the Creative Commons Attribution 4.0 License.
the Creative Commons Attribution 4.0 License.
 | 20 May 2026
Development of historical maps of land use-land cover, crop type, nutrients, and irrigation across CONUS (1938–2020) at different spatial resolutions
Christopher J. Kucharik
Land use-land cover, nutrient inputs from fertilizer and manure, and irrigation are primary anthropogenic drivers of ecosystem functioning and degradation. Historical datasets covering these drivers at various spatial resolutions are essential for analyzing changes in these drivers as well as for input to models that estimate ecosystem outcomes such as water quality and runoff. We describe a new dataset for the conterminous United States (CONUS) – the Harmonized Land Nutrient Irrigation Dataset (HLNID) – that leverages existing datasets both at the county-scale (e.g., Census of Agriculture) and higher resolution land change model outputs (e.g., FORE-SCE) and remotely-sensed products (e.g., NLCD, CDL) to produce annual land use-land cover (including crop type), fertilizer and manure nutrient mass (nitrogen and phosphorus), and irrigation extent for the years 1938–2020. The flexible method can provide data at a range of custom spatial resolutions but we present results at 48 and 250 arcsec. The dataset reveals specific changes such as the increase in corn and soybean (replacing small grains and pasture) in the northern Great Plains since the 1990s, the spatial concentration of manure production in certain regions such as the uplands of the Southern Seaboard, and the expansion of irrigation in regions such as the Prairie Gateway. The method can readily incorporate new raw input datasets (e.g., CDL) to create updated versions but is limited by current time lags in state fertilizer sales data reporting. The data presented in this work are available at https://doi.org/10.5061/dryad.r4xgxd2rh (Booth and Kucharik, 2026).
- Article
(10119 KB) - Full-text XML
-
Supplement
(1263 KB) - BibTeX
- EndNote


Historical datasets of key drivers of water, soil, and ecosystem functioning are important for assessing changes to ecosystem services as well as driving process-based biophysical models to answer research questions related to the past and to create reasonable initial conditions for simulations of future scenarios. The availability of public geospatial datasets has grown exponentially in recent decades thanks to the development of geographic information systems and remote sensing technologies. Yet, methods for synthesizing and harmonizing these disparate datasets at different spatial, temporal, and thematic resolutions can vary substantially with important implications for their ultimate use in analysis and modeling contexts.
Land use-land cover (including crop type), nutrient applications, and irrigation are primary drivers of terrestrial and downstream aquatic ecosystem functioning including cycles of energy, water, nitrogen, phosphorus, and carbon. Changes in these drivers across the conterminous United States (CONUS) have substantially impacted habitats for imperiled species such as grassland birds (Stanton et al., 2018), regional water budgets through increased crop water use (Leng et al., 2013), and surface and groundwater quality (Lark et al., 2022). These changes have been especially pronounced over the last 100 years as agriculture has intensified through the use of synthetic and mineral fertilizers (Crossley et al., 2021; Robertson and Vitousek, 2009). The legacy of historical land use-land cover, nutrient applications, and irrigated water use can also extend these impacts on ecosystems and water resources many decades into the future (Martin et al., 2017; Motew et al., 2017; Van Meter et al., 2018). Altering these drivers into the future and assessing their impacts using biophysical models through scenario planning is an essential environmental management activity (Ascott et al., 2021). These forward-looking analyses rely on a clear understanding of historical biophysical drivers and the legacies they create, requiring consistent and long-term datasets deployed at a variety of management-relevant scales.
1.1 Land use-land cover
Development of historical land use-land cover (LULC) datasets across the CONUS extent has accelerated in the last 10–20 years as satellite remote sensing observations have been integrated with long-term state and county-based inventories and land change models. The U.S. Geological Survey (USGS) has recently updated their methodology for estimating annual land cover beginning in 1985 using a deep learning approach that reduces inconsistencies over the period of record while preserving accuracy (Fleckenstein et al., 2026; USGS, 2025) This 30 m resolution dataset leverages previous versions of NLCD (Yang et al., 2018) that integrate multi-spectral imagery from LandSat with other geospatial datasets (e.g., National Wetland Inventory) and ground- and survey-based land inventories that are typically aggregated at the county or state level. A key input to the dataset's development that provides information on agricultural land cover types is the U.S. Department of Agriculture's (USDA) Census of Agriculture (CoA) that has occurred roughly every 5 years since the late 19th century. Although survey methods and terminology have changed throughout its history, the CoA has been used as and argued to be the most accurate and historically consistent estimates of agricultural land use (Johnson, 2013; Lark et al., 2017; Larsen et al., 2015). While cropland and pasture are broken up into many types in the CoA, the NLCD uses the aggregated estimates of total cropland and total pasture to bound mapped estimates of those land cover types.
The USGS Earth Resources Observation and Science (EROS) Center has also developed the FOREcasting SCEnarios of Land-use Change (FORE-SCE) model that extends land cover estimates back before the satellite era by using an older version of the NLCD (Homer et al., 2007) as input to backcast annual land cover across CONUS for the years 1938–2001 at a similar thematic resolution as the NLCD (14 classes) but at 250 m spatial resolution (Sohl et al., 2016, 2018). The FORE-SCE model uses the common approach of calculating demand for a specific land cover type or group of types over a region (e.g., county) and then spatially allocating that demand using suitability surfaces based on landscape characteristics (e.g., soil type, slope, adjacent year's land cover). EROS researchers have also used the FORE-SCE model to create an annual land cover dataset for the Delaware River Basin from 1680–2018 at a higher thematic (20 classes including major crop types) and spatial resolution (30 m) to facilitate analyses of the long-term impacts of land use and climate change (Dornbierer et al., 2021).
Li et al. (2023) recently leveraged the NLCD to backcast annual land cover at a slightly lower thematic resolution than the NLCD (10 classes) back to 1630 but using a different methodology that integrated the coarser spatial resolution (5 arcmin) History Database of the Global Environment (HYDE) dataset (Klein Goldewijk et al., 2017) as well as the forest cover estimates from the USDA Forest Service's Forest Inventory & Analysis dataset (Oswalt et al., 2019).
While each of the previously described datasets used the CoA to estimate demand for agricultural land cover types, they did not map specific crop types. However, historical LULC datasets that include crop types are starting to emerge due in part to the development and refinement of the USDA's Cropland Data Layer (CDL), which is an annual LULC dataset beginning in 2008 with very high thematic (134 classes) and spatial (30 m) resolution (Boryan et al., 2011; USDA, 2024). The CDL is partially informed by county-scale crop type area estimates from the CoA but areas for some crops can differ (Lark et al., 2021). The CDL also uses the most recent NLCD dataset as an input but they are not identical. Dominant commodity crop types such as corn and soybeans are mapped more accurately than other crop types; grass, hay, and pasture are typically mapped with low accuracy because of their non-unique spectral characteristics (Lark et al., 2017, 2021).
Yu et al. (2018) leveraged CDL crop type maps and state- and county-level CoA crop type areas to backcast cropland density and dominant crop type from 1850 to 2015 at 5 arcmin resolution. Ye et al. (2024) extended this approach to create maps of crop area and dominant crop type from 1850 to 2021 at 1 km resolution. Lamsal and Marston (2025) also recently utilized the CoA and CDL datasets to map crop types across CONUS from 1981 to 2019. Despite these advances and new datasets, there is still a lack of historical LULC datasets with high thematic (including natural land covers and crop types) and spatial resolutions. A continuing challenge remains in how best to harmonize disparate long-term data sources to create smooth and accurate changes in LULC through time.
1.2 Agricultural nutrients
Spatial agricultural nutrient inputs – from synthetic/mineral fertilizer and livestock manure – have been developed and refined over the last several decades, mostly in service of water quality assessments and models (e.g., Byrnes et al., 2020) but occasionally for other assessments such as greenhouse gas emissions (e.g., Lark et al., 2022). These datasets have been focused primarily on nitrogen (N) and phosphorus (P) as they are typically the most important from a water quality perspective. Fertilizer nutrient datasets typically rely on national- and state-level fertilizer sales (by mass) data originally collected by the fertilizer industry (Gaither and Terry, 2004). These data are then often downscaled to the county level using CoA data on fertilizer expenditures with the underlying assumption of a constant fertilizer prices and P:N ratio across all counties in a state for a given year (Ruddy et al., 2006). County level datasets have been compiled by the USGS back to the year 1945 (Alexander and Smith, 1990) but state level estimates go back as early as 1930 (Mehring et al., 1957).
Manure nutrient datasets have also been developed at the county scale but rely instead upon county-level CoA livestock inventories and various manure nutrient excretion rates per animal (Ruddy et al., 2006). However, these standard per-animal excretion rates should be viewed as snapshot-in-time estimates and do not account for changes in these rates through time due to livestock weight increases or other factors. Yang et al. (2016) developed a county-scale N and P manure nutrient dataset for 1930 to 2012 and showed a substantial difference in mass with and without accounting for changing livestock weights, particularly in the earlier part of the record. Falcone (2020) also updated the county-scale USGS manure nutrient dataset (1950–2017) to account for changes in livestock weight changes.
Recently, researchers have spatially allocated these county-level nutrient estimates using LULC maps. Earlier studies allocated nutrients uniformly across all cropland within a given county while recent efforts have developed more granular estimates based on maps of specific crop types and their varying demand for nutrients (e.g., based on university extension recommendations). Examples include Yu et al. (2018) and Cao et al. (2018) who developed a 5 km resolution fertilizer and manure nutrient (N and P) dataset for the years 1850 to 2015 at the CONUS scale to coincide with previous LULC maps (Yu et al., 2018; Yu and Lu, 2018). The manure nutrient dataset was then later refined at a 30 arcsec resolution (Bian et al., 2021). Hamlin et al. (2020) created a similar methodology to produce maps of fertilizer and manure nutrients (N and P) at a high spatial resolution (30 m) for the Lake Michigan Basin.
1.3 Irrigation
Spatial irrigation inputs have also been developed and refined over the last several decades to support hydrologic and agroecosystem modeling. Recent developments have taken a similar approach to the methods described above for LULC and nutrients: spatially allocate county-scale irrigated area estimated from the CoA using satellite remote sensing data. One of the first datasets created using this approach was the Moderate Resolution (250 m) Imaging Spectroradiometer (MODIS) Irrigated Agriculture Dataset (MIrAD-US), which was first introduced in 2010 (Pervez and Brown, 2010), made available at the full CONUS extent (Brown and Pervez, 2014), and then updated to include irrigated area maps for every 5 years from 2002 to 2017 (Brown et al., 2019; Shrestha et al., 2021). An extension and refinement of this approach incorporated data from LandSat to create annual maps for 1997–2017 at 30 m resolution (Xie et al., 2021).
1.4 Applications and limitations of previous datasets
Historical spatial datasets of LULC, crop type, nutrients, and irrigation have clear utility for analyzing spatially-explicit changes and trends through time to inform management and decision-making. However, these datasets are increasingly used as essential inputs to biophysical models to estimate management-relevant ecosystem outcomes such as crop yield, nutrient losses, and water fluxes. Large-scale examples include the USGS SPARROW water quality model (Robertson and Saad, 2021), the National Agroecosystem Model based on SWAT+ (White et al., 2022), and the Agro-IBIS agroecosystem model (Donner and Kucharik, 2008; Lark et al., 2022) that all heavily rely on LULC, nutrients, and irrigation.
While analyses of recent history have primarily relied on well-validated national datasets such as the NLCD and CDL, going back further in time before the satellite era is challenging because survey or inventory-based datasets can lack consistent methods of development through time. In addition, even contemporary, well-validated LULC inputs can represent a large unrecognized uncertainty that can ultimately impact biophysical model output uncertainty (Sharifi and Kalin, 2010). Thus, there is a need for these inputs to have acceptable levels of accuracy and consistency through time. Specifically, several studies have highlighted inconsistencies between the CoA and other LULC datasets including the NLCD (Goslee, 2011; Maxwell et al., 2008) and the CDL (Larsen et al., 2015). In particular, the CDL is not capable of distinguishing between different grassland types and matching the CoA in areas where soybeans and corn are not dominant (Lark et al., 2017, 2021; Larsen et al., 2015).
Some process-based modeling applications that simulate state variables through time also require certain input requirements, specifically for LULC. Model grid cells (or other discretized forms) need to be associated with single categorical values for LULC. For example, some LULC datasets estimate the fractional amount of cropland in a given raster or grid cell but most models can only simulate a single LULC type in a given year within each discretized unit (e.g., grid cell) and carry forward the values of the state variables to the next year's LULC type. While this single categorical value approach is essential for the simulation of historical trajectories and legacies of state variables like carbon, water, and nutrients, it also makes it challenging to ensure that correct LULC type areas are preserved, especially when re-scaling available datasets that only come in a single original resolution. For example, using a simple majority re-scaling of a raster dataset will typically alter the overall LULC composition and lead to unintended area changes that bias towards dominant types. Thus, a general approach to scale to desired spatial resolutions is needed that preserves the areas of input datasets assumed to be “truth”.
1.5 General approach for HLNID
Here we introduce and describe the development of a new dataset – the Harmonized Land Nutrient Irrigation Dataset (HLNID) – that resolves some of the limitations described above. The raster datasets consist of single categorical values for each pixel for LULC (and crop type), continuous values for nutrients, and Boolean values for irrigation extent. While we present results for two spatial resolutions (48 and 150 arcsec), the method is scale independent. We use the temporally consistent and county-scale CoA dataset as a foundational data source for the method to allow for harmonization through time and across other historical datasets. The method preserves county-scale estimates from the CoA and other sources (described below) and uses recent model-based and satellite-based datasets to spatially allocate LULC, crop type, and irrigation extent across a given county. It also preserves county-scale nutrient mass estimates and spatially allocates within a county according to crop-specific demand.
Notably, the method presented is not a predictive model resulting in a fully independent historical reconstruction because the county-scale demand is estimated based on available historical datasets; rather, it synthesizes existing datasets to reveal a consistent LULC dataset with high thematic resolution including major crop types with concurrent estimates of nutrients and irrigation extent. We present results both through CONUS maps and separated into USDA Farm Resource Regions as with other recent studies (Spangler et al., 2020).
2.1 Overview of workflow
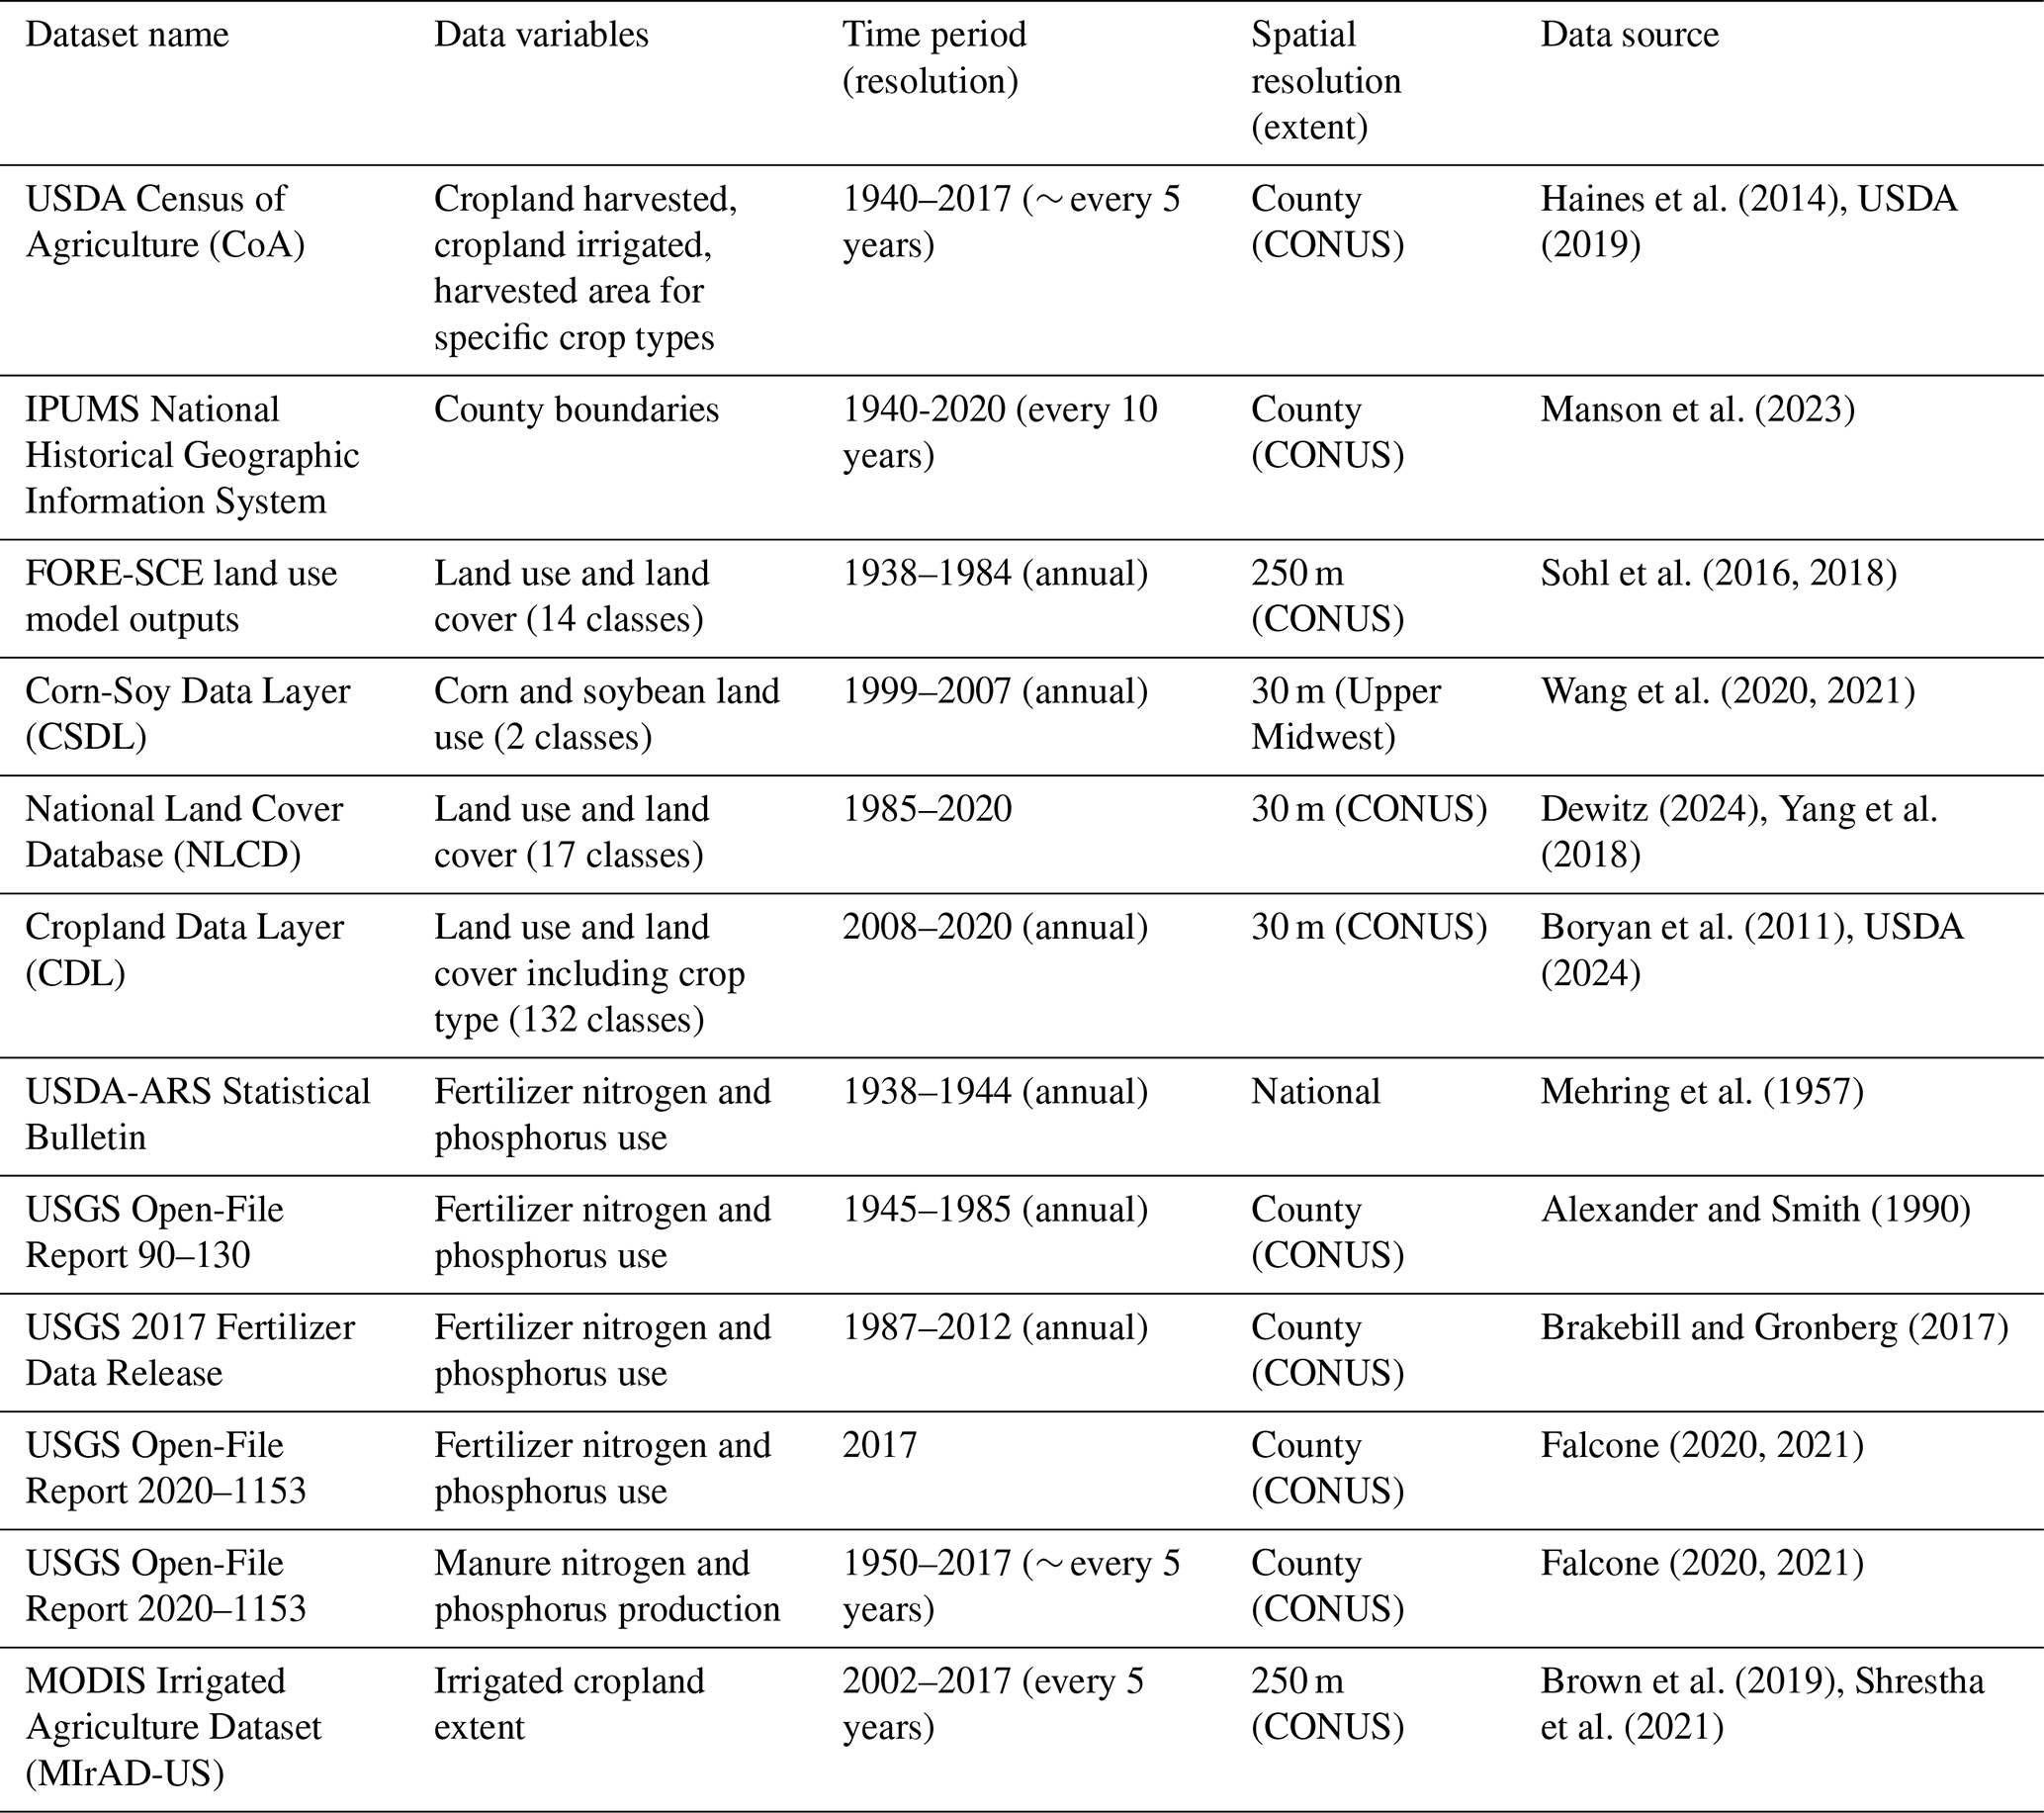
Our workflow starts with creation of the historical land use-land cover (LULC) dataset across the conterminous United States (CONUS), which is then used as an input to create maps of nutrient (N and P) mass from fertilizer and manure and irrigation extent on agricultural land. The method can be used to create datasets over a range of spatial resolutions but we present results for 48 arcsec (∼ 1.25 km) and 2.5 arcmin (∼ 4 km). Our method could be extended to earlier time periods but existing high-resolution CONUS datasets (i.e., FORE-SCE) are only available back to 1938. This year also represents the beginning of a large increase in nutrient inputs related to the proliferation of industrial agriculture in the U.S. in the mid-20th century. Thus, this time period (1938–2020) captures the major inputs and changes that drive today's landscape functioning including important nutrient legacies (Ilampooranan et al., 2022). As each dataset utilizes historical county-scale data, we accounted for changing county boundaries with time by using county boundary shapefiles from the National Historical Geographic Information System (Manson et al., 2023).
The workflow consists of Python scripts using the ArcPy library (ESRI) to resample and generate intermediate raster datasets (e.g., LULC type frequency) that are then utilized in MATLAB (R2023b, Mathworks, Inc.) scripts to implement the method's logic (see Supplement and code available in GitHub).
2.2 Land use-land cover & crop type
2.2.1 Overview
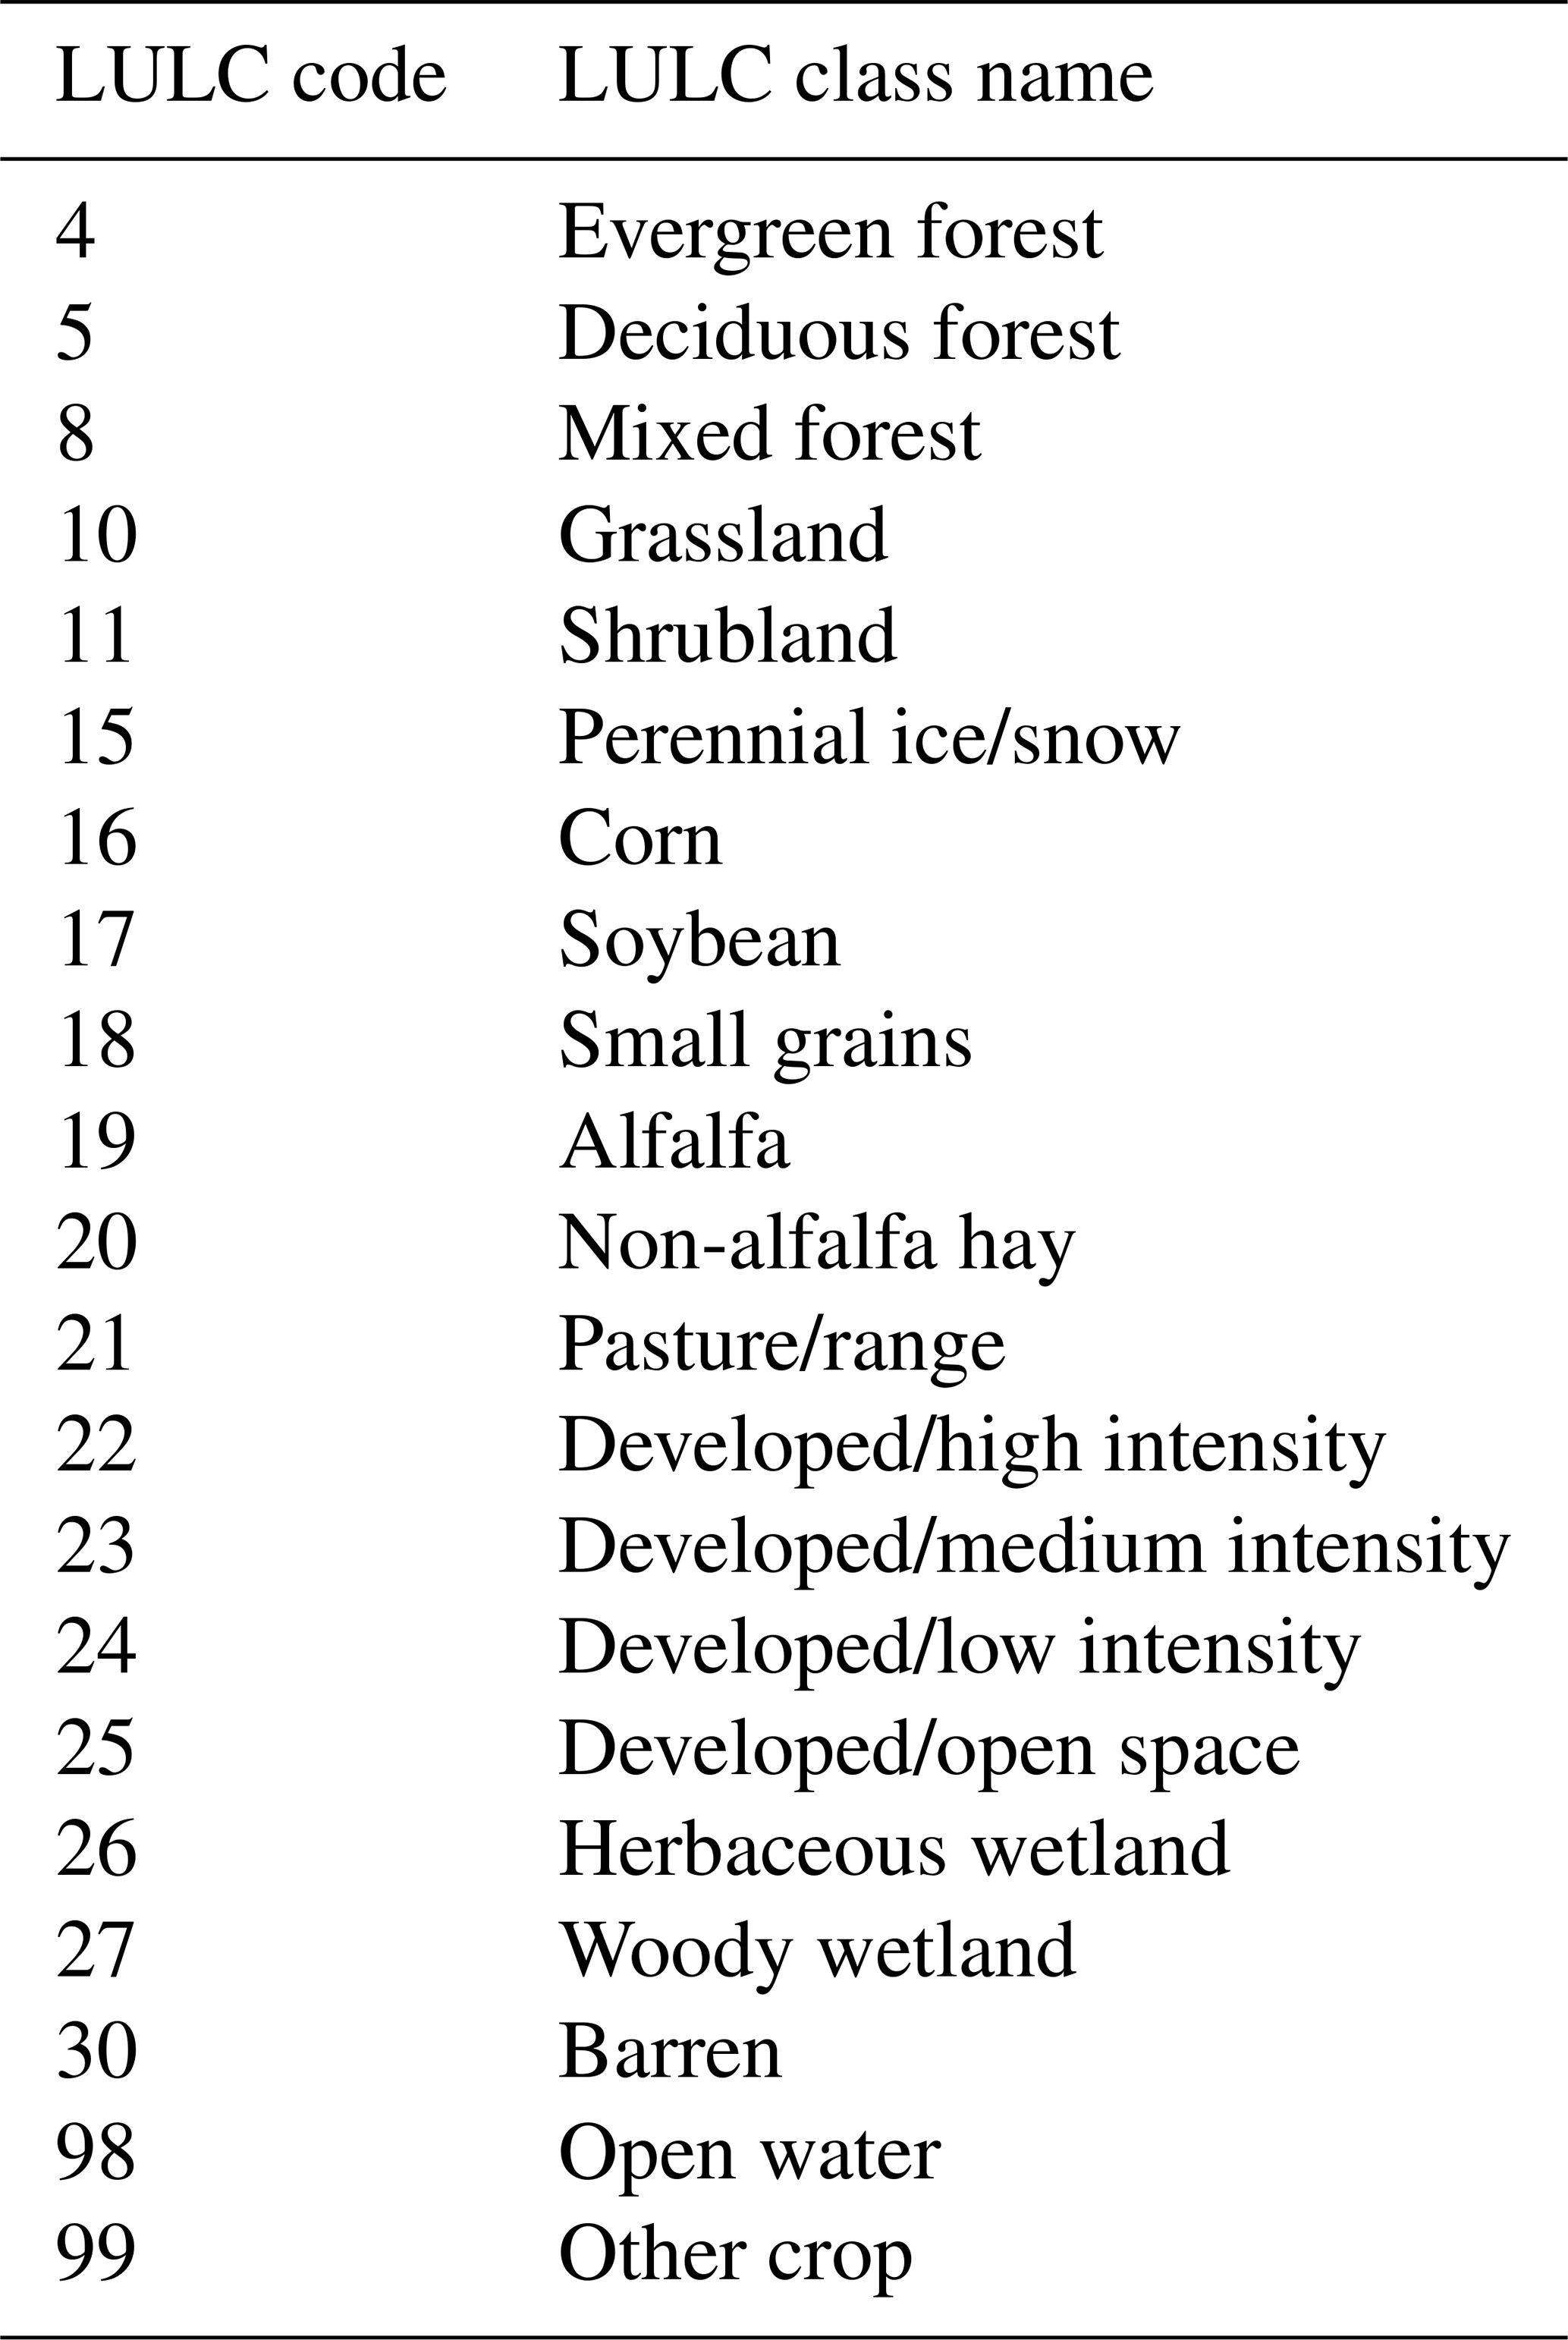
Our method to estimate historical LULC uses a harmonized synthesis framework that leverages existing datasets rather than an independent land change model to reconstruct the past. Our approach to determine historical LULC with high thematic resolution is a simplified version of other land change models (e.g., FORE-SCE, Dornbierer et al., 2021) with a demand and spatial allocation framework (Fig. 1). This approach requires annual “demand” for each LULC category within specific geographic regions and then satisfaction of that “demand” spatially based on suitability maps. We specify demand in this context at the county scale first using USDA CoA data (Haines et al., 2014; USDA, 2019) for total agricultural land and specific agricultural LULC classes. Then, we calculate area within each county under each non-agricultural LULC class from several historical LULC datasets (FORE-SCE, NLCD, CDL) using their native spatial resolution (Table 1). These areas are then used as demand for the remaining non-agricultural land and LULC classes. Suitability maps for agricultural land are created based on historical LULC datasets associated with each year while suitability maps for specific crop types are created based on the more contemporary Corn-Soy Data Layer (CSDL) (Wang et al., 2020, 2021) and CDL (with random year draws for years prior to 2008 for non-corn/soy crops and prior to 1999 for all crops). Suitability maps for non-agricultural land are created based on historical LULC datasets (FORE-SCE, NLCD). By attaching demand to estimated areas at the county scale, this method preserves accurate areas for each LULC class regardless of the spatial resolution. The resulting LULC dataset consists of 21 classes with identical definitions to NLCD and CDL except that “Pasture/range” is a unique category. Functionally, “Grassland” and “Pasture/range” are very similar (depending on management) except that “Pasture/range” receives manure from livestock and may have fertilizer applied.
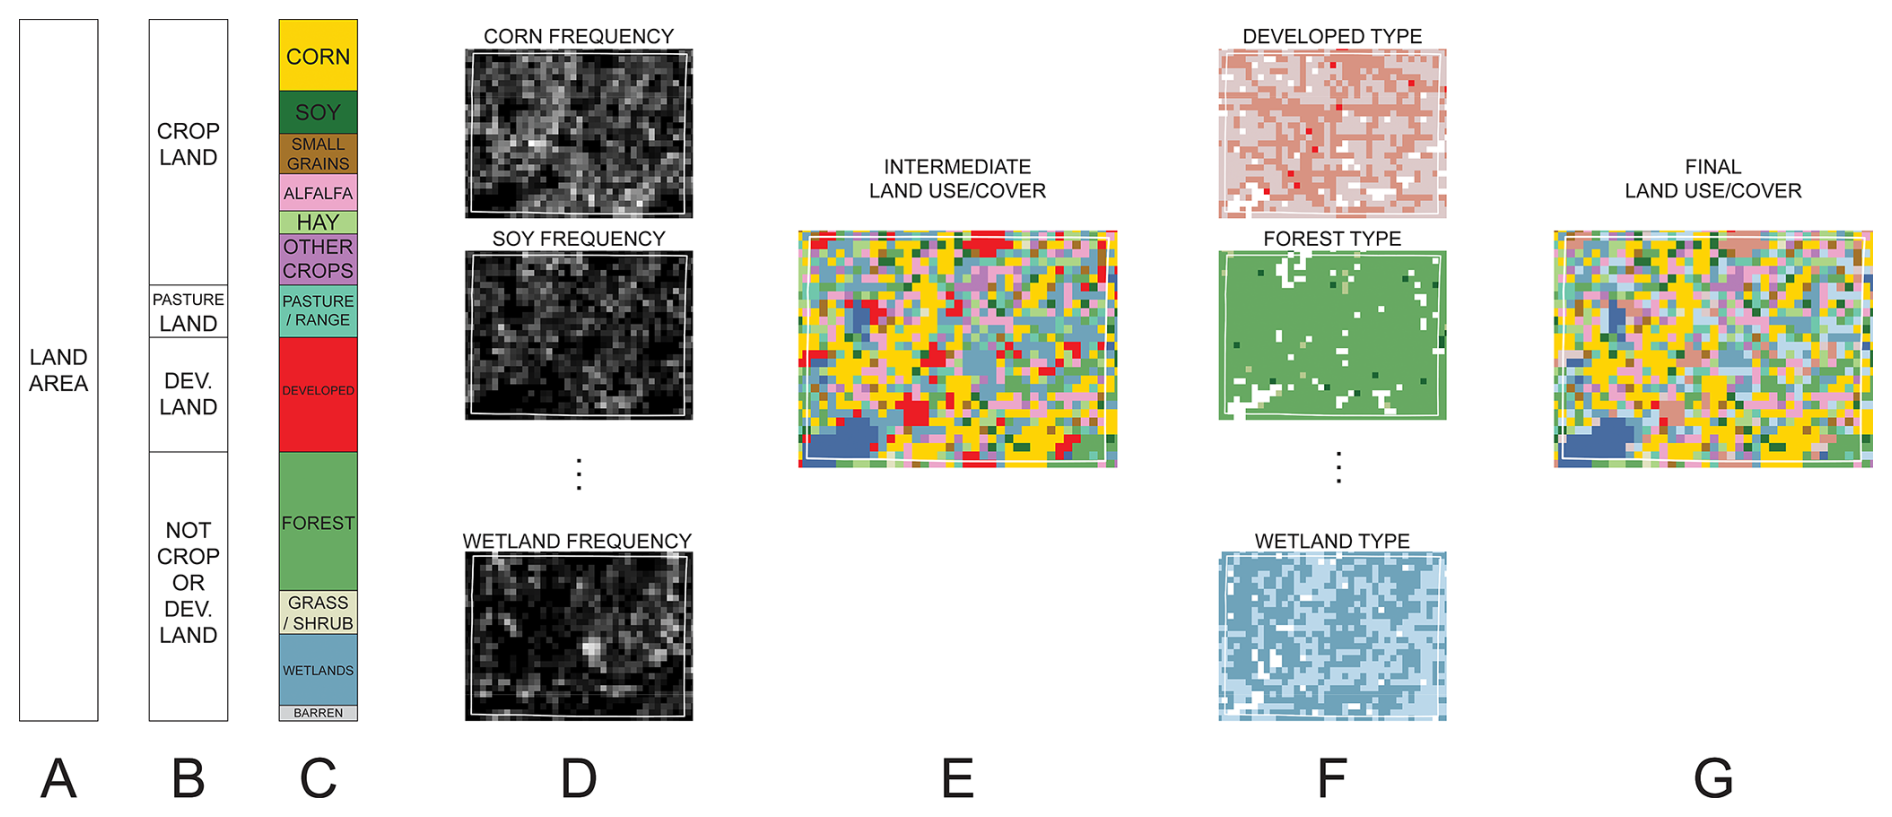
Figure 1Conceptual diagram of the workflow for creating the land use-land cover dataset using a representative county. (A) Total land area determined from average of NLCD from 2001 to 2016, (B) cropland and pastureland determined from nearest CoA year, developed land determined from FORE-SCE (1938–1984), or NLCD (1985–2020), (C) crop type areas determined from nearest CoA year and major non-cropland LULC type areas using proportions determined from FORE-SCE (1938–1984), or NLCD (1985–2020), (D) crop type frequency maps determined from CSDL (1999–2007) and CDL (2008–2020) and non-cropland LULC frequency maps determined from FORE-SCE (1938–1984), or NLCD (1985–2020), (E) spatial allocation of crop type areas and major non-cropland LULC type areas based on frequency maps, (F) maps of dominant non-cropland LULC sub-class based on NLCD 2016 data, and (G) assignment of dominant non-cropland LULC sub-class to each major non-cropland LULC type.
Table 1Summary of datasets used to create the HLNID. Note that “Time period” reflects the time period used for analysis and not necessarily the full temporal extent of the dataset. CONUS = conterminous United States.
2.2.2 Workflow
First, we established a target resolution (between 48 and 150 arcsec) and a regular grid across CONUS for all intermediate and final raster datasets. We assumed and determined a static open water extent across all years (1938–2020) based on average NLCD land area estimates from 2001 to 2020. While this assumption may not accurately reflect changing open water extent through time due to climate and water infrastructure (e.g., impoundments), pre-satellite-era data on open water area is not readily available and many biophysical models also assume a static open water extent (e.g., Motew et al., 2017). We calculated average total land area fraction (all cells not classified as “open water”) for each county across all years of the NLCD dataset. We then determined the average frequency of land at the target resolution across all years of the NLCD dataset. For each county, we then assigned pixels as land starting with the pixels with the highest land frequency values and moving down until the land area fraction (i.e., demand) was met.
To harmonize the non-agricultural LULC classes through time – avoiding any step changes as one historical dataset transitions to another – we calculated harmonization coefficients for each county based on the ratio of estimated areas for a given LULC class in the overlapping time period: 1985–1992 for FORE-SCE and NLCD.
Next, we proceeded year-by-year starting with 1938 and county-by-county to assign LULC classes (Table 2) to the static land layer. First, we used data from the USDA CoA for the closest year to determine area in pasture, cropland harvested, corn, soybean, small grains, alfalfa, non-alfalfa hay, and other crops (for more details on specific variables included in each category for each CoA year, see Supplement). Crop type areas were adjusted so that their sum was equivalent to the total cropland harvested area by multiplying each crop type area by the ratio of the total cropland harvested area to the original sum of all crop type areas. We then linearly interpolated annual values for each crop type area and used an 11-year centered moving average to smooth out any semi-random variability that is inherent within the periodic (∼ every 5 years) CoA surveys. Second, areas for each non-agricultural LULC class were determined based on the closest year's historical LULC dataset at its native resolution. FORE-SCE data was used for years from 1938 to 1984, NLCD for 1985 to 2007, and CDL for 2008 to 2020. For some of the historical LULC datasets, not all of the non-cropland LULC classes were represented. For instance, the FORE-SCE dataset does not sub-divide the “developed” category like the NLCD and CDL datasets do. Therefore, we created intermediate broader categories of “developed”, “forest”, and “wetland” for the years when sub-classes were absent and calculated their area for each county. These areas were then adjusted by multiplying by the harmonization coefficient for each broader LULC type to ensure that historical areas for the LULC types matched those for the NLCD. The equivalent number of pixels for each LULC class was then calculated ensuring that the sum of the pixels matched that for the total number of land pixels from the static land layer.
Table 2Land use-land cover (LULC) classes generated for years 1938–2020 across CONUS.
Following the calculation of demand, we used the same historical LULC datasets to spatially allocate that demand within a given county according to the frequency at which each LULC class appeared within a pixel at the target resolution using the historical LULC dataset at its native resolution. In other words, we used the frequency of occurrence as the “suitability” estimate. First, we assigned the cropland LULC classes in descending order by code (Table 2). For years prior to the CSDL for corn and soy and prior to the CDL for the remaining crop types, we assumed that contemporary frequency estimates were applicable as suitability indicators historically back to 1938. Second, we assigned the major non-cropland LULC classes in the following order: barren, perennial ice/snow, developed, forest, wetland, and grassland/shrubland. We used frequency estimates calculated using the native resolution from FORE-SCE (1938–1984), NLCD (1985–2007), and CDL (2008–2020) as suitability indicators for the corresponding year. Finally, non-cropland sub-classes were determined based on the dominant sub-class within each target resolution pixel calculated from the NLCD 2016 dataset. For example, pixels initially assigned as forest from FORE-SCE in 1980 were re-assigned as deciduous forest if the dominant forest type in that pixel from NLCD in 2016 was deciduous.
2.3 Agricultural nutrients (N & P)
2.3.1 Overview
Our approach for creating spatially-explicit fertilizer and manure nutrient (N and P) data uses the LULC dataset described above to spatially allocate county-scale masses of nutrients from available datasets according to fertilizer recommendation proportions between each crop type and corn. Manure nutrients are assumed to be spatially uniform across all cropland and pasture within a county. We also only provide estimates of manure nutrients on an as-excreted basis. While applications of this dataset for analysis of cropland dynamics will require an extra step of calculating losses of manure nutrients (particularly atmospheric N losses) during manure collection and storage, we intentionally provide manure nutrient data as excreted so that data users have the ability to model all potential nutrient losses (collection, storage, processing, land application, runoff/leaching) and fully close nutrient budgets.
2.3.2 Workflow
Following completion of the land use-land cover dataset, we then used county-level estimates of N and P fertilizer and manure developed by the U.S. Geological Survey for the period 1945–2017 for fertilizer (Alexander and Smith, 1990; Brakebill and Gronberg, 2017; Falcone, 2020) and 1950–2017 for manure (Falcone, 2020) (Table 1). To extend the fertilizer nutrient dataset back to 1938, we used annual national fertilizer consumption data (Mehring et al., 1957) to scale the 1945 data uniformly across all counties. We also assumed that county-scale manure nutrient mass was constant from 1938 to 1950.
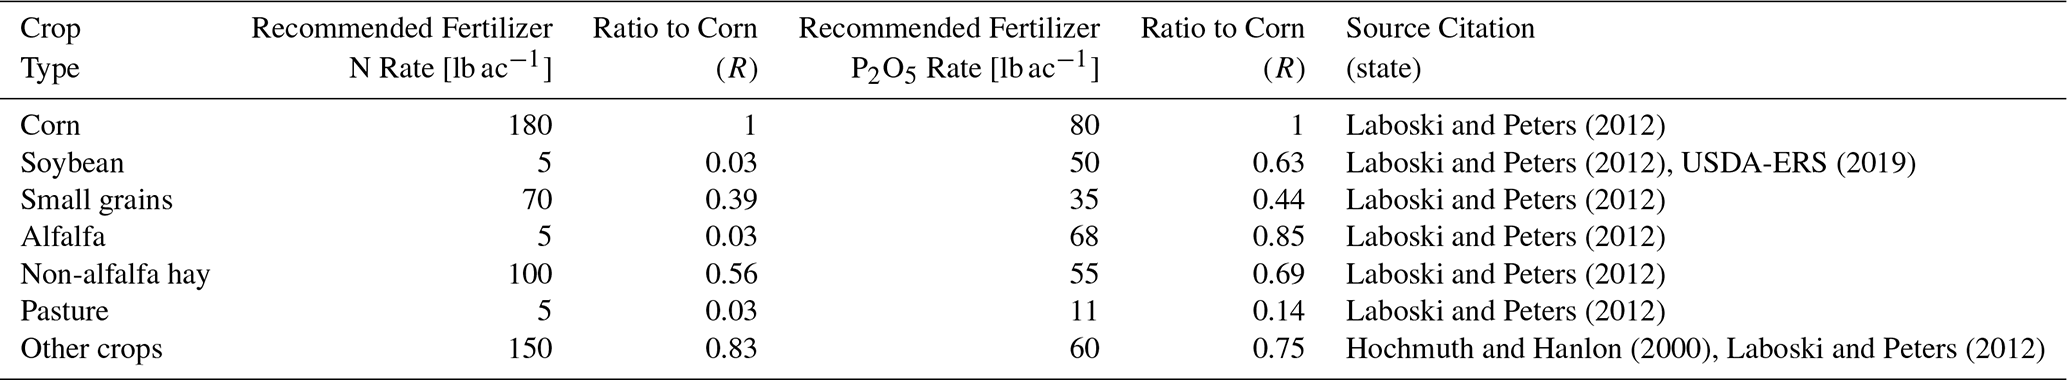
We developed a method to determine crop-specific rates of fertilizer N and P application based on the total mass of fertilizer N and P applied at the county-scale and an assumption of constant ratios between fertilizer rates for corn and rates for the other agricultural LULC types (soy, wheat, alfalfa, non-alfalfa hay, and pasture). We assumed that total fertilizer mass for a given county (mfert) could be calculated using the following equation:
where Fx is the county-average fertilizer application rate for a given crop x and Ax is the area devoted to crop x within that county. If we specify each crop's fertilizer application rate as a ratio of the crop's rate to the rate for corn – so that the ratio to corn – Eq. (1) can then be rearranged to solve for the fertilizer application rate for corn:
Then once Fcorn is determined, the fertilizer application rate for each crop is calculated by multiplying Fcorn by each crop's ratio to corn (Rx). We enforced a maximum limit of 300 and 100 kg ha−1 for fertilizer N and P, respectively. The constant ratios (Table 3) were determined based on current recommendations from several university extension publications (Hochmuth and Hanlon, 2000; Laboski and Peters, 2012). In addition, we used data on fertilizer use for soybean N rates (USDA-ERS, 2019).
Table 3Base fertilizer application rates based on published recommendations.
For manure N and P mass estimates, we used county-level estimates (Falcone, 2020, 2021) based on livestock inventories from the CoA, manure production per animal rates compiled by Ruddy et al. (2006) and modified by historical changes in livestock weight. Data is available in approximately 5-year increments (Falcone, 2020, 2021) and so we estimate annual values based on the nearest available year.
For each year and county, the manure N and P mass rates are determined by dividing the total county-scale manure mass by the total area devoted to cropland and pasture (as specified by previously discussed LULC data). Thus, manure mass is assumed to be uniform across all LULC types that could potentially receive manure in each county.
2.4 Irrigation extent
2.4.1 Overview
Maps of irrigated cropland (cropland and pasture) for the time period 1938–2020 were created based on “demand” as specified by county-scale historical irrigated harvested cropland data from the CoA that is spatially-allocated using irrigation frequency estimates from the 250 m Moderate Resolution Imaging Spectroradiometer (MODIS) Irrigated Agriculture Dataset for the United States (MIrAD-US) (Brown et al., 2019; Shrestha et al., 2021) for the years 2002, 2007, 2012, and 2017. Similarly to land use and nutrients, the method assumes that the irrigation frequency for the earliest available remotely-sensed year (2002) is indicative of the suitability surface for all prior years back to 1938.
2.4.2 Workflow
We used data from the USDA CoA for the closest year to estimate the fraction of harvested cropland that is irrigated for each county (irrigated harvested cropland divided by total harvested cropland). We then used data from MIrAD-US to spatially-allocate the irrigated cropland within a given county. MIrAD-US (version 4) is a consistently processed geospatial dataset that integrates CoA estimates of irrigated agricultural land, annual peak Normalized Difference Vegetation Index (NDVI) values derived from Collection 6 Aqua MODIS imagery, and the NLCD land mask. We calculated the frequency of irrigated agricultural land in each CONUS pixel at the target spatial resolution for each year of the MIrAD-US dataset. We then used the irrigation frequency map for the closest MIrAD-US year (e.g., years 1938–2004 used the year 2002) to assign cropland from the LULC dataset (described above) as irrigated to match the correct proportion as specified from the CoA with the highest irrigation frequency pixels available.
3.1 Land use-land cover & crop type
At the CONUS level, agricultural land (cropland and pasture/range) declined from 1938 to 2020 (352 to 290 Mha = million ha) and was largely replaced by developed and natural LULC types, primarily forest (Figs. 2–4). However, these changes were not consistent through time. Cropland declined from 138 Mha in 1938 to 115 Mha in 1967 and slowly increased thereafter to 126 Mha in 2020. Pasture/range saw the largest decline of any of the LULC classes over the 1938 to 2020 time period (214 to 163 Mha). Although some of the pasture/range was replaced by cropland and developed land (particularly in the Midwest and East), much of it also transitioned to grassland and shrubland not grazed by livestock (primarily in the West), which increased from 152 to 182 Mha. Forest area increased at the CONUS scale from 169 Mha in 1938 to a peak of 193 Mha in 1970 and then slowly declining to 189 Mha in 2020. Conversely, wetland area declined from 64 Mha in 1938 to 52 Mha in 1959 and stayed largely stable to 2020 (51 Mha). Developed land area more than doubled from 20 Mha in 1938 to 47 Mha in 2020. Within cropland, soybean increased the most in area from 1938 (4.4 Mha) to 2020 (35 Mha) and small grains declined the most from 43 to 17 Mha. Corn area declined from 1938 (36 Mha) to 1967 (26 Mha) but fully recovered by 2020 (36 Mha). Alfalfa area increased from 1938 (5.8 Mha) to 1960 (11 Mha) but then slowly declined to 2020 (7.0 Mha). Inversely, non-alfalfa hay area generally declined from 1938 (22 Mha) to 1968 (13 Mha) and then partially recovered to 2020 (16 Mha).
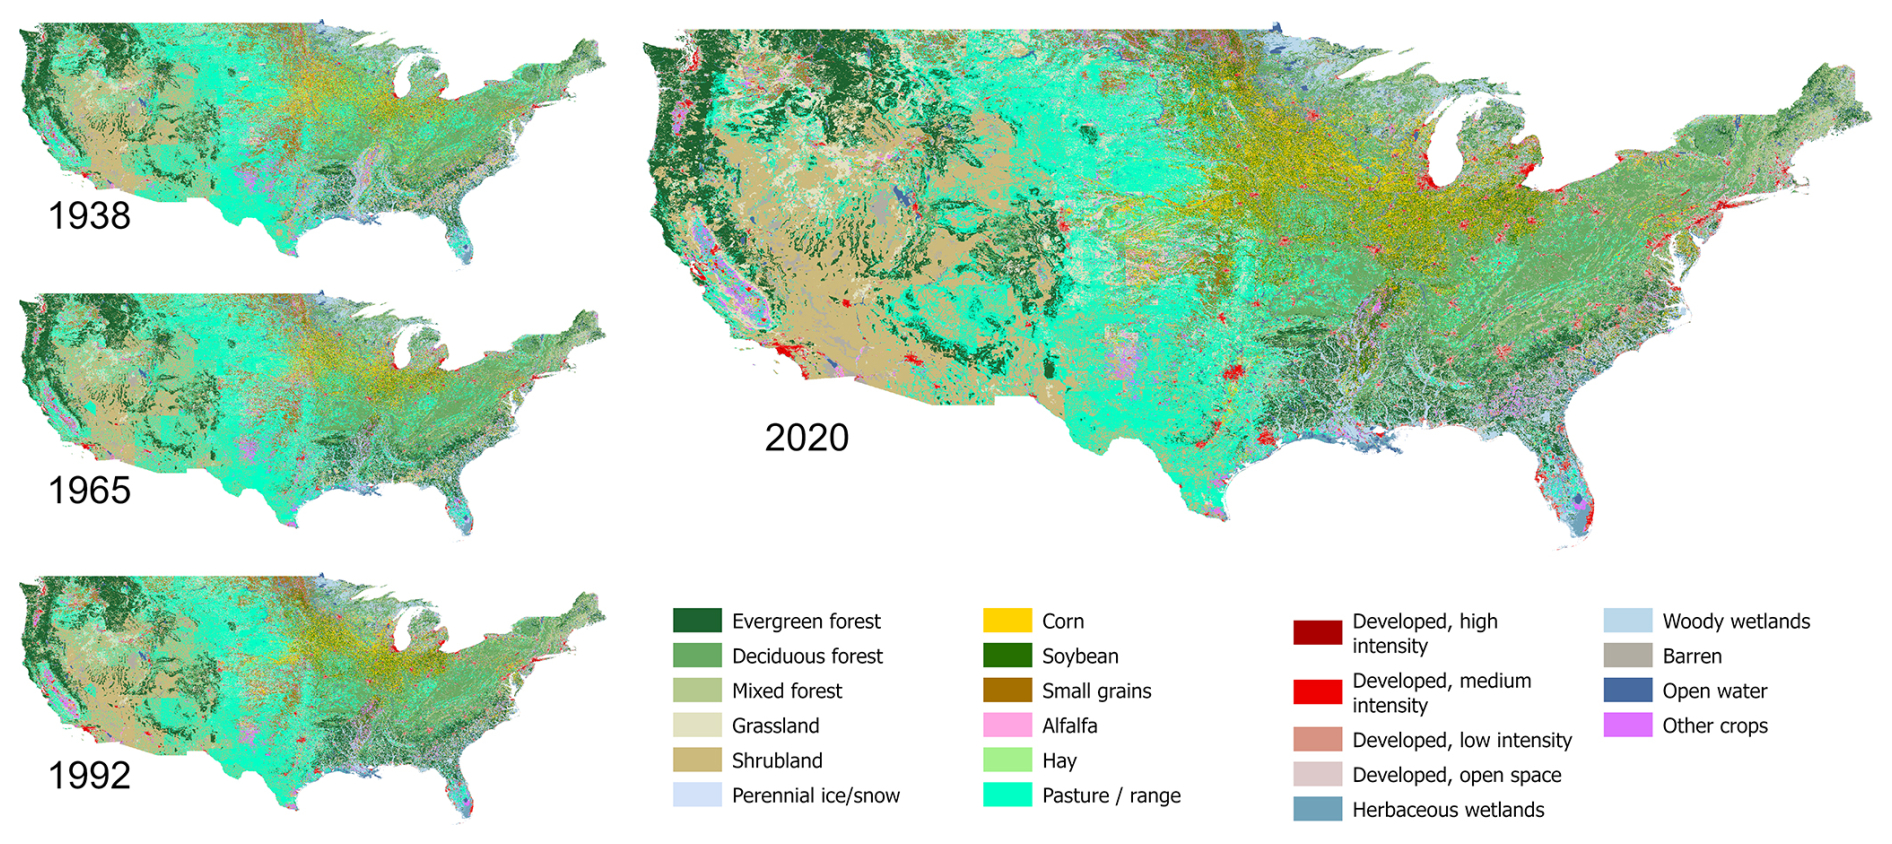
Figure 2Land use-land cover at 48 arcsec resolution for 1938, 1965, 1992, and 2020 estimated by this study (HLNID).
However, these CONUS scale changes in LULC from 1938 to 2020 varied substantially across regions (Fig. 3). The Northern Crescent, Eastern Uplands, and Southern Seaboard saw the largest gains in forest area and strong increases in developed area leading to a reduction in cropland area. In the agricultural categories, reductions in pasture, small grains, alfalfa, and other hay and increases in soybeans (primarily) and corn occurred consistently through time in the Heartland and Northern Crescent, while this shift happened later (post-1990) in the Northern Great Plains. Soybeans also became the dominant crop type by the 1970s in the Mississippi Portal. All regions shifted away from “other crops” besides the Fruitful Rim.
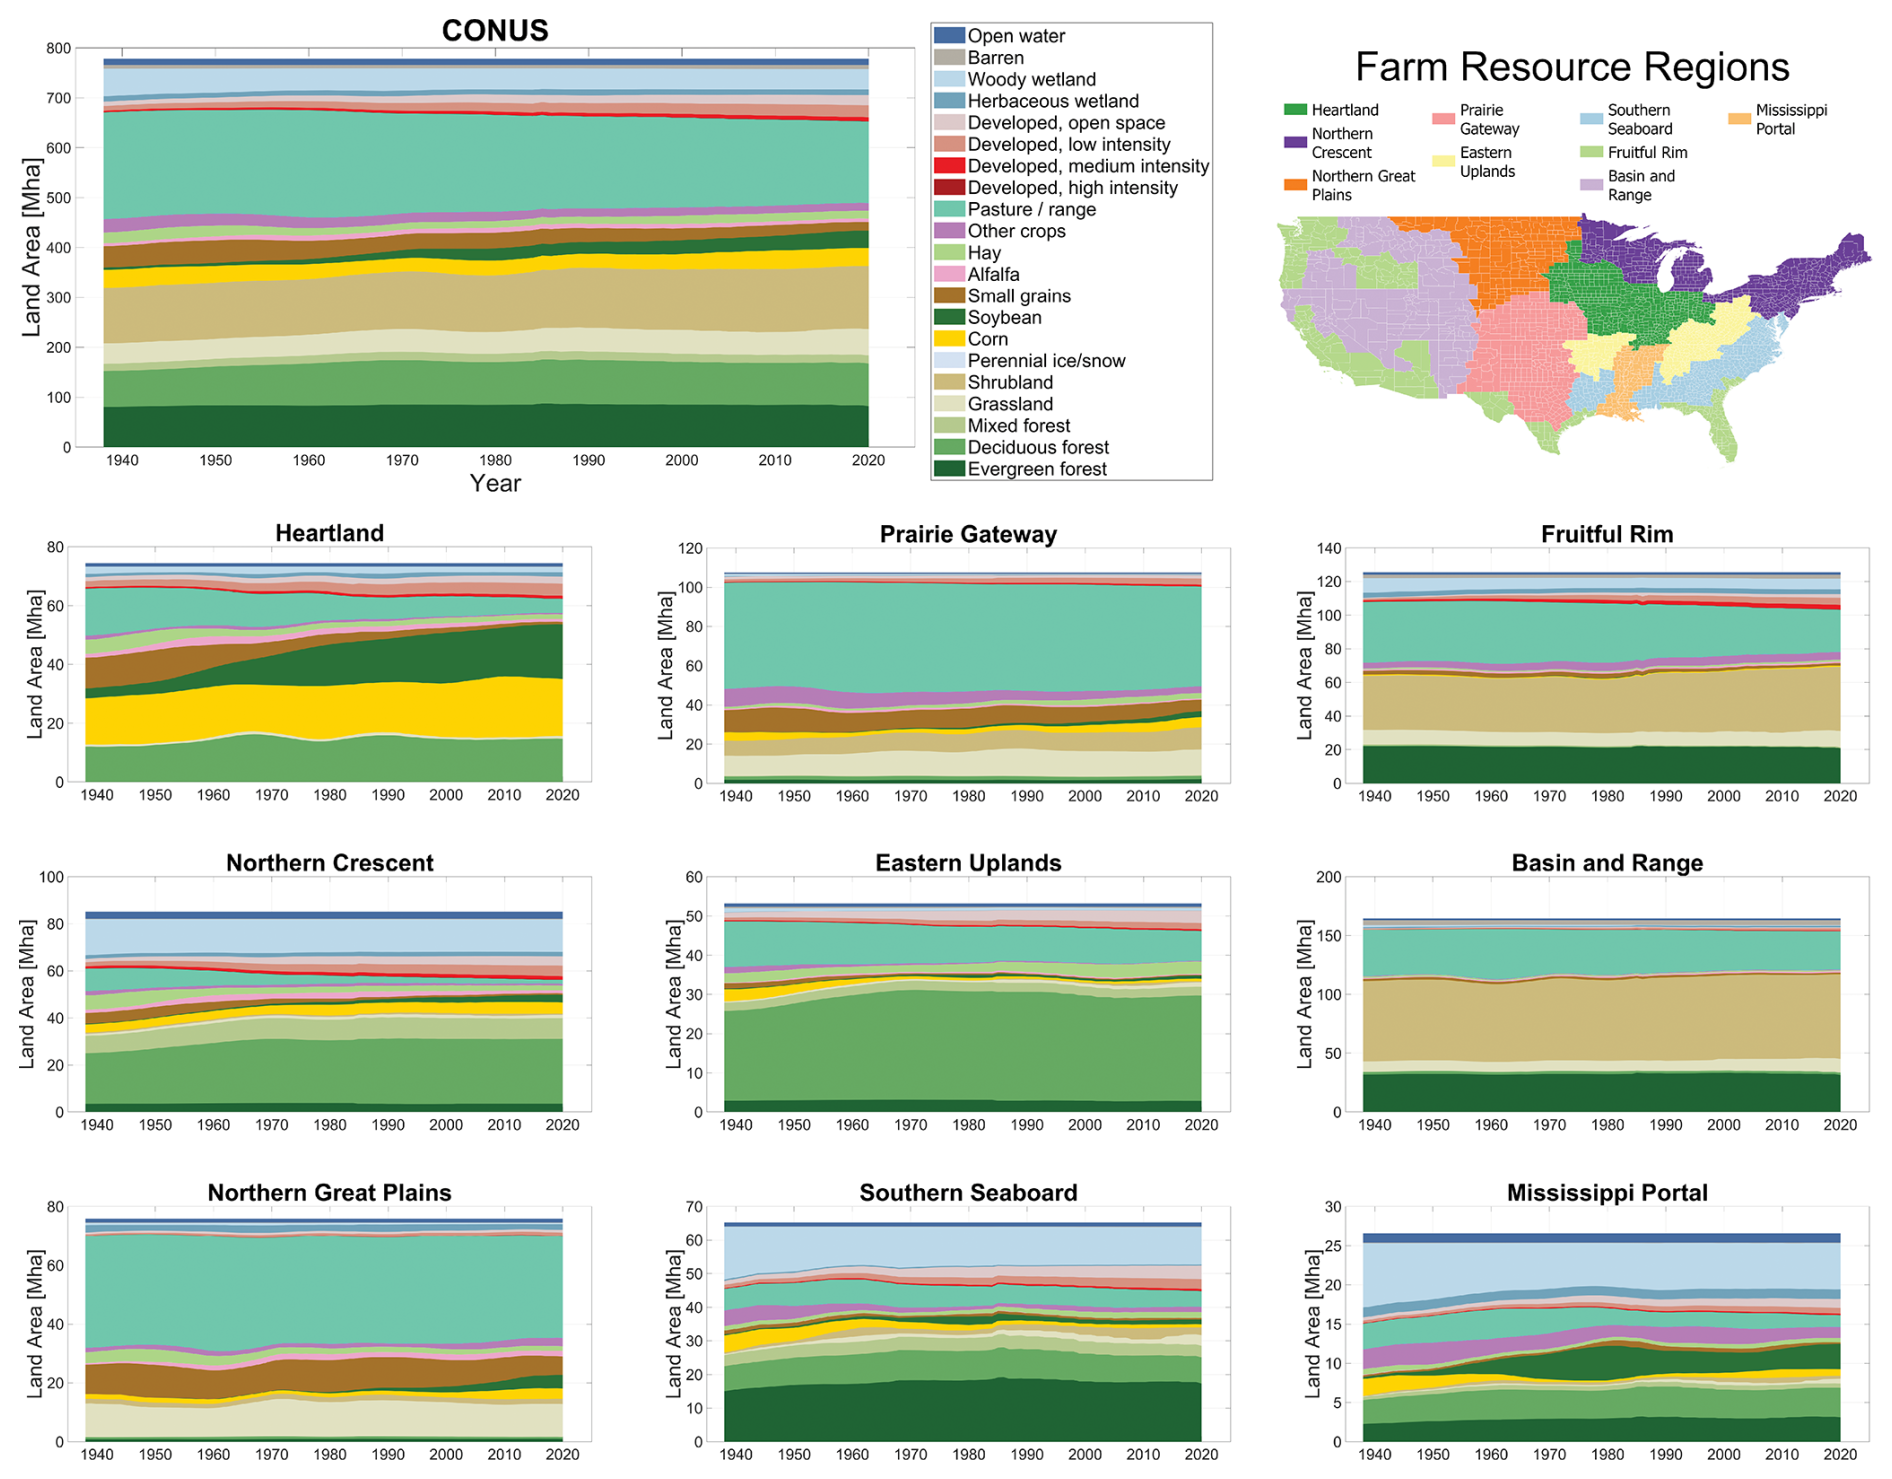
Figure 3Land use-land cover area changes from 1938 to 2020 for CONUS and 9 USDA Farm Resource Regions (boundaries shown in upper right).
LULC composition in the HLNID is comparable to many other CONUS-scale datasets, especially the ones used as input to the method (Fig. 4). Developed area at the CONUS scale aligns strongly with Li et al. (2023) early and late in the time period with a slightly higher estimate from 1970 to 2000 (Fig. 4A). In the later years, the developed area matches NLCD (an input to the method) but is 15 % higher than the CDL estimate. In the early years, the developed area is more than twice as large as that estimated by FORE-SCE.
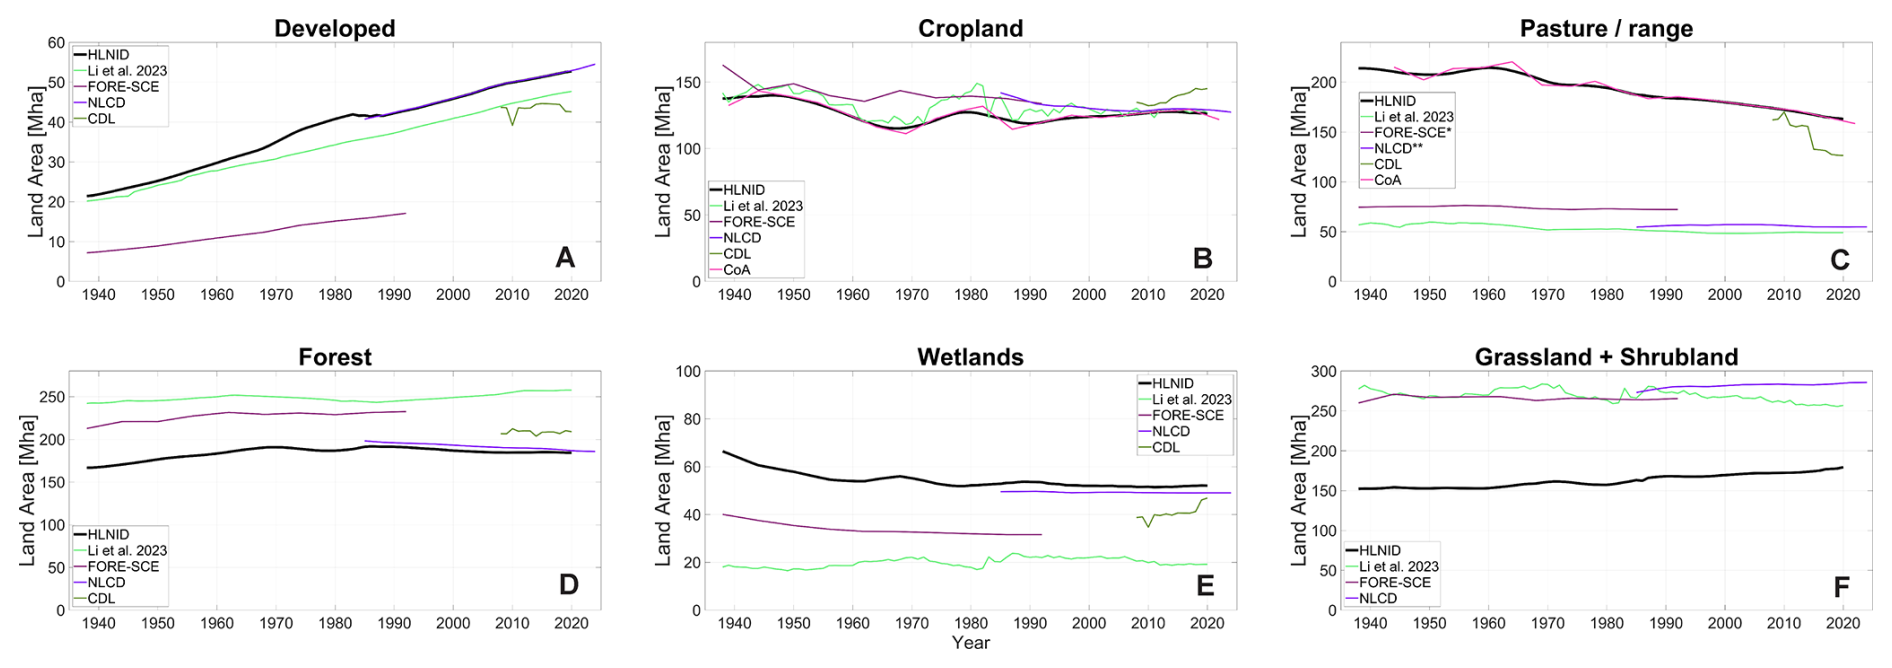
Figure 4Comparison of land use-land cover areas from 1938–2020 estimated by this study and other datasets: Li et al. (2023), FORE-SCE, NLCD, CDL, and CoA (see Table 1).
Cropland area estimates are fairly consistent across datasets with the HLNID dataset closely matching the CoA as intended through the method (Fig. 4B). An additional verification is made using the NLCD in later years, which shows strong alignment. In the first half of the record, estimated cropland area is ∼ 10 % less than that for the FORE-SCE dataset. Pasture/range area estimates do differ substantially between datasets with the HLNID aligning with the CoA and the Li et al. (2023), FORE-SCE, and NLCD datasets all substantially lower (Fig. 4C). Note that the FORE-SCE and NLCD datasets group together hay and pasture but do not include rangeland (typically classified as grassland). The opposite relationship is therefore present for grassland/shrubland area with the HLNID roughly 40 % less than the other datasets (Fig. 4F) because rangeland is included with pasture. For specific crop types, the HLNID aligns very closely with the CropAT_US dataset (Ye et al., 2024) as they both rely on the CoA dataset (Fig. S5).
Forested area in the HLNID most closely aligns with the NLCD for the later years compared with the other datasets that are 15 %–40 % higher (Fig. 4D). Wetland area in the HLNID also most closely aligns with the NLCD (as intended in the method) compared to the five other datasets that are 15 %–60 % lower. Compared with the HLNID and FORE-SCE datasets that estimate a decline in wetland area through time, the Li et al. (2023) dataset estimates a slight increase by the 1990s and then a reversal to initial 1938 values by 2020.
3.2 Agricultural nutrients (N & P)
Estimates of total nitrogen (N) and phosphorus (P) from fertilizer and manure at the CONUS scale show a substantial increase in fertilizer N and P through time and moderate increases in manure N and P (Fig. 5). Fertilizer N increased dramatically from 0.36 Tg in 1938 to 9.5 Tg in 1978 and slowly increased to 12 Tg in 2020. Fertilizer P also followed a similar early trajectory starting at 0.31 Tg in 1938 and rising to 2.1 Tg in 1978. However, fertilizer P then declines and holds steady around 1.7 Tg in the 1990s and 2000s until a small increase to 2.0 Tg in the last few years of the record. Manure N and P both steadily grew through the period of record with manure N starting at 4.7 Tg in 1938 and ending at 6.7 Tg in 2020 (42 % increase); manure P was 1.2 Tg in 1938 and 2.0 Tg in 2020 (60 % increase).
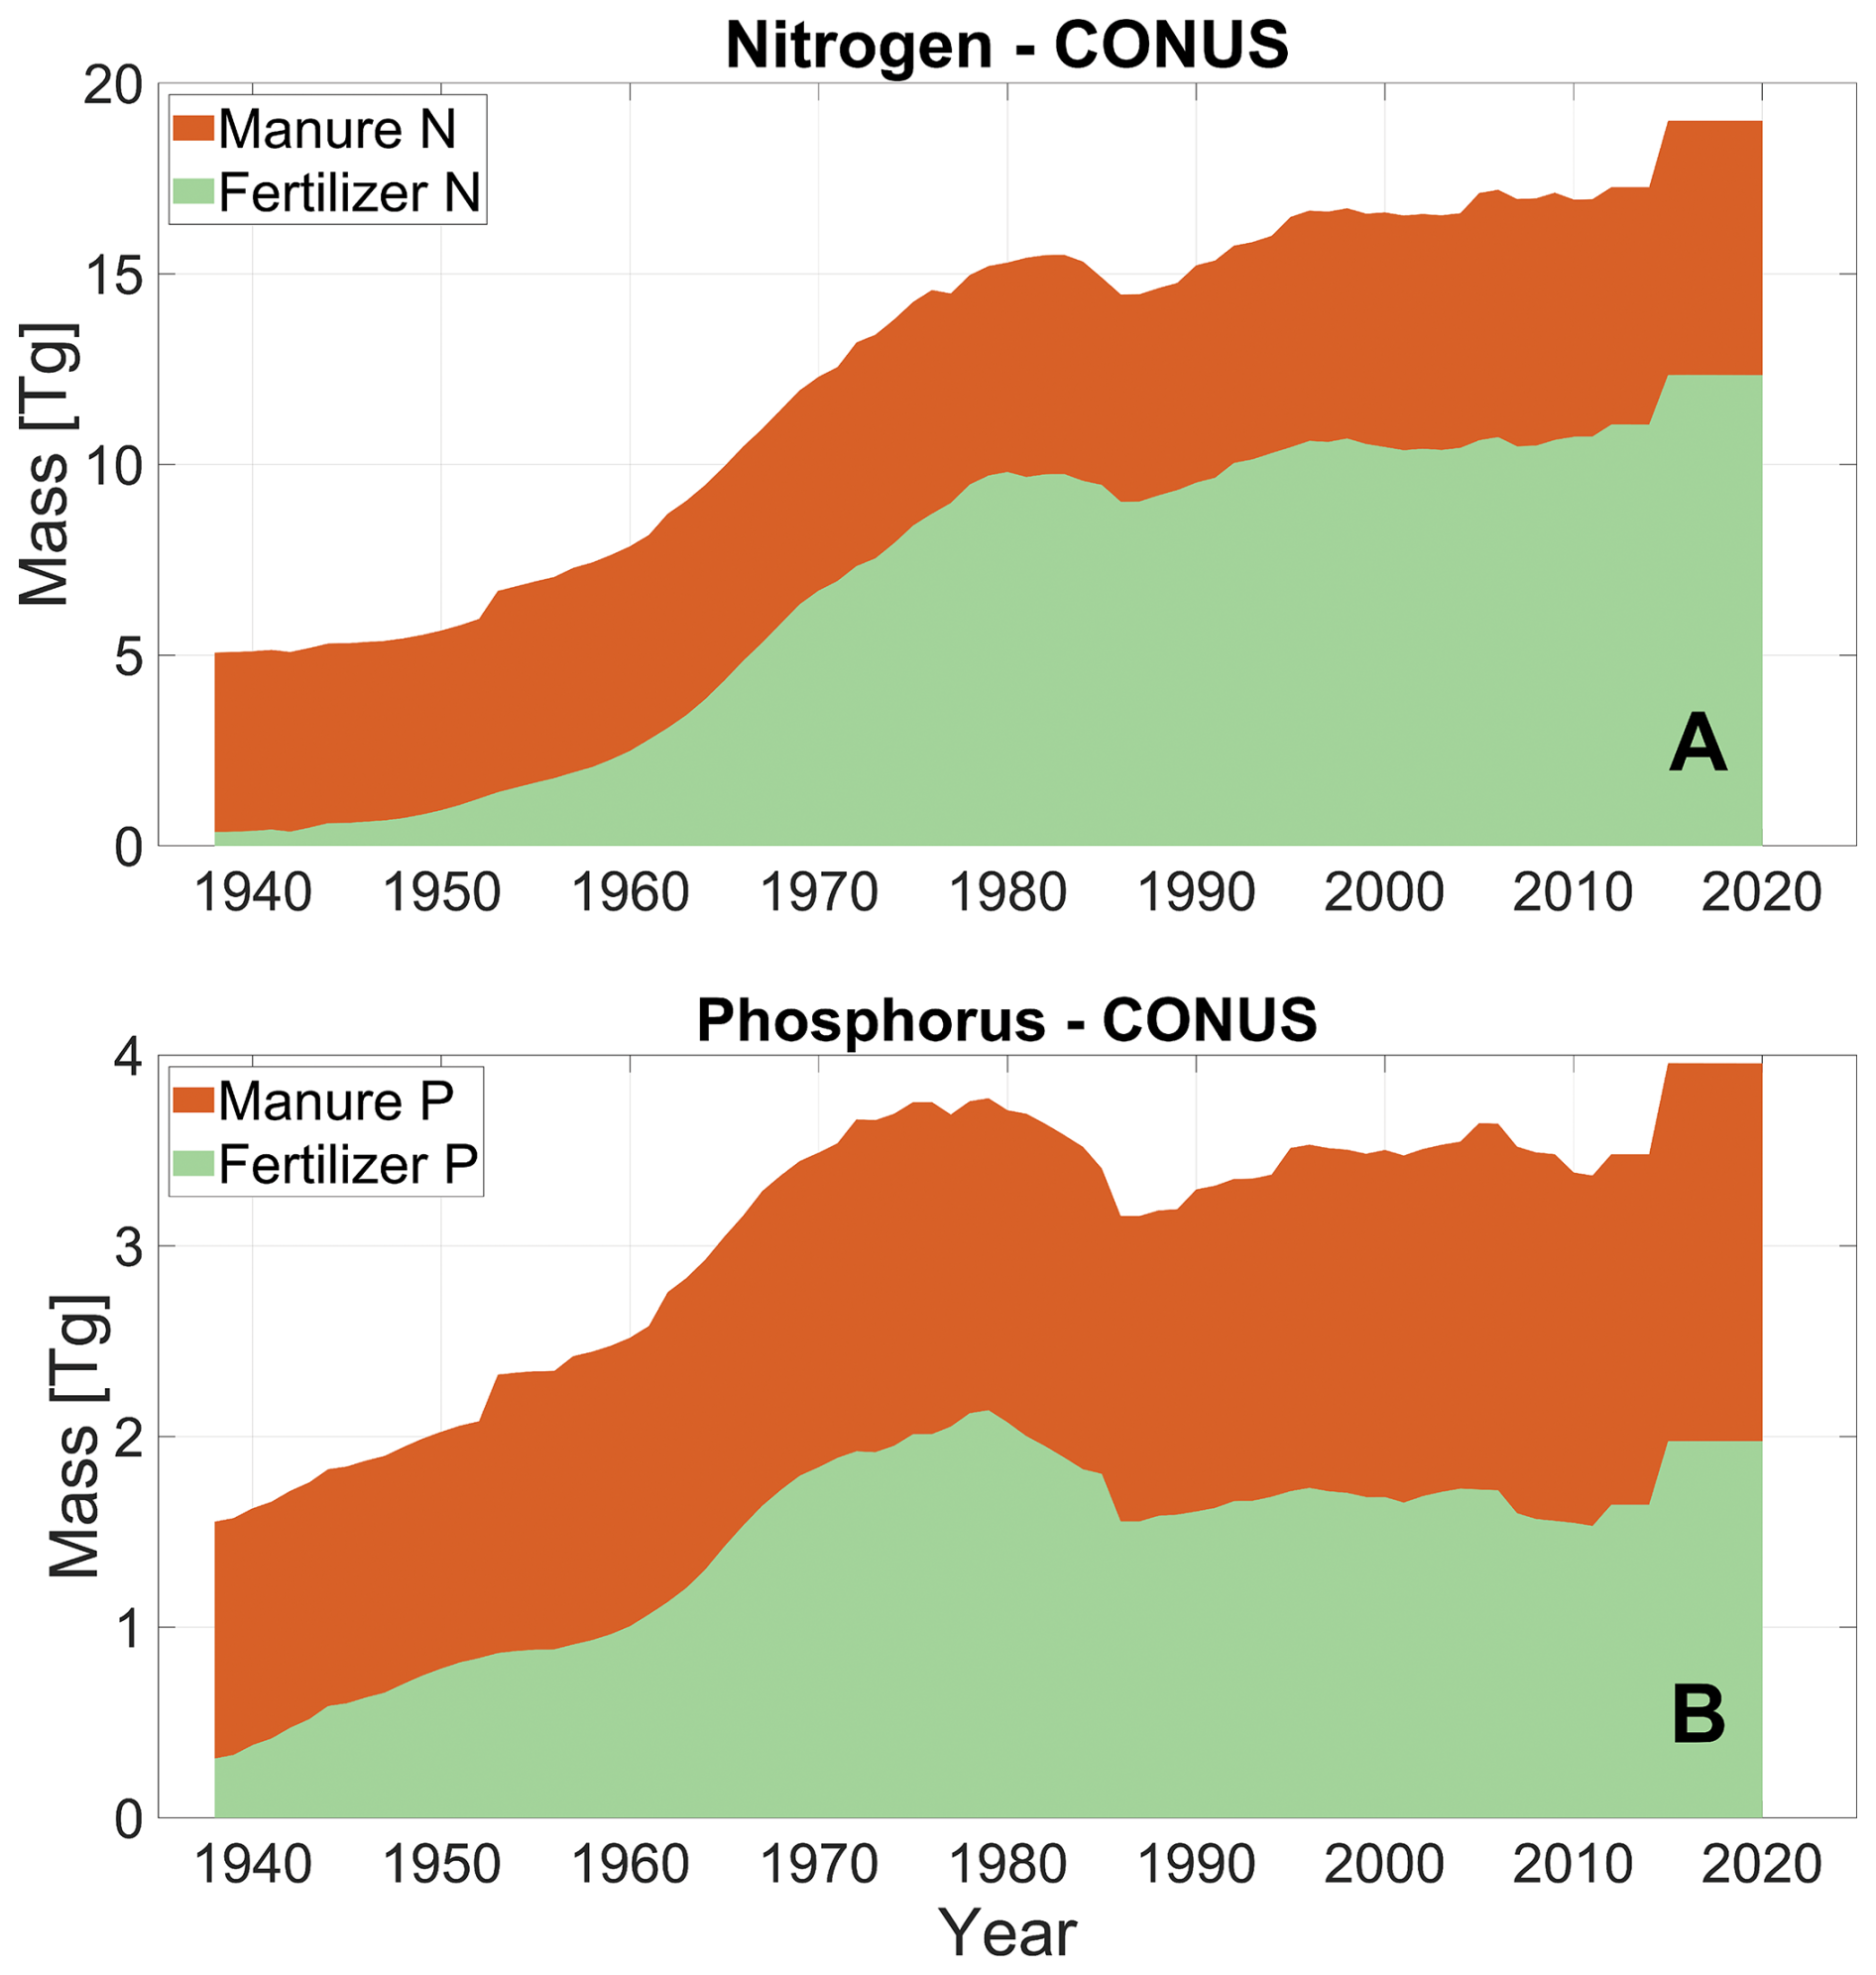
Figure 5Change in CONUS nutrient masses (manure and fertilizer) from 1938–2020 for nitrogen (A) and phosphorus (B).
Similar to LULC change, the spatial patterns of fertilizer and manure nutrients vary regionally (Figs. 6, S1–S4). Fertilizer N and P steadily increased in all regions but areas dominated by cropland with high nutrient demand crop types like corn, soybeans, and “other crops” represented emerging hot spots of fertilizer N and P as the overall nutrient mass at the CONUS scale increased through time. These hotspots are found primarily in the Heartland with other significant regions including the Mississippi Portal and Fruitful Rim (Figs. S3–S4). Manure N and P hotspots also begin to emerge by the 1990s in parts of the Heartland, Southern Seaboard, Northern Crescent, and Fruitful Rim (Figs. 7, S3). While all regions are dominated by manure sources of nutrients in the early part of the record, nearly all become dominated by fertilizer sources by the 1970s with more livestock-dominated regions like the Eastern Uplands, Basin and Range, and Southern Seaboard being the exceptions.
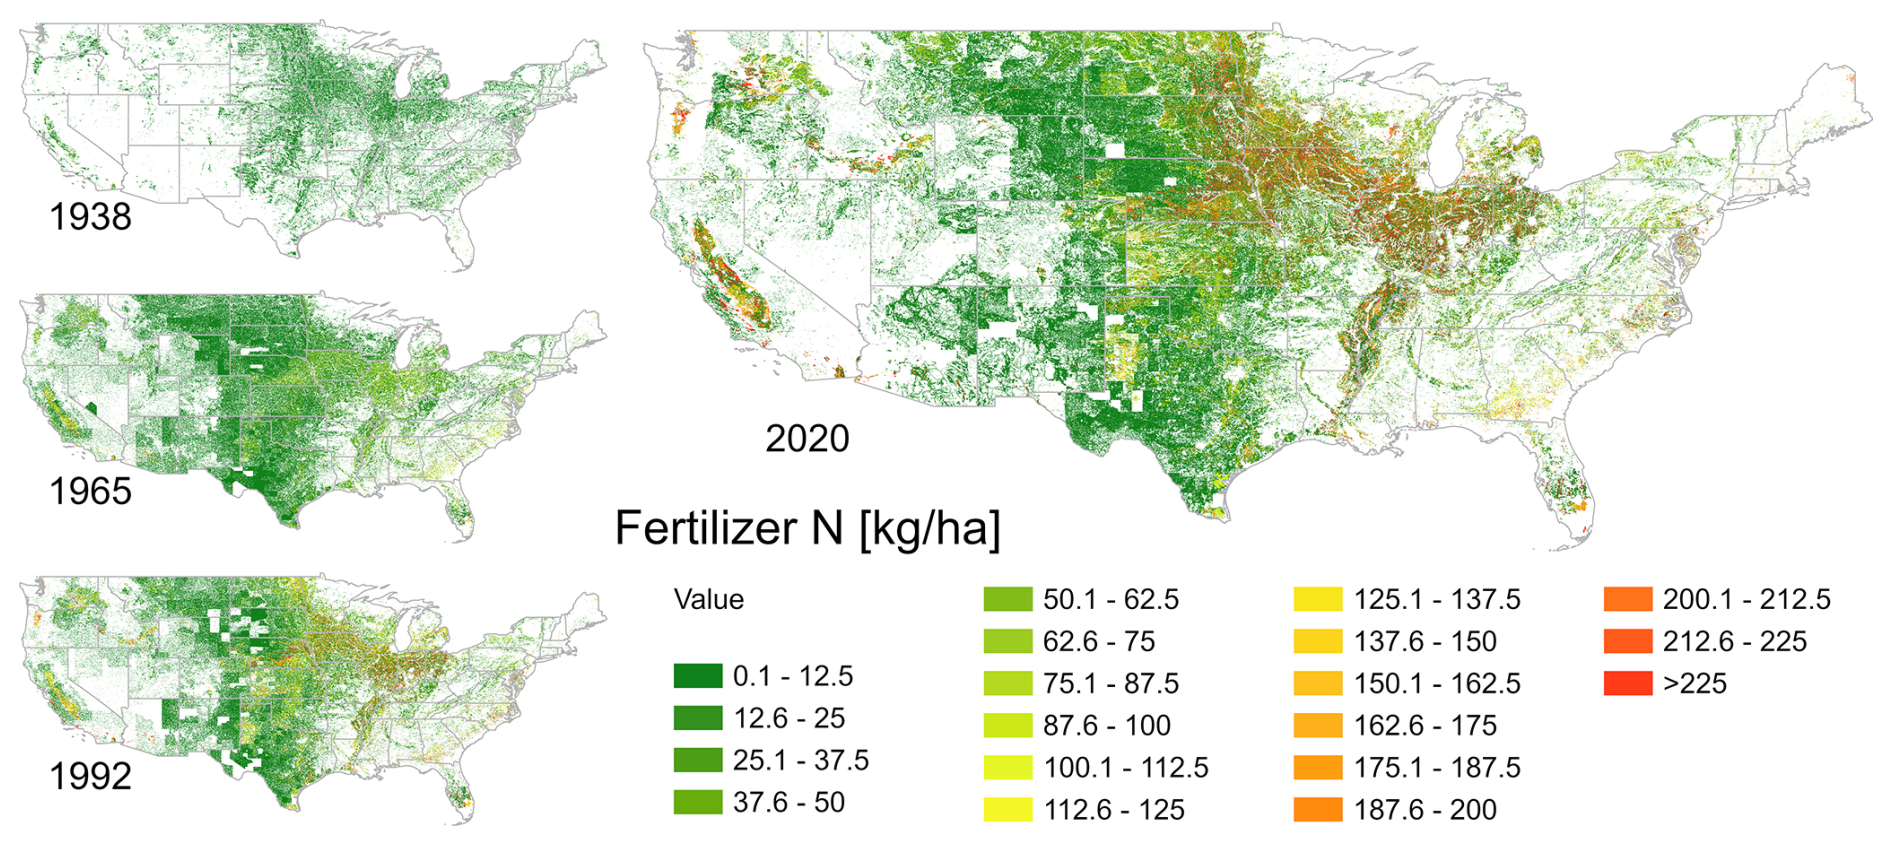
Figure 6Fertilizer N inputs at 48 arcsec resolution for 1938, 1965, 1992, and 2020 estimated by this study (HLNID).
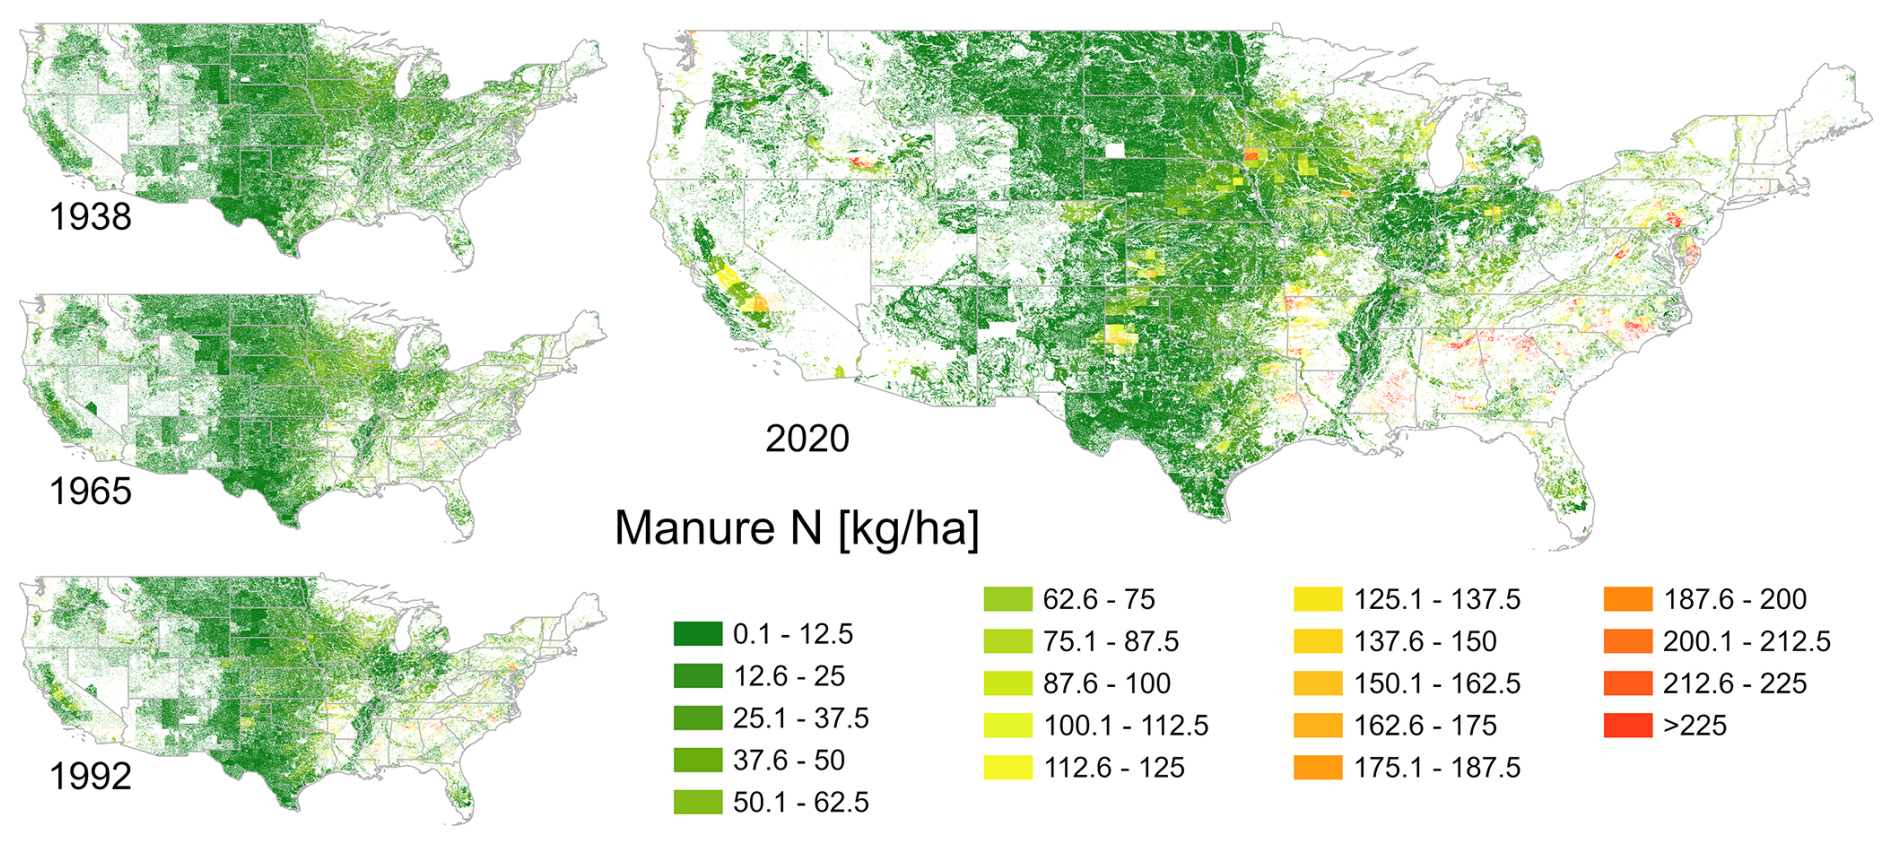
Figure 7Manure N inputs at 48 arcsec resolution for 1938, 1965, 1992, and 2020 estimated by this study (HLNID).
3.3 Irrigation extent
Estimated irrigated cropland area across CONUS more than tripled from 1938 (4.5 Mha) to 2020 (15 Mha). Irrigated cropland in 1938 primarily existed in the Western US with California dominant (Fig. 8). By 1965, irrigated cropland area increased within the West and expanded further east into Nebraska, Kansas, the Texas panhandle, and the Mississippi Portal. These trends continued through 2020 with irrigation hotspots emerging in southern Idaho, eastern Nebraska, and the Mississippi Portal to join with the intensified Central Valley in California.
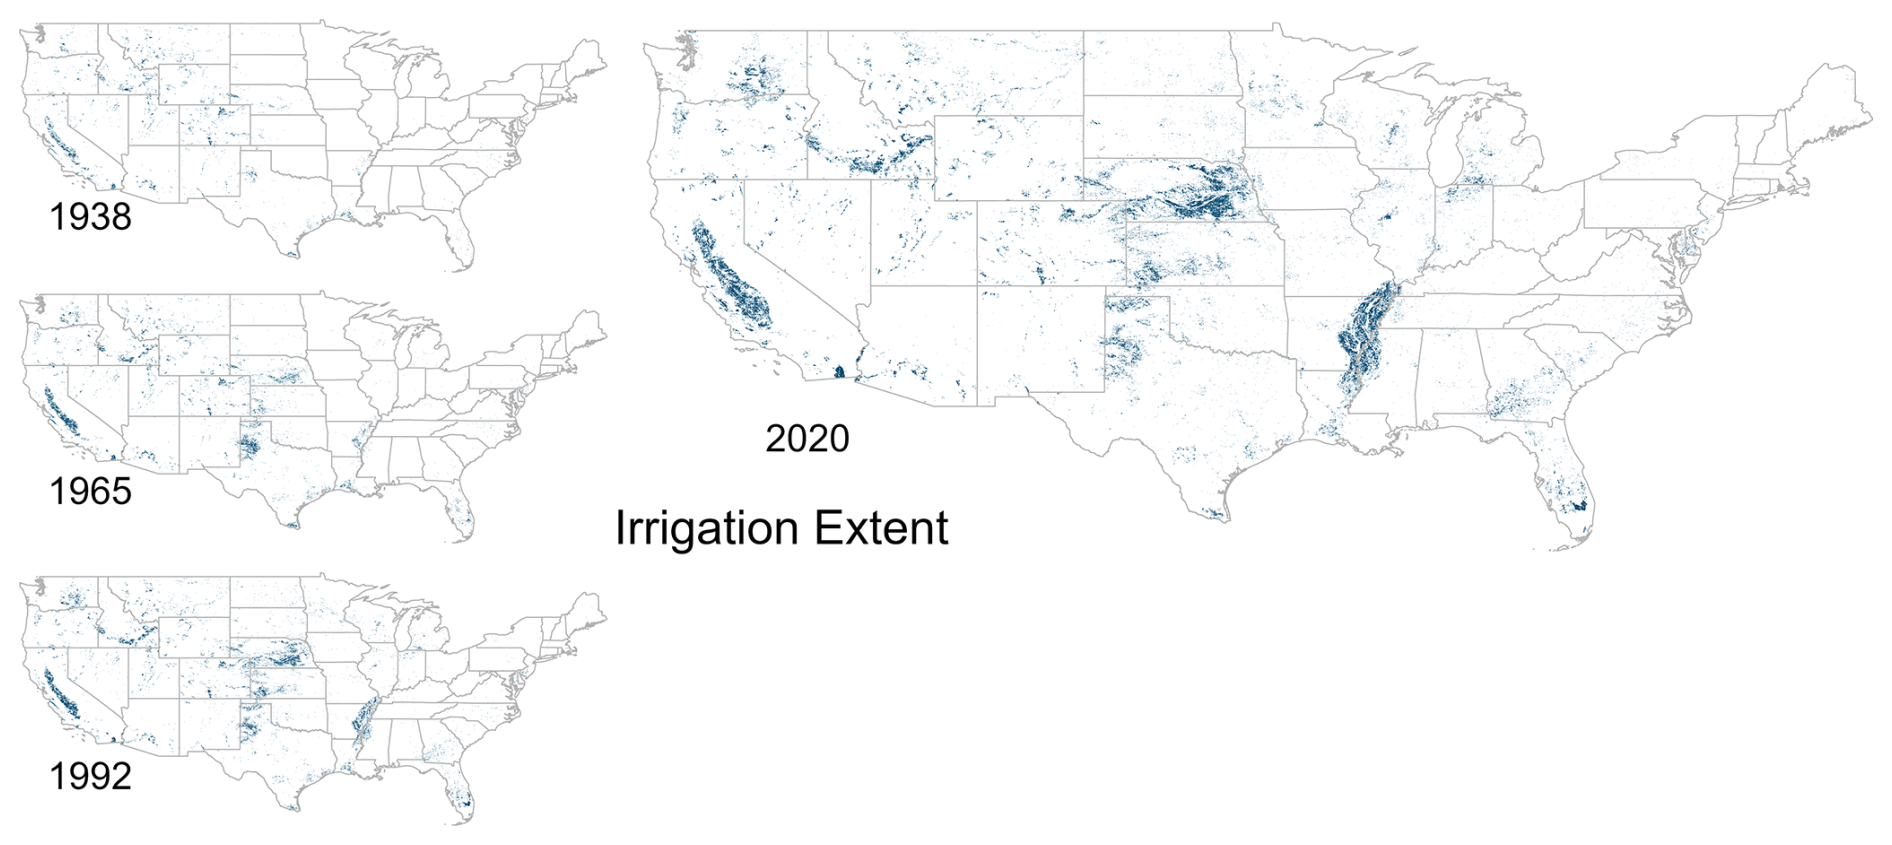
Figure 8Irrigation extent at 48 arcsec resolution for 1938, 1965, 1992, and 2020 estimated by this study (HLNID).
3.4 Spatial scale comparison
LULC composition is generally similar at the two different spatial resolutions (48 and 150 arcsec) (Fig. 9). Following the logic of the method and order of the steps, cropland and pasture areas are very similar between the two resolutions because they are tied to the CoA areas and determined first from the available land pixels in a given county. The non-agricultural LULC types are also generally similar across scales but start to differ more the later in the order of spatial allocation it is assigned (Fig. 10). For instance, the grass/shrub category differs the most between scales likely because it is the last category assigned in the algorithm and is allocated to all remaining land pixels.
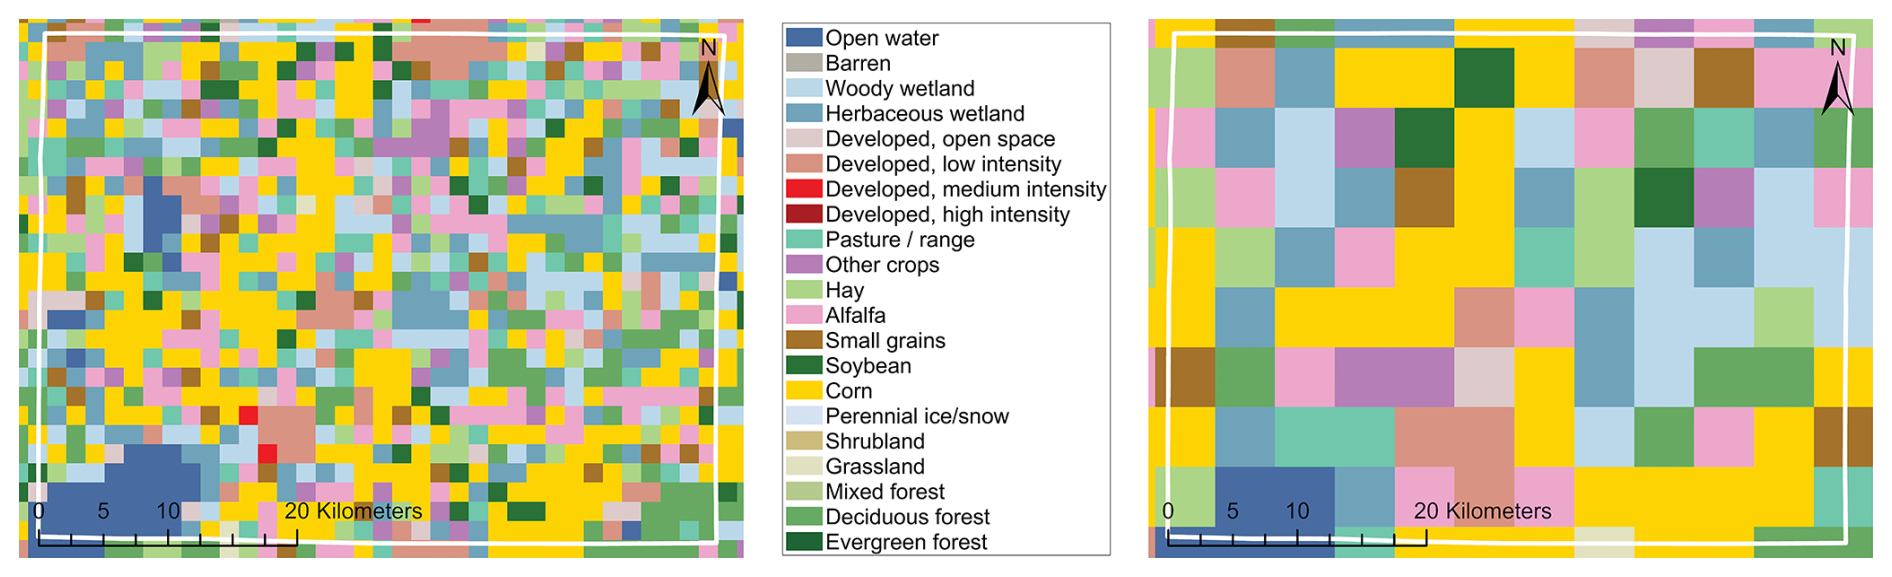
Figure 9Land use-land cover maps at 48 (left) and 150 (right) arcsec resolution of a representative county (Jefferson, WI) in 1980.
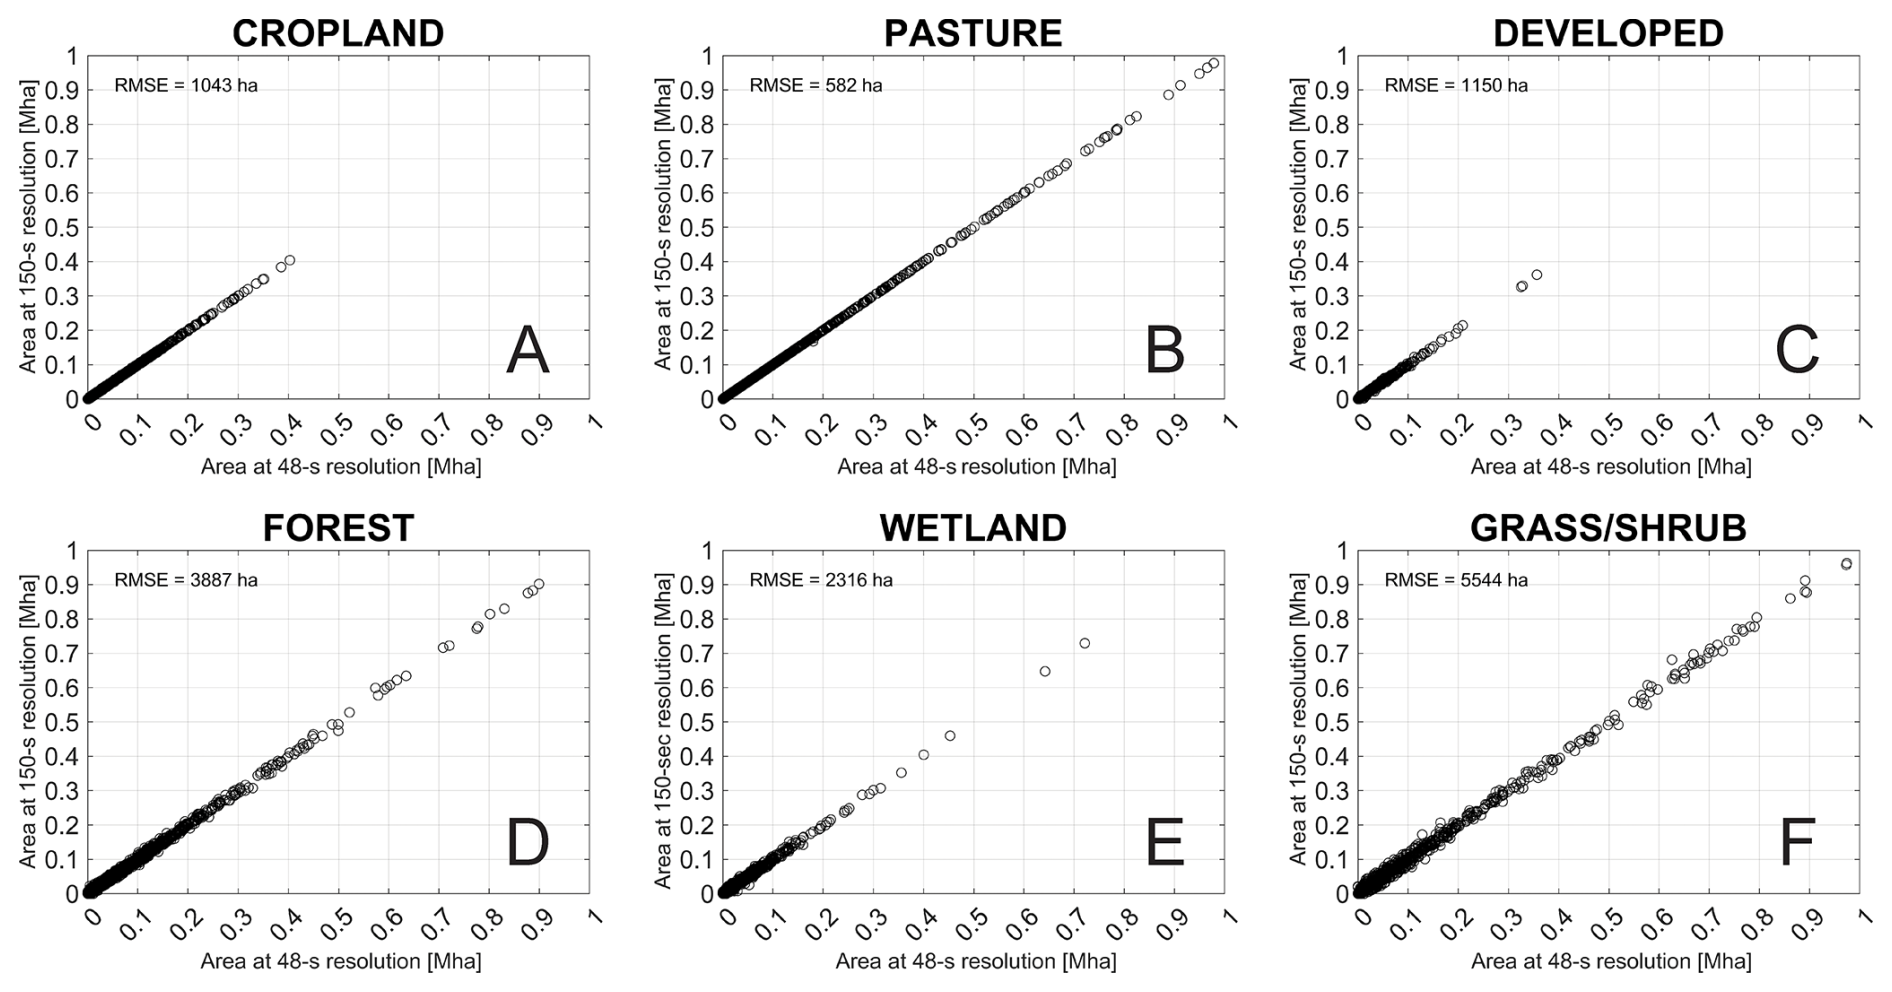
Figure 10Comparison of estimated areas for 6 LULC types for the year 2020 in each CONUS county at 48 and 150 arcsec resolution with error reported as root-mean-squared-error (RMSE).
4.1 Changes in land use-land cover, nutrients, and irrigation
While others have described some of the broader social, cultural, and economic drivers of the extensive changes that are documented within the HLNID (Alston et al., 2010; De Queiroz et al., 2025; Kucharik et al., 2023; Spangler et al., 2020; Waisanen and Bliss, 2002), we focus here on some of the more detailed changes highlighted through this high-resolution dataset. Specifically, the harmonized LULC dataset allows interpretation of simultaneous changes across agricultural, developed, and natural LULC categories.
Broader trends across the 1938–2020 time period include a modest decline in cropland (8 %), moderate increase in forest area (12 %), and substantial increases in developed area (130 %) as cropland production intensified, forest regrew replacing cropland primarily in the East, and major metropolitan areas expanded in population. In addition, a large decline in pasture area (24 %) occurred over this period but the causes are less clear. Certainly, some pastureland has been lost due to cropland expansion, afforestation (e.g., from fire suppression), and urban development (Sayre, 2023) but limitations of the historical CoA dataset in terms of changing definitions of rangeland and pasture through time may also have led to some of that decline. In practical terms, the shifting between the “pasture/range” and “grassland” LULC categories through time in some regions – particularly in the West – may not reflect a precise change in livestock management but the grassland biome is still represented in both categories.
The LULC changes from 1938 to 2020 also show a clear expansion of soybean across many parts of the CONUS but occurring at different periods of time. For example, expansion in the Heartland accelerated in the 1950s and steadily grew from 1980 to 2020 as market demand for soybean oil, meat, and eventually biodiesel increased and an extensive processing infrastructure developed (Katsikis, 2023). Alternatively, soybeans (along with corn) expanded in the Northern Great Plains later starting in the 1990s – replacing small grains, pasture, and grassland with many environmental consequences (Johnston, 2014; Otto et al., 2016).
As synthetic (N) and mineral (P) fertilizers became less expensive and more readily available starting in the middle of the 20th century, their mass available to supply more nutrient-demanding crops expanded across many parts of the CONUS (Figs. S2 and S3). While the fertilizer maps (Figs. 6 and S1) largely follow the locations of higher-demanding, higher-yield cropping systems (e.g., corn and soy in the Heartland, vegetable crops in the Central Valley of California), the manure maps (Figs. 7 and S2) show pockets of livestock consolidation emerging in the 2000s (e.g., chicken production in the uplands of the Southern Seaboard, dairy production in southern Idaho).
Irrigation extent maps also reveal the timing and patterning over a time of great change in agricultural water development in the United States. For example, High Plains Ogallala Aquifer in the Prairie Gateway was the location of dramatic expansion in groundwater irrigation starting in the 1960s to supply corn, wheat, cotton, sorghum, and (later) soybean production and an emerging cattle feedlot system (Watson, 2020).
4.2 Comparison with other datasets
We designed the method of creating the HLNID in a way that equates estimates of cropland and pasture area to the CoA and adjusts estimates of non-agricultural land based on NLCD composition. Thus, a comparison of the HLNID with these two foundational datasets – while highlighting their similarity as a successful implementation of the method's logic – does not illuminate the true accuracy of the approach. The HLNID method merely reflects the underlying CoA dataset and is not an independent estimation approach. Any accuracy assessment would need to be deferred to general discussions of the CoA accuracy and its historical approach to representing agricultural land use based on farmer surveys (e.g., Young et al., 2017). However, many researchers have viewed the CoA dataset as the most accurate and comprehensive dataset available for agricultural land use history in the United States (Johnson, 2013; Lark et al., 2017; Larsen et al., 2015). Similarly, the NLCD is seen as a highly accurate and quality controlled dataset for non-agricultural land cover type mapping during the satellite-era (Wickham et al., 2023; Yang et al., 2018). Thus, our method does not perform an independent accuracy assessment based on the fact that such a “true” dataset does not exist. However, it does match well with the CoA and NLCD as designed (Fig. 4). The only exception is for the pasture and grassland/shrubland types – that implicitly overlap across the CoA and NLCD datasets – where the HLNID is biased towards CoA estimates of pasture and rangeland. Thus, we estimate the combined grassland and shrubland area to be much less than the Li et al. (2023), FORE-SCE, and NLCD datasets (Fig. 4F) because those datasets do not distinguish pasture within those other cover types. Similarly, the HLNID estimates of pasture/range are much higher than FORE-SCE and NLCD because the latter datasets combine hay and pasture, negating a fair comparison (Fig. 4C).
Our method does produce – by design – a dataset that is more aligned with the NLCD across the major non-agricultural land classes as compared to other recent datasets including Li et al. (2023) and FORE-SCE. For example, our developed area estimates match well with Li et al. (2023) – who also used the NLCD as training data – but are much higher than FORE-SCE (Fig. 4A). The HLNID forest area is slightly less than the NLCD but other datasets clearly overestimate (based on the NLCD) including the FORE-SCE and Li et al. (2023). Finally, the HLNID matches the most closely to the NLCD for wetland area compared to all of the other datasets that underestimate (based on the NLCD). We argue that the resulting LULC dataset well represents the most accurate and trusted estimates of areas across a broad range of thematic classes both agricultural and non-agricultural.
Similarly to our discussion of LULC comparisons to other datasets, we are not able to assess the accuracy of the nutrient and irrigation datasets because no other independent datasets exist that are different from the ones that the method already uses. However, our method broadly reflects and captures the richness of the county-level datasets on fertilizer, manure, and irrigation extent that trace their origins to the CoA.
4.3 Limitations and future directions
While an extensive uncertainty analysis is not possible due to the lack of independent sources of historical LULC, nutrients, and irrigation data and documented and quantified uncertainties associated with each data input to our method, recognizing the primary sources of uncertainty – for both estimating county-level demand and the spatial allocation of that demand – is important for proper use of the HLNID. Although the CoA is the most accurate historical dataset for agricultural land use in the CONUS (Johnson, 2013; Lark et al., 2017; Larsen et al., 2015), uncertainties exist – and have been quantified since 2012 – related to response form errors and statistical adjustments to correct for undercoverage and misclassification. The use of the FORE-SCE historical LULC dataset (Sohl et al., 2016, 2018) for the 1938–1984 time period introduces additional uncertainty related to other land use survey data sources (e.g., forest inventories) and the FORE-SCE model's algorithm to estimate demand and spatial allocation. The satellite-based data products (NLCD, CDL) used to estimate non-agricultural land demand as well as spatial allocation have undergone their own uncertainty analyses (Fleckenstein et al., 2026; Lark et al., 2021) but are generally better at correctly classifying the more dominant land cover types (e.g., corn in the Midwest). County-level fertilizer use data compiled by the USGS also have inherent uncertainties associated with the downscaling of state-level fertilizer mass data to the county scale using either fertilized crop area or fertilizer expenditures from the CoA.
Several simplifying assumptions were implemented in the HLNID development method that increase uncertainty and may impact some applications. Open water is held constant through all years of the LULC dataset to facilitate the use by models that cannot represent a shifting land-water interface. In reality, open water area has changed both due to reservoir construction and climate fluctuations in the record, which has important implications for ecosystems and human water use (Stegen et al., 2025). In addition, some temporal smoothing was used on the CoA dataset to reduce noise inherent in a dataset with ∼ 5-year snapshots of a dynamic agricultural landscape and improve harmonization. Thus, using the dataset to analyze specific year-to-year changes is not recommended; instead, broader trends are a key focus. Assuming that crop-to-corn fertilizer ratios are constant through time and across CONUS despite notable changes and differences in agricultural management also brings uncertainty.
The use of contemporary (CDL) crop frequency maps was important for spatially allocating crop-specific land use prior to the satellite error (1985) but the implicit assumption that these frequency maps are generally unchanging through time creates additional uncertainty especially in areas where specific crop distributions have shifted within a county through time. While the presented method for LULC determination does result in annual rotations of various crops based on time-varying spatial maps of crop type frequency (from the CDL), alternate methods may be necessary to replicate more realistic crop rotations. For instance, if a given grid cell has a relatively consistent frequency of 60 % for corn and 40 % for soybean over several years, the method presented will likely result in continuous corn and not a corn-soybean rotation. However, where these frequencies vary from year to year to the point where different crop types take turns in being dominant, a rotation will result.
Inherent in our method is the argument that county-scale datasets are necessary to address spatial heterogeneity in nutrient mass and type (manure vs fertilizer) compared to downscaling state-level datasets uniformly across a state's cropland area. However, even county-scale datasets cannot adequately capture the spatial heterogeneity needed for some applications such as groundwater nitrate modeling (Juckem et al., 2024). Specifically, the assumption of spatially uniform allocation of county-based manure mass to all cropland can be problematic especially in counties where livestock operations have consolidated spatially (Booth and Kucharik, 2022). Recent efforts to map out point-scale livestock operations from historical aerial imagery using machine learning techniques (Miralha et al., 2022; Saha et al., 2025) could be leveraged to make more accurate manure nutrient maps based on distance to operation and other rules (e.g., Motew et al., 2017).
With both fertilizer and (as-excreted) manure nutrients, the spatial estimates represent the mass available to be potentially applied to the landscape. In reality, any application method will lead to losses due to processes such as N volatilization. While other nutrient datasets have estimated these losses and provided the spatial datasets following these losses (e.g., Bian et al., 2021), we have intentionally created the HLNID to represent the system prior to these losses so that users have the flexibility to apply different loss-estimation methods and the ability to simulate nitrogen-based greenhouse gas emissions from agricultural landscapes.
While irrigation extent is critical information for many water and agricultural management applications, estimating irrigation application rates on that land is an area of active research that is necessary for enabling more detailed estimates of hydrologic and ecosystem impact (Brookfield et al., 2024). In addition, new spatial agricultural management datasets based on satellite remote sensing products are emerging that are also essential drivers of ecosystem functioning including tillage intensity (Wang et al., 2023) and cover crop adoption (Zhou et al., 2022). These new datasets may need to be incorporated in future versions of HLNID to provide a more encompassing dataset of land and agricultural drivers. Finally, there is also a clear need to extend these datasets even further back in time to capture important land changes despite the increasing uncertainty associated with datasets like the CoA prior to 1938. However, we recommend using datasets such as the Biophysical Settings in the LANDFIRE dataset (Rollins, 2009) that represents pre-Euro-American settlement vegetation conditions as a starting point to bridge the gap in time.
The flexible and adaptable framework presented for developing the HLNID will be used to create new versions of the dataset that incorporate updated and new raw input datasets and innovative methods. Several current raw data limitations are worth highlighting. The county-scale fertilizer dataset has been dependent on state-level fertilizer sales data from the Association of American Plant Food Control Officials – who aggregates data from individual states – that has not been updated and incorporated into the method presented by Falcone (2020, 2021) that estimates data prior to the year 2017. Delays in the incorporation of updated foundational datasets can impact the use and quality of the spatial nutrient datasets. In addition, some researchers have highlighted concerns about recent declines in CoA survey response rates making that dataset less accurate through time (Smith, 2024). As methods evolve to track important agricultural variables into the future (Young et al., 2024), so too will methods to incorporate them into the HLNID workflow.
All HLNID annual raster datasets are available at: https://doi.org/10.5061/dryad.r4xgxd2rh (Booth and Kucharik, 2026).
LULC (including agricultural crop types), nutrients (nitrogen and phosphorus from fertilizer and manure), and irrigation are primary drivers of ecosystem processes and functions that provide benefits to humans across the landscape of the conterminous United States (CONUS). This study presents the methods used to produce the Harmonized Land Nutrient Irrigation Dataset (HLNID) that spans the years 1938–2020, a time of substantial and spatially-variable change including the intensification of agriculture with more fertilizer nutrients and irrigation. The approach to producing the LULC dataset includes specifying the “demand” area for each class, county, and year based on the CoA and other spatial datasets from historical models and remote sensing (e.g., NLCD) and then allocating each class area based on its mapped frequency determined by historical datasets for non-agricultural classes (FORE-SCE, NLCD) and more recent datasets for agricultural classes (CDL). The LULC dataset was then used as input to spatially allocate historical, county-scale fertilizer and manure nutrients based on crop demand. Finally, county-scale irrigated cropland area from the COA was spatially allocated for each year of the historical period using spatial frequency maps from a recent remotely-sensed irrigation product (MIrAD-US). The resulting dataset provides comprehensive and harmonized-through-time maps that are consistent with foundational datasets such as the CoA and NLCD – by design – that reveal many important changes in LULC such as expansion of corn and soybean into the Northern Great Plains and widespread conversion of cropland to forest in the East. Both fertilizer N and P increased substantially through time and were highest in the regions with high-demanding crops. Manure N and P increased less at the CONUS scale but high amounts were concentrated in areas with intensified livestock production. Finally, irrigation also expanded dramatically across the CONUS but primarily in semi-arid Western regions and the Mississippi Portal. The HLNID can be used to analyze historical changes in the major drivers of landscape and ecosystem functioning.
The supplement related to this article is available online at https://doi.org/10.5194/essd-18-3415-2026-supplement.
EB designed the methodology, developed the code, and created the datasets. EB and CK conceptualized the research goals and aims and acquired financial support for the project. EB prepared the manuscript with editing from CK.
The contact author has declared that neither of the authors has any competing interests.
Publisher's note: Copernicus Publications remains neutral with regard to jurisdictional claims made in the text, published maps, institutional affiliations, or any other geographical representation in this paper. The authors bear the ultimate responsibility for providing appropriate place names. Views expressed in the text are those of the authors and do not necessarily reflect the views of the publisher.
This material is supported by a grant from the National Science Foundation's Innovations at the Nexus of Food, Energy, and Water Systems (INFEWS) program (award number 1855996).
This research has been supported by the Directorate for Geosciences, Division of Earth Sciences (grant no. 1855996).
This paper was edited by Jia Yang and reviewed by two anonymous referees.
Alexander, R. B. and Smith, R. A.: County-Level Estimates of Nitrogen and Phosphorus Fertilizer Use in the United States, 1945 to 1985, Open-File Report 90-130, U.S. Geological Survey, Reston, VA, https://doi.org/10.3133/ofr90130, 1990.
Alston, J. M., James, J. S., Andersen, M. A., and Pardey, P. G.: A Brief History of U.S. Agriculture, in: Persistence Pays, Springer New York, New York, NY, 9–21, https://doi.org/10.1007/978-1-4419-0658-8_2, 2010.
Ascott, M. J., Gooddy, D. C., Fenton, O., Vero, S., Ward, R. S., Basu, N. B., Worrall, F., Van Meter, K., and Surridge, B. W. J.: The need to integrate legacy nitrogen storage dynamics and time lags into policy and practice, Sci. Total Environ., 781, 146698, https://doi.org/10.1016/j.scitotenv.2021.146698, 2021.
Bian, Z., Tian, H., Yang, Q., Xu, R., Pan, S., and Zhang, B.: Production and application of manure nitrogen and phosphorus in the United States since 1860, Earth Syst. Sci. Data, 13, 515–527, https://doi.org/10.5194/essd-13-515-2021, 2021.
Booth, E. G. and Kucharik, C. J.: Data inaccessibility at sub-county scale limits implementation of manuresheds, J. Environ. Qual., 51, 614–621, https://doi.org/10.1002/jeq2.20271, 2022.
Booth, E. G. and Kucharik, C. J.: Harmonized land nutrient irrigation dataset (HLNID) for conterminous United States, 1938–2020, Dryad [data set], https://doi.org/10.5061/dryad.r4xgxd2rh, 2026.
Boryan, C., Yang, Z., Mueller, R., and Craig, M.: Monitoring US agriculture: the US Department of Agriculture, National Agricultural Statistics Service, Cropland Data Layer Program, Geocarto Int., 26, 341–358, https://doi.org/10.1080/10106049.2011.562309, 2011.
Brakebill, J. W. and Gronberg, J. A. M.: County-Level Estimates of Nitrogen and Phosphorus from Commercial Fertilizer for the Conterminous United States, 1987–2012: U.S. Geological Survey data release, https://doi.org/10.5066/F7H41PKX, 2017.
Brookfield, A. E., Zipper, S., Kendall, A. D., Ajami, H., and Deines, J. M.: Estimating Groundwater Pumping for Irrigation: A Method Comparison, Groundwater, 62, 15–33, https://doi.org/10.1111/gwat.13336, 2024.
Brown, J. F. and Pervez, M. S.: Merging remote sensing data and national agricultural statistics to model change in irrigated agriculture, Agr. Syst., 127, 28–40, https://doi.org/10.1016/j.agsy.2014.01.004, 2014.
Brown, J. F., Howard, D., Shrestha, D., and Benedict, T. D.: Moderate Resolution Imaging Spectroradiometer (MODIS) Irrigated Agriculture Datasets for the Conterminous United States (MIrAD-US), U.S. Geological Survey, https://doi.org/10.5066/P9NA3EO8, 2019.
Byrnes, D. K., Van Meter, K. J., and Basu, N. B.: Long-Term Shifts in U.S. Nitrogen Sources and Sinks Revealed by the New TREND-Nitrogen Data Set (1930–2017), Global Biogeochem. Cy., 34, e2020GB006626, https://doi.org/10.1029/2020GB006626, 2020.
Cao, P., Lu, C., and Yu, Z.: Historical nitrogen fertilizer use in agricultural ecosystems of the contiguous United States during 1850–2015: application rate, timing, and fertilizer types, Earth Syst. Sci. Data, 10, 969–984, https://doi.org/10.5194/essd-10-969-2018, 2018.
Crossley, M. S., Burke, K. D., Schoville, S. D., and Radeloff, V. C.: Recent collapse of crop belts and declining diversity of US agriculture since 1840, Glob. Change Biol., 27, 151–164, https://doi.org/10.1111/gcb.15396, 2021.
De Queiroz, P. V., Mahmood, R., Fulginiti, L., and Perrin, R.: Land use policies, land use land cover change, and climate: a review with examples from the United States, Environ. Dev. Sustain., https://doi.org/10.1007/s10668-025-06023-8, 2025.
Dewitz, J.: National Land Cover Database (NLCD) 2019 Products (ver. 3.0, February 2024), U.S. Geological Survey, https://doi.org/10.5066/P9KZCM54, 2024.
Donner, S. D. and Kucharik, C. J.: Corn-based ethanol production compromises goal of reducing nitrogen export by the Mississippi River, P. Natl. Acad. Sci. USA, 105, 4513–4518, https://doi.org/10.1073/pnas.0708300105, 2008.
Dornbierer, J., Wika, S., Robison, C., Rouze, G., and Sohl, T.: Prototyping a Methodology for Long-Term (1680–2100) Historical-to-Future Landscape Modeling for the Conterminous United States, Land, 10, 536, https://doi.org/10.3390/land10050536, 2021.
Falcone, J. A.: Estimates of County-Level Nitrogen and Phosphorus from Fertilizer and Manure from 1950 through 2017 in the Conterminous United States: U.S. Geological Survey Open-File Report 2020-1153, U.S. Geological Survey, Reston, VA, https://doi.org/10.3133/ofr20201153, 2020.
Falcone, J. A.: Tabular county-level nitrogen and phosphorus estimates from fertilizer and manure for approximately 5-year periods from 1950 to 2017, U.S. Geological Survey, https://doi.org/10.5066/P9VSQN3C, 2021.
Fleckenstein, R., Wellington, D., Jin, S., Tollerud, H., Brown, J. F., Dewitz, J., Pastick, N. J., Barber, C. P., O'Brien, A., and Spanier, M.: A framework for integrating spatiotemporal deep learning methods with landsat for annual land cover and impervious surface mapping, Remote Sens. Environ., 338, 115347, https://doi.org/10.1016/j.rse.2026.115347, 2026.
Gaither, K. and Terry, D. L.: Uniform fertilizer tonnage reporting system – version 4 – Instruction manual, Association of American Plant Food Control Officials, 2004.
Goslee, S. C.: National Land-Cover Data and Census of Agriculture Estimates of Agricultural Land-Use Area Differ in the Northeastern United States, Photogramm. Eng. Rem. S., 77, 141–147, https://doi.org/10.14358/PERS.77.2.141, 2011.
Haines, M., Fishback, P., and Rhode, P.: United States Agriculture Data, 1840–2012: Version 4 (v4), Inter-university Consortium for Political and Social Research, https://doi.org/10.3886/ICPSR35206.V4, 2014.
Hamlin, Q. F., Kendall, A. D., Martin, S. L., Whitenack, H. D., Roush, J. A., Hannah, B. A., and Hyndman, D. W.: Quantifying Landscape Nutrient Inputs With Spatially Explicit Nutrient Source Estimate Maps, J. Geophys. Res.-Biogeosci., 125, 2, https://doi.org/10.1029/2019JG005134, 2020.
Hochmuth, G. J. and Hanlon, E. A.: IFAS Standardized Fertilization Recommendations for Vegetable Crops, Institute of Food and Agricultural Sciences, University of Florida Extension, https://www.haifa-group.com/sites/default/files/2024-03/CV00200.pdf (last access: 14 November 2024), 2000.
Homer, C., Dewitz, J., Fry, J., Coan, M., Hossain, N., Larson, C., Herold, N., McKerrow, A., VanDriel, J. N., and Wickham, J.: Completion of the 2001 national land cover database for the conterminous United States, Photogramm. Eng. Rem. S., 73, 337–341, 2007.
Ilampooranan, I., Van Meter, K. J., and Basu, N. B.: Intensive agriculture, nitrogen legacies, and water quality: intersections and implications, Environ. Res. Lett., 17, 035006, https://doi.org/10.1088/1748-9326/ac55b5, 2022.
Johnson, D. M.: A 2010 map estimate of annually tilled cropland within the conterminous United States, Agr. Syst., 114, 95–105, https://doi.org/10.1016/j.agsy.2012.08.004, 2013.
Johnston, C. A.: Agricultural expansion: land use shell game in the U.S. Northern Plains, Landscape Ecol., 29, 81–95, https://doi.org/10.1007/s10980-013-9947-0, 2014.
Juckem, P. F., Corson-Dosch, N. T., Schachter, L. A., Green, C. T., Ferin, K. M., Booth, E. G., Kucharik, C. J., Austin, B. P., and Kauffman, L. J.: Design and calibration of a nitrate decision support tool for groundwater wells in Wisconsin, USA, Environ. Modell. Softw., 176, 105999, https://doi.org/10.1016/j.envsoft.2024.105999, 2024.
Katsikis, N.: The Horizontal Factory. The Operationalisation of the US Corn and Soy Belt, in: Extended Urbanisation, edited by: Schmid, C. and Topalovic, M., De Gruyter, 121–158, https://doi.org/10.1515/9783035623031-004, 2023.
Klein Goldewijk, K., Beusen, A., Doelman, J., and Stehfest, E.: Anthropogenic land use estimates for the Holocene – HYDE 3.2, Earth Syst. Sci. Data, 9, 927–953, https://doi.org/10.5194/essd-9-927-2017, 2017.
Kucharik, C. J., Booth, E. G., Loheide, S. P., Power, R., Rissman, A. R., Seifert, J., and Turner, M. G.: Building US food-energy-water security requires avoiding unintended consequences for ecosystems, Front. Ecol. Environ., 21, 234–243, https://doi.org/10.1002/fee.2634, 2023.
Laboski, C. A. M. and Peters, J. B.: Nutrient application guidelines for field, vegetable, and fruit crops in Wisconsin, University of Wisconsin – Extension, https://cdn.shopify.com/s/files/1/0145/8808/4272/files/A2809.pdf (last access: 2 December 2024), 2012.
Lamsal, G. and Marston, L. T.: HarvestGRID: high-resolution harvested crop areas of the United States from 1981 to 2019, Environ. Res.-Food Syst., 2, 015006, https://doi.org/10.1088/2976-601x/ad96bf, 2025.
Lark, T. J., Mueller, R. M., Johnson, D. M., and Gibbs, H. K.: Measuring land-use and land-cover change using the U.S. department of agriculture's cropland data layer: Cautions and recommendations, Int. J. Appl. Earth Obs., 62, 224–235, https://doi.org/10.1016/j.jag.2017.06.007, 2017.
Lark, T. J., Schelly, I. H., and Gibbs, H. K.: Accuracy, Bias, and Improvements in Mapping Crops and Cropland across the United States Using the USDA Cropland Data Layer, Remote Sens., 13, 968, https://doi.org/10.3390/rs13050968, 2021.
Lark, T. J., Hendricks, N. P., Smith, A., Pates, N., Spawn-Lee, S. A., Bougie, M., Booth, E. G., Kucharik, C. J., and Gibbs, H. K.: Environmental outcomes of the US Renewable Fuel Standard, P. Natl. Acad. Sci. USA, 119, e2101084119, https://doi.org/10.1073/pnas.2101084119, 2022.
Larsen, A. E., Hendrickson, B. T., Dedeic, N., and MacDonald, A. J.: Taken as a given: Evaluating the accuracy of remotely sensed crop data in the USA, Agr. Syst., 141, 121–125, https://doi.org/10.1016/j.agsy.2015.10.008, 2015.
Leng, G., Huang, M., Tang, Q., Sacks, W. J., Lei, H., and Leung, L. R.: Modeling the effects of irrigation on land surface fluxes and states over the conterminous United States: Sensitivity to input data and model parameters, J. Geophys. Res.-Atmos., 118, 9789–9803, https://doi.org/10.1002/jgrd.50792, 2013.
Li, X., Tian, H., Lu, C., and Pan, S.: Four-century history of land transformation by humans in the United States (1630–2020): annual and 1 km grid data for the HIStory of LAND changes (HISLAND-US), Earth Syst. Sci. Data, 15, 1005–1035, https://doi.org/10.5194/essd-15-1005-2023, 2023.
Manson, S., Schroeder, J., Van Riper, D., Knowles, K., Kugler, T., Roberts, F., and Ruggles, S.: National Historical Geographic Information System: Version 18.0 (18.0), IPUMS, Institute for Social Research and Data Innovation, University of Minnesota, https://doi.org/10.18128/D050.V18.0, 2023.
Martin, S. L., Hayes, D. B., Kendall, A. D., and Hyndman, D. W.: The land-use legacy effect: Towards a mechanistic understanding of time-lagged water quality responses to land use/cover, Sci. Total Environ., 579, 1794–1803, https://doi.org/10.1016/j.scitotenv.2016.11.158, 2017.
Maxwell, S. K., Wood, E. C., and Janus, A.: Comparison of the USGS 2001 NLCD to the 2002 USDA Census of Agriculture for the Upper Midwest United States, Agr. Ecosyst. Environ., 127, 141–145, https://doi.org/10.1016/j.agee.2008.03.012, 2008.
Mehring, A. L., Adams, J. R., and Jacob, K. D.: Statistics on Fertilizers and Liming Materials in the United States. Statistical Bulletin No. 191, U.S. Department of Agriculture, Agricultural Research Service, Soil and Water Conservation Research Branch, https://esmis.nal.usda.gov/sites/default/release-files/k930bx03n/4q77fv50w/bn999b01q/fertstat_Statistics_on_Fertilizers_and_Liming_Materials__1880-1955.pdf (last access: 23 July 2024), 1957.
Miralha, L., Sidique, S., and Logsdon Muenich, R.: The spatial organization of CAFOs and its relationship to water quality in the United States, J. Hydrol., 613, 128301, https://doi.org/10.1016/j.jhydrol.2022.128301, 2022.
Motew, M., Chen, X., Booth, E. G., Carpenter, S. R., Pinkas, P., Zipper, S. C., Loheide, S. P., Donner, S. D., Tsuruta, K., Vadas, P. A., and Kucharik, C. J.: The Influence of Legacy P on Lake Water Quality in a Midwestern Agricultural Watershed, Ecosystems, 20, 1468–1482, https://doi.org/10.1007/s10021-017-0125-0, 2017.
Oswalt, S. N., Smith, W. B., Miles, P. D., and Pugh, S. A.: Forest Resources of the United States, 2017: a technical document supporting the Forest Service 2020 RPA Assessment, U.S. Department of Agriculture, Forest Service, Washington, DC, https://doi.org/10.2737/WO-GTR-97, 2019.
Otto, C. R. V., Roth, C. L., Carlson, B. L., and Smart, M. D.: Land-use change reduces habitat suitability for supporting managed honey bee colonies in the Northern Great Plains, P. Natl. Acad. Sci. USA, 113, 10430–10435, https://doi.org/10.1073/pnas.1603481113, 2016.
Pervez, M. S. and Brown, J. F.: Mapping Irrigated Lands at 250-m Scale by Merging MODIS Data and National Agricultural Statistics, Remote Sens., 2, 2388–2412, https://doi.org/10.3390/rs2102388, 2010.
Robertson, D. M. and Saad, D. A.: Nitrogen and Phosphorus Sources and Delivery from the Mississippi/Atchafalaya River Basin: An Update Using 2012 SPARROW Models, J. Am. Water Resour. As., 57, 406–429, https://doi.org/10.1111/1752-1688.12905, 2021.
Robertson, G. P. and Vitousek, P. M.: Nitrogen in Agriculture: Balancing the Cost of an Essential Resource, Annu. Rev. Env. Resour., 34, 97–125, https://doi.org/10.1146/annurev.environ.032108.105046, 2009.
Rollins, M. G.: LANDFIRE: a nationally consistent vegetation, wildland fire, and fuel assessment, Int. J. Wildland Fire, 18, 235–249, https://doi.org/10.1071/WF08088, 2009.
Ruddy, B. C., Lorenz, D. L., and Mueller, D. K.: County-level estimates of nutrient inputs to the land surface of the conterminous United States, 1982–2001, Reston, VA, https://doi.org/10.3133/sir20065012, 2006.
Saha, A., Rashid, B., Liu, T., Miralha, L., and Muenich, R. L.: Machine learning-based identification of animal feeding operations in the United States on a parcel-scale, Sci. Total Environ., 960, 178312, https://doi.org/10.1016/j.scitotenv.2024.178312, 2025.
Sayre, N. F.: A History of North American Rangelands, in: Rangeland Wildlife Ecology and Conservation, edited by: McNew, L. B., Dahlgren, D. K., and Beck, J. L., Springer International Publishing, Cham, 49–73, https://doi.org/10.1007/978-3-031-34037-6_3, 2023.
Sharifi, A. and Kalin, L.: Effect of Land Use Uncertainty on Watershed Modeling, in: World Environmental and Water Resources Congress 2010, World Environmental and Water Resources Congress 2010, 4730–4739, https://doi.org/10.1061/41114(371)480, 2010.
Shrestha, D., Brown, J. F., Benedict, T. D., and Howard, D. M.: Exploring the Regional Dynamics of U.S. Irrigated Agriculture from 2002 to 2017, Land, 10, 394, https://doi.org/10.3390/land10040394, 2021.
Smith, A.: Did the Ag Census Undercount Cropland?, Ag Data News, https://agdatanews.substack.com/p/did-the-ag-census-undercount-cropland (last access: 9 May 2024), 2024.
Sohl, T., Reker, R., Bouchard, M., Sayler, K., Dornbierer, J., Wika, S., Quenzer, R., and Friesz, A.: Modeled historical land use and land cover for the conterminous United States, Journal of Land Use Science, 11, 476–499, https://doi.org/10.1080/1747423X.2016.1147619, 2016.
Sohl, T. L., Reker, R., Bouchard, M., Sayler, K., Dornbierer, J., Wika, S., Quenzer, R., and Friesz, A.: Modeled Historical Land Use and Land Cover for the Conterminous United States: 1938–1992, U.S. Geological Survey, https://doi.org/10.5066/F7KK99RR, 2018.
Spangler, K., Burchfield, E. K., and Schumacher, B.: Past and Current Dynamics of U.S. Agricultural Land Use and Policy, Front. Sustain. Food Syst., 4, 98, https://doi.org/10.3389/fsufs.2020.00098, 2020.
Stanton, R. L., Morrissey, C. A., and Clark, R. G.: Analysis of trends and agricultural drivers of farmland bird declines in North America: A review, Agr. Ecosyst. Environ., 254, 244–254, https://doi.org/10.1016/j.agee.2017.11.028, 2018.
Stegen, J., Burgin, A. J., Busch, M. H., Fisher, J. B., Ladau, J., Abrahamson, J., Kinsman-Costello, L., Li, L., Chen, X., Datry, T., McDowell, N., Tatariw, C., Braswell, A., Deines, J. M., Guimond, J. A., Regier, P., Rod, K., Bam, E. K. P., Fluet-Chouinard, E., Forbrich, I., Jaeger, K. L., O'Meara, T., Scheibe, T., Seybold, E., Sweetman, J. N., Zheng, J., Allen, D. C., Herndon, E., Middleton, B. A., Painter, S., Roche, K., Scamardo, J., Vander Vorste, R., Boye, K., Wohl, E., Zimmer, M., Hondula, K., Laan, M., Marshall, A., and Patel, K. F.: Reviews and syntheses: Variable inundation across Earth's terrestrial ecosystems, Biogeosciences, 22, 995–1034, https://doi.org/10.5194/bg-22-995-2025, 2025.
USDA: 2017 Census of Agriculture. U.S. Department of Agriculture, National Agricultural Statistics Service, https://www.nass.usda.gov/Publications/AgCensus/2017/ (last access: 13 May 2022), 2019.
USDA: Cropland Data Layer. U.S. Department of Agriculture, National Agricultural Statistics Service, https://www.nass.usda.gov/Research_and_Science/Cropland/Release/index.php (last access: 23 October 2025), 2024.
USDA-ERS: Fertilizer Use and Price. U.S. Department of Agriculture, Economic Research Service, https://www.ers.usda.gov/data-products/fertilizer-use-and-price (last access: 5 August 2025), 2019.
USGS: Annual National Land Cover Database (NLCD) Collection 1.0 Reference Data Product, U.S. Geological Survey, https://doi.org/10.5066/P13EDMAF, 2025.
Van Meter, K. J., Van Cappellen, P., and Basu, N. B.: Legacy nitrogen may prevent achievement of water quality goals in the Gulf of Mexico, Science, 360, 427–430, https://doi.org/10.1126/science.aar4462, 2018.
Waisanen, P. J. and Bliss, N. B.: Changes in population and agricultural land in conterminous United States counties, 1790 to 1997, Global Biogeochem. Cy., 16, https://doi.org/10.1029/2001GB001843, 2002.
Wang, S., Di Tommaso, S., Deines, J. M., and Lobell, D. B.: Mapping twenty years of corn and soybean across the US Midwest using the Landsat archive, Sci. Data, 7, 307, https://doi.org/10.1038/s41597-020-00646-4, 2020.
Wang, S., Di Tommaso, S., Deines, J., and Lobell, D.: Corn-Soy Data Layer, Zenodo [data set], https://doi.org/10.5281/ZENODO.3742742, 2021.
Wang, S., Guan, K., Zhang, C., Zhou, Q., Wang, S., Wu, X., Jiang, C., Peng, B., Mei, W., Li, K., Li, Z., Yang, Y., Zhou, W., Huang, Y., and Ma, Z.: Cross-scale sensing of field-level crop residue cover: Integrating field photos, airborne hyperspectral imaging, and satellite data, Remote Sens. Environ., 285, 113366, https://doi.org/10.1016/j.rse.2022.113366, 2023.
Watson, A.: “The Single Most Important Factor”: Fossil Fuel Energy, Groundwater, and Irrigation on the High Plains, 1955–1985, Agr. Hist., 94, 629, https://doi.org/10.3098/ah.2020.094.4.629, 2020.
White, M. J., Arnold, J. G., Bieger, K., Allen, P. M., Gao, J., Čerkasova, N., Gambone, M., Park, S., Bosch, D. D., Yen, H., and Osorio, J. M.: Development of a Field Scale SWAT+ Modeling Framework for the Contiguous U.S., J. Am. Water Resour. As., 58, 1545–1560, https://doi.org/10.1111/1752-1688.13056, 2022.
Wickham, J., Stehman, S. V., Sorenson, D. G., Gass, L., and Dewitz, J. A.: Thematic accuracy assessment of the NLCD 2019 land cover for the conterminous United States, GISci. Remote Sens., 60, 2181143, https://doi.org/10.1080/15481603.2023.2181143, 2023.
Xie, Y., Gibbs, H. K., and Lark, T. J.: Landsat-based Irrigation Dataset (LANID): 30 m resolution maps of irrigation distribution, frequency, and change for the US, 1997–2017, Earth Syst. Sci. Data, 13, 5689–5710, https://doi.org/10.5194/essd-13-5689-2021, 2021.
Yang, L., Jin, S., Danielson, P., Homer, C., Gass, L., Bender, S. M., Case, A., Costello, C., Dewitz, J., Fry, J., Funk, M., Granneman, B., Liknes, G. C., Rigge, M., and Xian, G.: A new generation of the United States National Land Cover Database: Requirements, research priorities, design, and implementation strategies, ISPRS J. Photogramm., 146, 108–123, https://doi.org/10.1016/j.isprsjprs.2018.09.006, 2018.
Yang, Q., Tian, H., Li, X., Ren, W., Zhang, B., Zhang, X., and Wolf, J.: Spatiotemporal patterns of livestock manure nutrient production in the conterminous United States from 1930 to 2012, Sci. Total Environ., 541, 1592–1602, https://doi.org/10.1016/j.scitotenv.2015.10.044, 2016.
Ye, S., Cao, P., and Lu, C.: Annual time-series 1 km maps of crop area and types in the conterminous US (CropAT-US): cropping diversity changes during 1850–2021, Earth Syst. Sci. Data, 16, 3453–3470, https://doi.org/10.5194/essd-16-3453-2024, 2024.
Young, L. J., Lamas, A. C., and Abreu, D. A.: The 2012 Census of Agriculture: A Capture–Recapture Analysis, JABES, 22, 523–539, https://doi.org/10.1007/s13253-017-0303-8, 2017.
Young, L. J., Carletto, G., Márquez, G., Rozkrut, D. A., and Stefanou, S.: The production of official agricultural statistics in 2040: What does the future hold?, Statistical Journal of the IAOS: Journal of the International Association for Official Statistics, 40, 203–210, https://doi.org/10.3233/SJI-240043, 2024.
Yu, Z. and Lu, C.: Historical cropland expansion and abandonment in the continental U.S. during 1850 to 2016, Global Ecol. Biogeogr., 27, 322–333, https://doi.org/10.1111/geb.12697, 2018.
Yu, Z., Lu, C., Cao, P., and Tian, H.: Long-term terrestrial carbon dynamics in the Midwestern United States during 1850–2015: Roles of land use and cover change and agricultural management, Glob. Change Biol., 24, 2673–2690, https://doi.org/10.1111/gcb.14074, 2018.
Zhou, Q., Guan, K., Wang, S., Jiang, C., Huang, Y., Peng, B., Chen, Z., Wang, S., Hipple, J., Schaefer, D., Qin, Z., Stroebel, S., Coppess, J., Khanna, M., and Cai, Y.: Recent Rapid Increase of Cover Crop Adoption Across the U.S. Midwest Detected by Fusing Multi-Source Satellite Data, Geophys. Res. Lett., 49, https://doi.org/10.1029/2022gl100249, 2022.