the Creative Commons Attribution 4.0 License.
the Creative Commons Attribution 4.0 License.
 | 20 Apr 2026
A harmonized 2000–2024 dataset of daily river ice concentration and annual phenology for major Arctic rivers
Jiahui Qiu
Kari Luojus
Harri Kaartinen
Yubao Qiu
Jari Silander
Epari Ritesh Patro
Björn Klöve
Ali Torabi Haghighi
River ice plays a critical role in Arctic freshwater routing, navigation safety, and biogeochemical exchange. However, consistent, daily-resolved observations across the pan-Arctic remain scarce. Here we present a harmonized, multi-decadal dataset of daily river ice concentration (RIC) and annual phenology (freeze-up, breakup, and ice duration) for the six largest Arctic rivers – Yukon, Mackenzie, Ob, Yenisey, Lena, and Kolyma – covering hydrological years 2001–2024. Built from >590 000 MODIS Terra/Aqua scenes, our workflow integrates a scalable threshold-based classifier on Google Earth Engine with dual-satellite daily synthesis, temporal-window cloud reclassification, and a high-latitude dark-period correction. Technical validation against higher-resolution optical imagery shows a mean RIC accuracy of 0.83 across basins. Phenological metrics derived from MODIS agree with in situ records with mean absolute errors (MAE) of 10.8 d for freeze-up and 11.4 d for breakup (improving to 8.4 d relative to the onset of ice drift), and with Landsat-based river-section phenology with MAE of 10.5 d (freeze-up) and 16.0 d (breakup). RIC correlates strongly with surface air temperature (mean Pearson ) and increases systematically with latitude. Trend analysis from 2001 through 2024 shows delayed freeze-up in over 66 % of river segments, earlier breakup in more than 65 %, and shorter ice seasons in over 65 %. On average, freeze-up is delayed by 9.0 d, breakup occurs 7.8 d earlier, and ice duration shortens by 14.1 d over the study period. These basin-consistent, temporally resolved records provide an open benchmark for diagnosing cryospheric change in Arctic river corridors and for constraining model–data intercomparisons. The river-ice dataset is available via Zenodo (https://doi.org/10.5281/zenodo.17054619, Qiu et al., 2025a).
- Article
(14123 KB) - Full-text XML
-
Supplement
(5813 KB) - BibTeX
- EndNote


River ice, a key component of the terrestrial cryosphere, forms seasonally in rivers that drain more than one-third of Earth's landmass (Prowse et al., 2007; Yang et al., 2020). Its distribution, however, is markedly asymmetric between the Northern and Southern Hemispheres (Yang et al., 2020). Most seasonally ice-covered rivers are located in the Northern Hemisphere, where approximately 56 % of rivers experience ice cover of varying durations (Bennett and Prowse, 2010; Wang and Feng, 2024). Seasonal river ice across pan-Arctic river corridors plays a crucial role in regulating various aspects of river functioning. It influences channel morphology, hydrological regimes, and the exchange of heat and carbon, with far-reaching consequences for riverine ecosystems (Prowse, 2001; Beltaos, 2013; Gebre et al., 2013; Blackadar et al., 2020; Zhang et al., 2024). Beyond its environmental relevance, river ice and its phenological dynamics have significant socio-economic relevance for Arctic communities. Seasonal ice roads serve as critical transportation links enabling recreational activities in remote northern regions, while ice jam events during spring breakup pose substantial threats to infrastructure, property, and public safety in riparian zones (de Rham et al., 2008; Richards et al., 2023; Burrell et al., 2023; Huang and Shen, 2023).
The pan-Arctic region hosts several major river systems, including the Yukon and Mackenzie rivers in northern North America, as well as the Ob, Yenisey, Lena, and Kolyma rivers in Siberia (Patro et al., 2024). These high-latitude rivers drain extensive, permafrost-dominated basins and generally flow poleward into the Arctic Ocean; the Yukon is the sole exception among the six, running west across central Alaska before turning southwest to the Bering Sea. Despite regional contrasts, all six exhibit low channel gradients and large annual discharges (Shiklomanov et al., 2002; Lisina et al., 2023). During prolonged and severe winters, a significant portion of river water is stored in solid form as stable ice, reflecting the strong seasonal nature of river ice evolution in the region (Beltaos and Prowse, 2009). Previous studies suggested that river ice extent has declined in many regions, with an estimated global average reduction of approximately 2.5 % between 1984 and 2018 (Yang et al., 2020). Concurrently, river ice phenology across the Northern Hemisphere has exhibited a warming-driven trajectory, marked by delayed freeze-up, earlier breakup, reduced maximum ice thickness or volume, and shortened ice-covered duration (Chen and She, 2020; Newton and Mullan, 2021; Fukś, 2023; Podkowa et al., 2023; Blåfield et al., 2024). Given the ongoing global climate warming, compounded by the Arctic amplification effect, river ice serves as a sensitive indicator of ongoing climate regime shifts (Pithan and Mauritsen, 2014; Qiu et al., 2025b). Accordingly, monitoring the spatiotemporal dynamics of river ice across the pan-Arctic is of critical scientific and societal relevance.
Early river ice studies primarily relied on in situ observations, typically 50 to 100 years, including shoreline photography, manual field patrols, and direct visual assessments to record ice-on/off dates, classify ice types, and measure ice thickness (Shiklomanov et al., 2002; Beltaos, 2008). Although highly accurate and physically detailed, these methods are logistically demanding, spatially limited, and often hazardous under severe Arctic winter conditions. In contrast, satellite remote sensing has emerged as the dominant approach for river ice monitoring, enabling large-scale, consistent, and repeatable observations (Chu and Lindenschmidt, 2019). Passive microwave sensors, despite their ability to operate independently of cloud cover and solar illumination, are constrained by a coarse spatial resolution (typically greater than 10 km), which limits the detection of localized ice features (Kim et al., 2017; Podkowa et al., 2023). Synthetic Aperture Radar (SAR) provides all-weather, relatively frequent observations and is particularly effective for identifying ice jam events, yet its sensitivity to surface roughness complicates the detection of surface melt ponds (Jeffries et al., 2005; Van der Sanden et al., 2021). High-resolution optical sensors such as Landsat and Sentinel-2 offer finer spatial detail but are hindered by low revisit rates and coarse tiling, making them suboptimal for capturing short-term phenological transitions (Yang et al., 2020; Li et al., 2023). Given these trade-offs, Moderate Resolution Imaging Spectroradiometer (MODIS) offers a practical and efficient solution for large Arctic river systems, with its combination of daily revisit capability and moderate spatial resolution (500 m for MOD09GA) well suited for large-scale, temporally detailed monitoring of river ice evolution in Arctic environments (Chaouch et al., 2014; Cooley and Pavelsky, 2016; Zhang et al., 2024).
Using hydrometric observations from Canada's gauging-station network, de Rham et al. (2020) developed the Canadian River Ice Database (CRID), providing a valuable national-scale compilation of river ice information. However, hydrologic archives remain deficient in basin-specific, long-term datasets that systematically document river ice dynamics across the pan-Arctic region. Although existing datasets provide useful information, Landsat-based products often require model-based reconstruction of daily ice conditions because of their limited revisit frequency, while temperature-based approaches infer rather than directly observe river ice conditions. Both approaches may therefore introduce additional uncertainty, highlighting the need for a MODIS-based dataset that provides an observation-based record of river ice dynamics across major pan-Arctic river systems. To address this gap, we developed a comprehensive, multi-decadal (2000–2024) dataset based on MODIS imagery, focusing on six major pan-Arctic river systems: the Yukon, Mackenzie, Ob, Yenisey, Lena, and Kolyma rivers. Using consistent and scalable methods across entire river systems, including both main channels and tributaries, we derived detailed records of river ice concentration (i.e., the fractional areal coverage of ice within the river surface) and key phenological metrics (ice-on/off dates and ice duration). This dataset enables basin-level analysis of long-term river ice dynamics, supporting investigation into the climatic and anthropogenic factors that shape ice regimes across the circumpolar Arctic.
2.1 Study region
The pan-Arctic region encompasses the northernmost parts of North America, Europe, and Asia, characterized by diverse geography that includes vast tundra, boreal forests, and expansive permafrost landscapes (Liston and Hiemstra, 2011). The region experiences a predominantly cold climate with significant seasonal variations, characterized by long, harsh winters and brief, mild summers (Serreze and Barry, 2014). Climatic conditions are strongly influenced by the Arctic Oscillation and polar atmospheric circulation, which significantly impact precipitation patterns, temperature fluctuations, and the evolution of river ice processes (Pavelsky and Smith, 2004; Prowse et al., 2011).
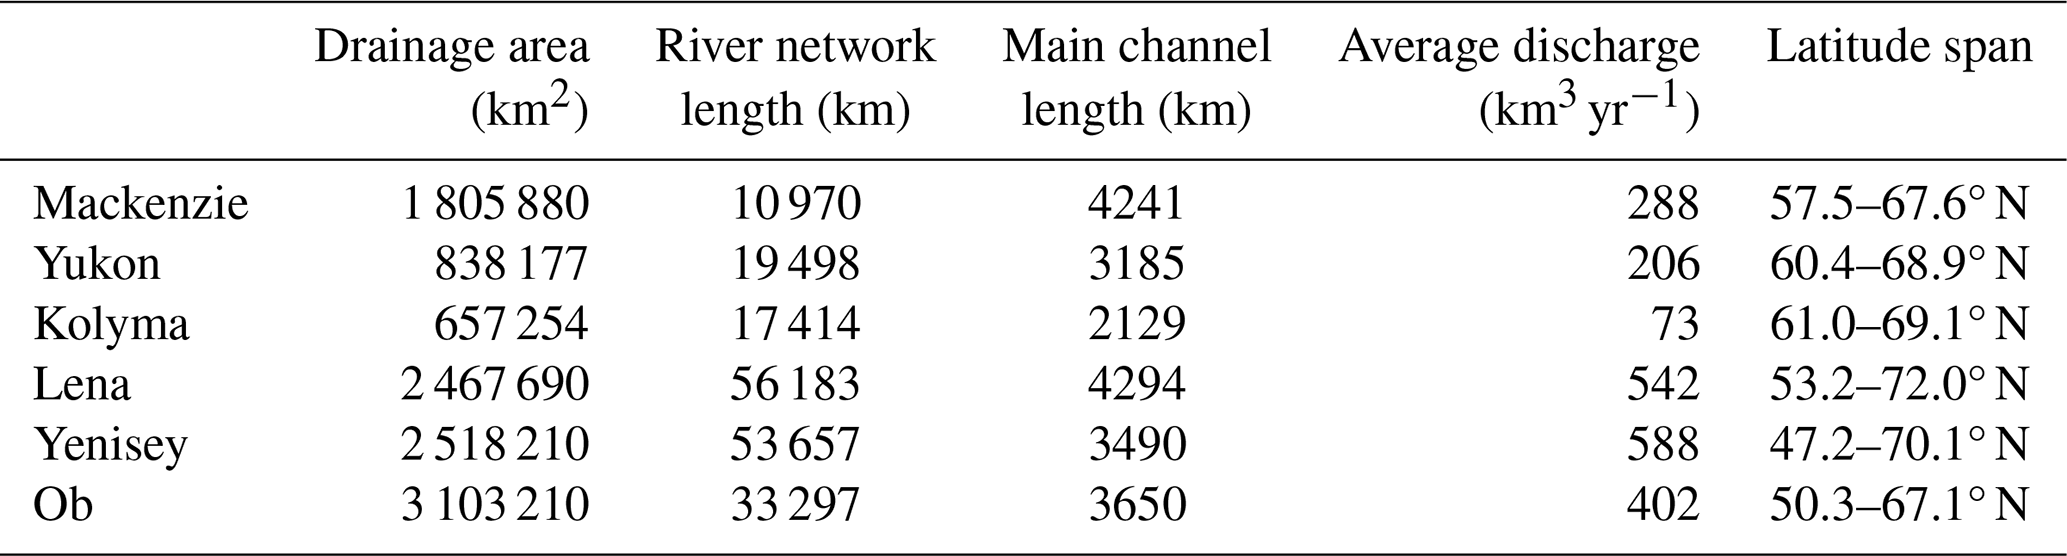
This study focuses on six major Arctic rivers – the Yukon, Mackenzie, Ob, Yenisey, Lena, and Kolyma – which span high latitudes (47.2–72.0° N) across North America and Eurasia, collectively draining extensive areas ( km2) into the Arctic or North Pacific Oceans (Allen and Pavelsky, 2018), as outlined in Fig. 1 and summarized in Table 1. These rivers exhibit substantial annual freshwater discharge – collectively averaging approximately 2099 km3 yr−1 – with five of them (excluding the Yukon River) accounting for about 45.1 % of the total freshwater inflow to the Arctic Ocean (Holmes et al., 2021; Osadchiev et al., 2023). Their discharge is primarily driven by spring snowmelt and summer precipitation, and they are characterized by pronounced seasonal cycles of river ice freezing and breakup (Holmes et al., 2013; Feng et al., 2021). Their basins generally experience cold climates, with annual average temperatures typically below 0 °C, and varying degrees of permafrost and glacier coverage, making them critical indicators of climate-driven environmental changes in the Arctic (Frey and McClelland, 2009; Liu et al., 2022).
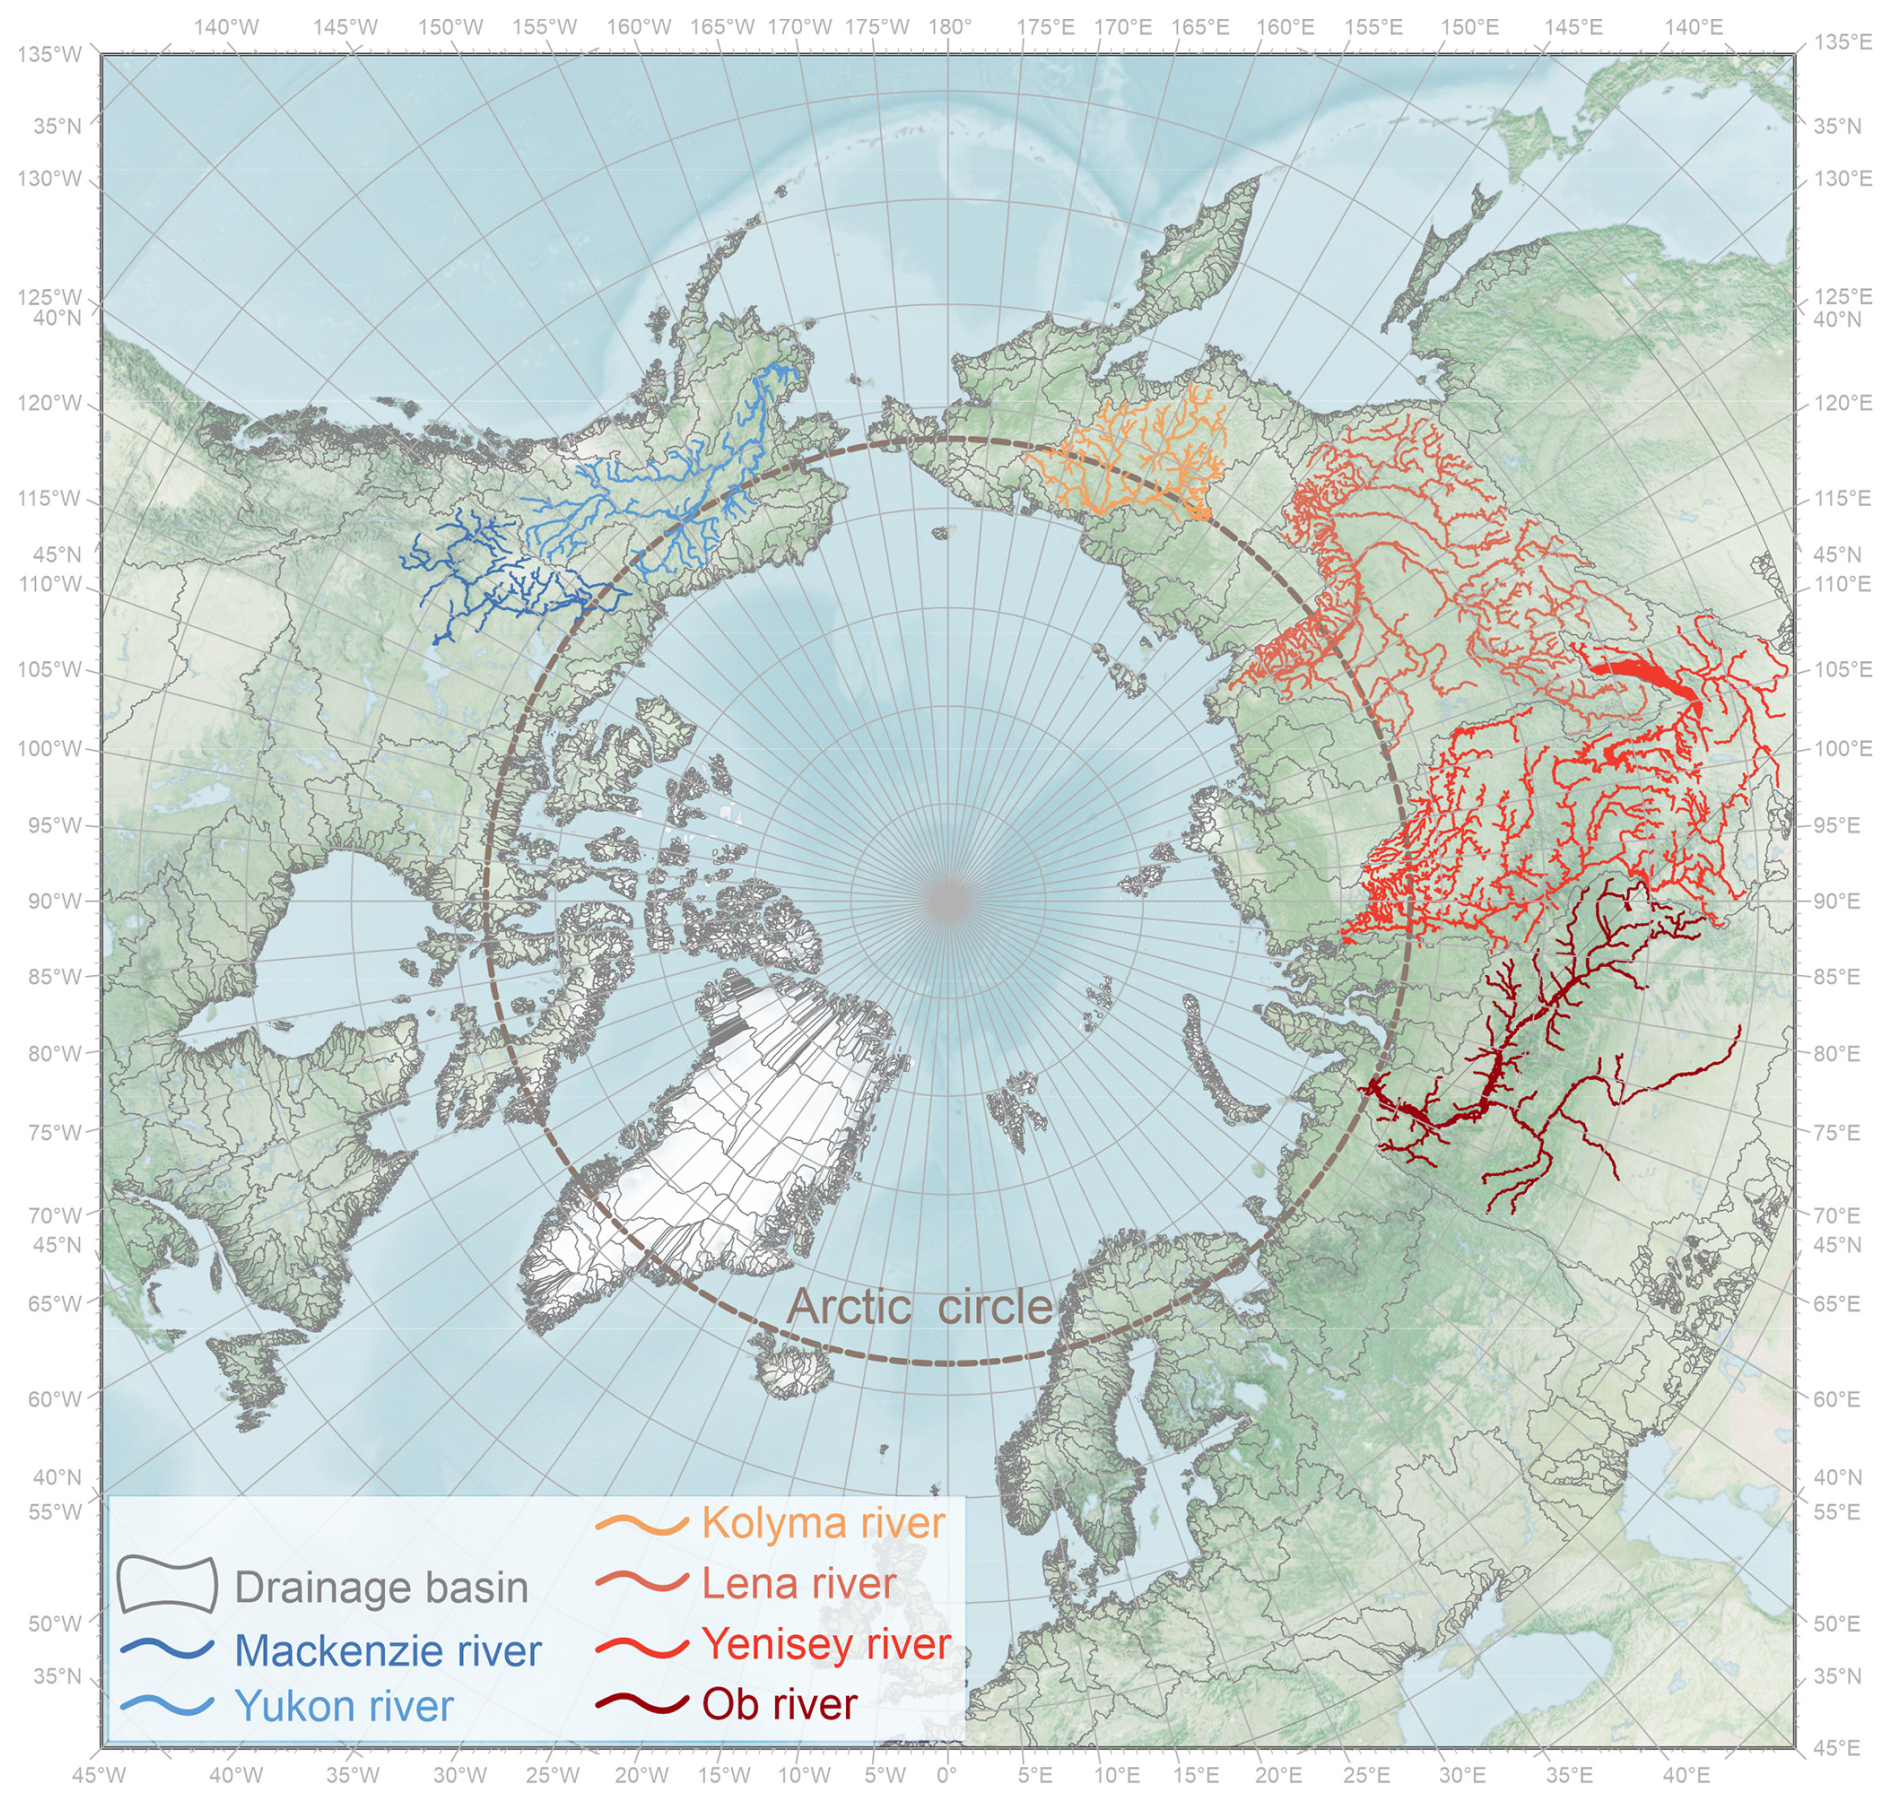
Figure 1Study area map showing the six major pan-Arctic rivers (Yukon, Mackenzie, Ob, Yenisey, Lena, and Kolyma rivers) under the WGS 84 / Arctic Polar Stereographic projection (EPSG:3995). The background map is from NASA Earth Observatory.
Table 1Summary of hydrological and geospatial attributes of the six major pan-Arctic rivers, derived from Allen and Pavelsky (2018).
2.2 Data sources
2.2.1 Spatial reference data
The static Global River Width from Landsat (GRWL) dataset was utilized as the spatial reference for the six major rivers analyzed in this study (Allen and Pavelsky, 2018). Specifically, the “RSSA_basins” layer, which provides global river and stream surface area (RSSA) totals by drainage basin, corresponding to HydroBASINS Level 3 data, was employed to define the extent of individual river watersheds (Lehner and Grill, 2013). To restrict the analysis to channels resolvable with coarser-pixelated MODIS imagery, we imposed a “width_max” ≥250 m filter to the “Simplified GRWL Vector Product”, retaining only the related river segments (polygons, converted from the “GRWL Mask” raster) with a maximum mapped width exceeding 250 m. A 250 m buffer was then applied to both sides of each retained segment to generate a vector polygon mask that delineates the maximum surface water envelope used as the spatial reference for each river system.
2.2.2 MODIS time series
The MODIS Surface Reflectance Daily products (MOD09GA and MYD09GA), acquired from the Terra and Aqua satellites, provide daily Level-2 gridded surface reflectance data corrected for atmospheric gases and aerosols at a spatial resolution of 500 m (Vermote and Wolfe, 2021). In this study, we derive daily river ice information from MODIS imagery spanning the hydrological years 2001–2024, with supplementary acquisitions from 1 August 2000 through 30 September 2000, to capture pre-freeze-up conditions for the hydrological year 2001 (1 October 2000 through 30 September 2001). Following the launch of Aqua on 4 July 2002, a combination of Terra- and Aqua-based observations was employed; prior to this, only Terra data were available. In total, over 590 000 MODIS tiles were utilized (306 305 from MOD09GA and 284 410 from MYD09GA), resulting in the generation of 52 023 daily river ice maps. Despite this extensive dataset, the MODIS optical archive still contained an average of 4 d yr−1 without usable observations during the 24 year study period, primarily due to orbital gaps and other missing or unusable source observations (Yao et al., 2021).
2.2.3 Landsat and Sentinel-2 imagery
Medium- to high-resolution optical imagery from the Landsat series (30 m) and Sentinel-2 (10 m) in the visible and near-infrared bands – each with revisit times of 16 and 10 d for a single satellite, or reduced by half, respectively, when operated as twin-satellite constellations – were used to validate river ice maps derived from MODIS data, owing to their finer spatial resolution and closer approximation to ground-truth conditions (Qiu et al., 2025b). A total of 1940 winter daily mosaics (1 October–30 April) drawn from Landsat 7 Enhanced Thematic Mapper Plus (ETM+), Landsat 8 and 9 Operational Land Imager (OLI and OLI-2), and Sentinel-2 Multi Spectral Instrument (MSI) were employed for validation.
2.2.4 River ice phenology data
This study incorporates a comprehensive set of relevant historical in situ river ice phenology data from hydrological stations reported in previous studies, where available and applicable (Shiklomanov and Lammers, 2014; Shiklomanov, 2016). In addition, a recent satellite remote sensing-based dataset – the rasterized Northern Hemisphere River Ice Phenology dataset, covering the period 2000–2021 – was included (Wang and Feng, 2024). This dataset has been evaluated using the Global Lake and River Ice Phenology Database (Benson et al., 2000).
2.2.5 Meteorological reanalysis data
Daily meteorological variables, including 2 m surface air temperature (SAT), net surface solar radiation, and total precipitation, were selected from the ERA5-Land dataset to identify key climatic drivers of river ice dynamics. ERA5-Land is an enhanced land surface reanalysis product derived by replaying the land component of the ERA5 climate reanalysis. It combines observations and model outputs through data assimilation to provide a consistent, multi-decadal record of daily land surface variables at a spatial resolution of 0.5° (Muñoz-Sabater et al., 2021).
3.1 River ice mapping
3.1.1 Threshold-based river ice pixel identification
Electro-optical and infrared imagery are valuable tools for monitoring and characterizing river ice cover, dynamics, and conditions under clear-sky conditions (Zakharov et al., 2024). Multispectral MODIS data, combined with automated pixel-wise classification based on spectral thresholding, have been widely used in operational methods to estimate ice concentration and extent (Cooley and Pavelsky, 2016). One commonly applied approach involves the Normalized Difference Snow Index (NDSI), which exploits the strong reflectance contrast between visible (particularly green) and near-infrared (NIR) or shortwave infrared (SWIR) wavelengths to enhance the detection of snow and ice features (Hall et al., 2002).
A robust threshold combination recommended by Hall et al. (2002) was adopted to identify river ice pixels: NDSI>0.40, ρNIR>0.10, and ρgreen>0.11, where ρNIR, ρgreen and ρSWIR represent surface reflectance values from the NIR (band 2), green (band 4), and SWIR (band 6) bands of MODIS Terra and Aqua imagery. This thresholding approach forms the basis of the river ice classification method applied in this study.
3.1.2 Daily synthesis from dual-satellite observations
To mitigate the effects of cloud contamination, daily observations from the MODIS dual-satellite constellation – Terra and Aqua – were synthesized. These satellites cross the study region once per day each at approximately 10:30 a.m. (Terra, descending node) and 01:30 p.m. (Aqua, ascending node), both in local solar time (LST), providing up to two observations per day per location under normal orbital conditions.
A pixel-level reclassification model was developed, following the lake ice mapping approach of Qiu et al. (2019). Specifically, for each pixel on each day, the final classification was determined based on the combination of Terra and Aqua observations as follows: (1) if either observation identified the pixel as river ice, it was classified as river ice (reclassified value = 255); (2) if both observations classified the pixel as cloud, as determined from bit 10 of the 1 km MOD09GA Quality Assurance (QA) band (state_1 km; 0 = no cloud, 1 = cloud), it was classified as cloud (reclassified value = 10); (3) if neither condition was met, the pixel was conservatively classified as background water (reclassified value = 0), representing an unclassified or mixed state potentially due to the poor imaging conditions.
It is important to note that prior to the launch of Aqua on 4 July 2002, only Terra-based observations were available. Consequently, daily classifications before this date rely solely on Terra data without dual-satellite synthesis. This approach improves daily river ice mapping by increasing data availability and reducing uncertainties associated with cloud cover (Li et al., 2019).
3.1.3 Temporal-based reclassification of cloud pixels
Following the dual-satellite synthesis, a temporal reclassification approach was applied to further reduce cloud-related uncertainties, based on the temporal continuity of river ice evolution, akin to the method proposed by Zhang et al. (2024). Specifically, both 3 and 5 d moving windows were used to reclassify cloud pixels on the central day of each window according to the following rules:
For the 3 d window, all nine possible combinations of river ice, water, and cloud were considered for a given pixel across three consecutive days (see illustration in Fig. 2). If the pixel was classified as river ice (or water) on both the preceding and following days, the central-day cloud pixel was reclassified accordingly as river ice (or water). If the adjacent days were labeled as river ice and water (or vice versa), the central pixel was interpreted as a transitional or mixed phase and conservatively reclassified as water. In the remaining five scenarios, the pixel was retained as cloud and subjected to evaluation in the 5 d window.
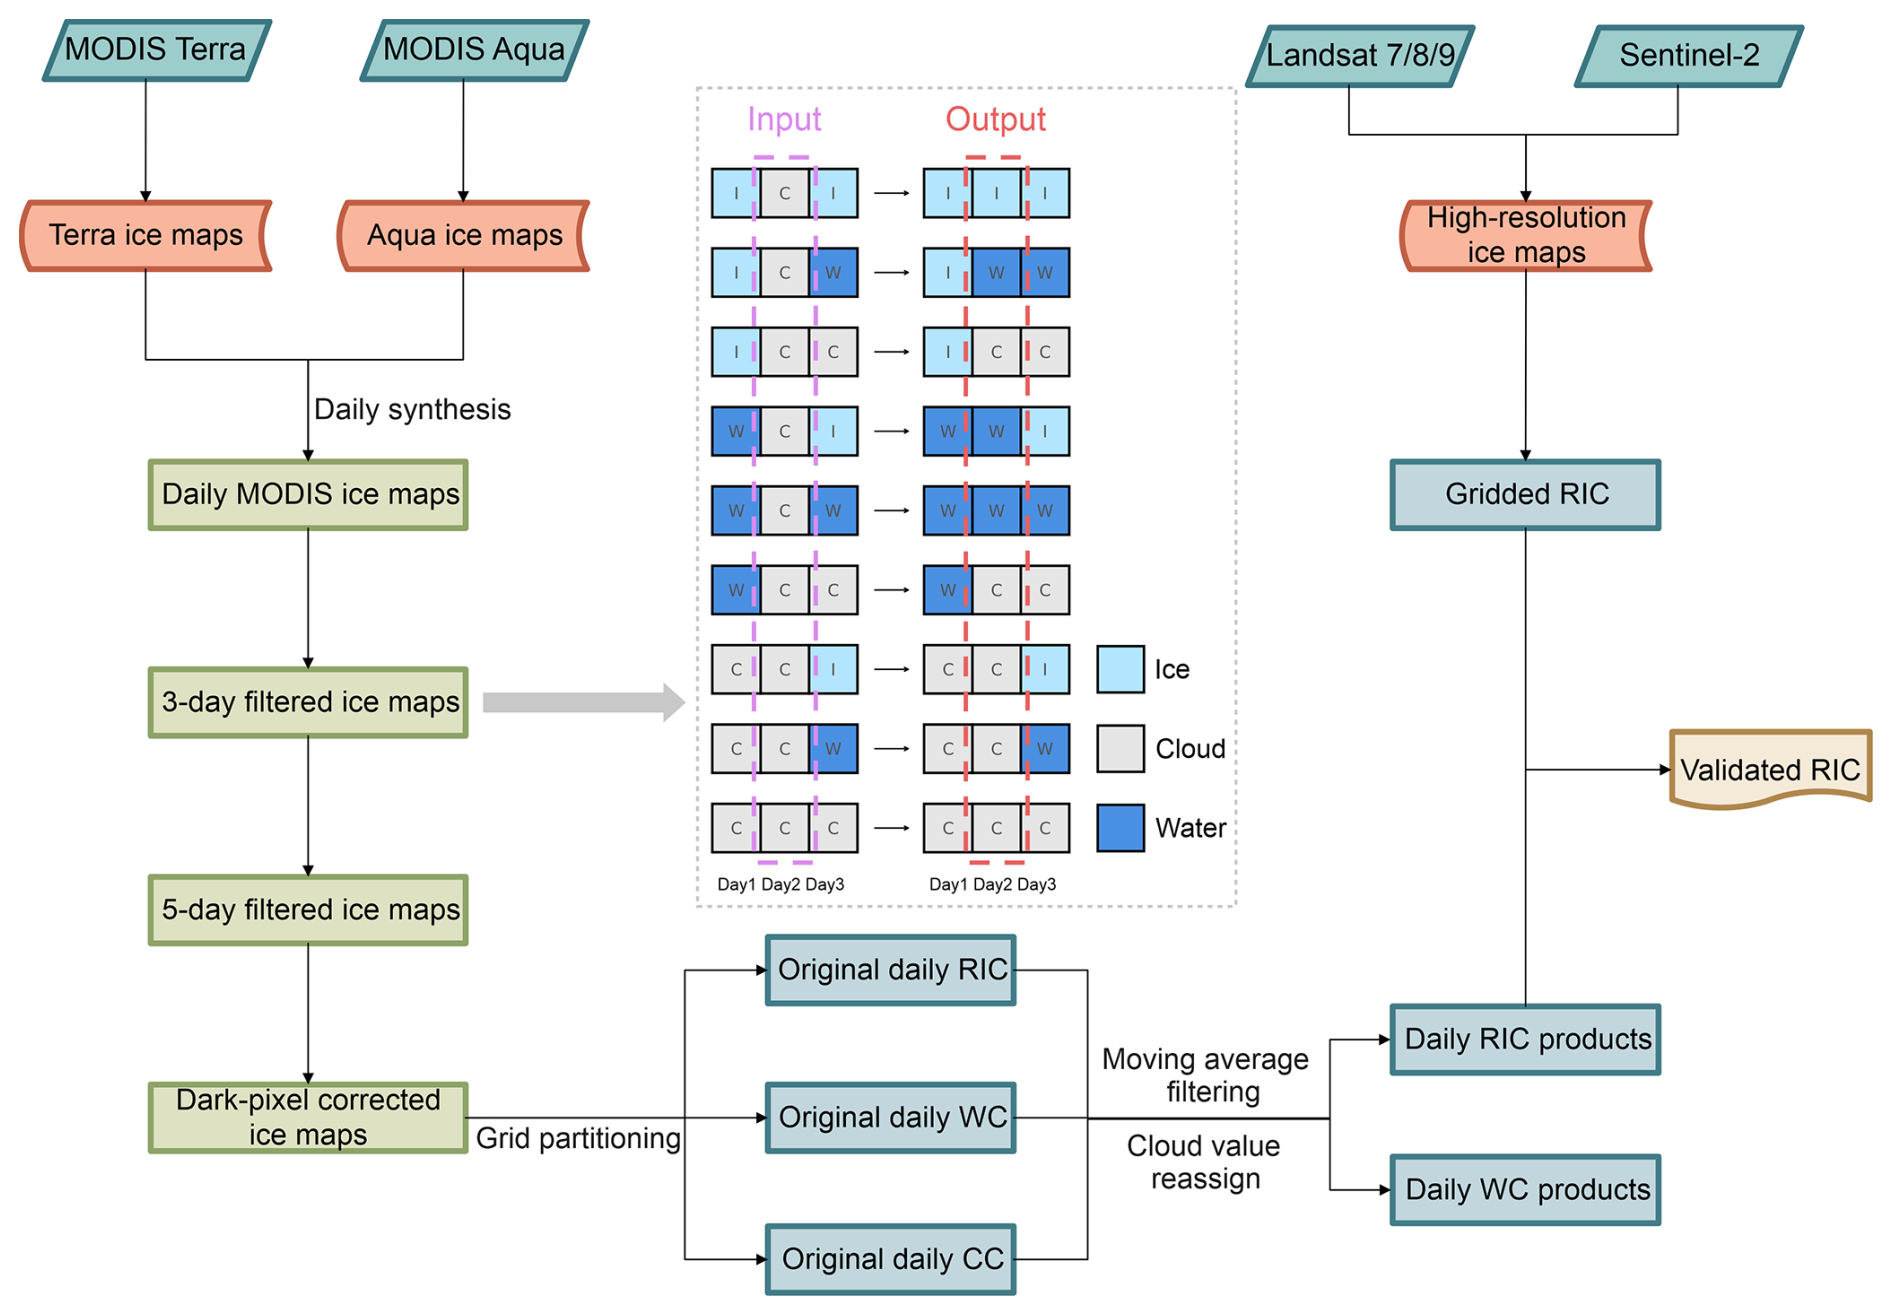
Figure 2Workflow for automated production of gridded river ice concentration (RIC) products from daily MODIS imagery. The dashed inset details the three-day sliding-window algorithm used to reclassify cloud-contaminated pixels.
For the 5 d window, which includes 45 possible classification combinations, a simplified decision rule was adopted. The central-day (third-day) cloud pixel was reclassified as river ice or water if at least two of the four surrounding days indicated the respective state, corresponding to 13 of the 45 possible scenarios in each case. In the remaining 19 cases, the pixel was retained as cloud (see detailed logic in Fig. S1 in the Supplement).
Building upon the dual-sensor synthesis, this temporally informed reclassification scheme reduced average winter-season cloud coverage by 30.8 % relative to the single-sensor Terra classification without temporal filtering (see Table S1 in the Supplement). Nonetheless, a fraction of pixels remained labelled as cloud, which is unavoidable under persistent cloud cover or spectrally ambiguous conditions.
3.2 River ice concentration and phenology estimation
3.2.1 River ice concentration estimation
Insufficient solar illumination at high latitudes during the polar night leads to an underestimation of river ice concentration (RIC) derived from optical imagery (Riggs et al., 2016). To mitigate this bias, we delineate a dark period from 15 November through 15 February and restrict subsequent corrections to latitudes greater than 60° N, refining the ∼62° N criterion suggested by Dietz et al. (2012). We then apply a rule-based temporal infill: for each pixel within the affected zone, the last ice detection during the pre-dark window (15 October–15 November) and the first ice detection during the post-dark window (15 February–15 March) are identified, and all intervening dates are classified as ice-covered. To preserve thermodynamic plausibility, any pixel experiencing a daily surface-air temperature above 0 °C is exempted from this fill-forward correction. This temporally constrained, temperature-screened procedure substantially reduces the systematic underestimation of RIC during wintertime.
Subsequently, we construct gridded river ice products at 3 km×3 km resolution by aggregating the pixel-level classification maps. Within each grid cell, we compute RIC, water concentration (WC), and cloud concentration (CC) as the fractional abundance of ice, open water and cloud pixels, respectively. Following Zhang et al. (2024), we apply a 10 d moving-average filter to each time series to suppress high-frequency noise. Residual cloud flags are then redistributed: if RIC (or WC) exceeds 80 % in a given cell, the corresponding CC is assimilated into the dominant category; otherwise, CC is apportioned between ice and water in proportion to their relative abundances. This post-processing yields a smooth, physically consistent time-series of RIC, suitable for long-term monitoring and model-data intercomparison.
3.2.2 River ice phenology estimation
Freeze-up (ice-on) and breakup (ice-off) are best understood not as instantaneous events but as the culmination of sequential processes. Conventionally, the freeze-up date (FUD) is taken as the first day on which the river reach is fully ice covered, whereas the breakup date (BUD) corresponds to the final disruption of ice before the onset of the summer open-water phase (Magnuson et al., 2000; Beltaos, 2013). More precisely, the freeze-up period spans from the inaugural appearance of ice to the establishment of a continuous cover. In contrast, the breakup period extends from the moment when bare ice is exposed (after snowmelt) through to the complete clearance of the river channel (Jeffries et al., 2012).
To extract these phenological markers from gridded RIC time series, we follow a threshold-based protocol grounded in previous remote-sensing efforts. Zhang et al. (2024) implemented a uniform RIC cutoff of 0.2 to delineate ice-on and ice-off transitions over the Yenisey River. Building on this foundation – and acknowledging the rapid, sometimes abrupt nature of ice ablation versus the more incremental process of freeze-up – we follow an asymmetric thresholding criterion consistent with Podkowa et al. (2023) to improve detection sensitivity and physical realism. Specifically, the BUD is assigned as the first date when RIC falls to ≤60 % of the climatological winter peak (over 1 December–1 February); by contrast, the FUD is defined as the first date on which RIC exceeds 30 % above the ice-free baseline. The interval between these two transition points then defines the river ice duration, yielding a continuous, thermodynamically consistent metric of seasonal ice persistence.
4.1 Accuracy assessment of MODIS-based RIC estimation
To evaluate the accuracy of MODIS-derived daily RIC, medium-resolution (30 m) and high-resolution (10 m) optical satellite imagery from Landsat 7/8/9 and Sentinel-2 was employed. A strict cloud cover threshold of 5 % was uniformly applied to ensure the mapped river ice pixels were exclusively from high-quality observations. River ice was delineated using a well-established threshold-based classification scheme originally developed for lake ice mapping (Sojka et al., 2023). Specifically, a fixed NDSI threshold of 0.4 was applied in combination with a blue-band reflectance threshold of 0.075, selected as the midpoint of the recommended range (0.033–0.120) to balance omission and commission errors in river ice detection.
Validated high-resolution ice maps derived from Landsat and Sentinel-2 were aggregated into 3 km grid cells to spatially match the resolution of the MODIS-based RIC product. The accuracy of the MODIS-derived RIC estimates was evaluated using pixel-wise accuracy and overall accuracy (OA) as core validation metrics. For each grid cell i (out of a total of m), Mi represents the RIC value estimated from MODIS, and LSi denotes the corresponding value from Landsat or Sentinel-2. Pixel-wise accuracy for each cell was calculated as:
The OA was then computed as the mean of all pixel-wise accuracies:
To account for variations in the operational periods of satellite missions and data availability, we validated the MODIS-derived RIC using reference imagery from different satellite platforms matched to specific hydrological years. Landsat 7 observations were employed for the 2006 hydrological year, while data from Landsat 8, Landsat 9, and Sentinel-2 were used for the 2021, 2024, and 2018 hydrological years, respectively.
Figure 3 summarizes the accuracy evaluation for six major Arctic rivers, comparing MODIS-derived RIC with higher-spatial-resolution reference estimates computed using the same referenced river mask and an identical 3 km grid partition. Overall, the MODIS-based RIC achieved a mean accuracy of 0.83, with a median of 0.87 and an interquartile range (IQR) of 0.73–0.94 across all basins. Among the six rivers, the Kolyma River exhibited the strongest agreement (overall accuracy=0.90; median=0.93) with a relatively compact distribution (IQR=0.86–0.97), whereas the Yenisey River – whose upstream network includes dense, lower-latitude tributaries – showed the lowest agreement (overall accuracy=0.77; median=0.85) and comparatively larger variability (IQR=0.67–0.95).
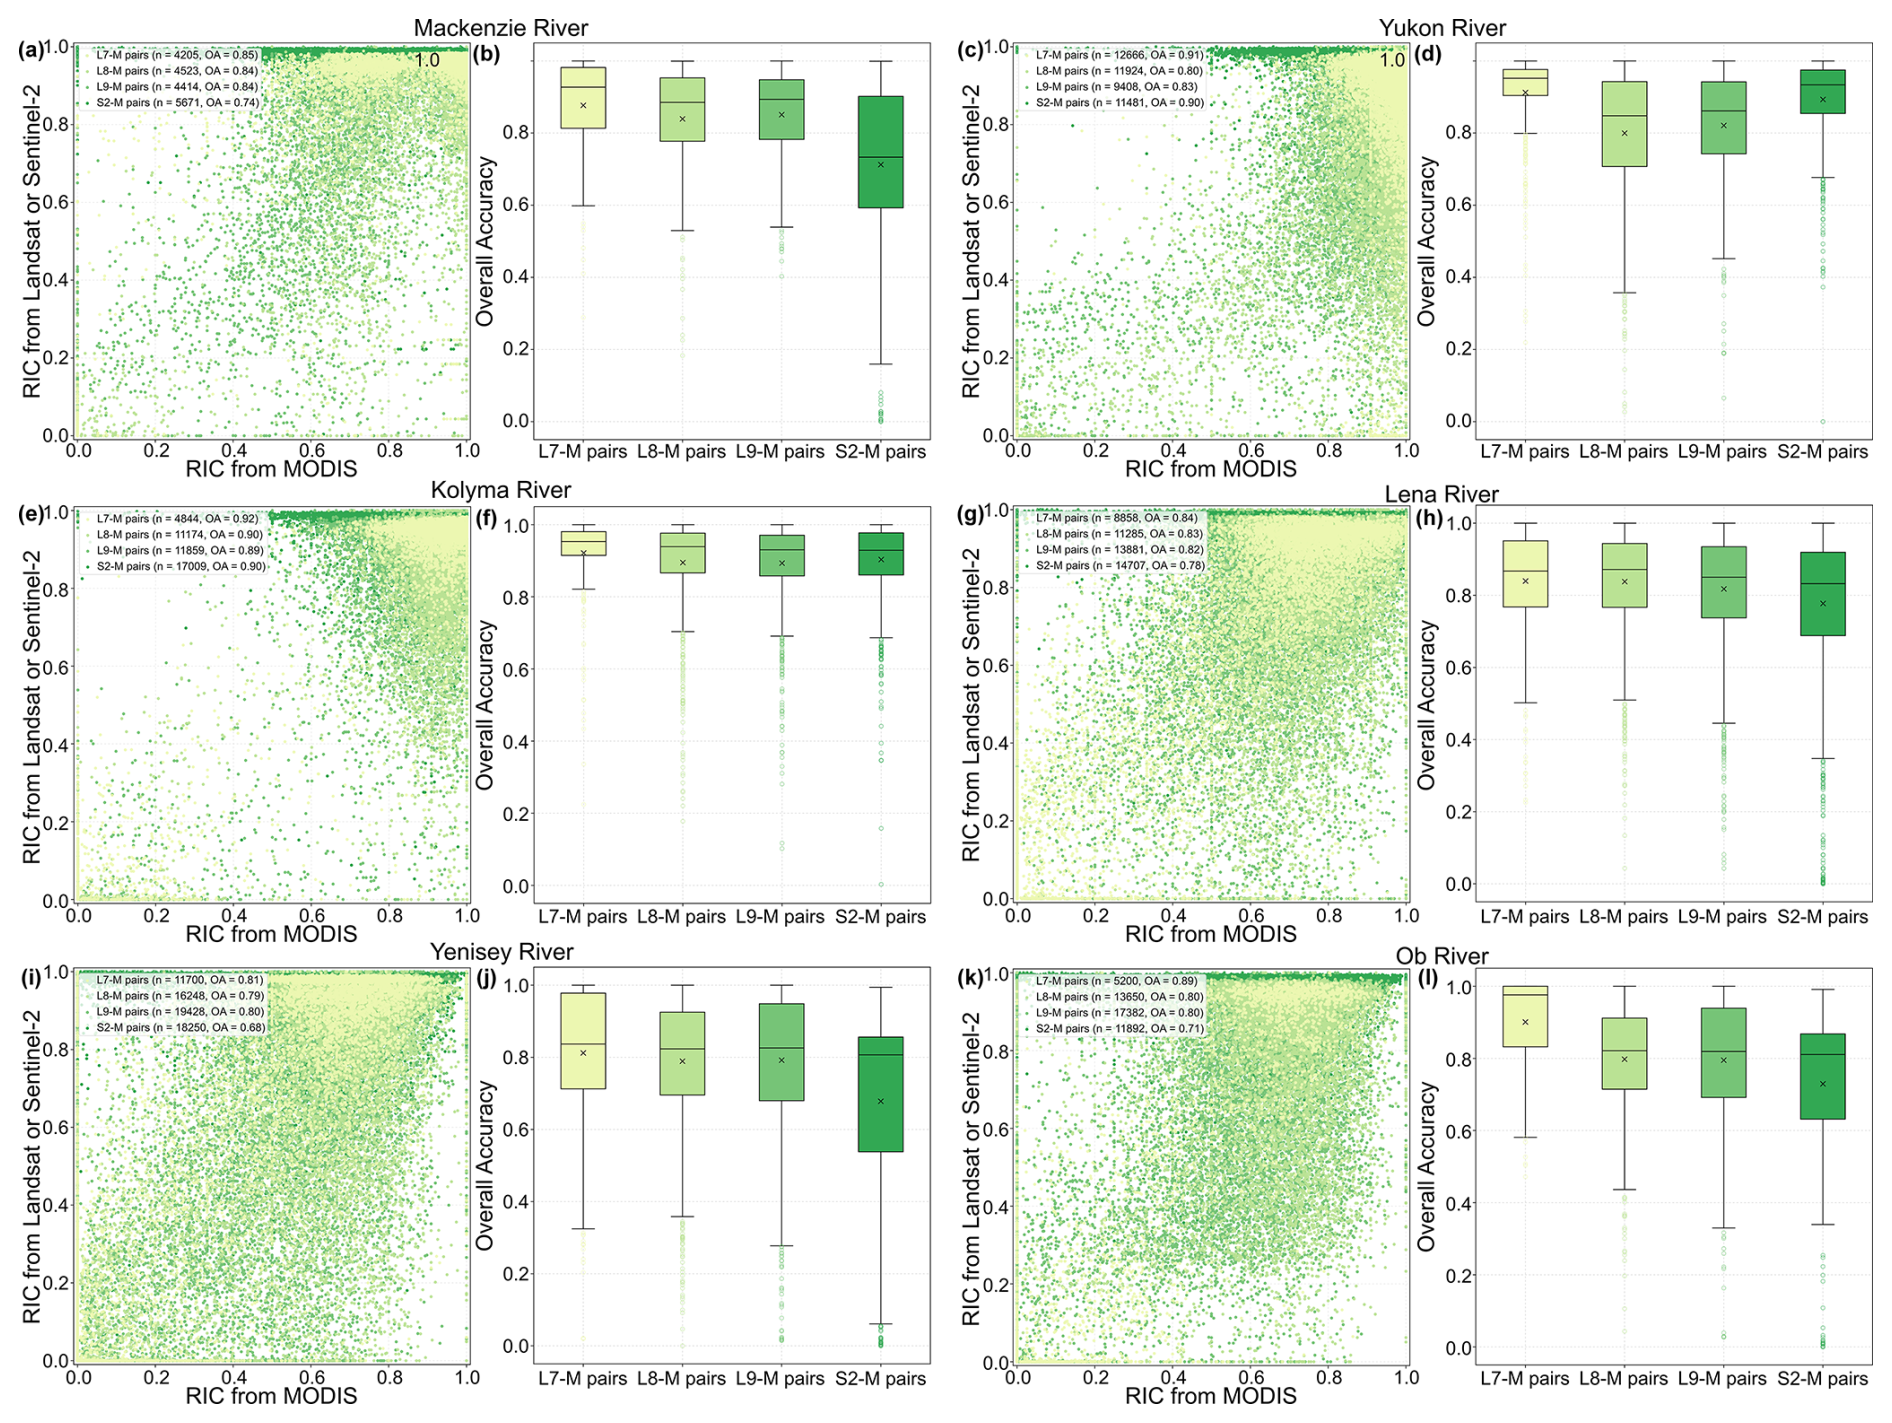
Figure 3Accuracy assessment of MODIS-derived RIC (river ice concentration) using high-resolution reference data from Landsat and Sentinel-2 across six major Arctic rivers. Left panels show pixel-wise scatterplots comparing MODIS-based RIC with higher-resolution estimates from Landsat 7, Landsat 8, Landsat 9, and Sentinel-2. Note the four matched point categories were plotted in a fixed layer order to improve visibility, with S2-M shown in the bottom layer. Right panels present the corresponding validation accuracies for each sensor pairing (L7-M, L8-M, L9-M, and S2-M). In the boxplots, the central line indicates the median, and the cross symbol denotes the mean value. Subplots (a) and (b) correspond to the Mackenzie River, (c) and (d) to the Yukon River, (e) and (f) to the Kolyma River, (g) and (h) to the Lena River, (i) and (j) to the Yenisey River, and (k) and (l) to the Ob River.
Across the satellite platforms used for validation, Landsat 7 showed the highest consistency with MODIS, with a mean matching accuracy of 0.87 and generally narrow interquartile ranges. This was followed by Landsat 8 and Landsat 9, both of which yielded mean accuracies of 0.83. Sentinel-2, despite offering the finest spatial resolution, produced a slightly lower mean accuracy of 0.79, with greater variability in several basins compared with the Landsat-based comparisons. The comparatively higher agreement for Landsat 7 likely reflects, at least in part, its smaller number of matched samples relative to the other sensor pairings, and thus a lower influence from more challenging cases. By contrast, the lower accuracy of Sentinel-2 likely arises from its enhanced ability to detect ice within narrow river segments, where its higher spatial resolution captures a greater number of ice-covered pixels. MODIS, with its coarser 500 m resolution, is more susceptible to mixed-pixel effects in such settings, which can lead to systematic differences in ice extent and consequently biased RIC values.
4.2 River ice phenology evaluation against previous records
River ice phenology derived from the daily MODIS-based RIC estimates was evaluated against long-term in situ observations compiled by Shiklomanov and Lammers (2014) and Shiklomanov (2016), which document historical records of ice freeze-up (beginning of continuous ice cover) and breakup (end of all ice conditions on the river) dates up to the year 2012. To further assess the spatial accuracy of the satellite-derived phenological signals, we also compared our results with a recently developed river-segment-based phenology dataset derived from Landsat imagery (Wang and Feng, 2024). This dataset offers an independent, high-resolution benchmark for evaluating pixel-wise estimates of ice-on and ice-off timing extracted from the MODIS time series.
Quantitative validation was conducted using standard performance metrics, including mean absolute error (MAE), root mean square error (RMSE), and Pearson's correlation coefficient (r), to assess the consistency and reliability of MODIS-derived phenology in comparison to both ground-based and satellite-based reference datasets. These metrics were calculated as follows:
where n is the total number of grid cells, Mj denotes the MODIS-derived ice-on or ice-off date for grid cell j, and Rj represents the corresponding phenological date from the reference dataset.
Figure 4 compares MODIS-derived river ice phenology (freeze-up and breakup dates) with independent references from (a) in situ observations and (b) Landsat-based river-section records. Against Landsat-based phenology datasets, the MAEs were 10.5 d for FUD and 16.0 d for BUD. Against in situ records, FUD performance was similar (MAE=10.8 d), whereas BUD discrepancies were smaller (MAE=11.4 d) and decreased further to 8.4 d when benchmarked to the onset of ice drift (see Fig. S2), implying that our BUD metric is more sensitive to drift initiation. The comparatively larger differences relative to Landsat-based phenology most likely arise from event-definition inconsistencies – specifically the RIC thresholds used to delineate ice-on/off – rather than from errors in the RIC itself.
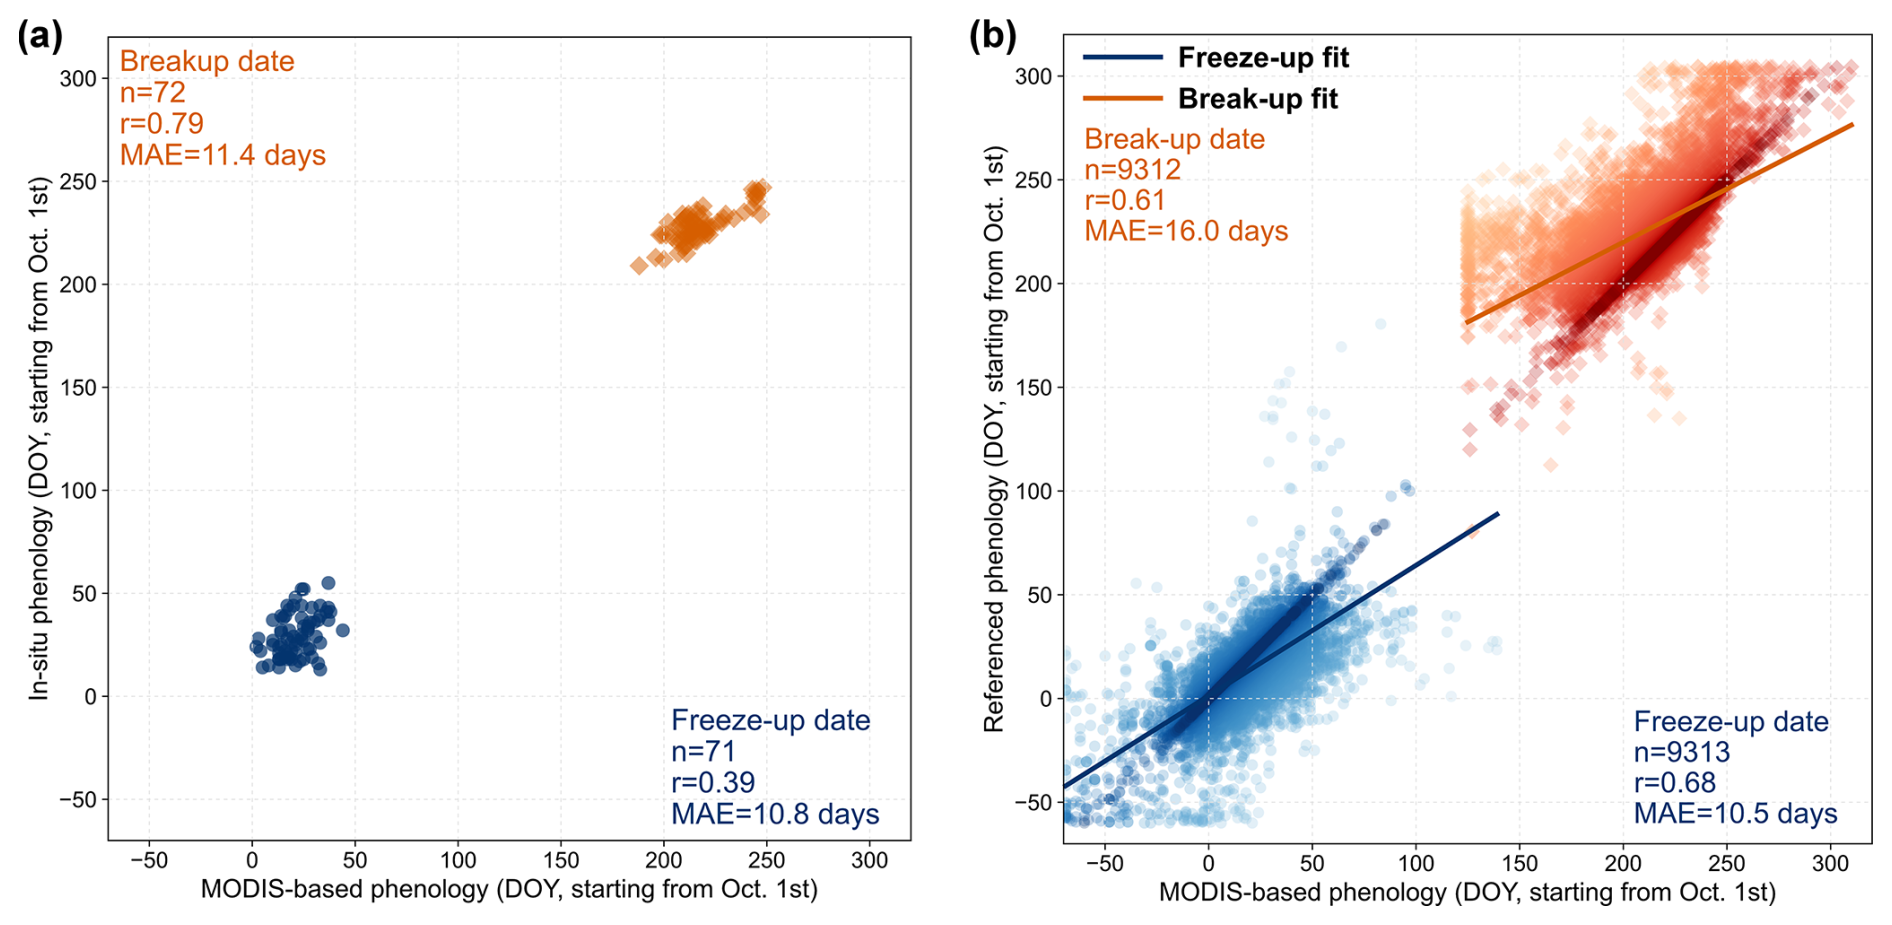
Figure 4Validation of MODIS-derived river-ice phenology (freeze-up and breakup dates). (a) Agreement with long-term in situ records. (b) Comparison of pixel-level MODIS estimates with a Landsat-derived, river-segment–based reference dataset.
Gauge-based river ice phenology records for the Ob, Lena, and Yenisey can be modulated by local thermodynamic and dynamic processes; therefore, they are not strictly comparable to our satellite criterion, which defines freeze-up as the first day that pixel-level RIC exceeds 30 %. For example, downstream reaches that have already melted may be reported as ice-covered at a gauge due to the advection of upstream ice floes (Zhang et al., 2024). Discrepancies with the phenology dataset of Wang and Feng (2024) likely stem from their river-section aggregation strategy, which groups observations by the “segmentID” field of the GRWL vector product. Variations in river section length may result in a single section intersecting multiple RIC pixels, while inconsistencies in coordinate reference systems could further introduce scale-related and spatial aggregation biases.
5.1 Spatiotemporal variations of RIC
To characterize the spatiotemporal behaviour of RIC, we analysed daily time series over 24 hydrological years (2001–2024) for six major Arctic rivers (Fig. 5), together with spatial distributions of mean winter RIC (Fig. 6) and basin-scale interannual anomalies (Figs. S3–S8). The time series exhibit a pronounced seasonal cycle tightly out of phase with SAT: as SAT declines below 0 °C, basin-mean RIC rises rapidly to a stable winter plateau, followed by an equally rapid spring decline. This anti-phased relationship is strong across all basins (mean Pearson ). Although the RIC–SAT relationship shows some sigmoidal curvature, reflecting the bounded nature of RIC and saturation near fully ice-covered and open-water conditions, the central transition range is still well approximated by a linear fit, with slopes indicating a decrease of approximately 2–3 percentage points in RIC per 1 °C increase in SAT. An additional logistic fit confirms the same overall interpretation while better capturing the curvature at the warm and cold extremes. By contrast, correlations with the net solar radiation and the total precipitation show consistent monotonic but weaker negative associations (basin-mean Pearson and −0.43, and Spearman and −0.45, respectively; Figs. S9 and S10). High-latitude basins such as the Yukon and Kolyma consistently attain near-complete winter coverage, whereas lower-latitude tributaries show longer shoulder seasons and more frequent mid-winter interruptions.
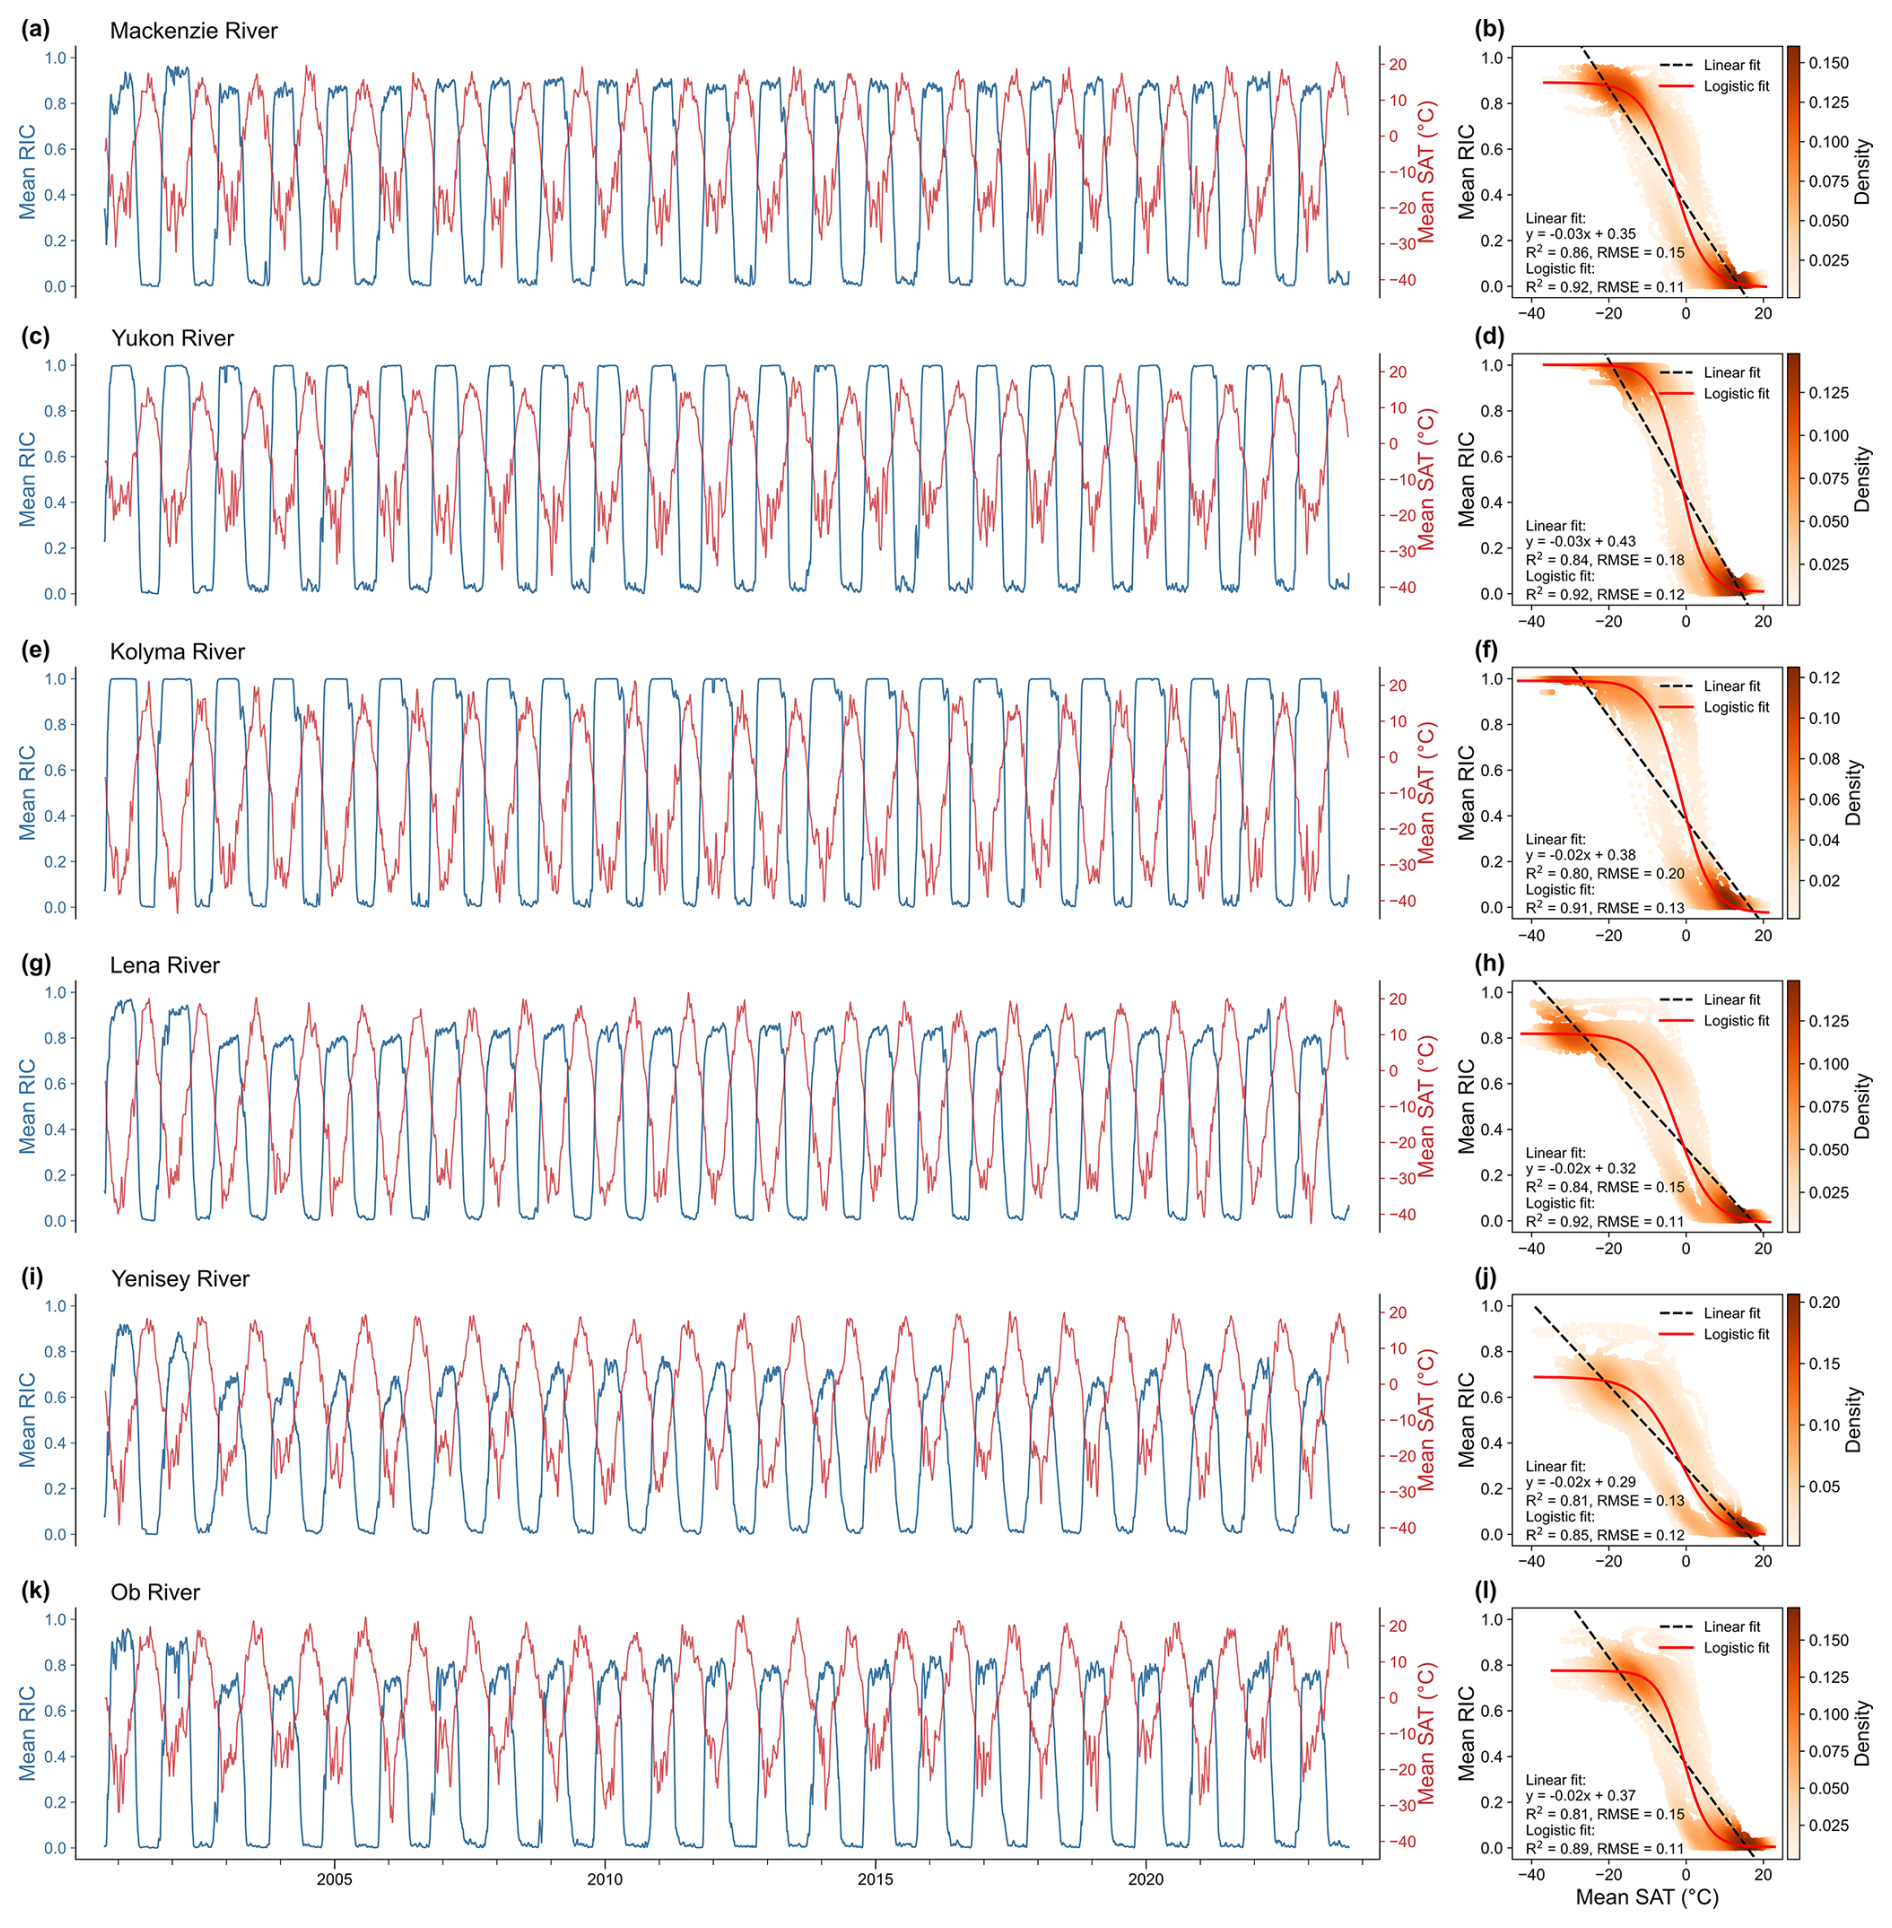
Figure 5Long-term variations and statistical correlations between MODIS-derived RIC (river ice concentration) and SAT (surface air temperature) across six major Arctic rivers. Panels show (left) time series of mean daily RIC and ERA5-Land SAT, and (right) their corresponding correlations for each river. A 10 d moving average was applied to the SAT time series to match the temporal smoothing applied during the generation of gridded RIC products. Subplots (a) and (b) correspond to the Mackenzie River, (c) and (d) to the Yukon River, (e) and (f) to the Kolyma River, (g) and (h) to the Lena River, (i) and (j) to the Yenisey River, and (k) and (l) to the Ob River.
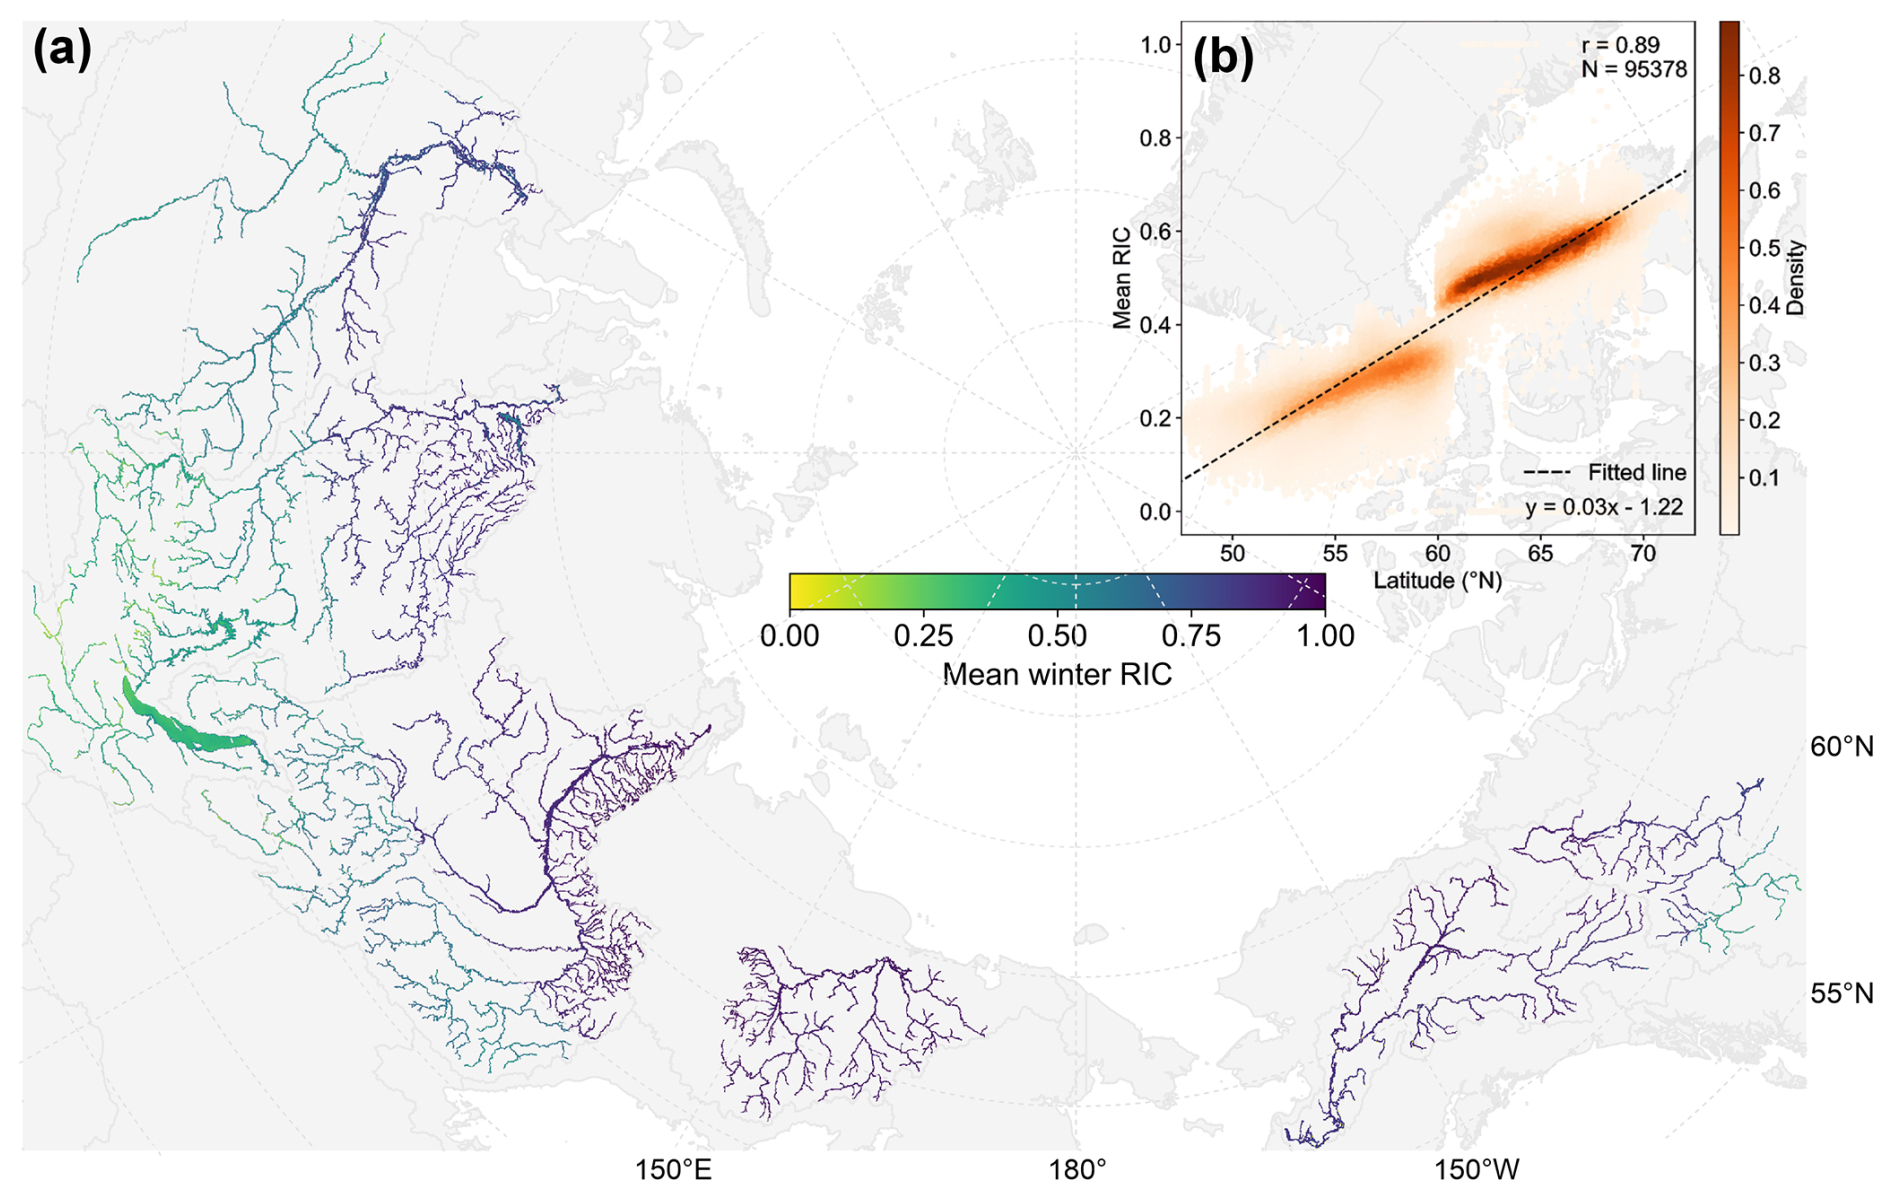
Figure 6Spatial pattern and latitudinal dependence of mean winter RIC (river ice concentration) across six major Arctic rivers. (a) Spatial distribution of mean winter RIC across six major Arctic rivers, averaged over 1 October–30 April. (b) Latitudinal correlation between winter RIC and geographic location, where each point represents the 24 year mean RIC within 0.1° latitude bins, plotted at the bin-center latitude. The background map is from HydroBASINS dataset (Lehner and Grill, 2013).
Mean winter RIC (1 October–30 April) increases systematically with latitude (Fig. 6): a pooled linear fit indicates ∼3 percentage-point increase in absolute RIC per degree north, broadly consistent with thermal control on winter ice formation. Across the domain, 4.54 % of river pixels exhibit RIC>0.95 % and 55.96 % exceed 0.70, indicating that more than half of the mapped network sustains largely continuous winter ice cover. Within basins, spatial heterogeneity follows the hydro-geomorphic template and the latitudinal gradient: winter RIC generally increases from low-latitude headwaters to high-latitude estuaries, with downstream trunk segments near the Arctic coast maintaining the highest values, whereas upper-basin, broad or multi-threaded reaches tend to retain lower winter RIC.
Interannual anomalies, defined as the winter-mean RIC for a given hydrological year minus the 24 year climatological winter mean (2001–2024) computed at each pixel, were aggregated at the basin scale. These anomalies differ across rivers – reflecting contrasts in latitude, continentality, and flow regime – but display a common tendency toward negative departures in 16 of 24 hydrological years. Particularly widespread reductions occur in 2003–2006, 2019, and 2024, with 2004 standing out for a basin-wide decline of 4.20 % relative to the multi-year mean. In contrast, strong positive anomalies occur in 2001, 2002, and 2013, with 2001 exhibiting an exceptional increase of 11.14 %, potentially reflecting short-term natural climate variability superimposed on the long-term warming trend Taken together, these results show that (i) winter RIC is strongly constrained by thermal forcing at daily to seasonal scales, (ii) its spatial distribution follows a robust latitudinal imprint modulated by river morphology, and (iii) interannual variability is coherent across basins in several notable winters, consistent with large-scale atmospheric forcing.
5.2 Patterns and trends of river ice phenology
We map RIC-based phenology – long-term mean FUD, BUD, and ice duration – to summarize spatial patterns (Figs. 7a, 8a, and 9a). Basin averages across the six rivers are 20 October for FUD (DOY 20.0 referenced to 1 October), 22 April for BUD (DOY 204.1), and 185.0 d for ice duration. For the two North American rivers, the corresponding phenological indicators are 13 October, 30 April, and 200.1 d. By contrast, the four Siberian rivers freeze ∼6 d later and break up ∼5 d earlier on average, yielding a shorter ice season of 189.0 d (Table S2). At the intra-basin scale, high-latitude headwaters or tributaries typically freeze earlier than co-latitudinal main-stem reaches and break up later, extending ice duration; this contrast is especially pronounced in the Lena, where tributaries freeze 18 d earlier and thaw 9 d later than the main channel – a net 27 d increase in ice duration. Phenological timing covaries strongly with latitude at the river-section scale: Pearson r is −0.73 for FUD, +0.84 for BUD, and +0.87 for ice duration (Figs. 7b, 8b, and 9b). Linear regressions indicate that each degree of latitude northward is associated with an advance of FUD by 3.1 d, a delay of BUD by 5.1 d, and a lengthening of ice duration by 8.2 d. Our analysis further indicates that seasonal river ice duration contracts by 6.4 d for each 1 °C increase in mean SAT – slightly exceeding the global average reduction of 6.1 d per degree reported by Yang et al. (2020) and underscoring the amplified warming characteristic of the high-latitude pan-Arctic region.
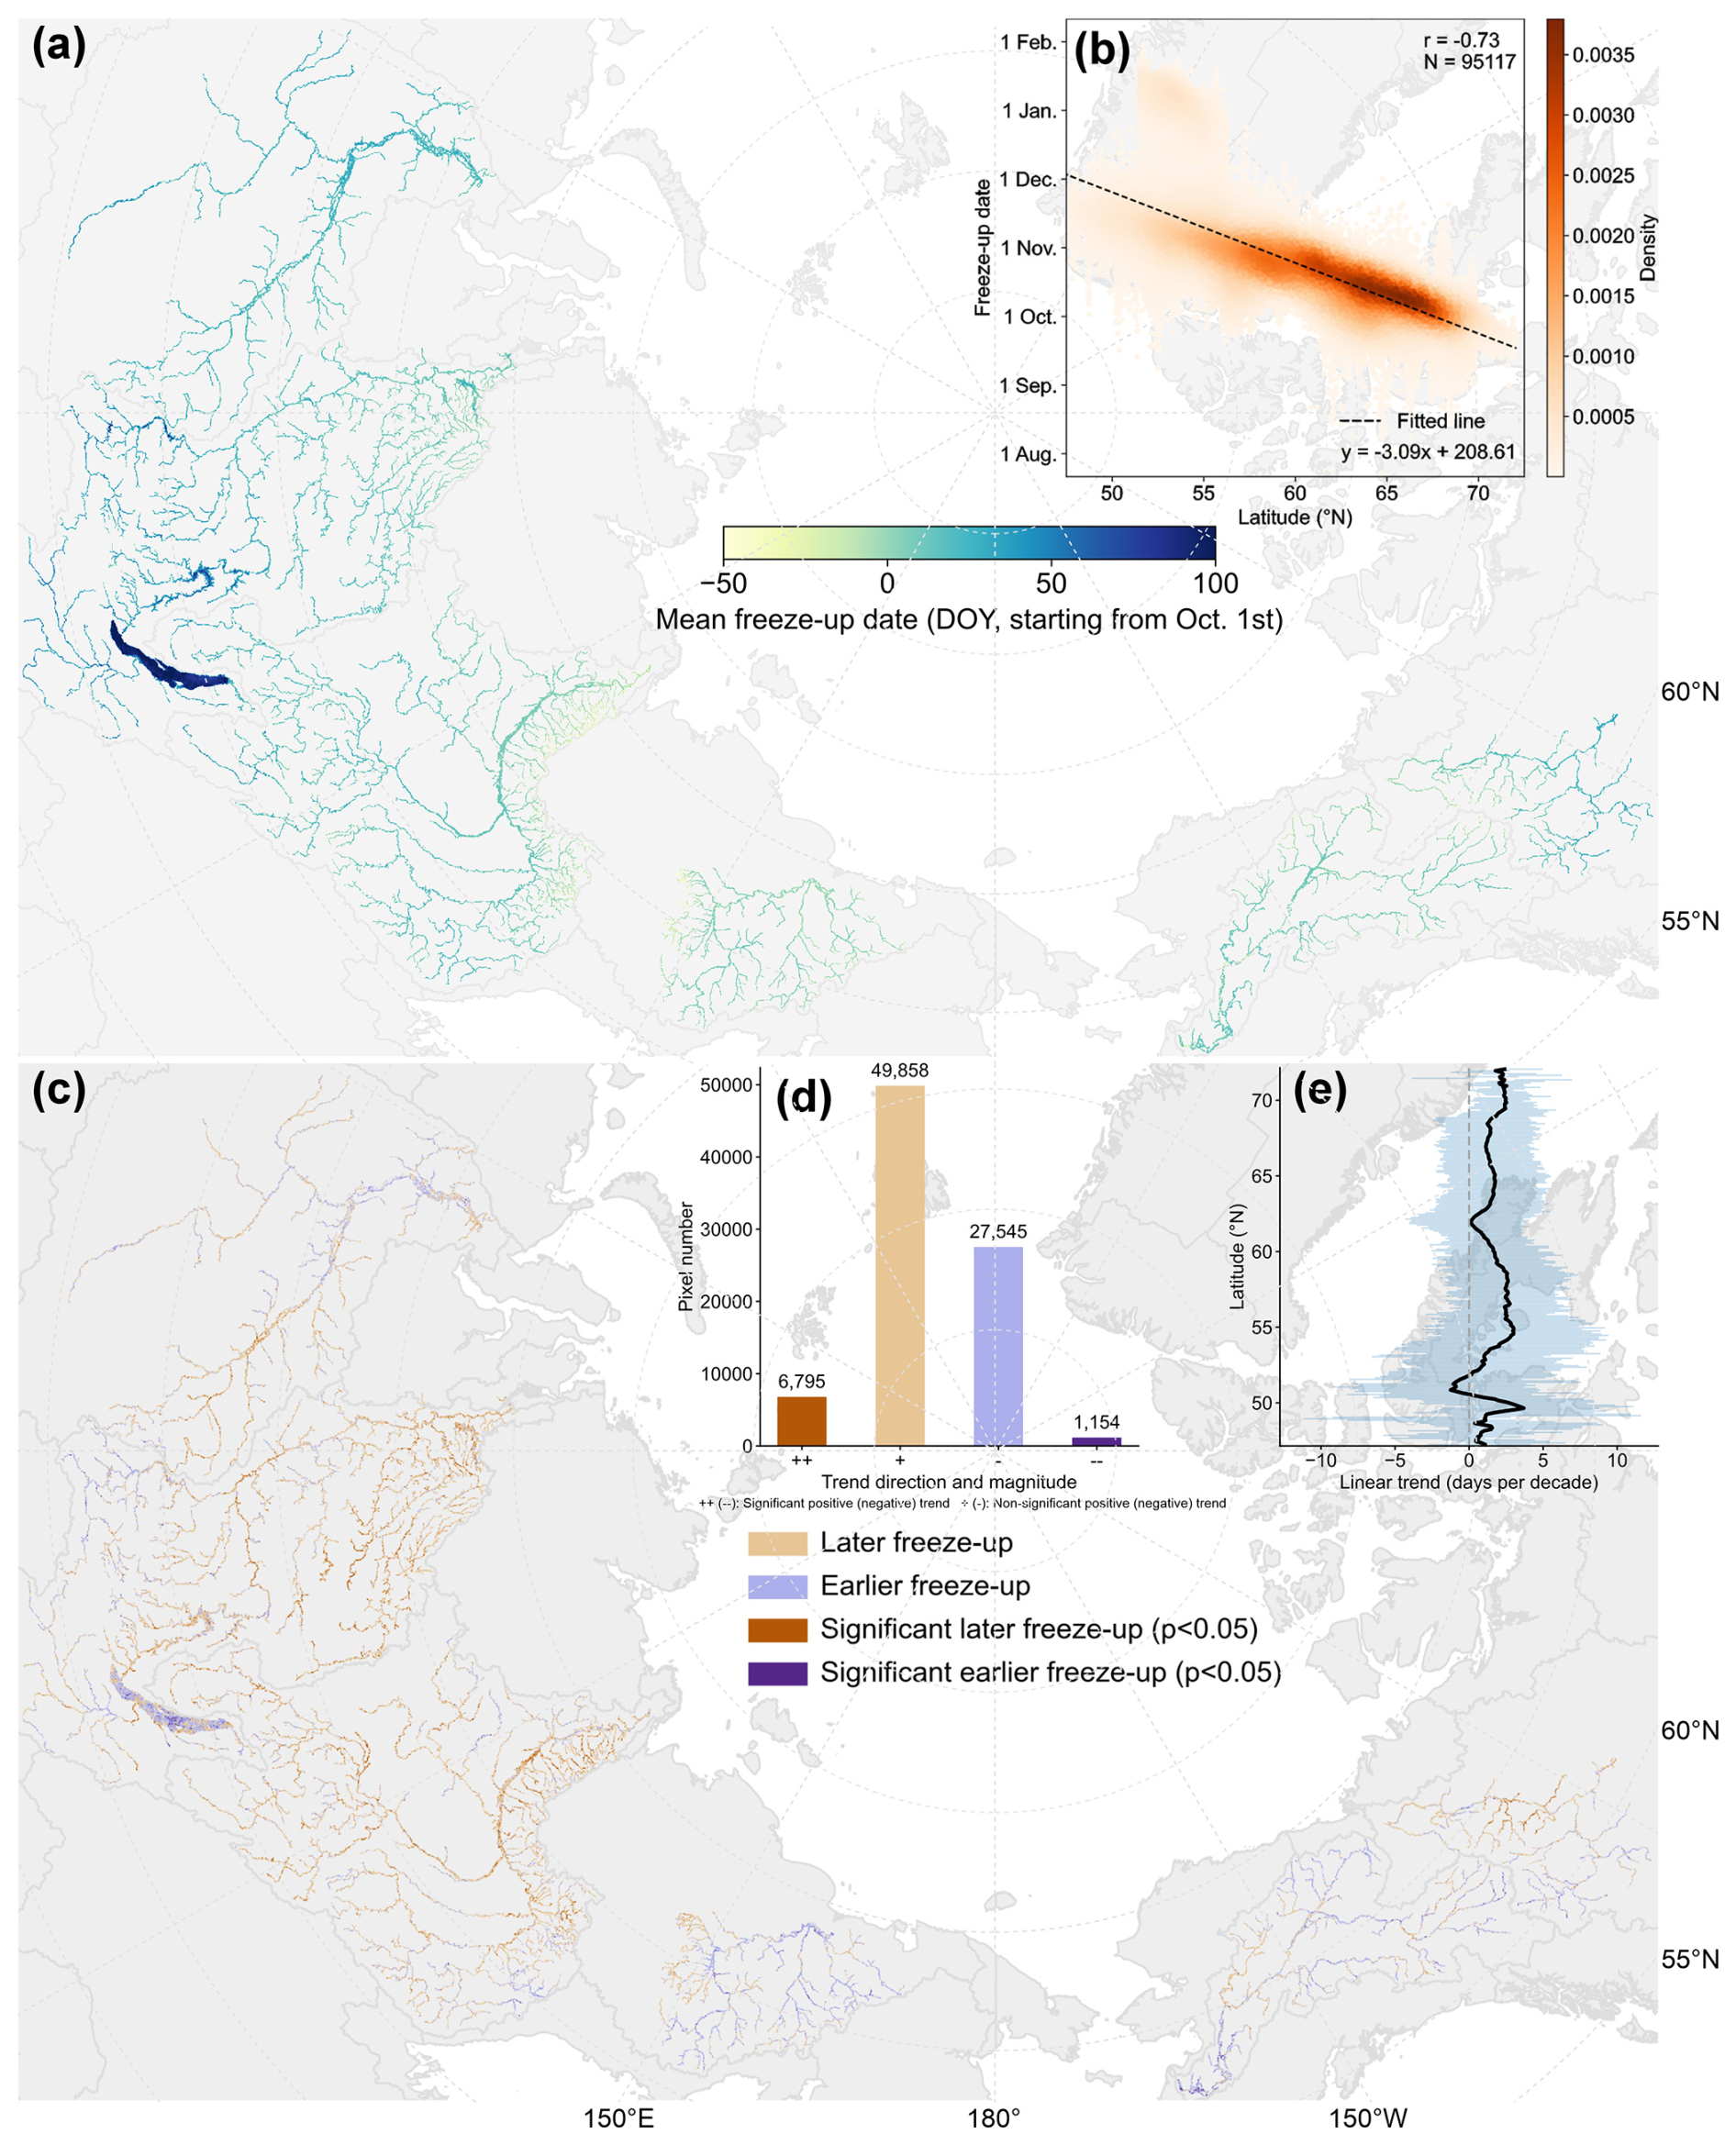
Figure 7Spatial patterns and temporal trends in river ice freeze-up date. (a) Spatial distribution of mean freeze-up date over the 24 year record. (b) Latitudinal relationship between freeze-up timing and geographic latitude. (c) Trends in freeze-up date estimated with the Theil–Sen slope; significance assessed with the Mann–Kendall test (significant pixels, p<0.05, darker tones). (d) Frequency distribution of trend directions and significance. (e) Latitude-wise distribution of mean linear trends in freeze-up timing. The background map is from HydroBASINS dataset (Lehner and Grill, 2013).
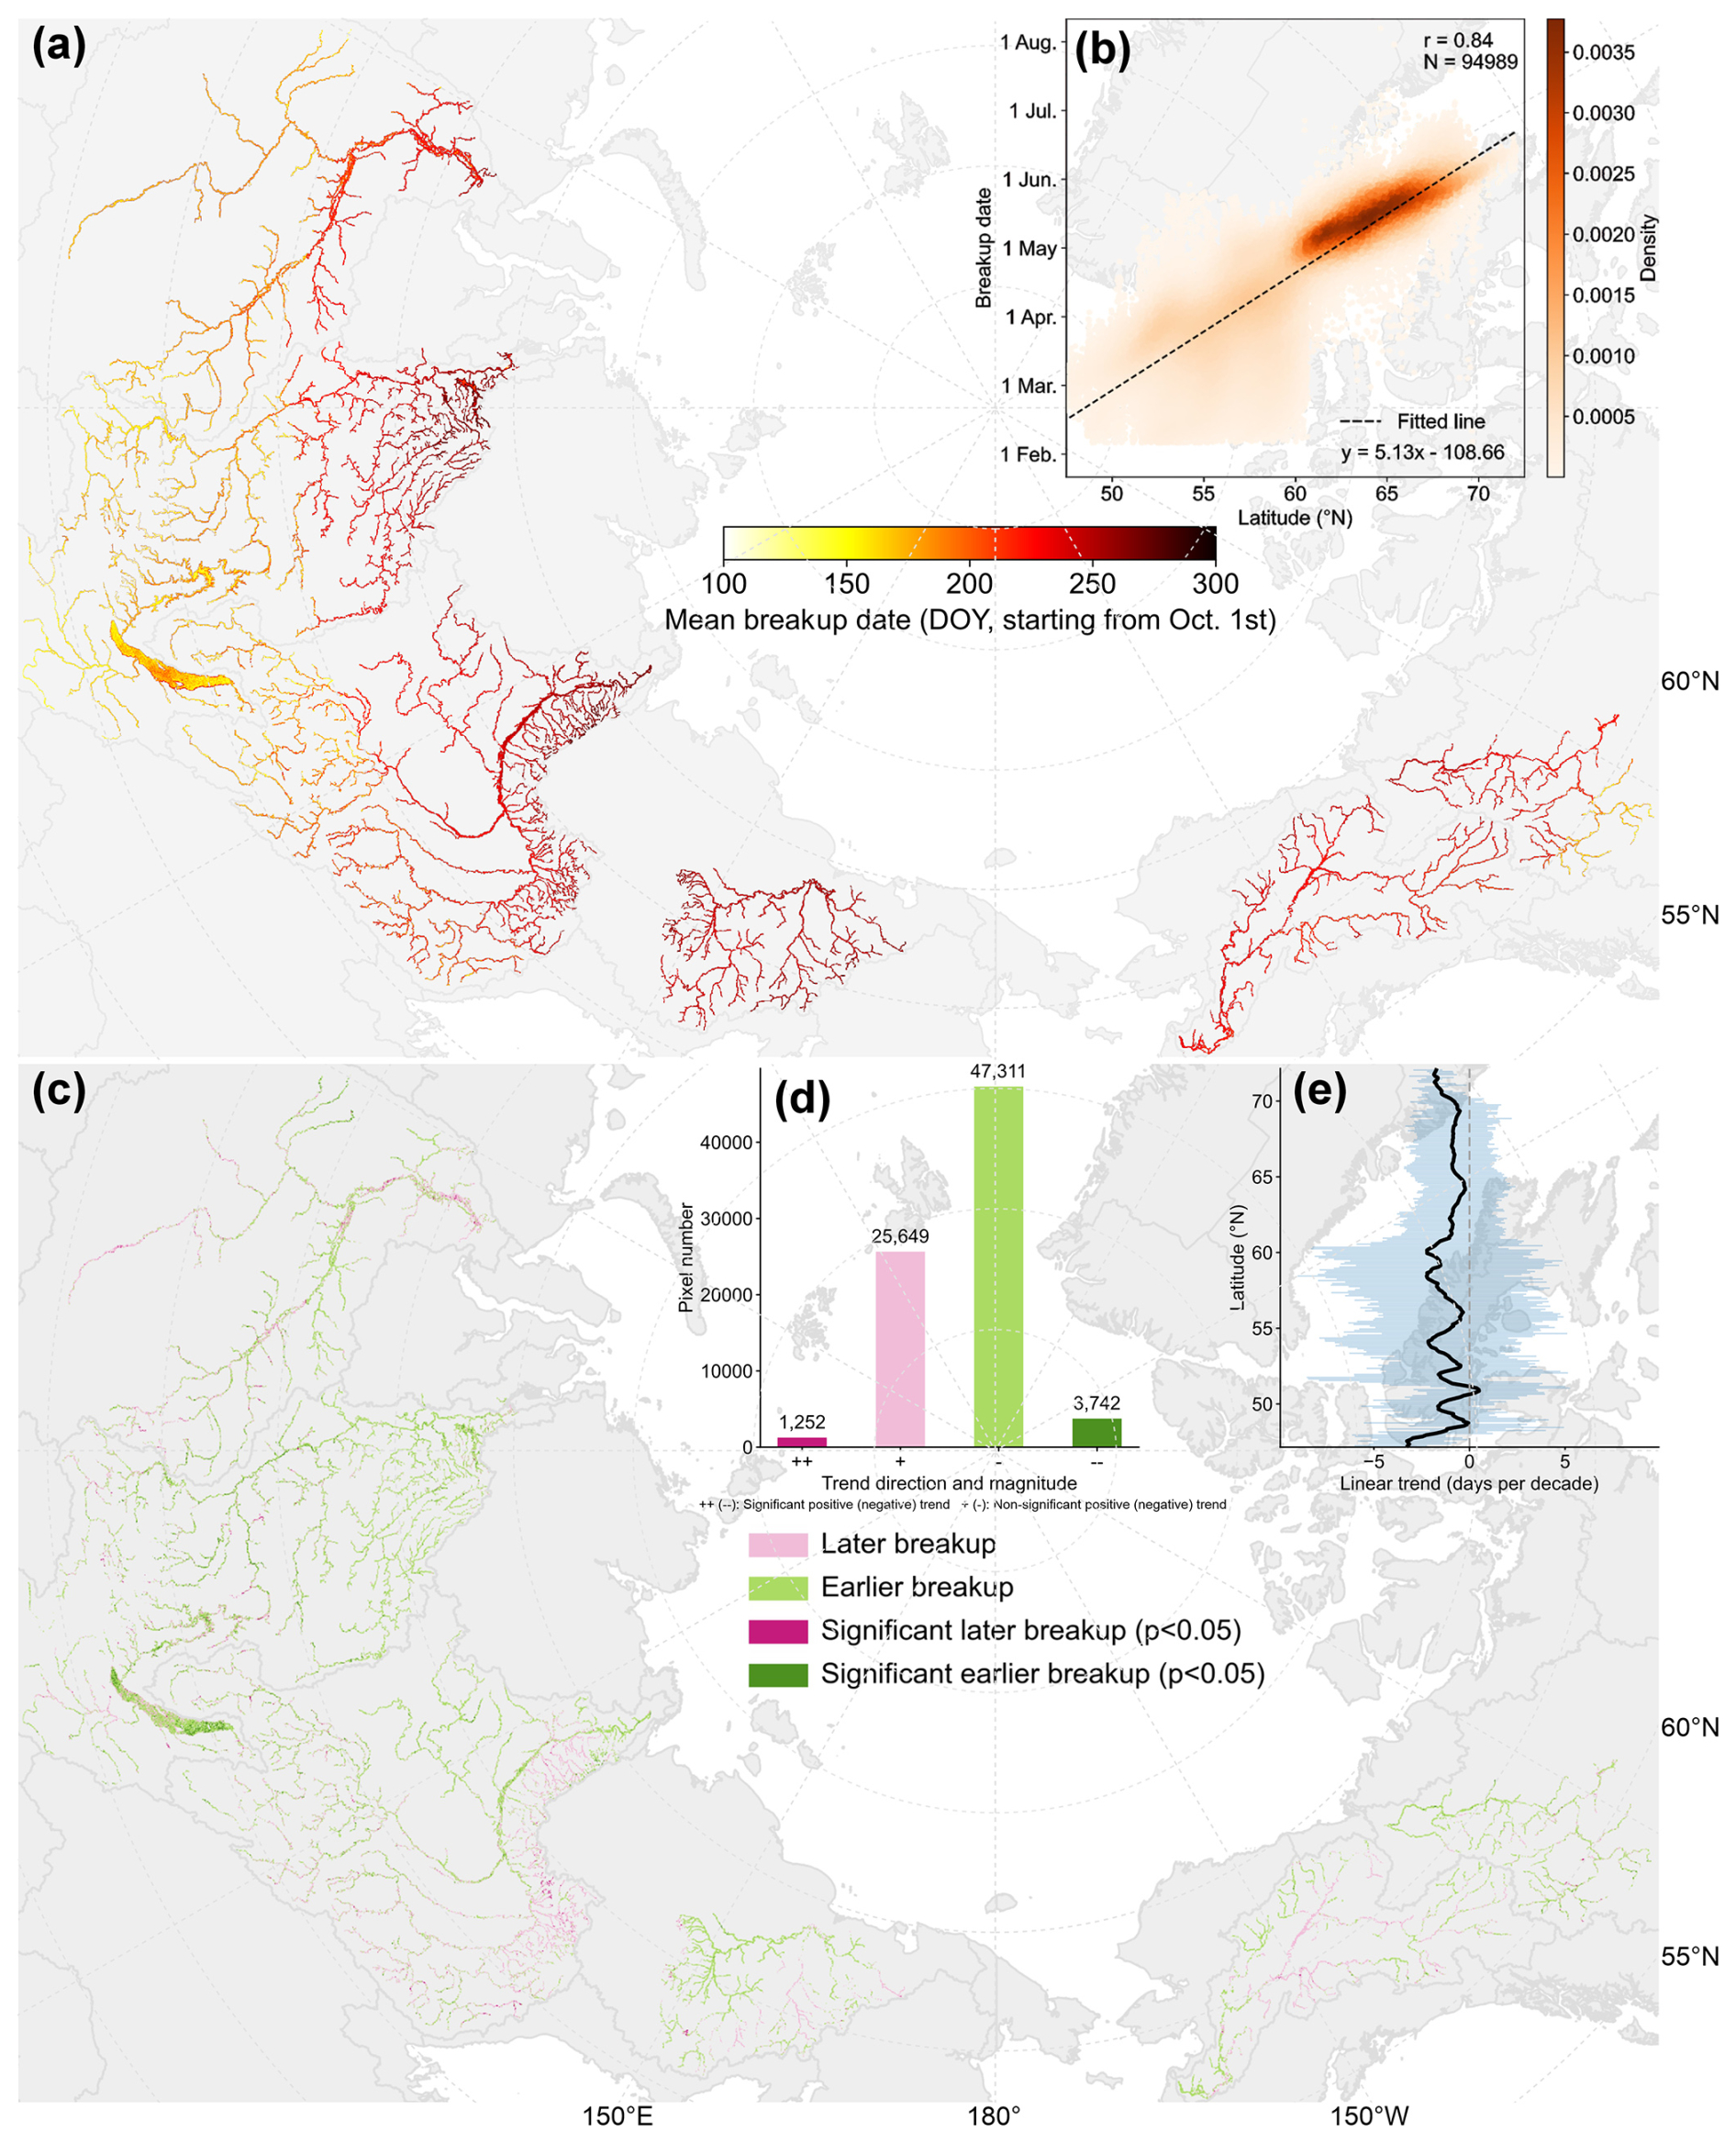
Figure 8Spatial patterns and temporal trends in river ice breakup date. (a) Spatial distribution of mean breakup date over the 24 year record. (b) Latitudinal relationship between breakup timing and geographic latitude. (c) Trends in breakup date estimated with the Theil–Sen slope; significance assessed with the Mann–Kendall test (significant pixels, p<0.05, darker tones). (d) Frequency distribution of trend directions and significance. (e) Latitude-wise distribution of mean linear trends in breakup timing. The background map is from HydroBASINS dataset (Lehner and Grill, 2013).
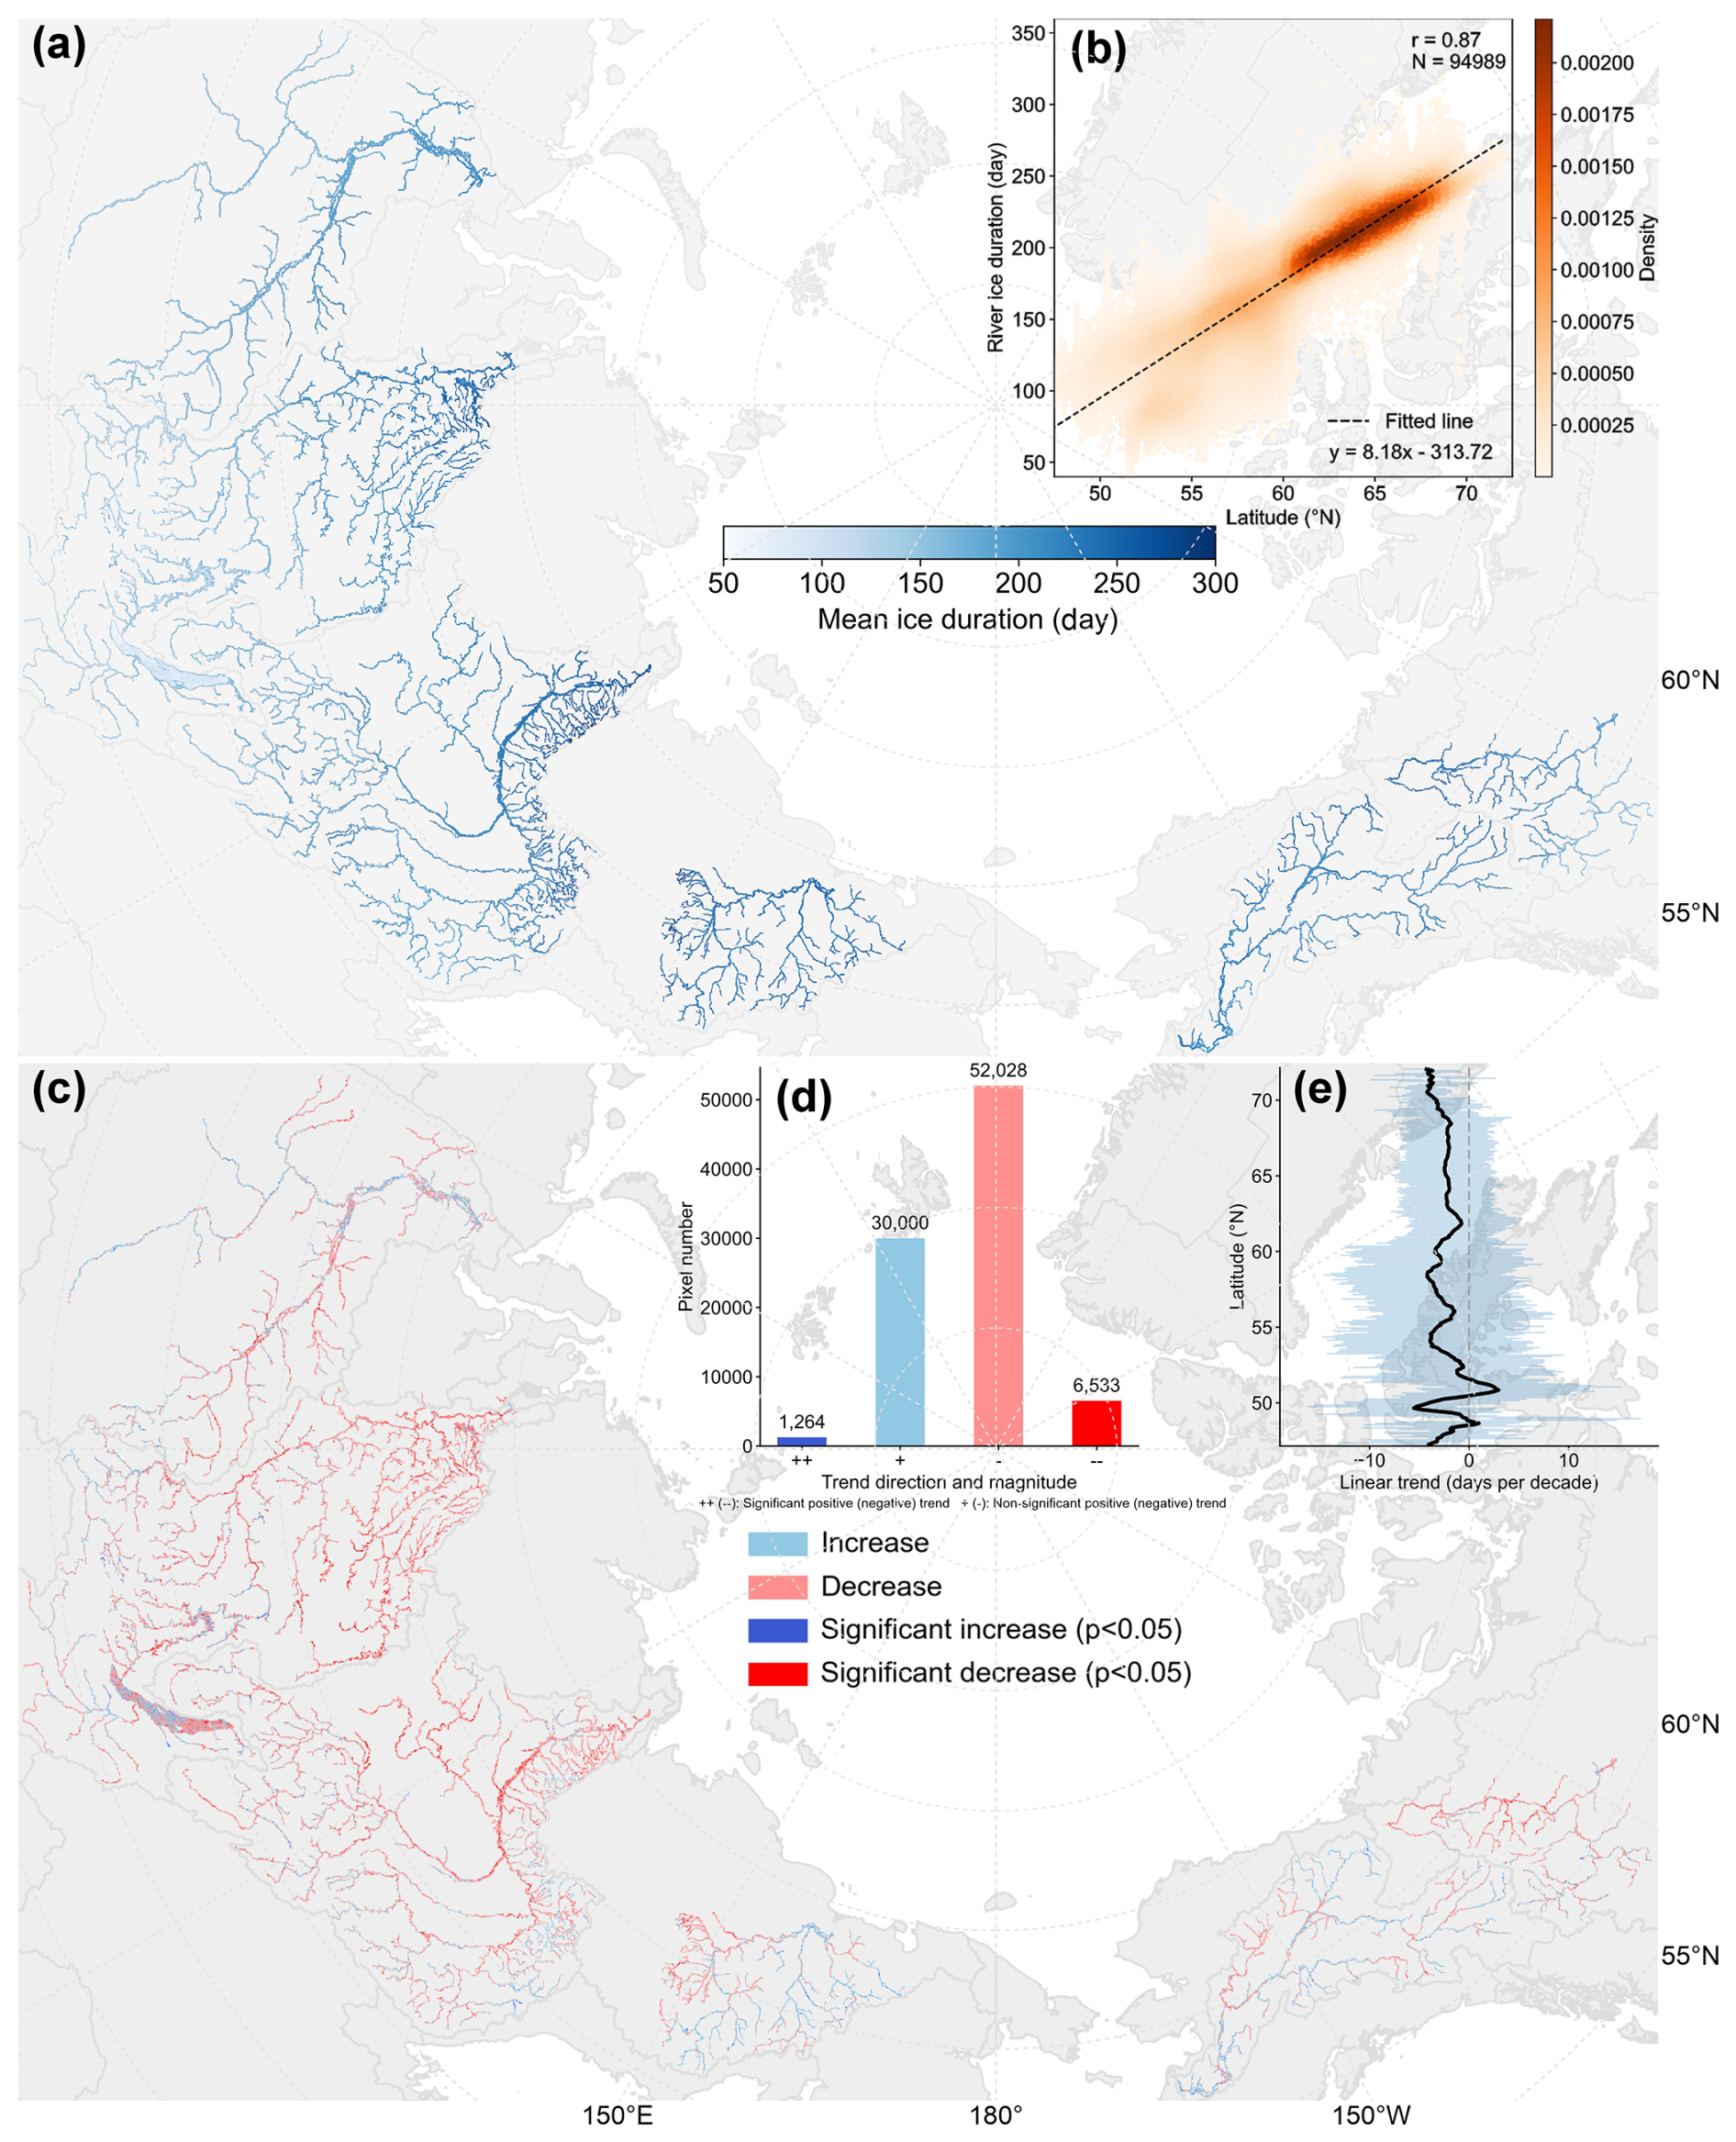
Figure 9Spatial patterns and temporal trends in river ice duration. (a) Spatial distribution of mean ice duration over the 24 year record. (b) Latitudinal relationship between ice duration and geographic latitude. (c) Trends in ice duration estimated with the Theil–Sen slope; significance assessed with the Mann–Kendall test (significant pixels, p<0.05, highlighted). (d) Frequency distribution of trend directions and significance. (e) Latitude-wise distribution of mean linear trends in ice duration. The background map is from HydroBASINS dataset (Lehner and Grill, 2013).
Long-term trends (hydrological year 2001–2024) were assessed using the Theil–Sen slope with Mann–Kendall significance testing (Figs. 7c, 8c, and 9c). More than 65 % of river segments trend toward shorter ice seasons, with 11.16 % showing a statistically significant reduction (p<0.05) – about nine percentage points higher than hemispheric-scale statistics reported by Wang and Feng (2024) for the period 2000–2021. In addition, >66 % of segments exhibit delayed freeze-up (11.99 % significant), and >65 % show earlier breakup (7.33 % significant). On average, over the 24 year study period, FUD was delayed by 9.0 d, BUD advanced by 7.8 d, and ice duration shortened by 14.1 d. On a decadal scale, these pan-Arctic river ice conditions represent a more pronounced diminution – 1.1 d greater delay in FUD, 0.8 d greater advance in BUD, and 0.4 d greater loss in ice duration per decade – than the Northern Hemisphere averages reported by Wang and Feng (2024), underscoring an intensified warming signal in Arctic river systems. Among pixels with significant trends, 85.48 % indicate delayed FUD, 74.93 % earlier BUD, and 83.79 % a shortened ice duration (Figs. 7d, 8d, and 9d). Across the latitudinal transition from mid- to high latitudes (47.2–72.0° N), decadal tendencies are nonlinear and spatially heterogeneous (Figs. 7e, 8e, and 9e); north of the Arctic Circle (66°34′ N), signals of delayed freeze-up, earlier breakup, and shorter seasons intensify, consistent with amplified high-latitude warming.
Notably, the MAEs of our phenology estimates exceed the trend magnitudes, indicating a potential “signal versus noise” concern that is consistent with previous large-scale studies (Wang and Feng, 2024). This implies that retrieval uncertainty may exceed the long-term change at the segment scale, potentially reducing the practical robustness of inferred trends even when statistical significance is achieved (Chang et al., 2021). Accordingly, confidence in the detected trends should be interpreted in relation to the signal-to-noise ratio (Scaife and Smith, 2018).
Focusing on basin-specific phenological trajectories, we report annual basin-mean records of river ice phenology for each of the six major Arctic rivers (Fig. 10) and the along-channel variability as a function of distance from the river mouth (Fig. 11). Across 24 hydrological years, all basins typically complete freeze-up in October, whereas basin-mean breakup spans from early April to late May. The high-latitude Kolyma averages FUD on 1 October and BUD on 23 May – freezing ∼33 d earlier and breaking up ∼45 d later than the Yenisey – yielding an average ice-season difference of ∼76 d. Ranking basins by the severity of ice conditions (earlier FUD, later BUD, longer duration) mirrors their mean latitude: .
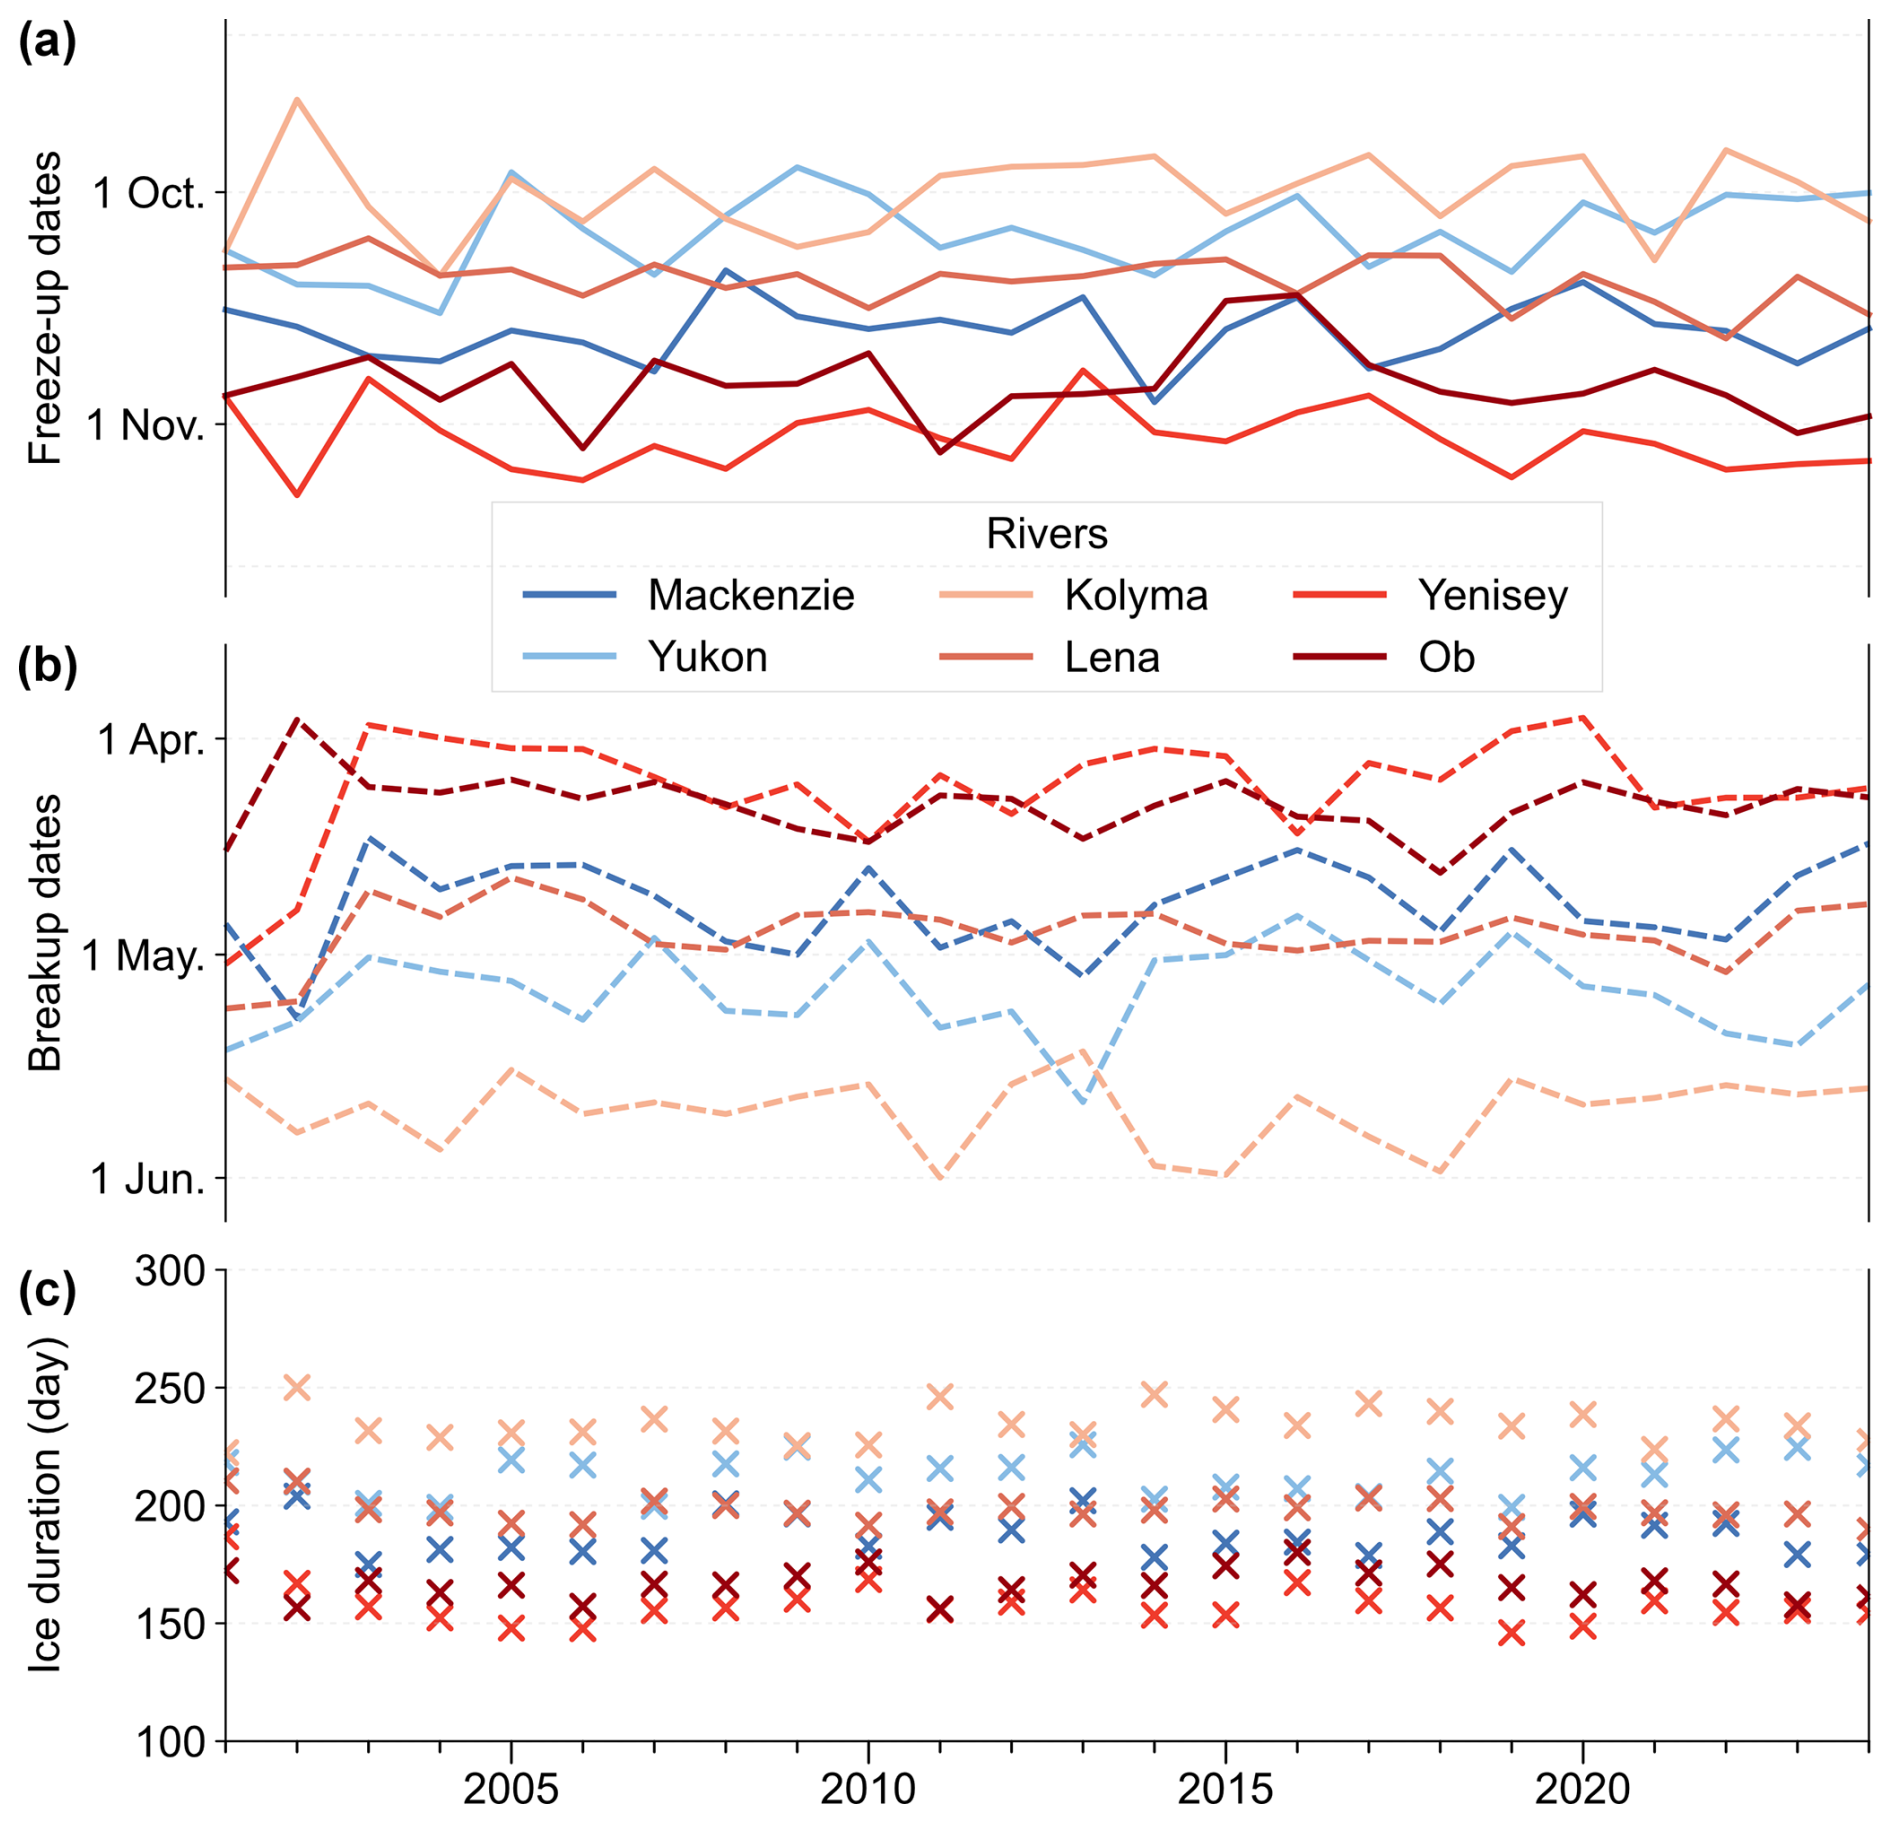
Figure 10Annual records of river ice phenology – freeze-up date (a), breakup date (b), and ice duration (c) – reported as basin-mean values across six major Arctic rivers.
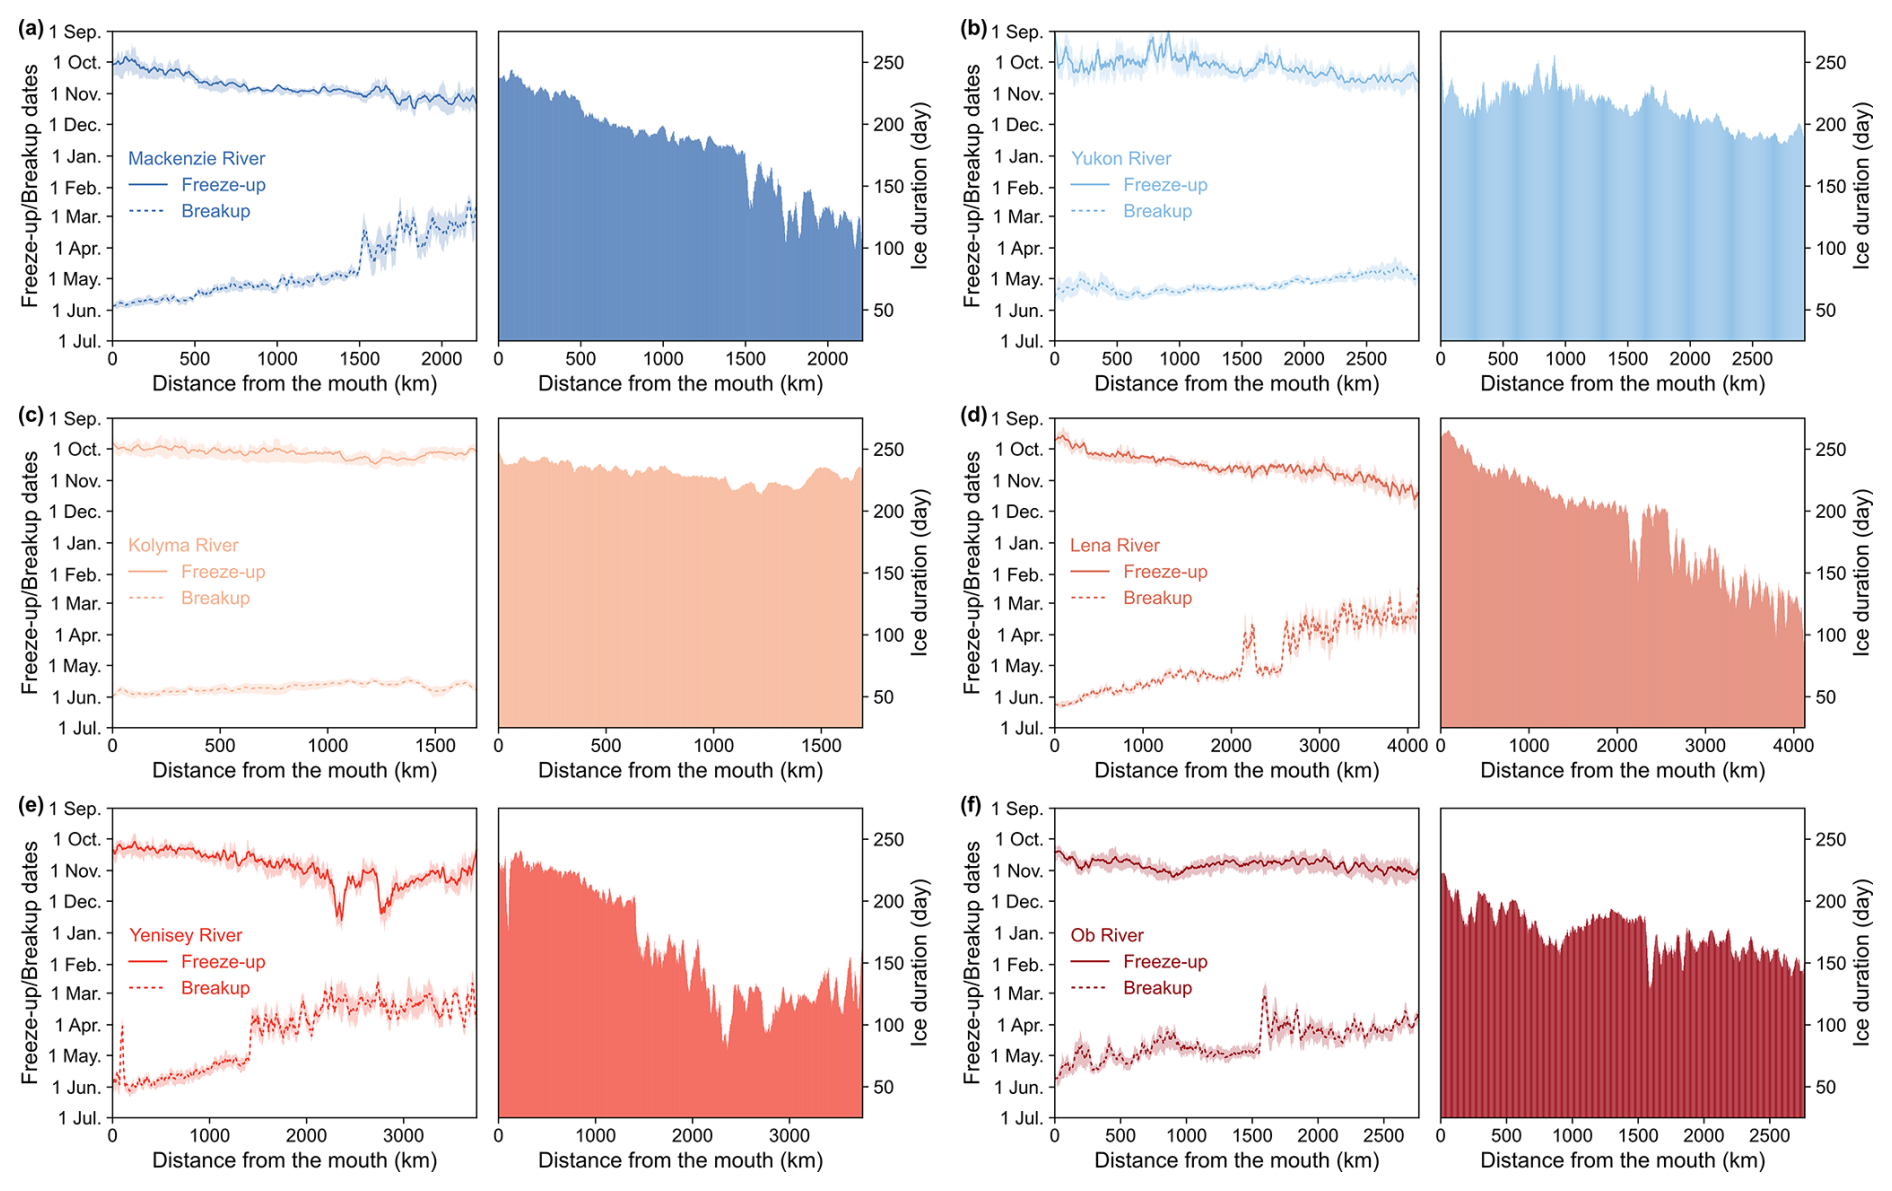
Figure 11Spatial variations in river ice phenology along six major Arctic rivers. River ice freeze-up, breakup, and duration characteristics are shown for the (a) Mackenzie, (b) Yukon, (c) Kolyma, (d) Lena, (e) Yenisey, and (f) Ob rivers. For each river, the left panel shows the 24 year mean freeze-up and breakup dates as a function of distance from the river mouth along the main channel, with shaded bands indicating the interquartile range across the 24 hydrological years. The right panel shows the corresponding 24 year mean ice duration along the same transect. Phenology curves were smoothed using a 10-point moving average.
Two archetypes characterize the spatial organization along channels. In the Mackenzie, Yenisey, Lena, and Ob, freeze-up tends to be progressively delayed upstream, whereas breakup generally propagates downstream (northward), with comparatively smooth progression in lower reaches and abrupt, discontinuous events upstream linked to tributary inflows and channel morphology (Cooley and Pavelsky, 2016). In contrast, the Yukon and Kolyma – whose main stems occupy higher latitudes (above 60.5° N) – exhibit more spatially coherent along-channel breakup and a weaker dependence of both FUD and BUD on downstream distance from the mouth. For the Yukon in particular, its predominantly westward yet latitudinally sinuous course – spanning ∼6° of latitude from its northern bend near the Arctic Circle to its southern lower reaches – further disrupts any simple monotonic gradient in freeze-up timing. These contrasts likely reflect the combined influence of tributary inputs, channel planform (e.g., long braided reaches versus short, confined segments), and variability in surface air temperature (Cooley and Pavelsky, 2016). Despite river-specific heterogeneity, a broadly consistent pattern emerges across basins: downstream reaches closer to the mouth tend to sustain longer ice seasons.
The limitations and uncertainties of this study arise from both data constraints and methodological choices, and additionally from data uncertainty embedded in the spatial reference data and the ice/snow discrimination capability of optical indices.
- Data-related limitations.
-
We exploit a daily MODIS time series to track river ice dynamics across six major Arctic rivers over 24 hydrological years. The high temporal cadence is essential for capturing the rapid – sometimes abrupt – character of ice breakup; however, the coarser 500 m spatial resolution hampers reliable detection along narrower tributaries. To mitigate this, we used the GRWL dataset as a spatial reference, selecting wider reaches based on the “width_max” attribute of the Simplified GRWL Vector Product. This filtering inevitably segments some river sections; we therefore retained only segments contiguous with the mainstem and excluded isolated tributary fragments. In addition, the MODIS archive contains notable temporal gaps – particularly in early years and at high latitudes. Across the six rivers, an average of 4.34 daily scenes per year are missing, which may bias estimates of mean ice phenology and inferred multi-year trends.
- Methodological limitations.
-
(1) We adopt robust, tractable thresholding for RIC retrieval and phenology detection. While practical, overly stringent thresholds risk missing thin or mobile ice, whereas permissive choices admit noise. The asymmetric thresholds adopted for phenology retrieval (following Podkowa et al., 2023) are intended to reflect different process rates, with breakup often rapid and abrupt and freeze-up generally more gradual. However, RIC-based dates capture footprint-scale areal transitions and may not align with station-based conventions. Therefore, the resulting phenological dates should be interpreted with appropriate caution, as the apparent error magnitude depends on the specific in situ event definition used. (2) To reduce cloud contamination inherent to optical imagery, we synthesize Terra and Aqua observations to form daily composites (from the 2002 hydrological year onward) and reclassify cloud pixels using 3 and 5 d temporal windows that leverage the spatiotemporal continuity of ice evolution. This procedure reduces cloud influence by 30.8 %, yet residual cloud cover remains substantial (mean cloud coverage 44.9 %). Further mitigation relies on subsequent 3 km gridding, whereby cloud concentration is redistributed conditional on the local RIC state. (3) At high latitudes, polar night affects winter observations. Our dark-pixel correction delineates affected areas north of 60° N (refining the latitude proposed by Dietz et al., 2012) and substantially alleviates low-bias RIC under darkness. However, this latitudinal mask introduces a noticeable step in the RIC–latitude relationship near 60° N. A more nuanced, observation-driven delineation of the polar-night footprint would likely reduce this artifact.
- Data uncertainty.
-
A key source of uncertainty stems from the construction of the river mask and its interaction with the limited separability of snow and ice in MODIS optical observations. To accommodate seasonal expansion and contraction of the active channel and to maintain geometric consistency with the 500 m resolution of MODIS data, we applied a fixed 250 m buffer on both sides of the reference river polygons, yielding an effective 500 m-wide mask. While this approach improves coverage of seasonally variable channel margins, it may introduce uncertainty in reaches narrower than 500 m, where the buffered mask extends beyond the wetted channel into adjacent banks or floodplain surfaces. During snowy periods, such non-channel areas may occasionally be classified as river ice by NDSI-based mapping, producing a positive bias in mapped ice area and thus in the reported RIC.
We quantified the prevalence of this situation using the GRWL Vector Product (river centerlines with wetted width information). Length-based statistics indicate that reaches with width <500 m constitute a limited fraction of the analyzed network: overall 12.0 % and lowest for the Mackenzie River at 7.2 % (Table S3). To bound the maximum potential impact on gridded RIC, we derived a conservative geometric upper limit for “bank-belt” area introduced by buffering within each grid cell (details provided in Sect. S1 in the Supplement). Under the most pessimistic configuration (narrower reach, continuous snow cover on banks, and complete snow-to-ice confusion), the resulting absolute RIC inflation is at approximately 0.50–0.67. This upper bound is governed by the width ratio of the actual channel to the buffered mask, such that the potential contribution from banks increases as the true channel becomes narrower relative to the mask. This represents a theoretical ceiling; in practice, the realized bias is expected to be smaller because bank snow is spatially and temporally intermittent, snow–ice confusion is not perfect under all conditions, and the subsequent temporal smoothing suppress isolated noise.
Uncertainty may also arise in wider or braided reaches containing islands or exposed bars. Although the GRWL-based mask generally excludes large vegetated islands and other non-channel land surfaces, the additional buffer may still incorporate small peripheral portions of islands or bars into the effective river mask. As this effect mainly involves only marginal buffered areas and small exposed geomorphic features, its overall influence on basin-scale results is expected to be more limited than that associated with narrow reaches.
All remote-sensing inputs used in this study are open access (see Sect. 2.2). The harmonized river-ice dataset is available at https://doi.org/10.5281/zenodo.17054619 (Qiu et al., 2025a). It includes (i) daily 3 km×3 km gridded RIC products and (ii) annual phenology layers (freeze-up date, breakup date, and river ice duration). Files are provided as GeoTIFF format in WGS 84/Arctic Polar Stereographic (EPSG:3995).
Codes related to this work, including Google Earth Engine scripts for river ice mapping, gridded RIC construction, and Python examples for visualization, are available at https://doi.org/10.5281/zenodo.19627384 (Qiu, 2026).
We demonstrate that long-term, high-cadence MODIS archives enable continuous monitoring of ice conditions on the major Arctic rivers, while acknowledging the intrinsic limitations of optical remote sensing at high latitudes – pervasive cloudiness year-round and wintertime polar night – which necessitate systematic pixel-level corrections. Focusing on the six largest pan-Arctic rivers, we assembled over 590 000 MODIS Terra and Aqua scenes and implement a robust, threshold-based river ice mapping scheme that scales efficiently on Google Earth Engine. Together with multi-step cloud mitigation and a dark-pixel correction, this workflow yields hydrological-year products for 2001–2024 comprising 52 023 daily RIC maps and annual phenological metrics.
Validation against higher-resolution RIC derived from Landsat 7/8/9 and Sentinel-2 indicate a basin-mean accuracy of 0.83 (up to 0.90 for the Kolyma). Phenology derived from the MODIS-based RIC is further evaluated against in situ observations and a recently developed river-segment phenology dataset, achieving MAE of 10.8/11.4 d (FUD/BUD) for the in situ comparisons and 10.5/16.0 d for the referenced dataset. Spatiotemporal analyses reveal strong covariation of RIC with surface air temperature and latitude (mean Pearson and 0.89, respectively). More than 66 % of river segments exhibit delayed freeze-up, over 65 % show earlier breakup, and over 65 % exhibit a shortened ice season, with the average FUD delayed by 9.0 d, BUD advanced by 7.8 d, and ice duration shortened by 14.1 d over the study period.
Taken together, these results demonstrate the value of the dataset as a consistent, basin-scale, and fully observation-based record of Arctic river ice dynamics. By relying on daily satellite observations rather than temporally reconstructed ice states or indirect meteorological inference, the dataset complements existing Landsat- and model-based products and provides an important benchmark for cross-dataset comparison and model evaluation. It also offers new opportunities to investigate the spatial heterogeneity, long-term change, and climate sensitivity of river ice regimes across the circumpolar Arctic, thereby supporting both process-oriented studies and large-scale assessments of Arctic environmental change.
The supplement related to this article is available online at https://doi.org/10.5194/essd-18-2703-2026-supplement.
JQ and ATH were both involved in the conceptualization of the work. KL, HK, BK, and ATH were responsible for supervision. JQ developed the methodology building on YQ's groundwork, curated the data, performed the formal analyses, and produced the visualizations. JQ drafted the manuscript, and all authors contributed to review and editing.
The contact author has declared that none of the authors has any competing interests.
Publisher's note: Copernicus Publications remains neutral with regard to jurisdictional claims made in the text, published maps, institutional affiliations, or any other geographical representation in this paper. The authors bear the ultimate responsibility for providing appropriate place names. Views expressed in the text are those of the authors and do not necessarily reflect the views of the publisher.
Some colour palettes used in the figures were adapted from Scientific colour maps (Crameri, 2023), distributed under the MIT License. ChatGPT was used for language checks in parts of a previous version of the manuscript.
This research has been supported by the Ministry of Education and Culture's Doctoral Education Pilot under Decision No. VN/3137/2024-OKM-6 (Digital Waters (DIWA) Doctoral Education Pilot related to the DIWA Flagship (decision no. 359228) funded by the Research Council of Finland's Flagship Programme).
This paper was edited by Niccolò Dematteis and reviewed by two anonymous referees.
Allen, G. H. and Pavelsky, T. M.: Global extent of rivers and streams, Science, 361, 585–588, https://doi.org/10.1126/science.aat0636, 2018.
Beltaos, S.: Progress in the study and management of river ice jams, Cold Reg. Sci. Technol., 51, 2–19, https://doi.org/10.1016/j.coldregions.2007.09.001, 2008.
Beltaos, S. (Ed.).: River ice formation, Committee on River Ice Processes and the Environment, Canadian Geophysical Union Hydrology Section, Edmonton, ISBN 978-0-9920022-0-6, 2013.
Beltaos, S. and Prowse, T.: River-ice hydrology in a shrinking cryosphere, Hydrol. Process., 23, 122–144, https://doi.org/10.1002/hyp.7165, 2009.
Bennett, K. E. and Prowse, T. D.: Northern Hemisphere geography of ice-covered rivers, Hydrol. Process., 24, 235–240, https://doi.org/10.1002/hyp.7561, 2010.
Benson, B., Magnuson, J., and Sharma, S.: Global Lake and River Ice Phenology Database, Version 1, National Snow and Ice Data Center, Boulder, Colorado USA [data set], https://doi.org/10.7265/N5W66HP8, 2000.
Blackadar, R. J., Baxter, C. V., Davis, J. M., and Harris, H. E.: Effects of river ice break-up on organic-matter dynamics and feeding ecology of aquatic insects, River Res. Appl., 36, 480–491, https://doi.org/10.1002/rra.3585, 2020.
Blåfield, L., Marttila, H., Kasvi, E., and Alho, P.: Temporal shift of hydroclimatic regime and its influence on migration of a high latitude meandering river, J. Hydrol., 633, 130935, https://doi.org/10.1016/j.jhydrol.2024.130935, 2024.
Burrell, B. C., Comfort, G., and Beltaos, S.: Considerations in the planning and design of bridges in ice-affected rivers: a review, Can. J. Civil. Eng., 51, 109–124, https://doi.org/10.1139/cjce-2023-0039, 2023.
Chang, K. L., Schultz, M. G., Lan, X., McClure-Begley, A., Petropavlovskikh, I., Xu, X., and Ziemke, J. R.: Trend detection of atmospheric time series: Incorporating appropriate uncertainty estimates and handling extreme events, Elem. Sci. Anth., 9, 00035, https://doi.org/10.1525/elementa.2021.00035, 2021.
Chaouch, N., Temimi, M., Romanov, P., Cabrera, R., McKillop, G., and Khanbilvardi, R.: An automated algorithm for river ice monitoring over the Susquehanna River using the MODIS data, Hydrol. Process., 28, 62–73, https://doi.org/10.1002/hyp.9548, 2014.
Chen, Y. and She, Y.: Long-term variations of river ice breakup timing across Canada and its response to climate change, Cold Reg. Sci. Technol., 176, 103091, https://doi.org/10.1016/j.coldregions.2020.103091, 2020.
Chu, T. and Lindenschmidt, K. E.: Effects of river geomorphology on river ice freeze-up and break-up rates using MODIS imagery, Can. J. Remote Sens., 45, 176–191, https://doi.org/10.1080/07038992.2019.1635004, 2019.
Cooley, S. W. and Pavelsky, T. M.: Spatial and temporal patterns in Arctic river ice breakup revealed by automated ice detection from MODIS imagery, Remote Sens. Environ., 175, 310–322, https://doi.org/10.1016/j.rse.2016.01.004, 2016.
Crameri, F.: Scientific colour maps, Zenodo [code], https://doi.org/10.5281/zenodo.1243862, 2023.
de Rham, L., Dibike, Y., Beltaos, S., Peters, D., Bonsal, B., and Prowse, T.: A Canadian River Ice Database from the National Hydrometric Program Archives, Earth Syst. Sci. Data, 12, 1835–1860, https://doi.org/10.5194/essd-12-1835-2020, 2020.
de Rham, L. P., Prowse, T. D., and Bonsal, B. R.: Temporal variations in river-ice break-up over the Mackenzie River Basin, Canada, J. Hydrol., 349, 441–454, https://doi.org/10.1016/j.jhydrol.2007.11.018, 2008.
Dietz, A. J., Wohner, C., and Kuenzer, C.: European snow cover characteristics between 2000 and 2011 derived from improved MODIS daily snow cover products, Remote Sens.-Basel, 4, 2432–2454, https://doi.org/10.3390/rs4082432, 2012.
Feng, D., Gleason, C. J., Lin, P., Yang, X., Pan, M., and Ishitsuka, Y.: Recent changes to Arctic river discharge, Nat. Commun., 12, 6917, https://doi.org/10.1038/s41467-021-27228-1, 2021.
Frey, K. E. and McClelland, J. W.: Impacts of permafrost degradation on arctic river biogeochemistry, Hydrol. Process., 23, 169–182, https://doi.org/10.1002/hyp.7196, 2009.
Fukś, M.: Changes in river ice cover in the context of climate change and dam impacts: a review, Aquat. Sci., 85, 113, https://doi.org/10.1007/s00027-023-01011-4, 2023.
Gebre, S., Alfredsen, K., Lia, L., Stickler, M., and Tesaker, E.: Review of ice effects on hydropower systems, J. Cold Reg. Eng., 27, 196–222, https://doi.org/10.1061/(ASCE)CR.1943-5495.0000059, 2013.
Hall, D. K., Riggs, G. A., Salomonson, V. V., DiGirolamo, N. E., and Bayr, K. J.: MODIS snow-cover products, Remote Sens. Environ., 83, 181–194, https://doi.org/10.1016/S0034-4257(02)00095-0, 2002.
Holmes, R. M., Coe, M. T., Fiske, G. J., Gurtovaya, T., McClelland, J. W., Shiklomanov, A. I., Spencer, R. G., Tank, S. E., and Zhulidov, A. V.: Climate change impacts on the hydrology and biogeochemistry of Arctic rivers, Clim. Change Glob. Warm. Inland Wat., 1–26, https://doi.org/10.1002/9781118470596.ch1, 2013.
Holmes, R. M., Shiklomanov, A. I., Suslova, A., Tretiakov, M., McClelland, J. W., Scott, L., Spencer, R. G. M., and Tank, S. E.: River Discharge, Arctic Report Card 2021, 78, https://doi.org/10.25923/zevf-ar65, 2021.
Huang, F. and Shen, H. T.: Dam removal effect on the lower St. Regis River ice-jam floods, Can. J. Civil. Eng., 51, 215–227, https://doi.org/10.1139/cjce-2023-0040, 2023.
Jeffries, M. O., Morris, K., and Kozlenko, N.: Ice characteristics and processes, and remote sensing of frozen rivers and lakes, in: Remote Sensing in Northern Hydrology: Measuring Environmental Change, 63–90, https://doi.org/10.1029/163GM05, 2005.
Jeffries, M. O., Morris, K., and Duguay, C. R.: State of the earth's cryosphere at the beginning of the 21st century: glaciers, global snow cover, floating ice, and permafrost and periglacial environments – floating ice: lake ice and river ice, in: Satellite Image Atlas of Glaciers of the World, edited by: Williams, R. S. and Ferrigno, J. G., USGS, Reston, VA, A381–A424, https://doi.org/10.3133/pp1386A, 2012.
Kim, Y., Kimball, J. S., Glassy, J., and Du, J.: An extended global Earth system data record on daily landscape freeze–thaw status determined from satellite passive microwave remote sensing, Earth Syst. Sci. Data, 9, 133–147, https://doi.org/10.5194/essd-9-133-2017, 2017.
Lehner, B. and Grill, G.: Global river hydrography and network routing: baseline data and new approaches to study the world's large river systems, Hydrol. Process., 27, 2171–2186, https://doi.org/10.1002/hyp.9740, 2013.
Li, H., Li, H., Wang, J., and Hao, X.: Revealing the river ice phenology on the Tibetan Plateau using Sentinel-2 and Landsat 8 overlapping orbit imagery, J. Hydrol., 619, 129285, https://doi.org/10.1016/j.jhydrol.2023.129285, 2023.
Li, X., Jing, Y., Shen, H., and Zhang, L.: The recent developments in cloud removal approaches of MODIS snow cover product, Hydrol. Earth Syst. Sci., 23, 2401–2416, https://doi.org/10.5194/hess-23-2401-2019, 2019.
Lisina, A. A., Krylenko, I. N., Kalugin, A. S., Motovilov, Y. G., Sazonov, A. A., and Frolova, N. L.: Assessment of the Kolyma Runoff under current climate changes, Water Resour., 50, S318-S322, https://doi.org/10.1134/S0097807823700513, 2023.
Liston, G. E. and Hiemstra, C. A.: The changing cryosphere: Pan-Arctic snow trends (1979–2009), J. Climate, 24, 5691–5712, https://doi.org/10.1175/JCLI-D-11-00081.1, 2011.
Liu, S., Wang, P., Huang, Q., Yu, J., Pozdniakov, S. P., and Kazak, E. S.: Seasonal and spatial variations in riverine DOC exports in permafrost-dominated Arctic river basins, J. Hydrol., 612, 128060, https://doi.org/10.1016/j.jhydrol.2022.128060, 2022.
Magnuson, J. J., Robertson, D. M., Benson, B. J., Wynne, R. H., Livingstone, D. M., Arai, T., Assel, R. A., Barry, R. G., Card, V., Kuusisto, E., and Granin, N. G.: Historical trends in lake and river ice cover in the Northern Hemisphere, Science, 289, 1743–1746, https://doi.org/10.1126/science.289.5485.1743, 2000.
Muñoz-Sabater, J., Dutra, E., Agustí-Panareda, A., Albergel, C., Arduini, G., Balsamo, G., Boussetta, S., Choulga, M., Harrigan, S., Hersbach, H., Martens, B., Miralles, D. G., Piles, M., Rodríguez-Fernández, N. J., Zsoter, E., Buontempo, C., and Thépaut, J.-N.: ERA5-Land: a state-of-the-art global reanalysis dataset for land applications, Earth Syst. Sci. Data, 13, 4349–4383, https://doi.org/10.5194/essd-13-4349-2021, 2021.
Newton, A. M. W. and Mullan, D. J.: Climate change and Northern Hemisphere lake and river ice phenology from 1931–2005, The Cryosphere, 15, 2211–2234, https://doi.org/10.5194/tc-15-2211-2021, 2021.
Osadchiev, A., Sedakov, R., Frey, D., Gordey, A., Rogozhin, V., Zabudkina, Z., Spivak, E., Kuskova, E., Sazhin, A., and Semiletov, I.: Intense zonal freshwater transport in the Eurasian Arctic during ice-covered season revealed by in situ measurements, Sci. Rep.-UK, 13, 16508, https://doi.org/10.1038/s41598-023-43524-w, 2023.
Patro, E. R., Ghadimi, S., Shahrood, A. J., Fazel, N., Makarieva, O., and Haghighi, A. T.: Flow regime alteration in Arctic rivers due to dam operations and climate change, Global Planet. Change, 237, 104442, https://doi.org/10.1016/j.gloplacha.2024.104442, 2024.
Pavelsky, T. M. and Smith, L. C.: Spatial and temporal patterns in Arctic river ice breakup observed with MODIS and AVHRR time series, Remote Sens. Environ., 93, 328–338, https://doi.org/10.1016/j.rse.2004.07.018, 2004.
Pithan, F. and Mauritsen, T.: Arctic amplification dominated by temperature feedbacks in contemporary climate models, Nat. Geosci., 7, 181–184, https://doi.org/10.1038/ngeo2071, 2014.
Podkowa, A., Kugler, Z., Nghiem, S. V., and Brakenridge, G. R.: Ice Freeze-Up and Break-Up in Arctic Rivers Observed With Satellite L-Band Passive Microwave Data From 2010 to 2020, Water Resour. Res., 59, e2022WR031939, https://doi.org/10.1029/2022WR031939, 2023.
Prowse, T., Alfredsen, K., Beltaos, S., Bonsal, B., Duguay, C., Korhola, A., McNamara, J., Pienitz, R., Vincent, W. F., Vuglinsky, V., and Weyhenmeyer, G. A.: Past and future changes in Arctic lake and river ice, Ambio, 40, 53–62, https://doi.org/10.1007/s13280-011-0216-7, 2011.
Prowse, T. D.: River-ice ecology. I: Hydrologic, geomorphic, and water-quality aspects, J. Cold Reg. Eng., 15, 1–16, https://doi.org/10.1061/(ASCE)0887-381X(2001)15:1(1), 2001.
Prowse, T. D., Bonsal, B. R., Duguay, C. R., and Lacroix, M. P.: River-ice break-up/freeze-up: a review of climatic drivers, historical trends and future predictions, Ann. Glaciol., 46, 443–451, https://doi.org/10.3189/172756407782871431, 2007.
Qiu, J.: CrisQiu/ESSD_2025: Code for “A Harmonized 2000–2024 Dataset of Daily River Ice Concentration and Annual Phenology for Major Arctic Rivers”, v1.0.0, Zenodo [code], https://doi.org/10.5281/zenodo.19627384, 2026.
Qiu, J., Luojus, K., Kaartinen, H., Qiu, Y., Silander, J., Patro, E. R., Klöve, B., and Haghighi, A. T.: A Harmonized 2000–2024 Dataset of Daily River Ice Concentration and Annual Phenology for Major Arctic Rivers, Zenodo [data set], https://doi.org/10.5281/zenodo.17054619, 2025a.
Qiu, J., Ran, J., Tangdamrongsub, N., Fettweis, X., Ali, S., Feng, W., and Wan, X.: Recent significant subseasonal fluctuations of supraglacial lakes on Greenland monitored by passive optical satellites, Remote Sens. Environ., 328, 114896, https://doi.org/10.1016/j.rse.2025.114896, 2025b.
Qiu, Y., Xie, P., Leppäranta, M., Wang, X., Lemmetyinen, J., Lin, H., and Shi, L.: MODIS-based daily lake ice extent and coverage dataset for Tibetan Plateau, Big Earth Data, 3, 170–185, https://doi.org/10.1080/20964471.2019.1631729, 2019.
Richards, E., Stuefer, S., Rangel, R. C., Maio, C., Belz, N., and Daanen, R.: An evaluation of GPR monitoring methods on varying river ice conditions: A case study in Alaska, Cold Reg. Sci. Technol., 210, 103819, https://doi.org/10.1016/j.coldregions.2023.103819, 2023.
Riggs, G. A., Hall, D. K., and Román, M. O.: MODIS snow products collection 6 user guide, https://modis-snow-ice.gsfc.nasa.gov/uploads/C6_MODIS_Snow_User_Guide.pdf (last access: 15 April 2026), 2016.
Scaife, A. A. and Smith, D.: A signal-to-noise paradox in climate science, npj Clim. Atmos. Sci., 1, 28, https://doi.org/10.1038/s41612-018-0038-4, 2018.
Serreze, M. C. and Barry, R. G.: The Arctic climate system, Cambridge University Press, https://doi.org/10.1017/CBO9781139583817, 2014.
Shiklomanov, A. I.: Data of river ice timing and thickness for selected river gauges in Russian pan-Arctic over 1970–2012, Arctic Data Center, https://doi.org/10.18739/A22Z12Q02, 2016.
Shiklomanov, A. I. and Lammers, R. B.: River ice responses to a warming Arctic – recent evidence from Russian rivers, Environ. Res. Lett., 9, 035008, https://doi.org/10.1088/1748-9326/9/3/035008, 2014.
Shiklomanov, A. I., Lammers, R. B., and Vörösmarty, C. J.: Widespread decline in hydrological monitoring threatens pan-Arctic research, EOS T. Am. Geophys. Un., 83, 13–17, https://doi.org/10.1029/2002EO000007, 2002.
Sojka, M., Ptak, M., and Zhu, S.: Use of Landsat Satellite images in the Assessment of the variability in Ice Cover on Polish Lakes, Remote Sens.-Basel, 15, 3030, https://doi.org/10.3390/rs15123030, 2023.
Van der Sanden, J. J., Drouin, H., and Geldsetzer, T.: An automated procedure to map breaking river ice with C-band HH SAR data, Remote Sens. Environ., 252, 112119, https://doi.org/10.1016/j.rse.2020.112119, 2021.
Vermote, E. and Wolfe, R.: MODIS/Terra Surface Reflectance Daily L2G Global 1 km and 500 m SIN Grid V061; NASA EOSDIS Land Process, https://doi.org/10.5067/MODIS/MOD09GA.061, 2021.
Wang, X. and Feng, L.: Patterns and Trends in Northern Hemisphere River Ice Phenology from 2000 to 2021, Remote Sens. Environ., 313, 114346, https://doi.org/10.1016/j.rse.2024.114346, 2024.
Yang, X., Pavelsky, T. M., and Allen, G. H.: The past and future of global river ice, Nature, 577, 69–73, https://doi.org/10.1038/s41586-019-1848-1, 2020.
Yao, R., Wang, L., Huang, X., Sun, L., Chen, R., Wu, X., Zhang, W., and Niu, Z.: A robust method for filling the gaps in MODIS and VIIRS land surface temperature data, IEEE T. Geosci. Remote, 59, 10738–10752, https://doi.org/10.1109/TGRS.2021.3053284, 2021.
Zakharov, I., Puestow, T., Khan, A. A., Briggs, R., and Barrette, P.: Review of river ice observation and data analysis technologies, Hydrology, 11, 126, https://doi.org/10.3390/hydrology11080126, 2024.
Zhang, Y., Qiu, Y., Li, Y., Leppäranta, M., Jia, G., Jiang, Z., and Liang, W.: Spatial-temporal variation of river ice coverage in the Yenisei river from 2002 to 2021, J. Hydrol., 637, 131440, https://doi.org/10.1016/j.jhydrol.2024.131440, 2024.