the Creative Commons Attribution 4.0 License.
the Creative Commons Attribution 4.0 License.
 | 10 Feb 2026
Fusing ERA5-Land and SMAP L4 for an improved global soil moisture product (1950–2025)
Wenhong Wang
Shiao Feng
Zhongwang Wei
Jianzhi Dong
Lutz Weihermüller
Cong-Qiang Liu
Harry Vereecken
Accurate, high-resolution soil moisture data are critical for hydrological modeling, climate studies, and ecosystem management. Unfortunately, current existing global products suffer from inconsistencies, coverage gaps, and biases. In this study, we evaluated the surface layers of three widely used soil moisture products, including ERA5-Land, ESA-CCI (v09.1 Combined), and SMAP L4 with resolutions ranging from 0.1 to 0.25°, against in situ measurements across five networks, including ISMN, CMA, Cemaden, COSMOS-Europe, and SONTE-China. The in situ dataset, to our knowledge, represents the most extensive global soil moisture compilation to date, comprising approximately 3.8 million records, organized into a primary dataset for modern validation (2015–2020) and an independent historical dataset (1960–2015). It is found that during the primary validation period (2015–2020), ERA5-Land exhibits high correlation (with correlation coefficient of 0.69) between measured and predicted soil moisture but the data also shows significant bias. SMAP L4 provides the highest accuracy (with root mean square error (RMSE) value of 0.088 m3 m−3) and low bias, but is limited by its temporal coverage from 2015 to the present. To address these gaps, we developed an adjusted ERA5-Land dataset spanning 1950 to 2025 by fusing ERA5-Land and SMAP L4 using a mean-variance rescaling method optimized for long time-series alignment, which enhanced the spatiotemporal coverage and reduced bias. Validation against the primary validation period demonstrates a reduction in RMSE of 24.6 % and an improvement in normalized Nash-Sutcliffe Efficiency (NNSE) of 30.6 % compared to the original ERA5-Land products. Crucially, the reliability of the backward extension was verified against independent historical observations spanning 1960 to 2015, demonstrating sustained improvements over ERA5-Land with 19.7 % RMSE reduction and 26.6 % NNSE increase. This confirms the robustness of the adjustment parameters in the mean-variance rescaling method. The adjusted ERA5-Land dataset, which is publicly available, can be used as benchmark for future research and support drought monitoring, weather prediction, and water resource management, contributing to global climate resilience across diverse ecosystems. The dataset is provided for the surface layer with global coverage at a 0.1° spatial and daily temporal resolution, spanning from 1950 to 2025, at https://doi.org/10.57760/sciencedb.30546 (Wang et al., 2026).
- Article
(13521 KB) - Full-text XML
-
Supplement
(2032 KB) - BibTeX
- EndNote


Soil moisture is a critical driver of water and energy cycles across Earth's spheres, playing a foundational role in coupling land-atmosphere interactions, regulating regional hydrological and biogeochemical processes, and sustaining ecosystem services (McColl et al., 2017; Humphrey et al., 2021; Dorigo et al., 2017; Hao et al., 2025; Li et al., 2025a). The temporal variability of surface soil moisture alters surface albedo and soil thermal properties, influencing net radiation budgets and regional temperature distributions, which in turn modulate atmospheric circulation and the occurrence of extreme climate events, such as heatwaves and droughts (Sang et al., 2021; Guan et al., 2009). As a critical component of the global water cycle, soil moisture also governs precipitation partitioning (run-off and infiltration), evaporation and transpiration, and groundwater recharge (Koster et al., 2004; Ruosteenoja et al., 2018; McColl et al., 2017; Vereecken et al., 2022). As soil moisture regulates plant water uptake it also impacts plant nutrient uptake and translocation in the plant root zone (e.g., carbon, nitrogen, phosphorus, and potassium), profoundly impacting vegetation growth, soil organic carbon dynamics, and ecosystem nutrient cycling (Glaser and Lehr, 2019; Green et al., 2019; Humphrey et al., 2021; Trugman et al., 2018). Consequently, high-quality soil moisture data are essential for numerical weather prediction, hydrological forecasting, water resource management, drought and flood early warning, agricultural irrigation, and Earth system modeling (Crow et al., 2012; Almendra-Martín et al., 2022; Shi et al., 2024; Manrique-Alba et al., 2017).
In general, soil moisture observations can be obtained through diverse methods, each with distinct strengths and limitations. In situ measurements utilize sensors to measure soil physical properties, such as dielectric permittivity, electrical conductivity, thermal characteristics, or neutron counts, providing high-accuracy data at point scales, often regarded as ground truth for validation and correcting biases in global soil moisture products (Robinson et al., 2008; Babaeian et al., 2019). In situ soil moisture networks, such as the International Soil Moisture Network (ISMN), China Meteorological Administration (CMA), Cemaden (Brazil), SONTE-China, and COSMOS-Europe, are widely recognized for their robust data and standardized protocols. ISMN integrates global networks, such as COSMOS, SCAN, and SMOSMANIA, with standardized quality control, offering over 2800 stations across diverse climates from arid to humid regions (Dorigo et al., 2013, 2021). CMA and SONTE-China provide dense, long-term measurements across Asia spanning from the arid Loess Plateau to humid eastern regions (Wang et al., 2023). Cemaden delivers critical data in Brazil's semi-arid Northeast, addressing gaps in South American coverage (Zeri et al., 2018). COSMOS-Europe employs cosmic-ray neutron sensing for high-accuracy, non-invasive, intermediate-scale measurements (130–240 m radius, 15–55 cm depth), partially overcoming the limitations of traditional point-scale sensors. The COSMOS-Europe network, comprising 66 cosmic-ray neutron sensor stations across 12 European countries, covers eight Köppen-Geiger climate zones (primarily humid continental and temperate oceanic) and varied land uses, providing high-accuracy soil moisture data with standardized processing and calibration against gravimetric soil samples (Bogena et al., 2022). Despite their high accuracy, in situ data are heterogeneous in terms of measurement methods and vertical depths, variable in spatial scale (from point measurements to footprints for cosmic-ray neutron sensing of several hundred meters; Babaeian et al., 2019; Bogena et al., 2022), and sparse in remote areas, such as deserts and polar regions, where stations are generally scarce. However, these networks provide robust global coverage, rigorous quality control, and representation of diverse soil and climate zones, enhancing the reliability of global datasets for bias correction and validation (Dorigo et al., 2013, 2021; Babaeian et al., 2019; Ochsner et al., 2013; Vereecken et al., 2008).
On the other hand, remote sensing is mainly based on microwave and optical/thermal sensors to estimate soil moisture over larger areas, each offering distinct advantages and limitations. Passive microwave sensors, such as those of the Soil Moisture Active Passive (SMAP) mission (gridded to ∼ 36 km for Level-2 soil moisture products; Entekhabi et al., 2010; Reichle et al., 2019), Soil Moisture and Ocean Salinity (SMOS) (yielding ∼ 30–50 km resolution, averaging ∼ 40 km for Level-2 soil moisture products, depending on incidence angle and processing; Kerr et al., 2010; Zhang et al., 2021b), and Advanced Microwave Scanning Radiometer 2 (AMSR2) (footprint of ∼ 22–35 km, gridded to ∼ 25 km for Level-2 products; Imaoka et al., 2010; Zhang et al., 2021a), provide resolutions suitable for global soil moisture monitoring. However, they are limited in capturing small scale soil moisture variability. This limitation arises from the coarse sensor footprints inherent to the low-frequency microwave bands and the spatial aggregation applied during data processing (e.g., regridding and noise-reduction smoothing), which further degrade spatial details. By comparison, active microwave sensors, such as radars used in Sentinel-1, provide higher resolution (1–10 km) but are more sensitive to vegetation and surface roughness, posing challenges in densely vegetated tropical regions and heterogeneous landscapes (Babaeian et al., 2019; Mohanty et al., 2017; Bauer-Marschallinger et al., 2019). Distinct from microwave observations, optical and thermal sensors complement microwave data by capturing surface conditions; however, they are limited to shallow depths and are restricted to observing the surface only under cloud-free conditions (Babaeian et al., 2018; Zhang and Zhou, 2016). To take advantage of different sensing approaches, multi-sensor fusion, such as in the European Space Agency's Climate Change Initiative (ESA-CCI), enhances soil moisture prediction accuracy. Yet, these still suffer from data gaps and reduced accuracy in tropical forests and snow/ice-covered high-latitude regions, due to microwave signal attenuation (Dorigo et al., 2017; Gruber et al., 2019). Furthermore, products derived from data assimilation, such as the SMAP L4 dataset, provide soil moisture estimates at a ∼ 9 km resolution through the direct assimilation of passive microwave observations (e.g., SMAP radiometer brightness temperature) into the NASA Catchment land surface model using an ensemble Kalman filter (EnKF) (Reichle et al., 2019). While SMAP L4 offers lower bias and unbiased root-mean-square error against in situ measurements, its performance naturally relies on the spatiotemporal availability of the assimilated observations. These methodological strengths and limitations highlight that the significant evolution of soil moisture estimation strategies, which now encompass a broad range of independent sensor retrievals, multi-sensor fusion products, and data assimilation systems.
Despite these advances in remote sensing techniques, global soil moisture products, such as ERA5-Land, ESA-CCI, SMAP L4, SMOS, AMSR2, and GLDAS, still face ongoing obstacles in delivering consistent, accurate, and comprehensive global soil moisture datasets. ERA5-Land, a widely recognized reanalysis product, provides extensive temporal coverage (1950–present) at 0.1° resolution and, with advanced land surface modeling, complements its fine-scale detail that makes it particularly valuable for capturing long-term trends (Hersbach et al., 2020; Muñoz-Sabater et al., 2021). However, ERA5-Land exhibits biases in arid regions (e.g., overestimation in deserts due to sparse observations) and high-latitude regions (e.g., overestimation in tundra due to snowmelt modeling errors), tending to overestimate moisture due to improper model parameterizations and limited observational inputs (Muñoz-Sabater et al., 2021). ESA-CCI integrates active and passive microwave data, thereby achieving high performance as shown by high temporal correlations with independent data and low estimated random errors. However, the product suffers from significant data gaps, mainly due to frozen conditions and dense vegetation causing microwave signal attenuation, which limits its applicability in certain global modeling applications (Dorigo et al., 2017; Gruber et al., 2019). SMAP L4 employs L-band observations and data assimilation to yield high accuracy, with a reported unbiased root-mean-square error (ubRMSE) of 0.04 m3 m−3 for surface soil moisture, and is widely applied in drought forecasting and agricultural monitoring. However, as data are only available since April 2015, its use is restricted for long-term (historical) analyses (Reichle et al., 2019). SMOS, another passive microwave L-band product, provides global coverage since 2010 but is partly affected by radio-frequency interference (RFI) in regions such as Asia, reducing its applicability (Zhang et al., 2021b). The passive microwave-based AMSR2 soil moisture product offers daily global data at ∼ 0.25° (∼ 25 km) resolution, useful for large-scale climate studies, whereby it is characterized by coarse spatial resolution and sensitivity to vegetation due to the used frequency of 10.65 GHz, limiting its applicability in forested areas and heterogeneous landscapes (Imaoka et al., 2010; Zhang et al., 2021a). GLDAS integrates multiple land surface models, with GLDAS-1 covering 1979-present and GLDAS-2 extending back to 1948 using Princeton meteorological forcing data. It has also quite coarse spatial resolution (0.25–1°, e.g., Noah model) and model-driven biases, making it less suitable for high-resolution applications (Rodell et al., 2004; Beaudoing and Rodell, 2020).
Overall, these soil moisture datasets exhibit region-dependent limitations: satellite-based products such as SMAP L4 and ESA-CCI tend to show higher uncertainties in dense tropical or forested regions due to vegetation effects (Gruber et al., 2019; Fan et al., 2020; Hirschi et al., 2025), while reanalysis data such as ERA5-Land may be less reliable in high-latitude or arid regions where model parameterizations struggle to capture frozen or sparse-moisture conditions (Muñoz-Sabater et al., 2021). These complementary strengths and weaknesses highlight the need for an integrated dataset that combines the extensive coverage of ERA5-Land with the high accuracy of SMAP L4.
Recent studies highlight specific limitations in regional coverage, data gaps, and temporal consistency of the available soil moisture products. For example, Li et al. (2022) developed a China-specific dataset using ERA5-Land but lacked global scope. Zheng et al. (2023) noted ESA-CCI's gaps in the tropical region, and Wang et al. (2024) addressed challenges in achieving long-term consistency in multi-product fusion. These limitations underscore the need for a unified, bias-corrected dataset, which has prompted the exploration of various techniques to reconcile discrepancies across soil moisture products, with several methods showing promise in addressing these challenges.
Among these, the mean-variance rescaling method has gained attention for its effectiveness in aligning datasets. This approach offers key advantages, including simplicity in implementation, which reduces computational demands compared to more complex approaches (Zheng et al., 2023; Afshar et al., 2019). Its explicit tuning parameters allow for consistent statistical adjustments across long time series, facilitating adaptability to varying temporal scales without necessitating recalibration for each period. Additionally, this method preserves the physical meaning of the data by focusing on mean and variance adjustments, avoiding the need to estimate and map full empirical distributions, which can introduce errors in highly variable datasets (Gruber et al., 2016; Afshar et al., 2019). However, alternative methods such as Cumulative Distribution Function (CDF) matching offer robust distribution alignment but are computationally intensive due to periodic recalculations (Afshar et al., 2019; Madelon et al., 2022).Triple collocation (TC) provides error variance estimation without a reference dataset, enhancing global product accuracy, though it requires at least three independent datasets and assumes uncorrelated errors (Crow et al., 2015; Gruber et al., 2016). These alternatives present trade-offs in accuracy, flexibility, and computational demand, illustrating the diversity of strategies available to address soil moisture data integration.
To address the challenges in regional coverage, data gaps, and biases, this study first comprehensively evaluates the surface soil moisture layers of ERA5-Land, ESA-CCI, and SMAP L4 against in situ measurements to identify the most suitable baseline datasets in terms of accuracy, reliability, and consistency. The in situ measurement datasets are collected from ISMN, CMA, Cemaden, SONTE-China, and COSMOS-Europe for assessment. To the best of our knowledge, this represents the most extensive in situ soil moisture compilation available to date, comprising approximately 3.8 million records in total, with 1.9 million measurements for the primary evaluation (2015–2020) and an independent set of 1.9 million records for historical validation dating back to 1960. We then develop an integrated dataset, adjusted ERA5-Land, calibrated using the continuous SMAP L4 record (2015–2025) to ensure global consistency, enhanced coverage, and reduced bias spanning 1950 to the present. The proposed dataset provides a robust soil moisture product that may support hydrological modeling, water resource management, drought monitoring, and agricultural optimization, while fostering global climate resilience and informed decision-making across diverse ecosystems.
2.1 Data Sources
2.1.1 In situ Datasets
This study utilizes five in situ soil moisture datasets for the assessment of the generated and already existing global soil moisture products. The in situ soil moisture datasets include data from the International Soil Moisture Network (ISMN) (Dorigo et al., 2021, 2011), the China Meteorological Administration soil moisture monitoring program (CMA) (Li et al., 2022), the Brazilian National Center for Natural Disaster Monitoring and Early Warning (Cemaden) (Zeri et al., 2018), the COSMOS-Europe (Bogena et al., 2022), and the SONTE-China (Wang et al., 2023).
To the best of our knowledge, this collection represents the most comprehensive in situ soil moisture compilations available to date, comprising approximately 3.8 million records in total. These records are organized into two distinct subsets to support specific evaluation objectives: a primary dataset for the primary validation analysis (April 2015–2020) containing approximately 1.9 million records, and an independent historical dataset (1960–March 2015) containing an additional 1.9 million records.
For the primary dataset, in situ soil moisture data measured at a depth of 0–10 cm over the period from 2015 to 2020 were selected, from the individual sources. We defined the primary validation period as 2015 to 2020 to ensure maximum temporal consistency across the diverse networks, as fully quality-controlled records for several regional networks (e.g., Cemaden and SONTE-China) were not yet available for subsequent years. Due to the differences in various organizational structures and quality control standards among the datasets, data were quality controlled and outliers removed (see Sect. 2.1.3). After this step, 1615 of around 3500 in situ stations meeting our criteria were obtained, providing a total of approximately 1.9 million soil moisture measurement records (with daily temporal resolution).
The global spatial coverage of these stations is illustrated in Fig. 1a. As shown in Fig. 1b, the stations are mainly located in North America and Asia, whereby the stations in North American are mainly taken from the International Soil Moisture Network (ISMN) and are concentrated in the United States. Asian stations are mainly from the China Meteorological Administration (CMA) dataset and cover China. The South American stations, mostly from the Brazilian National Center for Monitoring of Natural Disasters (Cemaden) dataset, are all located in Brazil. In contrast, stations in Africa and Oceania are sparsely distributed. In terms of the length of time series, Fig. 1c shows that most of the stations have an observation period of 1–4 years, and those with an observational period of more than 4 years are mainly from the ISMN, which makes the ISMN an important data support for the study of long-term soil moisture.
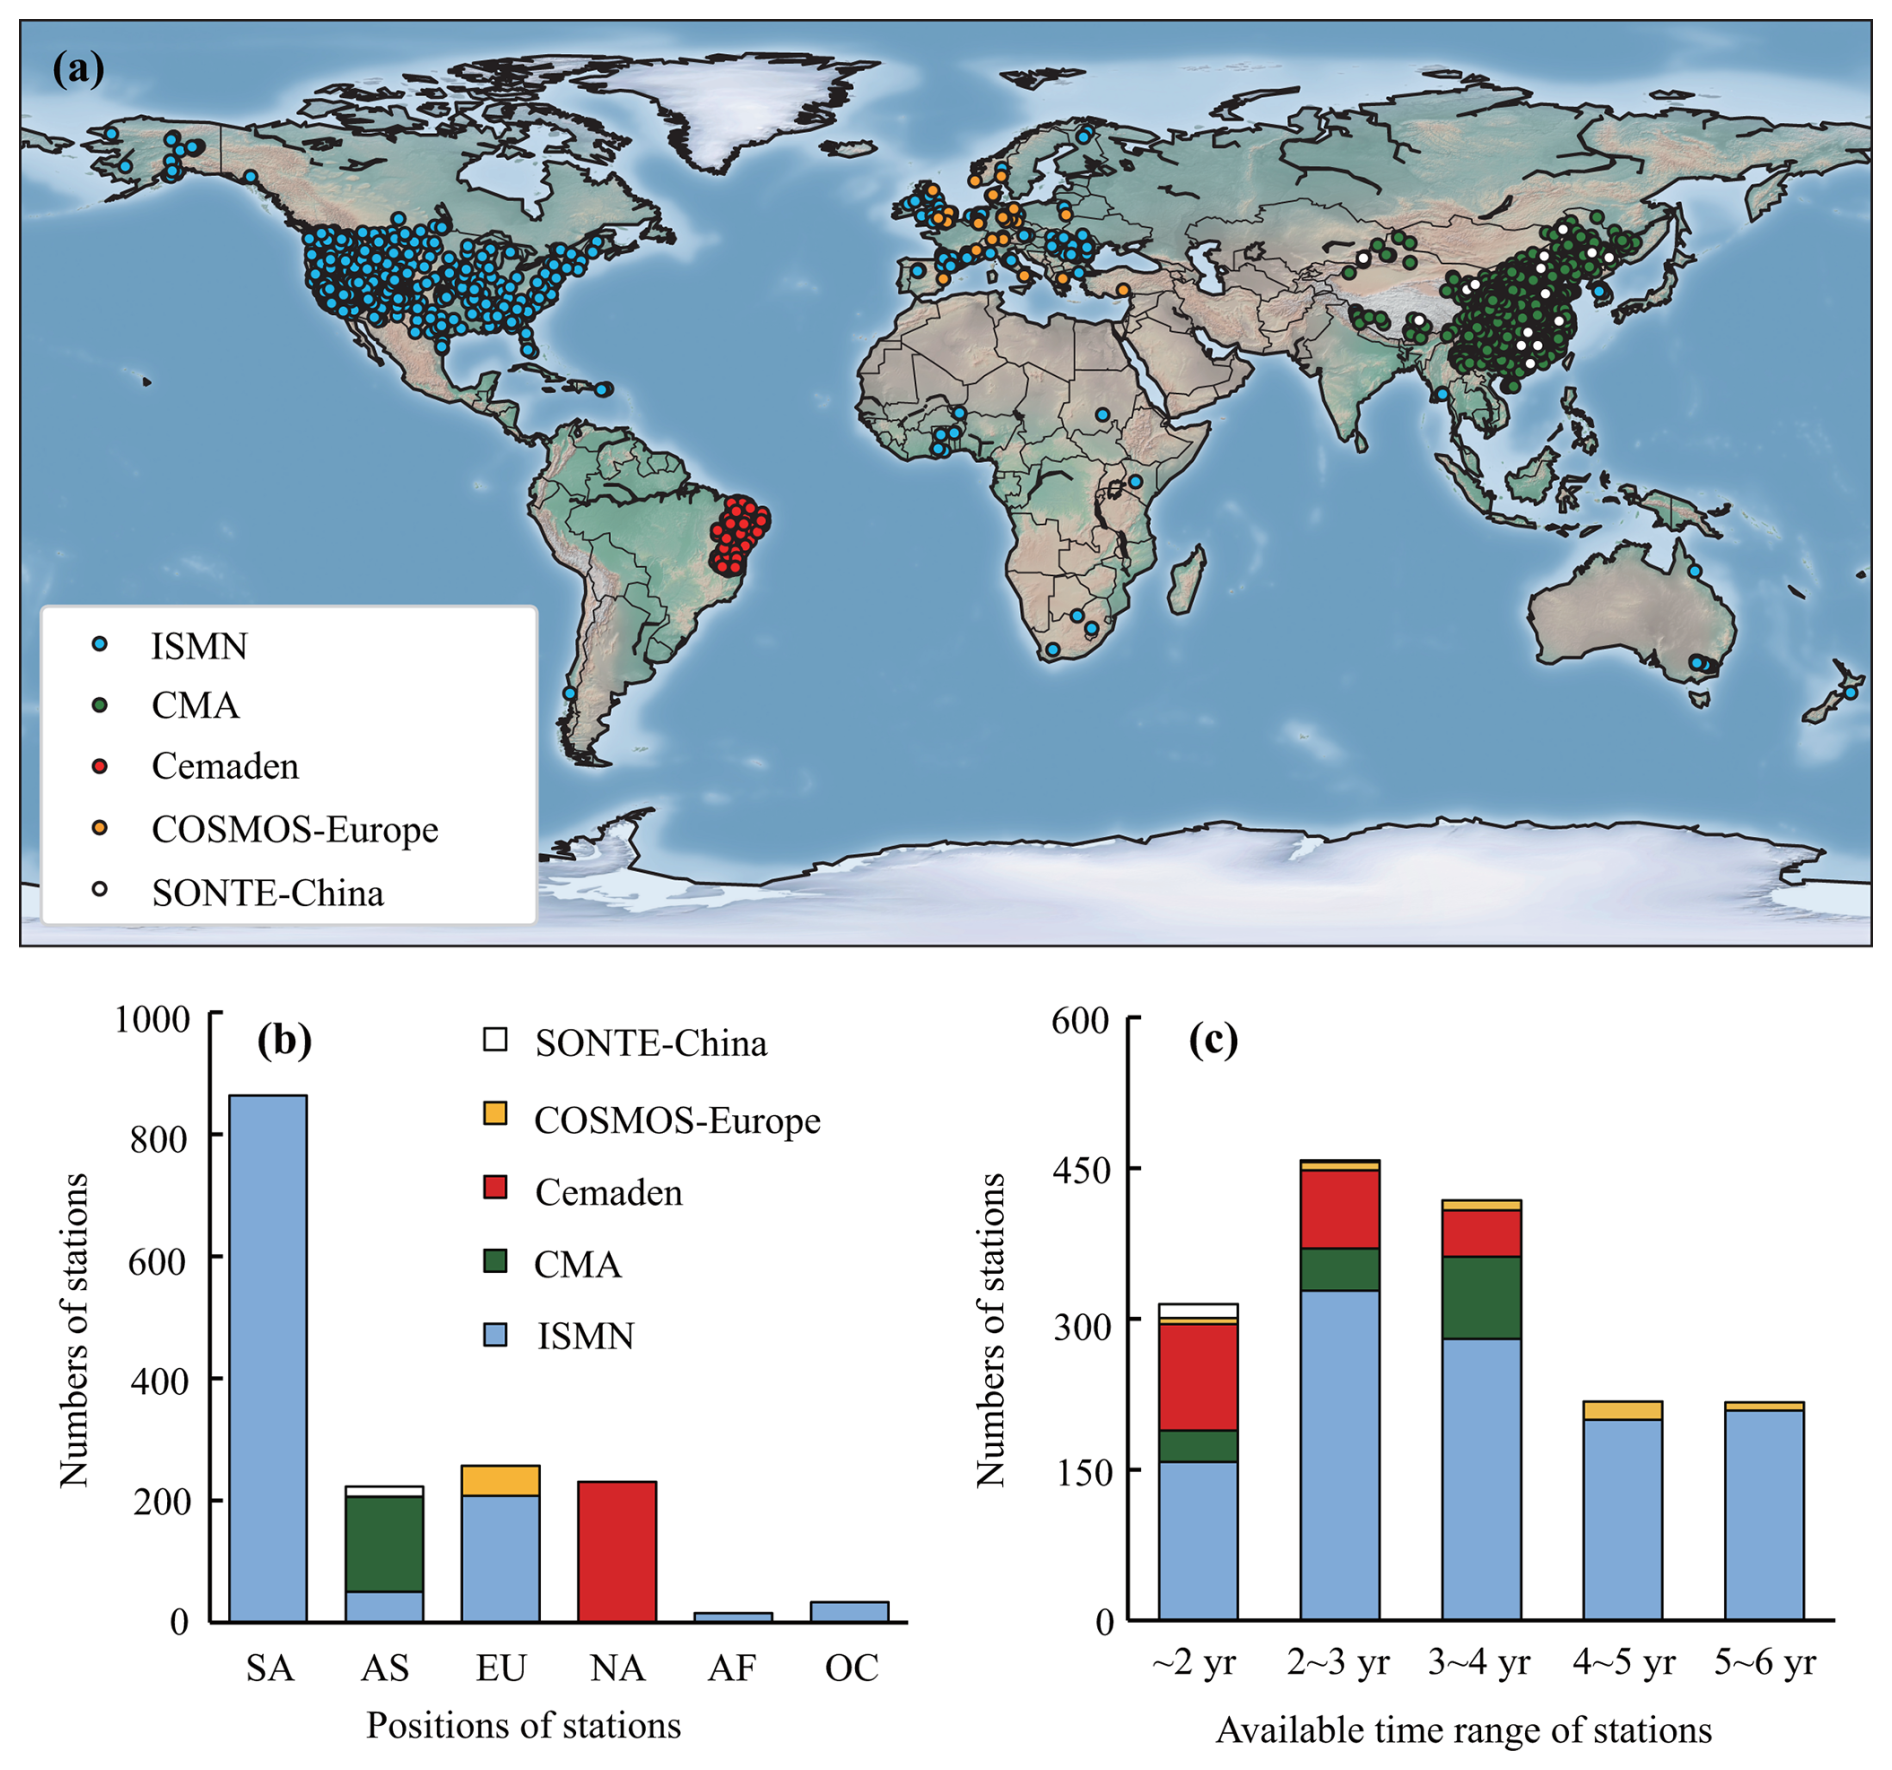
Figure 1Spatiotemporal characteristics of the primary in situ dataset used for the main analysis (2015–2020). (a) Global distribution of the 1615 in situ soil moisture stations used in this study, with colors differentiating the five source networks: ISMN, CMA, Cemaden, COSMOS-Europe, and SONTE-China; (b) Numbers of in situ soil moisture stations in each continent including North America (NA), Asia (AS), Europe (EU), South America (SA), Africa (AF), and Oceania (OC); (c) Numbers of stations with valid soil moisture data records across time range of different years within the 2015–2020 study window. The map in panel (a) was generated using the Matplotlib Basemap toolkit, with coastline and boundary data sourced from GSHHG and Natural Earth.
In addition to this primary dataset, all available ISMN soil moisture records spanning the period January 1960–March 2015 (2173 in situ stations providing an independent set of approximately 1.9 million soil moisture measurement records) were separately collected and retained. This dataset enables an independent evaluation of the reliability of the temporally extended ERA5-Land dataset. The spatial distribution of these historical stations is provided in Fig. S1 in the Supplement.
In the following, the different data sources are shortly described. The International Soil Moisture Network (ISMN) was established in 2009 with European Space Agency (ESA) support and integrates soil moisture data from over 70 in situ observation networks, encompassing more than 2000 monitoring stations distributed globally (Dorigo et al., 2021, 2011). While some records date back to the late 1950s, most stations operate since the 2000s. Stations are primarily concentrated in North America and Europe. As a comprehensive open-access database (https://ismn.earth/en/, last access: 5 January 2026), ISMN is critical for developing, validating, and evaluating soil moisture products (Wang et al., 2021; Zhang et al., 2021a, b).
The China Meteorological Administration (CMA) dataset consists of hourly in situ soil moisture measurements since the 1990s across eight soil depth (0–10, 10–20, 20–30, 30–40, 40–50 50–60, 70–80, and 90–100 cm) (Li et al., 2022). All stations are distributed within China, with higher station density in central and eastern China and sparser coverage in western and northern China. Considering the uneven spatial distribution of stations, this study ultimately selected a representative sample of CMA stations for assessment of the produced and existing moisture products through stratified sampling, ensuring balanced coverage and avoiding instances of multiple ground truth data points within each remapped grid cell, particularly in the central and eastern regions. Initial quality control by Li et al. (2022) removed long-term missing values, interpolated short-term gaps, and standardized the temporal resolution to a daily scale. The dataset is available at https://doi.org/10.5194/essd-14-5267-2022 (Li et al., 2022).
The Cemaden dataset (Zeri et al., 2018), established by the Brazilian National Center for Monitoring and Early Warning of Natural Disasters in 2014, focuses on monitoring the semi-arid regions of the country. Comprising over 500 observation stations, the Cemaden network provides in situ soil moisture data at various depths ranging from 0 to 40 cm from July 2015 to April 2019. In addition to soil moisture measurements, many stations are equipped to monitor atmospheric variables such as air temperature, relative humidity, wind speed, precipitation, and solar radiation. This integrated system facilitates comprehensive environmental monitoring, enhancing the dataset's relevance for a wide range of research applications. The Cemaden dataset is publicly available at https://www.cemaden.gov.br/mapainterativo (last access: 5 January 2026).
The COSMOS-Europe dataset encompasses in situ soil moisture measurements from 66 stations across 12 European countries, measuring soil moisture at 15–55 cm depth from 2011 to 2022 with a horizontal footprint radius of approximately 130–240 m (Bogena et al., 2022). Ancillary data, including soil texture, meteorological variables, and elevation, is accompanied for each measurement station. In addition, all stations have gone through standardized calibration and data were screened for outliers using advanced techniques such as spectral and meteorological analysis. Both the raw and processed datasets are accessible via the TERENO portal at http://www.tereno.net (last access: 5 January 2026).
The SONTE-China dataset, published in 2023, comprises 17 stations across China, with each station equipped with 5 to 10 soil moisture sensors capturing spatial variability (Wang et al., 2023). The dataset spans the period from 2018 to 2021 and includes measurements at four distinct depths (5, 10, 20, and 40 cm), providing a comprehensive vertical profile of soil moisture dynamics. Rigorous calibration and validation processes were applied at each station, thereby affirming the reliability of the dataset for applications. The SONTE-China dataset is available at https://doi.org/10.6084/m9.figshare.21302955.v2 (Wang et al., 2023).
2.1.2 Existing Soil Moisture Products: ERA5-Land, ESA-CCI, and SMAP L4
In this study, we incorporate three highly representative and widely utilized high-quality soil moisture products, i.e., the ERA5-Land reanalysis dataset, the SMAP Level 4 Soil Moisture product (hereafter referred to as SMAP L4), and the ESA-CCI v09.1 Combined dataset (hereafter referred to as ESA-CCI). ERA5-Land dataset, developed by the European Centre for Medium-Range Weather Forecasts (ECMWF), is a non-assimilated high-resolution reanalysis product, downscaled from its predecessor, the ERA5 dataset, which includes assimilation processes (Balsamo et al., 2015; Hersbach et al., 2020; Muñoz-Sabater et al., 2021). In contrast, SMAP L4, product of the NASA Soil Moisture Active Passive (SMAP) satellite mission (Entekhabi et al., 2009, 2010), integrates in situ observational data through assimilation to enhance accuracy (Reichle et al., 2019). ESA-CCI, led by the European Space Agency (ESA), combines multi-source satellite product without assimilation, providing comprehensive soil moisture estimates (Dorigo et al., 2017; Gruber et al., 2019; Preimesberger et al., 2020). The following describes the characteristics, resolution, and preprocessing steps of each product.
ERA5-Land (Muñoz-Sabater et al., 2021) is derived by driving the CHTESSEL land surface model (Nogueira et al., 2020) with downscaled meteorological data from the ERA5 climate reanalysis, providing a comprehensive suite of hourly and monthly data at a 9 km resolution on a global scale since 1950. This dataset captures the dynamic variations of meteorological and land surface variables, including soil moisture at four depths (0–7, 7–28, 28–100, and 100–289 cm). For this study, hourly 0–7 cm moisture dataset were aggregated to daily resolution for temporal consistency. The dataset is publicly accessible via the Copernicus Climate Data Store at https://cds.climate.copernicus.eu/datasets/reanalysis-era5-land/ (last access: 5 January 2026).
The SMAP L4 dataset (Reichle et al., 2019) offers global surface (0–5 cm) and root-zone (0–100 cm) soil moisture data at 9 km resolution every 3 h since April 2015. It assimilates brightness temperature observations into NASA's Catchment land surface model employing a distributed ensemble Kalman filter approach, calibrated using in situ soil moisture measurements from networks such as CSAN, COSMOS, and CRN. In this study, the surface soil moisture product spanning 2015 to 2020 was selected. The data are publicly available at https://smap.jpl.nasa.gov/data (last access: 5 January 2026).
The ESA-CCI Soil Moisture Version 09.1 Combined dataset (Dorigo et al., 2017; Gruber et al., 2019; Preimesberger et al., 2020), notably the latest version developed by the ESA, represents a long-term satellite-derived soil moisture climate data record. This dataset offers global daily soil moisture measurements at a 0.25° spatial resolution from 1978 to the present, constituting the longest available satellite-derived soil moisture archive with surface soil moisture (2–5 cm). This study used a hybrid active-passive product for 2015–2020, ensuring consistency with other datasets. Data are publicly available at https://climate.esa.int/en/projects/soil-moisture (last access: 5 January 2026).
2.1.3 Ancillary Quality Control and Climate Classification Dataset
This study uses ancillary and classification datasets to enhance in situ soil moisture quality control and evaluate soil moisture product performance across different climate zones. Ancillary factors, including precipitation, soil temperature, and saturated water content, identify anomalous in situ observations, ensuring data reliability. A climate classification dataset supports comparative analysis of products in diverse climatic regions.
In situ soil moisture quality control utilizes the relationships between precipitation and soil moisture, and also the relationships between soil temperature and soil moisture, with detailed description in Sect. 2.2. In addition, saturated moisture content (θs), obtained from Zhang et al. (2018), is also used to identify the outliers, serving as the upper threshold for the observed moisture content. Precipitation and soil temperature data were sourced from the ERA5-Land dataset, described in Sect. 2.1.2. Soil temperature is selected at 0–7 cm depth, matching ERA5-Land's soil moisture layer, and precipitation includes rainfall and snowfall.
To assess the performances of soil moisture product across different climate zones, a Köppen-Geiger classification dataset is used (Beck et al., 2018), which delineates climates into five main categories (tropical, arid, temperate, cold, and polar) based on seasonal monthly average temperature and precipitation. Here we utilized the 0.0083° resolution dataset, which is available for download at https://www.gloh2o.org/koppen (last access: 5 January 2026).
2.2 In situ Data Pre-processing
To keep consistent comparisons between gridded soil moisture products and in situ measurements, preprocessing ensured spatial and temporal alignment and data quality. Gridded data values were extracted at the geographic coordinates of each in-situ measurement location for spatial alignment. Temporal differences were resolved by standardizing all datasets to daily values by interpolating data for any coarse temporal resolution in the original dataset, whereas datasets in fine resolution were aggregated to daily values. Additionally, data cleaning was performed to remove invalid or anomalous data, as detailed below.
The ISMN dataset employs a robust quality control framework, providing a quality flag for each recording to assess its reliability (Dorigo et al., 2013). In this study, only samples labeled with the quality flag “G” (good, indicating no abnormalities) were retained, and stations with fewer than one year of valid samples were excluded. Multiple soil moisture data series were available within the 0–10 cm depth range for a few stations, differing in depth or method. These soil moisture data were therefore averaged into a single series to prevent interference with model training, as illustrated in Fig. 2, with raw and processed soil moisture series for some example ISMN stations.
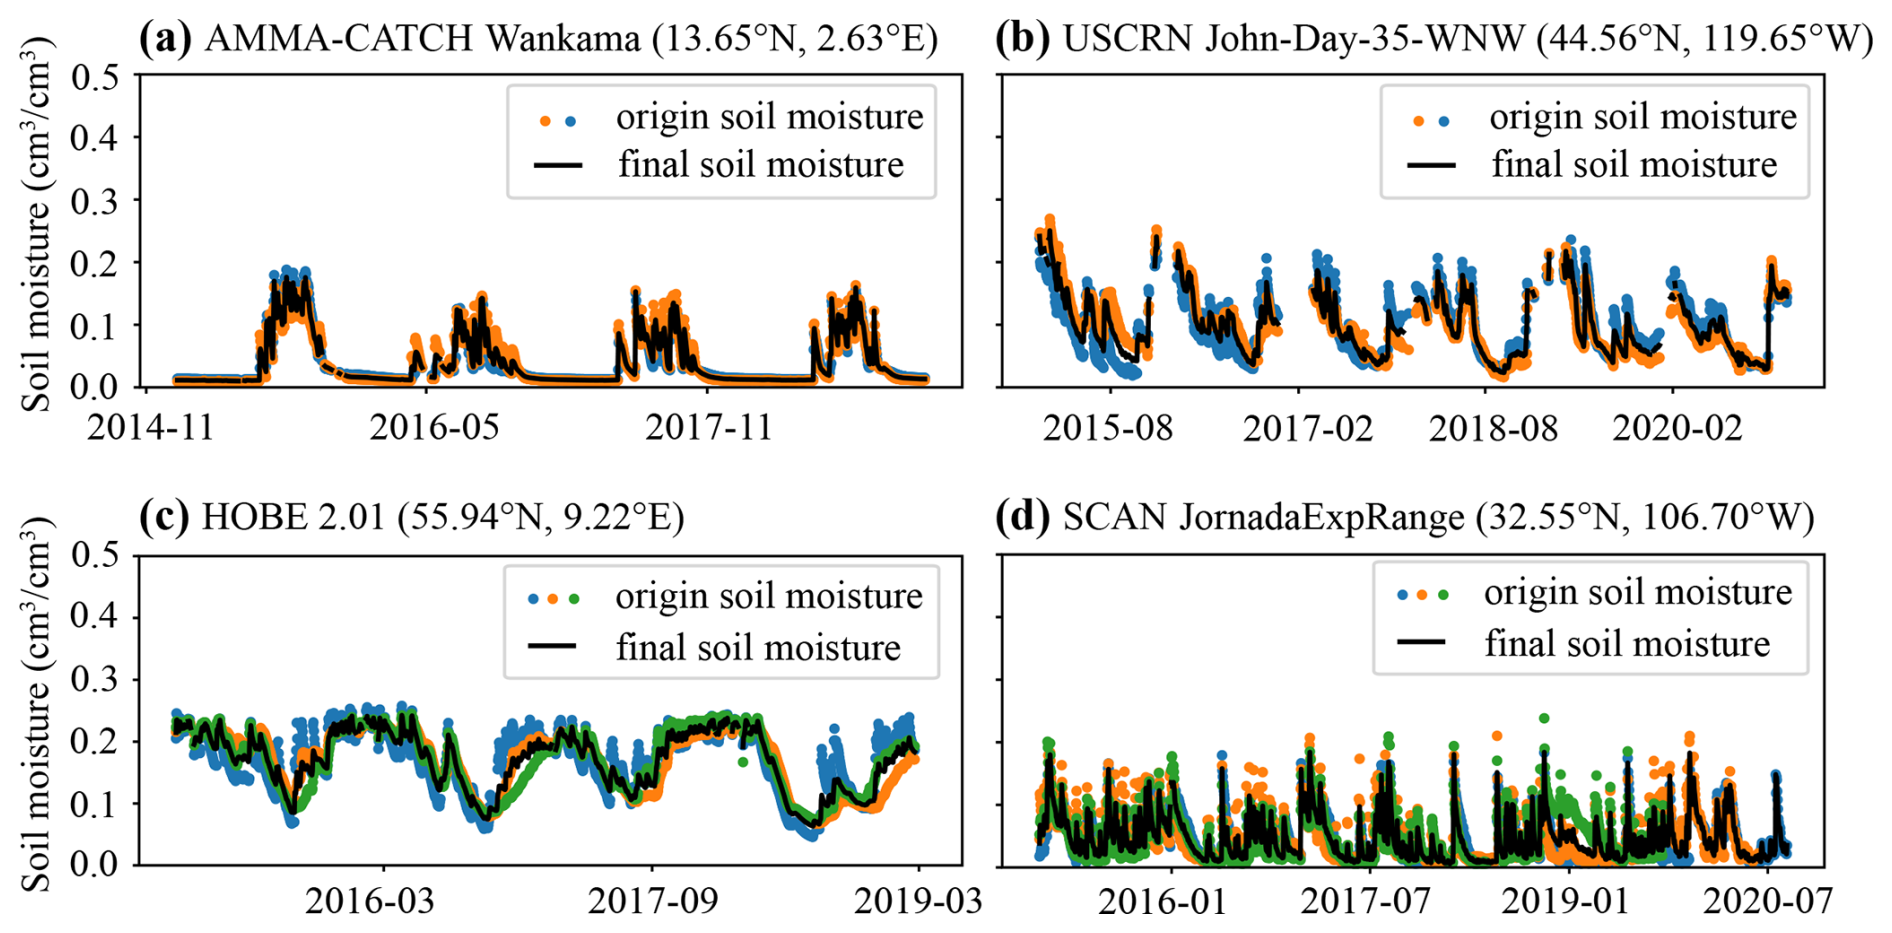
Figure 2Examples of ISMN (International Soil Moisture Network) soil moisture data processing. Each subplot is labeled by network and the station names with the original (colored dots) and processed soil moisture series (black line).
The CMA dataset lacks standardized and unified quality control for the soil moisture observations (Li et al., 2021a). Using the data already processed by Li et al. (2022) and incorporating insights from previous studies, strict quality control measures were implemented to identify anomalous data in three categories, as shown in Fig. 3. The first type, range anomalies (Type 1 anomaly), was identified if the moisture values exceed the saturated moisture content (θs) obtained from the global soil hydraulic parameters developed by Zhang et al. (2018) or fall below 0 cm3 cm−3 (Zhang et al., 2017). In addition, reported soil moisture values at soil temperatures below 0 °C were also typically considered anomalous in this category (Wang et al., 2018). The second type, fluctuation anomalies (Type 2 anomaly), was defined if daily moisture change of soil moisture (Δθt), calculated as the difference between current soil moisture value (θt) and the soil moisture at previous timestep (θt−1), exceeds 0.1 cm3 cm−3 under no precipitation conditions at the corresponding period or if Δθt felt below −0.05 cm3 cm−3 during precipitation events (Li et al., 2021a; McColl et al., 2017; Wang et al., 2018). Since positive changes in soil moisture (Δθt>0) are typically driven by precipitation, characterized by rapid response, while negative changes (Δθt<0) are generally linked to evaporation or transpiration, exhibiting a significantly slower rate and a decreasing trend in rate as soil moisture diminishes (Wang and He, 2015). The third type, constant anomalies (Type 3 anomaly), was identified if Δθt between consecutive days was less than 1 % of the sensor's precision due to instrument malfunctions or soil cracking, leading to prolonged periods of little or no variation in measurements (Li et al., 2021a). Finally, stations with fewer than one year of valid data were excluded.
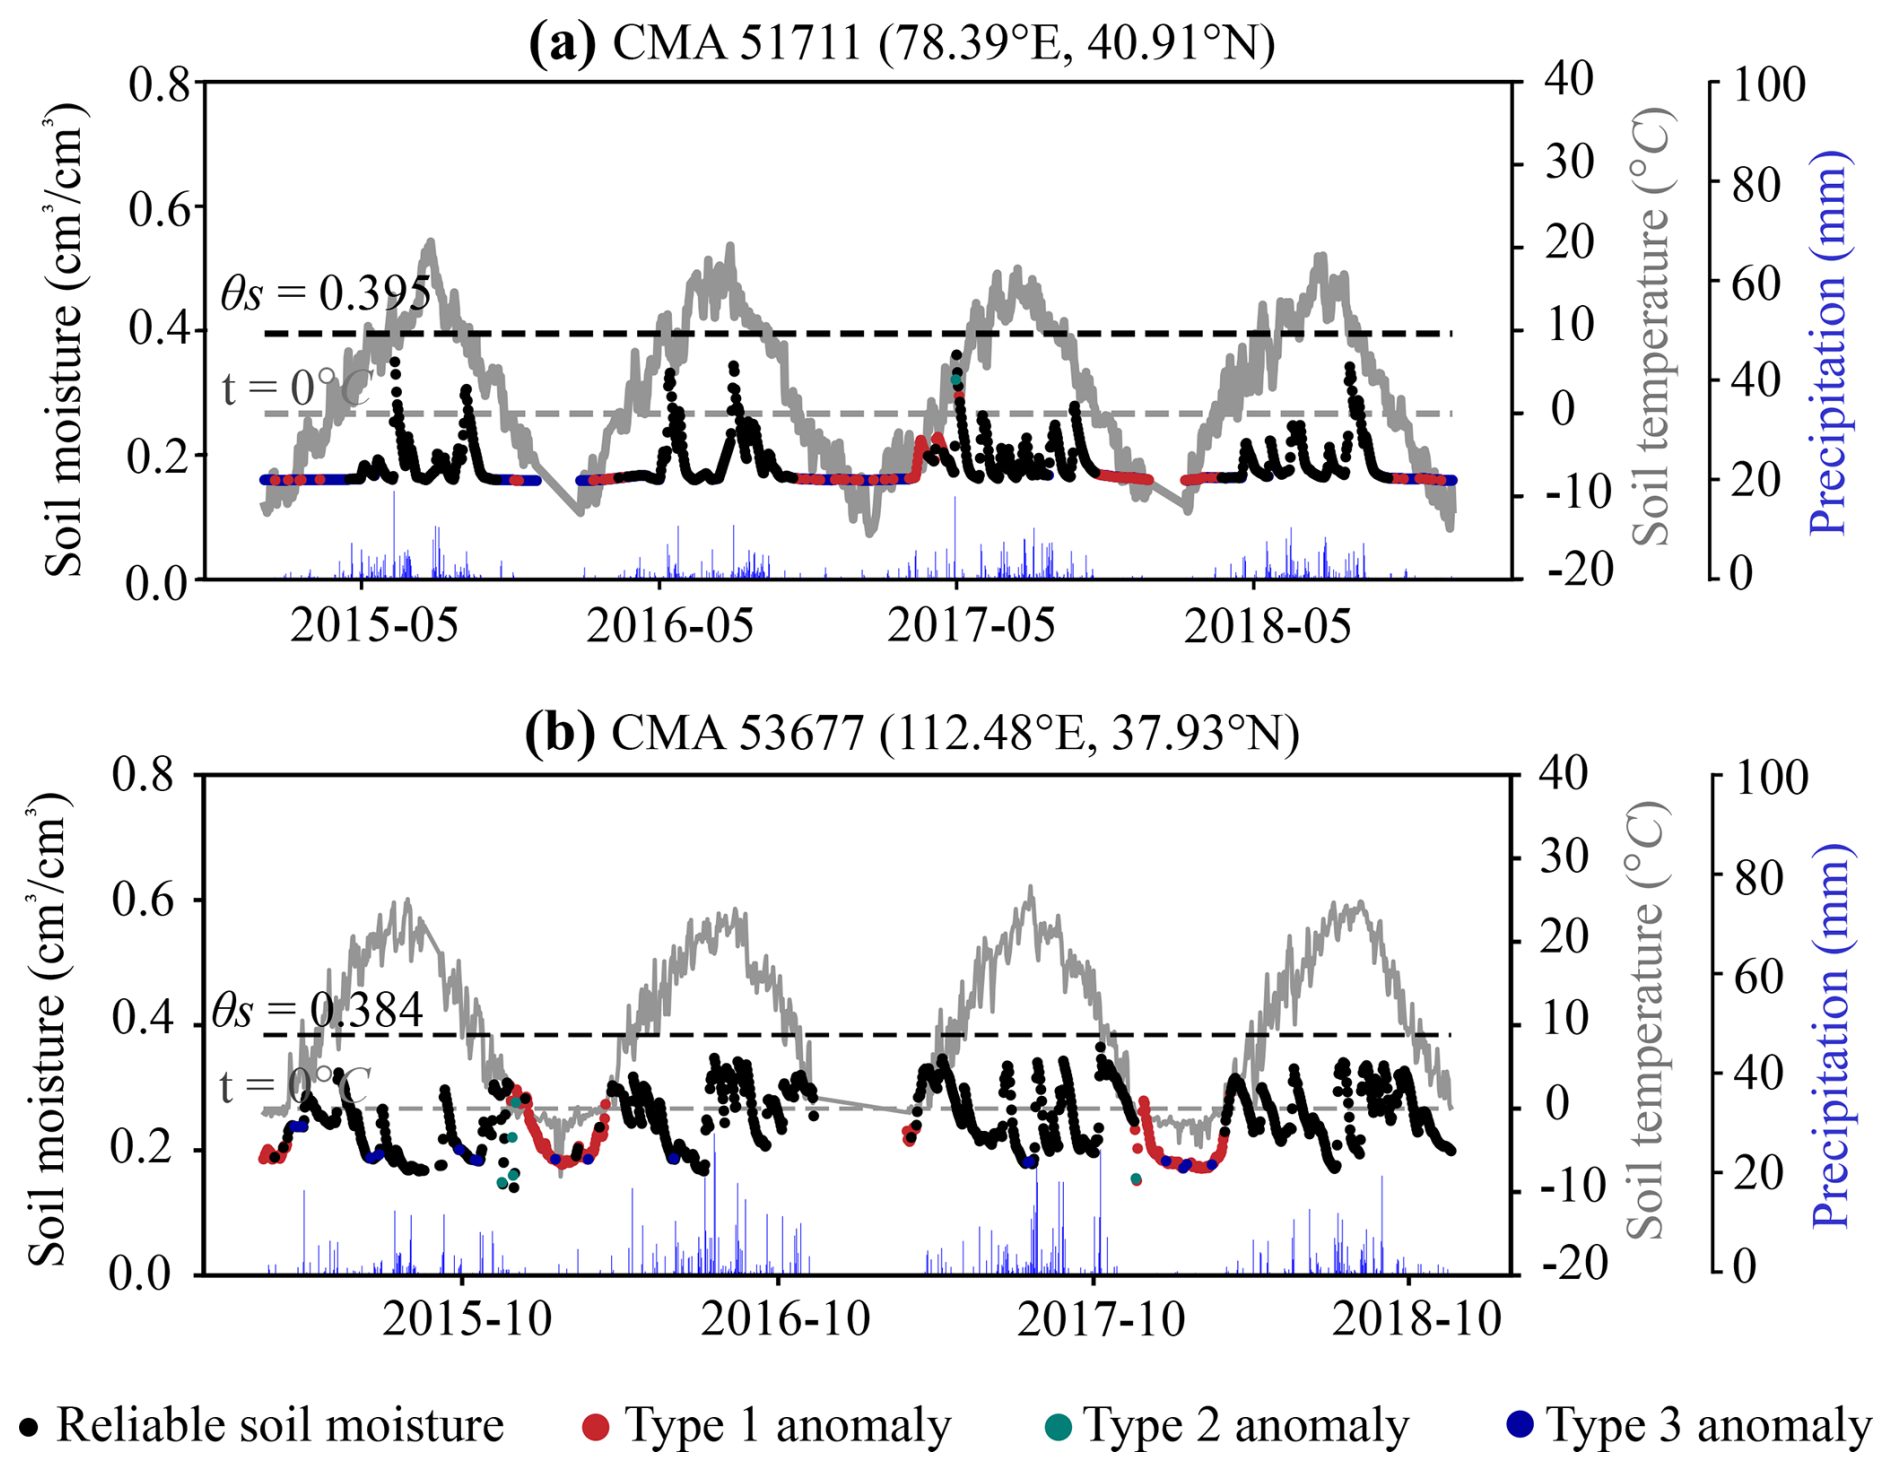
Figure 3Anomaly detection of CMA (China Meteorological Administration) stations. Each subplot is a station with the reliable soil moisture data (black dots), Type 1–3 anomalies (colored dots), soil temperature (gray dashed line), precipitation (blue bars), and saturated moisture content θs value (black dashed line).
The Cemaden dataset also lacks standardized and unified quality control. Here, following the CMA approach, we also conducted range anomaly (Type 1 anomaly) and fluctuation anomaly (Type 2 anomaly) detection. Constant anomaly detection (Type 3 anomaly) was not performed, as Cemaden stations are concentrated in arid areas, and therefore, low soil moisture values (θ< 0.02 cm3 cm−3) with minimal fluctuations are rather typical.
The COSMOS-Europe and SONTE-China datasets had already rigorous data collection and quality control protocols (Bogena et al., 2022; Wang et al., 2023) prior publishing. COSMOS-Europe provides integrated soil moisture over variable effective depths and footprints (130–240 m radius), which may differ from the 0–10 cm point-scale focus of this study but was included for its high-quality intermediate-scale representation. Therefore, only the provided quality flags were used to filter out anomalies and to remove stations with limited data availability.
2.3 Fusion Data and Method
2.3.1 Selection Rationale for Soil Moisture Products in Fusion
The selection of soil moisture products in fusion was driven by validation against in situ observation networks using 1615 stations. Findings from prior studies on the strengths of these products provided initial insights but requires specific assessment in this study due to differences in dataset versions used (e.g., ESA-CCI v09.1 in this study vs. v06.1 in earlier studies), in situ station distributions, and study areas.
Based on these considerations and prior studies (Reichle et al., 2019; Muñoz-Sabater et al., 2021), ERA5-Land and SMAP L4 were preliminarily selected for their potential complementary strengths, with ERA5-Land offering a long time series, high correlation with in situ data with correlation coefficient of 0.69, and extensive spatial coverage, while SMAP L4 providing low bias and high accuracy as evidenced by the lowest RMSE values, though spatial variations exist, as detailed in Sect. 3. SMAP L4 was chosen as the reference for adjustment due to its basis in satellite observations, which generally results in lower biases compared to reanalysis products such as ERA5-Land that relies on model simulations optimized with meteorological data but lack direct soil moisture observations (Reichle et al., 2019; Muñoz-Sabater et al., 2021; Li et al., 2022; Zhang et al., 2021b). Although these complementary strengths of ERA5-Land and SMAP L4 are reported as global averages in the literature, spatial differences exist, varying across diverse geographical regions and climatic zones, as confirmed by our regionally differentiated validation. ESA-CCI was avoided due to its significant spatiotemporal gaps with more than 20 % globally, especially in tropical and vegetated regions, which complicate temporal alignment and introduce biases during interpolation, making it unsuitable for robust fusion. ESA-CCI was included in the evaluation as a comprehensive benchmark, given its status as a widely recognized global soil moisture product with long temporal coverage and multi-sensor integration, which enables meaningful comparisons despite its known data gaps. These gaps were then explicitly accounted for in our analysis in Sect. 3.3.
The final selection rationale for soil moisture products in fusion was validated by results presented in Sect. 3.
2.3.2 Mean-variance Rescaling Method
To generate a fused soil moisture product that combines ERA5-Land's long time series, high correlation, and high coverage with SMAP L4's low bias and high quality dataset, a mapping model from ERA5-Land to SMAP L4 was developed using the mean-variance rescaling method (Zheng et al. 2023). As discussed previously, this method was selected for its simplicity, explicit tuning parameters, and adaptability to long time-series data, ensuring consistent statistical alignment between datasets while addressing trade-offs in computational demand and flexibility compared to alternatives such as CDF matching or triple collocation. The spatial resolutions of ERA5-Land and SMAP L4 datasets are 0.1° and 9 km, respectively. To ensure spatial consistency with ERA5-Land, SMAP L4 data were reprojected to the WGS84 geographic coordinate system and resampled to 0.1° resolution, converting from length units (km) to angular units (degrees). This alignment was critical for enabling direct comparison and fusion of the two datasets at a uniform spatial scale. The mean-variance rescaling method was then applied to adjust the ERA5-Land data to match the statistical properties of SMAP L4. The adjustment procedure was as follows:
-
For each 0.1° grid cell with overlapping ERA5-Land and SMAP L4 data, time series data over the study period (2015–2020) were extracted. This period was selected to prioritize the evaluation of the proposed method while balancing computational cost. To focus on the overall temporal trends and reduce noise from daily variations, the soil moisture time series were aggregated to a monthly scale, denoted as smERA5-Land and smSMAP L4, respectively.
-
The mean and variance of each time series were calculated and represented as E(smERA5-Land), Var(smERA5-Land), E(smSMAP L4), and Var(smSMAP L4), where E and Var represent expectation and variance, respectively.
-
The ERA5-Land dataset was adjusted to match the mean and variance of the SMAP L4 by using a mean-variance rescaling approach proposed by Zheng et al. (2023), implemented as follows:
where smadjusted_ERA5-Land denotes the ERA5-Land data series after adjustment, m and n are the adjustment parameters, both of which are calculated based on the expectation E and variance Var of ERA5-Land and SMAP L4 dataset by:
If SMAP L4 data was missing for a grid cell, m was assigned to 1 and n to 0, indicating that ERA5-Land data was used to fill this grid cell.
-
Iterate over all land grid cells to repeat Steps 1–3, generating global maps of m and n, as shown in Fig. 4.
-
The global m and n maps were applied to the original ERA5-Land data using Eq. (1), producing the final adjusted ERA5-Land dataset.
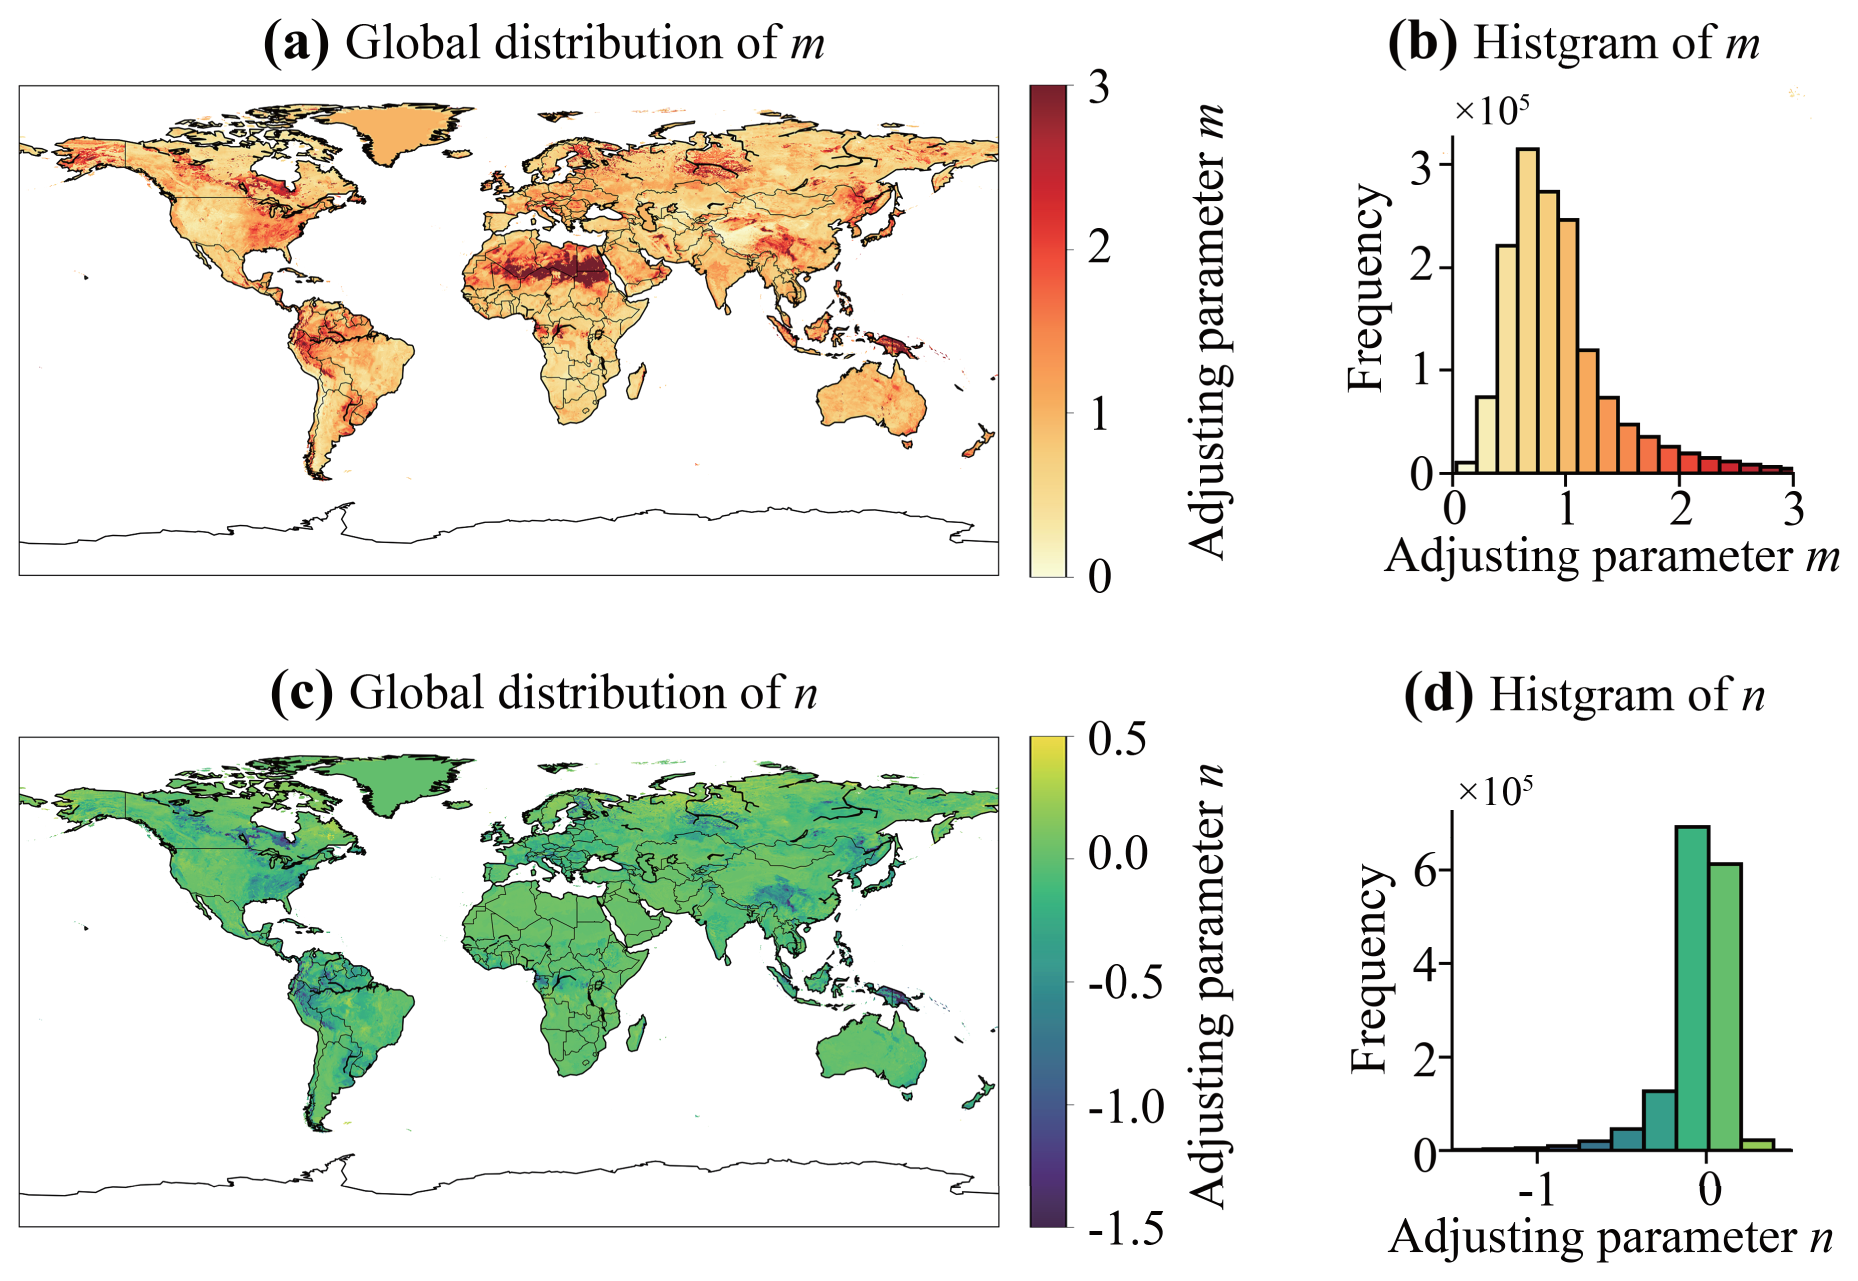
Figure 4Global maps of mean-variance adjustment parameters m and n used to adjust ERA5-Land dataset for SMAP L4 fusion, with histograms showing the frequency distribution of the parameters.
To extend the temporal coverage of the soil moisture product, the scaling coefficients were derived using a single, continuous reference period from April 2015 (marking the start of SMAP L4 data availability) to October 2025 and subsequently applied to adjust the ERA5-Land soil moisture data from 1950 to October 2025, thereby generating a continuous adjusted ERA5-Land dataset spanning 1950 to October 2025. To further justify the backward extension of the adjusted ERA5-Land soil moisture dataset and to ensure that the derived scaling coefficients remain valid under historical climatological conditions, two complementary assessments were conducted as follows:
-
Historical Validation: We conducted evaluations using ISMN soil moisture observations spanning 1960–March 2015 to assess the performance of the adjusted ERA5-Land dataset relative to the original ERA5-Land product. ISMN was used exclusively for this analysis because it is the only network with sufficient historical records dating back to the mid-20th century; other networks used in the main analysis (CMA, Cemaden, SONTE-China, and COSMOS-Europe) lack adequate coverage during this historical period. Due to the extremely sparse station availability prior to 1970, statistical evaluation metrics were calculated for the period 1970–March 2015 only. While the adjusted product extends back to 1950, and limited ISMN records are available for the 1960s, these early records were insufficient for robust and meaningful evaluation.
-
Assessment of Parameter Stability under Contrasting Climatic Conditions: We examined the sensitivity of the adjustment parameters (m and n) in the mean-variance rescaling method to varying climatic conditions. To this end, we identified the three wettest and three driest years during the SMAP L4 availability period (2015–2025) based on global annual mean soil moisture levels. The adjustment parameters were then calculated and compared for these contrasting conditions to ensure that the coefficients remain statistically stable and robust against interannual climate variability (detailed results are discussed in Sect. 3.3.4).
2.4 Evaluation Metrics
To comprehensively evaluate the soil moisture products, four quantitative metrics were employed, i.e., Pearson's correlation coefficient (r), root mean square error (RMSE), Bias, and normalized Nash coefficient (NNSE). These metrics assess the performance of each product against in situ data. The NNSE, derived from the Nash coefficient (NSE), addresses limitations as noted by Nossent and Bauwens (2012) who highlighted that traditional NSE can yield small negative values when model simulations are poor, skewing the overall mean and hindering comparative analysis. To mitigate this, NNSE was use instead, which ranges between 0 to 1, while preserving the main characteristics of NSE. The equations for the r, RMSE, Bias, and NNSE are given as:
where N is the total number of soi moisture measurements, oi denotes the in situ soil moisture measurement, si denotes the simulated or product soil moisture, and are the means of in situ and simulated/product soil moisture, respectively, calculated as:
3.1 Performance of Adjusted ERA5-Land Dataset
To fuse the strengths of ERA5-Land and SMAP L4, the mean and variance of ERA5-Land were adjusted grid-by-grid using SMAP L4 as the reference dataset, as already described. In the following, the outcome of the adjustment of the ERA-5-Land was evaluated through three key perspectives such as temporal trends, overall dataset performance, and spatial distribution.
To assess the temporal performance, the ERA5-Land before and after the adjustment were both analyzed via time series analysis at representative grid points from April 2015 to December 2020, because SMAP L4 data are available only from April 2015 onwards. Figures 5a-d, using exemplary grids, showed that at (−121.0, 42.1), original ERA5-Land consistently overestimated peak soil moisture values compared to SMAP L4. At the grids (14.5, 61.4) and (91.7, 39.2), ERA5-Land displayed a consistent tendency toward underestimation, while at (121.3, 63.8) it exhibited a pronounced overestimation. These location-specific biases across different geographical locations highlight the need for grid-by-grid adjustment. After implementing the adjustment, the adjusted ERA5-Land data at each location demonstrated substantial improvement in alignment with SMAP L4. For example at grid (91.7, 39.2), the adjusted ERA5-Land time series achieved a strong correspondence with SMAP L4, accurately capturing the amplitude of seasonal peaks and troughs, demonstrating the method's ability to mitigate biases and enhance temporal consistency.
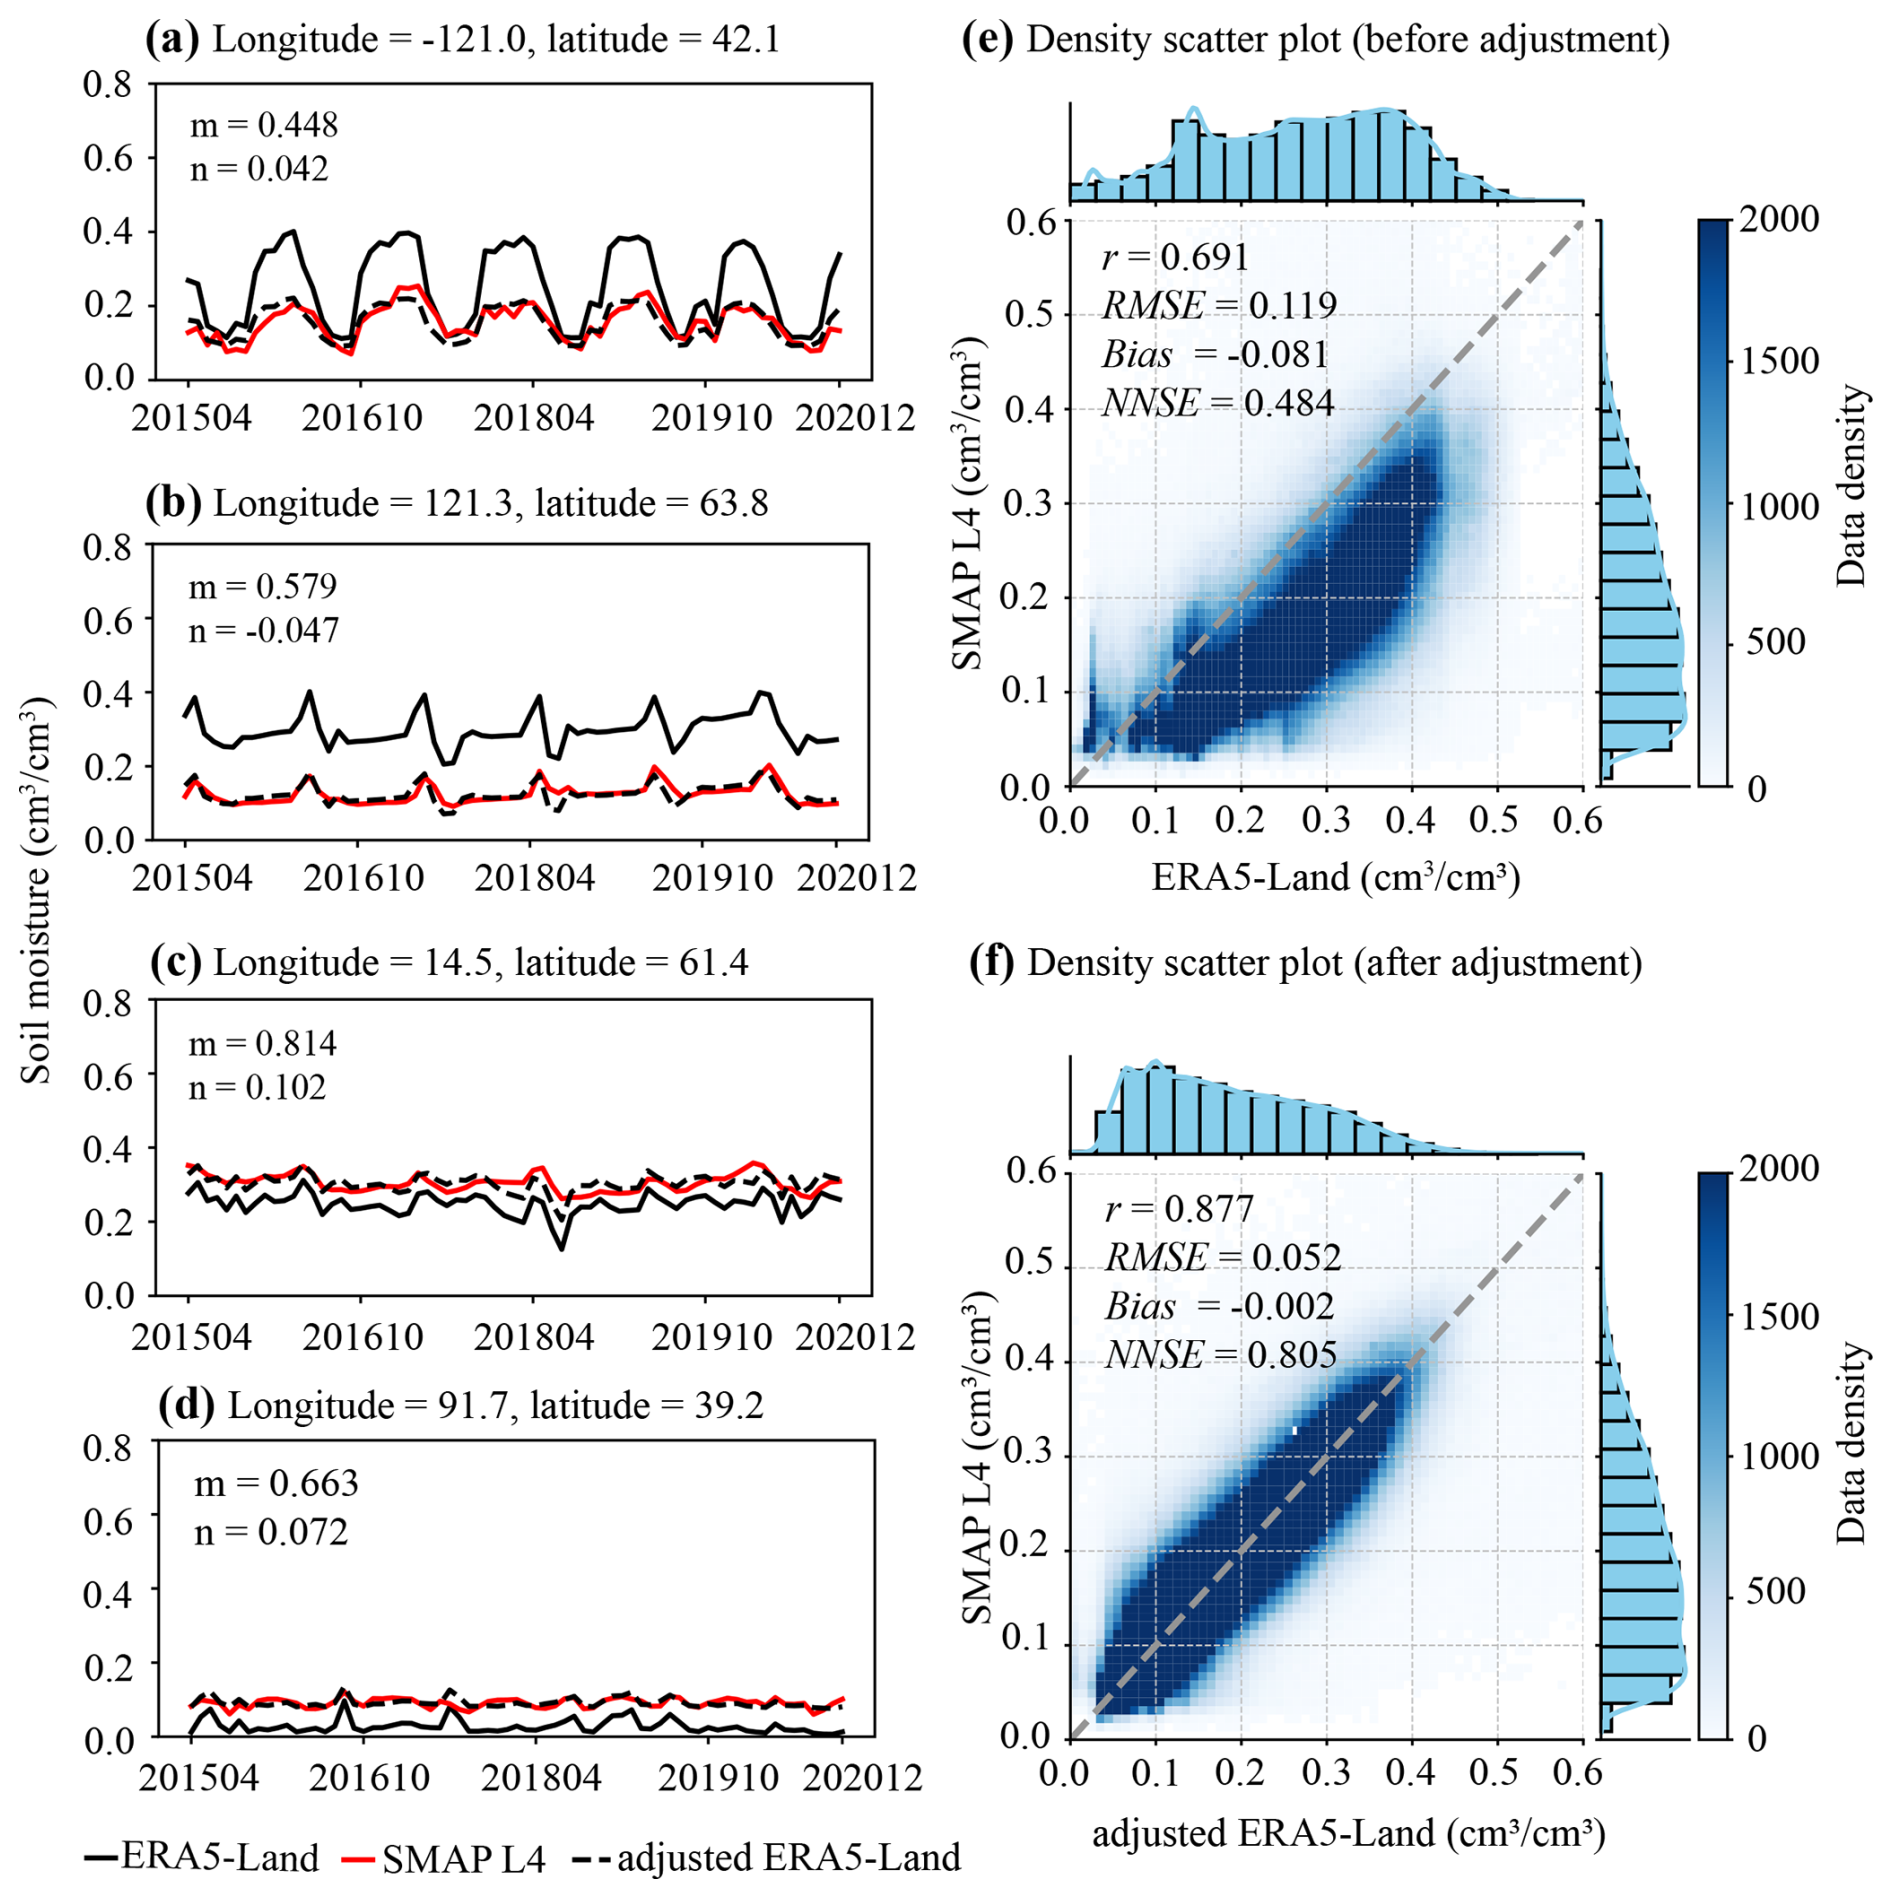
Figure 5ERA5-Land adjustments at (a–d) typical grids and the density scatter plots comparing ERA5-Land (e) before and (f) after the adjustment with SMAP L4 for the 2015–2020 period dataset. Panels (a)–(d) show time series at coordinates (−121.0, 42.1; 91.7, 39.2; 14.5, 61.4; 121.3, 63.8), with original ERA5-Land (black line), SMAP L4 (red line), and adjusted ERA5-Land (black dashed line). m and n are the adjustment parameters. Panels (e)–(f) include the 1:1 line (gray dashed), fitted line (red dashed), and evaluation indices (r, NNSE, RMSE, and Bias).
Turning to the overall dataset performance, statistical evaluation substantiated the effectiveness of the adjustment shown in Fig. 5e–f. Original ERA5-Land showed a correlation with SMAP L4 (r= 0.69, RMSE = 0.12 cm3 cm−3, Bias = −0.08 cm3 cm−3, and NNSE = 0.48). After adjustment, r increased to 0.88, RMSE decreased to 0.05 cm3 cm−3, Bias reduced to −0.002 cm3 cm−3, and NNSE rose to 0.81. Density scatter plots revealed tighter clustering along the 1:1 line, confirming reduced systematic biases and improved statistical reliability. These results demonstrate that the adjustment method enhances the accuracy and reliability of ERA5-Land across diverse climates.
To further analyze the spatial distribution characteristics, global soil moisture maps from different datasets on 1 January 2016 were selected as examples for comparison, as shown in Fig. 6. Before adjustment, the overall spatial distribution patterns of ERA5-Land and SMAP L4 soil moisture products displayed general similarities, as depicted in Fig. 6a and b, reflecting comparable trends at the large scale. However, notable regional differences were observed, particularly across the South American continent, the western part regions of the United States, central China, and also the central part of African continent. These discrepancies highlight inconsistencies between the datasets in capturing soil moisture dynamics across specific climatic and geographical zones. After implementing the adjustment, the adjusted ERA5-Land dataset exhibited significantly improved spatial agreement with SMAP L4, as evidenced by the spatial distribution of moisture maps shown in Fig. 6b and c, alongside an enhanced correlation coefficient (r) of 0.877, compared to the original correlation coefficient (r) of 0.691 between ERA5-Land and SMAP L4, as shown in Fig. 5. The difference maps, presented in Fig. 6f, illustrate the spatial differences between the adjusted ERA5-Land and SMAP L4 dataset, indicating that most regions show differences within −0.1 to 0.1 cm3 cm−3, with approximately 85 % falling within the range between −0.05 to 0.05 cm3 cm−3. Notably, regions with previously larger discrepancies demonstrated substantial improvements after the adjustment.
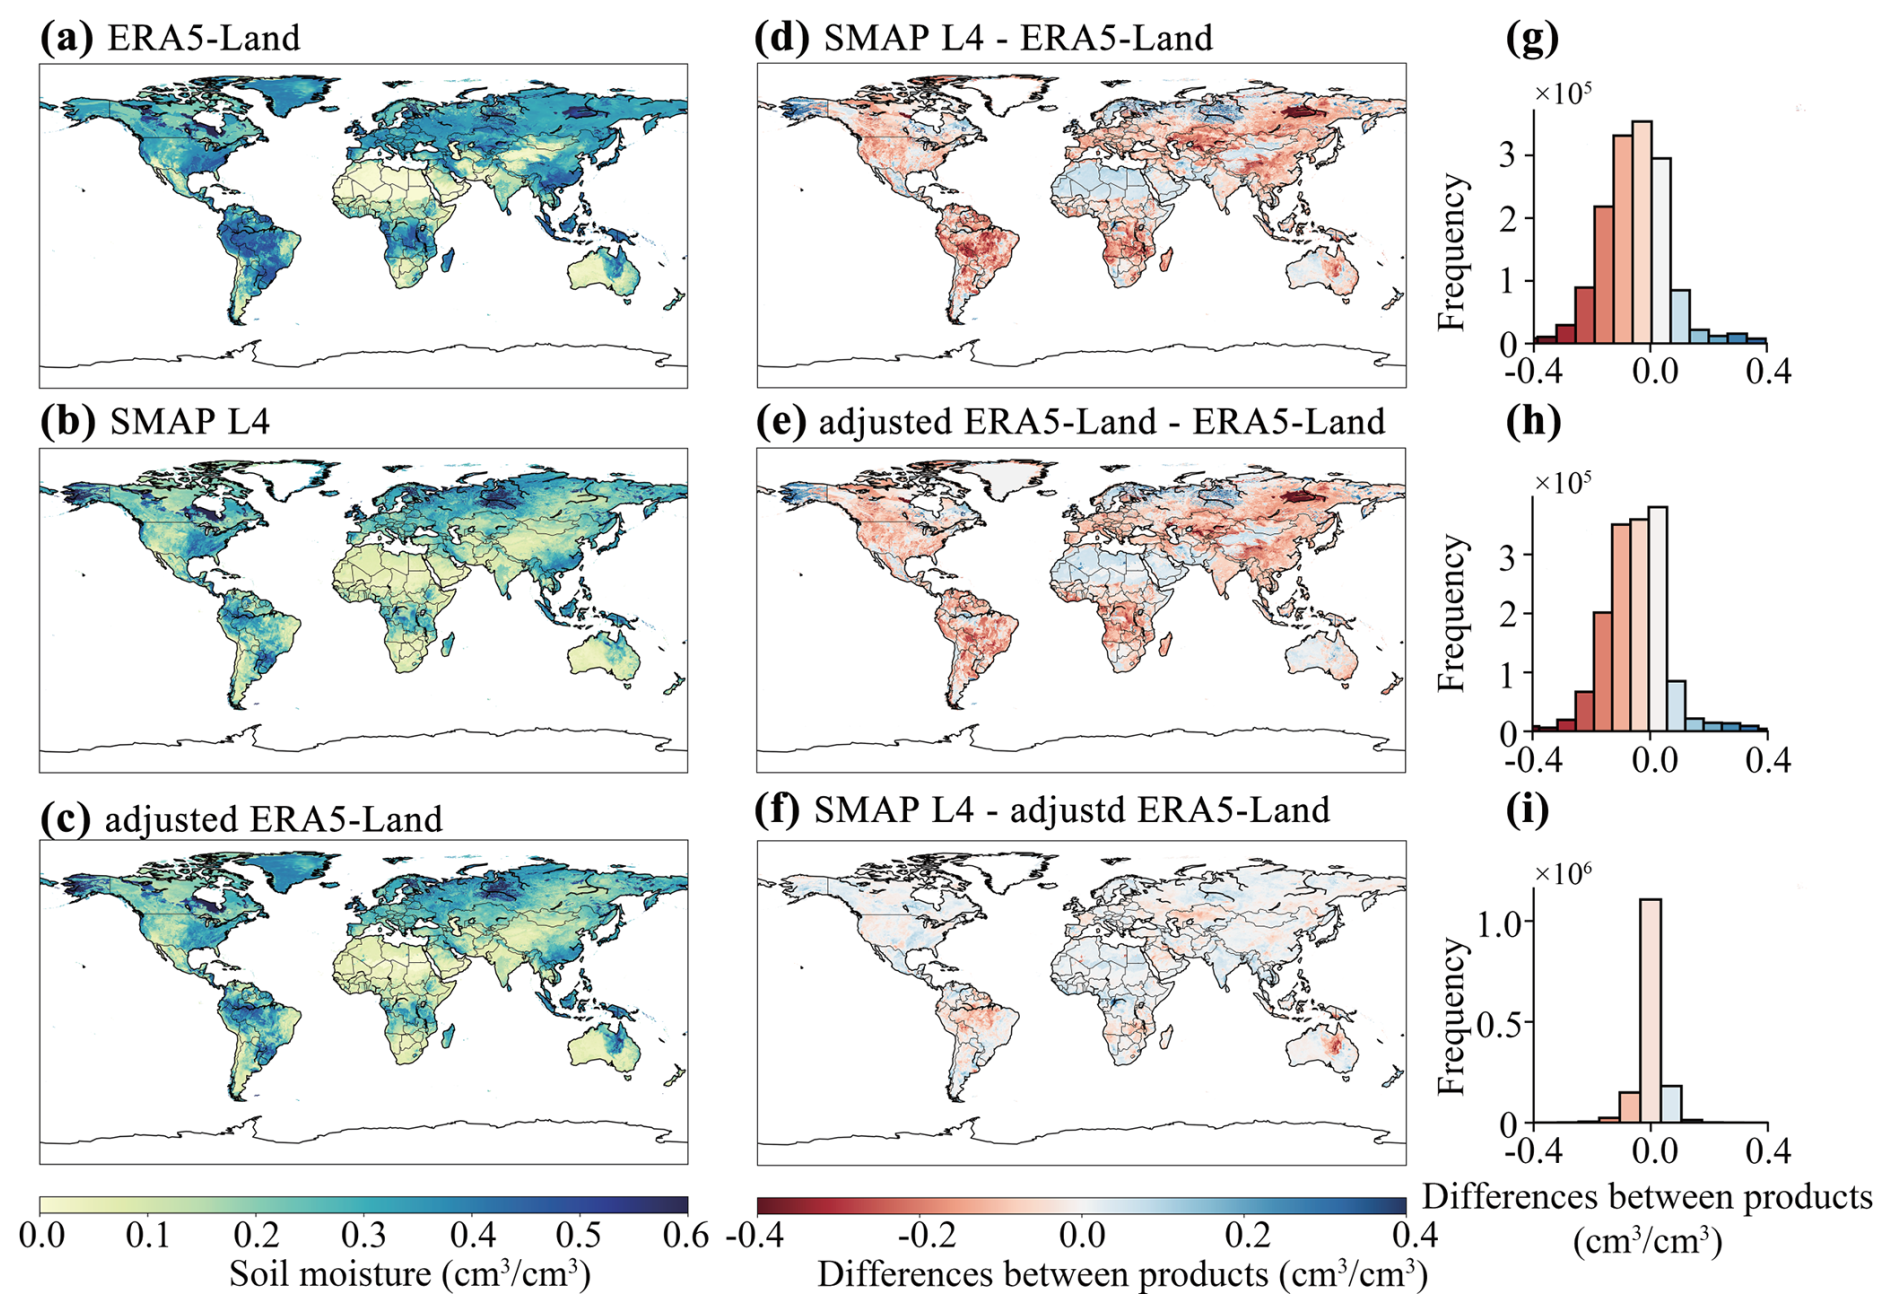
Figure 6Spatial distribution of moisture dataset for an example date (1 January 2016) and corresponding frequency distributions. (a)–(c) represent the spatial distributions of ERA5-Land, SMAP L4, and adjusted ERA5-Land, respectively. (d)–(f) show the spatial distributions of differences between (d) SMAP L4 minus ERA5-Land, (e) adjusted ERA5-Land minus ERA5-Land, and (f) SMAP L4 minus adjusted ERA5-Land. (g)–(i) provide frequency distributions corresponding to panels (d), (e), and (f), respectively.
These findings validate the effectiveness and reliability of the adjustment strategy employed in this study. By aligning the statistical properties of ERA5-Land with those of SMAP L4 on a grid-by-grid basis, the approach not only reduces the biases of ERA5-Land relative to SMAP L4 dataset, but also enhances the comparability and consistency of the dataset.
3.2 Spatiotemporal Coverage of Soil Moisture Products
Although the four soil moisture products differ in spatial resolution (9 km for SMAP L4, 0.25° for ESA-CCI, and 0.1° for both ERA5-Land and adjusted ERA5-Land datasets), they all share a uniform grid-based data format. Therefore, the spatial coverage of the soil moisture among the four products can be directly compared. Due to the unavailability of SMAP L4 starting 1 April 2015, the year 2016 was chosen as the reference. The first days of January, April, July, and October in 2016 are selected as representative dates for analyzing the global spatial distribution of soil moisture in Fig. 7, where the spatial coverage of the four soil moisture products are depicted. Evidently, not all products provide seamless global spatial coverage. ERA5-Land and its adjusted version stand out with the highest spatial coverage, achieving global data. ESA-CCI, on the other hand, shows the most extensive soil moisture data gaps across all four selected dates, with missing areas varying between seasons, whereby the coverage was smaller in winter and larger in summer. According to Zheng et al. (2023), the proportion of daily missing data in ESA-CCI ranged from 21.8 % to 94.9 % between 2000 and 2020, with an average of 58.2 %. Even after 2007, with the increase in available satellite data, the smallest proportion of missing data area relative to the global land area (excluding Antarctica) still reached 21.8 %. These gaps primarily result from unstable satellite coverage, challenges in data retrieval under specific conditions (e.g., dense vegetation, frozen soil, or snow), and rigorous quality control (Babaeian et al., 2019; Dorigo et al., 2017; Li et al., 2021b; Mu et al., 2022). Such issues may lead to spatial and temporal data discontinuities, introduce biases, and undermine the reliability of the fusion outcomes (Li et al., 2021b; Zhang and Zhou, 2016). In contrast, SMAPL4 shows missing data in only a few areas globally, including Greenland and parts of rivers, lakes, and other open-water bodies, with no substantial changes in these areas over time.
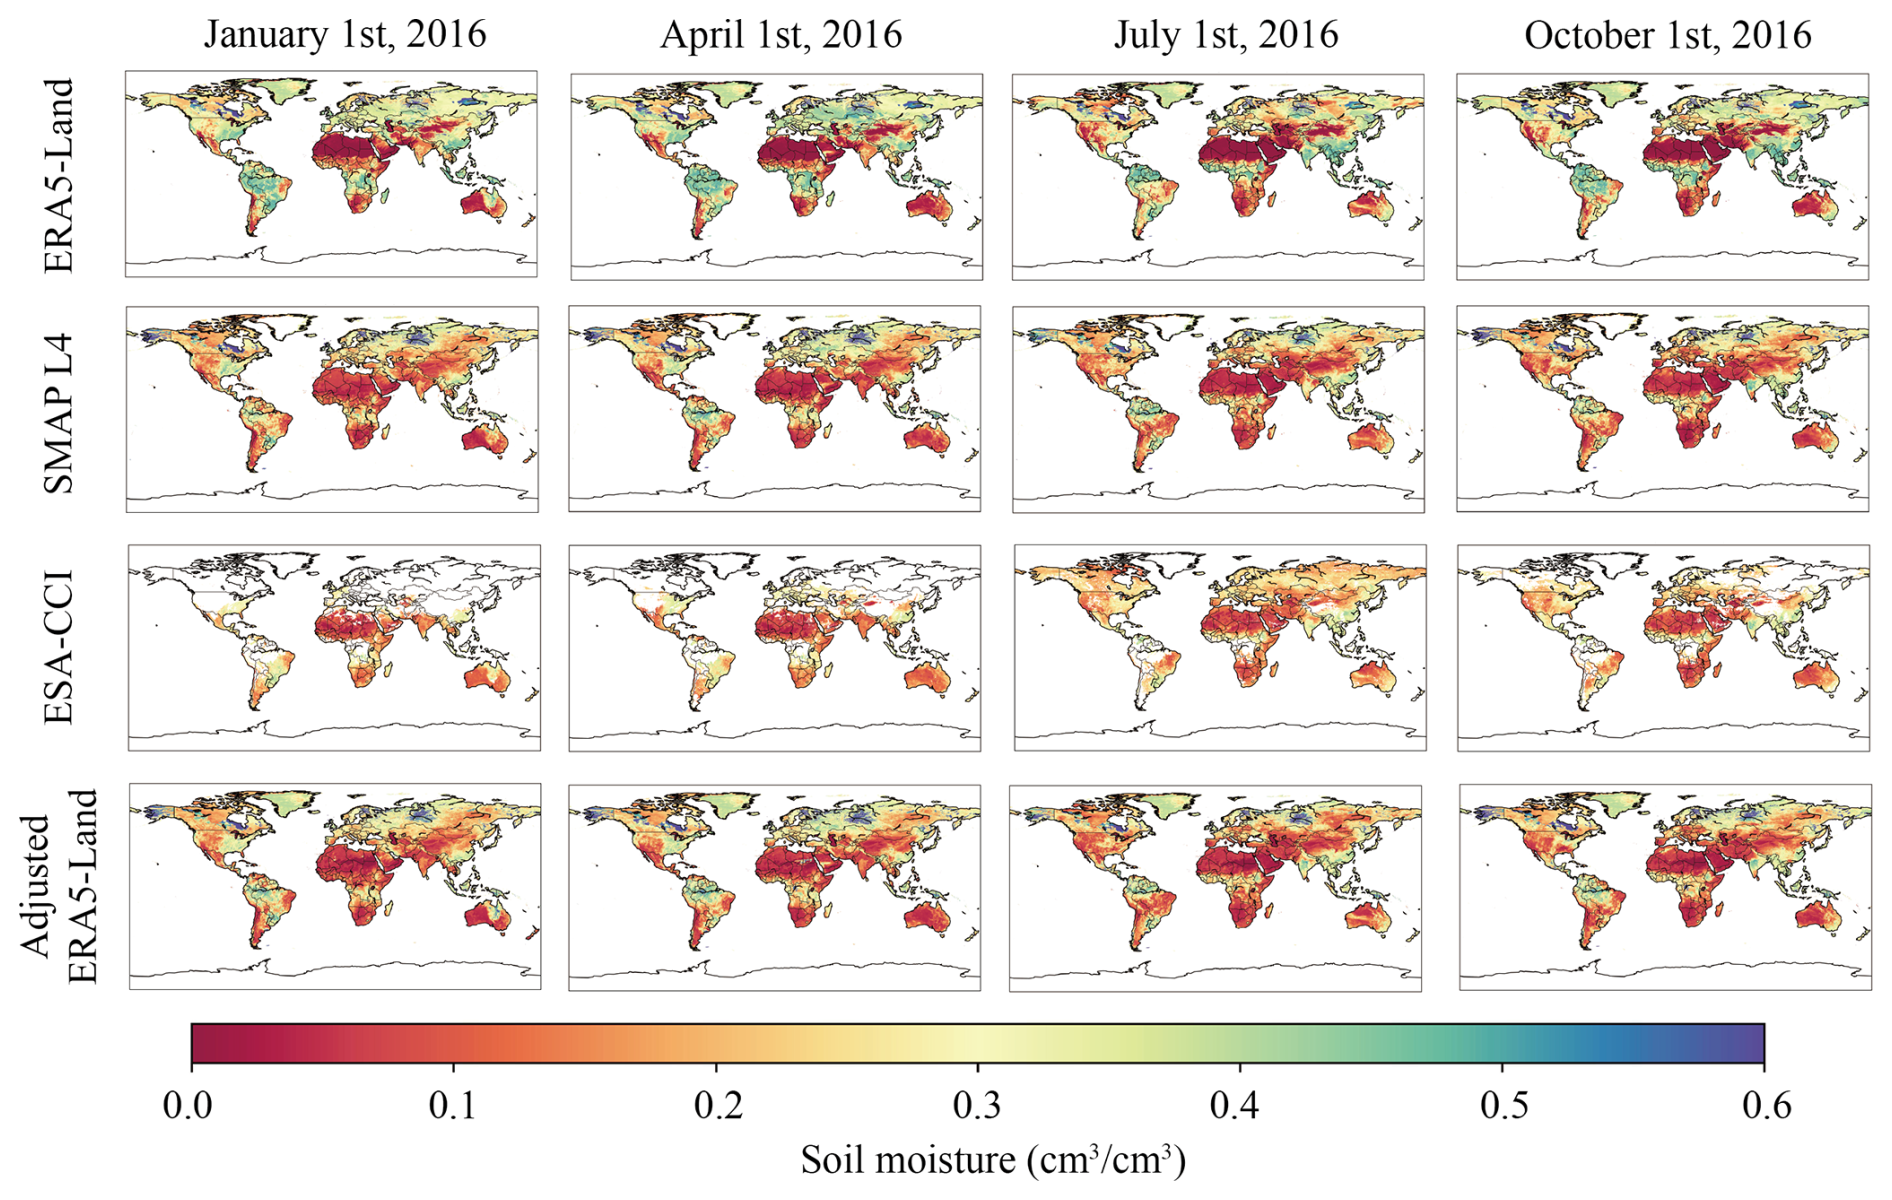
Figure 7Global spatial distribution of soil moisture from four products in different rows: ERA5-Land, SMAP L4, ESA-CCI, and the adjusted ERA5-Land dataset, shown for the first day of January, April, July, and October 2016 in different columns.
Gaps in ESA-CCI are well-documented in high-latitude, densely vegetated, and alpine regions due to microwave sensor limitations (Dorigo et al., 2017; Gruber et al., 2019). Data availability is the highest in temperate regions, such as Europe and parts of the United States, under favorable conditions. In contrast, tropical and semi-arid regions in Africa and South America, crucial for the global hydrological cycle and transpiration (Wang et al., 2017), exhibit substantial seasonal gaps in the moisture dataset.
In a next step, a detailed evaluation of data gaps in ESA-CCI over the period 2015–2020 across 1615 selected observation stations was performed. Given that ERA5-Land and adjusted ERA5-Land datasets exhibit no data gaps and SMAP L4 data is only available after April 2015, which does not fully align with the study period, i.e., 2015–2020, they were therefore not included in the following analysis.
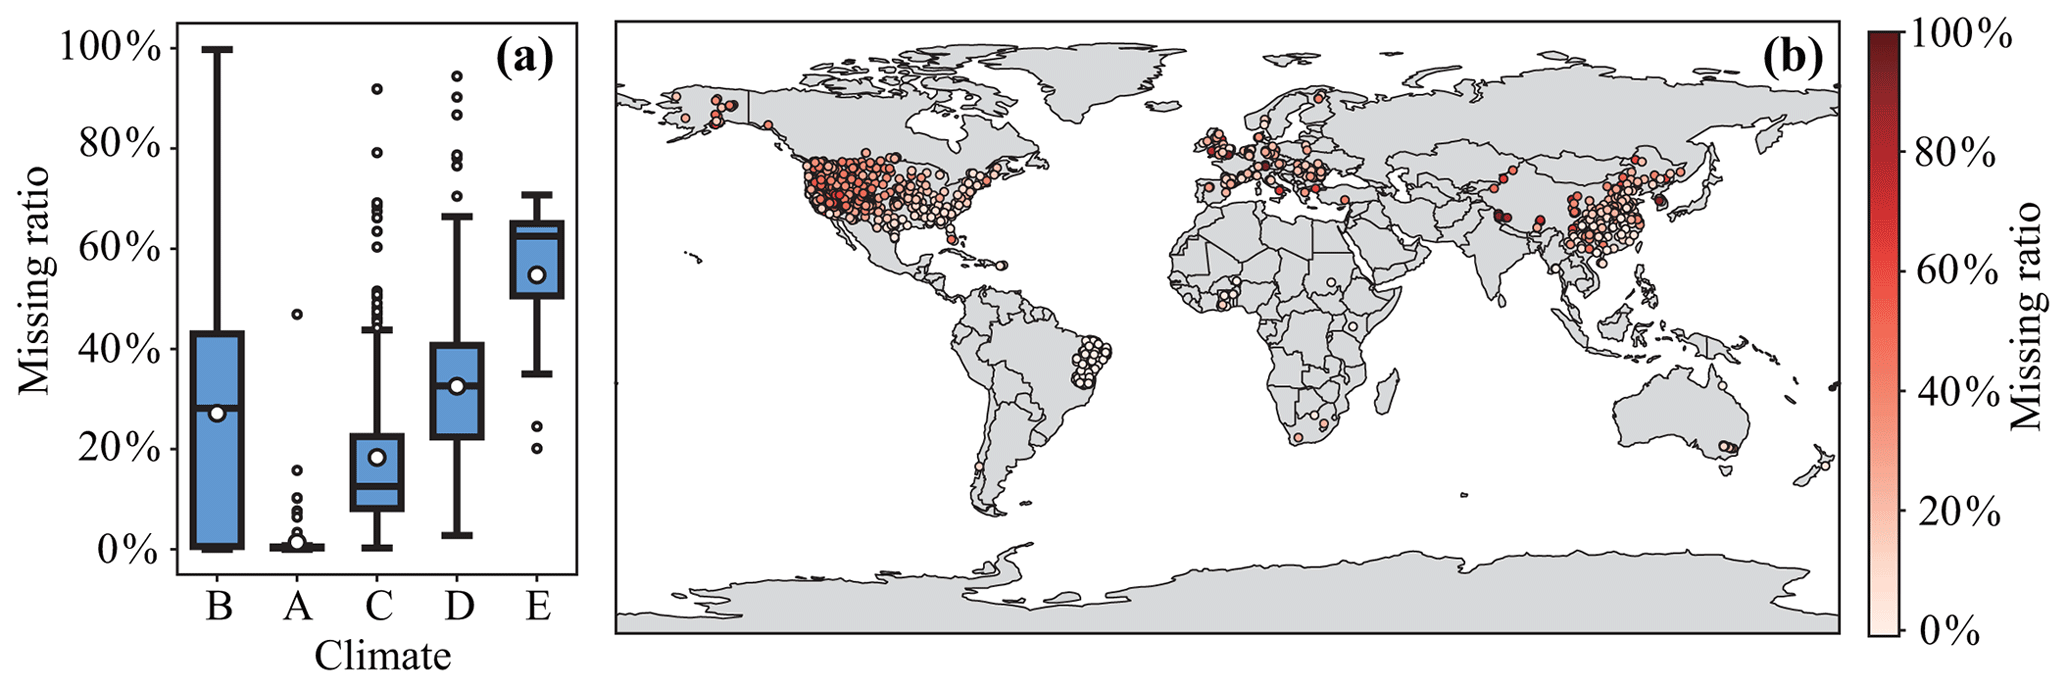
Figure 8The ratio of missing ESA-CCI data at in situ measurement stations, presented for (a) different climate zones and (b) the corresponding global distribution. Climate zones are defined according to the Köppen-Geiger classification taken from Beck et al. (2018) with A (Tropical), B (Arid), C (Temperate), D (Cold), and E (Polar); the “All” category represents an aggregate of all stations. The classification for Zone B is based on precipitation and evaporation criteria, whereas Zones A, C, D, and E are primarily classified based on air temperature. To reflect these thermal distinctions, the zones in panel (a) are ordered from warmest to coldest (A, C, D, and E).
As shown in Fig. 8, ESA-CCI data gaps occur in nearly all Köppen climate zones, indicating that aridity might not be a dominant factor affecting data availability for this soil moisture product. However, when comparing classifications of A, C, D, and E, it becomes evident that the data gaps increase as the temperature of climate zones decrease. Across all 1615 in situ stations, ESA-CCI data gap ratio has a median of 21. 7% and a mean of 24.4 %. Figure 8b further demonstrates a substantial increase in data gaps with rising latitude and altitude, as predominant in the western United States and the Tibetan Plateau, which aligns with the spatial patterns depicted in Fig. 8. Such gaps and inconsistencies may limit its application, which requires continuous and complete coverage in global-scale studies or regions where continuous soil moisture dynamics are critical for understanding climate and hydrological processes.
3.3 Performance of Soil Moisture Products (April 2015–2020)
Based on the analysis presented, it is clear that ESA-CCI has non-negligible data gaps compared to the other three soil moisture products, including ERA5-Land, SMAP L4, and the adjusted ERA5-Land datasets. To ensure consistent comparison and comprehensively evaluation, the performance of the different moisture products were further explored based on the data available in the ESA-CCI dataset. As shown exemplarily for one location of SCAN LovelockNnr station in Nevada, USA, the ESA-CCI data gap are highlighted by a red dashed box in Fig. 9, whereas in situ observational data and the other three soil moisture products provide coverage during the same time period. In the following, we thoroughly explore the data accuracy of each product, compare the overall performance of the four moisture products for data both available and unavailable in the ESA-CCI dataset, analyze the evaluation metrics against the 1615 global in situ measurement stations during the primary validation period (April 2015–2020), and explore their spatial distribution. Finally, we evaluate the metrics across various climate zones, ensuring a thorough assessment of the performance for each product.

Figure 9Data coverage and gaps at a representative station of SCAN LovelockNnr, Nevada, USA, comparing in situ observations with multiple soil moisture products. The time series of in situ soil moisture measurements is depicted as a solid black line, while corresponding estimates from the moisture products are shown as colored dots. Periods with missing data for the ESA-CCI dataset are highlighted by red dashed boxes.
3.3.1 Evaluation of Soil Moisture Products Across ESA-CCI Data Availability Subsets
This section compares ERA5-Land, ESA-CCI, SMAP L4, and the adjusted ERA5-Land with 1615 global in situ stations using a multi-metric evaluation over the primary validation period. To ensure a fair comparison across products, given ESA-CCI's significant data gaps, the data from each station was divided into two subsets: one where ESA-CCI data is available and one where ESA-CCI data is unavailable, as illustrated in Fig. 9. Metrics were computed individually for each subset to account for these gaps and maintain consistency in the evaluation. The combined metrics from all stations are presented in Fig. 10, where results are shown separately for regions with and without available ESA-CCI data. In contrast, Table 1 provides the overall mean and improvement percentages across all stations without differentiating ESA-CCI data availability, highlighting the general performance of each product.
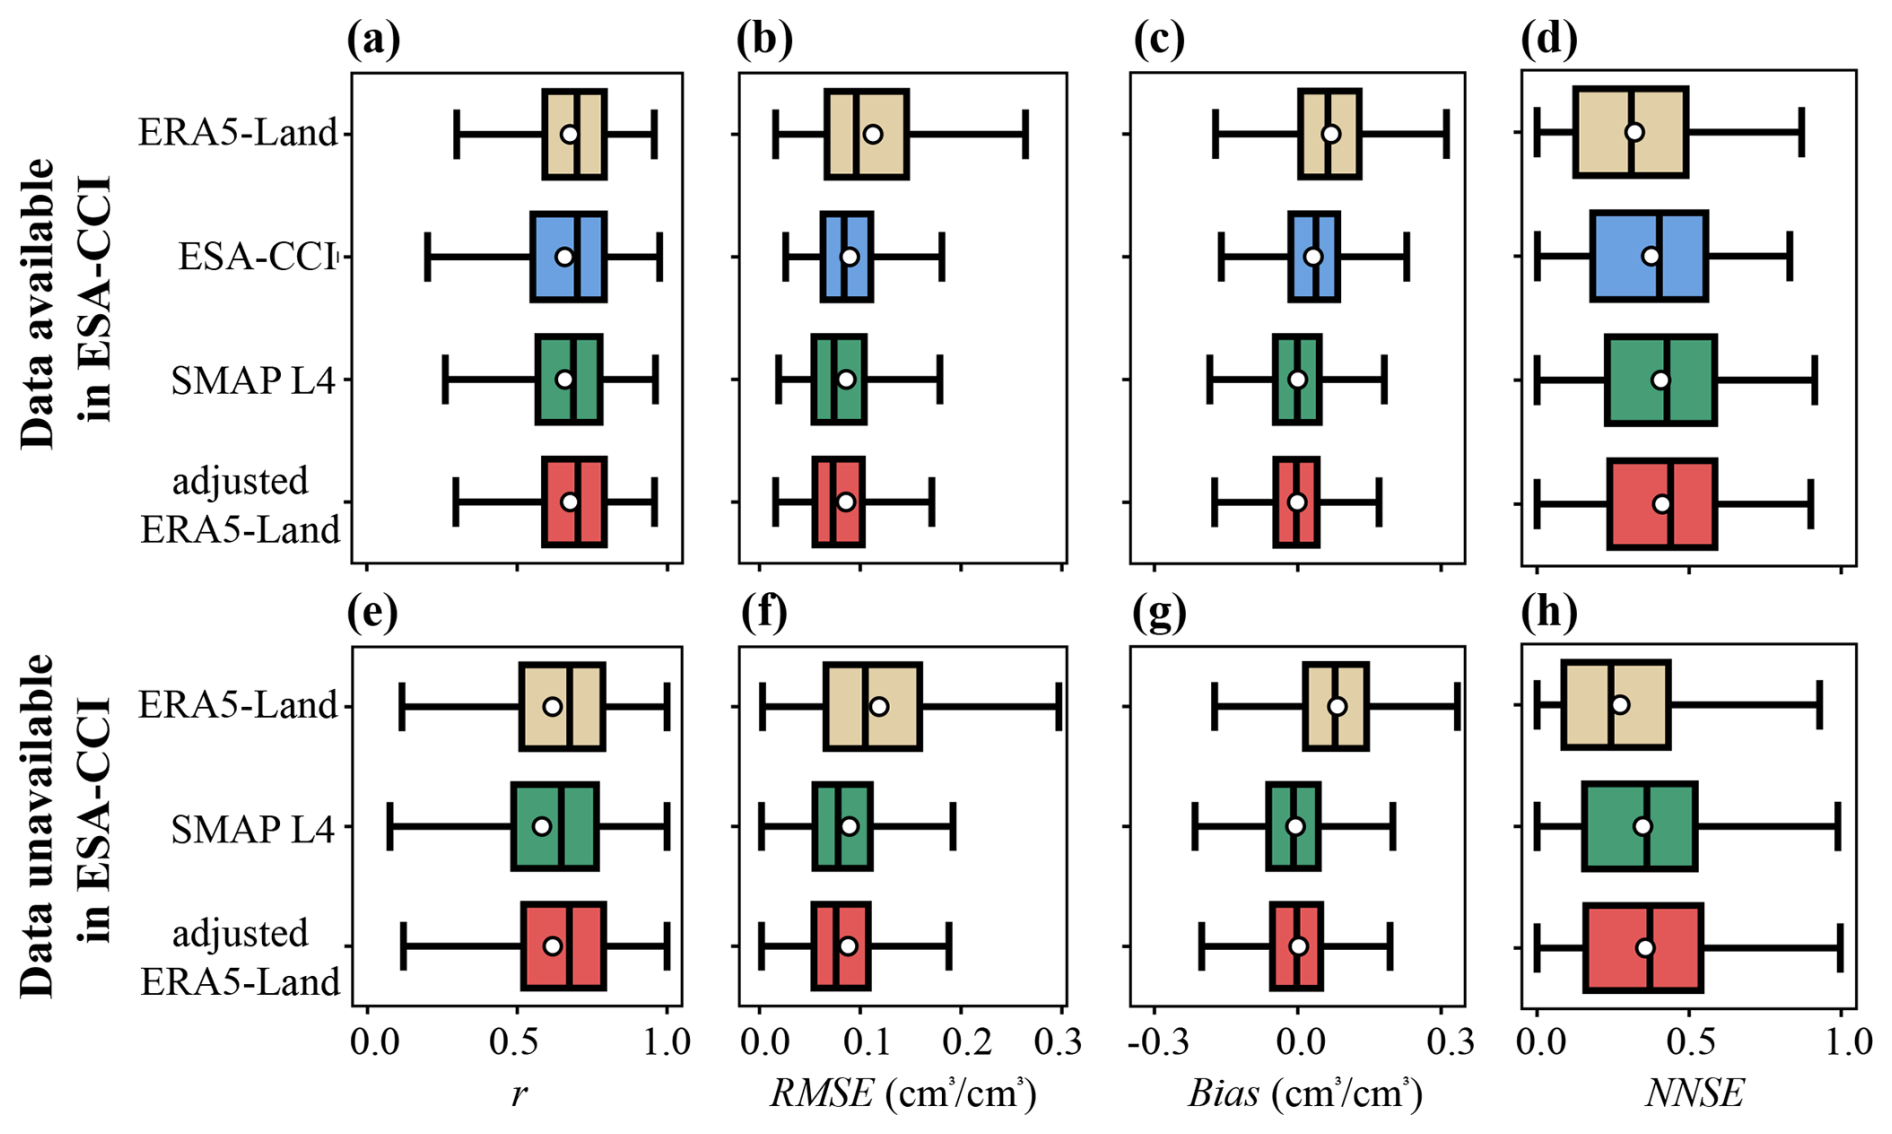
Figure 10Evaluation of soil moisture products using performance metrics aggregated across all measurement stations. The columns present the results for four metrics: the Pearson correlation coefficient r, RMSE, Bias, and the NNSE. The analysis is stratified into two data subsets with the upper panel showing the metric values for periods when ESA-CCI data are available, while the lower panel indicating the periods when ESA-CCI data are unavailable.
Table 1Mean values for evaluation metrics of the four soil moisture products compared against the in situ measurements during the primary validation period. Bold data in the table represent the best performance results among the products for each metric.
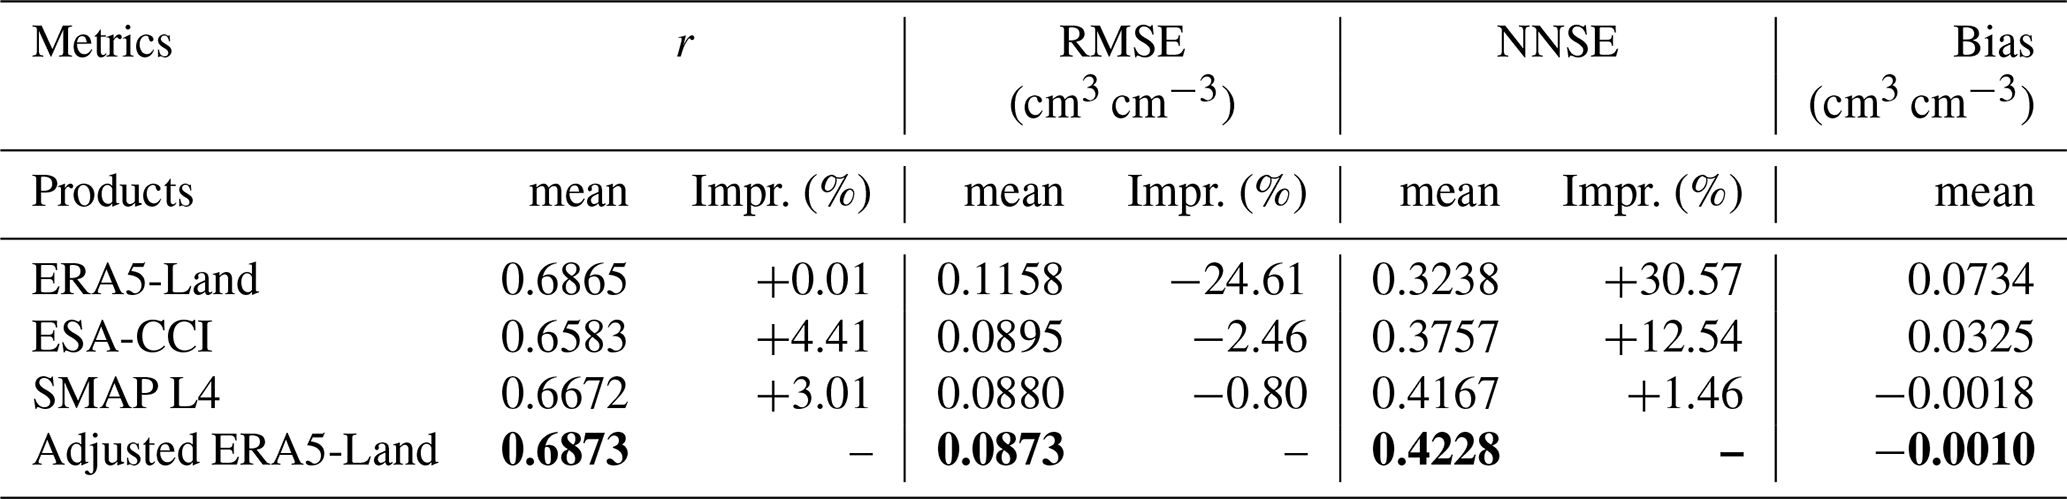
ERA5-Land and adjusted ERA5-Land showed improved correlation coefficients (r) compared to SMAP L4 and ESA-CCI. Adjusted ERA5-Land ranks the highest with a mean r of 0.69 and outperforms with a mean RMSE of 0.087 cm3 cm−3 and a mean Bias of −0.001 cm3 cm−3 compared to the other soil moisture products. This suggests, that the adjusted ERA5-Land captures the soil moisture dynamics more effectively and reduces systematic errors efficiently.
Overall, each of the four soil moisture products has its strengths and weaknesses. ESA-CCI data achieves a reasonable RMSE in its areas covered, but it is also the dataset with substantial spatial data gaps. SMAP L4 excels not only in RMSE and NNSE values but also in bias control and shows stability across regions, though it is less effective in dynamic correlation in terms of r values. ERA5-Land, with its high temporal resolution and dynamic correlation, is well suited for dynamic monitoring but has lower accuracy and weaker overall performance in terms of the evaluated metrics. Adjusted ERA5-Land integrates the strengths of ERA5-Land and SMAP L4, achieving notable improvements across the performance metrics. Specifically, the adjusted ERA5-Land dataset achieves a mean correlation coefficient (r) of 0.687 (0.01 % improvement over ERA5-Land, 3.01 % over SMAP L4, and 4.41 % over ESA-CCI), a mean RMSE of 0.087 cm3 cm−3 (24.61 % reduction compared to ERA5-Land, 0.80 % over SMAP L4, and 2.46 % over ESA-CCI), a mean NNSE of 0.423 (30.57 % improvement over ERA5-Land, 1.46 % over SMAP L4, and 12.54 % over ESA-CCI ), and a mean Bias of −0.001 cm3 cm−3 (closest to zero among all products). These results, particularly the substantial RMSE reduction of 24.6 % and NNSE improvement of 30.6 % relative to the original ERA5-Land, demonstrate the fusion method's effectiveness in enhancing accuracy while preserves or slightly improves correlation compared to SMAP L4. Additionally, to evaluate the product's applicability in human-managed environments such as agricultural regions, where soil moisture dynamics are influenced by irrigation, cropping cycles, and other activities often underrepresented in ERA5-Land, we conducted a targeted comparison at in situ sites in these agricultural areas (accounting for approximately 15 % of all sites). As detailed in Fig. S2, the adjusted ERA5-Land reduces RMSE by about 10 % and improves NNSE from 0.354 to 0.366 compared to the original ERA5-Land, enhancing reliability in these landscapes.
In conclusion, the data fusion approach mitigates the limitations of single datasets by harmonizing the high correlation of the ERA5-Land dataset and the high precision of the SMAP L4 dataset, achieving satisfactory results. However, SMAP L4's inherent accuracy constrains the performance ceiling of adjusted ERA5-Land to some extent. Future research could build upon this product by incorporating ground observations and other high-precision remote sensing datasets to obtain a better product (Li et al., 2021b; Zhang et al., 2023).
3.3.2 Spatial Distribution of Evaluation Results
Figure 11 illustrates the distribution of NNSE for the ERA5-Land, ESA-CCI, SMAP L4, and adjusted ERA5-Land datasets over all 1615 stations, highlighting the variations in soil moisture precision among these products. To further clarify the regional variations obscured by overlapping dots in the global map, enlarged regional maps for North America, Europe, Asia (primarily China), South America (mainly Brazil), and Africa are provided in Figs. S3–S7, offering a detailed view of spatial performance across these continents. The overall median NNSE for ERA5-Land is 0.325, performing reasonably well in North America, Europe, and Asia, but exhibiting lower accuracy in South America and Africa. ESA-CCI has an overall median NNSE of 0.403, which is considerably better than the ERA5-Land dataset, particularly in regions of North America and Europe, yet its performance was also suboptimal in South America, similar to the performance of ERA5-Land. SMAP L4, on the other hand, has a median NNSE value of 0.401, comparable to the overall performance of the ESA-CCI dataset. However, it demonstrates noticeable regional performance differences, which excels in regions over ESA-CCI in North America, Europe, and South America, but shows lower performance in Asia, suggesting a certain level of regional specificity in its applicability. By combing the strengths of ERA5-Land and SMAP L4 dataset, the adjusted ERA5-Land achieves a median NNSE value of 0.416, making it the best-performing product overall. However, because of using the SMAP L4 dataset as its adjustment benchmark, the adjusted ERA5-Land exhibits a regional NNSE distribution similar to SMAP L4, performing strongly in North America, Europe, and South America, yet showing weaker results in Asia.
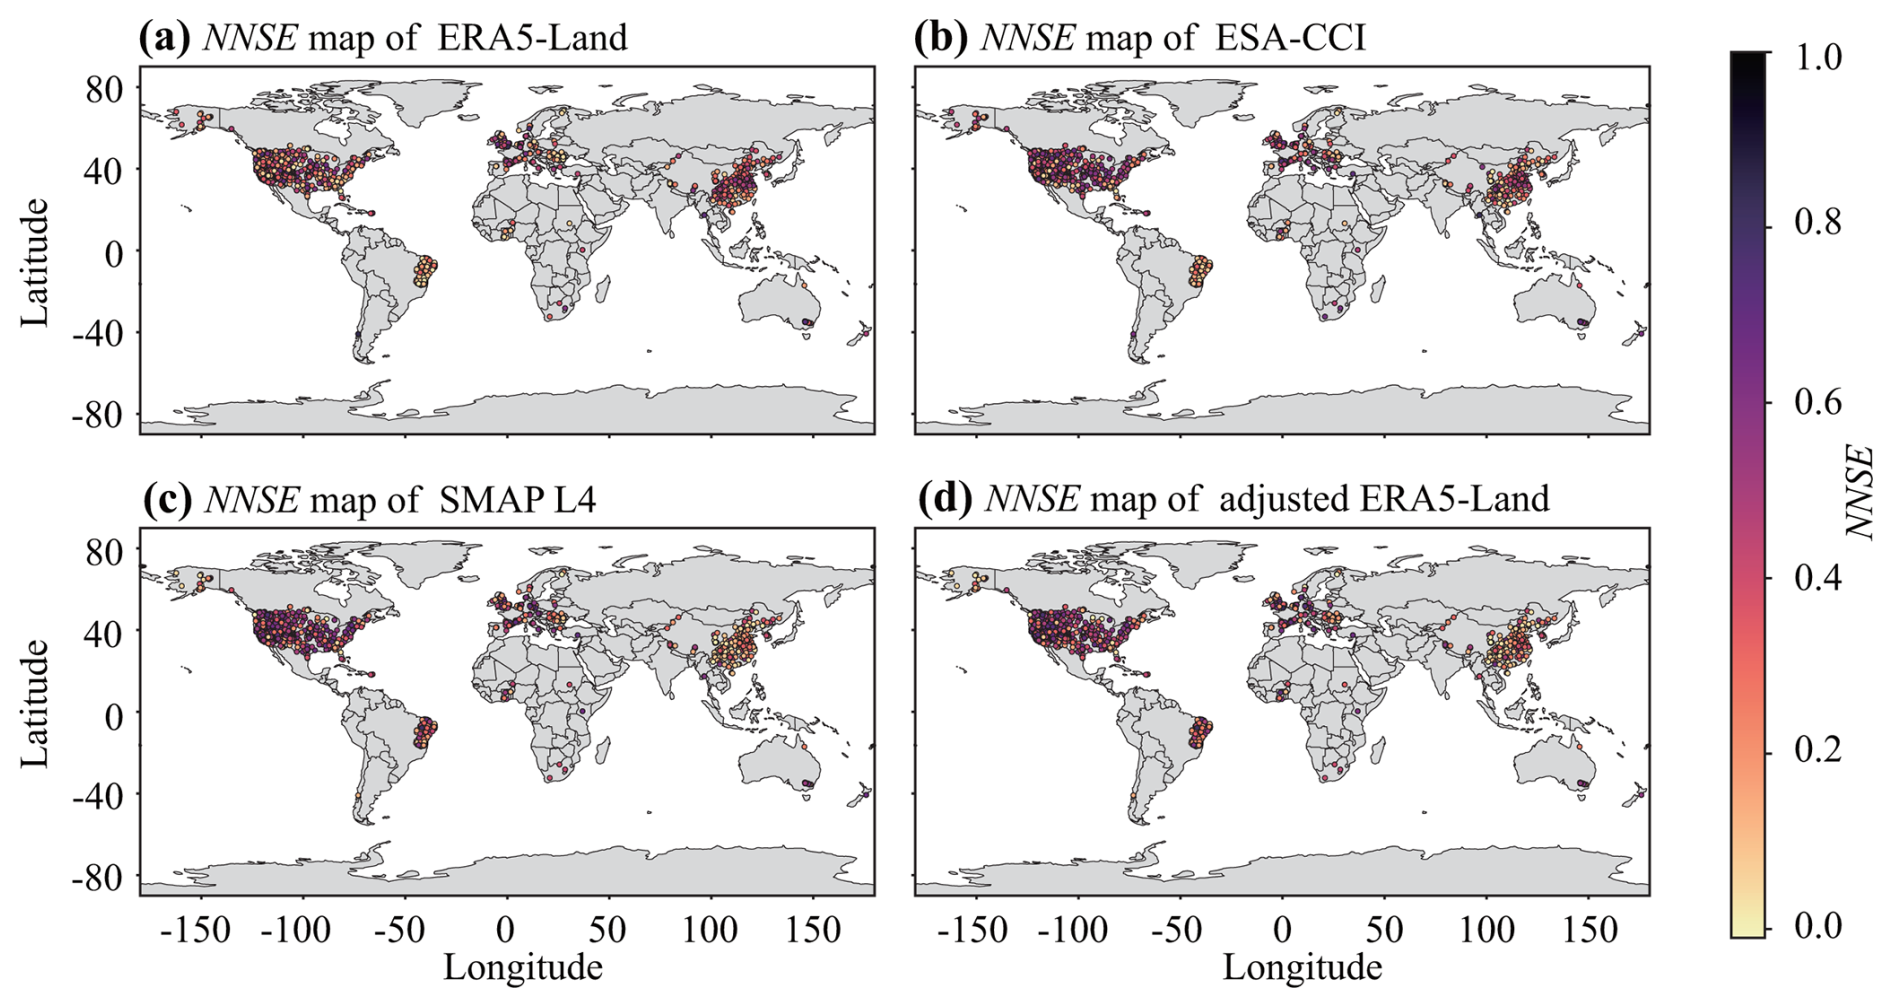
Figure 11Global spatial distribution of the NNSE for four soil moisture products: (a) ERA5-Land, (b) ESA-CCI, (c) SMAP L4, and (d) the adjusted ERA5-Land. The performance of each product is evaluated against time series data from all 1615 in situ stations.
In general, all products perform the best in North America and Europe, which may be related to the calibration data originating largely from the same regions used during data development (Dorigo et al., 2017; Entekhabi et al., 2010; Muñoz-Sabater et al., 2021) Amongst all soil moisture products, the adjusted ERA5-Land and SMAP L4 showed the best performance in North America and Europe. In contrast, the performances of these products differ largely across Asia, Africa, and Brazil. In Africa and Brazil, SMAP L4 and adjusted ERA5-Land show more advantages compared to the other products, while ERA5-Land performs the worst in these regions.
3.3.3 Evaluation Under Different Climate
Building on the spatial analysis of soil moisture products, the performance across diverse climate zones was evaluated, providing insights into the possible environmental influences on prediction accuracy. The evaluation results were classified according to different climates, as shown in Fig. 12. As can be seen from the boxplot of the correlation coefficient (r) under different climates all products exhibit the strongest correlation in tropical and temperate climates and the weakest in polar climate. In general, regional temperature seems to be a critical factor influencing the correlation between moisture products and in situ measurements, with higher temperatures typically leading to stronger correlations.
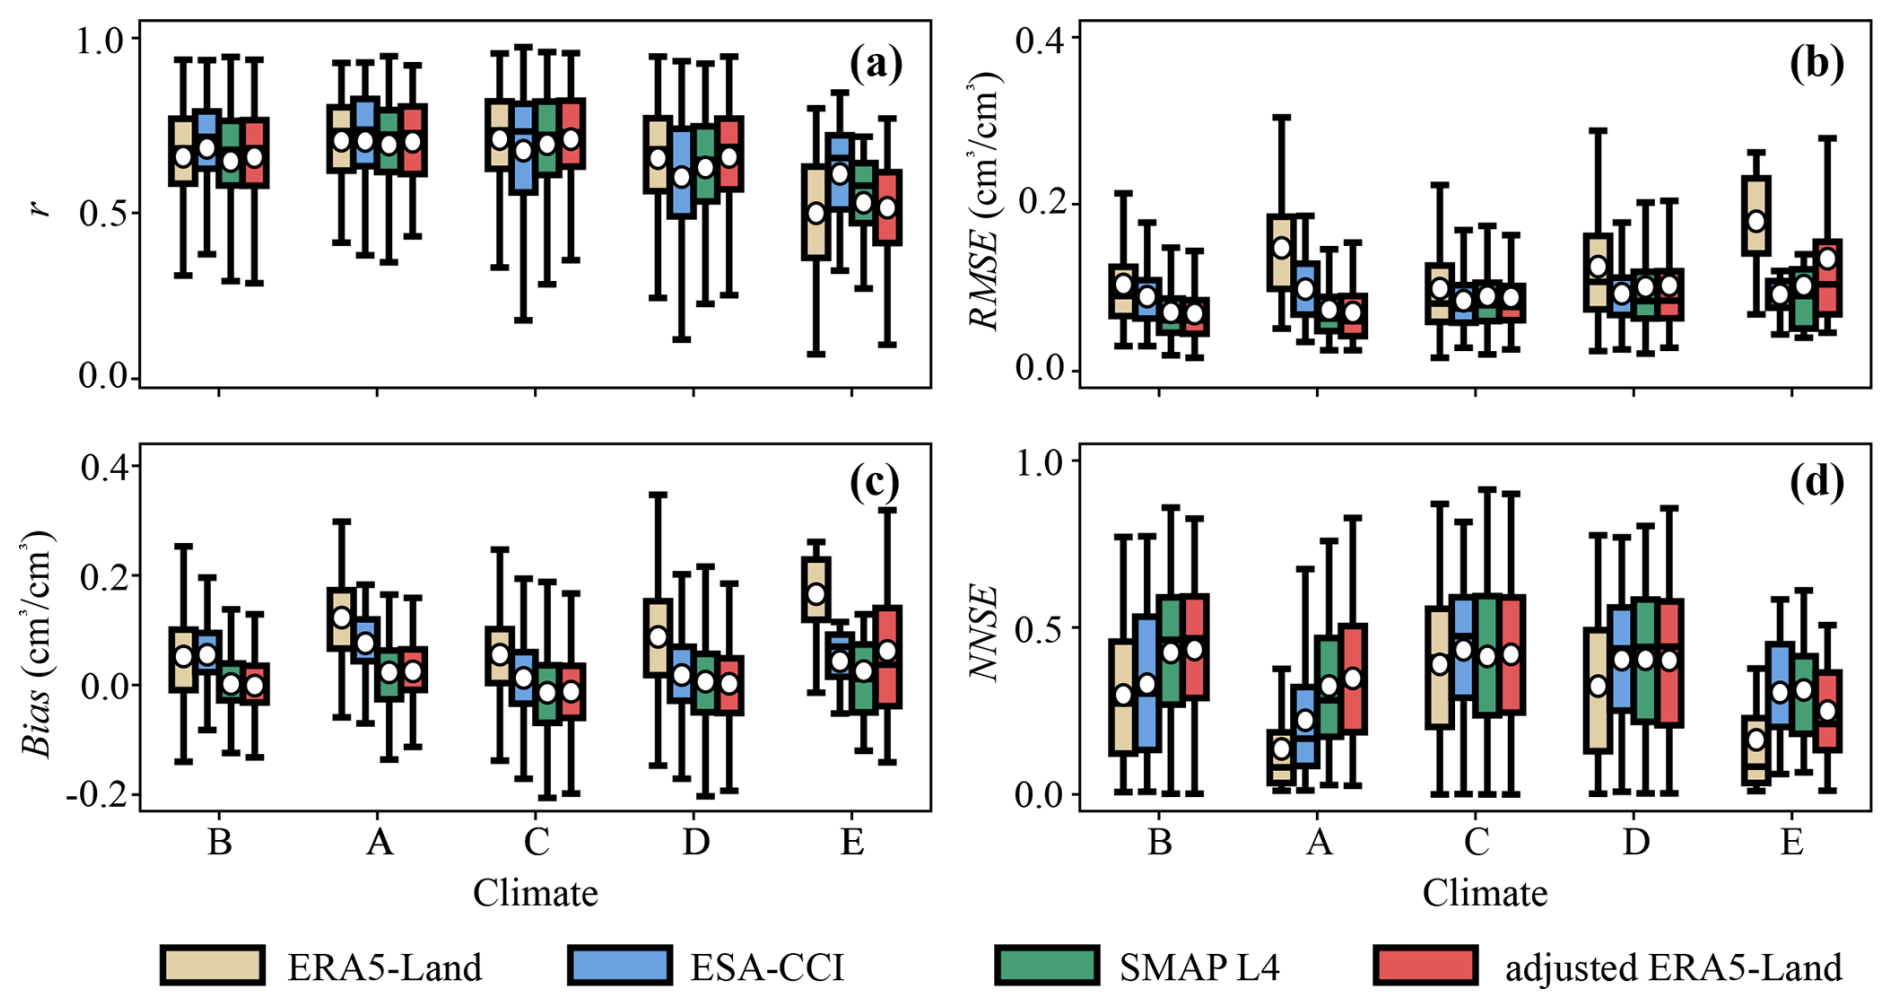
Figure 12Distributions of four performance metrics, including (a) the Pearson correlation coefficient r, (b) RMSE, (c) Bias, and (d) NNSE from the comparison between in situ measurements and the four soil moisture products across different climate zones. The climate zones are categorized as A (Tropical), B (Arid), C (Temperate), D (Cold), and E (Polar). The classification of Zone B is based on precipitation and evaporation, whereas Zones A, C, D, and E are classified by temperature. Accordingly, the x axis are ordered from the warmest to coldest (A, C, D, and E).
Figure 12b illustrates the boxplot of RMSE under different climate zones. It indicates that ERA5-Land consistently exhibits the highest RMSE across all climate zones, while SMAP L4 and adjusted ERA5-Land reach their lowest RMSE in arid and tropical climates. For temperate and cold climates, ESA-CCI, SMAP L4, and adjusted ERA5-Land show comparable RMSE values. In polar climate, ESA-CCI has the lowest RMSE and followed by SMAP L4 and adjusted ERA5-Land. Overall, the comparison highlights that adjusted ERA5-Land and SMAP L4 generally offer improved RMSE performance, particularly in arid and tropical climates, while ESA-CCI excels in polar regions, whereas ERA5-Land consistently underperforms across all climate zones.
The Bias plotted in Fig. 12c under different climates, resembles the RMSE distribution. Over all climate zones, ERA5-Land shows the highest Bias, whereas SMAP L4 and adjusted ERA5-Land exhibit the lowest Bias. In summary, in terms of different climates, all the products perform the best in temperate climate.
Finally, Fig. 12d shows that reasonable performance is noted for all products in arid climate in terms of the NNSE. In extreme climates, such as tropical and polar climates, all products show reduced results, whereas better accuracy is observed in moderate climates, such as in the temperate and cold climates. This suggests that extreme climates may challenge the performance of moisture products, potentially due to the limited in situ measurements in these regions for calibrating the remote sensing and reanalysis datasets.
3.4 Evaluation of the Extended Adjusted ERA5-Land Dataset against the Original ERA5-Land using ISMN Observations (1960–March 2015) and Stability Assessment of Mean-Variance Adjustment Parameters under Wet and Dry Conditions
This section employs a multi-metric evaluation framework to systematically compare the performance of the original ERA5-Land and the adjusted ERA5-Land datasets against 2173 ISMN in situ stations over the period 1960–March 2015 with approximately 1.9 million soil moisture measurement records. The validity and effectiveness of extending the adjusted ERA5-Land dataset to the historical period are assessed in Fig. 13. In these density scatter plots, each data point represents an individual station, with the color gradient indicating the observation count available for that site.
Overall, compared with the original ERA5-Land, the adjusted ERA5-Land exhibits consistent performance improvements across all evaluation metrics. In terms of correlation coefficient r (Fig. 13a), the adjusted ERA5-Land shows slightly higher station-based correlation coefficients (mean r increases from 0.6225 to 0.6230), indicating that it effectively preserves the temporal variability characteristics of the original ERA5-Land soil moisture data. For the bias (Fig. 13b), the distribution of the adjusted ERA5-Land is more strongly centered around zero (mean Bias reduced from 0.0561 to −0.0158 cm3 cm−3), reflecting a substantial reduction in systematic bias and demonstrating that the adjustment procedure effectively mitigates long-term biases present in the original ERA5-Land dataset. Regarding error magnitude (Fig. 13c), the adjusted ERA5-Land exhibits markedly lower RMSE values at the majority of stations, with the mean RMSE decreasing from approximately 0.0999 cm3 cm−3 for the original ERA5-Land to approximately 0.0835 cm3 cm−3 after adjustment, indicating an overall improvement in absolute accuracy. Meanwhile, the NNSE metric (Fig. 13d) shifts upward following adjustment, with the mean NNSE increasing by approximately 30 % relative to the ERA5-Land, further demonstrating a significantly enhanced ability of the adjusted dataset to explain observed soil moisture variability at the station scale.
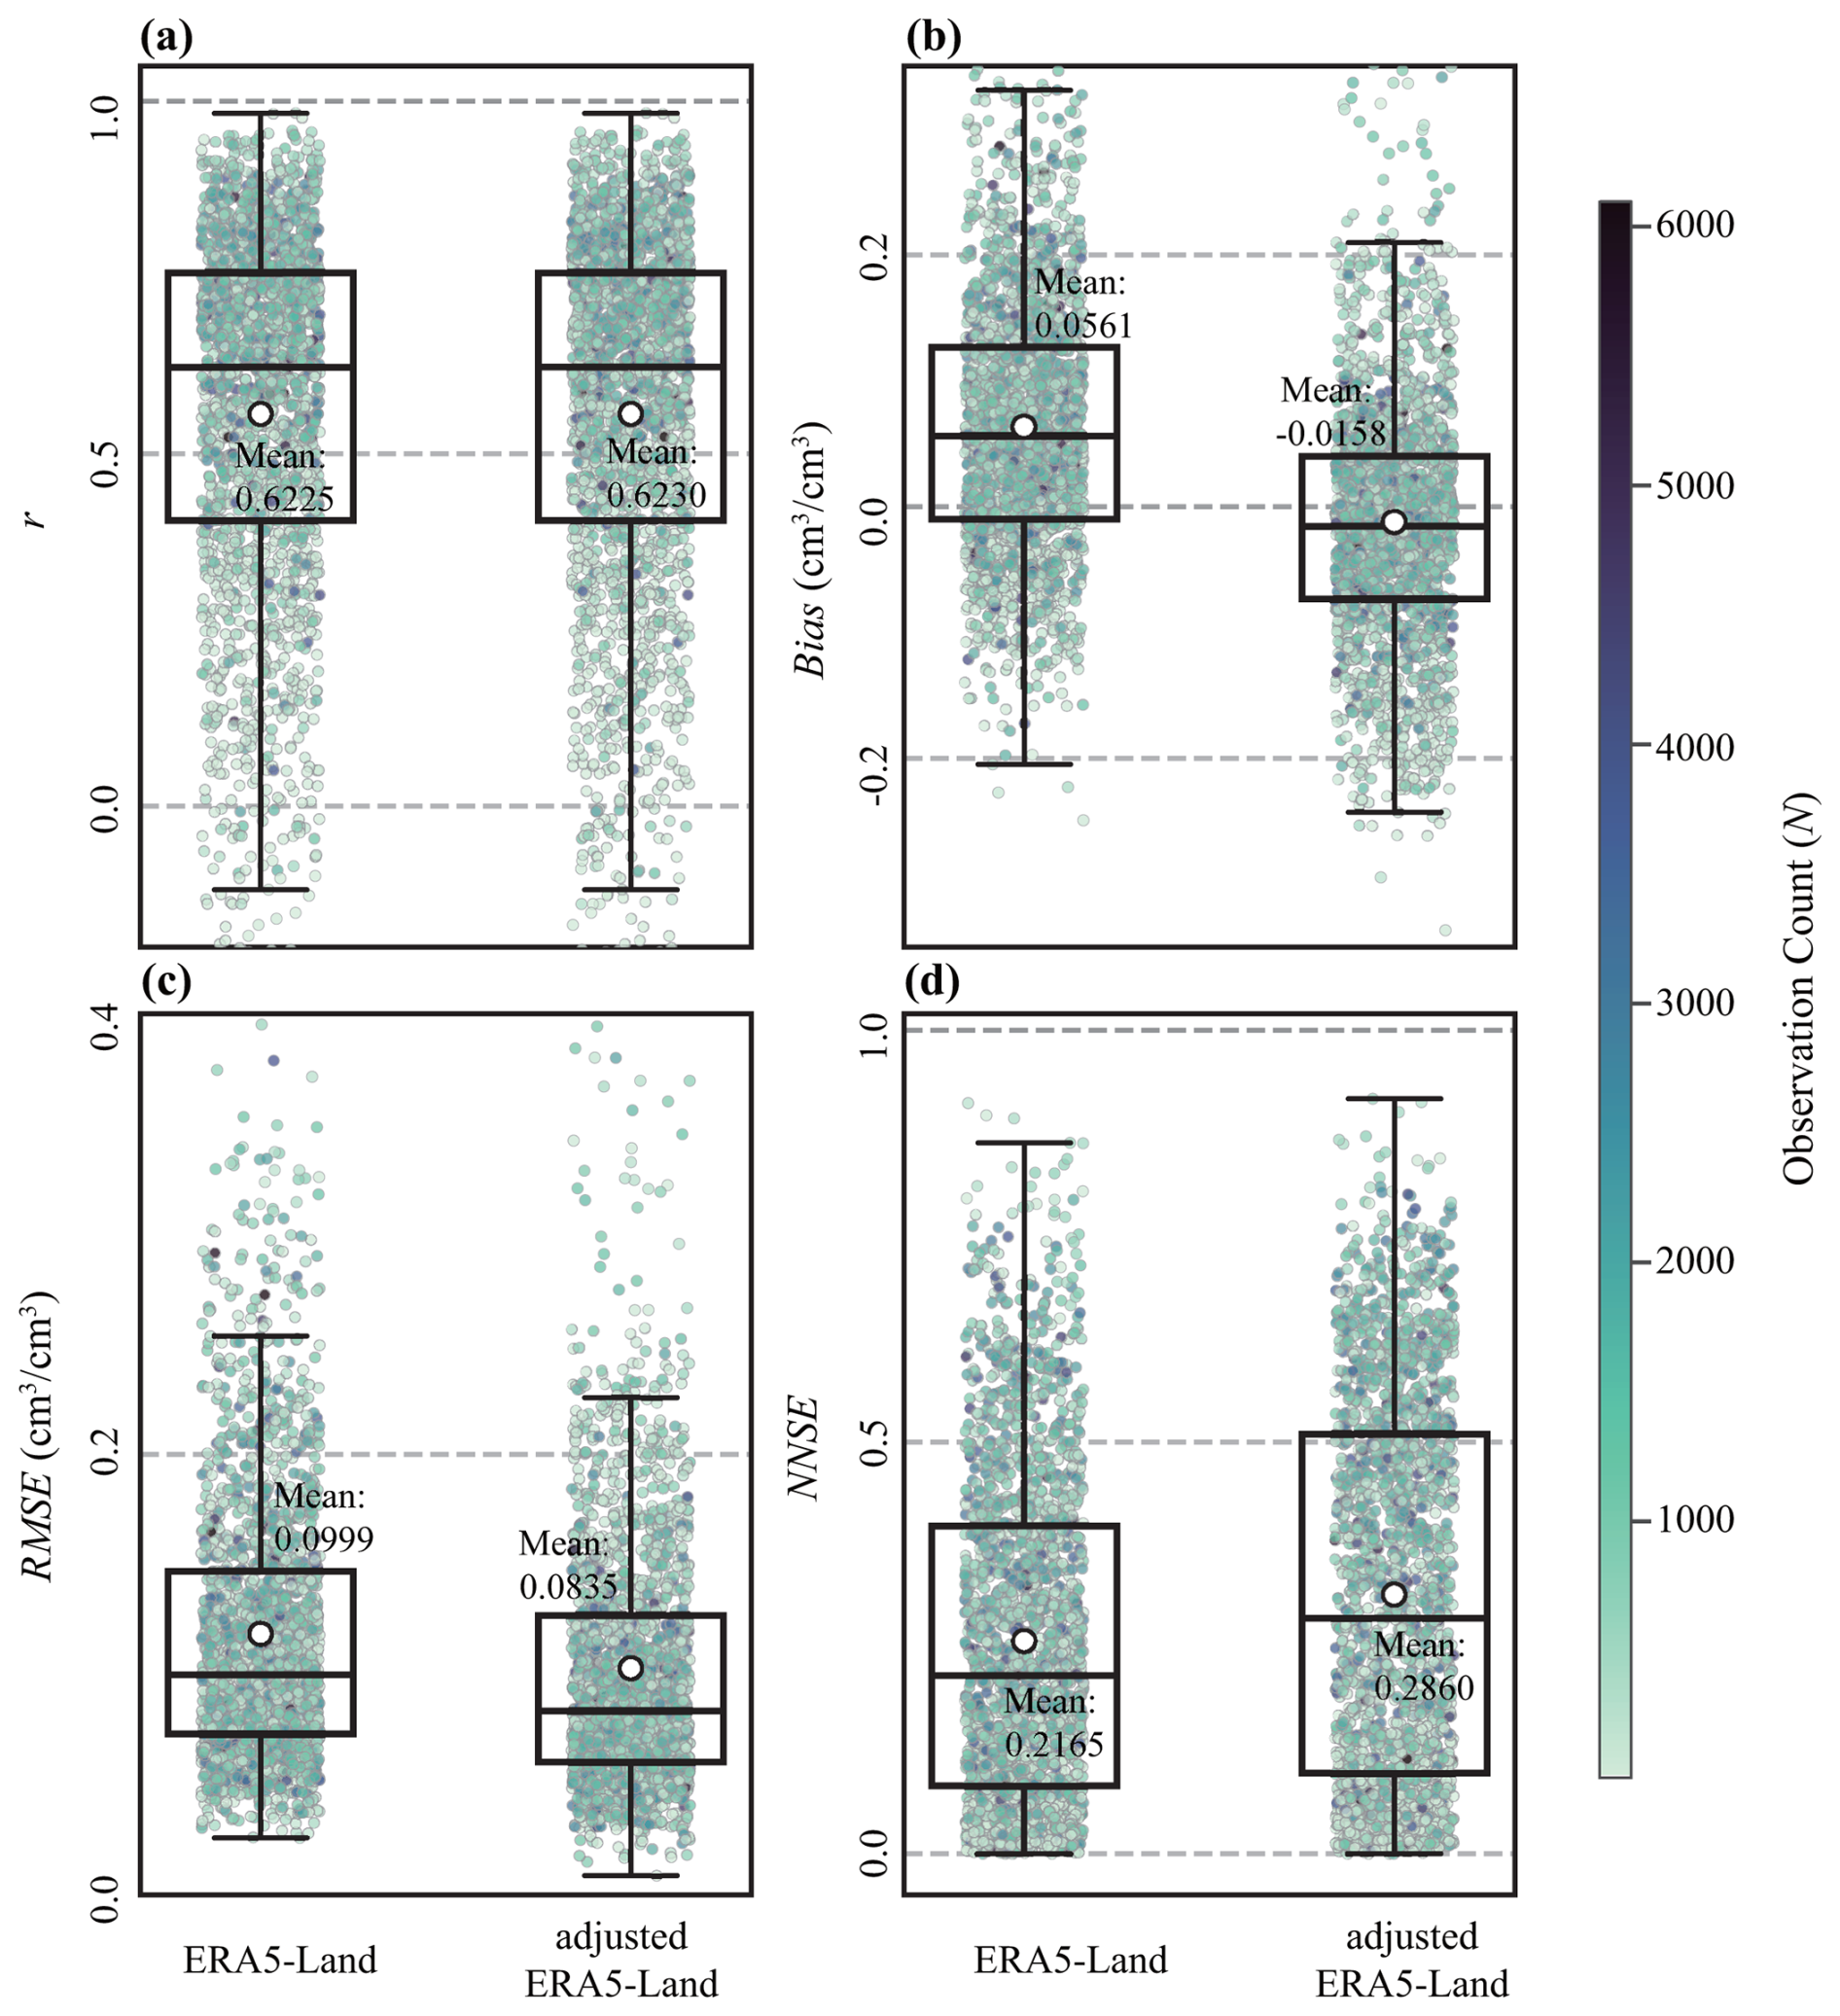
Figure 13Comparative evaluation of the extended adjusted ERA5-Land soil moisture dataset versus the original ERA5-Land against ISMN in situ observations for the historical period (1960–March 2015). The panels display the distributions of four performance metrics: (a) Pearson correlation coefficient (r), (b) Bias (cm3 cm−3), (c) RMSE (cm3 cm−3), and (d) NNSE. In the density scatter plots, each point represents a single ISMN station with more than 10 valid observations (N>10) throughout the entire historical period, colored according to the available observation count as shown in the color bar. The overlaid boxplots summarize the statistical distribution: the box spans the interquartile range (25th to 75th percentiles), and the central line marks the median. The white circles and numerical labels indicate the mean value of each distribution.
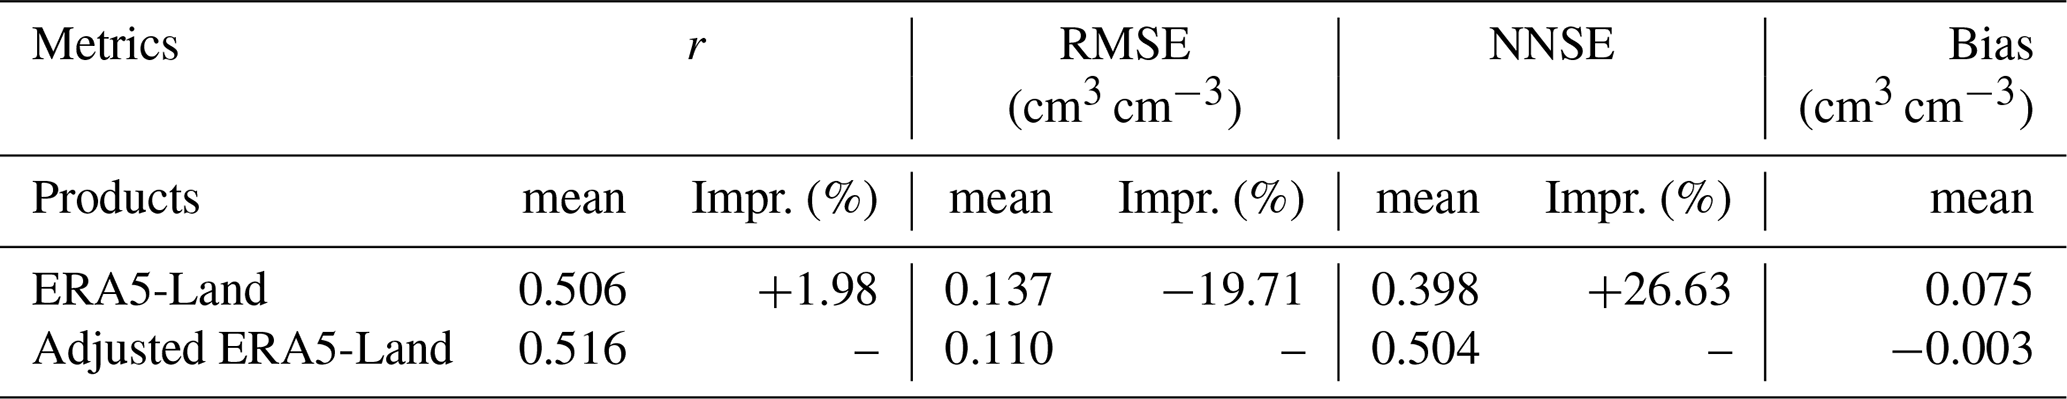
To further reinforce the dataset performance characterized by the site-scale evaluations and to provide a comprehensive assessment over the long-term historical period, we conducted an aggregated validation using the independent 2173 ISMN stations available for the period 1960–March 2015 and their complete time series. The corresponding validation statistics comparing the adjusted ERA5-Land with the original ERA5-Land are summarized in Table 2. The aggregated results show that the adjusted ERA5-Land consistently outperforms the ERA5-Land across all evaluation metrics. Specifically, the mean RMSE decreases from 0.137 to 0.110 cm3 cm−3, representing a reduction of 19.7 % and indicating improved absolute accuracy; the mean NNSE increases from 0.398 to 0.504 (an improvement of approximately 26.6 %), indicating a substantially enhanced ability of the adjusted dataset to explain observed soil moisture variability. In addition, the mean Bias is reduced to approximately −0.003 cm3 cm−3, which is markedly closer to zero than that of the ERA5-Land (0.075 cm3 cm−3), demonstrating that the adjustment procedure utilized in this study effectively mitigates long-term systematic biases.
Table 2Aggregated validation statistics comparing the performance of the original ERA5-Land and the Extended Adjusted ERA5-Land datasets against observations from 2173 ISMN stations for the period 1960–March 2015. The Improvement (Impr.) column represents the relative percentage improvement of the Adjusted ERA5-Land compared to the original ERA5-Land.
To further examine the temporal robustness of the adjusted ERA5-Land dataset, we analyzed the interannual variations of the validation metrics. ISMN station observations were aggregated on an annual basis, and yearly validation metrics were calculated for both the adjusted ERA5-Land and the original ERA5-Land relative to the ISMN sites. We focused the analysis on the period 1970–March 2015, as the period 1960–1969 was excluded due to insufficient statistical representativeness. Across the entire 1960–1969 period, there were only 20 soil moisture observations in total (with a maximum of 4 observations in any single year). Such extreme data scarcity precludes the calculation of robust or meaningful evaluation metrics (see the temporal evolution of available soil moisture observations in Fig. S8). Furthermore, even within the retained analysis period, the data distribution remains highly skewed; the period from 1998 to March 2015 accounts for approximately 99 % of the validation dataset.
As shown in Fig. 14, the adjusted ERA5-Land (red circles) consistently outperforms the ERA5-Land (blue triangles) across all four evaluation metrics throughout the analysis period 1970–March 2015, demonstrating sustained and stable improvements over time. In terms of correlation (Fig. 14a), the adjusted ERA5-Land exhibits systematically higher r values than the ERA5-Land. This improvement is observed both in the earlier sparse data period (prior to 1998) and the later data-rich period (after 1998), indicating a stable ability to capture interannual soil moisture variability across periods of varying observational density.
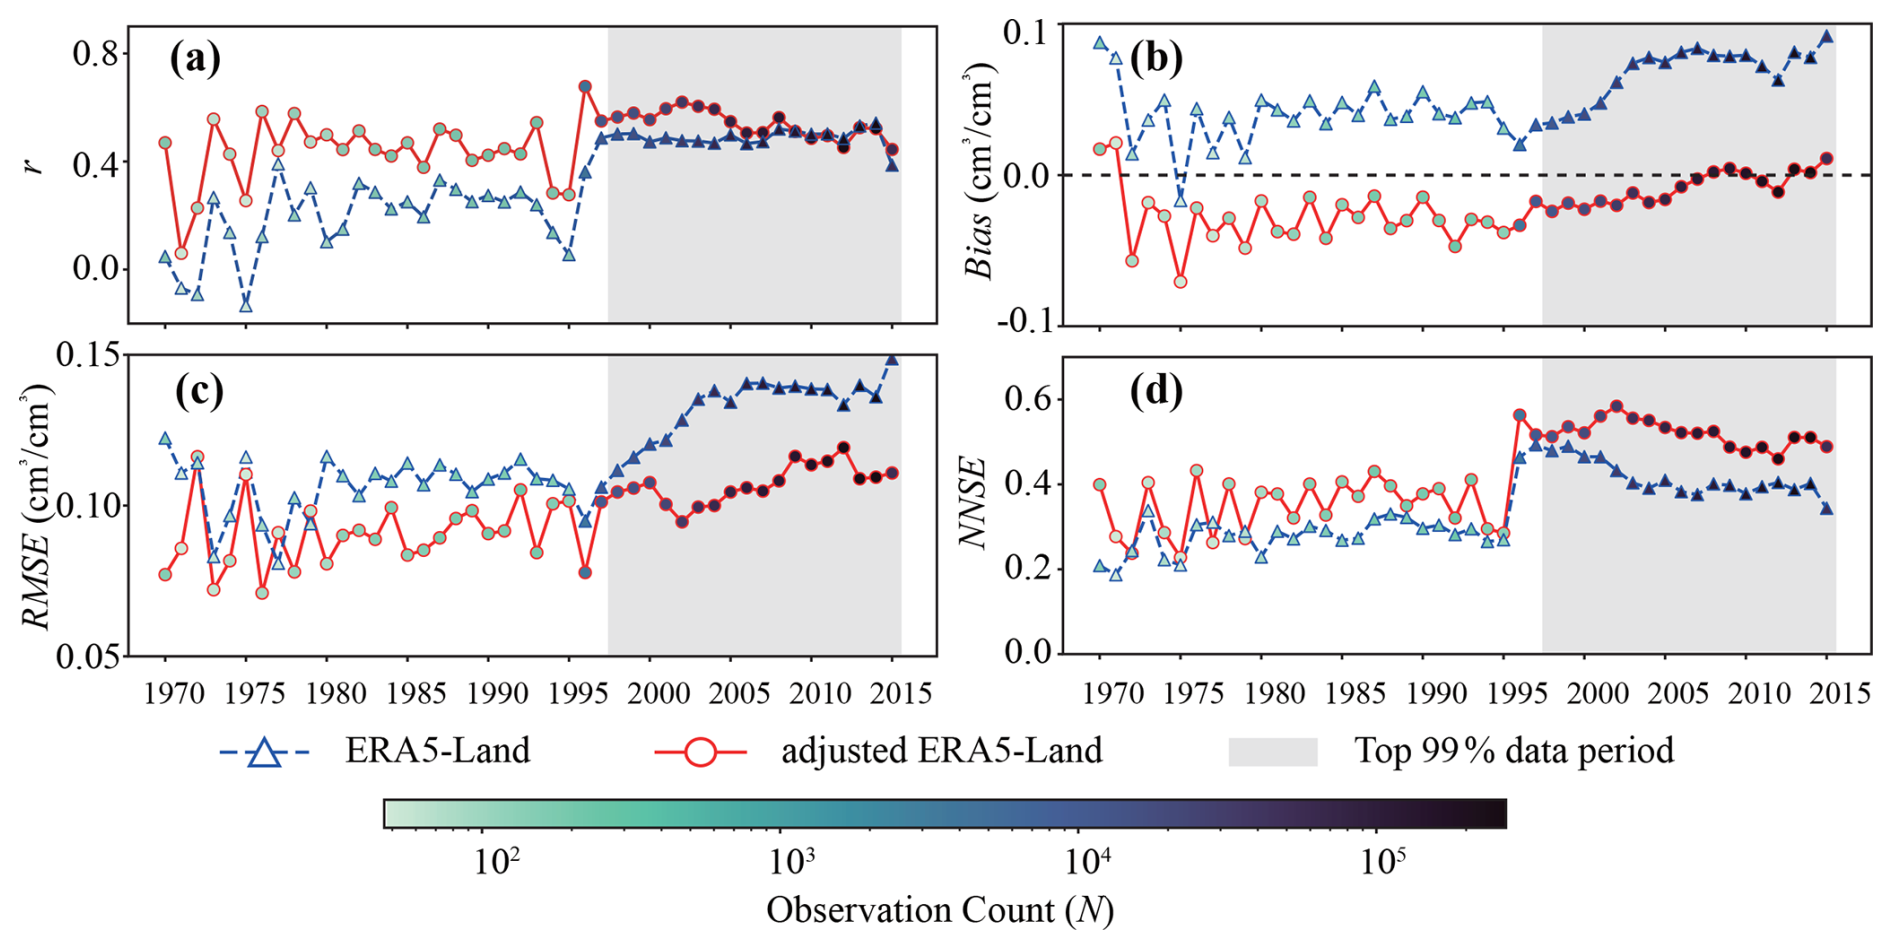
Figure 14Interannual evaluation of the adjusted ERA5-Land (red circles) and the original ERA5-Land (blue triangles) soil moisture products against ISMN in situ observations over the period 1970–March 2015. The panels display time series of the spatially aggregated (a) Pearson correlation coefficient (r), (b) Bias (cm3 cm−3), (c) RMSE (cm3 cm−3), and (d) NNSE. The color intensity of the data points corresponds to the number of available in situ observations for each year, as indicated by the color bar. The gray shaded region marks the period (1998–2015) where station density is the highest, accounting for approximately 99 % of the total validation data records.
With respect to bias (Fig. 14b), distinct behaviors are observed. The original ERA5-Land exhibits a persistent positive bias (systematic overestimation across nearly the entire record. In contrast, the adjusted ERA5-Land successfully mitigates this systematic offset. While interannual fluctuations exist, particularly during the data-sparse period (1970–1998), where limited station sampling leads to higher variability, the magnitude of the bias in the adjusted ERA5-Land product is generally smaller. Crucially, in the data-rich period after 1998, the bias of the adjusted product stabilizes near zero. This suggests that the adjustment procedure effectively removes systematic bias, resulting in a more balanced error distribution in which local over- and underestimations tend to cancel out at the global scale, in contrast to the consistent overestimation observed in the original ERA5-Land dataset. Regarding error magnitude (Fig. 14c), the adjusted ERA5-Land demonstrates improved absolute accuracy, yielding lower RMSE values in the vast majority of analyzed years. While isolated instances of slightly higher RMSE occur in the early sparse period (e.g., 1972 and 1977), likely due to the limited spatial representativeness of the few available stations, the performance becomes highly consistent in the data-rich period. Specifically, during the period with robust station coverage (after 1998), the adjusted product consistently exhibits lower RMSE than the original ERA5-Land. These findings support the temporal stability of the accuracy gains, demonstrating sustained improvements, most clearly evident during periods with sufficient in situ observational coverage. The NNSE metric (Fig. 14d) further corroborates these findings. Compared with the ERA5-Land, the adjusted ERA5-Land maintains consistently higher NNSE values throughout nearly the entire analysis period. The only deviation occurs in 1977, an isolated case within the data-sparse period, which likely reflects limited sampling dataset. Beyond this single year, the sustained improvement in NNSE confirms the enhanced ability of the adjusted dataset to capture soil moisture dynamics. Overall, the results presented in Fig. 14 demonstrate that the adjusted ERA5-Land dataset achieves stable and sustained performance improvements, with accuracy that remains consistent throughout the backward-extended historical period.
To investigate the influence of climatic variability, particularly differences between wet and dry conditions, on the mean-variance rescaling parameter (m and n), we identified the three wettest non-consecutive years (2016, 2017, and 2022) and the three driest years (2019, 2021, and 2024) from the period 2016–2024 based on global annual mean soil moisture derived from SMAP L4 data. Given that the SMAP data record begins in April 2015 and extends to October 2025, both 2015 and 2025 were excluded from this selection as they represent incomplete calendar years. Based on these selected years, the corresponding m and n parameters were calculated, and their distributional characteristics and empirical cumulative distribution functions (ECDFs) were analyzed, as shown in Fig. 15.
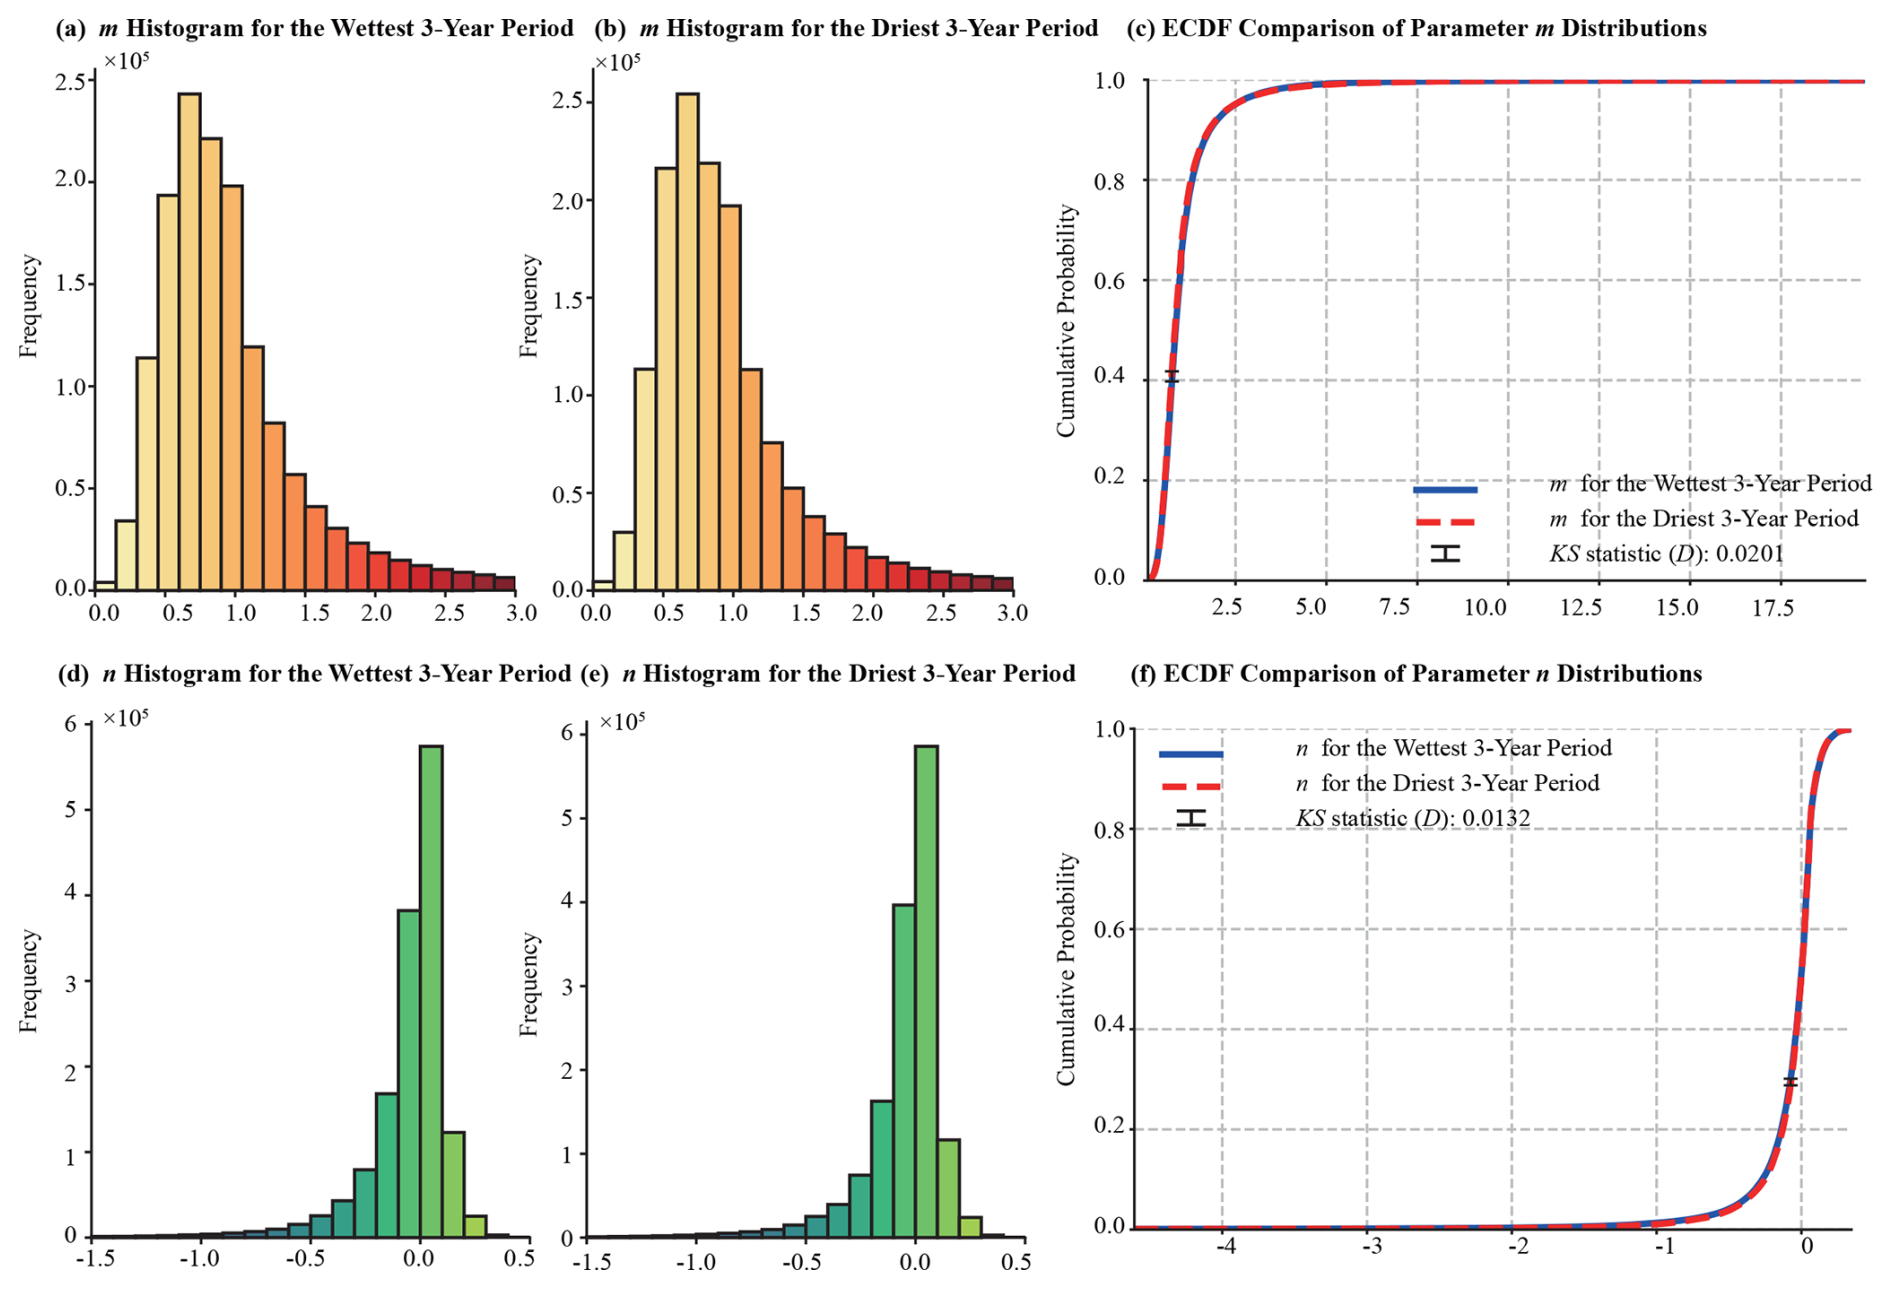
Figure 15Assessment of the temporal stability of the mean-variance adjustment parameters m (top row) and n (bottom row) under contrasting climatic conditions. The distributions are derived from (a, d) the three wettest non-consecutive years and (b, e) the three driest non-consecutive years selected from 2015–2024. Panels (c) and (f) present the comparison of the Empirical Cumulative Distribution Functions (ECDFs), where the blue solid line represents the wettest period and the red dashed line represents the driest period. The black markers indicate the Kolmogorov–Smirnov (KS) statistic (D), which quantifies the maximum vertical divergence between the two distributions (0.0201 for m and 0.0132 for n).
The distributional analysis indicates a high degree of similarity between the wettest three-years period and the driest three-years for both m (Fig. 15a–c) and n (Fig. 15d–f). Both the histogram shapes and the ECDF curves exhibit strong consistency across the two climatic regimes, with no evident systematic shift. A quantitative comparison was further conducted using the Kolmogorov–Smirnov (KS) test, yielding a KS statistic (D) of 0.0201 for parameter m, with a comparable result obtained for n. Under large-sample conditions (N= 1.45 × 10⁶), standard statistical tests often yield low p-values for even negligible differences due to high statistical power. Therefore, we interpret the magnitude of the KS statistic D, which quantifies the maximum absolute difference between the two ECDFs, rather than relying solely on significance testing. The results show that this maximum difference amounts to only 2.01 % for parameter m and 1.32 % for parameter n. Previous hydrological and climatological studies have demonstrated that D values on the order of 1 %–2 % can be regarded as practically negligible and indicative of highly similar distributions (Massey, 1951; Kroll et al., 2015; Lanzante, 2021). Accordingly, these results suggest that the adjustment parameters (m and n) exhibit strong temporal stability across contrasting the wettest and driest climatic conditions, with limited sensitivity to interannual climate variability. This stability provides a robust physical and statistical justification for applying the derived bias-correction parameters to the earlier historical periods.
4.1 Conditions Suitable for Different Soil Moisture Products
Based on the comprehensive evaluation of ERA5-Land, ESA-CCI, SMAP L4, and the adjusted ERA5-Land against in situ soil moisture data, each product demonstrates its own strengths and limitations under different conditions.
ERA5-Land, as a reanalysis-based soil moisture product, is known for its extensive spatiotemporal coverage and the ability to capture dynamic changes, making it particularly suitable for analyzing long-term global soil moisture trends (Hoffmann et al., 2019; Lal et al., 2022). However, due to insufficient calibration with in situ soil moisture measurements, ERA5-Land exhibits relatively high biases with mean RMSE and Bias of 0.116 and 0.073 cm3 cm−3, respectively, and shows reduced accuracy in extreme climatic zones. Consequently, ERA5-Land is probably appropriate for applications focused on dynamic changes, such as climate studies (Cantoni et al., 2022; Dalla Torre et al., 2024; Di Virgilio et al., 2025), but might not be suitable as a standalone source for high-precision soil moisture assessments.
ESA-CCI, on the other hand, is widely recognized for its superior integration of multi-source satellite data and high precision (Hirschi et al., 2025; Li et al., 2025b). It demonstrates robust performance across various regions and climate zones worldwide. However, ESA-CCI suffers from limitations in data coverage, with notable gaps in high-latitude and high-altitude regions, as well as densely vegetated areas (Ortet et al., 2024; Xie et al., 2024). Quantitatively, Zheng et al. (2023) reported that the proportion of daily missing data in ESA-CCI ranged from 21.89 % to 94.9 % between 2000 and 2020, with an average of 58.2 %. Even after 2007, when available satellite data increased, the smallest proportion of missing data relative to the global land area (excluding Antarctica) still reached 21.8 %. These gaps primarily result from unstable satellite coverage, challenges in data retrieval under specific conditions (e.g., dense vegetation, frozen soil, or snow), and rigorous quality control (Babaeian et al., 2019; Dorigo et al., 2017; Li et al., 2021b; Mu et al., 2022). Consequently, such issues may lead to spatial and temporal data discontinuities, introduce biases, and undermine the reliability of the fusion outcomes (Li et al., 2021b; Zhang and Zhou, 2016). These characteristics make it more suitable for applications requiring high accuracy rather than continuous coverage, such as regional drought monitoring and hydrological modeling.
SMAP L4, leveraging its L-band observation capabilities and data assimilation framework, demonstrates outstanding performance across various regions and climatic zones. Its superior bias control and high precision make it ideal for diverse research applications (Colliander et al., 2017, 2018; Ma et al., 2019). However, the temporal limitation of its historical data, beginning in April 2015, restricts its utility in long-term studies.
The adjusted ERA5-Land proposed in this study achieves substantial enhancements in global soil moisture estimation by integrating the extensive spatiotemporal coverage of ERA5-Land with the high-accuracy characteristics of SMAP L4. Its performance is particularly outstanding in temperate and cold climate zones. Although in situ data in tropical regions remain sparse (only ∼ 7 % of our 1615 stations are in tropical zones, primarily from the Cemaden dataset), the evaluation during the 2015–2020 primary validation period still indicates a notable improvement in the tropical regions, where the RMSE decreased from 0.1475 in the ERA5-Land product to 0.0702 in the adjusted ERA5-Land dataset (a reduction of ∼ 50 %), and the NNSE increased from 0.1365 to 0.3482 (an improvement of 150 %), as shown in Fig. 12. Additionally, a grid-based bias adjustment approach effectively mitigates regional systematic biases. Beyond the primary validation period (2015–2020), this study further verifies the product's performance against historical in situ observations dating back to 1960. The high consistency observed between the adjusted ERA5-Land and these long-term soil moisture measurements (Sect. 3.4), together with the stability of scaling parameters tested under contrasting wet and dry conditions, provides observational evidence supporting the reliability of the data extension. These characteristics ensure that the dataset is not only accurate for present-day applications but also supports the analysis of multi-decadal climate trends, making it suitable for applications demanding regional water balance and global consistency, such as water resource management and long-term climate modeling. Nevertheless, since the adjustment approach relies on SMAP L4 as a reference, its performance is obviously influenced by the inherent limitations of SMAP L4.
While this study provides a systematic validation spanning more than six decades (1960–2025), it is important to acknowledge the limitations concerning the earliest segment of the reconstructed record. Due to the complete unavailability of reliable in situ observations prior to 1960 and the extreme sparsity of station data between 1960 and 1970, a direct quantitative validation for the 1950–1960 period was not feasible. Consequently, although the proven stability of the adopted mean-variance adjustment parameters under contrasting climatic conditions supports the methodological transferability, users are advised to interpret the data with caution when analyzing specific regional trends or extreme events during the unvalidated 1950–1960 decade and the subsequent data-sparse early years. Future efforts will focus on “data archaeology” to recover and digitize historical records, which could enable the retroactive validation of these early years and enhance the reliability of the long-term product.
In summary, ERA5-Land, with its extensive temporal coverage, is optimally suited for long-term global analysis, whereas ESA-CCI, precisely calibrated from multi-source data, excels in high-precision specific regional applications. SMAP L4, renowned for its precision in arid and cold zones, offers robust performance for relevant studies, and the adjusted ERA5-Land, harmonizing the strengths of its predecessors, provides an integrated solution for a globally consistent soil moisture product. Selecting the appropriate data product based on specific research requirements, combined with multi-source data fusion techniques, can finally enhance the reliability and applicability of the soil moisture product.
4.2 Comparison of Moisture Product with Previous Studies
This section thoroughly reviews related studies to provide additional evidence supporting the accuracy, correlation, and coverage findings of this study. For instance, Shi et al. (2024) offers a comparison of the ESA-CCI and SMAP L4 products against in situ networks for the period of 2016–2020. In their evaluation against 550 stations from sparse networks across the Continental United States (CONUS), the ESA-CCI product yielded a slightly higher average correlation coefficient (r) of 0.636 compared to 0.613 for SMAP L4. The ESA-CCI product showed a marginally lower unbiased root mean square error (ubRMSE) of 0.092 m3 m−3 relative to 0.097 m3 m−3 for SMAP L4. Conversely, when assessing 33 stations in networks outside the CONUS, they found that ESA-CCI again achieved a higher r (0.843 vs. 0.832), whereas SMAP L4 demonstrated a superior ubRMSE (0.046 m3 m−3 vs. 0.054 m3 m−3). This documented pattern of performance generally aligns well with the trends observed in our own analysis Mazzariello et al. (2023) evaluated SMAP L4, ESA-CCI, and SMOS using ISMN in situ station measurements, focusing on European regions. Their study indicates that SMAP L4 outperformed the other products in terms of r, Bias, and unbiased RMSE. For the ESA-CCI dataset, while slightly lagging behind SMAP L4, it remained a dependable substitute, which aligns with the conclusions drawn in our study. Xu and Frey (2021) evaluated five soil moisture products in the Laurentian Great Lakes area, encompassing the Great Lakes across the United States and Canada, using in situ soil moisture observational sites from Michigan State University's Enviro-weather Automated Weather Station Network (MAWN) for validation. The five soil moisture products includes SMOS Level 2 Soil Moisture User Data Product V650, SMAP L3 Radiometer Soil Moisture Version 4 (referred to as SMAP L3), and the ESA-CCI Soil Moisture v05.2, including the Active, Passive, and Combined sets. Their results indicated that ESA-CCI Combined product exhibited the lowest unbiased RMSE, whereas SMAP L3 demonstrated the highest correlation among the evaluated products. Our selected products, including ESA-CCI and SMAP represent the best performances from their evaluated products, and their results are consistent with the conclusion in this study that ESA-CCI Combined v09.1 exhibited lower RMSE, whereas SMAP L4 demonstrated higher correlation. Ma et al. (2019), using ISMN in situ stations, limited to North America and Europe, found that SMAP L4 was less correlated with observed data in arid and rigid climates compared to ESA-CCI, which is also revealed by our analysis. Hong et al. (2024) comprehensively evaluated SMAPL4, ERA5-Land, and GLDAS in China and found that ERA5-Land had the highest correlation with observational data. Similarly, the study conducted in China by Wu et al. (2021) reached the same conclusion regarding the high correlation of ERA5-Land dataset, which is also corroborated by our work. The overall analysis showed, that existing studies are consistent with our work, further demonstrating the reliability of the results presented here.
However, a key distinction of our work is the rigorous validation of the backward extension. Methodologies for long-term reconstruction often rely on the assumption that statistical relationships established in the satellite period remain consistent over time (e.g., Li et al., 2022); however, verifying this consistency has historically been difficult due to the scarcity of independent pre-satellite observations. By compiling and utilizing the comprehensive ISMN archive dating back to 1960, our study provides rare, independent evidence supporting the temporal transferability of the mean-variance rescaling method, providing a quantitative assessment of historical performance that is often constrained by data availability in global soil moisture reconstruction efforts.
It should be noted that the ESA-CCI used in this study is the latest version (v09.1), which differs from most previous studies. ESA-CCI Version 0.1 (issued 2012) initially combined data from active sensors (e.g., AMI-WS and ASCAT) and passive sensors (e.g., SMMR, SSM/I, TMI, and AMSR-E). Following the release of the first version, subsequent ESA-CCI versions introduced substantial advancements. For example, versions 02.0–02.3 (released in 2014–2016) improved the data fusion algorithms and added support from GLDAS data, whereas version 05.2 (released in 2020) fully integrated SMAP data and optimized AMSR2 intercalibration performance, followed by several updates in data and methodologies. The latest version v09.1 (2024, http://catalogue.ceda.ac.uk/uuid/779f116d0477439db1874592add5848c, last access: 5 January 2026) incorporates data from passive sensors with a total of 15 products, including AMI-WS and ASCAT, as well as active sensors SMMR, SSM/I, TMI, AMSR-E, WindSat, FY-3B, FY-3C, FY-3D, AMSR2, SMOS, GPM, and SMAP. Compared to previous versions, both data accuracy and availability have been significantly enhanced (Dorigo et al., 2017; Gruber et al., 2019; Preimesberger et al., 2020).
To the best of our knowledge, this study represents the first global-scale comparative analysis of the ESA-CCI v09.1 Combined product, evaluating its accuracy, data coverage, and performance relative to other soil moisture products, thereby contributing a benchmark for future global soil moisture research and applications.
The produced adjust ERA5-Land for soi moisture dataset is available at https://doi.org/10.57760/sciencedb.30546 (Wang et al., 2026).
Soil moisture is a cornerstone of Earth system science, driving land-atmosphere interactions, regulating the global water cycle, and supporting critical applications such as hydrological modeling, drought monitoring, and climate prediction, yet existing global datasets struggle with inconsistencies, coverage gaps, and biases. To this end, this study addresses these challenges by developing the adjusted ERA5-Land dataset (1950–2025) for the surface soil moisture through the fusion of ERA5-Land and SMAP L4 using a simple mean-variance rescaling method.
To ensure a rigorous assessment, we collected in situ measurements from networks including ISMN, CMA, Cemaden, COSMOS-Europe, and SONTE-China. To the best of out knowledge, this collection represents the most comprehensive in situ soil moisture compilations available to date, comprising approximately 3.8 million records in total. These records are organized into two distinct subsets to support specific evaluation objectives, i.e., a primary dataset for the validation analysis (2015–2020) containing 1.9 million records, and an independent historical dataset (1960–2015) containing an additional 1.9 million records.
Results show that compared with the in situ measurements during the primary validation period (2015–2020), our proposed adjusted ERA5-Land dataset demonstrates substantial improved performance, with the highest correlation (r= 0.687, exceeding SMAP L4 by 3.01 %, ESA-CCI by 4.41 %, and slightly surpassing ERA5-Land), the lowest RMSE (0.087 cm3 cm−3, reduced by 24.61 % vs. ERA5-Land, 2.46 % vs. ESA-CCI, and 0.80 % vs. SMAP L4), near-zero bias (−0.001 cm3 cm−3, superior to all others), and the top NNSE (0.423, improved by 30.57 % over ERA5-Land, 12.54 % over ESA-CCI, and 1.46 % over SMAP L4). These improvements confirm the effectiveness of our proposed adjusted ERA5-Land dataset in enhancing accuracy and consistency across diverse regions and climates globally.
Furthermore, we extended the temporal coverage to span 1950 to October 2025 by applying scaling coefficients derived from the calibration period (2015–2025). To justify this backward extension, we conducted a rigorous historical validation using the independent ISMN dataset spanning 1960 to 2015. The adjusted ERA5-Land consistently outperformed the original ERA5-Land throughout this historical period, achieving a 19.7 % reduction in RMSE and a 26.6 % improvement in NNSE, demonstrating robustness even in the extended timeframe. This was further supported by a climate sensitivity analysis, which confirmed that the adjustment parameters in the mean-variance rescaling method remain stable under contrasting wet and dry climatic conditions. These findings provide rare observational evidence verifying the assumption that statistical relationships established in the calibration period remain consistent over time.
Secondly, the spatiotemporal coverage analysis revealed distinct product characteristics. ERA5-Land and adjusted ERA5-Land provided seamless global coverage, while ESA-CCI exhibited substantial data gaps with a median value of 21.7 % and a mean of 24.4 %, particularly in high-latitude, vegetated, and alpine regions, with seasonal variations and larger gaps in winter. SMAP L4 showed minimal gaps but was limited to after April 2015, highlighting the need for a balanced dataset, addressed by the proposed adjusted ERA5-Land dataset.
Thirdly, the systematic evaluation of ERA5-Land, ESA-CCI (v09.1 Combined), and SMAP L4 against in situ measurements, identified their complementary strengths and limitations. ERA5-Land offers seamless coverage suitable for applications requiring high temporal coverage, which exhibited high correlation against measurements with r of 0.69, but stronger bias due to its reanalysis-based approach. SMAP L4, on the other hand, demonstrated optimal accuracy, benefiting from integrated satellite and modeling data. SMAP L4 therefore delivers observational accuracy ideal for regional studies, though its temporal coverage (April 2015–present) limits long-term studies. Regarding the ESA-CCI dataset, it integrates multiple datasets and supports long-term climate trend analysis, but requires careful handling of its unignorable data gaps, rendering it less suitable for continuous applications. These findings highlight the trade-offs in existing products, i.e., ERA5-Land's bias undermines its reliability, ESA-CCI's gaps restrict its usability, and SMAP L4's short record constrains historical analyses. The adjusted ERA5-Land, on the other hand, harmonizing the strengths of its predecessors, provides an integrated solution for globally consistent, increased accuracy, and reduced bias soil moisture product. Future efforts could explore fusing SMAP L4 and ESA-CCI to bias-correct ERA5-Land in regions where ESA-CCI provides sufficient coverage and demonstrates superior accuracy, taking advantage of their spatial accuracy differences to yield more robust global estimates.
Finally, this study pioneers the first global-scale comparative analysis of the ESA-CCI v09.1 combined product, evaluating its accuracy, data coverage, and performance relative to other soil moisture products. The findings of this study are consistent with existing literature, aligning with the comparison of existing moisture products. The overall analysis indicates that prior studies align with our results, thereby reinforcing the reliability of our methodology and validating the enhanced performance of the adjusted ERA5-Land dataset.
The supplement related to this article is available online at https://doi.org/10.5194/essd-18-1061-2026-supplement.
SF, WW, and YZ designed the study. SF and WW performed the data fusion and validation analysis and wrote the initial draft. WW and SF performed the data processing, with assistance from YZ, ZW, JD, and CL. WW and SF performed the quality control of the in situ data, with assistance from YZ. JD, LW, CL and HV provided critical feedback and revised the manuscript. All authors contributed to and approved the final version of the paper.
The contact author has declared that none of the authors has any competing interests.
Publisher's note: Copernicus Publications remains neutral with regard to jurisdictional claims made in the text, published maps, institutional affiliations, or any other geographical representation in this paper. The authors bear the ultimate responsibility for providing appropriate place names. Views expressed in the text are those of the authors and do not necessarily reflect the views of the publisher.
This research has been supported by the National Natural Science Foundation of China (grant nos. 42472327, 42077168, and 42293260).
This paper was edited by Jiafu Mao and reviewed by two anonymous referees.
Afshar, M. H., Yilmaz, M. T., and Crow, W. T.: Impact of Rescaling Approaches in Simple Fusion of Soil Moisture Products, Water Resour. Res., 55, 7804–7825, https://doi.org/10.1029/2019WR025111, 2019.
Almendra-Martín, L., Martínez-Fernández, J., Piles, M., González-Zamora, Á., Benito-Verdugo, P., and Gaona, J.: Influence of atmospheric patterns on soil moisture dynamics in Europe, Sci. Total Environ., 846, 157537, https://doi.org/10.1016/j.scitotenv.2022.157537, 2022.
Babaeian, E., Sadeghi, M., Franz, T. E., Jones, S., and Tuller, M.: Mapping soil moisture with the OPtical TRApezoid Model (OPTRAM) based on long-term MODIS observations, Remote Sens. Environ., 211, 425–440, https://doi.org/10.1016/j.rse.2018.04.029, 2018.
Babaeian, E., Sadeghi, M., Jones, S. B., Montzka, C., Vereecken, H., and Tuller, M.: Ground, Proximal, and Satellite Remote Sensing of Soil Moisture, Rev. Geophys., 57, 530–616, https://doi.org/10.1029/2018RG000618, 2019.
Balsamo, G., Albergel, C., Beljaars, A., Boussetta, S., Brun, E., Cloke, H., Dee, D., Dutra, E., Muñoz-Sabater, J., Pappenberger, F., de Rosnay, P., Stockdale, T., and Vitart, F.: ERA-Interim/Land: a global land surface reanalysis data set, Hydrol. Earth Syst. Sci., 19, 389–407, https://doi.org/10.5194/hess-19-389-2015, 2015.
Bauer-Marschallinger, B., Freeman, V., Cao, S., Paulik, C., Schaufler, S., Stachl, T., Modanesi, S., Massari, C., Ciabatta, L., Brocca, L., and Wagner, W.: Toward Global Soil Moisture Monitoring With Sentinel-1: Harnessing Assets and Overcoming Obstacles, IEEE Trans. Geosci. Remote Sens., 57, 520–539, https://doi.org/10.1109/TGRS.2018.2858004, 2019.
Beaudoing, H. and Rodell, M.: GLDAS (Global Land Data Assimilation System) Version 2.1 README, NASA Goddard Earth Sciences Data and Information Services Center (GES DISC), Greenbelt, MD, USA, https://hydro1.gesdisc.eosdis.nasa.gov/data/GLDAS/GLDAS_NOAH025_3H.2.1/doc/README_GLDAS2.pdf (last access: 4 February 2026), 2020.
Beck, H. E., Zimmermann, N. E., McVicar, T. R., Vergopolan, N., Berg, A., and Wood, E. F.: Present and future Köppen-Geiger climate classification maps at 1-km resolution, Sci. Data, 5, 180214, https://doi.org/10.1038/sdata.2018.214, 2018.
Bogena, H. R., Schrön, M., Jakobi, J., Ney, P., Zacharias, S., Andreasen, M., Baatz, R., Boorman, D., Duygu, M. B., Eguibar-Galán, M. A., Fersch, B., Franke, T., Geris, J., González Sanchis, M., Kerr, Y., Korf, T., Mengistu, Z., Mialon, A., Nasta, P., Nitychoruk, J., Pisinaras, V., Rasche, D., Rosolem, R., Said, H., Schattan, P., Zreda, M., Achleitner, S., Albentosa-Hernández, E., Akyürek, Z., Blume, T., del Campo, A., Canone, D., Dimitrova-Petrova, K., Evans, J. G., Ferraris, S., Frances, F., Gisolo, D., Güntner, A., Herrmann, F., Iwema, J., Jensen, K. H., Kunstmann, H., Lidón, A., Looms, M. C., Oswald, S., Panagopoulos, A., Patil, A., Power, D., Rebmann, C., Romano, N., Scheiffele, L., Seneviratne, S., Weltin, G., and Vereecken, H.: COSMOS-Europe: a European network of cosmic-ray neutron soil moisture sensors, Earth Syst. Sci. Data, 14, 1125–1151, https://doi.org/10.5194/essd-14-1125-2022, 2022.
Cantoni, E., Tramblay, Y., Grimaldi, S., Salamon, P., Dakhlaoui, H., Dezetter, A., and Thiemig, V.: Hydrological performance of the ERA5 reanalysis for flood modeling in Tunisia with the LISFLOOD and GR4J models, J. Hydrol.-Reg. Stud., 42, 101169, https://doi.org/10.1016/j.ejrh.2022.101169, 2022.
Colliander, A., Jackson, T. J., Bindlish, R., Chan, S., Das, N., Kim, S. B., Cosh, M. H., Dunbar, R. S., Dang, L., Pashaian, L., Asanuma, J., Aida, K., Berg, A., Rowlandson, T., Bosch, D., Caldwell, T., Caylor, K., Goodrich, D., Al Jassar, H., Lopez-Baeza, E., Martínez-Fernández, J., González-Zamora, A., Livingston, S., McNairn, H., Pacheco, A., Moghaddam, M., Montzka, C., Notarnicola, C., Niedrist, G., Pellarin, T., Prueger, J., Pulliainen, J., Rautiainen, K., Ramos, J., Seyfried, M., Starks, P., Su, Z., Zeng, Y., Van Der Velde, R., Thibeault, M., Dorigo, W., Vreugdenhil, M., Walker, J. P., Wu, X., Monerris, A., O'Neill, P. E., Entekhabi, D., Njoku, E. G., and Yueh, S.: Validation of SMAP surface soil moisture products with core validation sites, Remote Sens. Environ., 191, 215–231, https://doi.org/10.1016/j.rse.2017.01.021, 2017.
Colliander, A., Jackson, T. J., Chan, S. K., O'Neill, P., Bindlish, R., Cosh, M. H., Caldwell, T., Walker, J. P., Berg, A., McNairn, H., Thibeault, M., Martínez-Fernández, J., Jensen, K. H., Asanuma, J., Seyfried, M. S., Bosch, D. D., Starks, P. J., Holifield Collins, C., Prueger, J. H., Su, Z., Lopez-Baeza, E., and Yueh, S. H.: An assessment of the differences between spatial resolution and grid size for the SMAP enhanced soil moisture product over homogeneous sites, Remote Sens. Environ., 207, 65–70, https://doi.org/10.1016/j.rse.2018.02.006, 2018.
Crow, W. T., Berg, A. A., Cosh, M. H., Loew, A., Mohanty, B. P., Panciera, R., de Rosnay, P., Ryu, D., and Walker, J. P.: Upscaling sparse ground-based soil moisture observations for the validation of coarse-resolution satellite soil moisture products, Rev. Geophys., 50, https://doi.org/10.1029/2011RG000372, 2012.
Crow, W. T., Lei, F., Hain, C., Anderson, M. C., Scott, R. L., Billesbach, D., and Arkebauer, T.: Robust estimates of soil moisture and latent heat flux coupling strength obtained from triple collocation, Geophys. Res. Lett., 42, 8415–8423, https://doi.org/10.1002/2015GL065929, 2015.
Dalla Torre, D., Di Marco, N., Menapace, A., Avesani, D., Righetti, M., and Majone, B.: Suitability of ERA5-Land reanalysis dataset for hydrological modelling in the Alpine region, J. Hydrol.-Reg. Stud., 52, 101718, https://doi.org/10.1016/j.ejrh.2024.101718, 2024.
Di Virgilio, G., Ji, F., Tam, E., Evans, J. P., Kala, J., Andrys, J., Thomas, C., Choudhury, D., Rocha, C., Li, Y., and Riley, M. L.: Evaluation of CORDEX ERA5-forced NARCliM2.0 regional climate models over Australia using the Weather Research and Forecasting (WRF) model version 4.1.2, Geosci. Model Dev., 18, 703–724, https://doi.org/10.5194/gmd-18-703-2025, 2025.
Dorigo, W., Himmelbauer, I., Aberer, D., Schremmer, L., Petrakovic, I., Zappa, L., Preimesberger, W., Xaver, A., Annor, F., Ardö, J., Baldocchi, D., Bitelli, M., Blöschl, G., Bogena, H., Brocca, L., Calvet, J.-C., Camarero, J. J., Capello, G., Choi, M., Cosh, M. C., van de Giesen, N., Hajdu, I., Ikonen, J., Jensen, K. H., Kanniah, K. D., de Kat, I., Kirchengast, G., Kumar Rai, P., Kyrouac, J., Larson, K., Liu, S., Loew, A., Moghaddam, M., Martínez Fernández, J., Mattar Bader, C., Morbidelli, R., Musial, J. P., Osenga, E., Palecki, M. A., Pellarin, T., Petropoulos, G. P., Pfeil, I., Powers, J., Robock, A., Rüdiger, C., Rummel, U., Strobel, M., Su, Z., Sullivan, R., Tagesson, T., Varlagin, A., Vreugdenhil, M., Walker, J., Wen, J., Wenger, F., Wigneron, J. P., Woods, M., Yang, K., Zeng, Y., Zhang, X., Zreda, M., Dietrich, S., Gruber, A., van Oevelen, P., Wagner, W., Scipal, K., Drusch, M., and Sabia, R.: The International Soil Moisture Network: serving Earth system science for over a decade, Hydrol. Earth Syst. Sci., 25, 5749–5804, https://doi.org/10.5194/hess-25-5749-2021, 2021.
Dorigo, W. A., Wagner, W., Hohensinn, R., Hahn, S., Paulik, C., Xaver, A., Gruber, A., Drusch, M., Mecklenburg, S., van Oevelen, P., Robock, A., and Jackson, T.: The International Soil Moisture Network: a data hosting facility for global in situ soil moisture measurements, Hydrol. Earth Syst. Sci., 15, 1675–1698, https://doi.org/10.5194/hess-15-1675-2011, 2011.
Dorigo, W. A., Xaver, A., Vreugdenhil, M., Gruber, A., Hegyiová, A., Sanchis-Dufau, A. D., Zamojski, D., Cordes, C., Wagner, W., and Drusch, M.: Global Automated Quality Control of In Situ Soil Moisture Data from the International Soil Moisture Network, Vadose Zone J., 12, 1–21, https://doi.org/10.2136/vzj2012.0097, 2013.
Dorigo, W. A., Wagner, W., Albergel, C., Albrecht, F., Balsamo, G., Brocca, L. L., Chung, D., Ertl, M., Forkel, M., Gruber, A., Haas, E., Hamer, P. D., Hirschi, M., Ikonen, J., Jeu, R. A. M. de, Kidd, R., Lahoz, W. A., Liu, Y. Y., Miralles, D. G., Mistelbauer, T., Nicolai-Shaw, N., Parinussa, R. M., Pratola, C., Reimer, C., Schalie, R. van der, Seneviratne, S. I., Smolander, T., and Lecomte, P.: ESA CCI Soil Moisture for improved Earth system understanding: State-of-the art and future directions, Remote Sens. Environ., 203, 185–215, 2017.
Entekhabi, D., Njoku, E., and O’Neill, P.: The Soil Moisture Active and Passive Mission (SMAP): Science and applications, in: 2009 IEEE Radar Conference, 1–3, https://doi.org/10.1109/RADAR.2009.4977030, 2009.
Entekhabi, D., Njoku, E. G., O'Neill, P. E., Kellogg, K. H., Crow, W. T., Edelstein, W. N., Entin, J. K., Goodman, S. D., Jackson, T. J., Johnson, J., Kimball, J., Piepmeier, J. R., Koster, R. D., Martin, N., McDonald, K. C., Moghaddam, M., Moran, S., Reichle, R., Shi, J. C., Spencer, M. W., Thurman, S. W., Tsang, L., and Van Zyl, J.: The Soil Moisture Active Passive (SMAP) Mission, Proc. IEEE, 98, 704–716, https://doi.org/10.1109/JPROC.2010.2043918, 2010.
Fan, X., Liu, Y., Gan, G., and Wu, G.: SMAP underestimates soil moisture in vegetation-disturbed areas primarily as a result of biased surface temperature data, Remote Sens. Environ., 247, 111914, https://doi.org/10.1016/j.rse.2020.111914, 2020.
Glaser, B. and Lehr, V.-I.: Biochar effects on phosphorus availability in agricultural soils: A meta-analysis, Sci. Rep., 9, https://doi.org/10.1038/s41598-019-45693-z, 2019.
Green, J. K., Seneviratne, S. I., Berg, A. M., Findell, K. L., Hagemann, S., Lawrence, D. M., and Gentine, P.: Large influence of soil moisture on long-term terrestrial carbon uptake, Nature, 565, 476–479, https://doi.org/10.1038/s41586-018-0848-x, 2019.
Gruber, A., Su, C.-H., Zwieback, S., Crow, W., Dorigo, W., and Wagner, W.: Recent advances in (soil moisture) triple collocation analysis, Int. J. Appl. Earth Obs. Geoinf., 45, 200–211, https://doi.org/10.1016/j.jag.2015.09.002, 2016.
Gruber, A., Scanlon, T., van der Schalie, R., Wagner, W., and Dorigo, W.: Evolution of the ESA CCI Soil Moisture climate data records and their underlying merging methodology, Earth Syst. Sci. Data, 11, 717–739, https://doi.org/10.5194/essd-11-717-2019, 2019.
Guan, X., Huang, J., Guo, N., Bi, J., and Wang, G.: Variability of soil moisture and its relationship with surface albedo and soil thermal parameters over the Loess Plateau, Adv. Atmos. Sci., 26, 692–700, https://doi.org/10.1007/s00376-009-8198-0, 2009.
Hao, Y., Mao, J., Bachmann, C. M., Hoffman, F. M., Koren, G., Chen, H., Tian, H., Liu, J., Tao, J., Tang, J., Li, L., Liu, L., Apple, M., Shi, M., Jin, M., Zhu, Q., Kannenberg, S., Shi, X., Zhang, X., Wang, Y., Fang, Y., and Dai, Y.: Soil moisture controls over carbon sequestration and greenhouse gas emissions: a review, npj Clim. Atmos. Sci., 8, 16, https://doi.org/10.1038/s41612-024-00888-8, 2025.
Hersbach, H., Bell, B., Berrisford, P., Hirahara, S., Horányi, A., Muñoz-Sabater, J., Nicolas, J., Peubey, C., Radu, R., Schepers, D., Simmons, A., Soci, C., Abdalla, S., Abellan, X., Balsamo, G., Bechtold, P., Biavati, G., Bidlot, J., Bonavita, M., De Chiara, G., Dahlgren, P., Dee, D., Diamantakis, M., Dragani, R., Flemming, J., Forbes, R., Fuentes, M., Geer, A., Haimberger, L., Healy, S., Hogan, R. J., Hólm, E., Janisková, M., Keeley, S., Laloyaux, P., Lopez, P., Lupu, C., Radnoti, G., De Rosnay, P., Rozum, I., Vamborg, F., Villaume, S., and Thépaut, J.: The ERA5 global reanalysis, Q. J. Roy. Meteor. Soc., 146, 1999–2049, https://doi.org/10.1002/qj.3803, 2020.
Hirschi, M., Stradiotti, P., Crezee, B., Dorigo, W., and Seneviratne, S. I.: Potential of long-term satellite observations and reanalysis products for characterising soil drying: trends and drought events, Hydrol. Earth Syst. Sci., 29, 397–425, https://doi.org/10.5194/hess-29-397-2025, 2025.
Hoffmann, L., Günther, G., Li, D., Stein, O., Wu, X., Griessbach, S., Heng, Y., Konopka, P., Müller, R., Vogel, B., and Wright, J. S.: From ERA-Interim to ERA5: the considerable impact of ECMWF's next-generation reanalysis on Lagrangian transport simulations, Atmos. Chem. Phys., 19, 3097–3124, https://doi.org/10.5194/acp-19-3097-2019, 2019.
Hong, X., Jia, S., Zhu, W., and Song, Z.: Evaluation of global seamless soil moisture products over China: A perspective of soil moisture sensitivity to precipitation, J. Hydrol., 641, 131789, https://doi.org/10.1016/j.jhydrol.2024.131789, 2024.
Humphrey, V., Berg, A., Ciais, P., Gentine, P., Jung, M., Reichstein, M., Seneviratne, S. I., and Frankenberg, C.: Soil moisture–atmosphere feedback dominates land carbon uptake variability, Nature, 592, 65–69, https://doi.org/10.1038/s41586-021-03325-5, 2021.
Imaoka, K., Kachi, M., Kasahara, M., Ito, N., Nakagawa, K., and Oki, T.: Instrument performance and calibration of AMSR-E and AMSR2, Int. Arch. Photogramm. Remote Sens. Spatial Inf. Sci., XXXVIII, Part 8, International Society for Photogrammetry and Remote Sensing (ISPRS), https://www.isprs.org/proceedings/XXXVIII/part8/pdf/JTS13_20100322190615.pdf (last access: 04 February 2026), 2010.
Kerr, Y. H., Waldteufel, P., Wigneron, J.-P., Delwart, S., Cabot, F., Boutin, J., Escorihuela, M.-J., Font, J., Reul, N., Gruhier, C., Juglea, S. E., Drinkwater, M. R., Hahne, A., Martín-Neira, M., and Mecklenburg, S.: The SMOS Mission: New Tool for Monitoring Key Elements ofthe Global Water Cycle, Proc. IEEE, 98, 666–687, https://doi.org/10.1109/JPROC.2010.2043032, 2010.
Koster, R. D., Dirmeyer, P. A., Guo, Z., Bonan, G., Chan, E., Cox, P., Gordon, C. T., Kanae, S., Kowalczyk, E., Lawrence, D., Liu, P., Lu, C.-H., Malyshev, S., McAvaney, B., Mitchell, K., Mocko, D., Oki, T., Oleson, K., Pitman, A., Sud, Y. C., Taylor, C. M., Verseghy, D., Vasic, R., Xue, Y., Yamada, T., and GLACE Team: Regions of strong coupling between soil moisture and precipitation, Science, 305, 1138–1140, https://doi.org/10.1126/science.1100217, 2004.
Kroll, C. N., Croteau, K. E., and Vogel, R. M.: Hypothesis tests for hydrologic alteration, Journal of Hydrology, 530, 117–126, https://doi.org/10.1016/j.jhydrol.2015.09.057, 2015.
Lal, P., Singh, G., Das, N. N., Colliander, A., and Entekhabi, D.: Assessment of ERA5-Land Volumetric Soil Water Layer Product Using In Situ and SMAP Soil Moisture Observations, IEEE Geosci. Remote Sens. Lett., 19, 1–5, https://doi.org/10.1109/LGRS.2022.3223985, 2022.
Lanzante, J. R.: Testing for differences between two distributions in the presence of serial correlation using the Kolmogorov–Smirnov and Kuiper's tests, International Journal of Climatology, 41, 6314–6323, https://doi.org/10.1002/joc.7196, 2021.
Li, C., Liu, T., and Wu, D.: Anomaly data detection method for in situ automatic soil moisture, Arid Land Geogr., 44, 1094–1102, 2021a.
Li, Q., Shi, G., Shangguan, W., Nourani, V., Li, J., Li, L., Huang, F., Zhang, Y., Wang, C., Wang, D., Qiu, J., Lu, X., and Dai, Y.: A 1 km daily soil moisture dataset over China using in situ measurement and machine learning, Earth Syst. Sci. Data, 14, 5267–5286, https://doi.org/10.5194/essd-14-5267-2022, 2022.
Li, W., Wang, G., Mu, Z., Qi, S., Zhou, S., and Xiang, D.: Microbially-Mediated Soil Carbon-Nitrogen Dynamics in Response to Future Soil Moisture Change, Earth's Future, 13, e2024EF005521, https://doi.org/10.1029/2024EF005521, 2025a.
Li, Y.-X., Leng, P., Kasim, A. A., and Li, Z.-L.: Spatiotemporal variability and dominant driving factors of satellite observed global soil moisture from 2001 to 2020, J. Hydrol., 654, 132848, https://doi.org/10.1016/j.jhydrol.2025.132848, 2025b.
Li, Z.-L., Leng, P., Zhou, C., Chen, K.-S., Zhou, F.-C., and Shang, G.-F.: Soil moisture retrieval from remote sensing measurements: Current knowledge and directions for the future, Earth Sci. Rev., 218, 103673, https://doi.org/10.1016/j.earscirev.2021.103673, 2021b.
Ma, H., Zeng, J., Chen, N., Zhang, X., Cosh, M. H., and Wang, W.: Satellite surface soil moisture from SMAP, SMOS, AMSR2 and ESA CCI: A comprehensive assessment using global ground-based observations, Remote Sens. Environ., 231, 111215, https://doi.org/10.1016/j.rse.2019.111215, 2019.
Madelon, R., Rodríguez-Fernández, N. J., van der Schalie, R., Scanlon, T., Al Bitar, A., Kerr, Y. H., de Jeu, R., and Dorigo, W.: Toward the Removal of Model Dependency in Soil Moisture Climate Data Records by Using an L-Band Scaling Reference, JSTARS, 15, 831–848, https://doi.org/10.1109/JSTARS.2021.3137008, 2022.
Manrique-Alba, À., Ruiz-Yanetti, S., Moutahir, H., Novak, K., De Luis, M., and Bellot, J.: Soil moisture and its role in growth-climate relationships across an aridity gradient in semiarid Pinus halepensis forests, Sci. Total Environ., 574, 982–990, https://doi.org/10.1016/j.scitotenv.2016.09.123, 2017.
Massey, F. J.: The Kolmogorov-Smirnov Test for Goodness of Fit, Journal of the American Statistical Association, 46, 68–78, https://doi.org/10.1080/01621459.1951.10500769, 1951.
Mazzariello, A., Albano, R., Lacava, T., Manfreda, S., and Sole, A.: Intercomparison of recent microwave satellite soil moisture products on European ecoregions, J. Hydrol., 626, 130311, https://doi.org/10.1016/j.jhydrol.2023.130311, 2023.
McColl, K. A., Alemohammad, S. H., Akbar, R., Konings, A. G., Yueh, S., and Entekhabi, D.: The global distribution and dynamics of surface soil moisture, Nat. Geosci., 10, 100–104, https://doi.org/10.1038/ngeo2868, 2017.
Mohanty, B. P., Cosh, M. H., Lakshmi, V., and Montzka, C.: Soil Moisture Remote Sensing: State-of-the-Science, Vadose Zone J., 16, 1–9, https://doi.org/10.2136/vzj2016.10.0105, 2017.
Mu, T., Liu, G., Yang, X., and Yu, Y.: Soil-Moisture Estimation Based on Multiple-Source Remote-Sensing Images, Remote Sens., 15, 139, https://doi.org/10.3390/rs15010139, 2022.
Muñoz-Sabater, J., Dutra, E., Agustí-Panareda, A., Albergel, C., Arduini, G., Balsamo, G., Boussetta, S., Choulga, M., Harrigan, S., Hersbach, H., Martens, B., Miralles, D. G., Piles, M., Rodríguez-Fernández, N. J., Zsoter, E., Buontempo, C., and Thépaut, J.-N.: ERA5-Land: a state-of-the-art global reanalysis dataset for land applications, Earth Syst. Sci. Data, 13, 4349–4383, https://doi.org/10.5194/essd-13-4349-2021, 2021.
Nogueira, M., Albergel, C., Boussetta, S., Johannsen, F., Trigo, I. F., Ermida, S. L., Martins, J. P. A., and Dutra, E.: Role of vegetation in representing land surface temperature in the CHTESSEL (CY45R1) and SURFEX-ISBA (v8.1) land surface models: a case study over Iberia, Geosci. Model Dev., 13, 3975–3993, https://doi.org/10.5194/gmd-13-3975-2020, 2020.
Nossent, J. and Bauwens, W.: Application of a normalized Nash-Sutcliffe efficiency to improve the accuracy of the Sobol' sensitivity analysis of a hydrological model, Geophys. Res. Abstr., 14, EGU2012-237, https://meetingorganizer.copernicus.org/EGU2012/EGU2012-237.pdf (last access: 4 February 2026), 2012.
Ochsner, T. E., Cosh, M. H., Cuenca, R. H., Dorigo, W. A., Draper, C. S., Hagimoto, Y., Kerr, Y. H., Larson, K. M., Njoku, E. G., Small, E. E., and Zreda, M.: State of the Art in Large-Scale Soil Moisture Monitoring, Soil Sci. Soc. Am. J., 77, 1888–1919, https://doi.org/10.2136/sssaj2013.03.0093, 2013.
Ortet, J., Mialon, A., Kerr, Y., Royer, A., Berg, A., Boike, J., Humphreys, E., Gibon, F., Richaume, P., Bircher-Adrot, S., Gorrab, A., and Roy, A.: Evaluating soil moisture retrieval in Arctic and sub-Arctic environments using passive microwave satellite data, Int. J. Digital Earth, 17, 2385079, https://doi.org/10.1080/17538947.2024.2385079, 2024.
Preimesberger, W., Scanlon, T., Su, C.-H., Gruber, A., and Dorigo, W. A.: Homogenization of Structural Breaks in the Global ESA CCI Soil Moisture Multisatellite Climate Data Record, IEEE Trans. Geosci. Remote Sens., 59, 2845–2862, 2020.
Reichle, R. H., Liu, Q., Koster, R. D., Crow, W. T., De Lannoy, G. J. M., Kimball, J. S., Ardizzone, J. V., Bosch, D., Colliander, A., Cosh, M., Kolassa, J., Mahanama, S. P., Prueger, J., Starks, P., and Walker, J. P.: Version 4 of the SMAP level-4 soil moisture algorithm and data product, J. Adv. Model. Earth Syst., 11, 3106–3130, https://doi.org/10.1029/2019MS001729, 2019.
Robinson, D. A., Campbell, C. S., Hopmans, J. W., Hornbuckle, B. K., Jones, S. B., Knight, R., Ogden, F., Selker, J., and Wendroth, O.: Soil Moisture Measurement for Ecological and Hydrological Watershed-Scale Observatories: A Review, Vadose Zone J., 7, 358–389, https://doi.org/10.2136/vzj2007.0143, 2008.
Rodell, M., Houser, P. R., Jambor, U., Gottschalck, J., Mitchell, K., Meng, C.-J., Arsenault, K., Cosgrove, B., Radakovich, J., Bosilovich, M., Entin, J. K., Walker, J. P., Lohmann, D., and Toll, D.: The Global Land Data Assimilation System, B. Am. Meteorol. Soc., 85, 381–394, https://doi.org/10.1175/BAMS-85-3-381, 2004.
Ruosteenoja, K., Markkanen, T., Venäläinen, A., Räisänen, P., and Peltola, H.: Seasonal soil moisture and drought occurrence in Europe in CMIP5 projections for the 21st century, Clim. Dynam., 50, 1177–1192, https://doi.org/10.1007/s00382-017-3671-4, 2018.
Sang, Y., Ren, H.-L., Shi, X., Xu, X., and Chen, H.: Improvement of Soil Moisture Simulation in Eurasia by the Beijing Climate Center Climate System Model from CMIP5 to CMIP6, Adv. Atmos. Sci., 38, 237–252, https://doi.org/10.1007/s00376-020-0167-7, 2021.
Shi, P., Leung, L. R., Lu, H., Wang, B., Yang, K., and Chen, H.: Uncovering the interannual predictability of the 2003 European summer heatwave linked to the Tibetan Plateau, npj Clim. Atmos. Sci., 7, 242, https://doi.org/10.1038/s41612-024-00782-3, 2024.
Trugman, A., Medvigy, D., Mankin, J., and Anderegg, W.: Soil Moisture Stress as a Major Driver of Carbon Cycle Uncertainty, Geophys. Res. Lett., 45, 6495–6503, https://doi.org/10.1029/2018GL078131, 2018.
Vereecken, H., Huisman, J. A., Bogena, H., Vanderborght, J., Vrugt, J. A., and Hopmans, J. W.: On the value of soil moisture measurements in vadose zone hydrology: A review, Water Resour. Res., 44, https://doi.org/10.1029/2008WR006829, 2008.
Vereecken, H., Amelung, W., Bauke, S. L., Bogena, H., Brüggemann, N., Montzka, C., Vanderborght, J., Bechtold, M., Blöschl, G., Carminati, A., Javaux, M., Konings, A. G., Kusche, J., Neuweiler, I., Or, D., Steele-Dunne, S., Verhoef, A., Young, M., and Zhang, Y.: Soil hydrology in the Earth system, Nat. Rev. Earth Environ., 3, 573–587, https://doi.org/10.1038/s43017-022-00324-6, 2022.
Wang, C., Gu, X., Zhou, X., Yang, J., Yu, T., Tao, Z., Gao, H., Liu, Q., Zhan, Y., Wei, X., Li, J., Zhang, L., Li, L., Li, B., Feng, Z., Wang, X., Fu, R., Zheng, X., Wang, C., Sun, Y., Li, B., and Dong, W.: Chinese Soil Moisture Observation Network and Time Series Data Set for High Resolution Satellite Applications, Sci. Data, 10, 424, https://doi.org/10.1038/s41597-023-02234-8, 2023.
Wang, J., Zhao, Y., Ren, Z., and Gao, J.: Design and Verification of Quality Control Methods for Automatic Soil Moisture Observation Data in China, Meteorol. Mon., 44, 244–257, https://doi.org/10.7519/j.issn.1000-0526.2018.02.004, 2018.
Wang, L. and He, Y.: Research on Outlier Threshold of Automatic SoilMoisture Observation Data, Meteorol. Mon., 41, 1017–1022, https://doi.org/10.7519/j.issn.1000-0526.2015.08.011, 2015.
Wang, W., Feng, S., Zhang, Y., Wei, Z., Dong, J., Weihermüller, L., Liu, C.-Q., and Vereecken, H.: Fusing ERA5-Land and SMAP L4 for an Improved Global Soil Moisture Product (1950–2025) (V2), Science Data Bank [data set], https://doi.org/10.57760/sciencedb.30546, 2026.
Wang, X., Edwards, R. L., Auler, A. S., Cheng, H., Kong, X., Wang, Y., Cruz, F. W., Dorale, J. A., and Chiang, H.-W.: Hydroclimate changes across the Amazon lowlands over the past 45,000 years, Nature, 541, 204–207, https://doi.org/10.1038/nature20787, 2017.
Wang, Y., Leng, P., Peng, J., Marzahn, P., and Ludwig, R.: Global assessments of two blended microwave soil moisture products CCI and SMOPS with in-situ measurements and reanalysis data, Int. J. Appl. Earth Obs. Geoinf., 94, 102234, https://doi.org/10.1016/j.jag.2020.102234, 2021.
Wang, Y., Sun, H., Xu, Z., Gao, J., Xu, H., Zhang, T., and Wu, D.: GSSM: A global seamless soil moisture dataset from 1981 to 2022 matching CCI to SMAP with a novel bias correction method, Earth Syst. Sci. Data Discuss. [preprint], https://doi.org/10.5194/essd-2024-200, 2024.
Wu, Z., Feng, H., He, H., Zhou, J., and Zhang, Y.: Evaluation of Soil Moisture Climatology and Anomaly Components Derived From ERA5-Land and GLDAS-2.1 in China, Water Resour. Manage., 35, 629–643, https://doi.org/10.1007/s11269-020-02743-w, 2021.
Xie, Q., Jia, L., Menenti, M., Chen, Q., Bi, J., Chen, Y., Wang, C., and Yu, X.: Evaluation of remote sensing soil moisture data products with a new approach to analyse footprint mismatch with in-situ measurements, Int. J. Digit. Earth, 17, https://doi.org/10.1080/17538947.2024.2437051, 2024.
Xu, X. and Frey, S. K.: Validation of SMOS, SMAP, and ESA CCI Soil Moisture Over a Humid Region, IEEE J. Sel. Topics Appl. Earth Observ. Remote Sens., 14, 10784–10793, https://doi.org/10.1109/JSTARS.2021.3122068, 2021.
Zeri, M., S. Alvalá, R. C., Carneiro, R., Cunha-Zeri, G., Costa, J. M., Rossato Spatafora, L., Urbano, D., Vall-Llossera, M., and Marengo, J.: Tools for Communicating Agricultural Drought over the Brazilian Semiarid Using the Soil Moisture Index, Water, 10, 1421, https://doi.org/10.3390/w10101421, 2018.
Zhang, D. and Zhou, G.: Estimation of Soil Moisture from Optical and Thermal Remote Sensing: A Review, Sensors, 16, 1308, https://doi.org/10.3390/s16081308, 2016.
Zhang, L., LV, H., and Wang, L.: Analysis and Calibration of Singular Historical: Observed Data of Manual Soil Water, Meteorol. Mon., 43, 189–196, 2017.
Zhang, Q., Yuan, Q., Li, J., Wang, Y., Sun, F., and Zhang, L.: Generating seamless global daily AMSR2 soil moisture (SGD-SM) long-term products for the years 2013–2019, Earth Syst. Sci. Data, 13, 1385–1401, https://doi.org/10.5194/essd-13-1385-2021, 2021a.
Zhang, R., Kim, S., Sharma, A., and Lakshmi, V.: Identifying relative strengths of SMAP, SMOS-IC, and ASCAT to capture temporal variability, Remote Sens. Environ., 252, 112126, https://doi.org/10.1016/j.rse.2020.112126, 2021b.
Zhang, Y., Schaap, M. G., and Zha, Y.: A High-Resolution Global Map of Soil Hydraulic Properties Produced by a Hierarchical Parameterization of a Physically Based Water Retention Model, Water Resour. Res., 54, 9774–9790, https://doi.org/10.1029/2018WR023539, 2018.
Zhang, Y., Liang, S., Ma, H., He, T., Wang, Q., Li, B., Xu, J., Zhang, G., Liu, X., and Xiong, C.: Generation of global 1 km daily soil moisture product from 2000 to 2020 using ensemble learning, Earth Syst. Sci. Data, 15, 2055–2079, https://doi.org/10.5194/essd-15-2055-2023, 2023.
Zheng, C., Jia, L., and Zhao, T.: A 21-year dataset (2000–2020) of gap-free global daily surface soil moisture at 1-km grid resolution, Sci. Data, 10, 139, https://doi.org/10.1038/s41597-023-01991-w, 2023.