the Creative Commons Attribution 4.0 License.
the Creative Commons Attribution 4.0 License.
 | 05 Mar 2025
A new high-resolution multi-drought-index dataset for mainland China
Qi Zhang
Jiajia Su
Jiaojiao Gou
Jinlong Hu
Xi Zhao
Ye Xu
Drought indices are crucial for assessing and managing water scarcity and agricultural risks; however, the lack of a unified data foundation in existing datasets leads to inconsistencies that challenge the comparability of drought indices. This study is dedicated to creating CHM_Drought, an innovative and comprehensive long-term meteorological drought dataset with a spatial resolution of 0.1° and with data collected from 1961 to 2022 in mainland China. It features six pivotal meteorological drought indices: the standardized precipitation index (SPI), standardized precipitation evapotranspiration index (SPEI), evaporative demand drought index (EDDI), Palmer drought severity index (PDSI), self-calibrating Palmer drought severity index (SC-PDSI), and vapor pressure deficit (VPD), of which the SPI, SPEI, and EDDI contain multi-scale features for periods of 2 weeks and 1–12 months. The dataset features a comprehensive application of high-density meteorological station data and a complete framework starting from basic meteorological elements (the China Hydro-Meteorology dataset, CHM). Demonstrating its robustness, the dataset excels in accurately capturing drought events across mainland China, as evidenced by its detailed depiction of the 2022 summer drought in the Yangtze River basin. In addition, to evaluate CHM_Drought, we performed consistency tests with the drought indices calculated based on Climatic Research Unit (CRU) and CN05.1 data and found that all indices had high consistency overall and that the 2-week-scale SPI, SPEI, and EDDI had potential early-warning roles in drought monitoring. Overall, our dataset bridges the gap in high-precision multi-index drought data in China, and the complete CHM-based framework ensures the consistency and reliability of the dataset, which contributes to enhancing the understanding of drought patterns and trends in China. Free access to the dataset can be found at https://doi.org/10.5281/zenodo.14634773 (Zhang and Miao, 2025).
- Article
(9517 KB) - Full-text XML
-
Supplement
(2789 KB) - BibTeX
- EndNote


Drought is defined as a persistent shortage of water (i.e., below normal levels), exerting various impacts on the functionality of natural ecosystems and socio-economic structures (WMO, 2012). It can significantly affect ecosystems (Gampe et al., 2021), agricultural practices (Lesk et al., 2021), water resources (Dobson et al., 2020), and socio-economic conditions (Naumann et al., 2021). Between 1999 and 2020, droughts affected an average of 69.21 million people annually worldwide, causing direct economic losses amounting to approximately USD 62.7 billion (GNDAR, 2021). The progression of climate change foretells an increase in drought occurrences, which are expected to escalate in terms of frequency, intensity, duration, and scope (Wang et al., 2022). Therefore, the development of high-quality, multi-index drought datasets has become crucial to monitor and analyze drought and to reduce the losses caused by drought.
The diversity of drought types poses significant challenges in drought assessment, leading to their classification into four categories: meteorological, hydrological, agricultural, and socio-economic droughts (Mishra and Singh, 2010). Meteorological drought – originating primarily from insufficient precipitation and exacerbated by global warming effects like increased potential evapotranspiration (Aadhar and Mishra, 2020) and rising saturated vapor pressure differences (Gamelin et al., 2022) – is the foundational cause of other drought types (Zhang et al., 2022a). Considering the impact of agricultural drought on both food crops and other vegetation types, some researchers have broadened its scope to encompass all natural and artificial vegetation or even the entire ecosystem, termed ecological drought (Sadiqi et al., 2022). Hydrological drought is characterized by inadequate surface and groundwater resources within water resource management systems, with runoff data commonly being utilized for its analysis (Dracup et al., 1980). Socio-economic drought, on the other hand, is associated with the inability of water resource systems to satisfy water demands (Huang et al., 2016; Shi et al., 2018). Because meteorological drought is the initial index and root cause of a series of interrelated drought types – such as agricultural drought, hydrological drought, and socio-economic drought – it is the basis of drought research, and the meteorological drought index has the most subtypes in drought monitoring and quantification (Svoboda and Fuchs, 2016; Heim, 2002).
The various meteorological drought indices each possess distinct advantages and limitations. The widely used Palmer drought severity index (PDSI) was an early metric; however, its applicability is limited in extreme climates and non-plains regions, and this limitation led Wells et al. (2004) to develop the self-calibrating PDSI (SC-PDSI), which enhances spatial comparability by using dynamically calculated constants and region-specific calibration. Given the complexity of the PDSI calculation (the input data include precipitation, temperature, and available water content), the standardized precipitation index (SPI; McKee et al., 1993), which requires only precipitation data and is simple to calculate, is by far the most widely used index and features multiple timescales to account for the cumulative effects of drought. However, considering meteorological drought's sensitivity to solar radiation, wind speed, air temperature, and relative humidity, Vicente-Serrano et al. (2010a) introduced the standardized precipitation evapotranspiration index (SPEI), which assesses droughts by calculating the climate water balance using the Penman–Monteith FAO equation (Allen et al., 1998) for potential evapotranspiration (PET). Building on the understanding of atmospheric factors influencing drought, the vapor pressure deficit (VPD) emerges as another crucial measure. The VPD quantifies the discrepancy between actual and saturated air moisture levels, with higher values signifying more arid conditions (Gamelin et al., 2022). This metric adds value to drought analysis by representing the thirst of the atmosphere for moisture, a vital factor that many other drought indices do not consider. In addition, Hobbins et al. (2016) noted that most drought indices primarily focus on precipitation and temperature, with few directly reflecting evaporation dynamics. To address this, the evaporative demand drought index (EDDI) was established, using the relationship between the atmospheric evaporation requirement (E0; Allen et al., 1998) and actual evapotranspiration (AET) and monitoring drought through E0's response to surface drying anomalies. This exploration of drought indices highlights the need for high-quality drought data that reflect the various climatic factors that contribute to drought, as well as the fact that such drought data are essential for accurately assessing drought and for developing strategies that can mitigate its far-reaching effects.
Global-scale drought datasets have been developed to assess and quantify the impacts of drought. The common ones mainly include a global multi-scale SPEI calculated based on Climatic Research Unit (CRU) monthly meteorological data (Beguería et al., 2010; Vicente-Serrano et al., 2010b), which span the period 1901–2022, with a spatial resolution of 0.5°, covering the global land. Pyarali et al. (2022) also calculated the SPEI, combining precipitation from the Climate Hazards Group InfraRed Precipitation with Stations (CHIRPS) dataset and PET from the Global Land Evaporation Amsterdam Model (GLEAM), covering the period 1981–2018 at a spatial resolution of 5 km. Liu et al. (2024) combined European Centre for Medium-Range Weather Forecasts (ECMWF) Reanalysis v5 (ERA5) precipitation and PET developed by Singer et al. (2021) to produce a multi-scale (5, 30, 90, 180, and 360 d) global SPEI dataset with a time span of 1982–2021 and a spatial resolution of 0.25°. In addition, there are some drought datasets such as the SPEI calculated based on ERA5 data (Vicente-Serrano et al., 2023), the PDSI calculated based on TerraClimate (Venkatappa and Sasaki, 2021), and the PDSI and SPEI calculated on the basis of data from the Gravity Recovery and Climate Experiment (GRACE; Zhao et al., 2017a, b). Since the accuracy of these datasets depends largely on the quality of the meteorological information, differences in the datasets used by different researchers to compute the same indices can lead to considerable differences in the results, which complicates cross-sectional comparisons. This point highlights the urgent need to utilize consistent and high-quality meteorological datasets for the calculation of these indices. Also, most existing drought indices focus on monthly or longer timescales and may not capture short-term (e.g., weekly scale) meteorological drought conditions. In addition, there are still controversial aspects in the calculation methods of some indices, such as PET and reference crop evapotranspiration (ET0), which have often been calculated in different ways. When considering AET under energy or water constraints, the ET0 estimates the upper limit of evapotranspiration under energy constraints, while, under water constraints, the land–atmosphere feedback affects ET0 in an opposite or complementary manner. Hobbins et al. (2016) suggested that ET0 could serve as an independent drought indicator and developed the EDDI. In contrast, Noguera et al. (2022) used PET, which is commonly used to calculate the SPEI, instead of ET0 to calculate the EDDI; this approach may differ greatly from Hobbins et al. (2016), either conceptually or in terms of calculation results. Overall, addressing these challenges requires a multifaceted approach that includes improving data quality and consistency, developing methods to capture a broader range of timescales, and clarifying drought index concepts and methods.
Drought is one of the most important types of natural disasters in China, causing the loss of 10×106 t of grain production each year and direct economic losses of up to CNY 44 billion per year (Su et al., 2018). Under global warming, the development of drought in China is showing a trend of increasing area, accelerating frequency, and worsening disaster (Zhang et al., 2022b). Entering the 21st century, drought events became more frequent. In northern China, northeastern China, northwestern China, and other areas, the drought situation is still severe, and some areas in the south have also become significantly drier with the increased frequency of major drought events (Zhai et al., 2010), especially with the widespread drought in the summer of 2022 in China's Yangtze River basin. The evapotranspiration anomaly for the whole river basin in summer was the second highest since 1960 (second only to 2013, with its high temperature and drought), which further aggravated the water deficit in the Yangtze River basin (Lyu et al., 2023).
Some scholars have developed drought datasets for China in order to better quantify, monitor, or forecast drought. Wang et al. (2021) developed daily versions of the SPI and SPEI to quantify short-term meteorological droughts using data collected over the period 1961–2018 from 484 meteorological stations, but their spatial coverage was limited to those 484 stations. There are also drought datasets calculated on the basis of different data products, such as that of Zhang et al. (2019), who integrated CN05.1 and near-real-time satellite precipitation products with the SPI dataset at a spatial resolution of 0.25°, covering 1961–2016. Zhang et al. (2023b) constructed a daily scale SPEI and SPI using data with a spatial resolution of 0.1° for the years 1979–2018 based on the China Meteorological Forcing Dataset (CMFD). Despite great progress in meteorological data sharing in China, high-resolution, multi-scale, multi-drought-index datasets are still lacking.
This paper aims to construct a new long-term (1961–2022) drought dataset (CHM_Drought), including the SPI, SPEI, PDSI, SC-PDSI, and VPD. According to the characteristics of these indices, we also considered multiple timescales (among them, the SPI, SPEI, and EDDI have scales of 1 to 12 months and 2 week). Then we evaluated the performance of CHM_Drought after comparative validation and proved that CHM_Drought can accurately identify specific characteristics of drought in China and that the complete framework based on the CHM (the China Hydro-Meteorology dataset) can increase our understanding of the pattern and trend of drought in mainland China. This can provide strong support for the development of drought management and response strategies.
2.1 Data
We used several datasets, including the daily meteorological station data (Fig. 1) from the China Meteorological Administration (CMA; http://data.cma.cn/, last access: 24 July 2024), gridded precipitation data from CHM_PRE (Han et al., 2023; https://data.tpdc.ac.cn/zh-hans/data/e5c335d9-cbb9-48a6-ba35-d67dd614bb8c, last access: 24 July 2024), and data from both CRU (https://crudata.uea.ac.uk/cru/data/hrg/, last access: 24 July 2024) and CN05.1 (a gridded daily observation dataset over mainland China; https://ccrc.iap.ac.cn/resource/detail?id=228, last access: 24 July 2024). First, we applied meteorological station data from the CMA to interpolate basic meteorological variables from 1961 to 2022 at a spatial resolution of 0.1°, including maximum temperature (Tmax), minimum temperature (Tmin), mean temperature (Tmean), average wind speed (wind), sunshine duration (Ssd), and average relative humidity (Rh). We directly used CHM_PRE and the interpolated meteorological data to compute CHM_Drought. The CN05.1 and CRU datasets were collected to evaluate CHM_Drought, with CRU data covering precipitation (pre), Tmax, Tmin, Tmean, wind, and Ssd and CN05.1 data covering pre, Tmax, Tmin, Tmean, wind, Rh, and Ssd. Notably, CN05.1's Ssd data span 1961 to 2018, while other variables span 1961 to 2022.
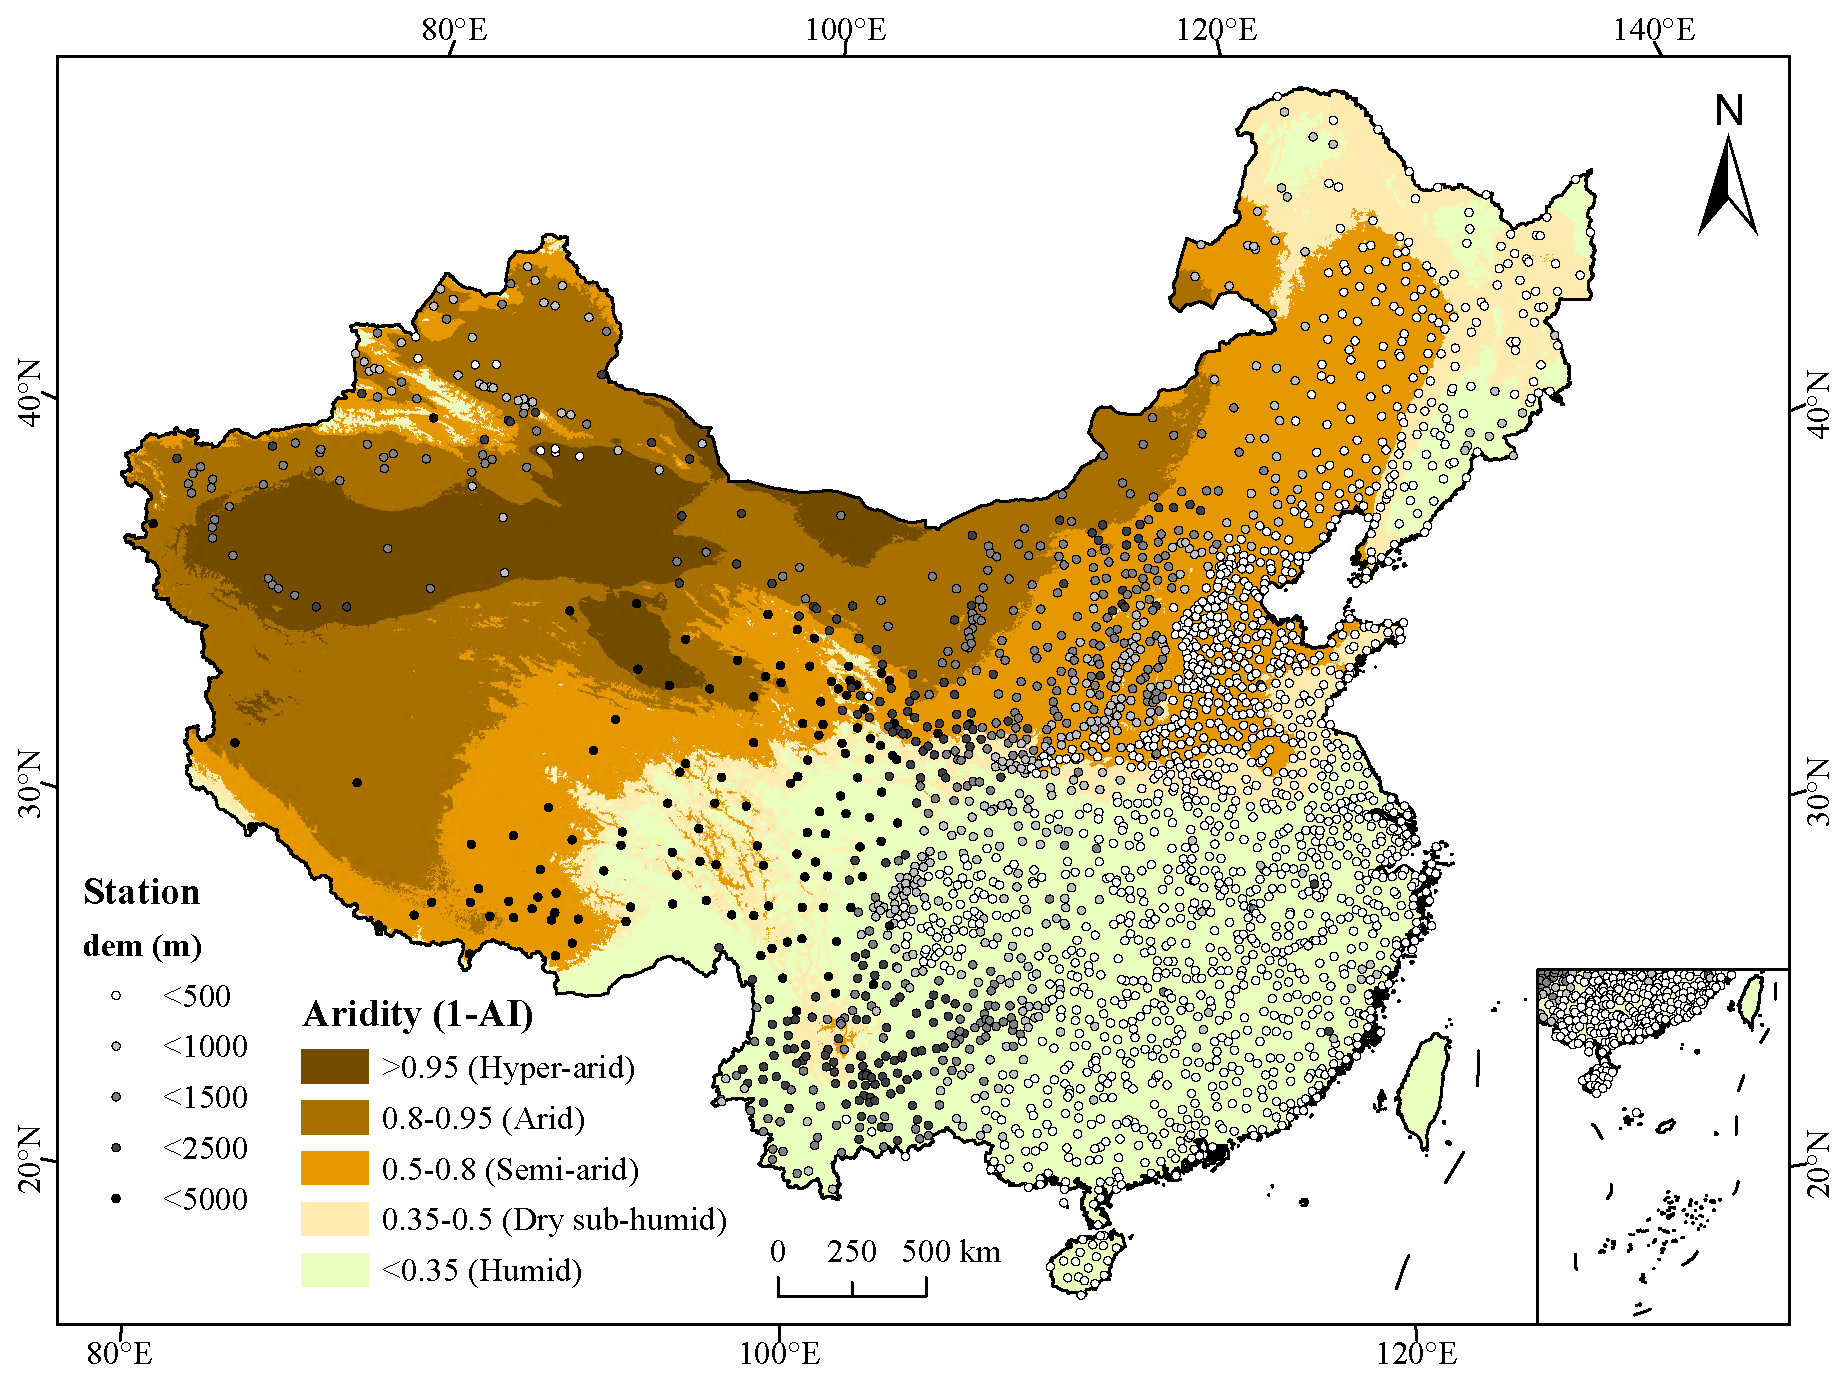
Figure 1Distribution of 2419 meteorological stations and pattern of China's drylands. The drylands are further classified into four subtypes based on the aridity (1−AI): hyper-arid (AI<0.05), arid (), semi-arid (), and dry sub-humid (). Shaded circles mark stations, and darker circles indicate higher elevations (digital elevation model, DEM).
In calculations for the drought index, as recommended by Li et al. (2023), we adopted the Global Gridded Surfaces of Selected Soil Characteristics data (https://daac.ornl.gov/cgi-bin/dsviewer.pl?ds_id=1006, last access: 24 July 2024) for the soil available water capacity (AWC) data. When comparing with VPD data, we also used the third-generation normalized difference vegetation index (NDVI) of the Global Inventory Monitoring and Modeling System (GIMMS; https://climatedataguide.ucar.edu/climate- data/ndvi-normalized-difference-vegetation-index-3rd-generation-nasagfsc-gimms, last access: 24 July 2024) for comparison for the period 1982–2022. In evaluating the performance of CHM_Drought in the drought zone of China, we used the aridity index (AI) – that is, the ratio of annual precipitation to potential evapotranspiration – to classify the arid regions of China (Fig. 1) (Li et al., 2021; https://csidotinfo.wordpress.com/data/global-aridity-and-pet-database/, last access: 24 July 2024).
2.2 Data processing
To ensure the integrity and reliability of our dataset, rigorous data quality control measures were implemented during the preprocessing stage. This involved a comprehensive data-cleaning process to address various aspects, including the identification and treatment of outliers and the handling of missing values. First, outliers within the meteorological station data were identified and addressed using appropriate statistical techniques. This step aimed to detect any data points that deviated significantly from the expected distribution and could potentially distort the analysis results. Second, missing values present in the dataset were carefully handled to minimize their impact on the overall dataset quality: we have removed any missing values to ensure that only valid sites are used for daily data interpolation.
Before calculating the drought index, we interpolated the basic meteorological variables (Tmax, Tmin, Tmean, wind, Ssd, Rh; see Fig. 2), incorporating the correlation decay distance (CDD) specific to each variable (Fig. S1 in the Supplement). Details on CDD are provided in the Supplement. For the interpolation process, we adopted angular distance-weighted interpolation (ADW), which considers angular weight in addition to the distance weight function, making it more robust in relation to outliers. ADW with CDD provides a key benefit that other methods may not emphasize as directly: the gradual decrease in correlation with increasing distance between stations. For missing values, we did not fill in the time series but rather used only stations with data available for spatial interpolation each day. We interpolated meteorological elements to 0.1° spatial resolution, which is consistent with CHM_PRE.
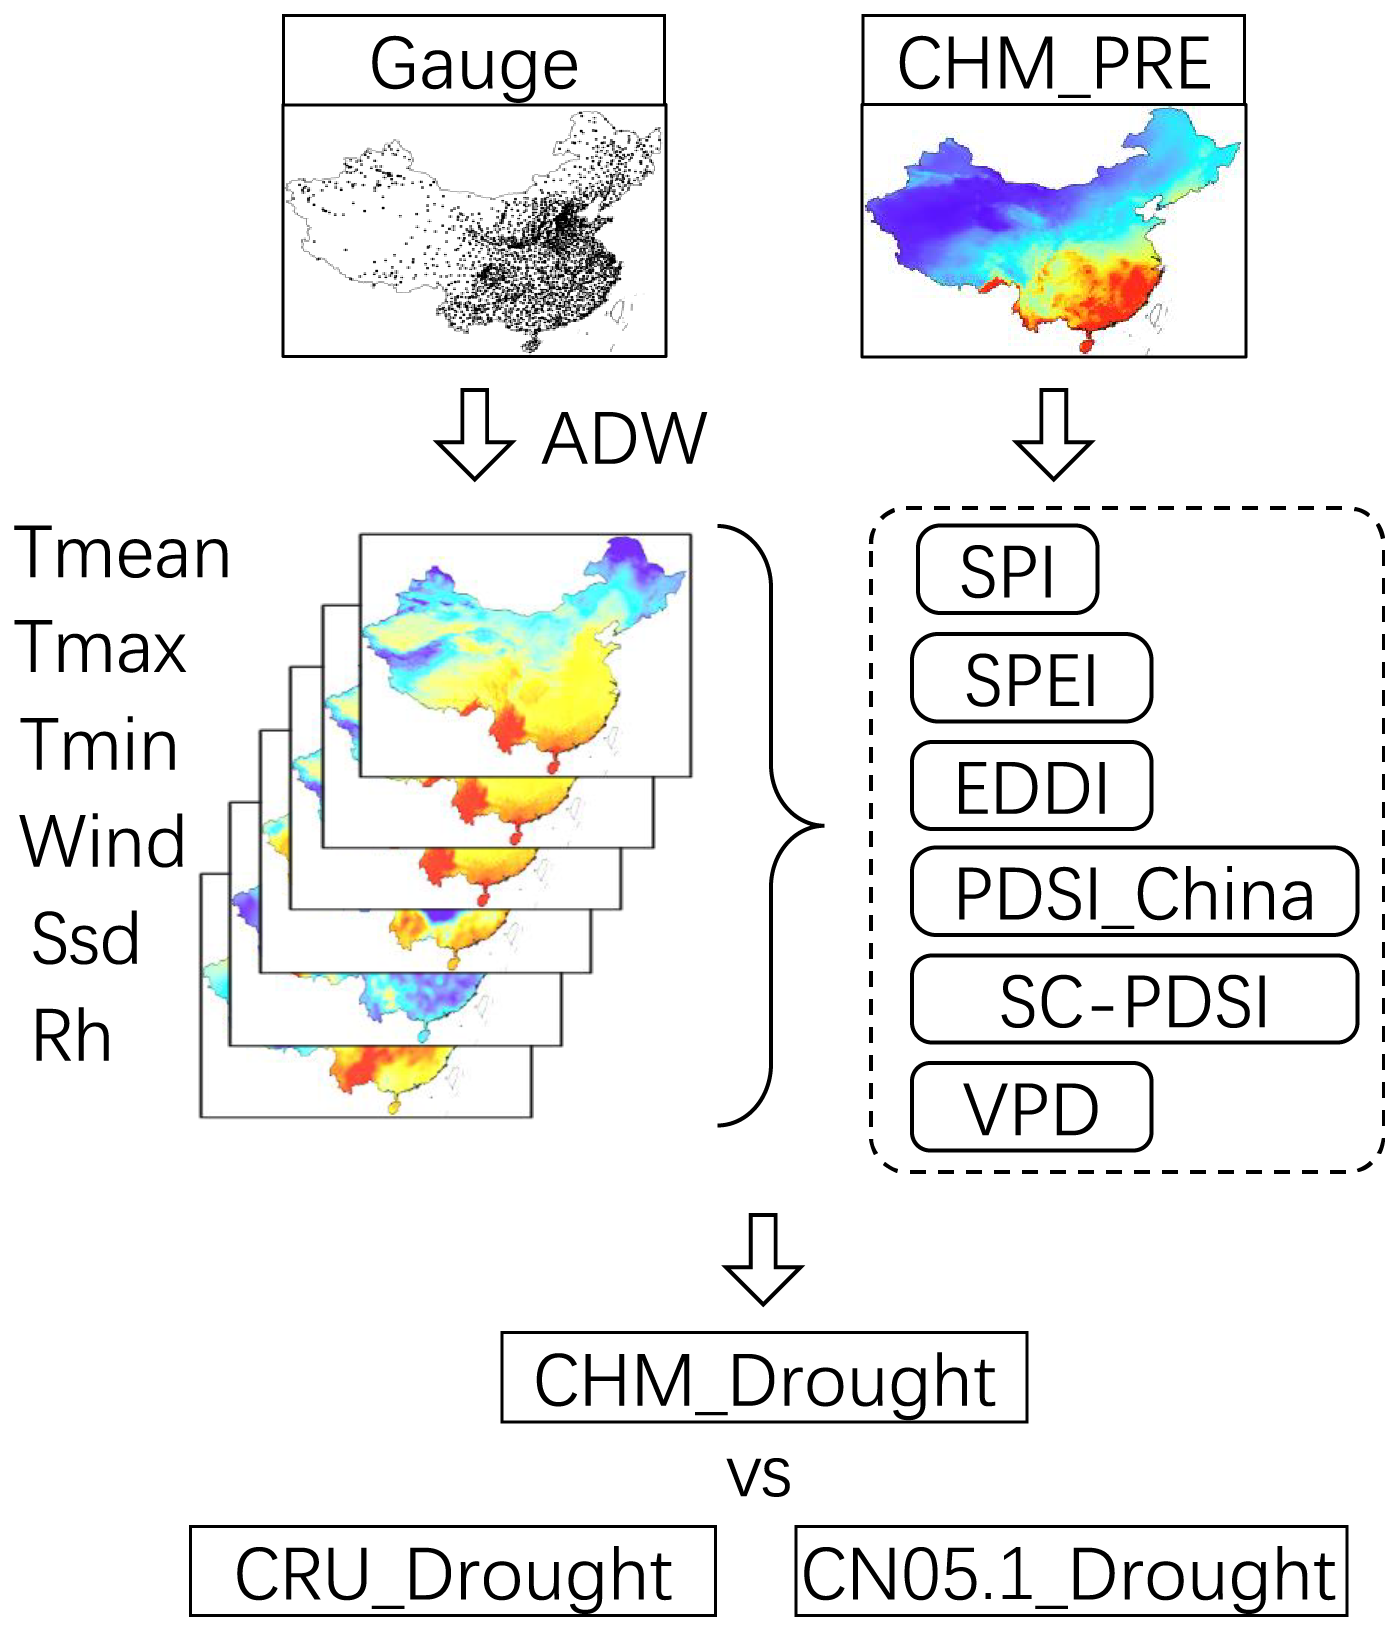
Figure 2Flowchart of the drought index construction system. The meteorological variables include maximum temperature (Tmax), minimum temperature (Tmin), average temperature (Tmean), average wind speed (wind), sunshine duration (Ssd), and average relative humidity (Rh). CRU_Drought and CN05.1_Drought represent drought indices calculated based on CRU and CN05.1 meteorological data, respectively.
3.1 Standardized precipitation index (SPI)
The SPI is a dryness index proposed by American scholars McKee et al. (1993) and is used to analyze the drought situation in Colorado. It is a powerful, flexible, and simple index, which takes precipitation as the research object, monitors precipitation on a long timescale, characterizes the correlation between precipitation and climate characteristics within a certain period of time, and is as effective for the analysis of wet periods or cycles as for the analysis of dry periods or cycles. Because the SPI has the characteristics of multiple timescales, these timescales can reflect the impact of drought on the availability of different water resources. The SPI is used to calculate the distribution probability Γ of precipitation within a certain period of time, then to perform normal standardization, and finally to classify the drought level with the standardized precipitation cumulative frequency distribution:
where β>0 and γ>0 are scale and shape parameters, respectively. The detailed calculation method can be found in the Supplement.
3.2 Standardized precipitation evapotranspiration index (SPEI)
Compared with the SPI, the SPEI more comprehensively reflects the relationship between precipitation and potential evapotranspiration (PET) and better reveals the impact of the hydrological cycle (Vicente-Serrano et al., 2010a). Since SPEI considers the sensitivity of atmospheric evaporation demand to drought, it is especially suitable for dry and warm climate zones in areas with increased temperature and PET and can better capture drought dynamics than the SPI (Li et al., 2020). First, PET is calculated. The second step is to calculate the difference between precipitation (P) and PET, i.e., . The third step is to transform data D as follows:
where , and T is the probability of a definite D value. The values of the coefficients are follows: c0=2.515517, c1=0.802853, c2=0.010328, d1=1.432788, d2=0.189269, and d3=0.001308. The detailed calculation method can be found in the Supplement. According to the FAO standard, we use the Penman equation to calculate PET as follows:
where Δ is the slope of the saturated vapor pressure–temperature relationship (kPa °C−1), Rn is the net radiation at the ground surface (), and G is the soil heat flux (MJ m−2); on a timescale of 1 to 10 d, the soil heat capacity of the reference meadow is quite small and can be neglected. γ is the psychrometric constant (kPa °C−1), T is the mean daily air temperature at 2 m height (°C), u2 is the wind speed at 2 m height (m s−1), es is the saturation vapor pressure of the air (kPa), and ea is the actual vapor pressure of the air (kPa). The detailed calculation formulas for Δ, γ, ea, es, and Rn can be found in the Supplement.
3.3 Evaporative demand drought index (EDDI)
The EDDI was developed by Hobbins et al. (2016) as an indicator of atmospheric drying potential, which can indicate plant stress on the ground. Therefore, the physically based ET0 index has the advantage of being more direct and more dependent on atmospheric physics principles than the SPEI and AET calculation methods that rely on remote sensing data. The EDDI, similarly to the SPI and SPEI, incorporates multiple timescales, and the accumulation time can vary from 1 week to 1 year or more. For the calculation of ET0 in the EDDI, we used the standardized reference evapotranspiration equation (Allen et al., 2005) adopted by the American Society of Civil Engineers (ASCE) in developing the EDDI. Although some scholars have equated PET and ET0 in recent years (Noguera et al., 2022), there are differences between the two (Xiang et al., 2020).
In the above, Cn () and Cd (s m−1) are the “numerator constant” and “denominator constant”, respectively, with values as defined in Allen et al. (2005). The EDDI is derived using the inverse method approximation detailed in Vicente-Serrano et al. (2010a), which is repeated here for convenience:
The values of the coefficients are as follows: c0=2.515517, c1=0.802853, c2=0.010328, d1=1.432788, d2=0.189269, and d3=0.001308.
For P(ET0)≤0.5,
and for P(ET0)>0.5,
Please refer to the Supplement for a more detailed description of the EDDI.
3.4 Palmer drought severity index (PDSI_China)
The PDSI is a drought index with clear physical meaning established by Palmer (1965). Its introduction was an important turning point in the history of drought index research. The PDSI is one of the most widely used drought indices in meteorological drought research and monitoring (Dai et al., 2004). When calculating water balance, the PDSI considers pre-season precipitation and water supply and demand, with clear physical meaning. Water deficit (d) is the difference between actual precipitation (P) and climate-appropriate precipitation (P′). To make the PDSI a standardized index, after the water deficit d is determined, it is multiplied by the climate weight coefficient K of a given month in a given place to obtain the water anomaly index Z, also known as the Palmer Z index, which indicates the deviation degree between the actual climate dry–wet condition and its average water condition in a given month and place: Z=dK, where the value of K is determined by the month and geographical location.
The empirical constant a=17.67 obtained by Palmer from the data of nine stations in seven states was revised to 16.84 according to the climate characteristics of China (Zhong et al., 2019); therefore, we calculate it as PDSI_China, where is the average annual absolute moisture anomaly over the years, and j represents January to December. The methodology is described in the Supplement.
3.5 Self-calibrating Palmer drought severity index (SC-PDSI)
Based on PDSI, Wells et al. (2004) proposed and evaluated an SC-PDSI. SC-PDSI automatically calibrates the index behavior at any location by replacing the empirical constants in the index calculation with dynamically calculated values. Compared with the PDSI, it can adapt to local climate (Dai, 2011) and has been proven to have better applicability in China (Bai et al., 2020; Shao et al., 2018). Since the disadvantages of the PDSI mainly revolve around its inconsistency between different locations and because it uses multiple empirical parameters that depend on the study area in the calculation process, Wells et al. (2004) believed that changing the ratio () could solve the spatial inconsistency of the PDSI without changing the way the PDSI deals with seasonal climate changes.
Since can be approximately regarded as the annual sum of the average absolute value of Z () and the value of a, 17.67, as obtained by Palmer, is the average value of (i.e., the annual average sum of vapor anomalies), and since PDSI is based on cumulative vapor anomalies, . The non-extreme value range of the PDSI is defined as −4 to 4, but, in practice, this range is different. Palmer (1965) argues that if the PDSI were truly a standardized measure of drought severity then values outside of that range (−4 to 4) would occur with roughly the same frequency. If the frequency of extreme events is fe then the feth percentile should be −4.00 and the (100−fe)th percentile should be 4.00. So . Defining an extreme drought as a “one-in-50-years event” does not determine the percentage of PDSI values below −4.00 as it may last 2 months or 2 years. In this implementation, Wells et al. (2004) used an fe value of 2 %, which resulted in the following climate characterization equation:
See the Supplement for detailed formulas.
3.6 Vapor pressure deficit (VPD)
Vapor pressure deficit (VPD) is one of the most important climate variables used to simulate the flux and state of water and carbon in ecosystem models and is one of the main driving factors of vegetation evapotranspiration. It is also an important meteorological variable in fire warning models and in warning models for the spread of pests, diseases, and epidemic diseases (Green and Hay, 2002). Therefore, VPD is widely used in various hydrological cycle, vegetation carbon cycle, and evapotranspiration estimation models (Hashimoto et al., 2008; Wang and Dickinson, 2012). Saturated vapor pressure is a function of temperature and can be directly calculated from temperature, as shown in the Tetens empirical formula (Allen et al., 1998):
where T is the air temperature (°C), and e0(T) is the saturated water vapor pressure at temperature (kPa). Since the above equation is a nonlinear function, for the average saturated vapor pressure with such a long interval at the monthly scale, if the average temperature is used to replace the daily maximum and minimum temperatures then the estimated value of the average saturated vapor pressure will be low, and the corresponding vapor pressure difference will be small. Therefore, the mean value of the saturated vapor pressure corresponding to the daily average maximum and minimum temperatures within the time interval is used for calculation (Li et al., 2024):
where es is the average saturated vapor pressure (kPa), and Tmax and Tmin are the daily average highest and lowest air temperature (°C), respectively. The actual vapor pressure ea (kPa) is calculated according to the monthly average relative humidity (φmean): and .
3.7 Consistency test for the drought dataset
To evaluate the consistency of CHM_Drought, we calculated the same index, namely CRU_Drought and CN05.1_Drought, using CRU and CN05.1 data, respectively (see Sect. 2). For consistency testing of CHM_Drought (the data characteristics are shown in Table 1), we resampled both the CHM_Drought (0.1°) and CN05.1_Drought data (0.25°) to 0.5° to match the spatial resolution of CRU_Drought (0.5°).
Table 1CHM_Drought dataset summary table, including drought index calculation input variables, timescale, and index characteristics.
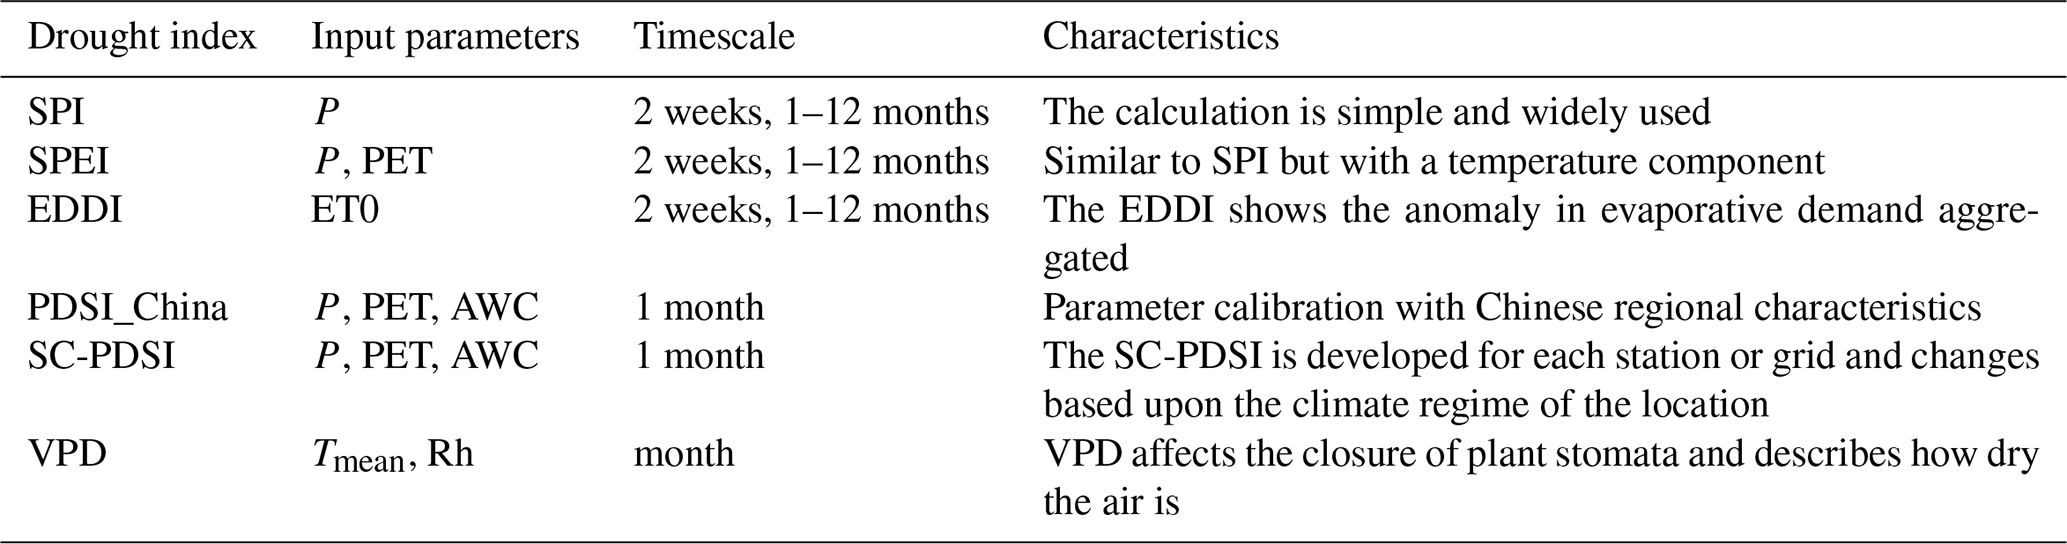
All abbreviations: P denotes precipitation, ET0 denotes reference crop evapotranspiration, PET denotes potential evapotranspiration, Tmean denotes average temperature, Rh denotes average relative humidity, and AWC denotes soil available water capacity.
Pearson's correlation coefficient (CC) and the Nash–Sutcliffe efficiency coefficient (NSE) were used as the evaluation indices of data consistency to detect the consistency of CHM_Drought, CN05.1_Drought, and CRU_Drought at the same spatial resolution (0.5°) and over the same time span (1961–2022). To assess the differences in the consistency of different timescales, we selected 1-, 3-, 6-, and 12-month scales for evaluation; the results are presented in Sect. 4.2. The formulas are as follows:
where , yi is the CHM_Drought value at time i , is the mean value taken over N, N is the total data size of yi (), and is the CRU_Drought (or CN05.1_Drought) value at time i; and represent the sample means of the two, respectively.
4.1 Performance of CHM_Drought during the 2022 summer drought in the Yangtze River basin
A severe drought occurred in the south of China in the summer of 2022, mainly concentrated in the Yangtze River basin. To show the performance of the CHM_Drought dataset in monitoring drought, we use the summer (June, July, August; JJA) of 2022 in the Yangtze River Basin as an example to examine the monitoring capabilities of drought indices. For the SPI, SPEI, and EDDI, we selected a 3-month scale (seasonal scale; Jin et al., 2020), as shown in Fig. 3. Due to the cumulative effect of drought, the drought performance is different on different timescales. Therefore, we also examined the 2-week and 1-, 3-, and 6-month scales (Fig. 4), in which case the 2-week scale takes mid-August 2022 as the node, while the 1-, 3-, and 6-month scales all show the value from August 2022.
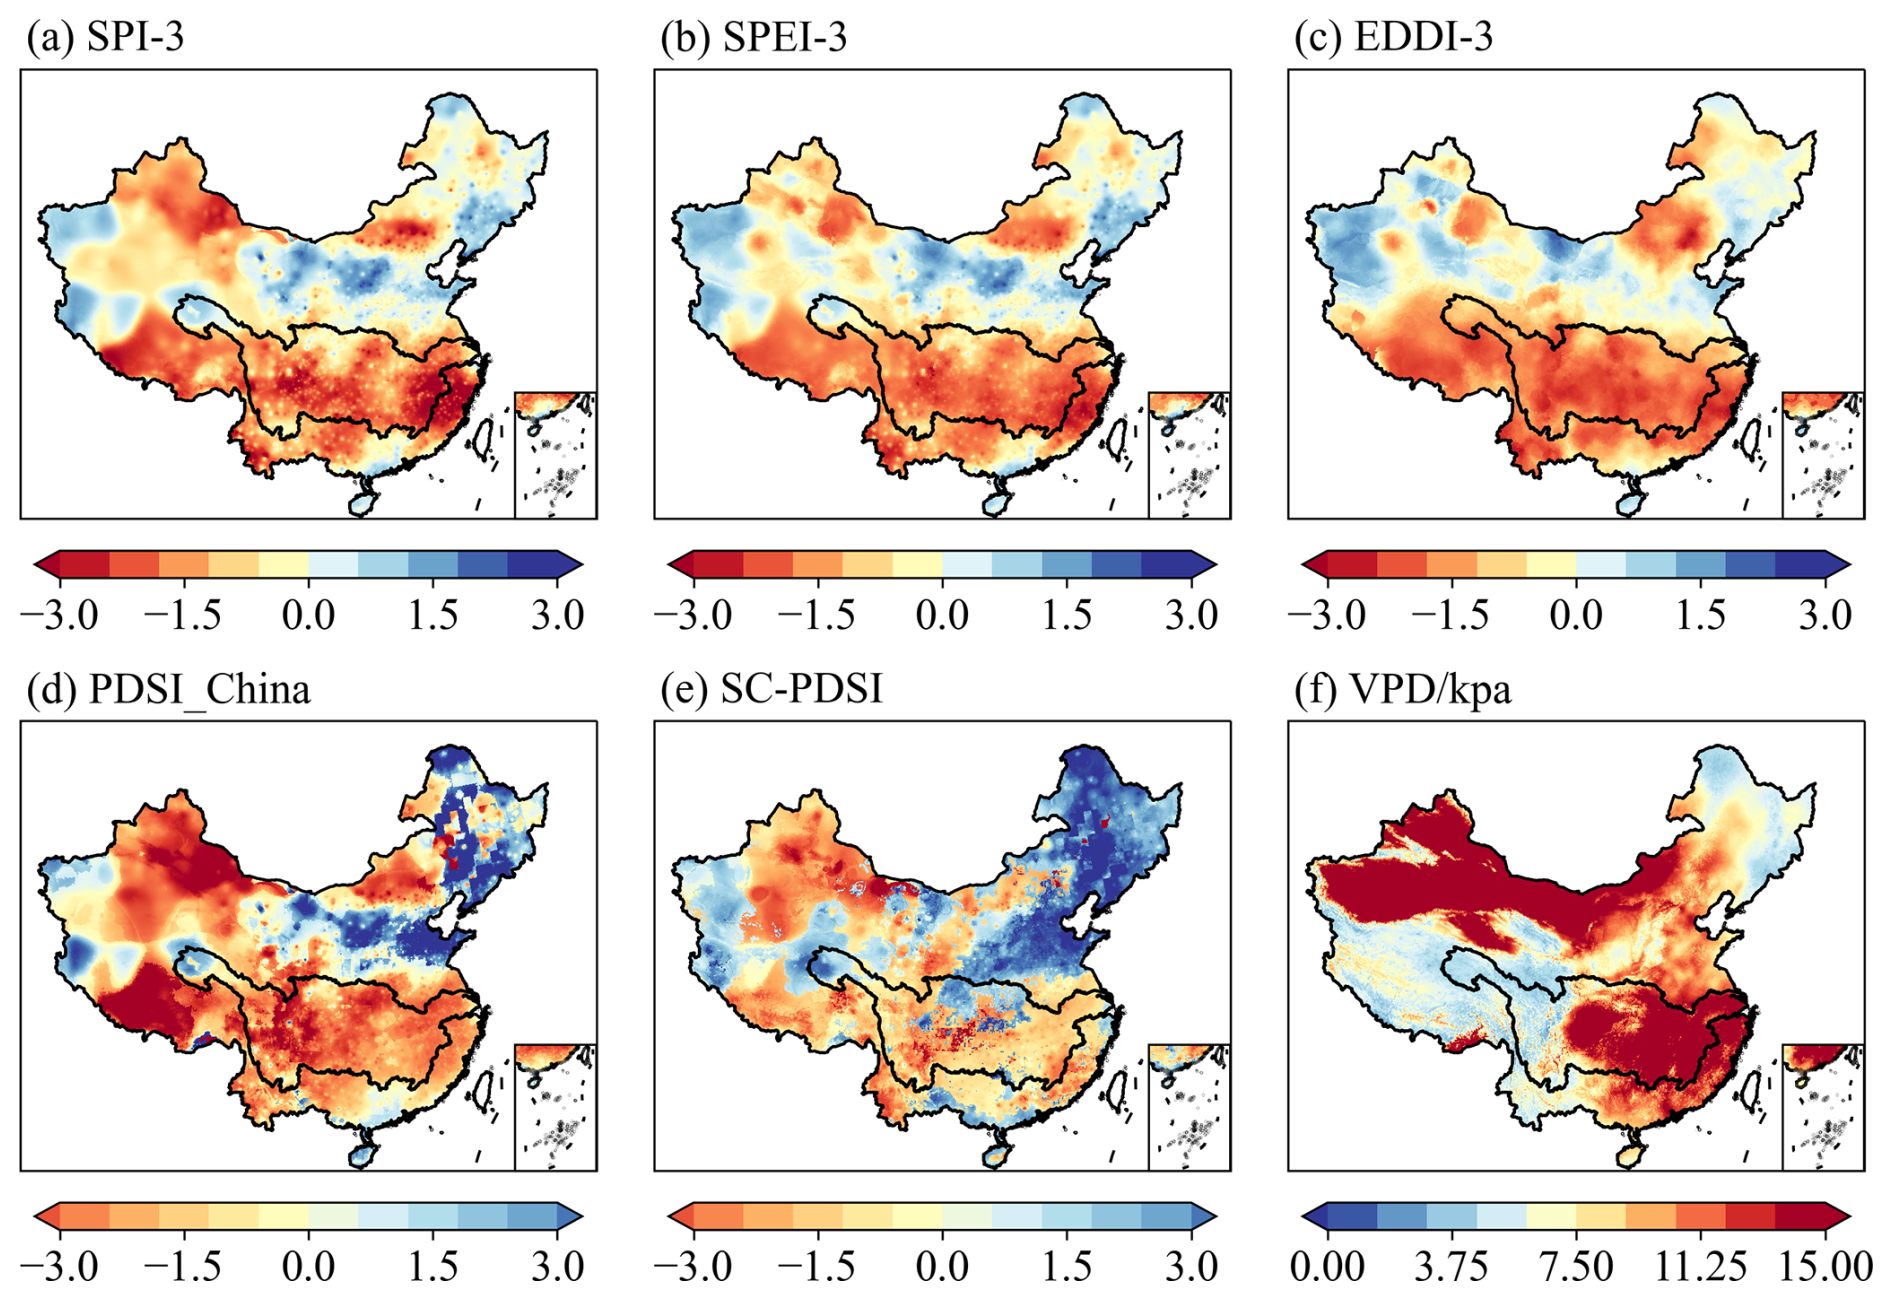
Figure 3Spatial distribution of summer (June, July, August; JJA) drought characteristics in the Yangtze River basin, China. Here, (a), (b), and (c) depict the 3-month-scale spatial distribution of drought indices, while (d), (e), and (f) present the average summer (JJA) values for these indices.
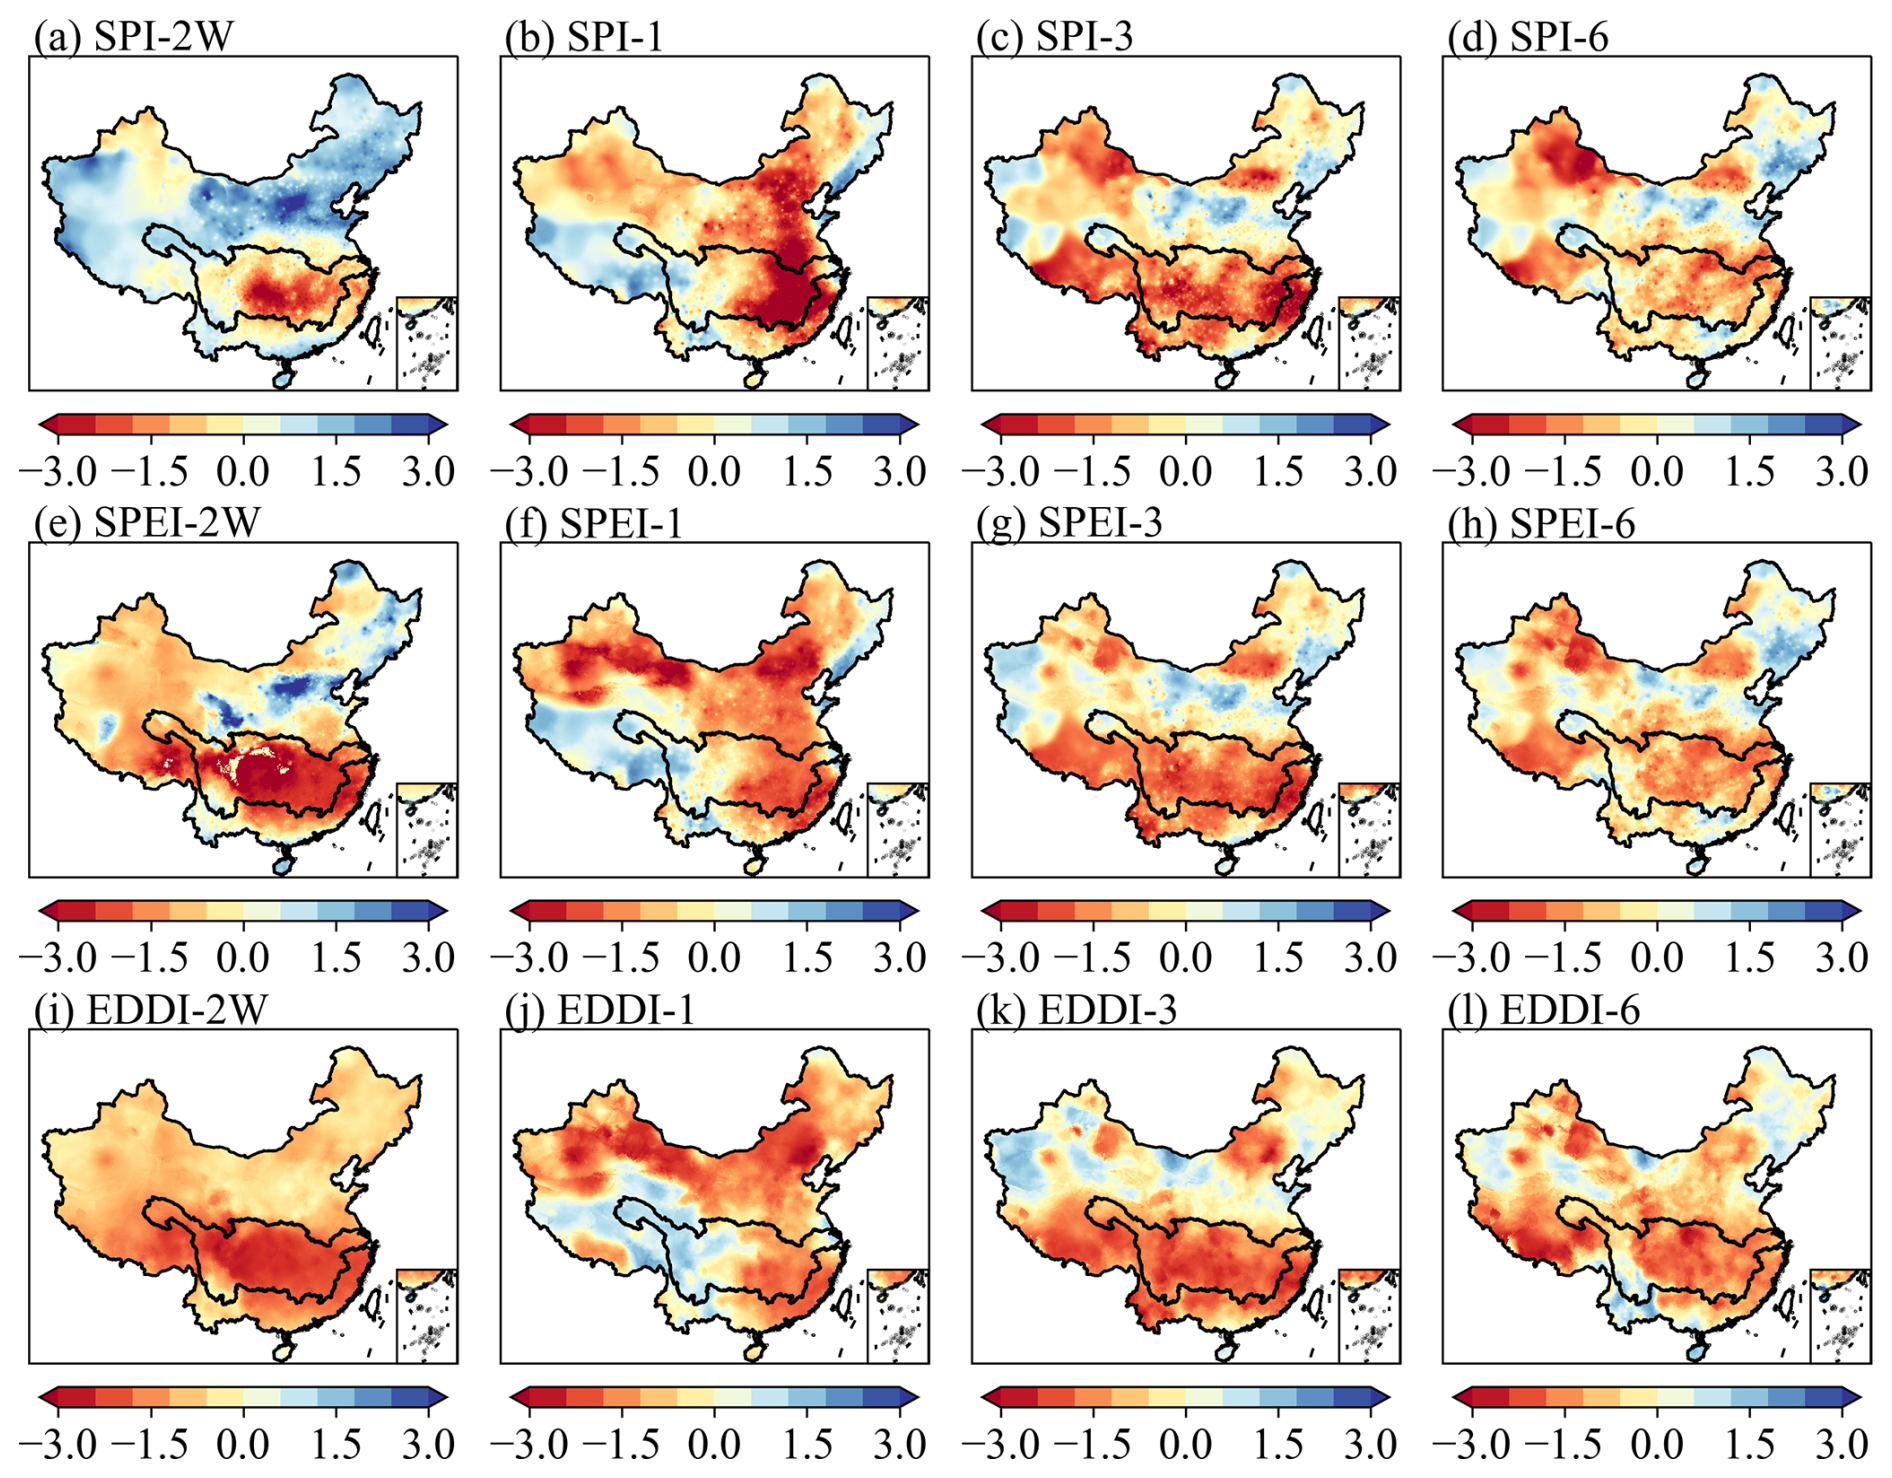
Figure 4Spatial distribution of three drought indices (the SPI, SPEI, and EDDI) in the Yangtze River basin, China, across multiple timescales (2 weeks, 1 month, 3 months, and 6 months) using August 2022 as an example. (a–d) SPI-2W indicates the 2-week-scale SPI, SPI-1 indicates the 1-month-scale SPI, SPI-3 indicates the 3-month-scale SPI, and SPI-6 indicates the 6-month-scale SPI. The scales of the SPEI and EDDI follow the same naming pattern.
The indices exhibit varied degrees of drought severity, with each index offering a unique perspective based on its inherent parameters. For instance, the SPI-3 and SPEI-3, focusing on precipitation anomalies, highlight significant deficiencies across the central and eastern regions, aligning with the Yangtze River basin's experiences. The EDDI-3, which emphasizes evaporative demand, suggests a widespread and intense drought condition, notably in the southern regions, indicating a profound hydrometeorological imbalance; this is similar to the 2022 summer high-temperature profile shown by Ma and Yuan (2023). The PDSI_China and SC-PDSI indices, which incorporate soil moisture conditions and the long-term climatic context, reveal extreme drought severity levels in the Yangtze River basin. These conditions reflect the compound effects of prolonged precipitation deficits, high temperatures, and the resulting soil moisture depletion. Lastly, the VPD index maps out the atmospheric moisture demand, which reached anomalously high levels in the illustrated period, particularly in the Yangtze River basin. This condition aggravates the drought impact by enhancing evapotranspiration rates, which in turn further depletes soil moisture and stresses vegetation. Wang et al. (2023) have also demonstrated that a record-breaking compound drought–heatwave hit the Yangtze River basin in summer 2022, resulting in the strongest anomalies of VPD and soil moisture since 2000.
On different timescales of the same index, different information emerges. At the 2-week scale (Fig. 4) the indices provide a snapshot of the immediate drought situation, which is highly valuable for short-term drought relief and response planning. Over 1-month and 3-month scales, the indices begin to show patterns of persistent drought conditions; these scales are critical for assessing the medium-term impact on agriculture and water resources. The 6-month scale reveals long-term drought conditions, which are crucial for planning and managing water resources, as well as for understanding the broader environmental impacts of extended droughts. It is also informative to compare different indices at the same timescale. We found that the results of the SPI-2W (Fig. 4a) show that the southern part of China, mainly the Yangtze River basin (Zhang et al., 2023a), has a short-term precipitation gap and that the precipitation in this region is far below the average level. The SPEI-2W (Fig. 4e) not only reflects the lack of precipitation but also takes into account the possible increase in evaporation due to high temperatures, making the drought in the southern region more severe. The effects of temperature increase that may not be captured by the SPI are reflected in the SPEI. For the EDDI-2W (Fig. 4i), the dramatic increase in atmospheric water demand is a direct result of the heatwave, and the EDDI-2W shows that the whole of China – and, in particular, the Yangtze River basin – is in this drying condition, which may further exacerbate soil drying and water stress on crops.
4.2 Consistency assessment of the multi-scale SPI, SPEI, and EDDI based on CHM_Drought with CRU_Drought (or CN05.1_Drought)
Figure 5 illustrates the spatial distribution of CC values based on the CHM for the SPI-6, SPEI-6, and EDDI-6 with those calculated based on CRU and CN05.1, respectively. Figure S2 in the Supplement is similar to Fig. 5 but illustrates the spatial distribution of the NSE. We can see that the correlations at the 6-month scale are high overall, with the correlations being above 0.8 in most regions, especially in the wet areas at low altitudes, and the correlations in the northwestern region are generally lower than those in the southeastern region, especially in the Qinghai–Tibet Plateau region, which has the lowest station density (Miao et al., 2024). However, most of the data developed so far are limited by the poor performance of sparse sites, whether they are developed meteorological data (He et al., 2020; Wu and Gao, 2013) or drought datasets (Wang et al., 2021). Simply comparing the three indices, the overall correlations and the NSE values of the SPI and EDDI are generally higher than those of the SPEI, while the regions with low correlations and NSE values in terms of the SPEI (Figs. 5 and S2) are mainly concentrated in the extremely arid regions. One consideration is that the correlations and NSE values depend on the quality and accuracy of the dataset. Another consideration is that, for the arid regions, the measurement of precipitation and evaporation is more difficult than it is in the wet regions, and the SPEI is not a single meteorological input compared with the SPI and EDDI but is rather a series of P−PET values, resulting in greater noise (uncertainty) in the data.
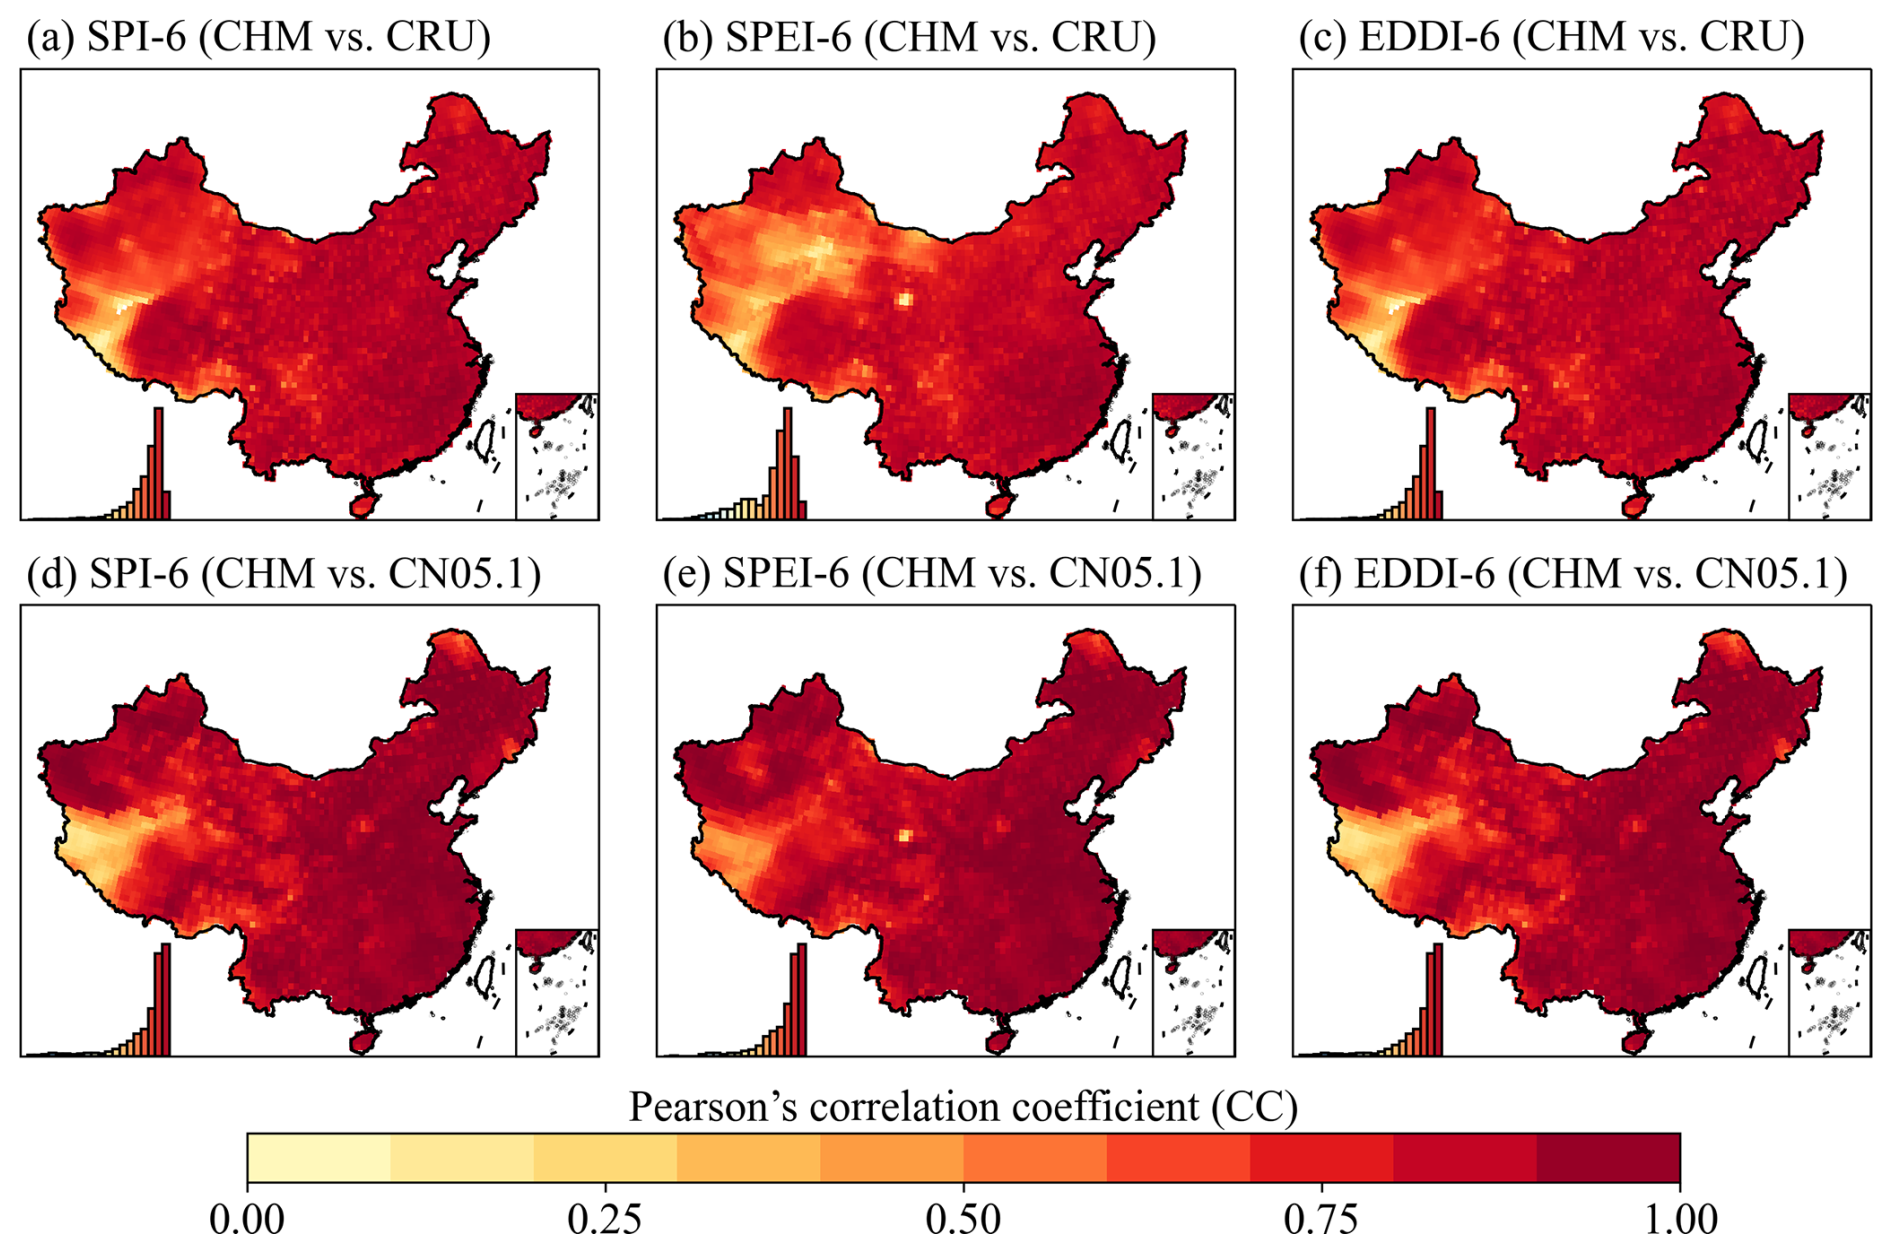
Figure 5(a–c) Correlation spatial distributions of the SPI-6, SPEI-6, and EDDI-6 based on CHM and CRU data. (d–f) Correlation spatial distributions of the SPI-6, SPEI-6, and EDDI-6 based on CHM and CN05.1 data. The histogram at the bottom left in each subplot shows the distribution of correlation coefficients for all grid cells.
When the timescale is changed, for example, to a longer timescale (12 months; from Figs. S2–S4 in the Supplement), we find that the overall correlation between CHM_Drought and CRU_Drought (or CHM_Drought and CN05.1_Drought) remains high, which proves the robustness of the data. However, the spatial distributions of CHM_Drought vs. CRU_Drought and of CHM_Drought vs. CN05.1_Drought still differ in the northwest; when compared with CN05.1_Drought, the regions with large differences are on the western side of the Qinghai–Tibet Plateau, where the sites are notably the sparsest (Fig. 1); when compared with CRU_Drought, the region with poor consistency also includes the hyper-arid region (Fig. 1).
The consistency assessment at different timescales is shown in Fig. 6. With an increase in timescale, although the median value in the boxplot remains basically unchanged, the lower quartile shifts downward progressively. This indicates that the consistency of the SPEI calculated by the two datasets decreases as the timescale increases, especially in areas with low correlation (such as the arid northwestern region). As can be seen from Figs. S2 and S4, at the 12-month, scale the NSE value in the northwestern arid region is lower than it is at the 6-month scale. Aside from the limitations of the observational data, this may be due to climate variability as climate factors (such as precipitation patterns and drought frequency and intensity) may have greater changes, resulting in larger inconsistency in the subsequent long-term records. It is also possible that, in the arid region, extreme climate events (such as extreme drought or rainstorms) may occur more frequently, and these extreme events may increase inconsistency at a long timescale. As can be seen from Fig. 6c and d, the inconsistency between the SPEI, SPI, and EDDI is the largest at the monthly scale, but the consistency increases with the increase in timescale. This may be due to the accumulation of precipitation and evaporation processes over time: evaporation (or potential evapotranspiration) is a dynamic process that takes time to accumulate in sufficient quantities, as is precipitation. In the short term, some extreme weather events (such as heavy rain or drought) may affect the amount of precipitation or evaporation, but in the long term, such events may have only a small effect. Therefore, on a longer timescale, the SPI and SPEI may reflect a more consistent and stable drought condition rather than being affected by short-term weather events.
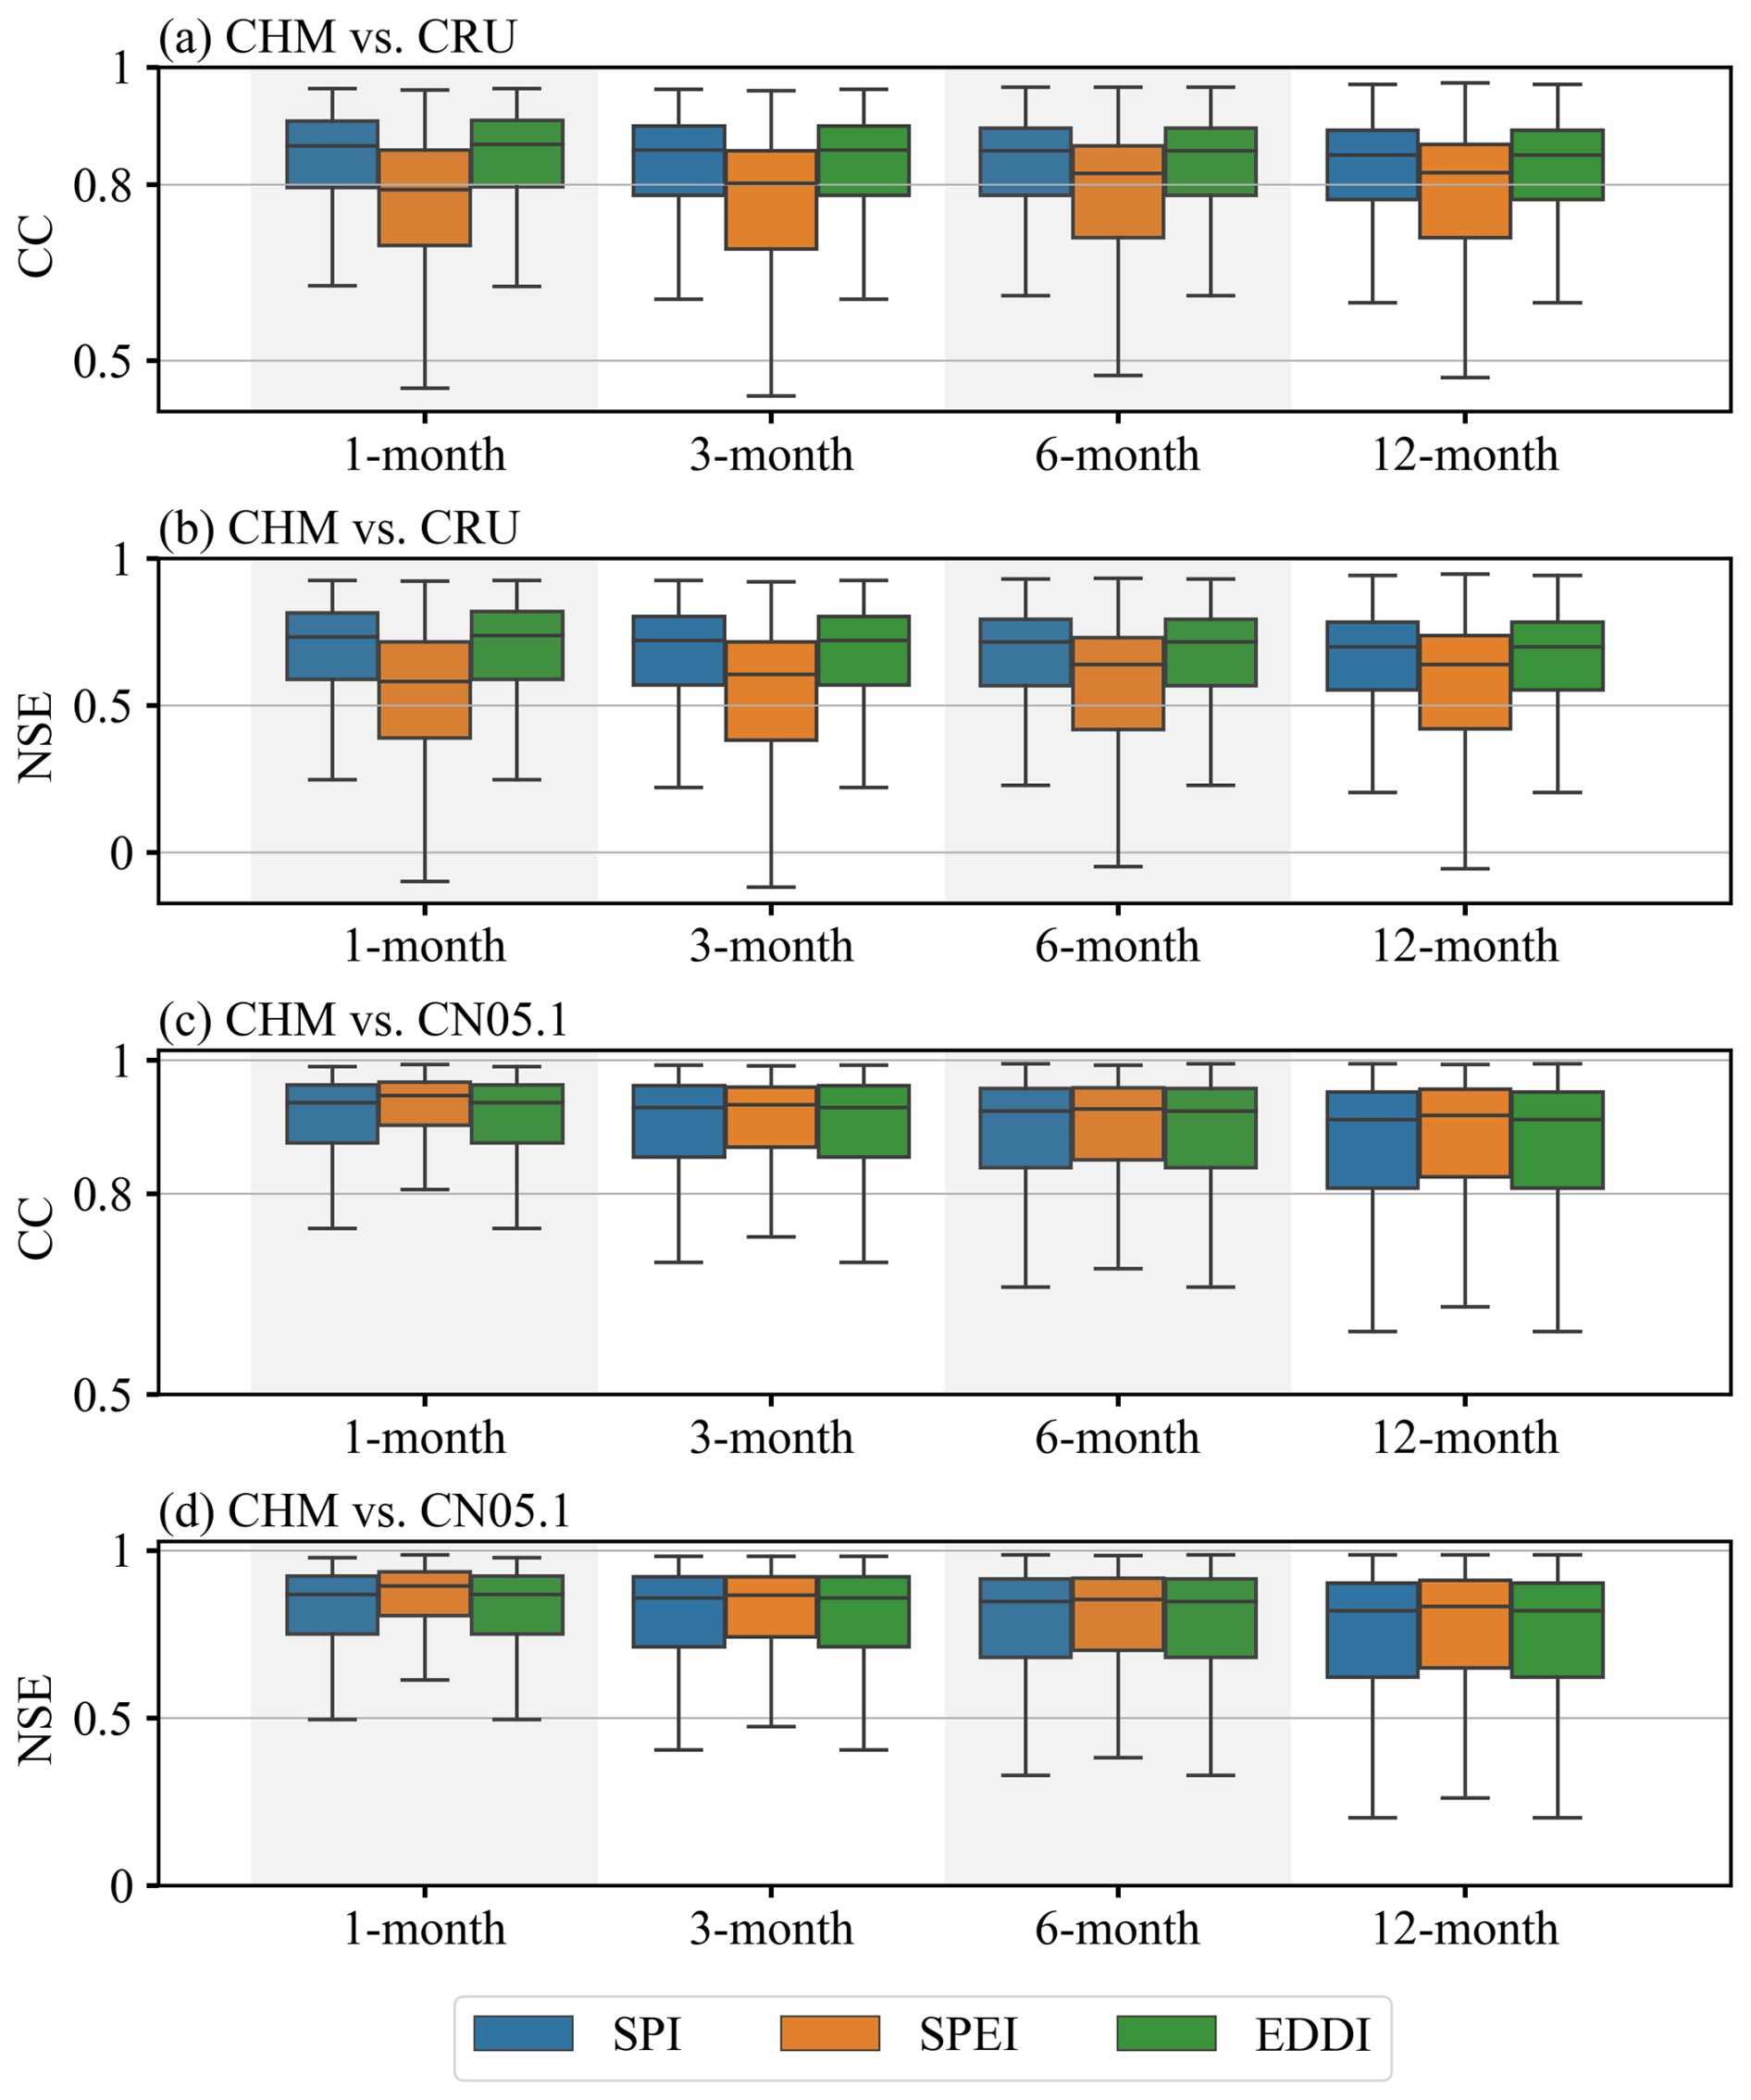
Figure 6Boxplots of the CC and NSE of three drought indices (the SPI, SPEI, and EDDI) calculated based on the CHM and either (a, b) CRU or (c, d) CN05.1 at different monthly scales (1, 3, 6, and 12 months). The middle line within each box indicates the median, the upper and the lower edges mark the 25th and 75th percentiles, and the whiskers show the 2.5th and 97.5th percentiles.
In addition, we quantified the uncertainties of the SPI, SPEI, and EDDI at different timescales (Fig. 7). We used the standard deviation to quantify the results, which were similar to those in Figs. S2–S4. The regions with higher standard deviations, such as the arid northwest, highlight the spatial variability in uncertainty across different datasets. This suggests that the drought indices calculated from these datasets may show obvious discrepancies in regions with sparse observational coverage. The observed uncertainties can be attributed to several factors, with the first being (1) the interpolation technique. The variability in interpolation techniques across datasets is a critical factor contributing to uncertainty. For instance, the CHM dataset employs advanced interpolation techniques based on high-density observational stations, while the CRU and CN05.1 datasets utilize the methods of thin plate smooth spline (TPSS) and inverse distance weighting (IDW), respectively (Harris et al., 2020; Xu et al., 2009). These methodological differences become particularly pronounced in areas with complex topography, such as the arid northwest. Xu et al. (2022) demonstrated that TPSS performs well in capturing broad climate gradients, though it may overly smooth the results in data-sparse regions, leading to underestimation of extremes. Conversely, IDW might overemphasize local station values, causing biases in interpolated fields (Shen et al., 2023). The second factor is (2) sparse observational coverage. Limited observational inputs in certain regions further exacerbate uncertainty. Liu et al. (2009) highlighted that the density of interpolation sites is the key factor influencing interpolation accuracy. They found that the performance of interpolation methods, such as kriging or IDW, deteriorates significantly as the number of sites decreases. The third factor is (3) the inclusion of auxiliary covariates. Differences in the incorporation of auxiliary covariates, such as topography, land cover, or climate zones, also contribute to dataset discrepancies. For instance, the CHM dataset incorporates high-resolution digital elevation models (DEMs) as covariates, while the CRU dataset primarily relies on planar spatial gradients without explicitly considering terrain effects (Harris et al., 2020). This leads to substantial differences in regions with complex orography.
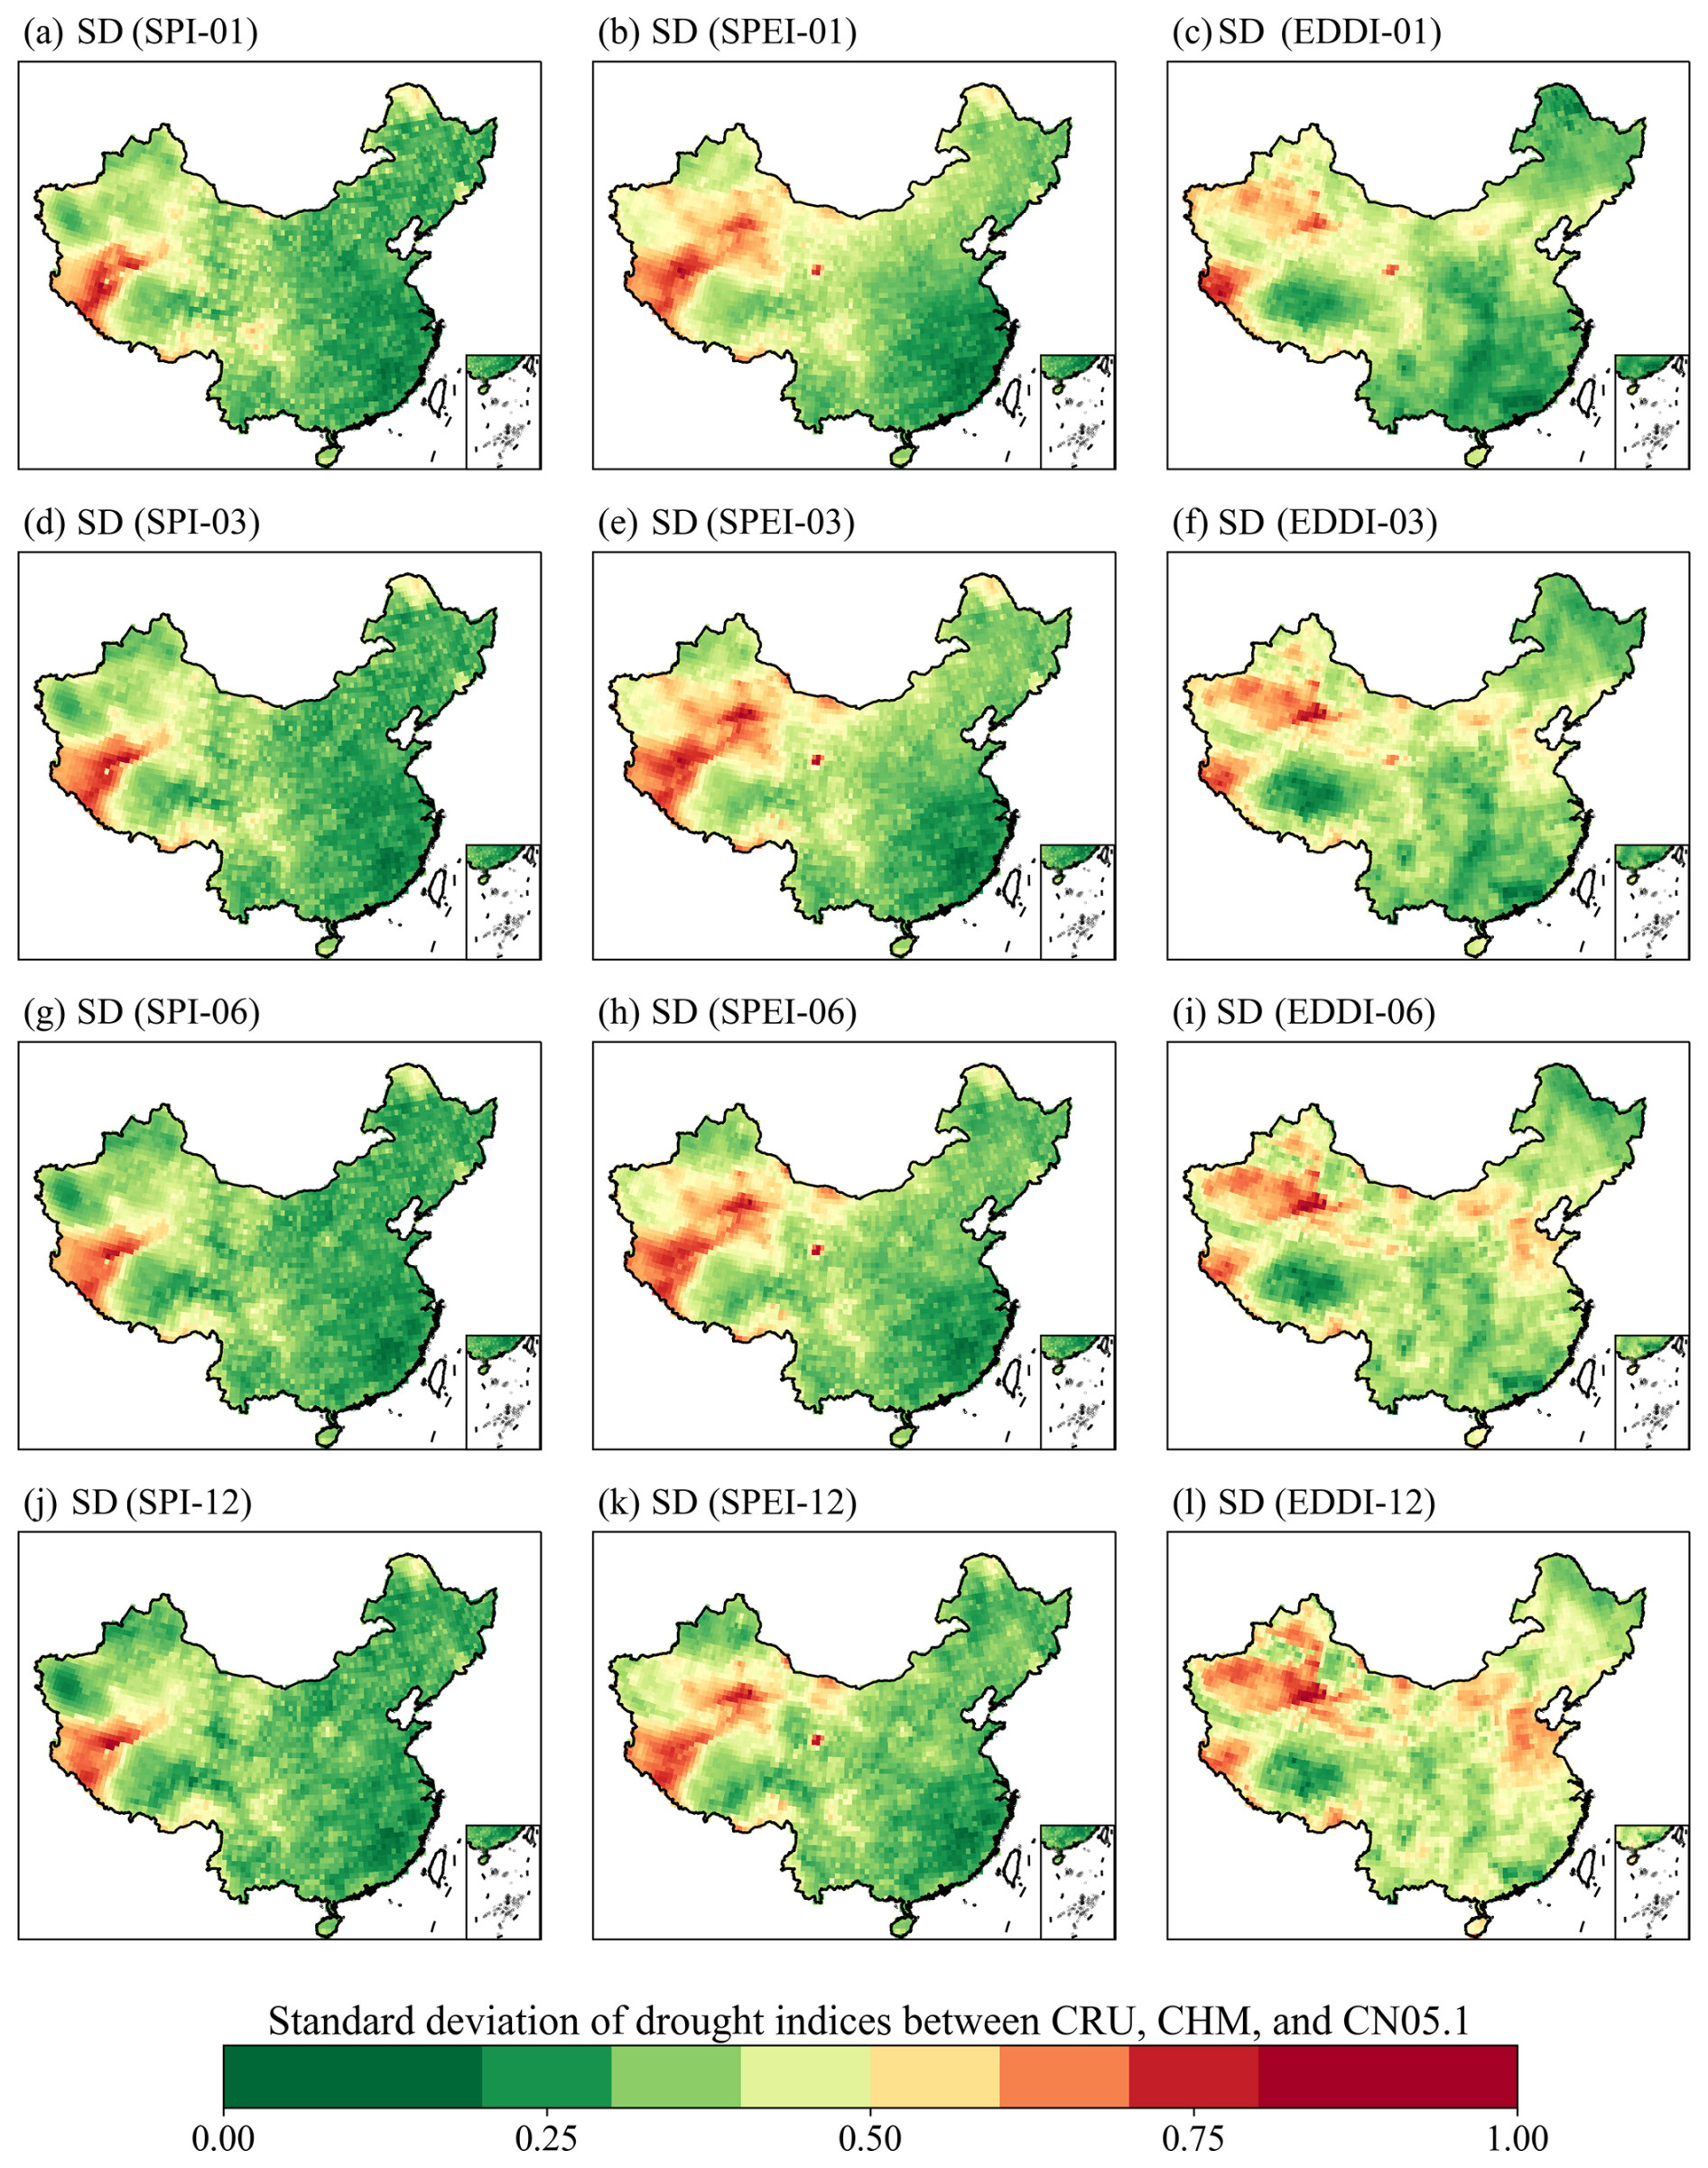
Figure 7Spatial distribution of the standard deviations of the SPI, SPEI, and EDDI drought indices across three data sources (CRU, CHM, and CN05.1) at various timescales (1, 3, 6, and 12 months). Here, (a–c) show the 1-month scale, (d–f) show the 3-month scale, (g–i) show the 6-month scale, and (j–l) show the 12-month scale.
4.3 Consistency assessment of PDSI_China and the SC-PDSI based on CHM_Drought with CRU_Drought (or CN05.1_Drought)
We evaluated the consistency of PDSI_China and the SC-PDSI in China. According to Fig. 8 and Fig. S5 in the Supplement, the two indices have high correlations over China as a whole. However, PDSI_China, corrected according to data from Chinese meteorological stations, is significantly better than the SC-PDSI. Except for the areas with low station density, the overall correlation is high, especially in the wet areas. The biggest difference between PDSI_China and the SC-PDSI comes from the calibration method. The SC-PDSI uses the self-calibration method, but it may not consider the regional differences in China, which may affect the accuracy of the SC-PDSI because it relies on appropriate calibration to reflect the climate characteristics of specific areas. In addition, the SC-PDSI takes into account the climate characteristics of specific areas through the self-calibration method, making it, in theory, more sensitive to local climate change. Therefore, although it does not have multi-scale characteristics like PDSI_China, this greater sensitivity to local climate improves its ability to reflect drought change in the short term compared with PDSI_China.
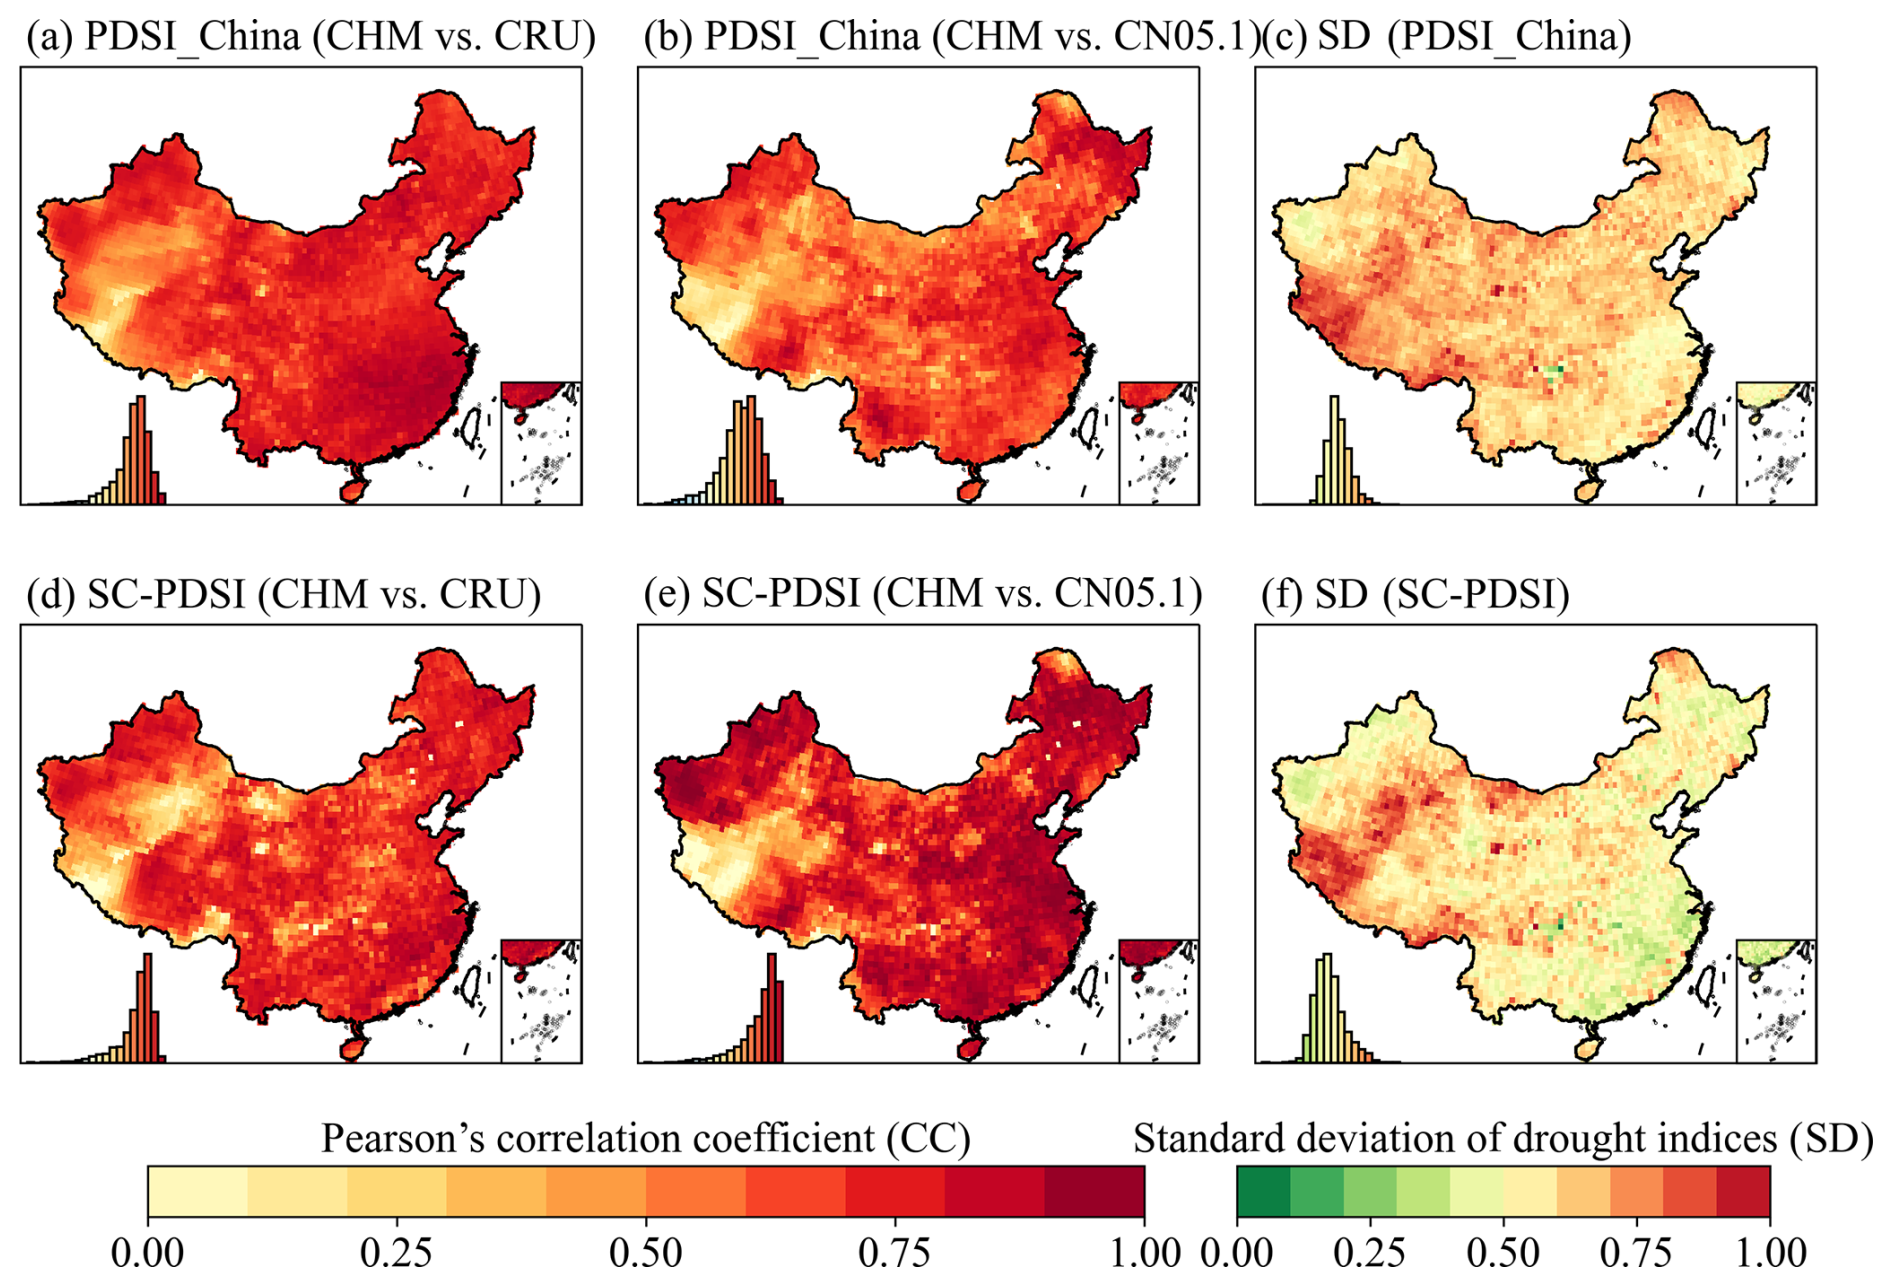
Figure 8(a, b) Correlation spatial distributions of PDSI_China and the SC-PDSI based on CHM and CRU data. (d, e) Correlation spatial distributions of PDSI_China and the SC-PDSI based on CHM and CN05.1 data. (c, f) Spatial distribution of the standard deviations of PDSI_China and the SC-PDSI across three data sources (CRU, CHM, and CN05.1). The histogram at the bottom left in each subplot shows the distribution of values for all grid cells.
4.4 Consistency assessment of VPD based on CHM_Drought with CN05.1_Drought
When the VPD value is higher, it indicates that the atmosphere is drier, the transpiration of plants is enhanced, and more water is needed to maintain growth. Therefore, VPD reflects the water use demand of plants to a large extent. Figure 9 shows results from the consistency evaluation of VPD calculated using the CHM and CN05.1. We found that the consistency of VPD calculated using CN05.1 is very high, and the correlation in each region of China is generally above 0.8 (Fig. 9a). In addition, we compared the seasonal distribution of VPD with the results of Yuan et al. (2019) and found that the seasonal spatial distribution is also very consistent. It is mainly reflected in the high VPD in the arid and semi-arid areas of northwestern China and the low VPD in the Tibetan Plateau, northeastern China, and in most regions of south China, especially in summer (Fig. S6 in the Supplement).
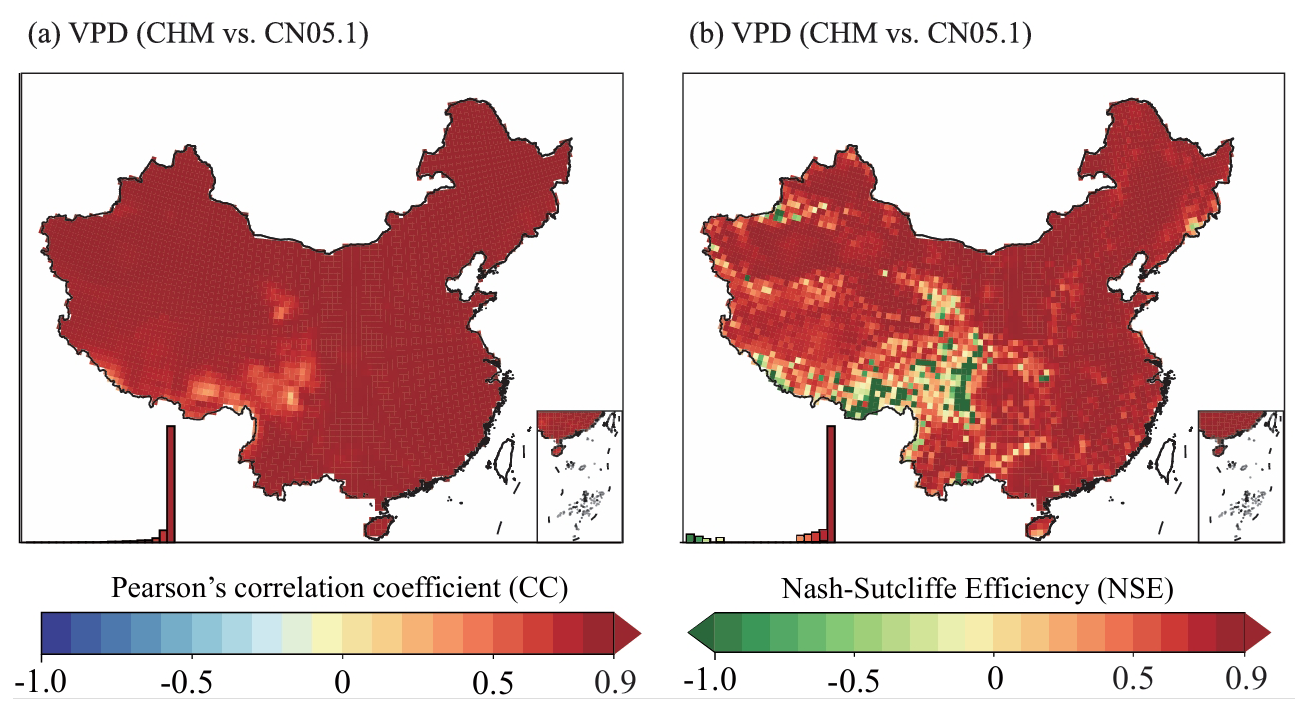
Figure 9Spatial distributions of correlation (a) and the NSE (b) of VPD based on CHM and CN05.1 data.
Studies have shown that VPD's impact on land productivity change in China is second only to soil moisture (Cheng et al., 2022), and the effect of high VPD is greater than that of high soil moisture in promoting vegetation productivity (Tu et al., 2024). Therefore, we believe that the correlation between NDVI and VPD (Fig. S7 in the Supplement) serves as an additional metric to evaluate the data. We found that the correlation between VPD and NDVI was lower in the arid northwest and southwest of China. This may be due to water limitations in the arid northwest. Due to the very limited precipitation in this region, vegetation growth and development may mainly depend on water availability rather than on VPD. VPD mainly describes the dryness of the air. In extremely arid conditions, even if the VPD is high, vegetation growth may be severely limited by water scarcity, resulting in a lower correlation between VPD and NDVI. In contrast, southwestern China's topography is complex, including high mountains and deep valleys, and the climate types are diverse. These topographic and climatic conditions may lead to a more complex relationship between VPD and NDVI. For example, mountainous areas may have lower VPD due to the frequent occurrence of clouds and fog, but this may not necessarily reflect the actual water status of the vegetation on the ground. Rainfall and clouds are common in southwestern China and may reduce the dryness of the air, thus affecting the correlation between VPD and NDVI. In addition, different types of vegetation have different responses to VPD. For example, some plants can survive in arid conditions by regulating the opening of stomata to reduce water evaporation. In southwestern China, diverse vegetation types (e.g., evergreen forest, shrub, and crops) may have different physiological responses to changes in VPD, which may lead to a lower correlation between VPD and NDVI.
Although this study provides valuable data resources for drought research in China, there are also limitations that point to potential directions for future research. First, the data uncertainty in northwestern China is relatively large due to meteorological stations being sparse. Although both CRU and CN05.1 are obtained based on station interpolation, the data consistency is generally not high in areas with sparse meteorological stations (including hyper-arid areas from Fig. 1) when compared with their calculated drought index. This may hinder the accurate assessment and understanding of drought conditions in the region. Second, because the spatial resolution of CHM_Drought is 0.1°, the higher the accuracy, the lower the confidence of the spatial resolution in the site-sparse areas. However, it is important to recognize the inherent limitations of uncertainty quantification in sparse observational data. To address these uncertainties, future work could integrate satellite data or reanalysis products to expand spatial coverage or apply advanced machine learning techniques, such as deep learning, to capture complex spatial and temporal patterns. Third, although six common meteorological drought indices have been developed and are powerful tools for understanding the diversity of drought, PDSI_China and SC-PDSI, for example, are more dependent on the accuracy of soil available water capacity (AWC) data, and there are currently no high-quality AWC data with a spatial resolution matching that of CHM_Drought (0.1°).
Additionally, a critical area for future work involves the use of the latest climate projections, such as those from the Coupled Model Intercomparison Project Phase 6 (CMIP6), to estimate future values of drought indices. This approach could offer more robust and detailed insights into how climate change may impact drought frequency, intensity, and duration in China and globally. Integrating CMIP6 projections with drought indices can help in understanding future drought risks under various greenhouse gas emission scenarios, thereby enhancing drought preparedness and mitigation strategies. Moreover, this could also involve developing or refining drought indices (including an agricultural drought index or hydrological drought index) that are more sensitive to projected changes in precipitation, temperature, evaporation, and other climatic variables influenced by climate change.
This high-resolution long-term drought dataset covers the period of 1961–2022, and it will continue to be updated annually. It contains data at a spatial resolution of 0.1°×0.1°, covering the domain of 18–54° N, 72–136° E. The NetCDF formatted output files of the CHM_Drought dataset are freely accessible at https://doi.org/10.5281/zenodo.14634773 (Zhang and Miao, 2025).
We developed new high-resolution multi-drought indices from data across mainland China with a 0.1° resolution, spanning 1961 to 2022. The dataset includes six meteorological drought indices, namely the SPI, the SPEI, the EDDI, PDSI_China, and the SC-PDSI. All six drought indices can monitor drought events in China well, although different indices and different scales have different performance characteristics. The shorter timescale (2 weeks) drought index can be used as an early warning tool for drought, but it is more sensitive to short-term precipitation or temperature, which may limit its use in monitoring drought or cold areas. The developed dataset, CHM_Drought, is highly consistent with the drought indices calculated on the basis of CRU and CN05.1.
In conclusion, the development of this high-resolution (0.1°), reliable drought dataset for China from 1961 to 2022 marks a multifaceted contribution to drought research and management. It not only enhances our ability to monitor, predict, and respond to drought conditions but will also support strategic planning across multiple sectors, including agricultural planning and management, water resource management, climate change adaptation strategies, and even interdisciplinary research to enable researchers to understand the compounding effects of drought. By addressing the urgent need for accurate and accessible drought data, this dataset opens new avenues for research and policy-making that can mitigate the impacts of drought and contribute to the sustainable management of natural resources.
The supplement related to this article is available online at https://doi.org/10.5194/essd-17-837-2025-supplement.
QZ and CM contributed to designing the research; QZ implemented the research and wrote the original draft; CM supervised the research; all the co-authors revised the paper and contributed to the writing.
The contact author has declared that none of the authors has any competing interests.
Publisher's note: Copernicus Publications remains neutral with regard to jurisdictional claims made in the text, published maps, institutional affiliations, or any other geographical representation in this paper. While Copernicus Publications makes every effort to include appropriate place names, the final responsibility lies with the authors. Regarding the maps used in this paper, please note that Figs. 1–5 and 7–9 contain disputed territories.
We are grateful to the National Meteorological Information Center of the China Meteorological Administration (NMIC, http://data.cma.cn, last access: 24 July 2024) for providing the observed climate data.
This research was supported by the National Key Research and Development Program of China (grant no. 2024YFF0809301) and the National Natural Science Foundation of China (grant no. U24A20572).
This paper was edited by Tobias Gerken and reviewed by two anonymous referees.
Aadhar, S. and Mishra, V.: Increased drought risk in south asia under warming climate: Implications of uncertainty in potential evapotranspiration estimates, J. Hydrometeorol., 21, 2979–2996, https://doi.org/10.1175/JHM-D-19-0224.1, 2020.
Allen, R. G., Pereira, L. S., Raes, D., and Smith, M.: Crop evapotranspiration – Guidelines for computing crop water requirements (FAO Irrigation and drainage, paper 56), Food and Agriculture Organizatoin of the United Nations, Rome, 17–28, https://www.fao.org/3/X0490E/X0490E00.htm (last access: 17 October 2024), 1998.
Allen, R. G., Walter, I. A., Elliott, R., Howell, T., Itenfisu, D., and Jensen M.: The ASCE standardized reference evapotranspiration equation, Rep. 0-7844-0805-X, 59 pp., https://ascelibrary.org/doi/epdf/10.1061/9780784408056.fm (last access: 5 February 2025), 2005.
Bai, X., Shen, W., Wu, X., and Wang, P.: Applicability of long-term satellite-based precipitation products for drought indices considering global warming, J. Environ. Manage., 255, 109846, https://doi.org/10.1016/j.jenvman.2019.109846, 2020.
Beguería, S., Vicente-Serrano, S. M., and Angulo-Martínez, M.: A multiscalar global drought dataset: The SPEI base: A new gridded product for the analysis of drought variability and impacts, B. Am. Meteorol. Soc., 91, 1351–1354, https://doi.org/10.1175/2010BAMS2988.1, 2010.
Cheng, Y., Liu, L., Cheng, L., Fa, K., Liu, X., Huo, Z., and Huang, G.: A shift in the dominant role of atmospheric vapor pressure deficit and soil moisture on vegetation greening in China, J. Hydrol., 615, 128680, https://doi.org/10.1016/j.jhydrol.2022.128680, 2022.
Dai, A.: Drought under global warming: a review, WIREs Clim. Change, 2, 45–65, https://doi.org/10.1002/wcc.81, 2011.
Dai, A., Kevin, E. T., and Taotao, Q.: A Global Dataset of Palmer Drought Severity Index for 1870–2002: Relationship with Soil Moisture and Effects of Surface Warming, J. Hydrometeorol., 5, 1117–1130, https://doi.org/10.1175/JHM-386.1, 2004.
Dobson, B., Coxon, G., Freer, J., Gavin, H., Mortazavi-Naeini, M., and Hall, J. W.: The Spatial Dynamics of Droughts and Water Scarcity in England and Wales, Water Resour. Res., 56, e2020WR027187, https://doi.org/10.1029/2020WR027187, 2020.
Dracup, J. A., Lee, K. S., and Paulson, E. G.: On the statistical characteristics of drought events, Water Resour. Res., 16, 289–296, https://doi.org/10.1029/WR016i002p00289, 1980.
Gamelin, B. L., Feinstein, J., Wang, J., Bessac, J., Yan, E., and Kotamarthi, V. R.: Projected U. S. drought extremes through the twenty-first century with vapor pressure deficit, Sci. Rep., 12, 8615, https://doi.org/10.1038/s41598-022-12516-7, 2022.
Gampe, D., Zscheischler, J., Reichstein, M., O'Sullivan, M., Smith, W. K., Sitch, S., and Buermann, W.: Increasing impact of warm droughts on northern ecosystem productivity over recent decades, Nat. Clim. Change, 11, 772–779, https://doi.org/10.1038/s41558-021-01112-8, 2021.
GNDAR: Global Natural Disaster Assessment Report 2020, UN Annu. Rep., 1–80, https://www.gddat.cn/WorldInfoSystem/production/BNU/2020-EN.pdf (last access: 5 February 2025) 2021.
Green, R. M. and Hay, S. I.: The potential of Pathfinder AVHRR data for providing surrogate climatic variables across Africa and Europe for epidemiological applications, Remote Sens. Environ., 79, 166–175, https://doi.org/10.1016/S0034-4257(01)00270-X, 2002.
Han, J., Miao, C., Gou, J., Zheng, H., Zhang, Q., and Guo, X.: A new daily gridded precipitation dataset for the Chinese mainland based on gauge observations, Earth Syst. Sci. Data, 15, 3147–3161, https://doi.org/10.5194/essd-15-3147-2023, 2023.
Harris, I., Osborn, T. J., Jones, P., and Lister, D.: Version 4 of the CRU TS monthly high-resolution gridded multivariate climate dataset, Sci. Data, 7, 109, https://doi.org/10.1038/s41597-020-0453-3, 2020.
Hashimoto, H., Dungan, J. L., White, M. A., Yang, F., Michaelis, A. R., Running, S. W., and Nemani, R. R.: Satellite-based estimation of surface vapor pressure deficits using MODIS land surface temperature data, Remote Sens. Environ., 112, 142–155, https://doi.org/10.1016/j.rse.2007.04.016, 2008.
He, J., Yang, K., Tang, W., Lu, H., Qin, J., Chen, Y., and Li, X.: The first high-resolution meteorological forcing dataset for land process studies over China, Sci. Data, 7, 25, https://doi.org/10.1038/s41597-020-0369-y, 2020.
Heim, R. R.: A Review of Twentieth-Century Drought Indices Used in the United States, B. Am. Meteorol. Soc., 83, 1149–1166, https://doi.org/10.1175/1520-0477-83.8.1149, 2002.
Hobbins, M. T., Wood, A., McEvoy, D. J., Huntington, J. L., Morton, C., Anderson, M., and Hain, C.: The evaporative demand drought index. Part I: Linking drought evolution to variations in evaporative demand, J. Hydrometeorol., 17, 1745–1761, https://doi.org/10.1175/JHM-D-15-0121.1, 2016.
Huang, S., Huang, Q., Leng, G., and Liu, S.: A nonparametric multivariate standardized drought index for characterizing socioeconomic drought: A case study in the Heihe River Basin, J. Hydrol., 542, 875–883, https://doi.org/10.1016/j.jhydrol.2016.09.059, 2016.
Jin, X., Qiang, H., Zhao, L., Jiang, S., Cui, N., Cao, Y., and Feng, Y.: SPEI-based analysis of spatio-temporal variation characteristics for annual and seasonal drought in the Zoige Wetland, Southwest China from 1961 to 2016, Theor. Appl. Climatol., 139, 711–725, https://doi.org/10.1007/s00704-019-02981-y, 2020.
Lesk, C., Coffel, E., Winter, J., Ray, D., Zscheischler, J., Seneviratne, S. I., and Horton, R.: Stronger temperature–moisture couplings exacerbate the impact of climate warming on global crop yields, Nat. Food, 2, 683–691, https://doi.org/10.1038/s43016-021-00341-6, 2021.
Li, C., Fu, B., Wang, S., Stringer, L. C., Wang, Y., Li, Z., Liu, Y., and Zhou, W.: Drivers and impacts of changes in China's drylands, Nature Reviews Earth & Environment, 2, 858–873, https://doi.org/10.1038/s43017-021-00226-z, 2021.
Li, L., She, D., Zheng, H., Lin, P., and Yang, Z.-L.: Elucidating Diverse Drought Characteristics from Two Meteorological Drought Indices (SPI and SPEI) in China, J. Hydrometeorol., 21, 1513–1530, https://doi.org/10.1175/jhm-d-19-0290.1, 2020.
Li, S., Wang, G., Chai, Y., Miao, L., Fiifi Tawia Hagan, D., Sun, S., Huang, J., Su, B., Jiang, T., Chen, T., Lu, C., and Guan, Z.: Increasing vapor pressure deficit accelerates land drying, J. Hydrol., 625, 130062, https://doi.org/10.1016/j.jhydrol.2023.130062, 2023.
Li, T., He, B., Chen, D., Chen, H. W., Guo, L., Yuan, W., Fang, K., Shi, F., Liu, L., and Zheng, H.: Increasing sensitivity of tree radial growth to precipitation, Geophys. Res. Lett., 51, e2024GL110003, https://doi.org/10.1029/2024GL110003, 2024.
Liu, J., Chen, H., Yang, S., Wang, W., Xiang, Y., and Zhao, C.: Comparison of interpolation methods on annual mean precipitation in Hebei Province, Acta Ecologica Sinica, 29, 3493–3500, 2009 (in Chinese).
Liu, X., Yu, S., Yang, Z., Dong, J., and Peng, J.: The first global multi-timescale daily SPEI dataset from 1982 to 2021, Sci. Data, 11, 223, https://doi.org/10.1038/s41597-024-03047-z, 2024.
Lyu, Z. Z., Gao, H., Gao, R., and Ding, T.: Extreme characteristics and causes of the drought event in the whole Yangtze River Basin in the midsummer of 2022, Advances in Climate Change Research, 14, 642–650, https://doi.org/10.1016/j.accre.2023.09.007, 2023.
Ma, F. and Yuan, X.: When Will the Unprecedented 2022 Summer Heat Waves in Yangtze River Basin Become Normal in a Warming Climate?, Geophys. Res. Lett., 50, e2022GL101946, https://doi.org/10.1029/2022GL101946, 2023.
McKee, T. B., Doesken, N. J., and Kliest, J.: The relationship of drought frequency and duration to time scales, in: Proceedings of the 8th Conference of Applied Climatology, 17–22 January, Anaheim, CA, American Meteorological Society, Boston, MA, 179–184, https://www.droughtmanagement.info/literature/AMS_Relationship_Drought_Frequency_Duration_Time_Scales_1993.pdf (last access: 28 November 2023), 1993.
Miao, C., Immerzeel, W. W., Xu, B., Yang, K., Duan, Q., and Li, X.: Understanding the Asian water tower requires a redesigned precipitation observation strategy, P. Natl. Acad. Sci. USA, 121, e2403557121, https://doi.org/10.1073/pnas.2403557121, 2024.
Mishra, A. K. and Singh, V. P.: A review of drought concepts, J. Hydrol., 391, 202–216, https://doi.org/10.1016/j.jhydrol.2010.07.012, 2010.
Naumann, G., Cammalleri, C., Mentaschi, L., and Feyen, L.: Increased economic drought impacts in Europe with anthropogenic warming, Nat. Clim. Change, 11, 485–491, https://doi.org/10.1038/s41558-021-01044-3, 2021.
Noguera, I., Vicente-Serrano, S. M., Domínguez-Castro, F., and Reig, F.: Assessment of parametric approaches to calculate the Evaporative Demand Drought Index, Int. J. Climatol., 42, 834–849, https://doi.org/10.1002/joc.7275, 2022.
Palmer, W. C.: Meteorological Drought. Office of Climatology Research Paper No. 45, Washington DC: US Weather Bureau, https://www.droughtmanagement.info/literature/USWB_Meteorological_Drought_1965.pdf (last access: 28 November 2023), 1965.
Pyarali, K., Peng, J., Disse, M., and Tuo, Y.: Development and application of high resolution SPEI drought dataset for Central Asia, Sci. Data, 9, 172, https://doi.org/10.1038/s41597-022-01279-5, 2022.
Sadiqi, S. S. J., Hong, E. M., Nam, W. H., and Kim, T.: Review: An integrated framework for understanding ecological drought and drought resistance, Sci. Total Environ., 846, 157477, https://doi.org/10.1016/j.scitotenv.2022.157477, 2022.
Shao, D., Chen, S., Tan, X., and Gu, W.: Drought characteristics over China during 1980–2015, Int. J. Climatol., 38, 3532–3545, https://doi.org/10.1002/joc.5515, 2018.
Shen, F., Xu, C., and Hu, M.: Comparison of approaches to spatiotemporally interpolate land surface air temperature for the Qinghai–Tibet Plateau, Environ. Earth Sci., 82, 452, https://doi.org/10.1007/s12665-023-11151-3, 2023.
Shi, H., Chen, J., Wang, K., and Niu, J.: A new method and a new index for identifying socioeconomic drought events under climate change: A case study of the East River basin in China, Sci. Total Environ., 616–617, 363–375, https://doi.org/10.1016/j.scitotenv.2017.10.321, 2018.
Singer, M. B., Asfaw, D. T., Rosolem, R., Cuthbert, M. O., Miralles, D. G., MacLeod, D., Quichimbo, E. A., and Michaelides, K.: Hourly potential evapotranspiration at 0.1° resolution for the global land surface from 1981–present, Sci. Data, 8, 224, https://doi.org/10.1038/s41597-021-01003-9, 2021.
Su, B., Huang, J., Fischer, T., Wang, Y., Kundzewicz, Z. W., Zhai, J., Sun, H., Wang, A., Zeng, X., Wang, G., Tao, H., Gemmer, M., Li, X., and Jiang, T.: Drought losses in China might double between the 1.5 °C and 2.0 °C warming, P. Natl. Acad. Sci. USA, 115, 10600–10605, https://doi.org/10.1073/pnas.1802129115, 2018.
Svoboda, M. D. and Fuchs, B. A.: Handbook of drought indicators and indices, in: Drought and Water Crises: Integrating Science, Management, and Policy, 2nd edn., World Meteorological Organization Geneva, Switzerland 2016, ISBN 978-92-63-11173-9, https://doi.org/10.1201/b22009, 2017.
Tu, Y., Wang, X., Zhou, J., Wang, X., Jia, Z., Ma, J., Yao, W., Zhang, X., Sun, Z., Luo, P., Feng, X., and Fu, B.: Atmospheric water demand dominates terrestrial ecosystem productivity in China, Agr. Forest Meteorol., 355, 110151, https://doi.org/10.1016/J.AGRFORMET.2024.110151, 2024.
Venkatappa, M. and Sasaki, N.: Datasets of drought and flood impact on croplands in Southeast Asia from 1980 to 2019, Data Brief, 38, 107406, https://doi.org/10.1016/j.dib.2021.107406, 2021.
Vicente-Serrano, S. M., Beguería, S., and López-Moreno, J. I.: A multiscalar drought index sensitive to global warming: The standardized precipitation evapotranspiration index, J. Climate, 23, 1696–1718, https://doi.org/10.1175/2009JCLI2909.1, 2010a.
Vicente-Serrano, S. M., Beguería, S., López-Moreno, J. I., Angulo, M., and El Kenawy, A.: A new global 0.5° gridded dataset (1901–2006) of a multiscalar drought index: Comparison with current drought index datasets based on the palmer drought severity index, J. Hydrometeorol., 11, 1033–1043, https://doi.org/10.1175/2010JHM1224.1, 2010b.
Vicente-Serrano, S. M., Domínguez-Castro, F., Reig, F., Tomas-Burguera, M., Peña-Angulo, D., Latorre, B., Beguería, S., Rabanaque, I., Noguera, I., Lorenzo-Lacruz, J., and El Kenawy, A.: A global drought monitoring system and dataset based on ERA5 reanalysis: A focus on crop-growing regions, Geosci. Data J., 10, 505–518, https://doi.org/10.1002/gdj3.178, 2023.
Wang, J., Zhang, Q., Zhang, L., Wang, Y., Yue, P., Hu, Y., and Ye, P.: The Global Pattern and Development Trends and Directions on the Drought Monitoring Research from 1983 to 2020 by Using Bibliometric Analysis, B. Am. Meteorol. Soc., 103, E2081–E2107, https://doi.org/10.1175/BAMS-D-21-0324.1, 2022.
Wang, J., Yan, R., Wu, G., Liu, Y., Wang, M., Zeng, N., Jiang, F., Wang, H., He, W., Wu, M., Ju, W., and Chen, J. M.: Unprecedented decline in photosynthesis caused by summer 2022 record-breaking compound drought-heatwave over Yangtze River Basin, Sci. Bull. (Beijing), 68, 2160–2163, https://doi.org/10.1016/j.scib.2023.08.011, 2023.
Wang, K. C. and Dickinson, R. E.: A review on global terrestrial evapotranspiration: observation, modeling, climatology, and Climatic Variability, Rev. Geophys., 50, RG2005, https://doi.org/10.1029/2011RG000373, 2012.
Wang, Q., Zeng, J., Qi, J., Zhang, X., Zeng, Y., Shui, W., Xu, Z., Zhang, R., Wu, X., and Cong, J.: A multi-scale daily SPEI dataset for drought characterization at observation stations over mainland China from 1961 to 2018, Earth Syst. Sci. Data, 13, 331–341, https://doi.org/10.5194/essd-13-331-2021, 2021.
Wells, N., Goddard, S., and Hayes, M. J.: A self-calibrating Palmer Drought Severity Index, J. Climate, 17, 2335–2351, https://doi.org/10.1175/1520-0442(2004)017<2335:ASPDSI>2.0.CO;2, 2004.
WMO: Guide to Meteorological Instruments and Methods of Observation, 8, World Meteorological Organization, http://library.wmo.int/pmb_ged/wmo_8_en-2012.pdf (last access: 1 November 2013), 2012.
Wu, J. and Gao, X. J.: A gridded daily observation dataset over China region and comparison with the other datasets, Acta Geophys. Sinica, 56, 1102–1111, https://doi.org/10.6038/cjg20130406, 2013.
Xiang, K., Li, Y., Horton, R., and Feng, H.: Similarity and difference of potential evapotranspiration and reference crop evapotranspiration – a review, Agr. Water Manage., 232, 106043, https://doi.org/10.1016/j.agwat.2020.106043, 2020.
Xu, X., X. Zhang, and X. Li.: Evaluation of the Applicability of Three Methods for Climatic Spatial Interpolation in the Hengduan Mountains Region, J. Hydrometeorol., 24, 35–51, https://doi.org/10.1175/JHM-D-22-0039.1, 2022.
Xu, Y., Gao, X., Shen, Y., Xu, C., Shi, Y., and Giorgi, F.: A daily temperature dataset over China and its application in validating a RCM simulation, Adv. Atmos. Sci., 26, 763–772, https://doi.org/10.1007/s00376-009-9029-z, 2009.
Yuan, W., Zheng, Y., Piao, S., Ciais, P., Lombardozzi, D., Wang, Y., Ryu, Y., Chen, G., Dong, W., Hu, Z., Jain, A. K., Jiang, C., Kato, E., Li, S., Lienert, S., Liu, S., Nabel, J. E. M. S., Qin, Z., Quine, T., Sitch, S., Smith, W. K., Wang, F., Wu, C., Xiao, Z., and Yang, S.: Increased atmospheric vapor pressure deficit reduces global vegetation growth, Sci. Adv., 5, eaax1396, https://doi.org/10.1126/sciadv.aax1396, 2019.
Zhai, J., Su, B., Krysanova, V., Vetter, T., Gao, C., and Jiang, T.: Spatial variation and trends in PDSI and SPI indices and their relation to streamflow in 10 large regions of china, J. Climate, 23, 649–663, https://doi.org/10.1175/2009JCLI2968.1, 2010.
Zhang, L., Guo, G., Xiong, K., Qin, P., and Wu, Y.: Causes of the high temperature process in the Yangtze River Basin in 2022, Progress in Geography, 42, 971–981, https://doi.org/10.18306/dlkxjz.2023.05.011, 2023a.
Zhang, Q. and Miao, C.: CHM_Drought, Zenodo [data set], https://doi.org/10.5281/zenodo.14634773, 2025.
Zhang, Q., Miao, C., Gou, J., Wu, J., Jiao, W., Song, Y., and Xu, D.: Spatiotemporal characteristics of meteorological to hydrological drought propagation under natural conditions in China, Weather Clim. Extrem., 38, 100505, https://doi.org/10.1016/j.wace.2022.100505, 2022a.
Zhang, R., Bento, V. A., Qi, J., Xu, F., Wu, J., Qiu, J., Li, J., Shui, W., and Wang, Q.: The first high spatial resolution multi-scale daily SPI and SPEI raster dataset for drought monitoring and evaluating over China from 1979 to 2018, Big Earth Data, 7, 860–885, https://doi.org/10.1080/20964471.2022.2148331, 2023b.
Zhang, X., Su, Z., Lv, J., Liu, W., Ma, M., Peng, J., and Leng, G.: A set of satellite-based near real-time meteorological drought monitoring data over China, Remote Sens., 11, 453, https://doi.org/10.3390/rs11040453, 2019.
Zhang, X., Hao, Z., Singh, V. P., Zhang, Y., Feng, S., Xu, Y., and Hao, F.: Drought propagation under global warming: Characteristics, approaches, processes, and controlling factors, Sci. Total Environ., 838, 156021, https://doi.org/10.1016/j.scitotenv.2022.156021, 2022b.
Zhao, H., Gao, G., An, W., Zou, X., Li, H., and Hou, M.: Timescale differences between SC-PDSI and SPEI for drought monitoring in China, Phys. Chem. Earth, 102, 48–58, https://doi.org/10.1016/j.pce.2015.10.022, 2017a.
Zhao, M., Geruo, A., Velicogna, I., and Kimball, J. S.: A global gridded dataset of GRACE drought severity index for 2002-14: Comparison with PDSI and SPEI and a case study of the Australia millennium drought, J. Hydrometeorol., 18, 2117–2129, https://doi.org/10.1175/JHM-D-16-0182.1, 2017b.
Zhong, R., Chen, X., Lai, C., Wang, Z., Lian, Y., Yu, H., and Wu, X.: Drought monitoring utility of satellite-based precipitation products across mainland China, J. Hydrol., 568, 343–359, https://doi.org/10.1016/j.jhydrol.2018.10.072, 2019.