the Creative Commons Attribution 4.0 License.
the Creative Commons Attribution 4.0 License.
 | 19 Dec 2025
The Western United States MTBS-Interagency database of large wildfires, 1984–2024 (WUMI2024a)
A. Park Williams
Caroline S. Juang
Karen C. Short
Wildfire regimes of the western United States (US) have changed dramatically since the 1980s but our understanding of the causes and effects of these changes is limited by a lack of a quality-controlled, publicly available wildfire database that (1) spans from the 1980s to present, (2) represents wildfires across a wide range of sizes, and (3) includes mapped fire perimeters and the areas burned within. Here we present an updated and improved Western US MTBS-Interagency database (WUMI2024a) of wildfire occurrences, perimeters, and burned-area maps, covering the period 1984–2024 and the geographic domain of the 11 westernmost states in the contiguous US. The database represents 22 234 wildfires ≥ 1 km2 in size, which we compile by merging seven publicly available government databases. For over 47 % of wildfires in our database (more than 10 300 wildfires), the maps of fire perimeters and area burned are based on 30 m satellite data provided by the US government's Monitoring Trends in Burn Severity (MTBS) project, allowing our mapping and assessments of total area burned to account for heterogeneity within fire boundaries. For another 24 % of fires, our database includes perimeter observations provided by non-MTBS sources, meaning that only 29 % of fire occurrences are without perimeter observations. For these fires, which are generally small and account for <5 % of total burned area in the database, we tentatively assume perimeters are circular centred on the ignition location, but with shapes adjusted to not include areas dominated by open water or barren ground. The fire perimeters and burned area maps in our database are intended to improve assessments of temporal variations and trends in wildfire frequency and area burned, assessments of the landcover types that burn, and simulations of how historical fires have affected ecosystems, smoke emissions, and hydrology. The WUMI2024a can be quickly updated as new and improved data become available. The WUMI2024a dataset and the code used to produce the dataset are available at https://doi.org/10.5061/dryad.63xsj3vd4 (Williams et al., 2025a).
- Article
(7073 KB) - Full-text XML
-
Supplement
(1973 KB) - BibTeX
- EndNote


The annual area burned by wildfires in the western United States (US) has increased dramatically over the past four decades, largely due to rapid increases in the forested area burned by large wildfires (Juang et al., 2022). Fire activity is expected to continue changing in the coming decades as complex and interactive responses to changes and variations in climate, vegetation, and human activities (Westerling et al., 2011; Bryant and Westerling, 2014; Keeley and Syphard, 2016; Parks et al., 2016; McKenzie and Littell, 2017; Parks et al., 2018; Westerling, 2018; Hurteau et al., 2019; Abatzoglou et al., 2021). The effects of changing fire regimes on humans and ecosystems will also be complex, related not only to changes in the locations, sizes, and frequencies of fires, but also to their intensities, severities, and emissions of pollutants and greenhouse gases. Quantitative modeling is a critical tool for understanding the complex causes and effects of historical and future fire regimes and assessing the effectiveness of strategies to avoid disastrous outcomes. However, the complexity of wildfires and their coupled interactions with ecosystems and human society prevent such model simulations from being performed across the large spatial scale of the western US without high degrees of parameterization. Instead, fire models that operate at regional to global scales are largely statistical, based on equations parameterized to optimally reproduce historical observations of wildfire activity (Hantson et al., 2016; Williams and Abatzoglou, 2016).
Unfortunately, the usefulness of existing observational wildfire datasets for model parameterization and calibration are limited, even in the western US where government wildfire records are public, free, and extend back decades. Among the most valuable and heavily used is a database of perimeters and high-resolution (30 m) satellite-based maps of burned area and fire severity developed by the interagency Monitoring Trends in Burn Severity (MTBS) program, covering 1984 to near-present (Eidenshink et al., 2007). The main limitation of this dataset is that, in the western US, it only represents fires >4.04 km2 in size, which account for most area burned in the region but only a small fraction of fire occurrences. Another commonly used dataset is the US Forest Service (USFS) Fire Program Analysis Fire Occurrence Dataset (FPA FOD), version 6, a database including ignition locations, dates, and sizes of over 2.3 million wildfires from 1992–2020, as reported by US federal, state, county, and local agencies (Short, 2022). This dataset includes fires of all sizes and was intensively quality controlled to minimize duplicative fires, which are common in government records, but limitations are that it is point-based, does not span back into the 1980s or forward to near-present, and is subject to temporal changes and geographic inconsistencies in reporting practices. Another interagency list of wildfire occurrences, available through the Wildland Fire Application Information Portal (WFAIP), extends back through the 1980s but does not include fires reported by non-federal agencies and is not quality controlled to remove duplicates. In addition, the National Interagency Fire Center (NIFC) hosts a number of fire perimeter datasets on its Open Data site (https://data-nifc.opendata.arcgis.com/, last access: 13 December 2025), but none is without a major caveat related to comprehensiveness, temporal coverage (the most comprehensive dataset covers <10 years), or lack of ignition dates or locations. A recent effort by the US Geological Survey (USGS) produced a quality-controlled compilation of US fire perimeters extending back to the 1800s (Welty and Jeffries, 2021), but limitations are that this dataset does not include fires that lack perimeter data and it currently ends in 2020.
Here we present the Western US MTBS-Interagency (WUMI) database of large (≥ 1 km2) wildfires, version 2024a, covering 1984–2024 (WUMI2024a). This version name reflects the final complete year represented in the dataset and accommodates the possibility of future releases before the dataset extends into 2025. Previous versions of the WUMI, most recently Juang and Williams (2024), were not documented in a full-length paper and simply provided a list of wildfire events and monthly maps of western US area burned, and the MTBS dataset was the only source of actual fire perimeters and footprints of area burned. All other fires were assumed circular. In this update, we merge and quality-control seven government databases of observed wildfire, five of which provide fire perimeters, to greatly increase the proportion of fires with observed fire perimeters. In addition to the list of wildfire start dates, start locations, and final sizes provided by the WUMI2024a, the database also now includes 1 km resolution maps of area burned as well as observed or estimated perimeters for each fire. The improved geographic representation of fire extent in this dataset allows for better identification of the land-cover types burned in wildfire, which should improve the accuracy of statistical assessments of fire-landcover relationships across the large and ecologically diverse western US. The comprehensive archive of wildfire perimeters will also aid efforts to use high-resolution satellite imagery to map the severities of many more historical and recent fires than was previously possible, and to improve accuracy of simulations of how historical wildfires have affected ecosystems, terrestrial carbon balance, and smoke emissions in the western US. Finally, the WUMI2024a can be updated with relative ease as new and improved wildfire observations become available. This is critical, as continued changes in climate, ecosystems, and human activities are likely to promote continued occurrences of non-analog wildfire behavior that incentivize scientists to continue updating their quantitative models and understanding of how western US wildfire is likely to change in the coming decades.
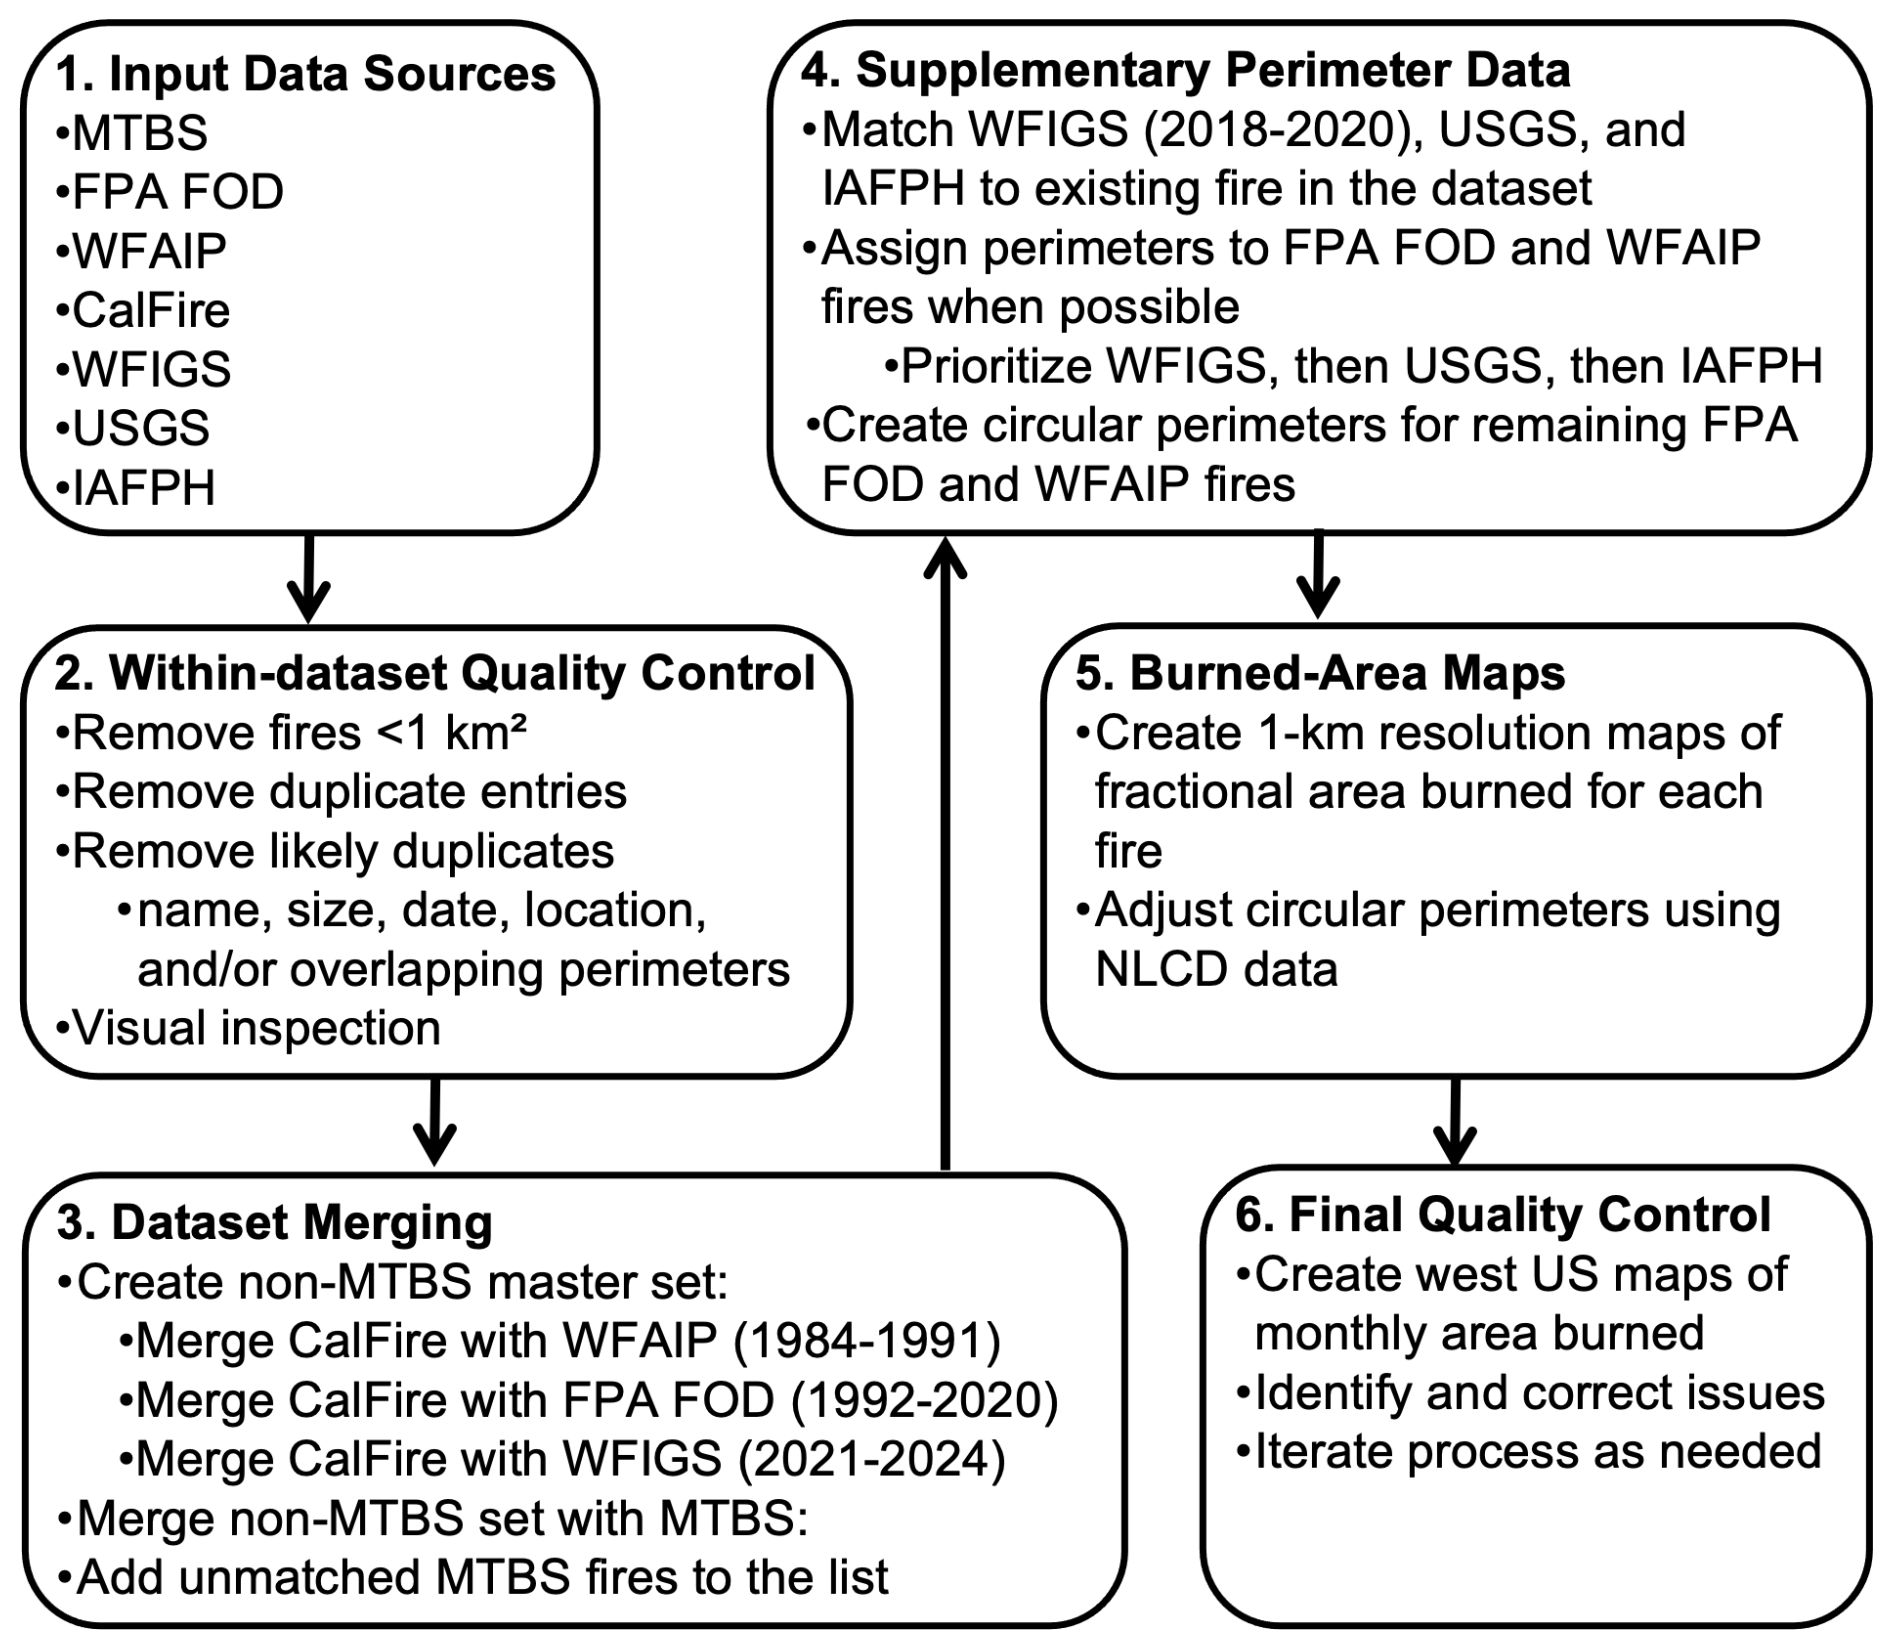
The geographic domain of the WUMI2024a is the 11 westernmost states of the coterminous US: Arizona, California, Colorado, Idaho, Montana, New Mexico, Nevada, Oregon, Utah, Washington, and Wyoming. The time period covered is 1984–2024 and the WUMI2024a only represents wildfires ≥ 1 km2 (100 ha) in size. The WUMI2024a consists of a list of all wildfire events in the database, monthly maps at 1 km resolution of area burned across the full western US domain, and, for each event, a shapefile with the known or estimated fire perimeter as well as a 1 km resolution map of the fraction of each grid cell that burned. We describe each wildfire database in Sect. 2.1 and then how we merged them to produce the WUMI2024a in Sect. 2.2. A schematic outlining the approach is provided in Fig. 1.
2.1 Data
Most datasets described below provide a fire start date but do not specify whether this is the date of ignition or discovery. We refer to the dates provided as “start dates”. For fires with no reported ignition location (only perimeter), we estimate the ignition location as the coordinates of the perimeter's centroid. When possible we replace these derived points with reported ignition locations from agency reports (e.g., FPA FOD). Here we describe each data product.
2.1.1 MTBS
The MTBS project (Eidenshink et al., 2007) maintains a database of Landsat-based maps of burned areas at 30 m resolution for large (>4.04 km2) fires spanning 1984–2024, though records for 2023 and 2024 were incomplete at the time of last access. The MTBS dataset distinguishes four fire types: Wildfire, Prescribed fires, Wildland Fire Use, and Unknown. We exclude the Prescribed fire type. In addition to uses of the fire sizes provided as attributes in the MTBS records, which represent total area within the fire perimeter, we estimate the area burned by each fire as the summed area of all 30 m grid cells classified as burned by the MTBS. Excluding unburned 30 m grid cells within the fire perimeters provides a more accurate estimate of actual area burned. Data were accessed from https://www.mtbs.gov/ on 26 April 2025.
2.1.2 FPA FOD
The USFS Fire Program Analysis Fire-Occurrence Database (FPA FOD), 6th edition (Short, 2022), is a compilation of final wildfire reports from the federal, state, and local fire services, currently spanning 1992–2020. The spatial component is limited to reported point locations of fire ignitions, although, when applicable, the database identifier for the corresponding MTBS perimeter is included for FPA FOD fires represented in the MTBS dataset. This dataset is described in detail by Short (2014). Data were accessed from https://doi.org/10.2737/RDS-2013-0009.6 on 4 November 2022.
2.1.3 WFAIP
The Wildland Fire Application Information Portal (WFAIP) includes an archive of point-based final fire reports from federal agencies, including the USFS and the Fish and Wildlife Service from 1972–2020 and by the Bureau of Land Management, Bureau of Indian Affairs, Bureau of Reclamation, and National Park Service from 1972–2017. We limit incorporation of these records to 1984–1991 in favor of the FPA FOD dataset for 1992–2020 because the WFAIP shows a drop-off in wildfire frequencies in the first decade of the 2000s that is not apparent in other data sources and the FPA FOD includes fires reported by state and local agencies and is scrubbed for redundancy as described in Short (2014). The WFAIP data were not used by the FPA FOD to extend that record prior to 1992 due to concerns about inconsistencies in reporting and the completeness of the records, but they are still a valuable resource for our purposes. Data were accessed from https://www.wildfire.gov/page/zip-files on 15 December 2024. This website may only be available to computers in the US, but the original datasets are made available through the WUMI2024a database (Williams et al., 2025a).
2.1.4 CalFire
The California Department of Forestry and Fire Protection (CalFire) Resource Assessment Program (FRAP) maintains a database of perimeters for fire incidents in California. The first fire represented occurred in 1898 and the latest version includes records through 2024. The criteria that CalFire uses to determine which fires to include in the FRAP database have changed over time, but for the large ≥ 1 km2 fires and time period of focus in the WUMI2024a, the policy has been consistent. CalFire FRAP does not provide ignition locations, so we initially estimate each fire's ignition location as the centroid within each fire's perimeter. Data were accessed from https://www.fire.ca.gov/what-we-do/fire-resource-assessment-program/fire-perimeters on 26 April 2025.
2.1.5 WFIGS
The NIFC hosts a database of fire perimeters maintained by the Wildland Fire Interagency Geospatial Services (WFIGS) Group. These perimeters are for wildland fire incidents that have been reported with an Integrated Reporting of Wildland Fire Information identification code (IRWIN ID). The first fire in this database is from 2018 and the dataset is updated in real-time, but federal records prior to 2021 are incomplete and perimeters may be missing for non-federal fires throughout the period of record. This dataset only includes wildfires with perimeter data. Data were accessed from https://data-nifc.opendata.arcgis.com/datasets/nifc::wfigs-interagency-fire-perimeters/about on 10 October 2025.
2.1.6 USGS
The USGS compiled a dataset of US fire perimeters from 40 sources spanning from the 1800s through 2020 (Welty and Jeffries, 2021). Their quality controlled “combined wildland fire polygon dataset” includes perimeters for > 100 000 fires, including > 14 000 wildfires ≥ 1 km2 in the western US from 1984–2020. In cases of multiple data products providing overlapping fire boundaries, likely representing the same fire event, the authors dissolve the boundaries into a single best-estimate boundary and they save the metadata reported by each product (e.g., fire name, ignition and/or discovery date, IRWIN ID). In cases of multiple fire names listed for a given fire, we select the most common name, or the first name listed in the case of a tie. For start date we use the ignition date when available and discovery date when not. In the case of multiple start dates we use the one more commonly reported. We discard the small proportion (8 %) of 1984–2020 western US fires ≥ 1 km2 in size that are missing start date information beyond fire year. This dataset does not report ignition locations and only includes fires with perimeter data. We therefore use this dataset to provide perimeters for fires listed by the more comprehensive fire-occurrence lists that lack perimeter data (FPA FOD and WFAIP), but not as a primary source of fire-occurrence records. Data were accessed from https://www.sciencebase.gov/catalog/item/61aa537dd34eb622f699df81 on 9 June 2025.
2.1.7 IAFPH
The NIFC hosts a database of US wildfire perimeters called the Interagency Fire Perimeter History (IAFPH), with some records dating prior to the 1900s and spanning through 2023. There is a marked increase in the annual number of IAFPH fires throughout the 20th century that reflects changes in availability of perimeter data rather than changes in actual fire frequency. The IAFPH dataset only provides the year of fire occurrence, not start dates, and does not provide ignition location. The IAFPH is therefore a useful resource for perimeters associated with known fires, but not as a primary source of fire-occurrence records. Data were accessed from https://data-nifc.opendata.arcgis.com/datasets/nifc::interagencyfireperimeterhistory-all-years-view/about on 14 October 2024.
2.2 Processing and merging of datasets
2.2.1 Within-dataset quality control
From each dataset described above we remove fires <1 km2 in area as well as duplicate entries in which multiple fires are reported as occurring at the same location with the same size on the same date. We next remove likely duplicates, identified as fires that occurred within 5 d, have matching names, and are within 100 km of each other (reported fire locations are often imprecise or inaccurate). These thresholds were determined empirically to allow for the automatic detection of the vast majority of duplicate fires with identical names. We found that loosening the distance and start-date criteria increasingly led to automated detections of duplicates that did not stand up to scrutiny, as pairs of identically named fires that are distant in time or space are more likely to have large discrepancies in reported fire sizes or to have commonly used fire names. We use flexibility in searching for matching names, for example by allowing for variants such as abbreviations (e.g., “MOUNTAIN” vs. “MT” or “CANYON” vs. “CYN”) and punctuation (e.g., “.” or “#”). If a fire's full name is within the name of another fire, we interpret them to be duplicates if they are within 5 d and 50 km. Among pairs with UNKNOWN names, we treat them as duplicates if they are within 25 km, 3 d, and 10 % of the larger of the fire sizes. If these criteria are met between a pair of fires but just one fire's name is UNKNOWN, they are considered duplicates if they are within 1 d of each other. When fires within a given database have identical date and size, we retain only the first database instance. When date and size are not identical, we keep the fire with the earlier date and then the larger size. In identifying duplicate fires within the FPA FOD, we do not indicate fires as duplicates if they were previously identified by Short (2022) as linked to different MTBS fires. Finally, for CalFire, WFIGS, IAFPH, and USGS, we identify pairs of fires with start dates within 14 d and overlapping perimeters. If ≥ 50 % of one fire's boundary is contained within the other's, we only keep the larger fire. For WFAIP and FPA FOD, for which boundaries are not available, we do the same but assume fires are circular, centered on the reported ignition location. After automated quality control we perform rigorous visual inspection of fire lists and maps of fire perimeters to identify additional duplicates and errors in fire dates or locations.
2.2.2 Dataset merging
To develop our final dataset, we begin by making a master set of non-MTBS fires from WFAIP, FPA FOD, WFIGS, and CalFire. We then merge this dataset with MTBS fires and then, when possible, replace perimeters associated with WFAIP and FPA FOD fires, which we initially estimate to be circular, with fire perimeters from USGS and IAFPH.
To produce the non-MTBS dataset, we merge CalFire with WFAIP for 1984–1991, FPA FOD for 1992–2020, and WFIGS for 2021–2024, prioritizing CalFire in cases of overlap. For WFIGS, most matches to CalFire records are easily identified via common IRWIN IDs. We additionally assume a non-CalFire fire to be a match to a given CalFire fire if it has the same name, has a start-date within 5 d of the CalFire discovery date, and has an ignition location within 1° latitude and longitude of the bounding box of the CalFire boundaries. For CalFire fires with UNKNOWN name and cases of non-matching names, we consider a non-CalFire fire to be a match with, or part of, a CalFire fire if it is within 5 d of the CalFire fire and the ignition location is within the CalFire bounding box. We additionally identify WFIGS fires as matches to CalFire fires if their listed discovery dates are within 5 d and they have overlapping boundaries. When matches between non-CalFire and CalFire fires are identified, the estimated CalFire ignition location (estimated as the centroid within the perimeter) is replaced with the ignition location reported for the non-CalFire fire. When this leads to an ignition location outside the CalFire perimeter, the location is readjusted to the nearest point along the CalFire perimeter. Some CalFire fires represent fire complexes made of multiple fires that began separately and merged. When multiple non-CalFire fires are linked to a given CalFire fire, we save this information and the CalFire ignition location is assigned the ignition location of the non-CalFire fire that is closest in size.
We next merge the non-MTBS dataset with MTBS by identifying matches between non-MTBS and MTBS fires and prioritizing MTBS when possible due to the high-resolution (30 m) maps of area burned that MTBS provides. For WFIGS, we identify matches to MTBS by comparing IRWIN IDs. In addition, in producing the FPA FOD dataset, Short (2022) identified matches between FPA FOD and MTBS fires and provided the corresponding MTBS Fire IDs, which we use to link FPA FOD and MTBS fires. However, some matching fires between the FPA FOD and MTBS are not immediately evident based on the MTBS Fire IDs provided in the FPA FOD because the MTBS undergoes regular revisions and some of its Fire IDs have changed. After using IRWIN IDs and MTBS Fire IDs to find matches between non-MTBS and MTBS fires, we identify additional matches using fire names, locations, and sizes, similar to our method described above to merge non-CalFire and CalFire fires. For the merge with MTBS our method is somewhat more liberal than for CalFire because, first, MTBS fires are exclusively large fires, and therefore more likely to represent fire complexes composed of multiple smaller fires that merged. Second, many MTBS burned areas are identified post-hoc with satellite imagery, but the pre- and post-fire images used are generally not from satellite overpasses immediately before and after the fire, so burned areas attributed to some MTBS fires are actually from multiple fire events. To identify linkages between MTBS and non-MTBS fires, we first attempt to identify for each MTBS fire, any non-MTBS fires with the same name, dates within 14 d, and ignition locations within 1° of the MTBS fire's bounding box. We next link non-MTBS and MTBS fires, regardless of name, if the start dates are within 5 d and the non-MTBS fire's ignition location is within the MTBS bounding box. Additionally, we link WFIGS and CalFire fires to MTBS fires if the start dates are within 14 d and fire perimeters overlap. As with the CalFire merge, we allow for multiple non-MTBS fires to be linked to the same MTBS fire. See Sect. 2.4 for additional description about how these cases are handled. Finally, we delete all MTBS fires that are identified by MTBS as an Unknown fire type and without any match to a non-MTBS fire, as these are likely to be prescribed fires that were never reported but produced burned areas detected post-hoc in the satellite imagery by the MTBS team. All remaining MTBS fires without linkages to non-MTBS fires are added to the list of non-MTBS fires to complete our final list of WUMI2024a wildfire events. When linking FPA FOD and WFAIP fires to MTBS fires, we adjust any FPA FOD and WFAIP ignition location that falls outside its associated MTBS polygon to lie on the nearest point along the MTBS polygon.
Importantly, we found it infeasible to automate a one-size-fits-all set of rules that effectively detects duplicate fires within or between datasets without need for intensive additional scrutiny. For example, the same fire is often assigned different names by different government agencies; the same name may be spelled or misspelled in a range of ways; and dates, locations, and sizes are not always reported consistently across agencies, sometimes with large differences. Therefore, at every step of the quality-control and dataset-merging process we conduct rigorous visual inspections of fire lists and perimeter maps to identify additional duplicate fires between or within datasets as well as fires that were misidentified as redundant by our automated routine. Due to the intensive nature of the visual inspection and manual correction process we are confident that the quality of the final WUMI2024a dataset, while certainly not without remaining errors, is not highly sensitive to the specific rules implemented in the automated portion of the process.
2.2.3 Supplementary datasets with fire perimeters
Although WFIGS is incomplete prior to 2021, USGS does not provide ignition locations or records of fires lacking perimeter data, and IAFPH does not provide ignition location or start date, these datasets can provide unique geographic information for many fires in the WUMI2024a. We therefore treat WFIGS during 2018–2020, USGS, and IAFPH as supplementary. During each supplementary dataset's period of overlap with the WUMI2024a (2018–2020 for WFIGS, 1984–2020 for USGS, 1984–2023 for IAFPH), we identify matching fires in the WUMI2024a. Matches are identified when names match, fire starts are within 14 d (or same year in the case of IAFPH), and the WUMI2024a ignition location is within 0.25° of the supplementary perimeter's bounding box. In cases of matching UNKNOWN fire names, the WUMI2024a ignition location must be within the supplementary fire's bounding box and its size must be within 10 % of the supplementary fire's size. If a WUMI2024a fire is matched to more than one supplementary fire, WFIGS is prioritized because it provides ignition locations and start dates, then USGS because it provides start dates, and then IAFPH. In the case of a match to an FPA FOD or WFAIP fire, that fire is assigned the perimeter and size of the supplementary fire and the ignition location is adjusted if outside the fire perimeter. In the case of a match between WFIGS and CalFire, the WFIGS ignition location is assigned to the CalFire fire and adjusted if outside the CalFire perimeter. Matches to other datasets (e.g., a supplementary fire to an MTBS fire) are recorded but no changes are made. Finally, for any FPA FOD or WFAIP fire not assigned a perimeter from an alternative dataset, we initially assume the fire perimeter to be circular centred on the ignition location. We then adjust the boundaries and sizes of circular perimeters such that burned areas exclude areas of open water, permanent ice, or barren ground according to the previous year's map of landcover type from the USGS annual National Land Cover Database (NLCD) (USGS, 2024).
2.3 Burned-area maps
For each fire in the WUMI2024a we produce a 1 km resolution map of fractional area burned. For MTBS fires, this is done by, for each 1 km grid cell in our study region, summing the area, in units of km2, of all 30 m grid cells identified as burned in the original MTBS dataset. For fire perimeters from CalFire, WFIGS, USGS, and IAFPH, we assume the area within the fire perimeter is burned uniformly, accounting for partial-cell overlap with the fire perimeter as well when fire perimeters indicate gaps within the area burned or disconnected burned areas. Notably, many of these non-MTBS perimeters do include within-fire gaps where burning did not occur. For FPA FOD and WFAIP fires assumed to be circular, we adjust the 1 km grids of area burned by multiplying by the fractional land cover that is not open water, permanent ice, or barren ground according to the NLCD, thus excluding areas deemed unburnable. Finally, as a quality control measure we make regional maps of monthly and annual area burned to identify cases of suspiciously high burned areas concentrated in time. This leads us to find duplicate fires not previously identified and, in some cases, use internet searches to identify incorrect dates or locations of fires. Over several iterations we correct found issues and remake the dataset following the methods described above.
2.4 Summary of the final dataset
The WUMI2024a database represents 21 940 wildfires ≥ 1 km2 in size according to the area within the fire perimeter if MTBS fires are always prioritized as single events even if they are composed of multiple smaller events. However, 119 MTBS fires are composed of multiple non-MTBS fires. For example, some fire complexes, defined as fire events composed of multiple fires that began independently but merged, are represented by MTBS as single events. In these cases, we refer to the large MTBS fires as parent fires and the smaller fires within as sub-fires. Because these sub-fires generally have different ignition locations and start dates from the parent fire, we produce an alternative list of WUMI2024a wildfire events that replaces each parent fire with its sub-fires. In this version, we adjust the sizes of sub-fires so that they sum to equal the sizes of the parent fires. When the ignition location for a sub-fire is not within the satellite-derived area burned of the MTBS parent fire, we adjust the ignition location to the nearest burned location within the parent fire's footprint. In the alternative list of wildfire events that replaces each parent fire with its sub-fires, there are 22 234 wildfires ≥ 1 km2 in size. We realign the sizes and locations of sub-fires to be consistent with the MTBS parent because the MTBS maps of area burned are satellite-based and rigorously quality controlled. In contrast, the fire sizes and ignition locations reported in other datasets are often approximate, as exemplified by cases in which the same fire is reported by different agencies but with non-identical sizes and ignition locations. On the other hand, adjustment of fire size and ignition location introduces errors for cases in which one or more of the sub-fires was misidentified (did not actually contribute to the burned area mapped by MTBS), not all sub-fires were identified, or two or more sub-fires were actually the same event but not identified as such. That said, we find that, among the 119 cases in which a parent fire is composed of sub-fires, the sum of the areas burned by the sub-fires consistently agree well with the total area of the parent fire (Fig. S1 in the Supplement), giving us confidence that any unintended errors caused by adjustments to sub-fire sizes and ignition locations are generally minor.
Thus, the WUMI2024a includes two lists of wildfire events. The list that prioritizes sub-fires over parent fires may be preferable when the goal is to use the most accurate records of ignition dates and fire frequencies. However, perimeter data are not available for some sub-fire events, and MTBS is the only dataset that resolves unburned areas within fire perimeters. Therefore, prioritization of parent fires over sub-fires may be preferable in applications requiring the most accurate maps of area burned. Importantly, the 119 parent fires and their 413 sub-fires are rare, constituting <2 % of all fires in the dataset, meaning that analyses of fire frequencies or areas burned at the large scale of the western US will not be strongly sensitive to whether parent fires or sub-fires are prioritized. Additionally, for each parent fire the WUMI2024a database includes a text file that provides the pre-adjustment ignition locations and sizes of sub-fires. Table S1 in the Supplement provides descriptions of the wildfire attributes included in the WUMI2024a lists of wildfires and sub-fires.
As mentioned above, the final ignition locations for some FPA FOD and WFAIP fires are different from those originally reported because, when we found a linkage between an FPA FOD or WFAIP fire and a fire from an alternative dataset that provides perimeter data, we adjusted FPA FOD or WFAIP ignition locations to the nearest point along the perimeter if the originally reported ignition location fell outside the perimeter. Notably these adjustments were relatively rare and minor. Of the 9434 FPA FOD or WFAIP fires in the final dataset, ignition locations are adjusted for 16.8 %. Of these, the median adjustment distance is 406 m and 95 % of adjustments were within 6.6 km. Users can retrieve the originally reported ignition locations from the original lists of FPA FOD and WFAIP fires that we provide as part of the WUMI2024a archive by cross-referencing the unique FPA FOD and WFAIP fire identifiers provided in the final lists of WUMI2024a fires with those in the original lists of fires represented in those databases.
In addition to maps of area burned by individual fires, we provide monthly 1 km resolution maps of total area burned across the western US, prioritizing parent fires over sub-fires due to their superior spatial data.
Information on ignition cause is available for many fires in the CalFire, FPA FOD, WFIGS, and USGS datasets. We preserve this information in the list of WUMI2024a wildfires. When one dataset (e.g., FPA FOD) provides ignition-cause information for a given fire, but another dataset without ignition information is prioritized for that fire due to superior spatial information (e.g., MTBS), the ignition cause information is carried over.
Figure 2 presents maps of the 22 234 ignition locations reported in the WUMI2024a as well as the areas burned. The map of ignition locations (Fig. 2a) distinguishes fires ignited in forest versus non-forest areas and the grey contours in both maps bound forested areas. We map forest areas using the 250 m resolution map of forest classifications from Ruefenacht et al. (2008). We consider an ignition to be in a forest area if its location lies in a 1 km grid cell for which ≥ 50 % of the 250 m grid cells within are classified as forest. In the assessments below we divide the western US into four quadrant regions, mapped in Fig. 2: Pacific Northwest (PNW), Northern Rockies (N Rockies), California and Nevada (CA/NV), and Four Corners (4 Corners).
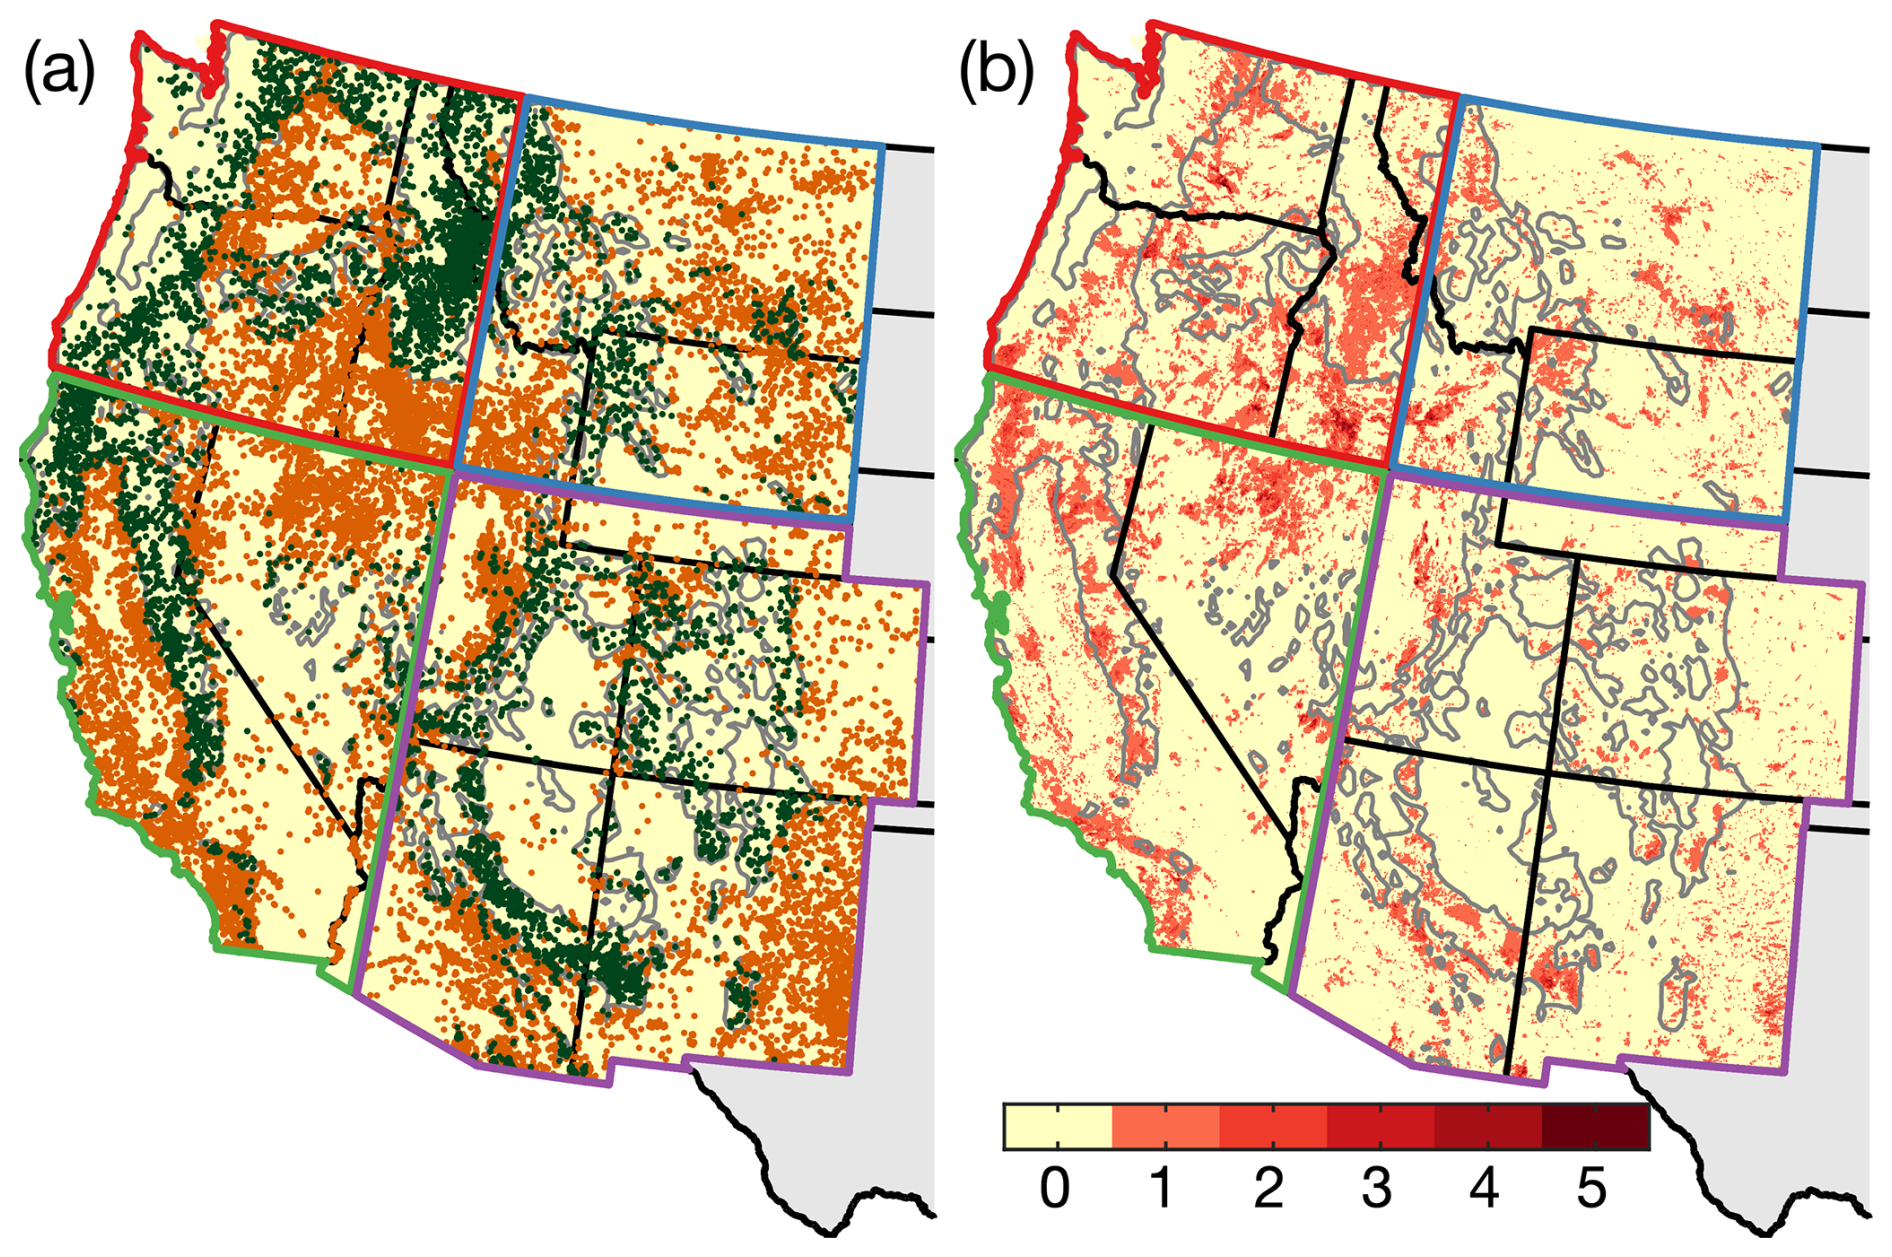
Figure 2Maps of large (≥ 1 km2) wildfires in the WUMI2024a from 1984–2024. (a) Ignition locations. Dot colors indicate locations outside (orange) versus inside (green) forested areas. (b) Number of times burned, approximated as the sum of monthly 1 km resolution maps of fractional area burned. Grey contours bound forested areas where 12 × 12 km forest coverage is ≥ 50 %. Western US domain is divided into four quadrant regions bounded by colors: (red) Pacific Northwest, (blue) Northern Rockies, (green) California/Nevada, and (purple) 4 Corners.
A unique feature of the WUMI2024a is its use of multiple data products to maximize the proportion of fire events for which fire perimeter data are available. The top-left panel in Fig. 3 shows the annual number of fires for which perimeter data come from each source (when multiple perimeters are available for the same fire, the prioritization order is MTBS, CalFire, WFIGS, USGS, IAFPH) as well as the number of fires assumed to be circular due to lack of perimeter data. We also provide annual maps of ignition locations that delineate the source of perimeter data in Fig. S2. Overall, 71 % of fires represented in the database include observed perimeters. The perimeters for two-thirds of these fires (>47 % of all fires) come from MTBS and thus are represented by especially accurate satellite-derived maps of area burned. The 29 % of events without perimeter data are estimated to be circular. These are WFAIP or FPA FOD fires from 1984–2020 that we could not link to fire perimeters from the other databases. Of the four quadrant regions shown in the Fig. 3 maps, the proportion of fires without perimeter data is the lowest (20 %) in CA/NV due to the unique availability of fire perimeters from CalFire in California (Fig. 3, left side). In contrast, more than 41 % of fires lack perimeter data in 4 Corners. Importantly, fires lacking perimeter observations are generally relatively small and account for less than 5 % of total area burned in the WUMI2024a (Fig. 3, right side). In 4 Corners, the 41 % of fires without perimeter observations account for less than 10 % of area burned. In all regions, the proportion of fires lacking perimeter observations, as well as the burned areas represented by these fires, declined significantly from 1984 through 2020 (all fires have perimeters after 2020). In 2020, only 16 % of fires lack perimeter observations and account for just 1.5 % of area burned. The dramatic increase in the proportion of fires with perimeter data represents an encouraging trend toward more rigorous collection and management of wildfire information since the 1980s, but is also illustrative of the unavoidable caveats related to dataset consistency, which researchers should be aware of when using government records to analyze variability and trends in wildfire activity.
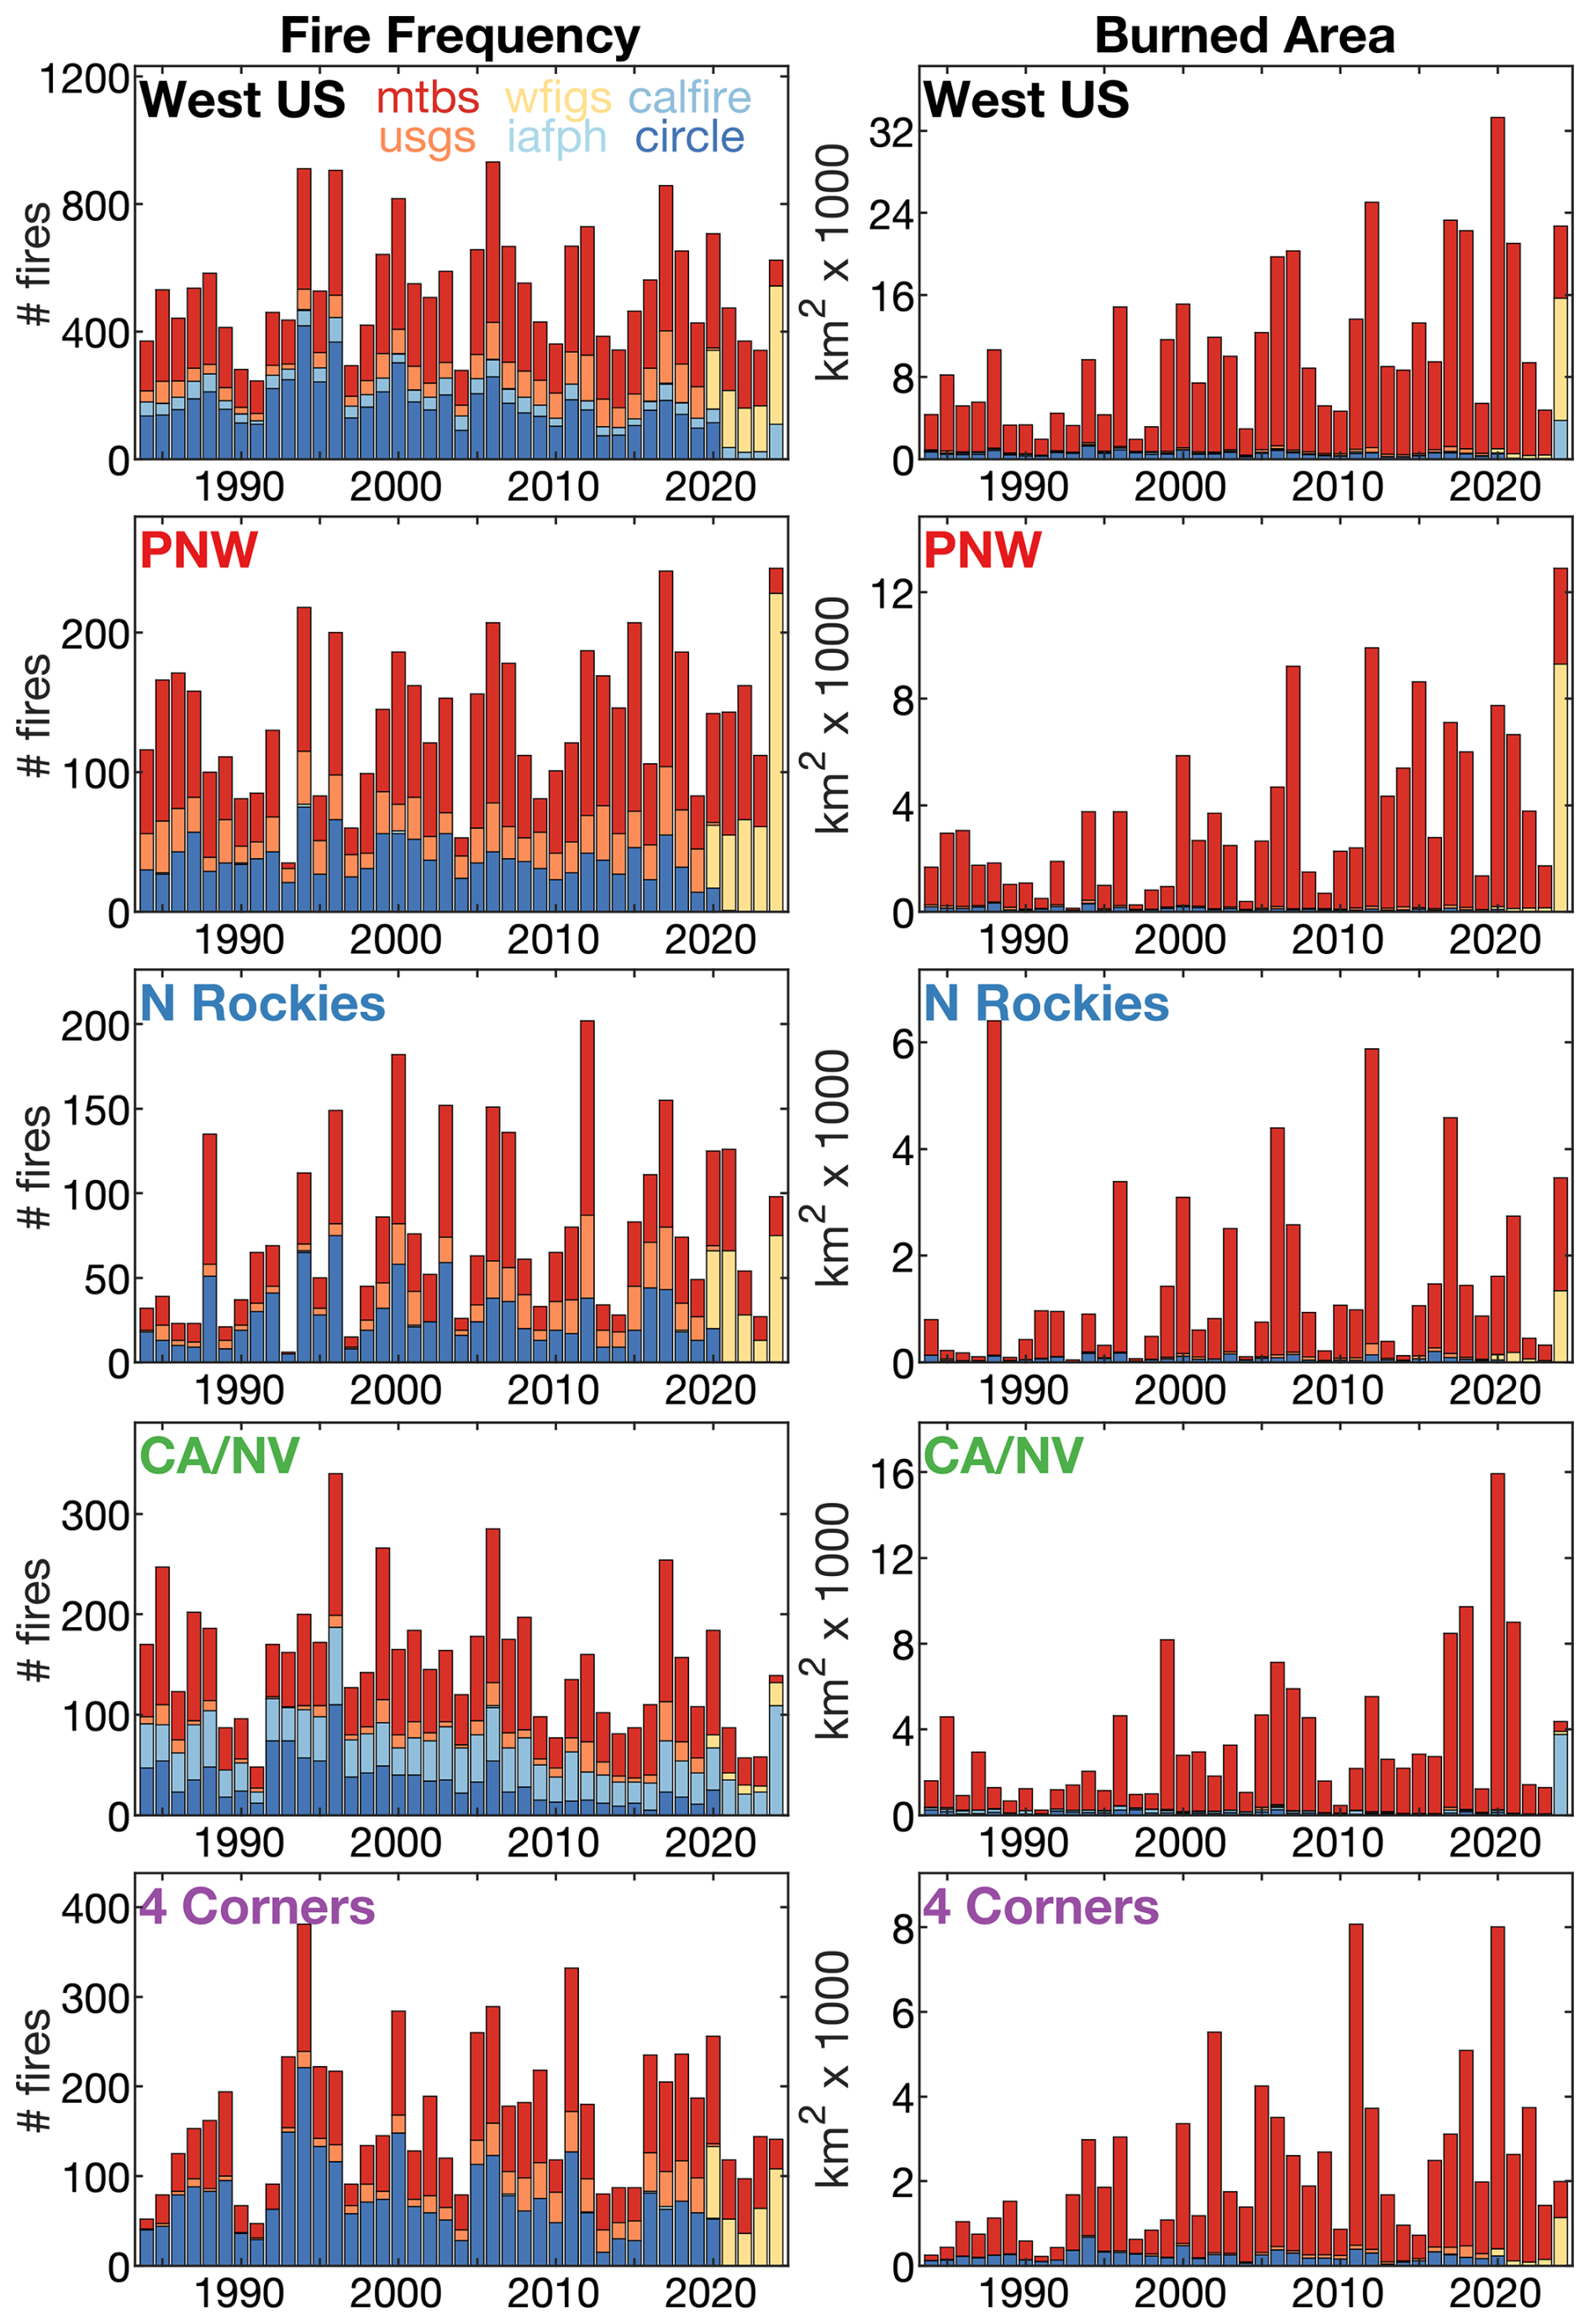
Figure 3Dataset composition of WUMI2024a fire perimeters by year. (left panels) Annual number of wildfires with perimeter data from MTBS, WFIGS, CalFire, USGS, or IAFPH, as well as the number of fires assumed circular due to lack of perimeter data, for (top) the full western US and (lower rows) each of the four regions outlined in Fig. 2. (right panels) Same as left panels except for area burned. Note that when perimeter data are available from more than one source, only one is used, prioritizing MTBS, then CalFire, then WFIGS, then USGS, then IAFPH.
Efforts to assess spatiotemporal variations and changes in historical fire activity are challenged by inconsistencies in the methods to collect, report, and store wildfire information across time and space. Among government records, the types of information recorded, or whether a record for a given fire is made at all, have been inconsistent over time as well as across agencies, and the same fire event is often recorded by multiple government agencies, but commonly with differing names, dates, or sizes. Many consistency issues have been alleviated through the Integrated Reporting of Wildland Fire Information (IRWIN) initiative, but this is a relatively new initiative that has been increasingly implemented since 2014. It is also important to acknowledge that the government wildfire records used for the WUMI2024a are more appropriately viewed as records of fire suppression efforts than as records of all fire occurrences. Thus, the WUMI2024a probably underrepresents the occurrences of relatively small or remote wildfires, as these fires may be more likely to never command attention from an official fire-suppression agency, or to require such a minor suppression effort as to have not been recorded. Further, the data associated with relatively small fires that require fewer suppression resources and are of relatively little consequence may be more likely to receive less scrutiny for accuracy than lager fires, and policies for whether or how data are recorded for these fires are more likely to change over time than for larger fires. For example, the FPA FOD dataset exhibits irregularities in the frequencies of very small (e.g., <4 ha) fires reported by non-federal entities in developed areas that are likely artifacts of changes in reporting levels from local fire departments (Jorge et al., 2025). Given that fire occurrences are dominated by very small events, assessments of fire frequency are especially vulnerable to errors or inconsistencies in the reporting of small fires, thus motivating our choice to limit the WUMI2024a to larger fires ≥ 1 km2 in size. While satellite imagery can supplement and improve the accuracy of government records of fire incidents, which we do through use of the Landsat-derived maps of area burned by the very large fires represented by MTBS, no publicly available database of satellite imagery exists that can be used to systematically identify the start dates, ignition locations, and spatial extents of western US wildfires from the mid-1980s to present.
The most substantial temporal inconsistencies in the accuracy of the WUMI2024a are likely caused by the shift from reliance on the WFAIP as the primary source of fire-occurrence information prior to 1992 to the FPA FOD from 1992–2020. Indeed, by comparing time series of the annual fire frequencies derived from the WFAIP and FPA FOD datasets during their period of overlap, we see that the WFAIP list of federal incidents consistently represents fewer wildfires than the more comprehensive FPA FOD list of incidents reported by federal, state, and local agencies (Fig. 4). Comparing these datasets during their first 10 years of overlap (1992–2001), and focusing on the large ≥ 1 km2 fires of focus in the WUMI2024a, we find that WFAIP fires are 22 % less numerous than FPA FOD fires. Essentially all of this offset is explained by the inclusion of data from state, county, and local (ST/C&L) agencies in the FPA FOD dataset. The orange dashed time series in Fig. 4 represent an alternative version of the FPA FOD dataset that excludes ST/C&L fires, showing that excluding ST/C&L fires from FPA FOD causes much better alignment with WFAIP during 1992–2001. Assessing fires ignited in forest versus non-forest separately, and within each of the four regions visualized in Fig. 2, it is clarified in Fig. 4 that the under-representation of WFAIP fires is mostly confined to the non-forest areas of the southwest US, particularly in 4 Corners but also in CA/NV. In non-forested areas of 4 Corners, approximately 45 % of all FPA FOD fires ≥ 1 km2 in size are reported by ST/C&L agencies, and thus the WUMI2024a may underrepresent the actual frequency of large non-forest fires in this region by approximately half prior to 1992, relative to what may be expected if the FPA FOD data were available during this time. Assessing by state, the negative bias in pre-1992 fire frequency is likely to be strongest in New Mexico, where, during 1992–2001, the frequency of non-forest fires ≥1 km2 was nearly 70 % lower according to WFAIP than to FPA FOD and, non-coincidentally, ST/C&L fires accounted for nearly 70 % of the FAP FOD fire frequency (Fig. S3a). Negative biases in WFAIP fire frequencies are also relatively large, on the order of 30 %–40 %, in non-forest areas of Arizona, California, Colorado, and Wyoming. These biases are also attributable mostly to the absence of ST/C&L fires. In the California, however, the negative bias in WFAIP fire frequency is largely addressed in the WUMI2024a through use of CalFire data, which do include fires addressed by non-federal agencies. Thus, the WUMI2024a is likely to under-represent the frequencies of pre-1992 wildfires in non-forest areas, particularly in New Mexico, Arizona, Colorado, and Wyoming. In addition, the maps of annual fire occurrences provided in Fig. S2 indicate a complete lack of fires in 1984 in the states of Wyoming and New Mexico, which is almost certainly an artifact of inconsistent reporting practices.
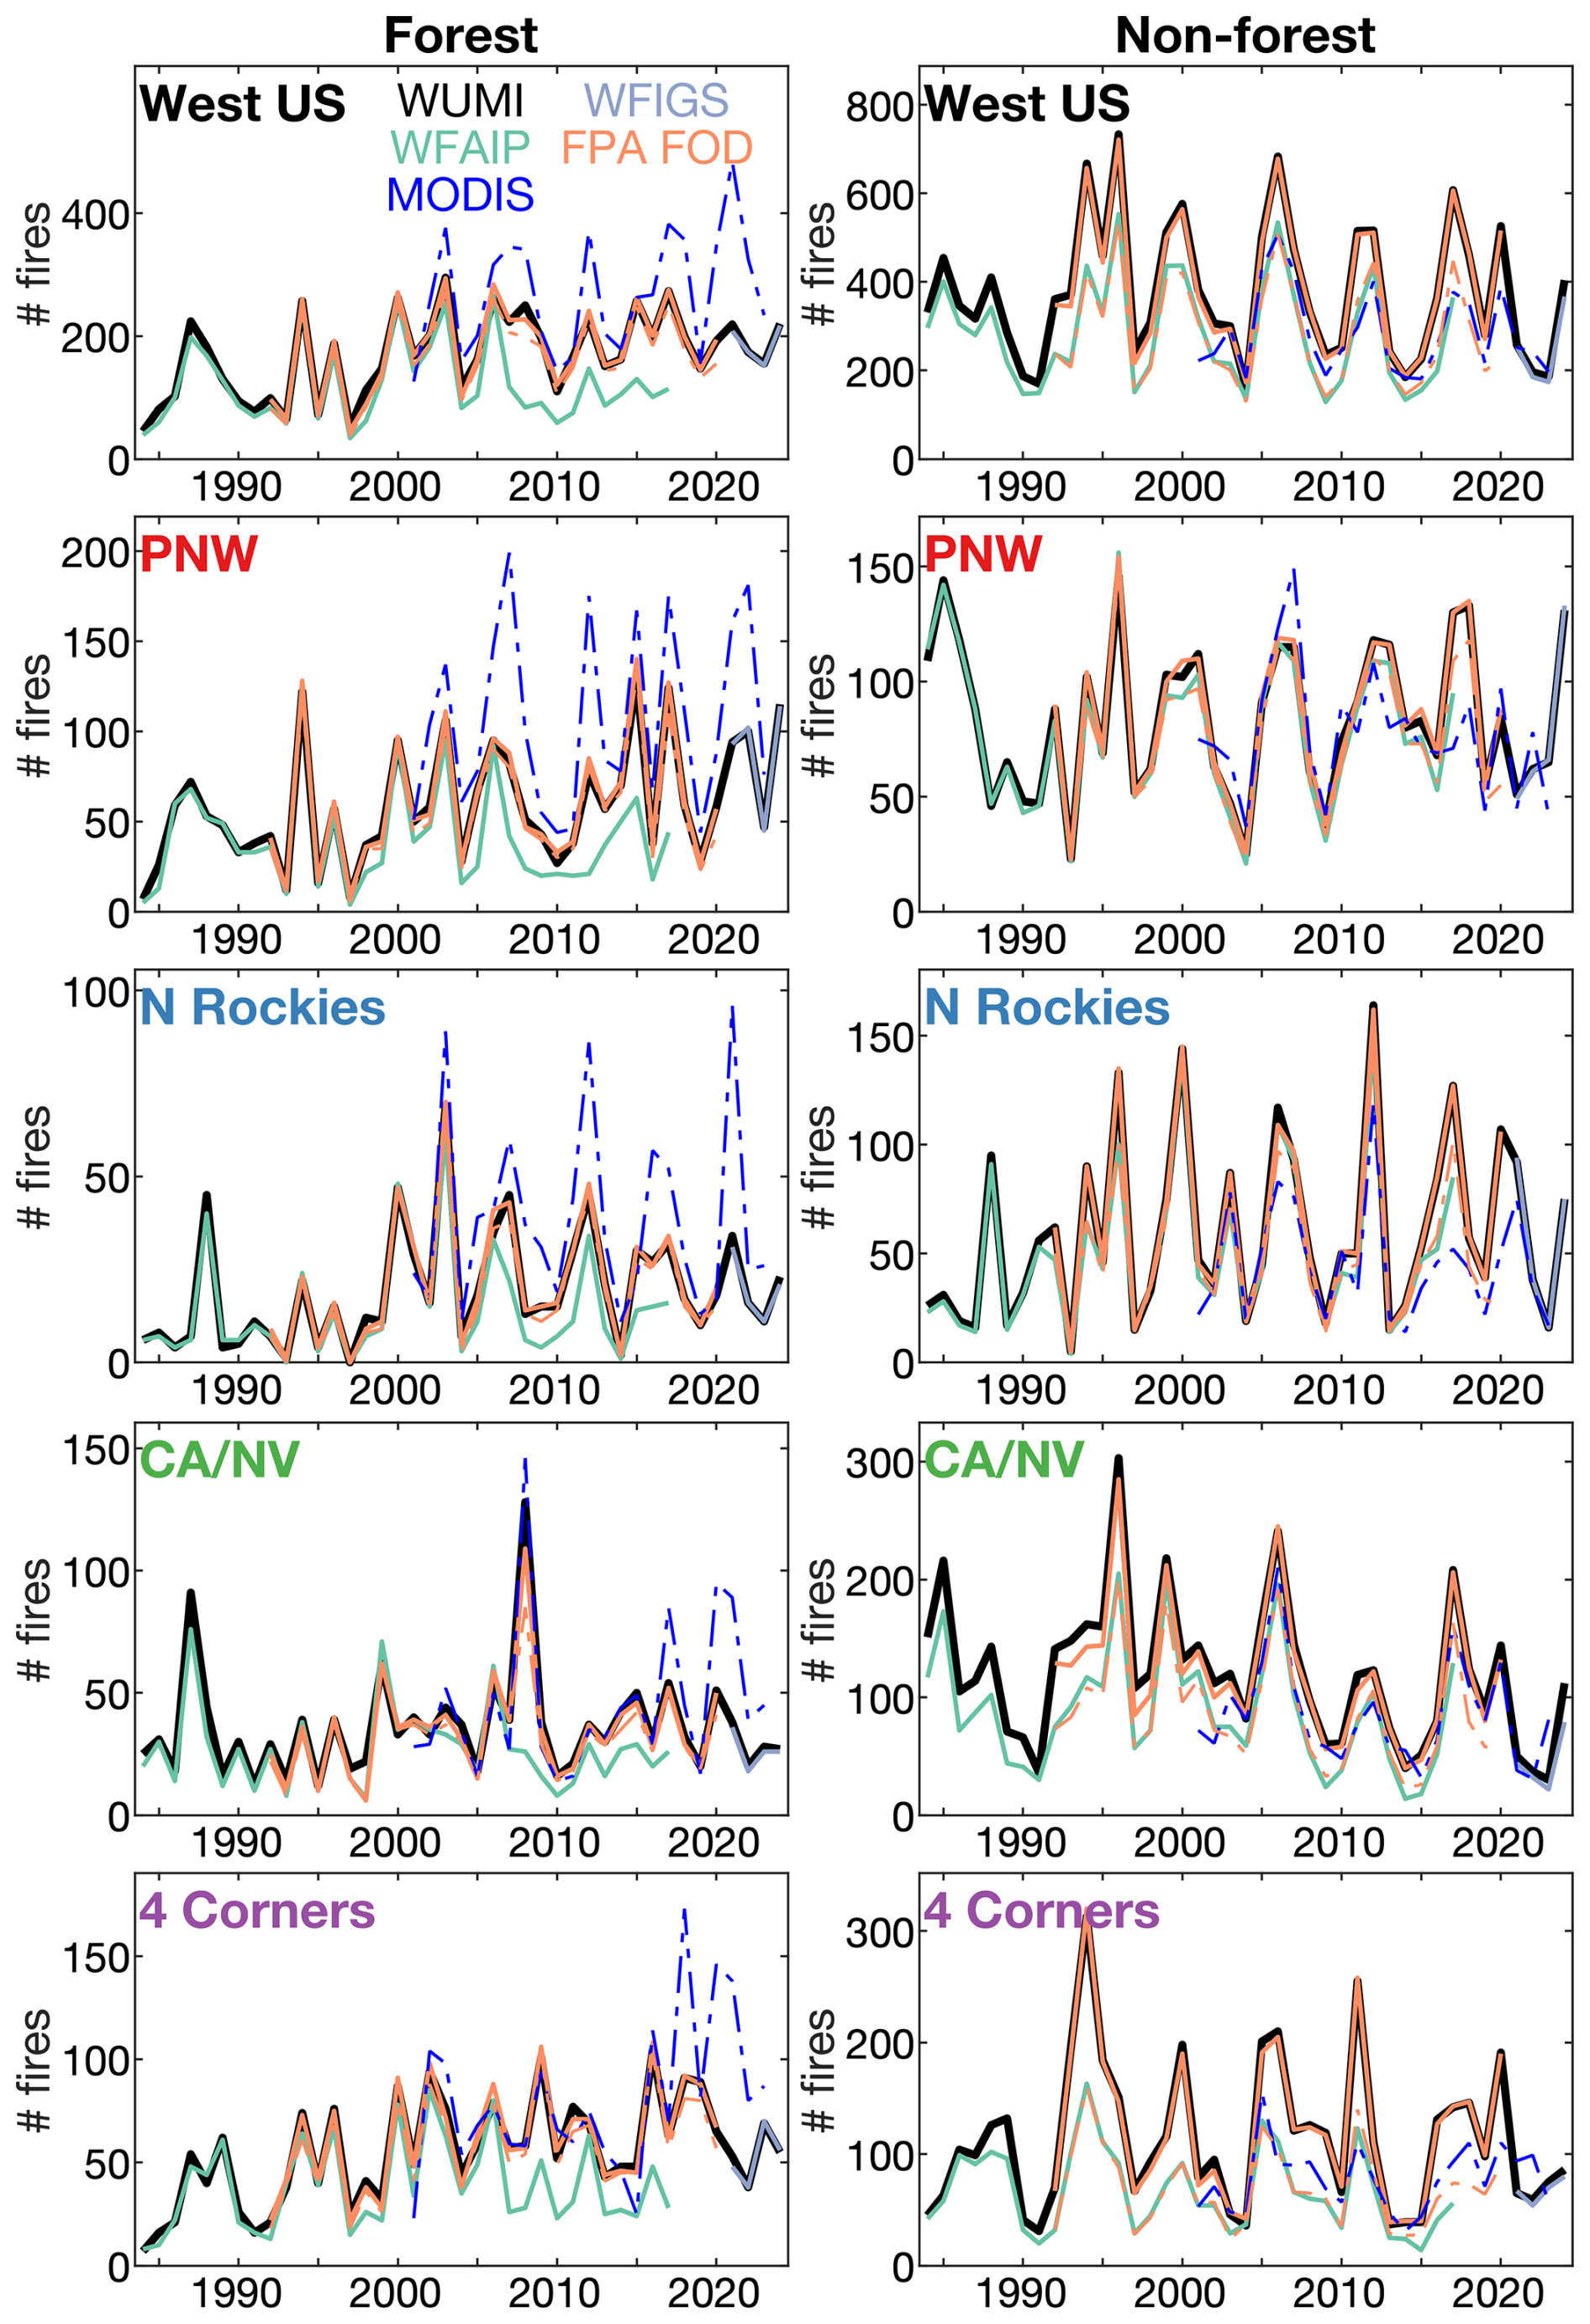
Figure 4Annual frequency of large (≥ 1 km2) western US wildfires, by dataset. Panels on left and right represent fires ignited in forest and non-forest areas, respectively (see Fig. 2a). Top row represents the full western US study domain and rows below represent the four quadrant regions mapped in Fig. 2. Colors distinguish the databases used: WUMI2024a (bold black), WFAIP (light green), FPA FOD (orange), and WFIGS (light purple). The dashed orange line is an alternative version of FPA FOD that excludes fire reports from non-federal agencies. The dashed blue time series is calculated from the independent MODIS FIRED dataset of satellite-derived fire events for 2001–2023 (excluding fires centered on 1 km grid cells where agricultural and/or urban coverage exceeds 75 % according to the USGS NLCD). The WFAIP time series ends in 2017 because this is when its records from most federal agencies ends. The WFIGS time series begins in 2021 because it is not complete prior to that year.
Importantly, the bias toward too few pre-1992 fires is less consequential to assessments of area burned than to fire frequency, as indicated by a much better match between the FPA FOD and WFAIP time series of area burned during their period of overlap (Figs. 5, S3b). This is because the ST/C&L fires missing from WFAIP tend to be relatively small, whereas regional time series of area burned are dominated by a small proportion of very large fires that more often command federal responses, most of which appear in the MTBS dataset. Users who prefer a dataset built from a more temporally consistent set of data sources may consider excluding FPA FOD fires reported by ST/C&L agencies. Overall, the WUMI2024a underrepresents fire frequencies in 1984–1991 relative to 1992–2020, but this effect appears isolated mostly to relatively small fires in non-forest areas, particularly in the easternmost states of the western US. We therefore caution against over-interpretation of the relatively low frequency of pre-1992 fires, particularly small non-forest fires, as represented by WUMI2024a or other databases that extend back to the 1980s or prior.
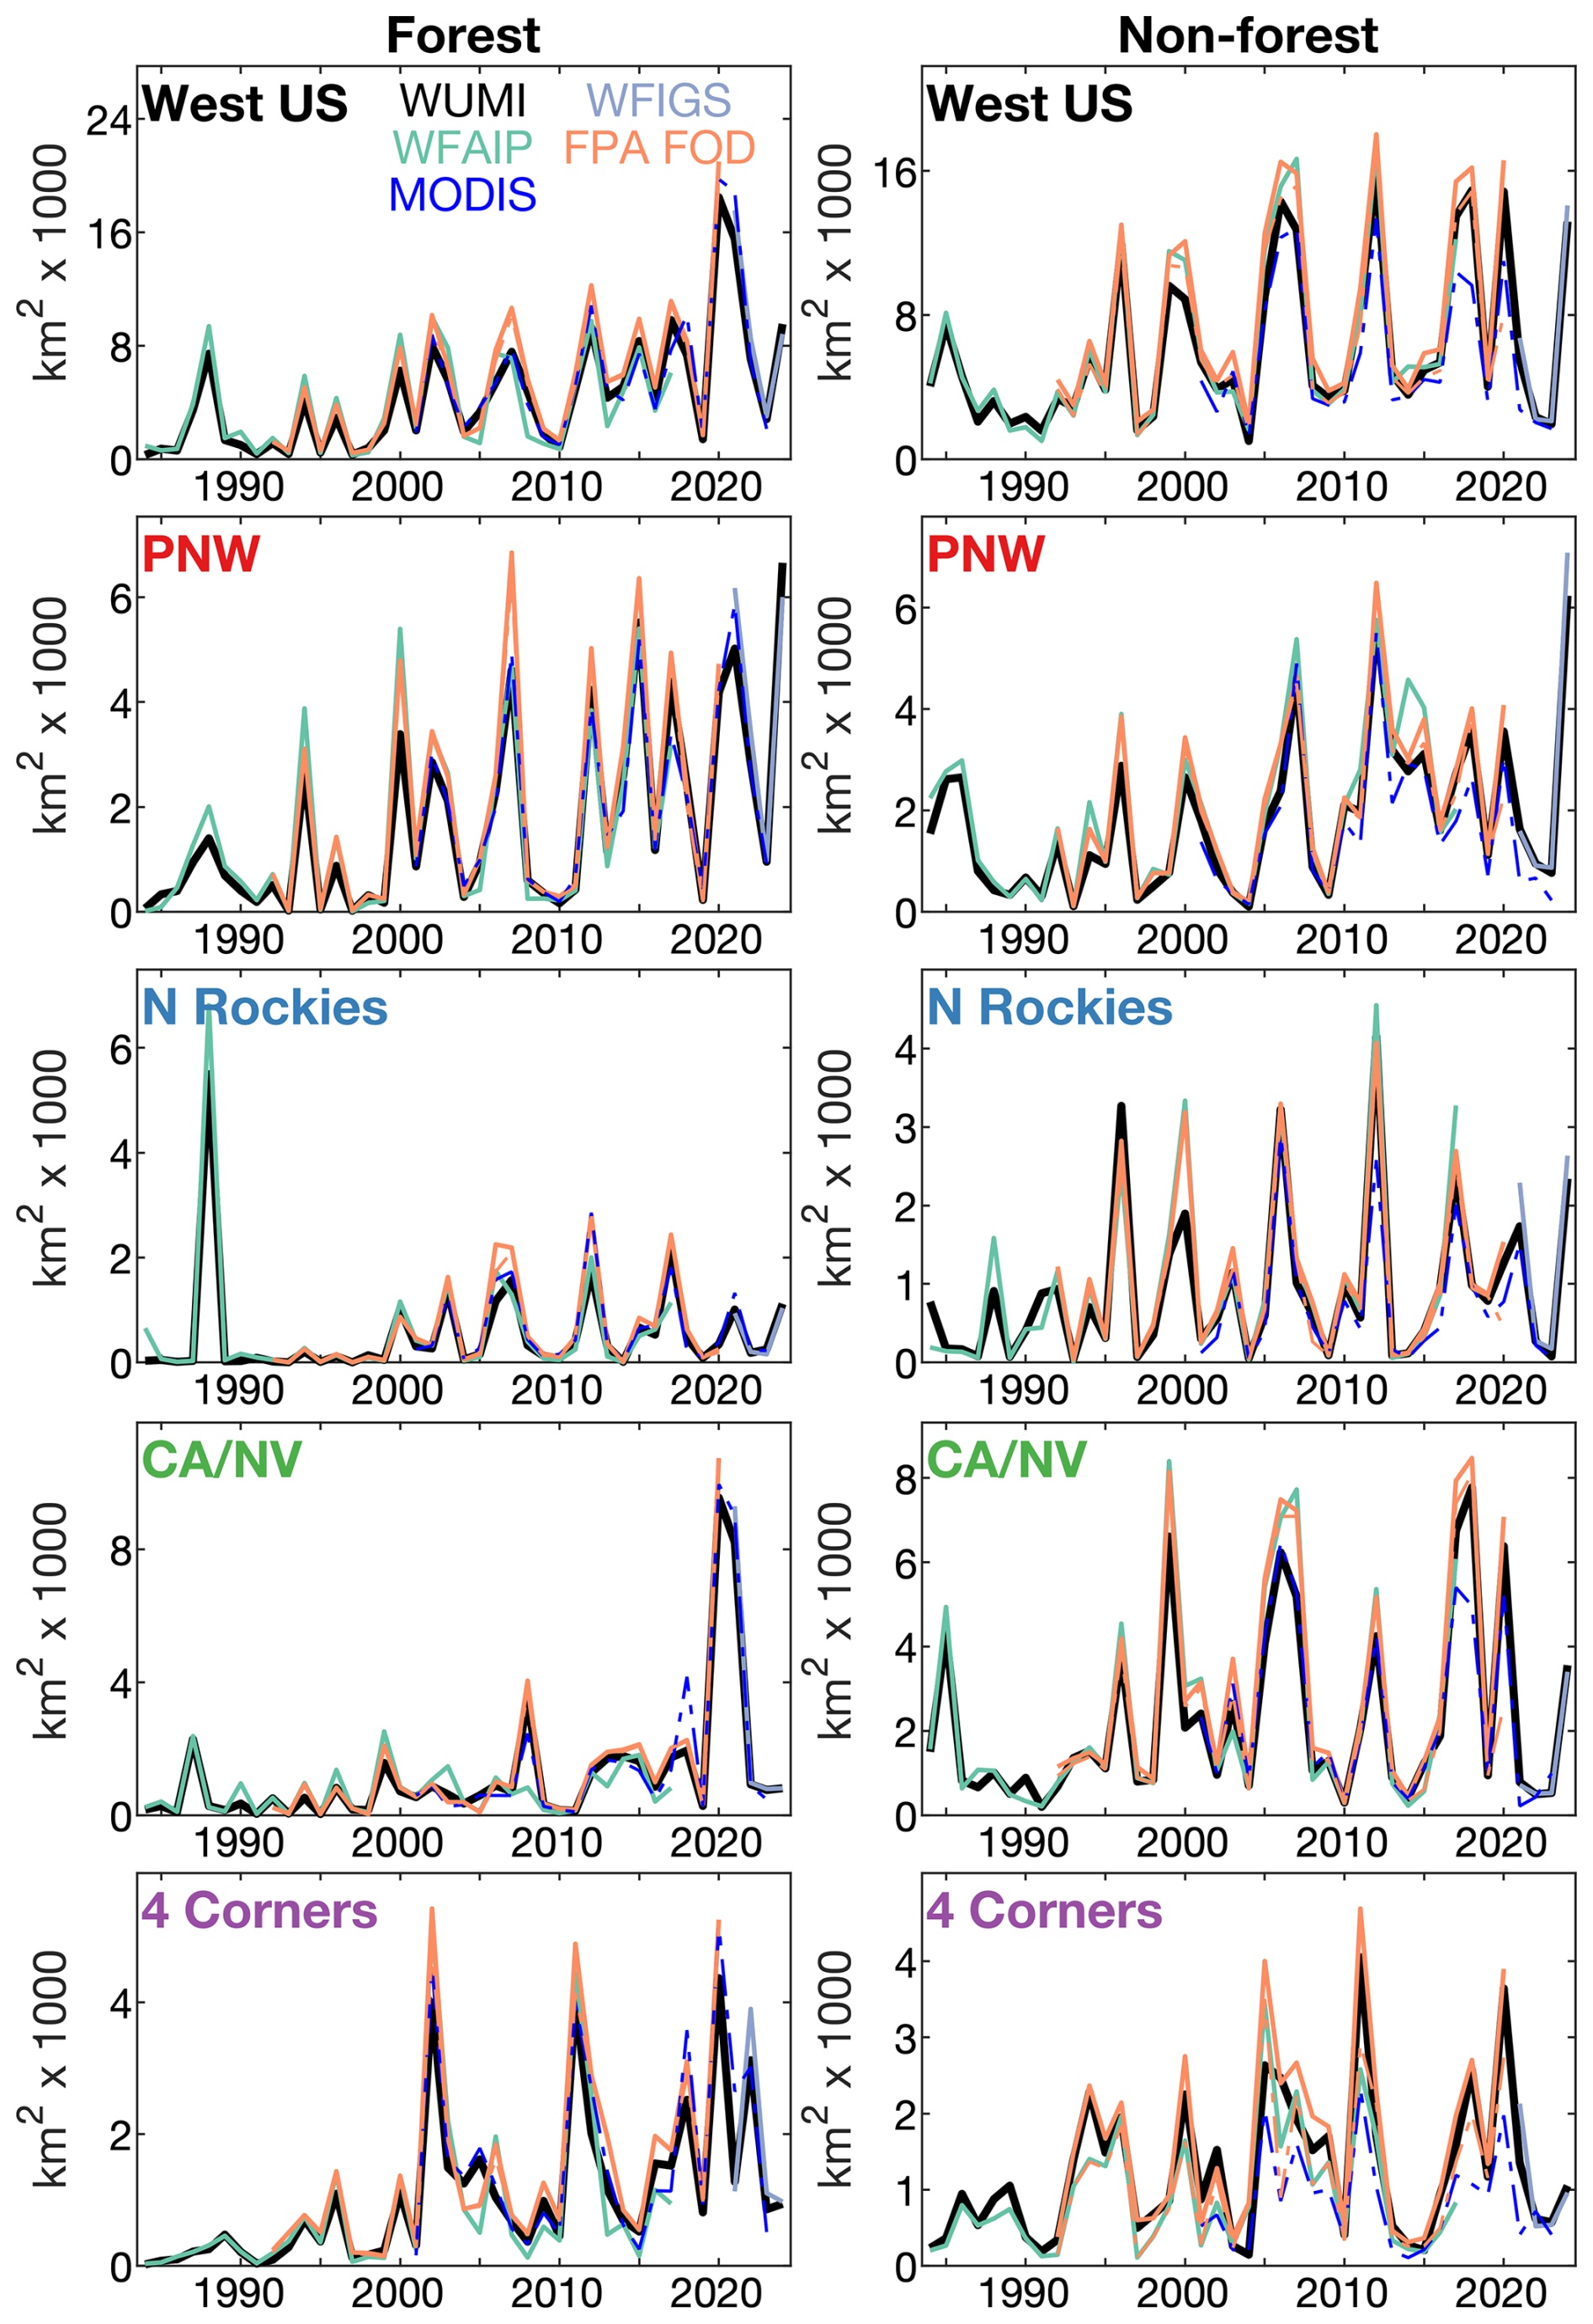
Figure 5As in Fig. 4 but for annual area burned. Forest area burned by each fire is estimated by multiplying the 1 km resolution maps of area burned and fractional forest coverage (Ruefenacht et al., 2008) and summing.
There are probably additional artifacts associated with the 2020-to-2021 transition from reliance on FPA FOD to WFIGS as the primary source of wildfire occurrence data. While WFIGS does include fires reported by non-federal agencies, fires are not included in WFIGS if strict reporting standards are not met. The effects of this shift are difficult to readily assess because WFIGS is not complete during its 2018–2020 period of overlap with FPA FOD. Some insights may be gleaned, however, through comparison to the independent satellite-based FIRED dataset (Balch et al., 2020), a delineation of the gridded MODIS v6.1 burned area product (Giglio et al., 2016) into individual fire events. The blue dashed time series in Fig. 4 show MODIS-derived annual fire frequencies, excluding fires <1 km2 in size (assuming burned 500 m MODIS grid cells burn uniformly) as well as fires in heavily urbanized or agricultural areas where satellite fire detections are less likely to represent wildfires. Comparing FIRED to WUMI2024a in non-forest areas, we see WUMI2024a fire frequencies tend to be somewhat higher than those derived from FIRED in 2001–2020, but not during 2021–2023 (Fig. 4, right side). This suggests that WFGIS may systematically underrepresent fire frequencies relative to what would be expected if FPA FOD was available following 2020. In forest areas, on the other hand, FIRED fires are consistently more frequent than indicated by WUMI2024a (Fig. 4, left side). The higher forest-fire frequencies in FIRED are most prominent in PNW and N Rockies, but also emerge in CA/NV and 4 Corners after 2017. However, there is not a clear post-2020 shift in WUMI2024a forest-fire frequencies relative to those calculated from FIRED and it is therefore unclear how the shift from FPA FOD to WFIGS may affect accuracy of post-2020 forest-fire frequencies.
The higher frequencies of forest fires in the MODIS FIRED dataset relative to WUMI2024a are interesting. One likely cause is that government records often attribute geographically separated burned areas to the same event, but the FIRED dataset may more often delineate these as distinct events. In addition, the FIRED dataset does not distinguish prescribed fires from wildfires and may also capture wildfires in remote areas if the fires are small and short-lived enough to not be managed by a federal or local agency. Importantly, records of annual burned area derived from the FIRED dataset are in tight agreement with the WUMI2024a (Fig. 5) despite the notable disagreements in fire frequency discussed above, reinforcing our interpretation that assessments of spatiotemporal variations in areas burned are far less sensitive than fire frequencies to historical inconsistencies in wildfire reporting.
The WUMI2024a dataset and the code used to produce the dataset are available for peer review at https://doi.org/10.5061/dryad.63xsj3vd4 (Williams et al., 2025a). Two lists of fire events (one prioritizing parent fires, one prioritizing sub-fires) are in the directory called WUMI2024a_final_wildfire_lists/ and Table S1 provides a description of the wildfire attributes included in the fire lists. Maps of fire perimeters and 1 km grids of burned area are in the directory called fire_maps/.
The code used to produce the WUMI2024a is available from https://doi.org/10.5281/zenodo.17298252 (Williams et al., 2025b).
The WUMI2024a is a comprehensive and quality controlled database of more than 22 000 large (≥ 1 km2) wildfires in the western US, currently covering 1984–2024. The database includes start dates, final sizes, and digital maps of perimeters and area burned for each fire. It can be updated with relative ease as new and improved data become available. We compiled this database from seven government datasets and this is the only such compilation to cover the full period of 1984 to 2024 and include fires as small as 1 km2. For more than 10 300 (∼ 47 %) of fires represented, the maps of area burned are calculated from high-resolution satellite imagery and thus account for islands of unburned areas within fire perimeters, which are important to ecosystem recovery and resilience (Coop et al., 2019; Krawchuk et al., 2020). For another 24 % of fires, fire perimeters were accessed from other government datasets, leaving us to resort to an assumption of circular perimeters for just 29 % of fires, which account for only 4.5 % of the area burned. Our primary motives in producing this database include (1) updated assessments of trends and extremes in the wildfire frequency and area burned; (2) improved potential for statistical analyses and modelling of wildfire activity; (3) linkage of our fire perimeters to independent observations of fire progression (e.g, Balch et al., 2020; Lizundia-Loiola et al., 2021), area burned (e.g., Hawbaker et al., 2017), fire severity (e.g., He et al., 2024), and hydrology (e.g., Williams et al., 2022); and, ultimately, (4) improved ability to simulate historical and ongoing effects of wildfire on ecosystems, terrestrial carbon, smoke, hydrology, and society.
Importantly, no historical wildfire database is without major caveats associated with temporal and geographic inconsistencies in the practices used to collect, archive, or disseminate data over time. Satellite-derived observations of fire offer promising opportunities to sidestep the biases and methodological uncertainties inherent to the government records we used to develop the WUMI2024a, but the temporal frequencies of publicly available satellite products do not allow for confident detection of fire-start timing or location across the western US prior to the 2000s, and moderate-to-low spatial resolution inhibits accurate detection of small fires and fine-scale features of burned-area boundaries. Although Landsat imagery is invaluable for production of accurate maps of area burned, which we capitalize on through the MTBS dataset, Landsat overpass times are too infrequent (8 d) to detect many important wildfire features such as the start date and location. Thus, while Landsat imagery can be used to produce wall-to-wall maps of area burned with relatively low (e.g., annual) temporal resolution (Hawbaker et al., 2017), additional observational datasets are necessary to confidently associate Landsat images of burned area with a start date or ignition location. Further, the pre- and post-fire imagery used to identify burned areas may be obscured by clouds, gaps in the imagery data, or changes in vegetation characteristics.
The WUMI2024a also has caveats. First, it relies on publicly available government records of wildfire incidents, which can be more accurately characterized as records of fire response and management rather than as purely records of wildfire occurrence. This means the WUMI2024a is missing any wildfires not recorded by a fire management agency and incorporated into a publicly available database. For example, some wildfires may have never been detected and reported, and others may have been extinguished without receiving official attention from a fire management agency. Thus, the database's completeness and accuracy are subject to temporal and geographic inconsistencies related to changes in practices related to fire detection, management, and data archival. These limitations are well exemplified by the fact that the WUMI2024a indicates zero wildfires in Wyoming and New Mexico in 1984 (Fig. S2). The lack of large 1984 wildfires in two western US states is likely an artifact and we suggest excluding 1984 in assessments that include the interior Western US. We further presented evidence that fire frequencies in the WUMI2024a are highly likely to be artificially low prior to 1992 (the first year of the FPA FOD) in non-forested areas of the interior West because many wildfires in these areas are addressed by non-federal agencies (ST/C&L), which are not represented our database prior to 1992 (Figs. 4, S3a). The negative biases in pre-1992 frequencies are likely to be largest in the non-forest areas of New Mexico, Arizona, Colorado, and Wyoming, as these are the areas where ST/C&L fires are most common in the FPA FOD, so we caution against analyses that rely on consistent fire reporting from the 1980s through 1990s in these areas. Our database does comprehensively represent non-federal fires in California, on the other hand, via data from CalFire. Finally, we were unable to find perimeter data for 29 % of the wildfire events in the WUMI2024a. While these fires are relatively small, only accounting for less than 5 % of area burned in the dataset, and we do adjust the circular perimeters and maps of burned area to exclude open water, ice, and barren ground, we warn against use of the circular fire features for applications that require accurate maps of area burned. These derived features are provided as resources for applications where an approximated map of area burned is better than none at all (e.g., as inputs for some hydrological or smoke-emission modelling exercises), but should be used with caution.
Finally, the value of the WUMI2024a can be improved upon by expanding it to include more than wildfire start dates, locations, causes, perimeters, and 1 km resolution maps of area burned. For example, many fires in the WUMI2024a can be linked to those represented in the ICS-209-PLUS database (St. Denis et al., 2023) to provide information about fire management costs, personnel, and impacts on people and property. Additionally, Landsat imagery can be used to improve our maps of area burned for fires in the WUMI2024a that are not represented among the fires >4.04 km2 in size mapped by the MTBS. Landsat imagery can also be used to detect the perimeters and areas burned for fires with unknown perimeters that we currently assume to be circular, identify additional fire events not yet represented in our database, and expand beyond our maps of burned area to also develop high-resolution maps of fire severity (e.g., Parks et al., 2019) for all fires in the database. Likewise, the MODIS-based FIRED dataset (Balch et al., 2020) can be used to decompose the fire maps in our database into maps of daily fire progression, and capabilities for mapping of fire spread are deepening further through use of the Visible Infrared Imaging Radiometer Suite (VIIRS) instrument (Schroeder et al., 2014; Chen et al., 2022). Imagery from MODIS and VIIRS can also be used to map fire intensity via retrievals of fire radiative power (Schroeder et al., 2014; Giglio et al., 2016). While the WUMI2024a database of wildfire events has been designed to accommodate future updates and expansions, including additional metrics related to fire processes (e.g., spread) and impacts (e.g., severity), its current form advances beyond currently available databases of western US wildfire events and will be a robust and valuable resource for researchers and practitioners in the field of wildfire science.
The supplement related to this article is available online at https://doi.org/10.5194/essd-17-7359-2025-supplement.
APW, CSJ, and KCS developed the methods. APW carried them out, performed the analyses, and prepared the manuscript. CSJ and KCS provided edits to the manuscript.
The contact author has declared that none of the authors has any competing interests.
Publisher's note: Copernicus Publications remains neutral with regard to jurisdictional claims made in the text, published maps, institutional affiliations, or any other geographical representation in this paper. The authors bear the ultimate responsibility for providing appropriate place names. Views expressed in the text are those of the authors and do not necessarily reflect the views of the publisher.
This work would not have been possible without the dedicated efforts of countless others to produce the public databases on which the WUMI2024a relies, as well as the original fire agency reports that those public databases are based on.
This research was supported by the Zegar Family Foundation, the John D. and Catherine T. MacArthur Foundation, the Gordon and Betty Moore Foundation (11974 and 13283), the UCLA Sustainable LA Grand Challenge, the USGS Southwestern Climate Adaptation Science Center (G24AC00611 and G24AC00080), and the US National Park Service (P24AC00743-00).
This paper was edited by Alexander Gruber and reviewed by two anonymous referees.
Abatzoglou, J. T., Battisti, D. S., Williams, A. P., Hansen, W. D., Harvey, B. J., and Kolden, C. A.: Projected increases in western US forest fire despite growing fuel constraints, Communications Earth & Environment, 2, 1–8, https://doi.org/10.1038/s43247-021-00299-0, 2021.
Balch, J. K., St Denis, L. A., Mahood, A. L., Mietkiewicz, N. P., Williams, T. M., McGlinchy, J., and Cook, M. C.: FIRED (Fire Events Delineation): An Open, Flexible Algorithm and Database of US Fire Events Derived from the MODIS Burned Area Product (2001–2019), Remote Sensing, 12, 3498, https://doi.org/10.3390/rs12213498, 2020.
Bryant, B. P. and Westerling, A. L.: Scenarios for future wildfire risk in California: links between changing demography, land use, climate, and wildfire, Environmetrics, 25, 454–471, https://doi.org/10.1002/env.2280, 2014.
Chen, Y., Hantson, S., Andela, N., Coffield, S. R., Graff, C. A., Morton, D. C., Ott, L. E., Foufoula-Georgiou, E., Smyth, P., Goulden, M. L., and Randerson, J. T.: California wildfire spread derived using VIIRS satellite observations and an object-based tracking system, Scientific data, 9, 249, https://doi.org/10.1038/s41597-022-01343-0, 2022.
Coop, J. D., DeLory, T. J., Downing, W. M., Haire, S. L., Krawchuk, M. A., Miller, C., Parisien, M.-A., and Walker, R. B.: Contributions of fire refugia to resilient ponderosa pine and dry mixed-conifer forest landscapes, Ecosphere, 10, e02809, https://doi.org/10.1002/ecs2.2809, 2019.
Eidenshink, J., Schwind, B., Brewer, K., Zhu, Z., Quayle, B., and Howard, S.: A project for monitoring trends in burn severity, Fire Ecol., 3, 3–21, https://doi.org/10.4996/fireecology.0301003, 2007.
Giglio, L., Schroeder, W., and Justice, C. O.: The collection 6 MODIS active fire detection algorithm and fire products, Remote Sens. Environ., 178, 31–41, https://doi.org/10.1016/j.rse.2016.02.054, 2016.
Hantson, S., Arneth, A., Harrison, S. P., Kelley, D. I., Prentice, I. C., Rabin, S. S., Archibald, S., Mouillot, F., Arnold, S. R., Artaxo, P., Bachelet, D., Ciais, P., Forrest, M., Friedlingstein, P., Hickler, T., Kaplan, J. O., Kloster, S., Knorr, W., Lasslop, G., Li, F., Mangeon, S., Melton, J. R., Meyn, A., Sitch, S., Spessa, A., van der Werf, G. R., Voulgarakis, A., and Yue, C.: The status and challenge of global fire modelling, Biogeosciences, 13, 3359–3375, https://doi.org/10.5194/bg-13-3359-2016, 2016.
Hawbaker, T. J., Vanderhoof, M. K., Beal, Y.-J., Takacs, J. D., Schmidt, G. L., Falgout, J. T., Williams, B., Fairaux, N. M., Caldwell, M. K., Picotte, J. J., Howard, S. M., Stitt, S., and Dwyer, J. L.: Mapping burned areas using dense time-series of Landsat data, Remote Sensing of Environment, 198, 504–522, https://doi.org/10.1016/j.rse.2017.06.027, 2017.
He, K., Shen, X., and Anagnostou, E. N.: A global forest burn severity dataset from Landsat imagery (2003–2016), Earth Syst. Sci. Data, 16, 3061–3081, https://doi.org/10.5194/essd-16-3061-2024, 2024.
Hurteau, M. D., Liang, S., Westerling, A. L., and Wiedinmyer, C.: Vegetation-fire feedback reduces projected area burned under climate change, Sci. Rep.-UK, 9, 2838, https://doi.org/10.1038/s41598-019-39284-1, 2019.
Jorge, A. L., Abatzoglou, J. T., Fleishman, E., Williams, E. L., Rupp, D. E., Jenkins, J. S., Sadegh, M., Kolden, C. A., and Short, K. C.: COVID-19 fueled an elevated number of human-caused ignitions in the western United States during the 2020 wildfire season, Earth's Future, 13, e2024EF005744, https://doi.org/10.1029/2024EF005744, 2025.
Juang, C. S. and Williams, A. P.: Western US MTBS-Interagency (WUMI) wildfire dataset (2), Dryad [data set], https://doi.org/10.5061/dryad.sf7m0cg72, 2024.
Juang, C. S., Williams, A. P., Abazoglou, J. T., Balch, J. K., Hurteau, M. D., and Moritz, M. A.: Rapid growth of large forest fires drives the exponential response of annual forest-fire area to aridity in the western United States, Geophys. Res. Lett., 49, e2021GL097131, https://doi.org/10.1029/2021GL097131, 2022.
Keeley, J. E. and Syphard, A. D.: Climate change and future fire regimes: examples from California, Geosciences, 6, 37, https://doi.org/10.3390/geosciences6030037, 2016.
Krawchuk, M. A., Meigs, G. W., Cartwright, J. M., Coop, J. D., Davis, R., Holz, A., Kolden, C., and Meddens, A. J. H.: Disturbance refugia within mosaics of forest fire, drought, and insect outbreaks, Frontiers in Ecology and the Environment, 18, 235–244, https://doi.org/10.1002/fee.2190, 2020.
Lizundia-Loiola, J., Franquesa, M., Boettcher, M., Kirches, G., Pettinari, M. L., and Chuvieco, E.: Implementation of the burned area component of the Copernicus climate change service: from MODIS to OLCI data, Remote Sensing, 13, 4295, https://doi.org/10.3390/rs13214295, 2021.
McKenzie, D. and Littell, J. S.: Climate change and the eco-hydrology of fire: Will area burned increase in a warming western USA?, Ecological Applications, 27, 26–36, https://doi.org/10.1002/eap.1420, 2017.
Parks, S. A., Miller, C., Abatzoglou, J. T., Holsinger, L. M., Parisien, M.-A., and Dobrowski, S. Z.: How will climate change affect wildland fire severity in the western US?, Environmental Research Letters, 11, 035002, https://doi.org/10.1088/1748-9326/11/3/035002, 2016.
Parks, S. A., Holsinger, L. M., Miller, C., and Parisien, M.-A.: Analog-based fire regime and vegetation shifts in mountainous regions of the western US, Ecography, 41, 910–921, https://doi.org/10.1111/ecog.03378, 2018.
Parks, S. A., Holsinger, L. M., Koontz, M. J., Collins, L., Whitman, E., Parisien, M.-A., Loehman, R. A., Barnes, J. L., Bourdon, J.-F., and Boucher, J.: Giving ecological meaning to satellite-derived fire severity metrics across North American forests, Remote Sensing, 11, 1735, https://doi.org/10.3390/rs11141735, 2019.
Ruefenacht, B., Finco, M. V., Nelson, M. D., Czaplewski, R., Helmer, E. H., Blackard, J. A., Holden, G. R., Lister, A. J., Salajanu, D., and Weyermann, D.: Conterminous US and Alaska forest type mapping using forest inventory and analysis data, Photogrammetric Engineering & Remote Sensing, 74, 1379–1388, https://doi.org/10.14358/PERS.74.11.1379, 2008.
Schroeder, W., Oliva, P., Giglio, L., and Csiszar, I. A.: The New VIIRS 375m active fire detection data product: Algorithm description and initial assessment, Remote Sensing of Environment, 143, 85–96, https://doi.org/10.1016/j.rse.2013.12.008, 2014.
Short, K. C.: A spatial database of wildfires in the United States, 1992–2011, Earth Syst. Sci. Data, 6, 1–27, https://doi.org/10.5194/essd-6-1-2014, 2014.
Short, K. C.: Spatial wildfire occurrence data for the United States, 1992–2020 [FPA_FOD_20221014], 6th Edition, Fort Collins, CO, Forest Service Research Data Archive [data set], https://doi.org/10.2737/RDS-2013-0009.6, 2022.
St. Denis, L. A., Short, K. C., McConnell, K., Cook, M. C., Mietkiewicz, N. P., Buckland, M., and Balch, J. K.: All-hazards dataset mined from the US National Incident Management System 1999–2020, Scientific data, 10, 112, https://doi.org/10.1038/s41597-023-01955-0, 2023.
USGS: Annual National Land Cover Database (NLCD) Collection 1.0, U.S. Geological Survey data release [data set], https://doi.org/10.5066/P94UXNTS, 2024.
Welty, J. L. and Jeffries, M. I.: Combined wildland fire datasets for the United States and certain territories, 1800s–Present, U.S. Geological Survey data release [data set], https://doi.org/10.5066/P9ZXGFY3, 2021.
Westerling, A. L.: Wildfire Simulations for California's Fourth Climate Change Assessment: Projecting Changes in Extreme Wildfire Events with a Warming Climate, California Energy Commission, https://www.energy.ca.gov/sites/default/files/2019-11/Projections_CCCA4-CEC-2018-014_ADA.pdf (last access: 13 December 2025), 2018.
Westerling, A. L., Turner, M. G., Smithwick, E. A. H., Romme, W. H., and Ryan, M. G.: Continued warming could transform Greater Yellowstone fire regimes by mid-21st century, Proceedings of the National Academy of Sciences USA, 108, 13165–13170, https://doi.org/10.1073/pnas.1110199108, 2011.
Williams, A. P. and Abatzoglou, J. T.: Recent advances and remaining uncertainties in resolving past and future climate effects on global fire activity, Current Climate Change Reports, 2, 1–14, https://doi.org/10.1007/s40641-016-0031-0, 2016.
Williams, A. P., Livneh, B., McKinnon, K. A., Hansen, W. D., Mankin, J. S., Cook, B. I., Smerdon, J. E., Varuolo-Clarke, A. M., Bjarke, N. R., and Juang, C. S.: Growing impact of wildfire on western US water supply, Proc. Nat. Acad. Sci. USA, 119, e2114069119, https://doi.org/10.1073/pnas.2114069119, 2022.
Williams, A. P., Juang, C. S., and Short, K. C.: The western united States MTBS-Interagency database of large wildfires, 1984–2024 (WUMI2024a) (2024a), Dryad [data set], https://doi.org/10.5061/dryad.63xsj3vd4, 2025a.
Williams, P., Juang, C., and Short, K.: The Western United States MTBS-Interagency Database of Large Wildfires, 1984–2024 (WUMI2024a), Zenodo [code], https://doi.org/10.5281/zenodo.17298252, 2025b.