the Creative Commons Attribution 4.0 License.
the Creative Commons Attribution 4.0 License.
 | 10 Dec 2025
Dynamics of China's forest carbon storage: the first 30 m annual aboveground biomass mapping from 1985 to 2023
Yaotong Cai
Xiaoping Liu
Yuhe Chen
Qianhui Shen
Xiaocong Xu
Honghui Zhang
Sheng Nie
Cheng Wang
Jia Wang
Bingjie Li
Changjiang Wu
Haoming Zhuang
Accurate estimation and monitoring of forest aboveground biomass (AGB) are essential for understanding carbon dynamics, managing forest resources, and guiding environmental policies. However, the spatial and temporal patterns, dynamics, and driving factors of forest AGB in China over recent decades remain insufficiently understood, hindering ecosystem analysis and forest management strategies. This study combines multi-source remote sensing data with residual neural networks (ResNets) to develop the first 30 m resolution annual China Forest AGB dataset (1985–2023) with uncertainty quantification. Validation results confirm the robustness of the ResNets model, achieving an R2 of 0.91, RMSE of 16.49 Mg ha−1, and Bias of 0.50 Mg ha−1 against GEDI footprint AGBD, and an R2 of 0.63, RMSE of 68.26 Mg ha−1, and Bias of −19.87 Mg ha−1 against independent multi-year ground survey data. The dataset reveals a notable increase in China's average forest aboveground biomass density (AGBD) from 95.74 ± 11.30 Mg ha−1 in 1985 to 122.69 ± 13.94 Mg ha−1 in 2023. During this period, total forest aboveground carbon (AGC) stock rose from 5.50 ± 0.23 PgC to 13.97 ± 0.87 PgC, establishing China's forests as a significant carbon sink over the past four decades, with a net carbon sink of 0.22 ± 0.01 PgC yr−1, offsetting 11.5 %–14.9 % of China's annual fossil fuel and industrial carbon dioxide emissions. Forest growth contributed 65.1 % (5.75 PgC) of the total AGC increase, while forest expansion accounted for 34.9 % (3.09 PgC). This dataset provides critical information for forest carbon accounting in China and offers valuable insights for climate change mitigation, ecosystem conservation, and sustainable land management.
The dataset is available at https://doi.org/10.5281/zenodo.12620984 (Part I: 1985–1993, Cai et al., 2025a), https://doi.org/10.5281/zenodo.12637101 (Part II: 1994–2001, Cai et al., 2025b), https://doi.org/10.5281/zenodo.12655492 (Part III: 2002–2008, Cai et al., 2025c), https://doi.org/10.5281/zenodo.12658255 (Part IV: 2009–2015, Cai et al., 2025d), https://doi.org/10.5281/zenodo.12742210 (Part V: 2016–2021, Cai et al., 2025e), https://doi.org/10.5281/zenodo.12747329 (Part VI: 2022-2023, Cai et al., 2025f).
- Article
(15991 KB) - Full-text XML
-
Supplement
(1354 KB) - BibTeX
- EndNote


Aboveground biomass (AGB) is a critical metric for quantifying carbon stocks in forest ecosystems, representing approximately 70 %–90 % of total forest biomass (Cairns et al., 1997). Variations in AGB over time directly shape the dynamics of the global carbon cycle. Empirical studies estimate that forest AGB accounts for approximately 15 % to 30 % of the terrestrial carbon pool (Davidson and Janssens, 2006) and has sequestered an estimated 106.9 PgC over the past three decades, corresponding to roughly 17 % of global fossil fuel emissions (Pan et al., 2024). Given its critical role in the global carbon cycle, AGB has been incorporated into the compliance framework of the Paris Agreement and recognized as a key monitoring indicator under the United Nations Sustainable Development Goals (SDGs) (Baccini et al., 2012; Xu et al., 2021).
China ranks fifth globally in total forest area and possesses the largest expanse of planted forests worldwide (FAO, 2020) (see Sect. S1 in the Supplement for details on the study area). Since the 1970s, the Chinese government has launched a series of large-scale forestry initiatives aimed at improving ecological quality and mitigating environmental degradation (Liu et al., 2008; Lu et al., 2018). These programs have driven extensive afforestation and reforestation, expanding forest cover from 12.98 % in the 1980s to 24.02 % in 2021 (Fig. S1) (Cai et al., 2024). Between 1990 and 2019, the carbon sink capacity of global temperate forests increased by 30.2 %, with China's reforestation programs contributing substantially to this rise (Pan et al., 2024). Nevertheless, the degree to which these afforestation initiatives have augmented AGB, especially regarding the spatiotemporal dynamics of carbon accumulation across China's forested landscapes, remains inadequately quantified.
Annual, spatially explicit assessments of forest AGB provide a direct and effective approach to evaluating carbon sink enhancement resulting from large-scale afforestation. While mature forests typically experience gradual annual biomass changes that may not be detectable using yearly remote sensing data, monitoring intervals of 3–5 years are generally sufficient to capture meaningful growth trends (Le Toan et al., 2011). In contrast, young, fast-growing forests or recently disturbed areas require more frequent (e.g., annual) observations due to rapid carbon turnover in dynamic carbon pools, rendering high-frequency monitoring essential for accurately capturing rapid disturbance events and recovery processes (Quegan et al., 2019).
Traditional forest inventory approaches, which rely on permanent sample plots and periodic surveys (typically conducted at five-year intervals), remain widely employed at the national scale for estimating forest biomass and assessing its temporal dynamics. While these surveys provide valuable statistics, they are labour-intensive, lack spatial and temporal continuity, and are unsuitable for producing wall-to-wall, spatiotemporally consistent biomass estimations. Process-based ecosystem models (e.g., Dynamic Global Vegetation Model, DGVM), which simulate biogeochemical processes such as photosynthesis, carbon allocation, and uptake, often incorporate biotic, climatic, and anthropogenic drivers (Sitch et al., 2008). However, these models are limited by uncertainties in input datasets (e.g., climate and soil data), coarse spatial resolutions, and assumptions of stand homogeneity, resulting in significant uncertainties in biomass estimates and an inability to capture spatial variability in forest biomass. In contrast, remote sensing–based models is a promising alternative for achieving spatially explicit and annual assessments of forest AGB (Lu et al., 2016).
Optical remote sensing, synthetic aperture radar (SAR), and light detection and ranging (LiDAR) are the primary remote sensing technologies employed for estimating forest AGB. Spaceborne LiDAR systems (e.g., GEDI) provide accurate footprint-level forest AGB estimates but are limited in spatial and temporal coverage, making them unsuitable for nationwide, long-term monitoring (Coops et al., 2021; H. Nguyen et al., 2019). While synthetic aperture radar (SAR) data enable spatially continuous monitoring, historical satellite missions like ALOS-2 and Sentinel-1 lack sufficient temporal depth to capture the multi-decade impacts of large-scale afforestation. Vegetation optical depth (VOD) derived from SAR has demonstrated strong correlations with AGB over long timescales (Fang et al., 2024; Moesinger et al., 2020) but suffers from coarse spatial resolution, limiting its effectiveness in capturing fine-scale AGB changes caused by deforestation, degradation, and recovery.
To date, large-scale and long-term forest biomass monitoring systems have primarily relied on multispectral satellite imagery (e.g., Landsat time series) combined with field inventory data or airborne LiDAR to estimate AGB (Coops et al., 2021). Three main approaches have been employed for historical AGB reconstruction: (1) Space-for-time substitution: Models are trained using multitemporal reference datasets to predict historical AGB from spectral data, assuming that contemporary relationships are temporally transferable (Harris et al., 2021; Matasci et al., 2018; Wulder et al., 2020). (2) Parameter-based reconstruction: Historical AGB is inferred from related forest parameters, such as tree cover or canopy height (Chen et al., 2023). This approach depends on the robustness of parameter–AGB relationships and the quality of input datasets. (3) Continuous time-series estimation using machine learning: Continuous AGB dynamics are derived by integrating Landsat time series with advanced algorithms that extract temporal and spectral features (e.g., CCDC) and predict biomass via machine learning models, such as random forests (Fu et al., 2024). Among the available approaches, space-for-time substitution provides a practical solution for reconstructing historical AGB at large scales. By leveraging multitemporal reference data, this method can generate temporally generalizable models without requiring continuous field observations, thus balancing prediction accuracy, temporal coverage, and computational feasibility. Compared with approaches relying on continuous Landsat time series and machine learning, space-for-time substitution effectively captures both abrupt and gradual forest changes while maintaining manageable computational demands (H. Nguyen et al., 2019). However, a key challenge in predicting AGB from Landsat spectra is spectral saturation, wherein reflectance values become insensitive to biomass variations beyond certain thresholds, particularly in dense forest conditions (Zhang et al., 2019). This phenomenon restricts the capacity of traditional regression-based models to accurately capture biomass dynamics in high-biomass regions. Previous studies indicate that deep learning approaches outperform traditional machine learning algorithms in terms of cross-validation stability and generalization (Dixon et al., 2025; He et al., 2016; Huy et al., 2022). In particular, the ResNet architecture – through its residual connections – facilitates the training of deeper networks and the extraction of complex, non-linear relationships between spectral–structural features and AGB (He et al., 2016). This capability offers a promising pathway to mitigating the saturation effects inherent to single-source data.
Another limitation to achieving high-quality, high-resolution, and long-term AGB monitoring in China is the absence of forest-specific thematic maps that reliably reflect national forest dynamics. Forest extents derived from general land-use/land-cover products frequently underrepresent afforestation and plantation dynamics (Cai et al., 2024), which leads to omissions in historical records and underestimation of China's carbon sink potential (Wang et al., 2020; Yu et al., 2022). There is also a pronounced shortage of large-scale, geographically representative biomass survey data that cover China's diverse forest types, soils, climatic zones, and biomass gradients – datasets that are essential for developing spatially and temporally transferable models. Although several static AGB maps for China have been produced using different approaches, substantial inconsistencies persist (see Table S1); reported national AGB/AGC totals vary widely because of differences in observation epochs, input data, and upscaling/conversion procedures (Santoro et al., 2021). A recurring problem is temporal and spatial misalignment between field inventories and remote sensing inputs, which reduces the ability of models to capture forest change reliably (Araza et al., 2022; Babcock et al., 2016; Le Toan et al., 2011).
Representative global and China time series AGB products (see Sect. S1) exhibit complementary strengths but also systematic weaknesses that limit their direct applicability for high-fidelity, temporally explicit mapping in China. For example, coarse global products and compilations (e.g., European Space Agency's Climate Change Initiative (ESA CCI) biomass dataset, and GEOCARBON/GlobBiomass) provide extensive spatial coverage and useful baselines but tend to smooth local detail because of coarse native resolutions and multi-year compositing; some pan-tropical maps also exhibit systematic positive or negative biases outside the wet tropics (Liu et al., 2015; Santoro et al., 2021). Meanwhile, emerging spaceborne lidar (e.g., GEDI, and ICESat-2) provides higher-quality vertical structure information that can reduce saturation and structural ambiguity, but footprint sparsity requires careful upscaling to wall-to-wall maps (Duncanson et al., 2022). In short, available global products trade off spatial detail, temporal continuity, and structural sensitivity – none simultaneously deliver the high spatial resolution, dense temporal coverage, and unbiased response across the full biomass gradient that are needed for national-scale, temporally consistent AGB time series in China.
In response to the urgent need for improved national biomass mapping and the lack of a comprehensive dataset to support continuous monitoring of AGB spatial dynamics, this study proposes a bottom-up spatial framework to quantify changes in China's forest biomass over the past four decades (1985–2023). This framework integrates a ResNet-based deep learning algorithm, leveraging 72 150 multi-temporal GEDI AGB training samples (2019–2021) and remote sensing observations to train the model and generate accurate AGB time series, thereby reducing uncertainties in inventory change estimates. The primary goals of this study are: (1) to generate the first 30 m resolution annual time series dataset of China's forest AGB from 1985 to 2023, referred to as the China Forest AGB Time Series Dataset (CFATD); and (2) to monitor and quantify long-term and short-cycle changes in China's terrestrial forest biomass, improving estimates of carbon sources (e.g., from deforestation) and carbon sinks (e.g., from forest regeneration and afforestation). By achieving these objectives, this study seeks to answer four key questions: (1) What are the spatiotemporal trends of China's AGB carbon sink? (2) How much carbon have forests sequestered under China's large-scale afforestation initiatives? (3) How much of this sequestration is directly attributable to afforestation? (4) To what extent can forests contribute to China's carbon neutrality goals, and how much of the nation's anthropogenic carbon emissions have past forest carbon sinks offset? The resulting dataset provides a robust, data-driven foundation for understanding forest biomass changes and their implications for environmental policy, climate change mitigation, and sustainable forest management.
2.1 Remote sensing data
2.1.1 Landsat imagery
This study utilized Landsat satellite imagery from the Google Earth Engine (GEE) platform, covering the period from 1985 to 2023. The dataset includes images from Landsat 4/5 Thematic Mapper (TM), Landsat 8/9 Operational Land Imager (OLI), and Landsat 7 Enhanced Thematic Mapper Plus (ETM+) prior to 2003. Due to the Scan Line Corrector (SLC)-off failure in mid-2003, post-2003 Landsat 7 data were excluded from the analysis, except for 2012 when no other Landsat sensors provided coverage. All imagery was obtained from the Landsat Collection 2, Level-2, Tier-1 surface reflectance products at 30 m spatial resolution, which have undergone sensor-specific radiometric calibration, atmospheric correction, and orthorectification (Wulder et al., 2022).
To ensure temporal consistency, we first selected images acquired during the main growing season (Day of Year 150–300) and applied the cross-sensor spectral harmonization procedure described by Roy et al. (2016) to align the spectral responses of TM, ETM+, and OLI bands. Subsequently, annual medoid composites were generated for each year using QA band filtering (Zhu et al., 2015) to remove cloud, shadow, and snow contamination. Remaining gaps in the annual composites were filled using linear interpolation or extrapolation along the temporal dimension. Each composite contained three visible bands (red, green, blue), one near-infrared (NIR) band, and two shortwave infrared (SWIR) bands. Additionally, to capture vegetation growth status and canopy structure, we calculated several spectral indices, including the Normalized Difference Vegetation Index (NDVI), Enhanced Vegetation Index (EVI), and Normalized Burn Ratio (NBR). These spectral bands and indices served as input features for subsequent modelling. A more detailed description of the processing workflow can be found in Cai et al. (2025g).
2.1.2 China annual tree cover dataset
The China Annual Tree Cover Dataset (CATCD) is the first long-term dataset capturing annual tree cover changes across China at a 30 m spatial resolution from 1985 to 2023 (Cai et al., 2024). Developed using Landsat time-series imagery and advanced random forest-based ensemble learning techniques, the dataset has been rigorously validated against multiple reference datasets, achieving correlation coefficients of 0.70 to 0.96 and RMSE values ranging from 5.6 % to 25.2 %. The dataset aligns closely with National Forest Inventory (NFI) trends, effectively capturing forest area dynamics driven by major afforestation and reforestation initiatives. This capability enables the development of an AGB dataset that reflects temporal forest changes with high fidelity. In accordance with the technical standards of the National Forestry and Grassland Administration (National Forestry and Grassland Administration, 2019) and forest definition in the previous study (Fang et al., 2001; Piao et al., 2009), a 20 % tree cover threshold was applied to delineate forested areas, which formed the foundational layer for AGBD estimation. Furthermore, leveraging the strong correlation between canopy cover and forest biomass (Chen et al., 2023), tree cover was also used as an explanatory variable in AGBD modelling.
2.1.3 Meteorological and topographic data
To enhance the accuracy of AGBD predictions by capturing the environmental and spatial factors influencing forest biomass, we integrated climate, topography, and geographic location as explanatory variables in our AGBD prediction model (Su et al., 2016; Zhang et al., 2019). Climate variables were sourced from WorldClim 2.1, which provides global climate data for the period 1970–2000 at high spatial resolutions (∼ 1000 m). This dataset includes variables such as temperature, precipitation, and other bioclimatic factors. We selected four climate variables from WorldClim 2.1 that are relevant to forest growth: bio1 (annual mean temperature), bio4 (temperature seasonality), bio12 (annual mean precipitation), and bio15 (precipitation seasonality). To match the spatial resolution of other datasets such as Landsat, we resampled the climate data to 30 m resolution using bilinear interpolation. Topographic factors were derived from the SRTM DEM V3, which provides 30 m resolution elevation data. Based on the DEM data, we calculated slope and aspect using the GEE platform. To capture large-scale spatial patterns and residual spatial autocorrelation beyond environmental predictors, we also included latitude and longitude as auxiliary spatial variables, following Tobler's First Law of Geography. This practice has proven effective in improving model generalization and reducing spatial bias in regions with sparse training data (Yang and Huang, 2021).
2.2 Reference data
2.2.1 GEDI AGBD product
The Global Ecosystem Dynamics Investigation (GEDI) instrument aboard the International Space Station (ISS) provides footprint-level estimates of aboveground biomass density (AGBD) at ∼ 25 m spatial resolution, with footprints spaced ∼ 60 m along track. These estimates are derived from statistical models calibrated with field measurements and simulated waveforms, stratified by region and plant functional type to improve predictive performance (Duncanson et al., 2022; Kellner et al., 2023). The dataset also provides per-footprint uncertainty information, which enhances its applicability in underrepresented regions. We obtained GEDI L4A footprint-level AGBD observations for 2019-2021 and applied standard quality-control filters to retain only reliable measurements, excluding those from degraded orbits or steep slopes (Shendryk, 2022). To remove residual outliers, we employed the GEDI Level-4B (L4B) 1 km gridded product as a consistency benchmark. The L4B product generation implements a rigorous multi-tier screening process that goes beyond standard quality flags. It applies stricter beam sensitivity thresholds (> 0.98 in tropics) to ensure canopy penetration, filters out observations with degraded geolocation precision, and incorporates an iterative local outlier detection algorithm to remove spurious retrievals caused by atmospheric scattering (e.g., clouds or fog). Leveraging this robust baseline, we performed a consistency check by identifying and excluding L4A footprints that deviated significantly (> 2 standard deviations) from the high-quality local L4B grid mean. Finally, to minimize spatial autocorrelation, we applied a systematic spatial thinning strategy. Within each 1 km grid cell, we prioritized the retention of the single observation that exhibited optimal beam sensitivity and minimal deviation from the grid-level ensemble mean, thereby ensuring the selection of the most representative footprint for each 1 km cell. This rigorous process resulted in a curated dataset of 72 150 high-confidence samples distributed across China's major ecoregions (Fig. S2).
2.2.2 Field survey data
To independently assess the accuracy of forest AGBD estimates derived from remote sensing, we compiled ground-based measurements from 4243 forest plots across the study area from published sources (Fig. S3) (Avitabile et al., 2016; Luo et al., 2014; Usoltsev, 2010; Zhang et al., 2019). Given the scale mismatch between field plots and satellite pixels, strictly controlling data quality was critical. We applied a rigorous screening protocol: (1) Temporal Alignment: Survey years were aligned with satellite observation epochs to minimize errors from forest growth or disturbance; (2) Homogeneity Assessment: Plots located in highly heterogeneous landscapes or forest edges (identified using high-resolution imagery) were excluded to reduce the scale effect; and (3) Statistical Outlier Removal: Inconsistent records and potential outliers (e.g., biomass values exceeding biological potential for specific climate zones) were removed. After this quality control, 2109 representative plots were retained. These plots, surveyed between 1978 and 2008, cover diverse forest types (primary, secondary, and plantations) and dominant species such as Betula platyphylla, Cunninghamia lanceolata, and Pinus koraiensis.
2.2.3 Provincial statistics from national forest inventories
The National Forest Inventories (NFIs) provide provincial-level forest area and total forest volume data but lack biomass-specific information for direct validation. Here, we utilized provincial forest AGC statistics derived from Fang et al. (2001), based on forest volume data from five NFIs (3rd NFI: 1984–1988 to 7th NFI: 2004–2008). These AGC estimates were obtained by converting the NFI-reported forest volumes into biomass using continuous biomass expansion factors (BEFs) (Fang et al., 2005). The reliability of the AGC estimates has been validated in previous studies (Fang et al., 2001).
2.3 Satellite-based datasets for temporal trend validation
To cross-check the temporal dynamics of AGBD, we employed two independent datasets: vegetation optical depth (VOD) and gross primary production (GPP). VOD primarily reflects canopy structural and water characteristics, whereas GPP quantifies ecosystem carbon uptake; both are strongly and positively correlated with aboveground biomass dynamics. VOD was derived from the VOD Climate Archive (VODCA v2, CXKu band), which provides harmonized microwave retrievals from 1987 to 2021 at 0.25° resolution (Zotta et al., 2024). To better capture biomass-related signals, we filtered daily VOD by the main growing season (day of year 150–300) and composited annual medians. For ecosystem productivity, we used the Global Sunlit and Shaded GPP dataset (1992–2020, 0.05° resolution), which estimates photosynthesis with a two-leaf light use efficiency model. Annual GPP was adopted to evaluate AGBD variations at interannual to decadal scales (Bi et al., 2022). Together, VOD and GPP provide complementary perspectives on canopy structure, water content, and carbon uptake, supporting the validation of long-term AGBD trends.
2.4 Forest AGBD mapping using ResNet
2.4.1 Model development
To improve computational efficiency and remove redundant information, we applied Recursive Feature Elimination (RFE) combined with five-fold cross-validation to identify the optimal set of features for forest AGBD mapping (Cai et al., 2020). The importance of the selected explanatory variables was further evaluated using the Random Forest method. Subsequently, these RFE-selected features were utilized as explanatory variables in developing the forest AGBD estimation model based on the Residual Neural Network (ResNet).
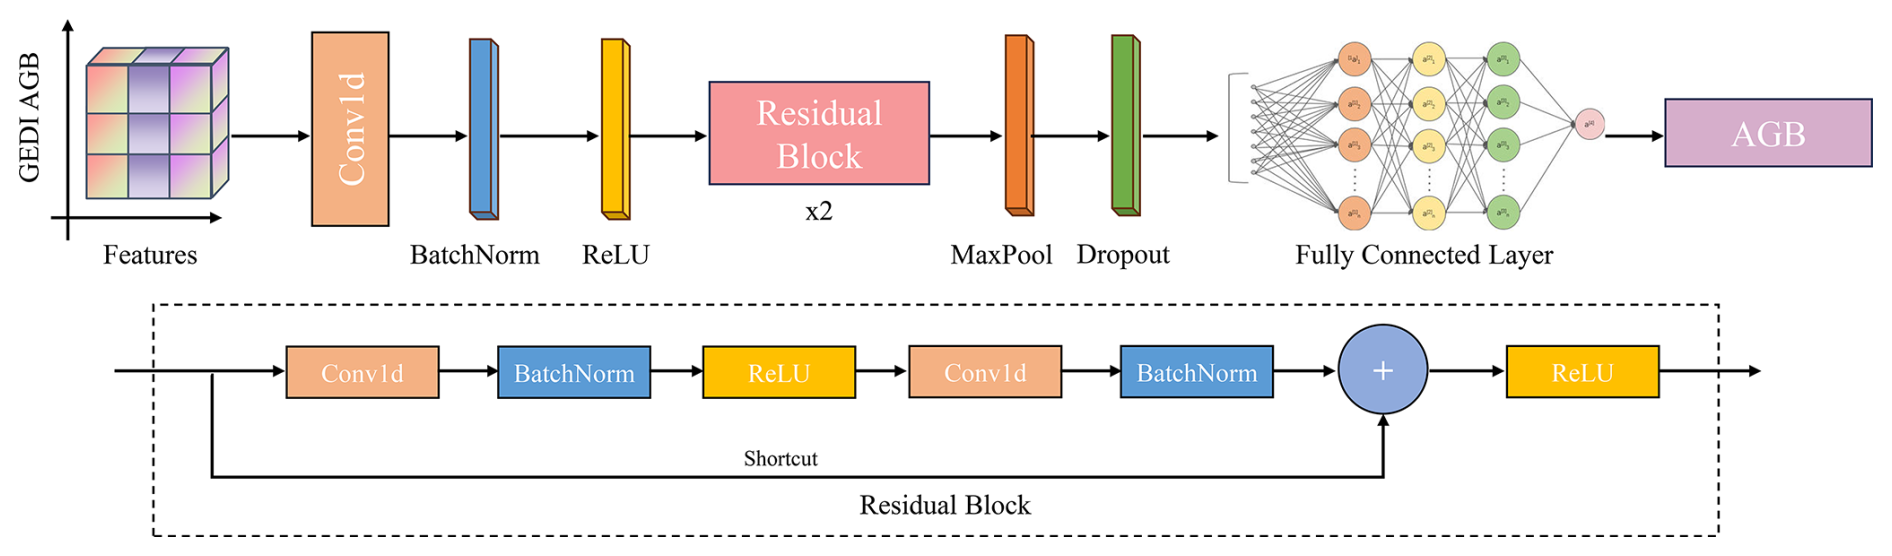
Figure 1 illustrates the architecture of the ResNet employed for AGBD estimation. Building on the original ResNet framework (He et al., 2016), all 2D convolutional layers were replaced with 1D counterparts to accommodate the structure of the per-pixel input feature. Specifically, the input was constructed as a 1D vector comprising spectral bands, indices, and auxiliary variables. The network comprises two residual blocks, each containing a 1D convolutional layer, batch normalization, and a Rectified Linear Unit (ReLU) activation. Each block incorporates a skip connection that adds the block's input directly to its output feature map. This residual connection stabilizes training, alleviates the vanishing gradient problem, and enables the model to learn complex, non-linear relationships between multitemporal spectral–structural features and biomass. By fusing shallow and deep feature representations, the residual mechanism also enhances the model's ability to capture subtle spectral variations in high-biomass regions, thereby helping to mitigate the saturation effects inherent to single-source optical data. Following each residual block, max-pooling layers reduce the dimensionality of intermediate feature maps by half, decreasing memory consumption, accelerating inference, and gradually enlarging the receptive field so that deeper layers encode broader contextual information. To further improve generalization, a dropout layer with a rate of 0.5 is applied before the final fully connected component, which consists of two linear layers separated by a ReLU activation.
We randomly selected 80 % of the multi-temporal GEDI AGBD samples (n= 57 720) as the training set, while the remaining 20 % (n= 14 430) were reserved for multi-year validation to test the robustness of the model over time. The training data were aligned with the observation dates of Landsat satellites to develop a temporally consistent deep learning model, which was then applied to the entire time series of images to generate the forest biomass time series dataset. During model training, we adopted the Adam optimizer, an adaptive version of stochastic gradient descent. In each iteration of the optimizer, the loss was calculated based on random batches of 64 data samples (batch size = 64). Based on this loss, the partial derivatives (gradients) of all model parameters were determined by backpropagation, using the chain rule to compute numerical gradients. The model parameters were updated in small steps along the negative gradient direction to minimize the loss, with the step size controlled by a hyperparameter known as the learning rate, initialized to 0.001. The model was trained for 1,000 epochs, where an epoch refers to the entire training data set going through a complete process of forward propagation and back propagation.
2.4.2 Uncertainty estimation
In this study, we employed quantile regression to quantify the uncertainty of AGBD estimates (Chung and Neiswanger, 2021; Shendryk, 2022). Assuming a Gaussian error distribution, the 95 % prediction interval was approximately within ±2 standard deviations (SD), and the 68 % prediction interval was approximately within ±1 SD of the AGBD estimates. Therefore, we estimated the AGBD values at the 2.5th percentile and 97.5th percentile for each pixel using the ResNet model with quantile loss function (Eq. 1). The difference between the quantile loss estimates at these percentiles provided the 95 % prediction interval, allowing us to quantify the uncertainty (±1 SD) of AGBD estimates for each pixel. The uncertainty derived from the quantile regression can capture the variability in predictions associated with the model, reflecting modelling uncertainty derived from the spread of prediction intervals.
where Lq represents the quantile loss function, q is the number of quantiles of interest, y and signify the observation and prediction, respectively. In this study, q was set to 2.5 % and 97.5 % to obtain AGBD estimates at the 2.5th and 97.5th percentiles, respectively.
2.5 Accuracy assessment
To assess temporal robustness, we implemented a Leave-One-Year-Out (LOYO) validation using the multi-year GEDI AGBD record (2019–2021) (Laffitte et al., 2025). In each LOYO iteration (i.e., leaving one year out for validation), the model was trained on the remaining two years, and the process was repeated three times to evaluate temporal generalization. In addition, a 5-fold cross-validation was performed within the full dataset to further assess model stability and ensure consistent predictive performance. Reported accuracy metrics represent the mean performance across LOYO and 5-fold evaluations. For assessing the accuracy of the AGBD estimation model, we utilized validation metrics such as the coefficient of determination (R2, Eq. 2), root mean square error (RMSE, Eq. 3), and bias (Eq. 4). These metrics quantified the agreement between predicted AGBD values and reference values, providing insights into prediction accuracy and systematic errors.
where n is the number of reference samples, represents the estimated AGBD, and yi denotes the reference AGBD.
2.6 Comparison of existing AGB products
To further validate the effectiveness of our models, we compared the results against several external AGB datasets, focusing on both spatial and temporal dynamics (see Sect. S2 for details). For spatial comparison, we used static AGB datasets from global (e.g., Zarin map (Zarin et al., 2016), Santoro map (Santoro et al., 2021)) and regional (e.g., Hu map (Hu et al., (2016)), Yang map (Yang et al., 2023)) sources to assess the spatial distribution and accuracy of AGBD estimates at different resolutions (from 30 to 1000 m). For dynamic comparison, we utilized annual and multi-year datasets (e.g., Hengeveld map (Hengeveld et al., 2015), Liu map (Liu et al., 2015), Chen map (Chen et al., 2023), ESA CCI) spanning different periods from 1950 to 2021. This allowed us to evaluate how well the models captured forest biomass changes over time across various temporal scales and spatial extents. By comparing static and dynamic AGBD estimates, we provide a comprehensive view of the performance and robustness of the developed models under different conditions.
2.7 Forest AGC stock and change analysis
The AGB (unit: Mg) for each pixel was calculated by multiplying the estimated AGBD by the forest area derived from the CATCD for the corresponding year (represented as the product of forest cover fraction and pixel area). Carbon content was then derived from the biomass using a conversion factor of 0.5, allowing for the calculation of forest AGC for each pixel. The net annual change in forest carbon was calculated by aggregating the pixel-level changes.
2.8 Quantifying the impact of forest changes on AGC stock
To consistently quantify how forest dynamics influence AGC stocks, we established clear operational definitions of forest change modes based on tree cover transitions. Annual forest cover data from the CATCD were used to determine forest status, with pixels having tree cover ≥ 20 % classified as forest. In this study, four distinct forest change modes were defined as follows:
-
Forest growth. pixels that were forested in both 1985 and 2023 and exhibited an increase in tree cover.
-
Tree cover loss. pixels that were forested in both 1985 and 2023 but showed a decrease in tree cover.
-
Forest expansion. pixels that transitioned from non-forest in 1985 to forest in 2023.
-
Forest loss. pixels that changed from forest in 1985 to non-forest in 2023.
For each pixel i, the change in aboveground carbon was calculated as:
Positive ΔAGC values indicate carbon gain, while negative values denote carbon loss. To facilitate interpretation, the four modes were further grouped into two broader categories: (1) Tree cover change (TCC)-induced changes, including forest growth and tree cover loss, which occur without a change in land-cover class; and (2) Land-use and land-cover change (LULCC)-induced changes, including forest expansion and forest loss, which involve transitions between forest and non-forest classes. Finally, we aggregated pixel-level ΔAGC to quantify the relative contributions of each change mode and category to the national AGC balance between 1985 and 2023.
3.1 Feature selection and importance
The RFE results indicated that the model's cross-validation score increased with the number of features, stabilizing around 10 features, with the highest performance at 17 features (Fig. 2a). Therefore, we selected 17 explanatory variables to train the ResNet, including five spectral bands, three vegetation indices, three topographic factors, three climate variables, geographic location, tree cover, and land cover. Feature importance analysis showed that among the 17 explanatory variables, tree cover contributed the most to the model, followed by slope and longitude. The near-infrared band and EVI also demonstrated high importance, while other spectral features generally ranked lower than climate and topographic variables (Fig. 2b).
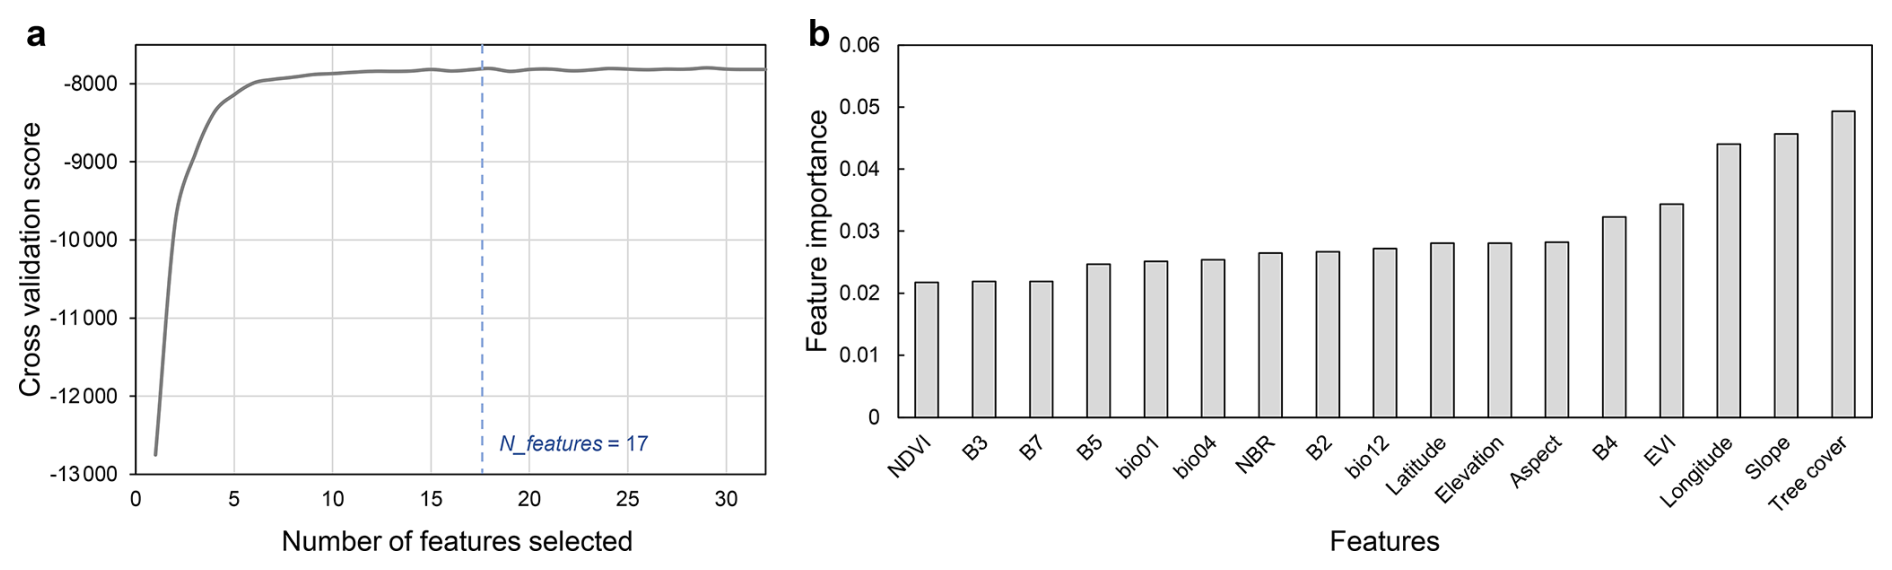
Figure 2Feature selection and importance analysis. (a) Cross-validation scores of the model with different numbers of features, measured by negative mean squared error. (b) Feature importance distribution based on Random Forest.
3.2 Accuracy assessment
3.2.1 Model performance
The ResNet model exhibited strong predictive performance for AGBD. In 5-fold cross-validation, the model achieved R2= 0.91, RMSE = 16.49 Mg ha−1, and a minimal bias of 0.50 Mg ha−1, demonstrating its overall accuracy. Temporal validation using the LOYO approach yielded slightly lower but still robust performance (R2= 0.85, RMSE = 21.20 Mg ha−1, Bias = 0.66 Mg ha−1; Fig. 3), highlighting the model's ability to generalize across years. The marginally lower performance observed in the LOYO validation, likely reflects the temporal distribution imbalance of training samples, particularly the limited representation of high-biomass conditions in specific years. Nevertheless, the model still delivered satisfactory predictions across all years. Moreover, the ResNet model outperformed other machine learning ensemble models (e.g., Random Forest, XGBoost, and LightGBM), particularly in mitigating the effects of spectral saturation in high-biomass forests (see Sect. S3 for details).
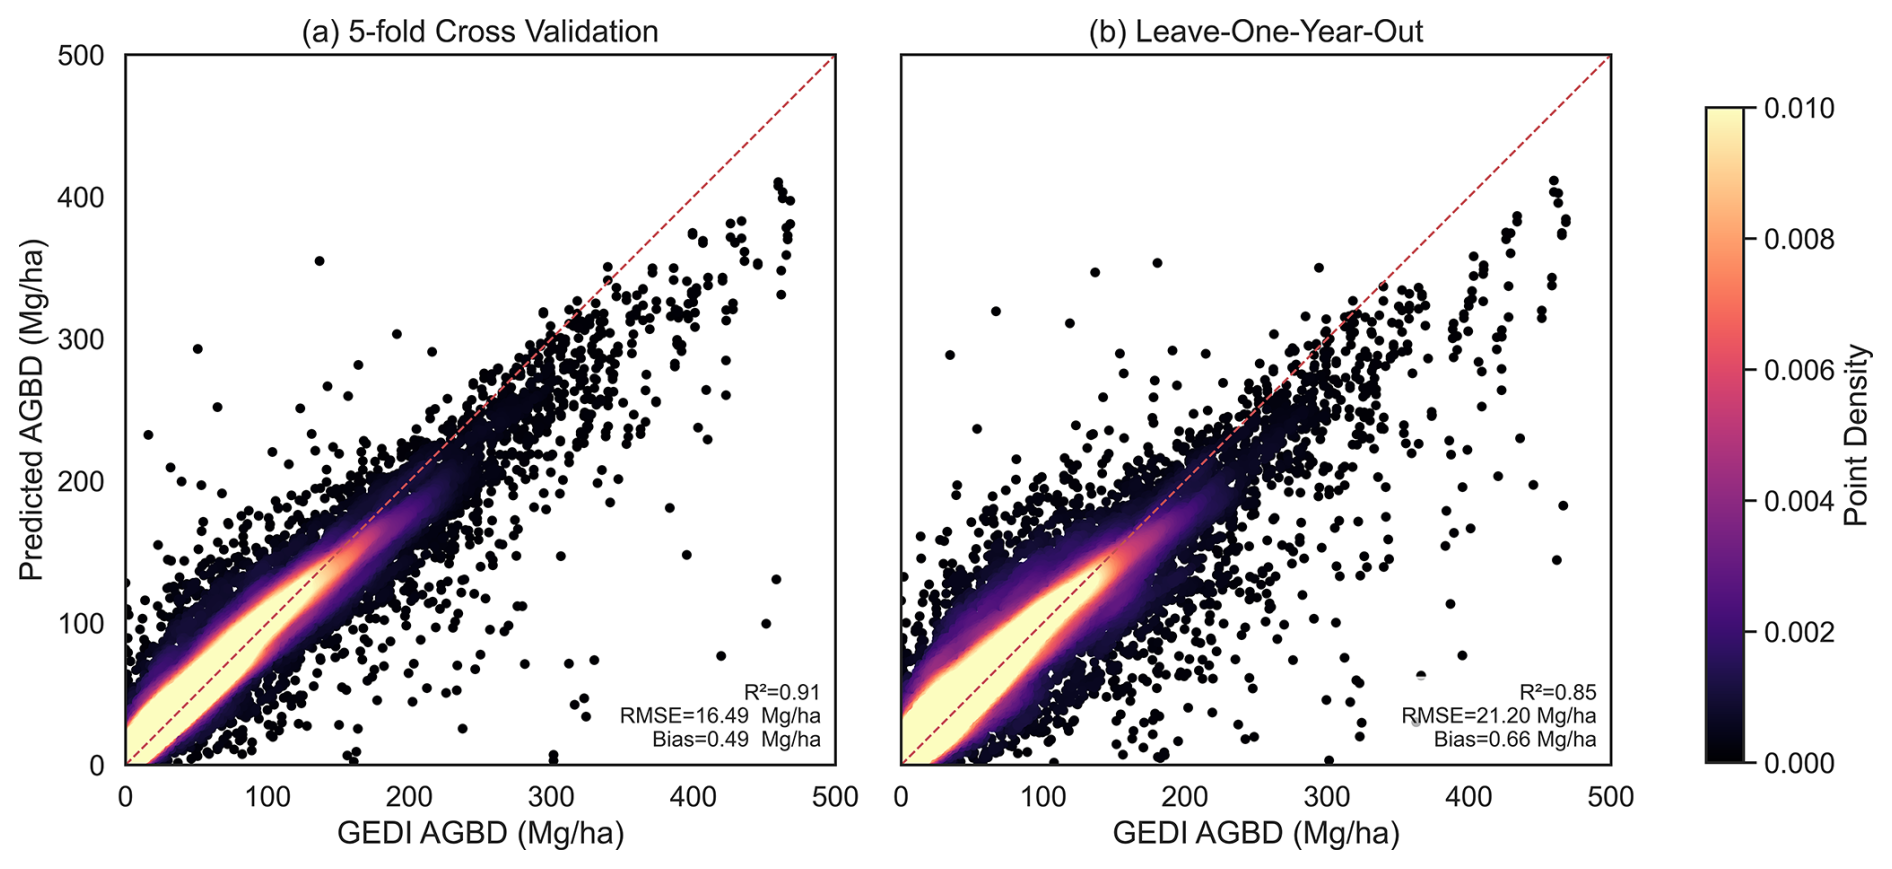
Figure 3Model evaluation of AGBD predictions. (a) Overall performance based on 5-fold cross-validation. (b) Temporal generalization assessed using Leave-One-Year-Out (LOYO) validation for 2019–2021.
3.2.2 Independent accuracy evaluation using field survey data
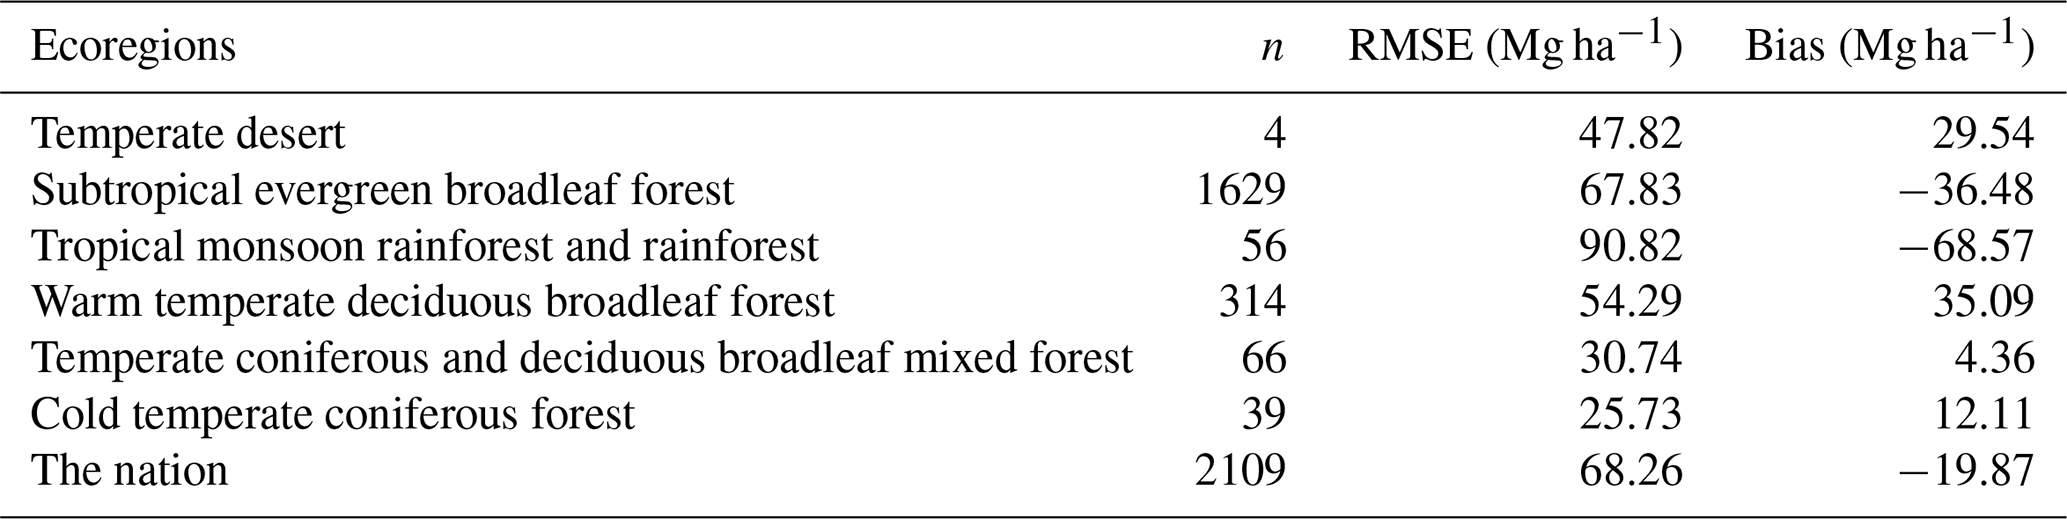
The validation using historical field survey data confirms that the AGBD estimates exhibit reasonable accuracy across different time periods. For the period 1985–2008, the model achieved an R2 of 0.63, an RMSE of 68.26 Mg ha−1, and a bias of −19.87 Mg ha−1 (Table 1, Fig. 4). Among ecoregions, the cold temperate coniferous forest showed the highest accuracy, with the lowest RMSE (25.73 Mg ha−1). Similarly, the temperate coniferous and deciduous broadleaf mixed forest achieved low RMSE (30.74 Mg ha−1) and minimal bias (4.36 Mg ha−1). In contrast, the tropical monsoon rainforest and rainforest regions presented greater challenges, with higher RMSE (90.82 Mg ha−1) and a significant negative bias (−68.57 Mg ha−1). Other ecoregions, such as the temperate desert and subtropical evergreen broadleaf forest, displayed intermediate accuracy levels, with RMSEs of 47.82 and 67.83 Mg ha−1 and biases of 29.54 and −36.48 Mg ha−1, respectively.
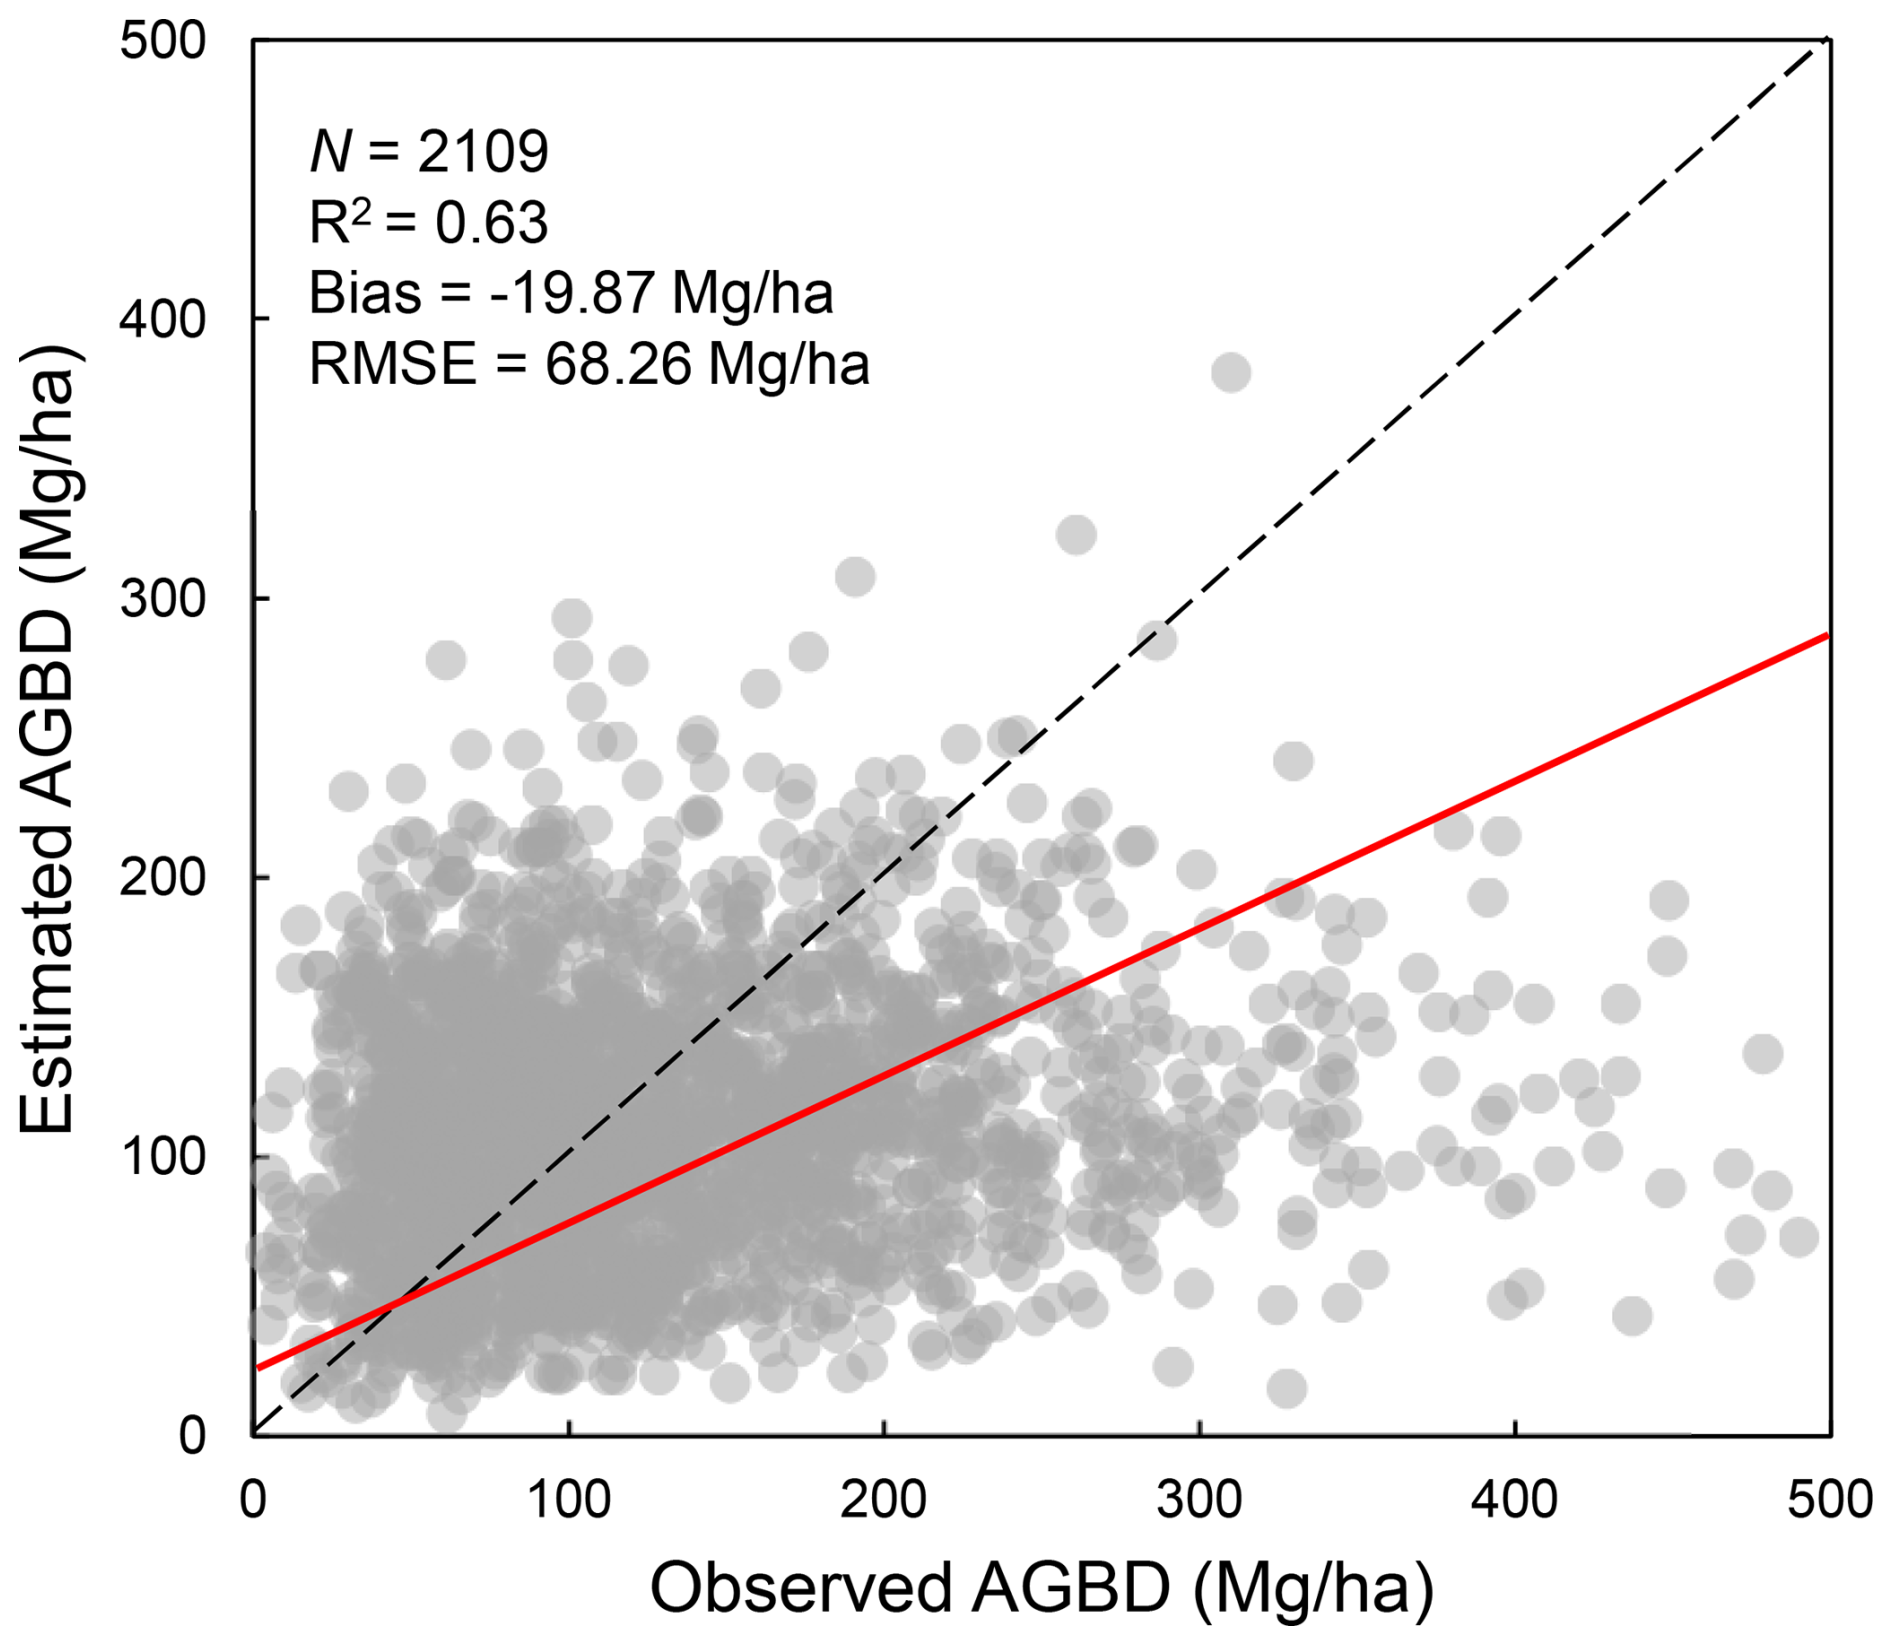
Figure 4Scatter plot comparing field survey data with ResNet-estimated AGBD. The black dashed line represents the 1:1 line, while the red solid line represents the fitted regression line.
Table 1Independent accuracy evaluation using field survey data across different ecoregions.
The correlation analysis between provincial-level AGC estimates and NFI forest AGC statistics reveals strong correlations, with coefficients consistently exceeding 0.85 (p<0.05) across different assessment periods, ranging from 0.85 to 0.89 (Fig. 5). These results suggest that the AGC estimates effectively capture the temporal changes in national AGC, as reflected in the NFI's multi-period data. The consistent correlations observed across the various assessment periods demonstrate that the AGC estimates are reliable indicators of forest carbon stock dynamics over time.
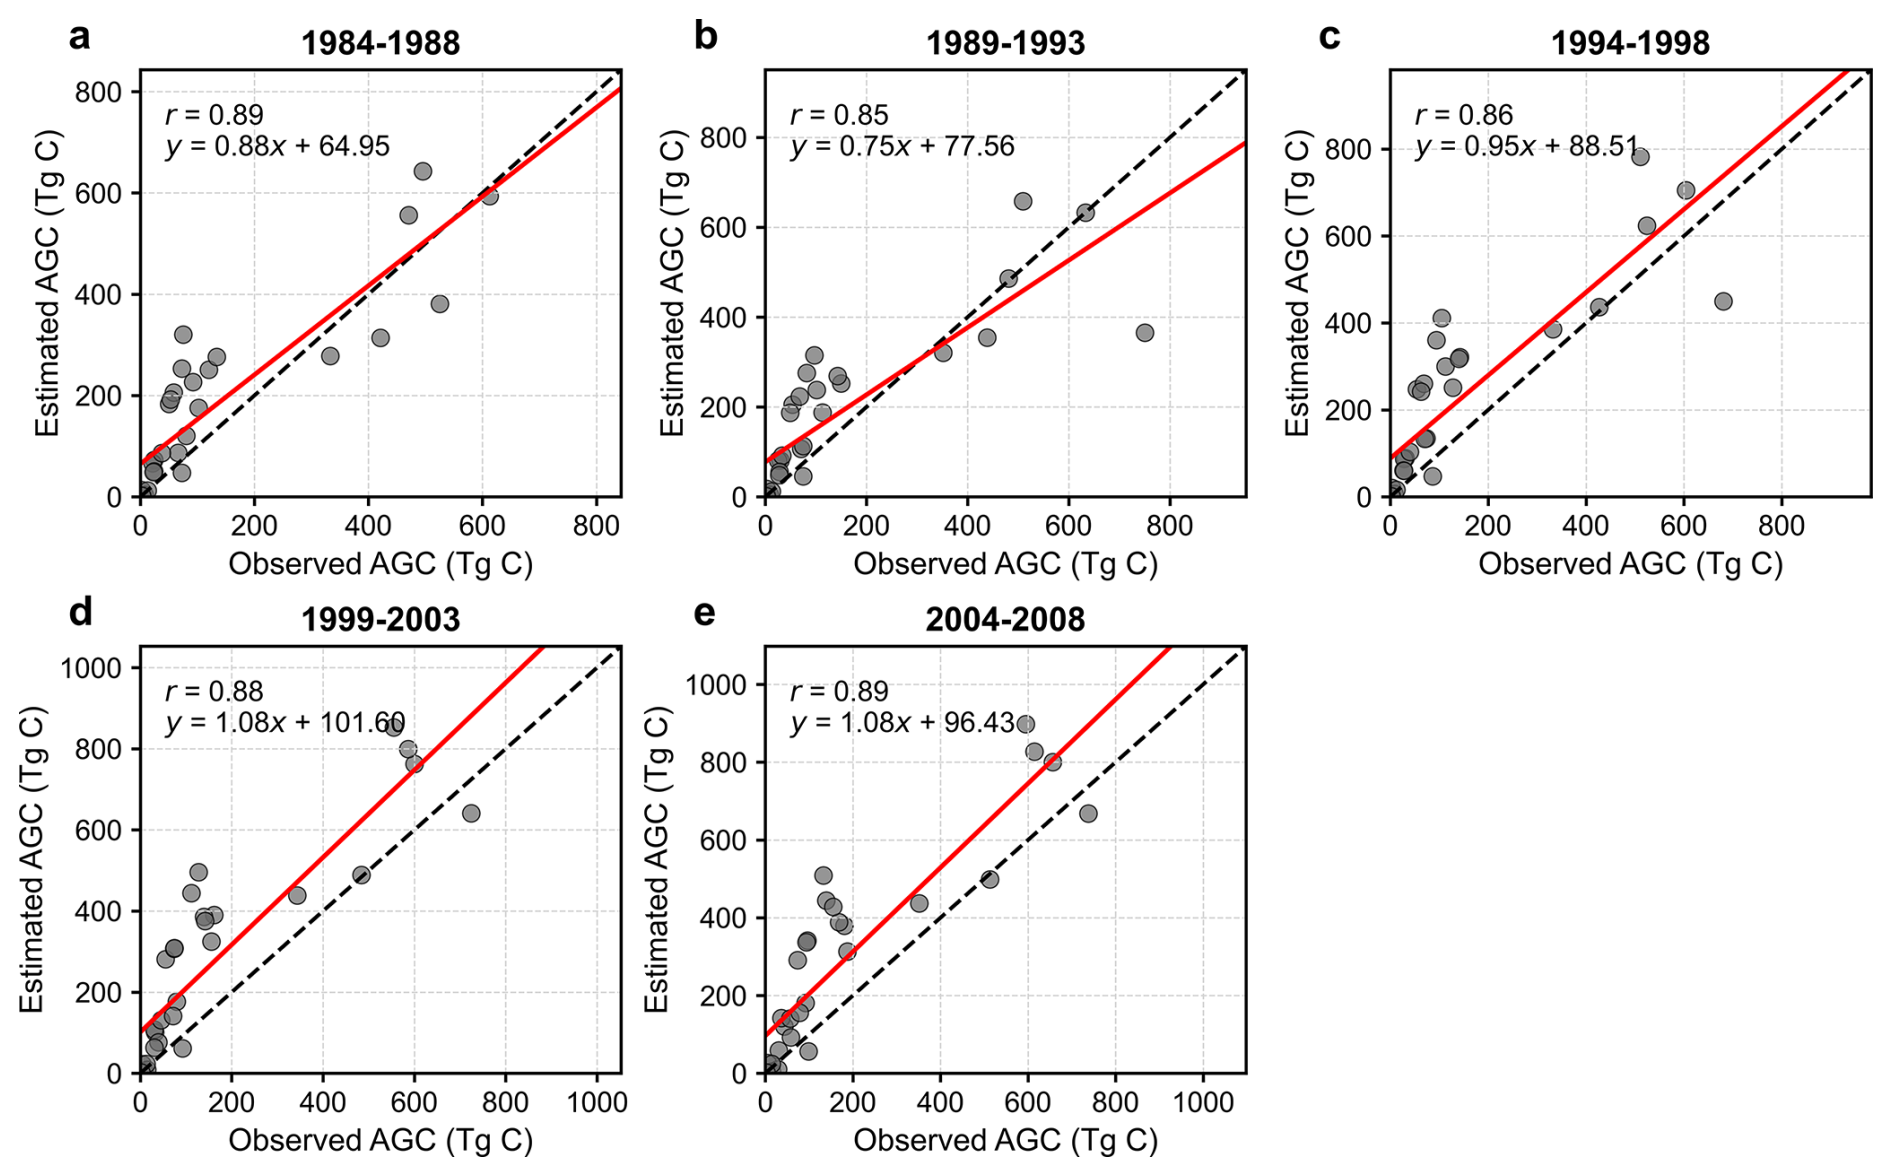
Figure 5Scatterplots comparing provincial-level aboveground biomass carbon (AGC) from National Forest Inventory (NFI) data and ResNet-based estimates of AGBD for 1984–2008. Panels (a)–(e) correspond to five-year intervals: 1984, 1989, 1994, 1999, and 2004. Each point represents a province, and the 1:1 line (dash line) indicates perfect agreement.
3.2.3 Residual analysis
The comparison between our AGBD estimates and historical ground surveys (Fig. 4) indicates a systematic underestimation in some regions, as reflected by regression slopes lower than one and a negative mean bias. Additional diagnostics (Table S3) show that this bias increases with observed biomass density, implying greater underestimation in high-biomass plots. This pattern is consistent with the well-known spectral saturation effect, whereby optical indices lose sensitivity in dense canopies, as well as with potential scale and methodological mismatches between satellite-based estimates and historical field plots.
The residual analysis stratified by geographic location, tree cover, and terrain further underscores these tendencies (Fig. 6). Residuals are wider in low latitude (< 25° N) and high latitude (> 40° N) regions compared to mid-latitudes. As slope and tree cover increase, residual spread also broadens, indicating that predictions tend to be less accurate in steep or densely forested areas. By contrast, no significant biases were observed across longitudes, aspects, or elevations, suggesting that errors are more strongly associated with biomass density and slope rather than with all terrain factors. These findings highlight slope- and biomass-related challenges that should be addressed in future AGBD mapping efforts.
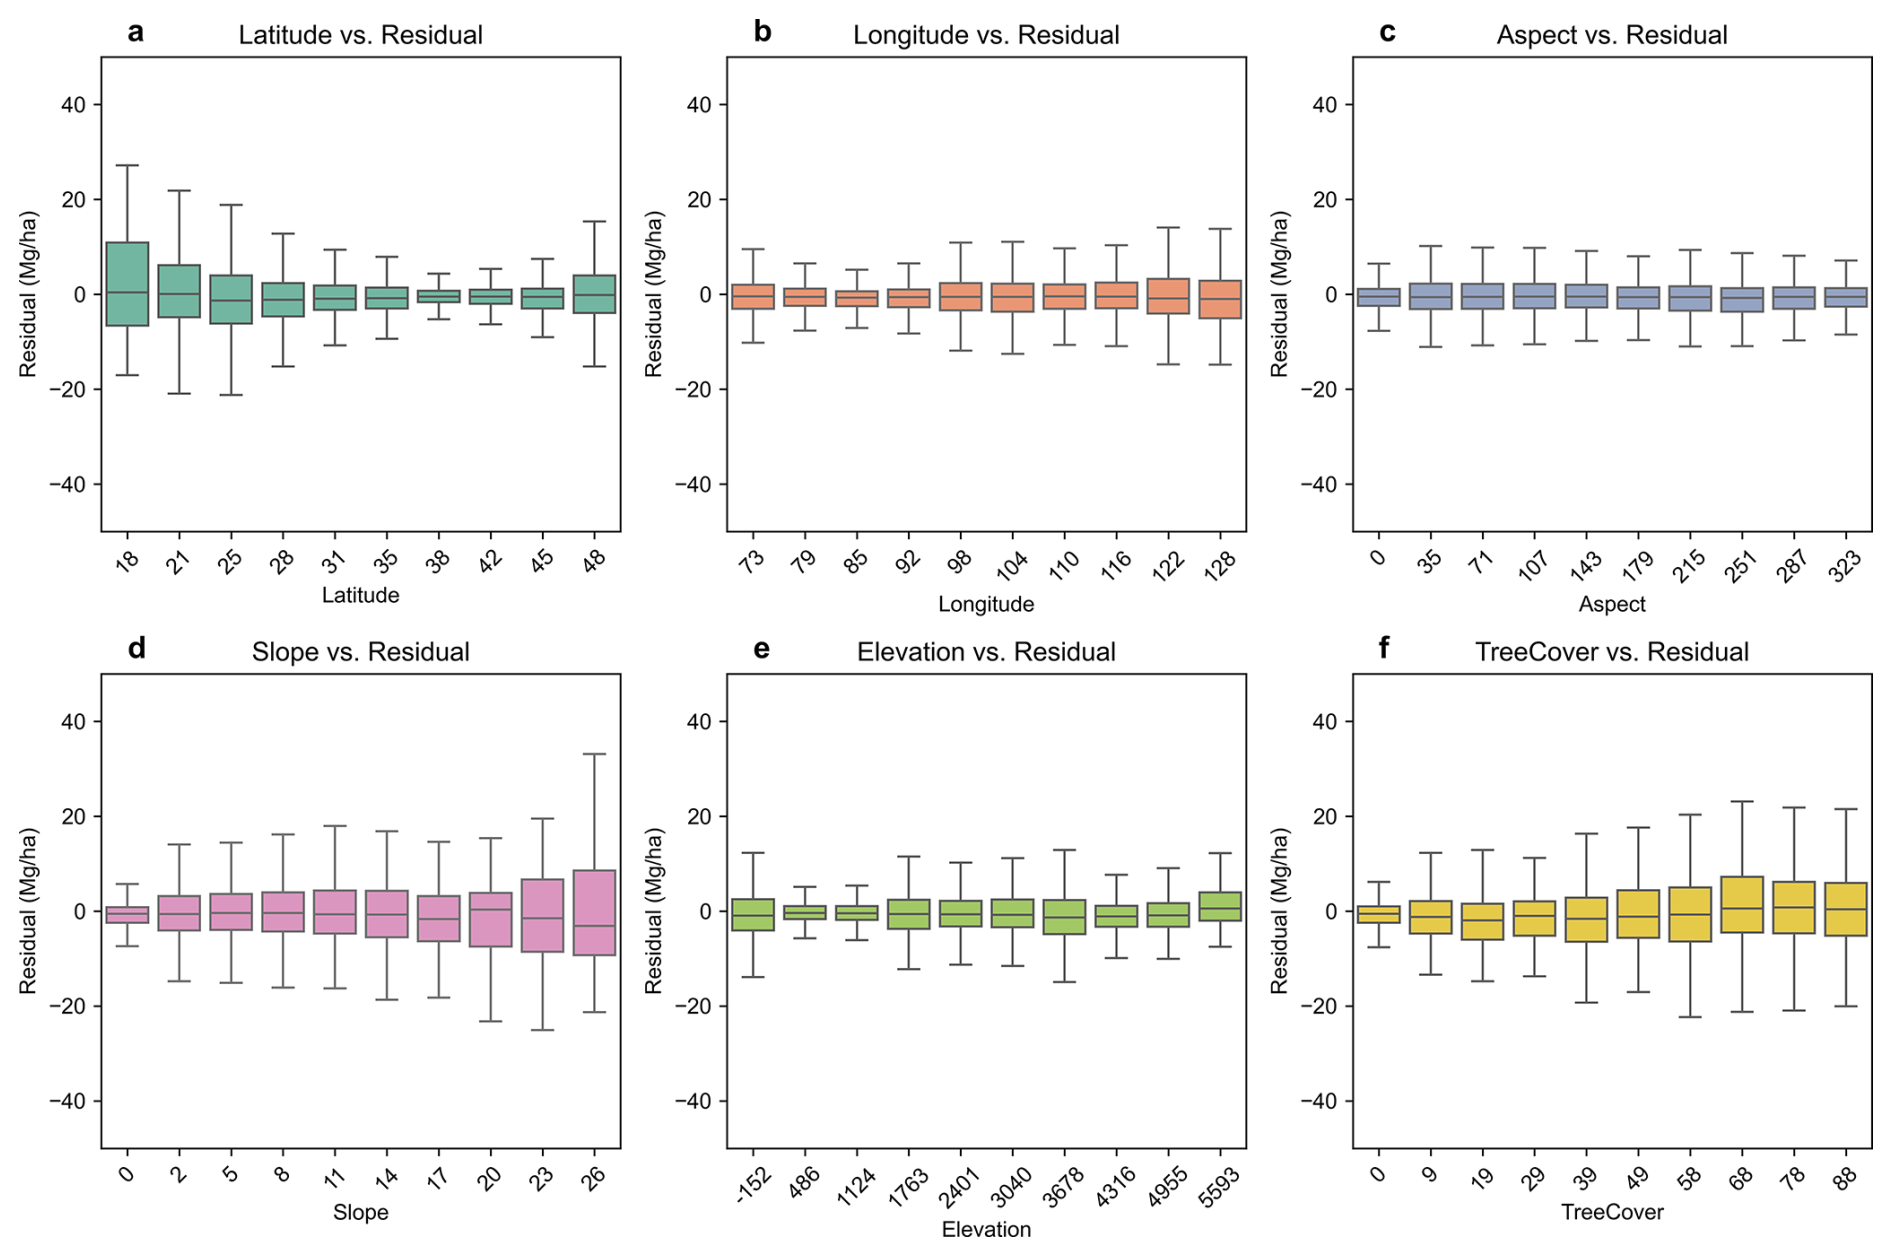
Figure 6Residual analysis for forest AGBD estimation. Panels (a)–(f) depict AGBD prediction residuals under varying latitudes (° N), longitudes (° E), aspects (°), slopes (°), elevations (m), and tree cover (%), respectively. Positive residuals indicate predicted values higher than reference values, while negative residuals signify underestimation of AGBD compared to GEDI references. The box plot displays the median, quartiles, as well as the 10th and 90th percentiles of the residuals. The analysis was performed based on the 20 % of 2019–2021 GEDI AGBD footprints and their corresponding estimates.
3.3 Evaluation of AGBD temporal dynamics
3.3.1 Cross-comparison with VOD and GPP
The cross-comparison between AGBD trends and independent satellite-based datasets (GPP and VOD) further supports the temporal reliability of our product. Pixel-level correlation analysis (Fig. 7a, b) shows that positive correlations dominate for both GPP and VOD, while negative correlations are relatively limited. For VOD, 37.7 % of pixels exhibit highly significant positive correlations (p<0.01) and 6.1 % are significant (), with highly significant negative correlations accounting for only 5.6 %. Similarly, for GPP, 34.3 % of pixels show highly significant positive correlations and 8.3 % are significant, while negative correlations remain rare (3.2 % highly significant, 2.6 % significant). Non-significant correlations comprise roughly 25 %–31 % of pixels.
Temporal trajectories of national mean AGBD closely follow those of GPP (1992–2020) and VOD (1987–2021) (Fig. 7e–f). Scatterplots of annual national means (Fig. 7g–h) demonstrate strong positive linear relationships, with R2= 0.65 for both GPP and VOD, indicating substantial consistency in interannual patterns. Collectively, the predominance of significant positive correlations and the alignment of temporal trajectories corroborate that the estimated AGBD trends are ecologically plausible and effectively capture large-scale interannual to decadal variations in vegetation biomass.
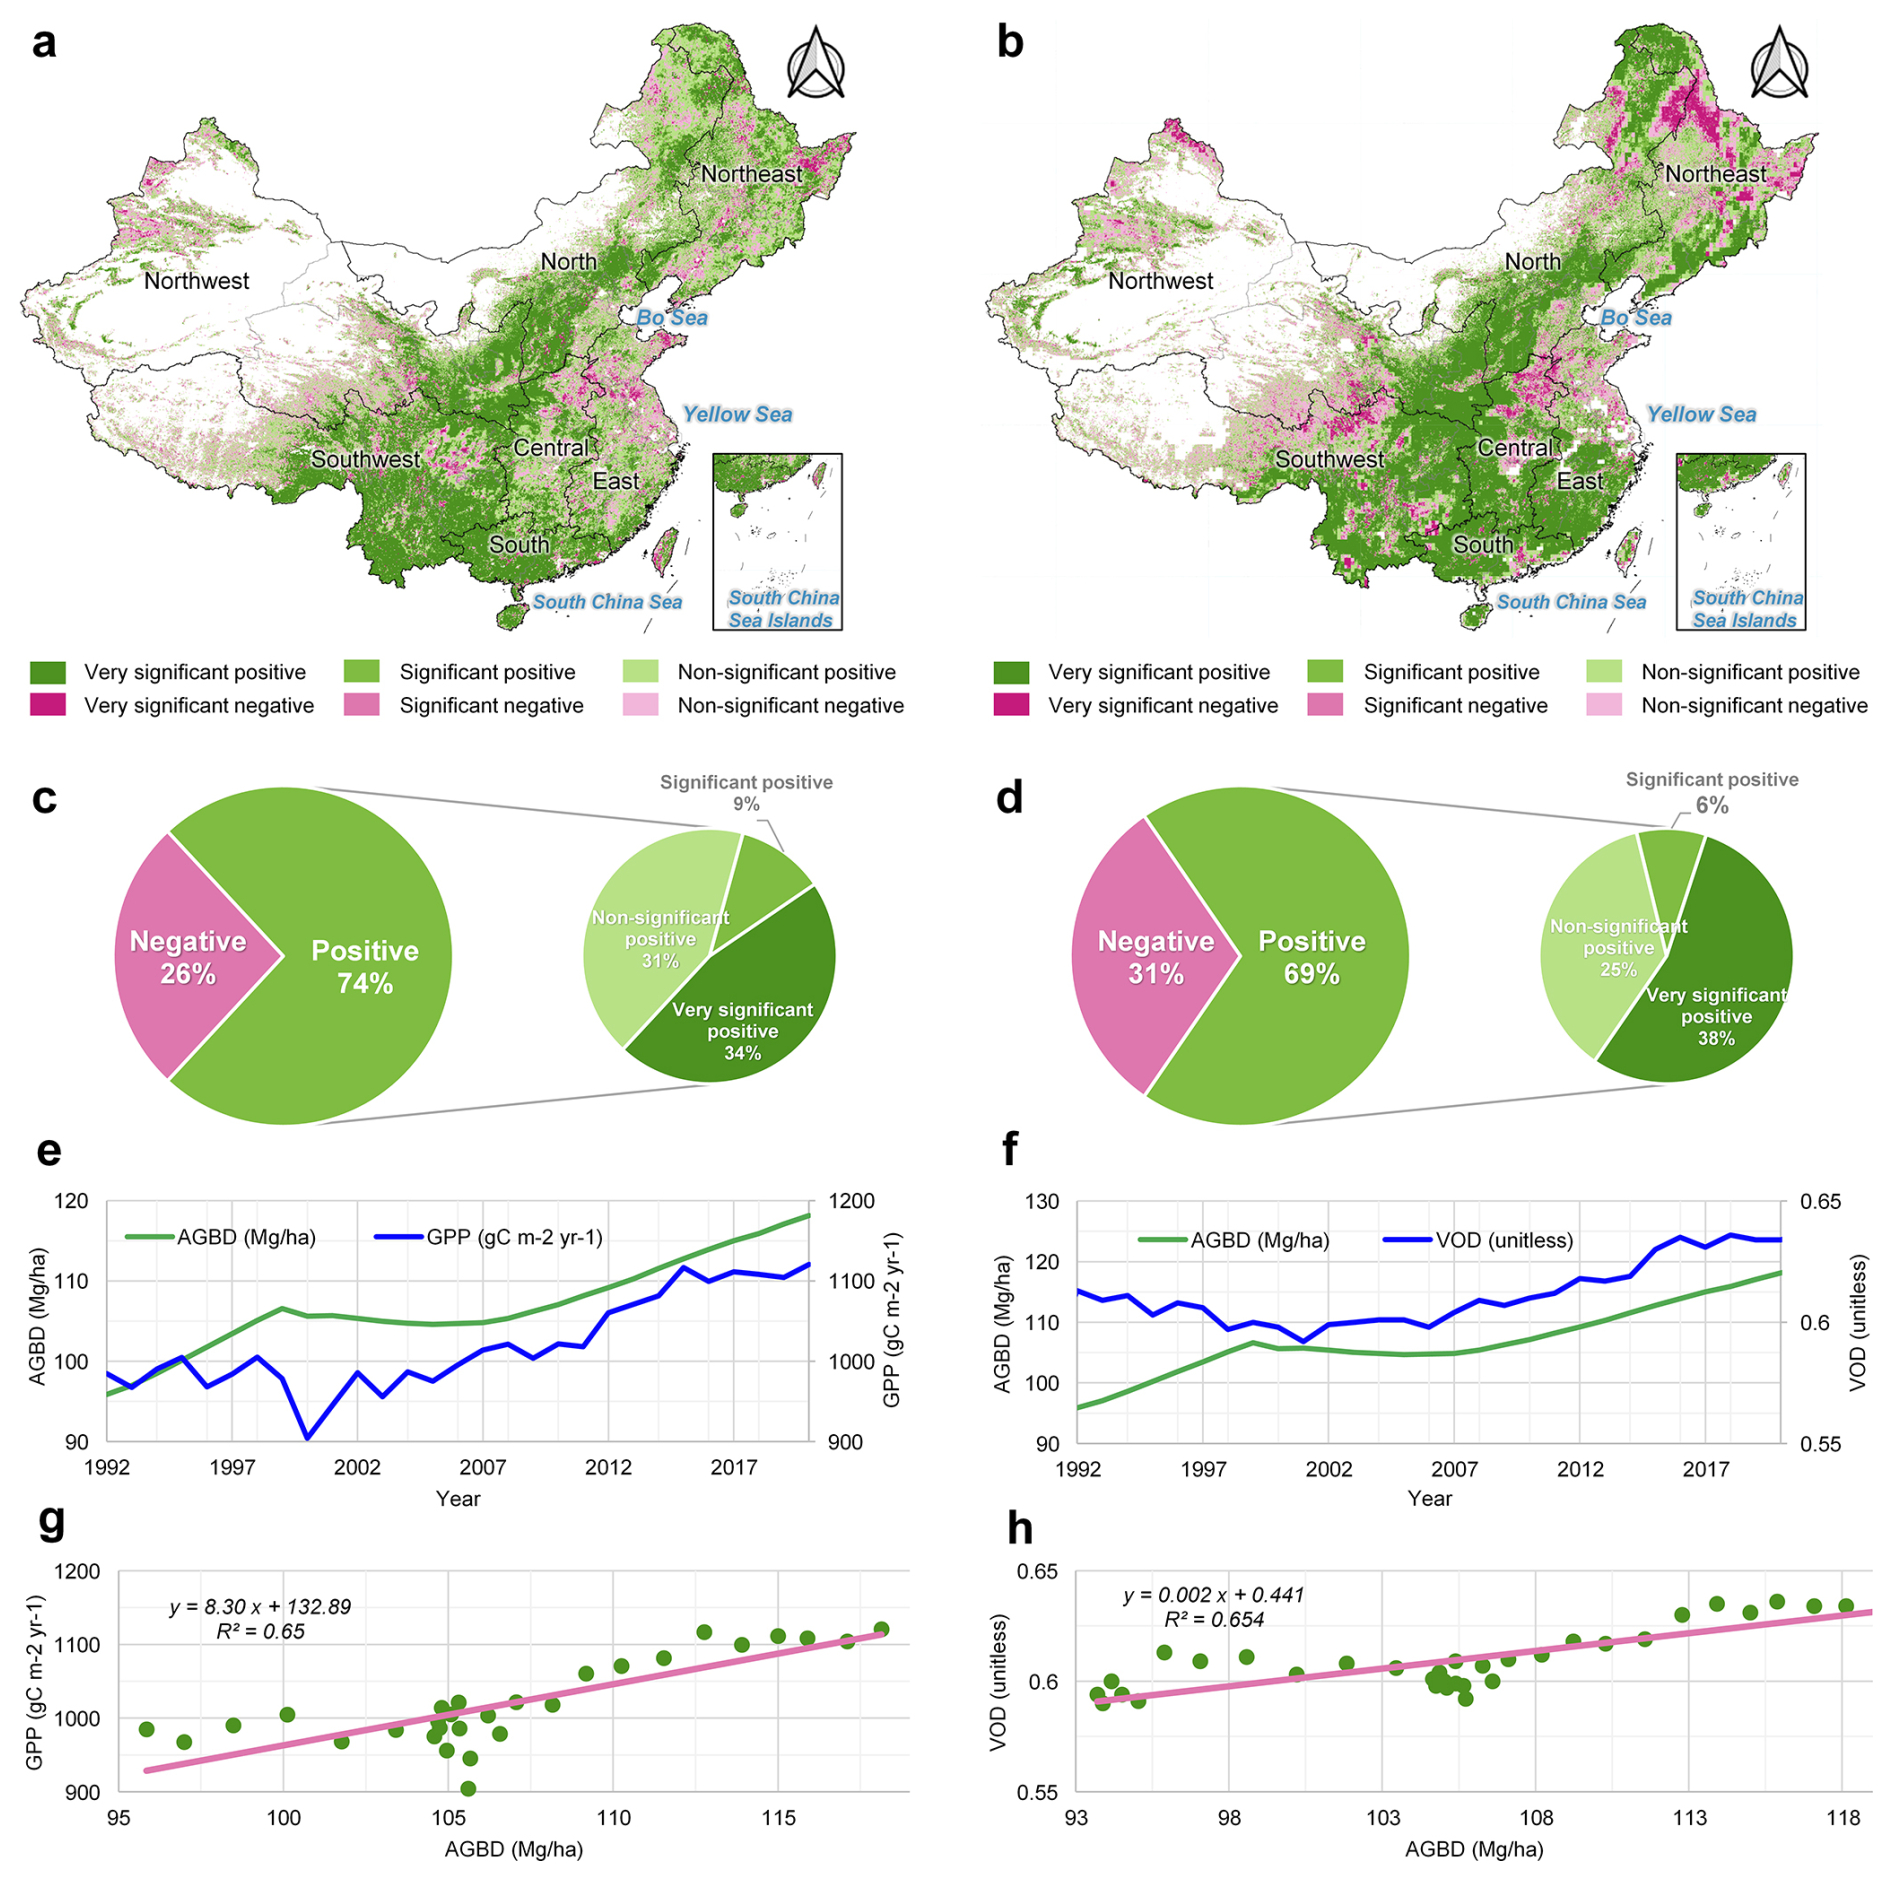
Figure 7Cross-comparison of temporal dynamics between estimated AGBD and satellite-based datasets (GPP and VOD). (a, b) Pixel-level correlation maps between AGBD and GPP/VOD trends. (c–d) Fractions of highly significant (p<0.01), significant (), and non-significant (p≥ 0.05) pixels. (e, f) Temporal trajectories of national mean AGBD and GPP/VOD. (g–h) Relationships between national mean AGBD and GPP (1992–2020) or VOD (1987–2021).
3.3.2 Temporal validation via before–after–control–impact (BACI) analysis
The BACI analysis provides additional evidence that the estimated AGBD trends are consistent with known forest dynamics and management interventions. Typical examples of forest growth and natural forest degradation detected by CFATD highlight its effectiveness in capturing temporal changes in forest biomass (Figs. 8–9). In the Three-North shelterbelt regions (Fig. 8), BACI confirms the establishment of plantations, showing a sigmoidal growth curve typical of young forests: AGBD increased at 5.60 Mg ha−1 yr−1 during the first phase (1994–1999), accelerated to 8.45 Mg ha−1 yr−1 in the second phase (2000–2007), and stabilized at −0.03 Mg ha−1 yr−1 in the final phase (2008–2023). In contrast, natural dark coniferous forests in the alpine valleys of Sichuan and Yunnan (Fig. 9) experienced continuous degradation. Despite stable or slightly expanded forest area, AGBD declined from 292 Mg ha−1 in 1985 to 136 Mg ha−1 in 2023, with a degradation rate of −3.15 Mg ha−1 yr−1. BACI results reveal that this decline is temporally consistent with disturbances and policy interventions, with no recovery observed in the impacted areas, while nearby control regions remain relatively stable.
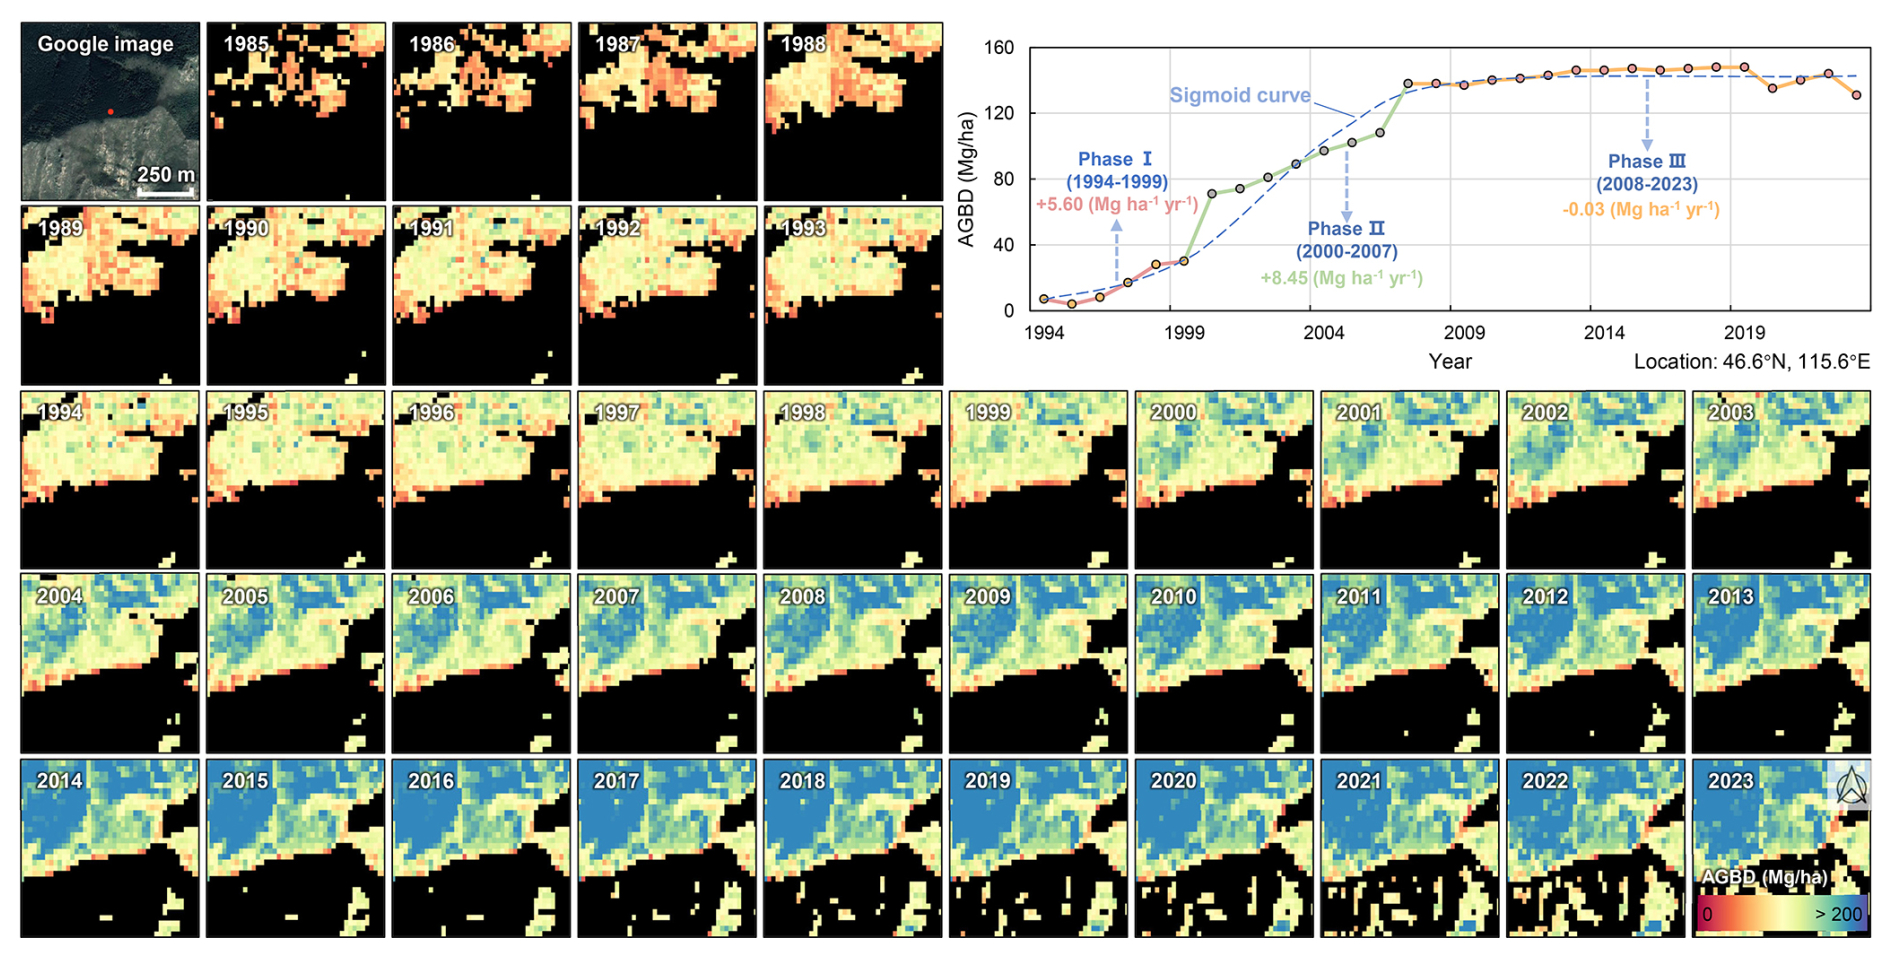
Figure 8Temporal increase in AGBD of newly established forests under the Three-North Shelterbelt Program from 1985 to 2023, as captured by CFATD. (Satellite imagery: © Google Earth).
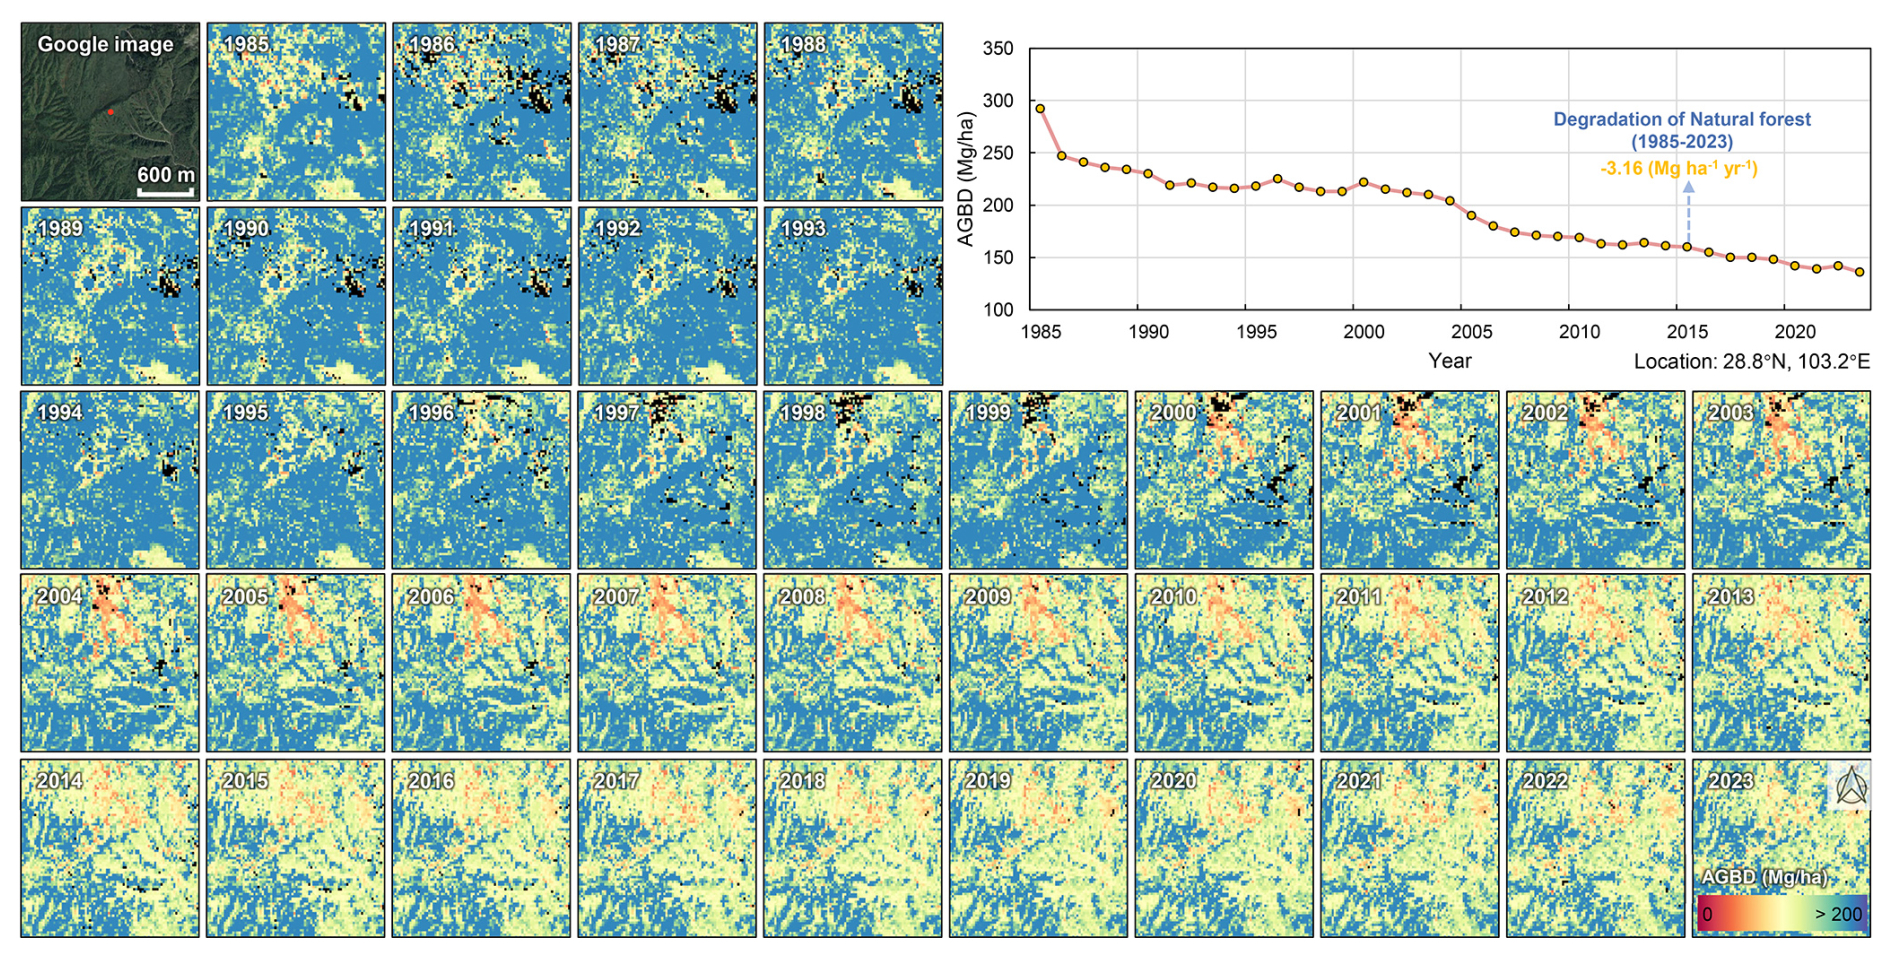
Figure 9Temporal decline in AGBD of degraded natural forests in southwest China from 1985 to 2023, as captured by CFATD. (Satellite imagery: © Google Earth).
When combined with the cross-comparison with satellite-based proxies (GPP and VOD, Fig. 7), these BACI-based case studies reinforce the reliability of AGBD temporal trends. Significant positive correlations with GPP and VOD, consistent national mean trajectories, and strong linear relationships (R2 = 0.65) across years collectively demonstrate that the estimated AGBD trends capture ecologically plausible interannual to decadal variations, responding appropriately to both natural disturbances and anthropogenic interventions.
3.4 Spatial pattern of forest AGB
The 30 m resolution mapping of China's forest AGBD reveals substantial spatial variability in biomass density (Fig. 10). In 2023, the national average forest AGBD was 122.69 Mg ha−1, with a total forest AGB stock amounting to 13.97 PgC. Among the seven geographic regions, the Southwest (142 Mg ha−1), Northeast (123 Mg ha−1), and Northwest (123 Mg ha−1) regions exhibited biomass densities above the national average. High-density areas with forest AGBD exceeding 300 Mg ha−1 were predominantly located in these regions, including southern Tibet, the Qinling Mountains, and parts of Northeast China. Additionally, central Taiwan exhibited several hotspots with forest AGBD greater than 300 Mg ha−1. These regions are notably rich in forest resources and represent significant areas of natural forest distribution in China. Conversely, the northern, central, eastern, and southern regions have historically been subjected to frequent human disturbances and high-intensity impacts, leading to younger forest stands and relatively lower biomass densities (Fig. 10e). Nonetheless, these regions present a substantial potential for carbon sequestration. The provinces of Yunnan, Sichuan, Heilongjiang, Guangxi, and Tibet are the top five in terms of forest biomass carbon stocks, collectively accounting for 41.5 % of the national total (Fig. 10f). This highlights the uneven spatial distribution of forest resources across China.
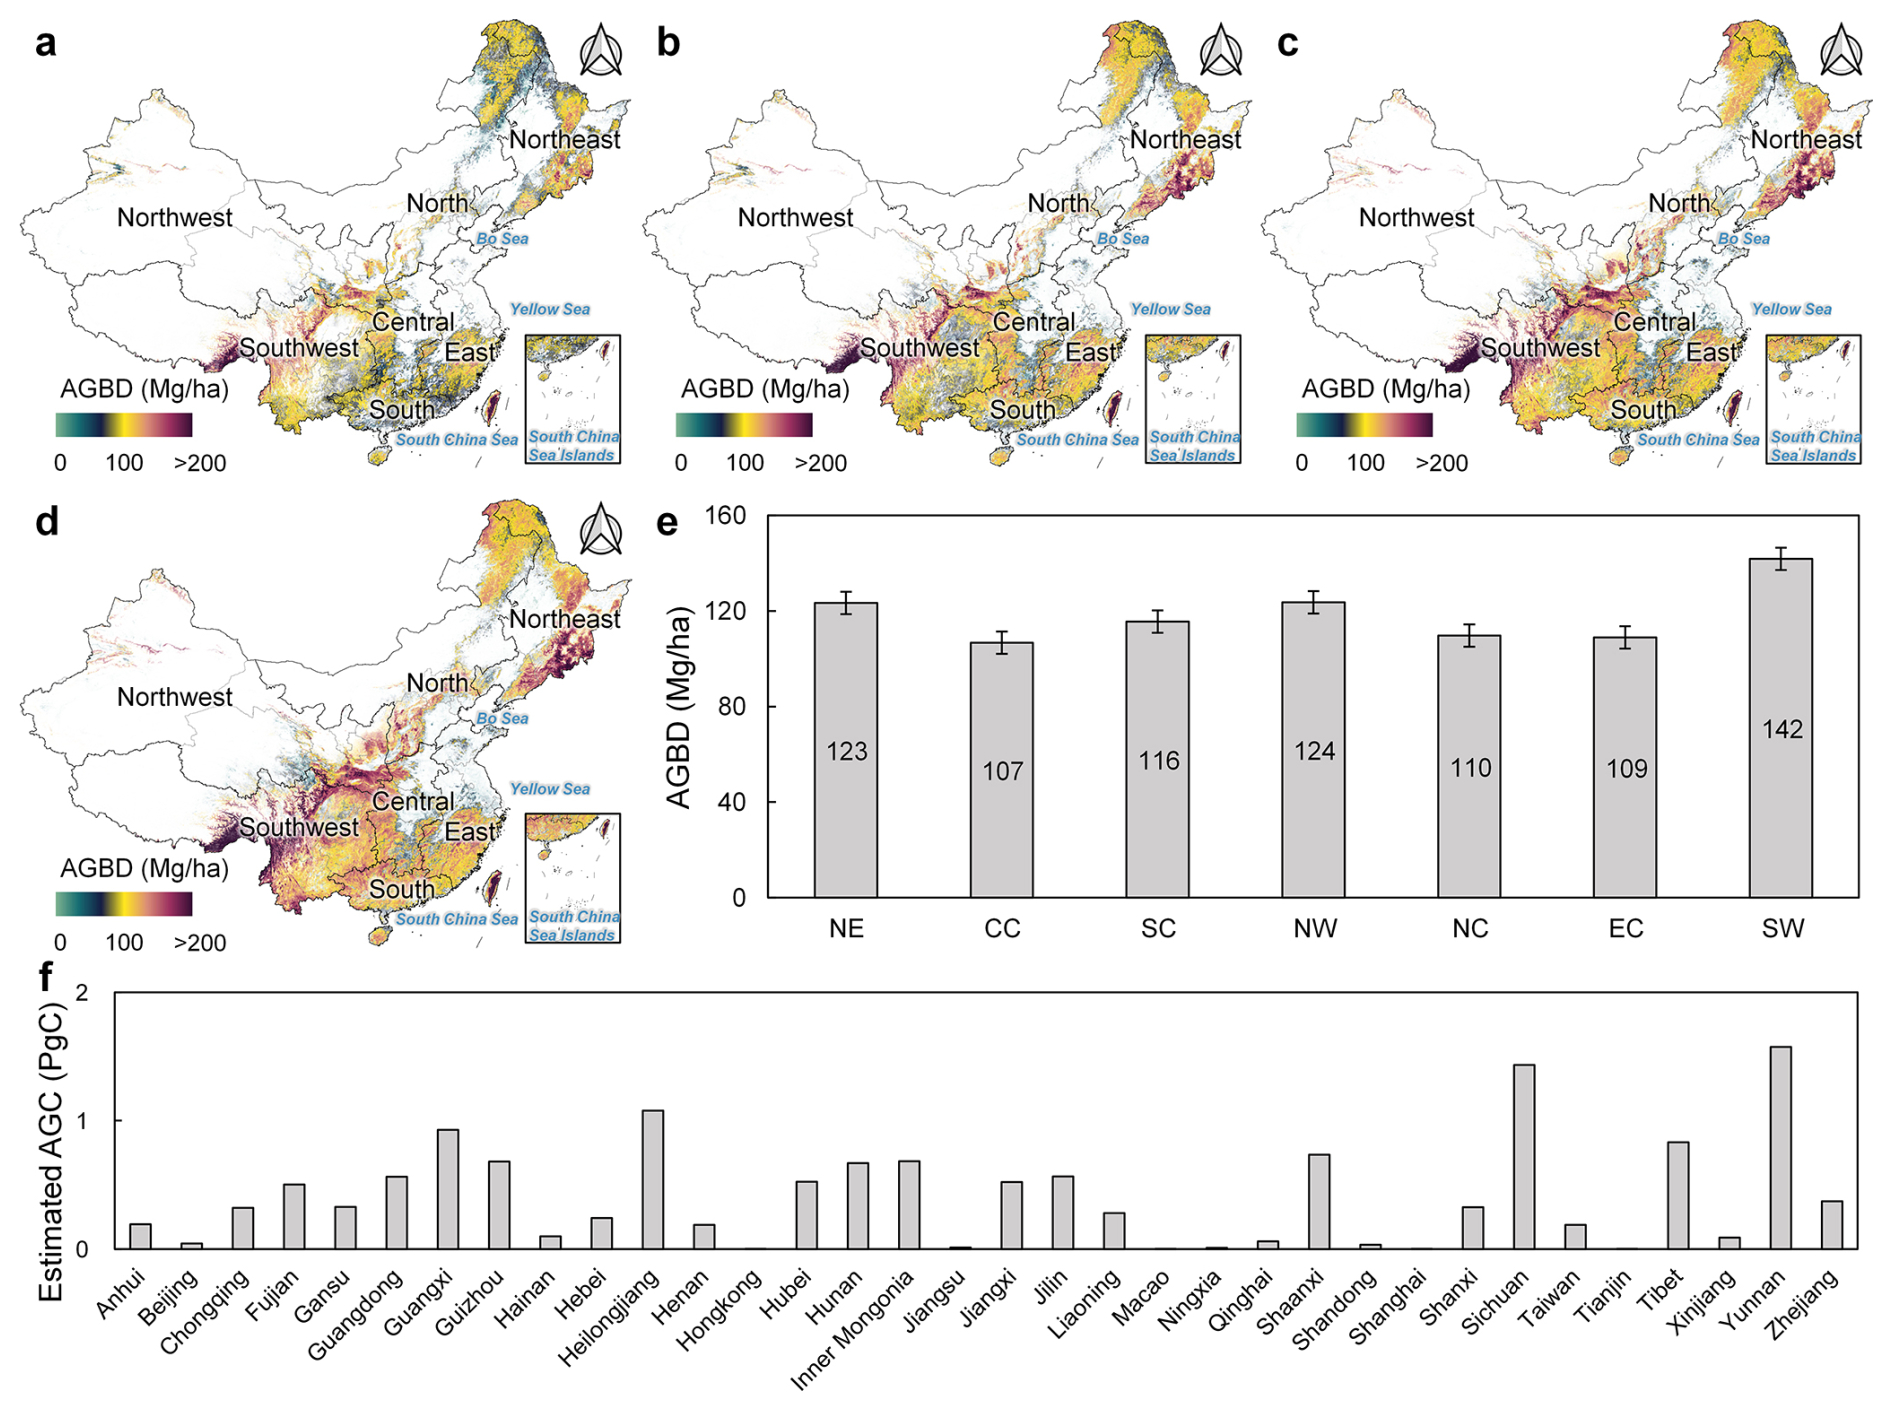
Figure 10Spatial patterns of forest AGBD and regional summaries. (a–d) Spatial distribution of forest AGBD in China for 1985, 2000, 2015, and 2023, respectively. (e) Mean AGBD across different geographical regions. (f) Estimated forest AGC stock for different provinces.
In 2023, the tropical rainforest exhibited the highest AGBD (165.17 Mg ha−1), followed by the temperate coniferous and deciduous broadleaf mixed forest (136.38 Mg ha−1), subtropical evergreen broadleaf forest (123.88 Mg ha−1), warm temperate deciduous broadleaf forest (111.08 Mg ha−1), cold temperate coniferous forest (107.77 Mg ha−1), temperate desert region (97.50 Mg ha−1), and Tibetan plateau alpine region (72.98 Mg ha−1).
The pixel-level analysis reveals that the average uncertainty in AGBD estimates across the study area is 13.94 Mg ha−1, with individual pixel uncertainties ranging from 0 to 85 Mg ha−1 (Fig. 11a). The vast majority of the study area (99.35 %) exhibits an uncertainty of less than 30 Mg ha−1, while only a small fraction (0.65 %) has uncertainties of 30 Mg ha−1 or greater (Fig. 11b). Notably, uncertainties are higher than the national average in the southwestern and southern regions, at 15.55 and 16.62 Mg ha−1, respectively. In contrast, the northwestern and northern regions have relatively lower uncertainties, with estimates falling below 10 Mg ha−1 (Fig. 11c). Overall, the uncertainty in forest AGBD across the study area is well-controlled, indicating a reliable dataset. However, the higher uncertainties in specific regions underscore the need for further refinement in these areas, particularly in complex terrains where topographic and vegetation heterogeneity may challenge the accuracy of AGBD estimates (Fig. 6d).
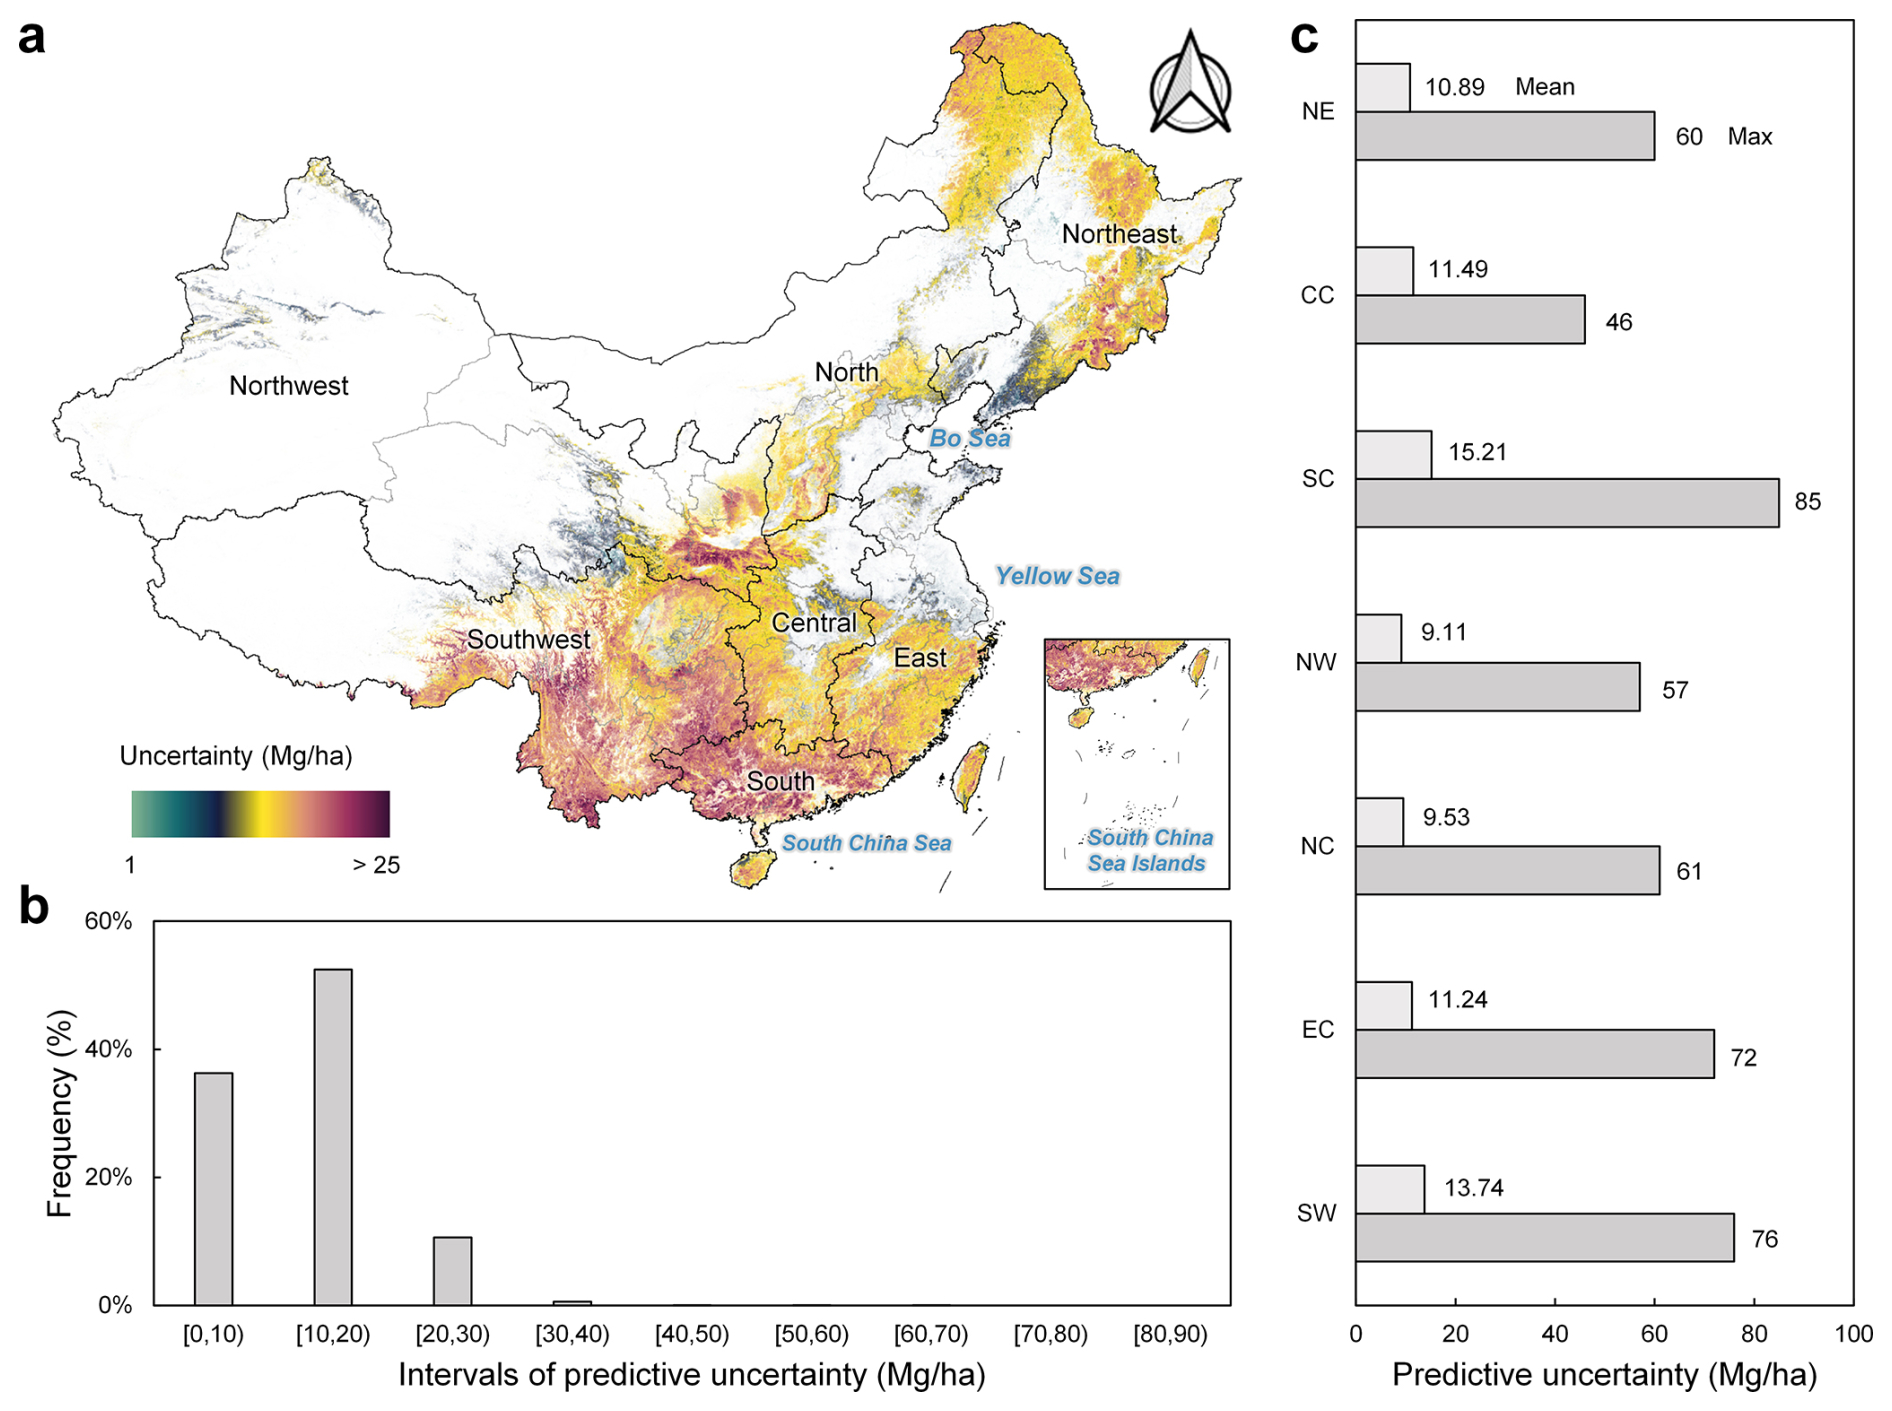
Figure 11Uncertainty analysis of forest AGB in China for the year 2023. (a) Predictive uncertainty map (expressed as standard deviation) of forest AGBD across China. (b) Frequency distribution of predictive uncertainty, categorized into 10 Mg ha−1 intervals. (c) Regional statistics of predictive uncertainty across different geographical areas.
3.5 Temporal trend and dynamics of forest AGB and AGC in China
The temporal analysis of China's average forest AGBD reveals a significant upward trend over the study period, with the average AGBD increasing from 95.74 ± 11.30 Mg ha−1 in 1985 to 122.69 ± 13.94 Mg ha−1 in 2023 (Fig. 12b). The average AGBD grew at an annual rate of 0.69 Mg ha−1 yr−1, representing a 28.1 % increase over the entire period. Most regions experienced an increase in AGBD during the study period, with the exception of certain areas in northeastern and northern China, where agricultural expansion and deforestation likely contributed to forest AGBD reduction (Fig. 12a). In contrast, significant increases in AGBD were observed in the Three-North Shelterbelt region, as well as in southwestern and southern China. In the Three-North region, extensive afforestation and the construction of shelter forests transformed non-forested areas into forested land, resulting in a substantial increase in AGBD. Similarly, large-scale afforestation efforts as part of desertification control in the southwestern and southern (e.g., Guangxi) regions, also contributed to a significant rise in AGBD. Among the seven geographical regions, the southern region experienced the fastest growth in AGBD (0.90 Mg ha−1 yr−1), followed by the northeast (0.81 Mg ha−1 yr−1), southwest (0.79 Mg ha−1 yr−1), north (0.73 Mg ha−1 yr−1), northwest (0.67 Mg ha−1 yr−1), central (0.41 Mg ha−1 yr−1), and eastern regions, which exhibited the slowest growth rate (0.26 Mg ha−1 yr−1) (Fig. 12b).
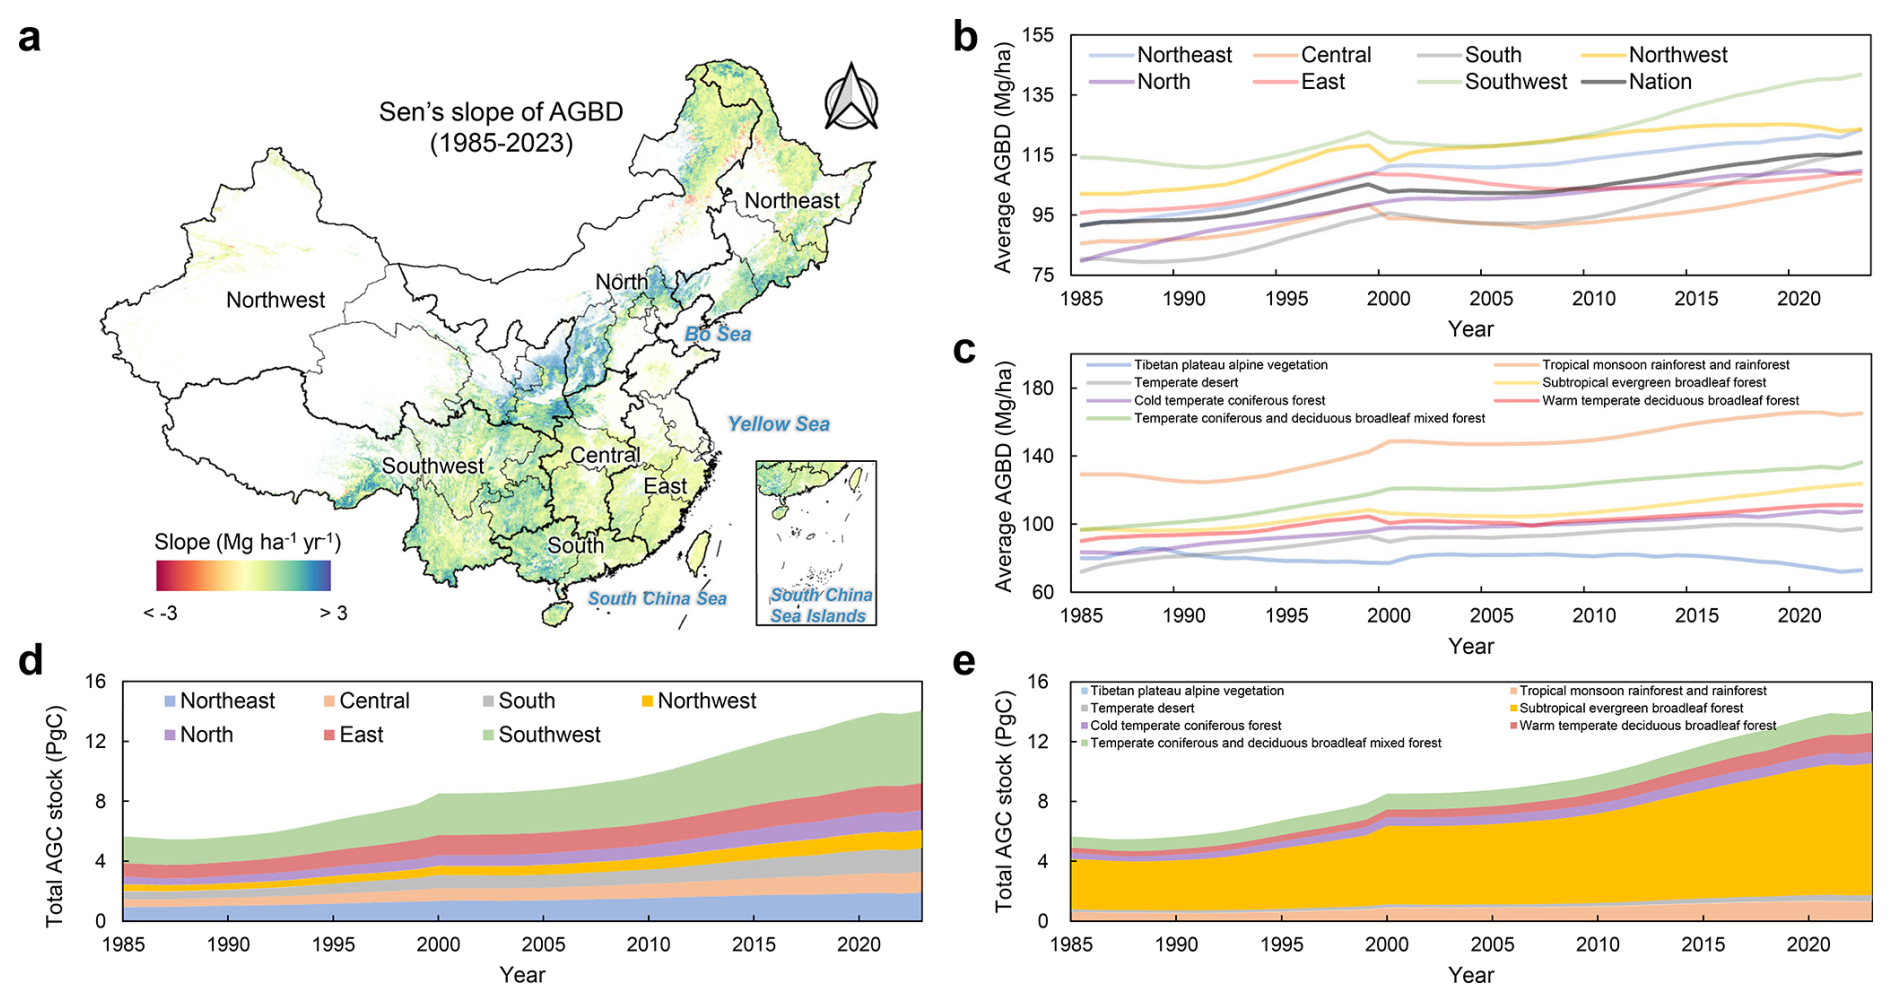
Figure 12Long-term (1985–2023) trends in forest AGB and AGC stocks in China. (a) Pixel-level forest AGBD trend map derived from Sen's slope analysis (Sen, 1968). (b) and (c) display annual changes in forest AGBD from 1985 to 2023 across geographical regions and ecoregions, respectively. (d) and (e) illustrate annual changes in total forest AGC stock over the same period, also across geographical regions and ecoregions. AGC is calculated from biomass using a conversion factor of 0.5.
We observed increasing AGBD trends across most ecoregions, except for the Tibetan plateau alpine region, where forest AGBD declined from 80.07 Mg ha−1 in 1985 to 72.98 Mg ha−1 in 2023, with a trend of −0.12 Mg ha−1 yr−1. Alpine forests, being more sensitive to environmental changes, may have experienced degradation due to climate warming and extreme weather events. The tropical rainforest showed the most pronounced increase in AGBD (1.17 Mg ha−1 yr−1), followed by the temperate coniferous and deciduous broadleaf mixed forest (1.00 Mg ha−1 yr−1), subtropical evergreen broadleaf forest (0.67 Mg ha−1 yr−1), cold temperate coniferous forest (0.64 Mg ha−1 yr−1), temperate desert region (0.60 Mg ha−1 yr−1), and warm temperate deciduous broadleaf forest (0.48 Mg ha−1 yr−1).
The spatial distribution of China's forest aboveground carbon (AGC) stock in 2023 was uneven. The southwestern region held the largest share, with 4.84 PgC, accounting for over one-third of the national total (34.43 %). The northeast contributed 13.65 %, followed by the east (12.94 %), the south (11.32 %), the central region (9.80 %), the north (9.19 %), and the northwest (8.66 %) (Fig. 12d). Disparities in AGC stock were even more pronounced across different forest types. The subtropical evergreen broadleaf forest contained 8.82 PgC, making up over half of the national total (62.80 %), followed by the temperate coniferous and deciduous broadleaf mixed forest (10.32 %), warm temperate deciduous broadleaf forest (9.11 %), tropical rainforest (8.90 %), cold temperate coniferous forest (5.44 %), temperate desert region (2.91 %), and the Tibetan Plateau alpine region (0.55 %) (Fig. 12e).
Throughout the study period, China's forest AGC showed an upward trend, with total forest AGC stock expanding from 5.50 ± 0.23 PgC in 1985 to 13.97 ± 0.87 PgC in 2023 (Fig. 12d, e). Across all geographic and ecological regions, total forest AGC stock consistently increased from 1985 to 2023. The southwestern region experienced the fastest increase (0.09 PgC per year), while growth rates in other regions were relatively similar (0.02 PgC per year). Among ecoregions, the subtropical evergreen broadleaf forest showed the fastest growth (0.15 PgC per year), while the Tibetan Plateau alpine region exhibited the slowest growth (0.001 PgC per year). However, net carbon storage initially declined at a rate of −0.02 PgC per year during 1985–1989. This trend reversed after 1990, with a robust increase of 0.25 PgC per year. Overall, the total forest AGC stock increased at a rate of 0.22 ± 0.01 PgC per year, effectively doubling China's forest carbon reserves over the past 40 years, achieving a remarkable growth of 154.0 % (see Sect. S4 for discussion). The forest net AGC sink offset 11.5 %–14.9 % of fossil fuel and industrial emissions between 1985 and 2023.
3.6 Contribution of forest change to changes in AGC
This study highlights the dual role forests played in carbon sequestration and emissions in China during the period from 1985 to 2023, depending on the nature of forest changes. Forest growth, which involves increased tree cover in already forested areas, was a major contributor to carbon sequestration, particularly in regions south of the Qinling Mountains (Fig. 13a). The spatial changes in AGC induced by forest growth closely mirror the age distribution of China's forests. The carbon sequestration per unit area due to forest growth was significantly higher in southern regions compared to northern, northeastern, southwestern, and Taiwan, where natural forests dominate. These older forests with higher canopy cover had limited potential for further AGC increase, following the “law of constant final yield” (Adler et al., 2018), which explains why AGC growth in younger and less dense forests in central, southern, and eastern China outpaced that of other regions, reflecting the effects of long-term conservation efforts.
Forest expansion also contributed to additional carbon sequestration by converting non-forested land to forest, with significant gains observed in the southwest and western regions (Fig. 13b). This is closely related to reforestation efforts initiated since 1985. These areas, previously allocated for other land uses, significantly boosted carbon stocks through afforestation initiatives. Notably, we observed that carbon sequestration per unit area from forest expansion was considerably lower than that from forest growth, which can be explained by the fact that AGC accumulation rates follow a “slow-fast-slow” pattern as forests mature (see Fig. 8). Hence, the carbon sequestration in newly planted forests was naturally lower than that in pre-existing forests. However, the carbon sequestration due to forest expansion in the southwest was significantly higher than in other regions, aligning with recent studies showing that the carbon sink potential in southwest China may have been historically underestimated (Wang et al., 2020). Conversely, tree cover loss and forest-to-non-forest transitions were the primary contributors to carbon emissions, mainly concentrated in northern and northeastern regions (Fig. 13c, d). The spatial patterns of carbon emissions due to forest loss suggest that deforestation and land-use conversion were concentrated in the same regions experiencing high developmental pressure and agricultural expansion.
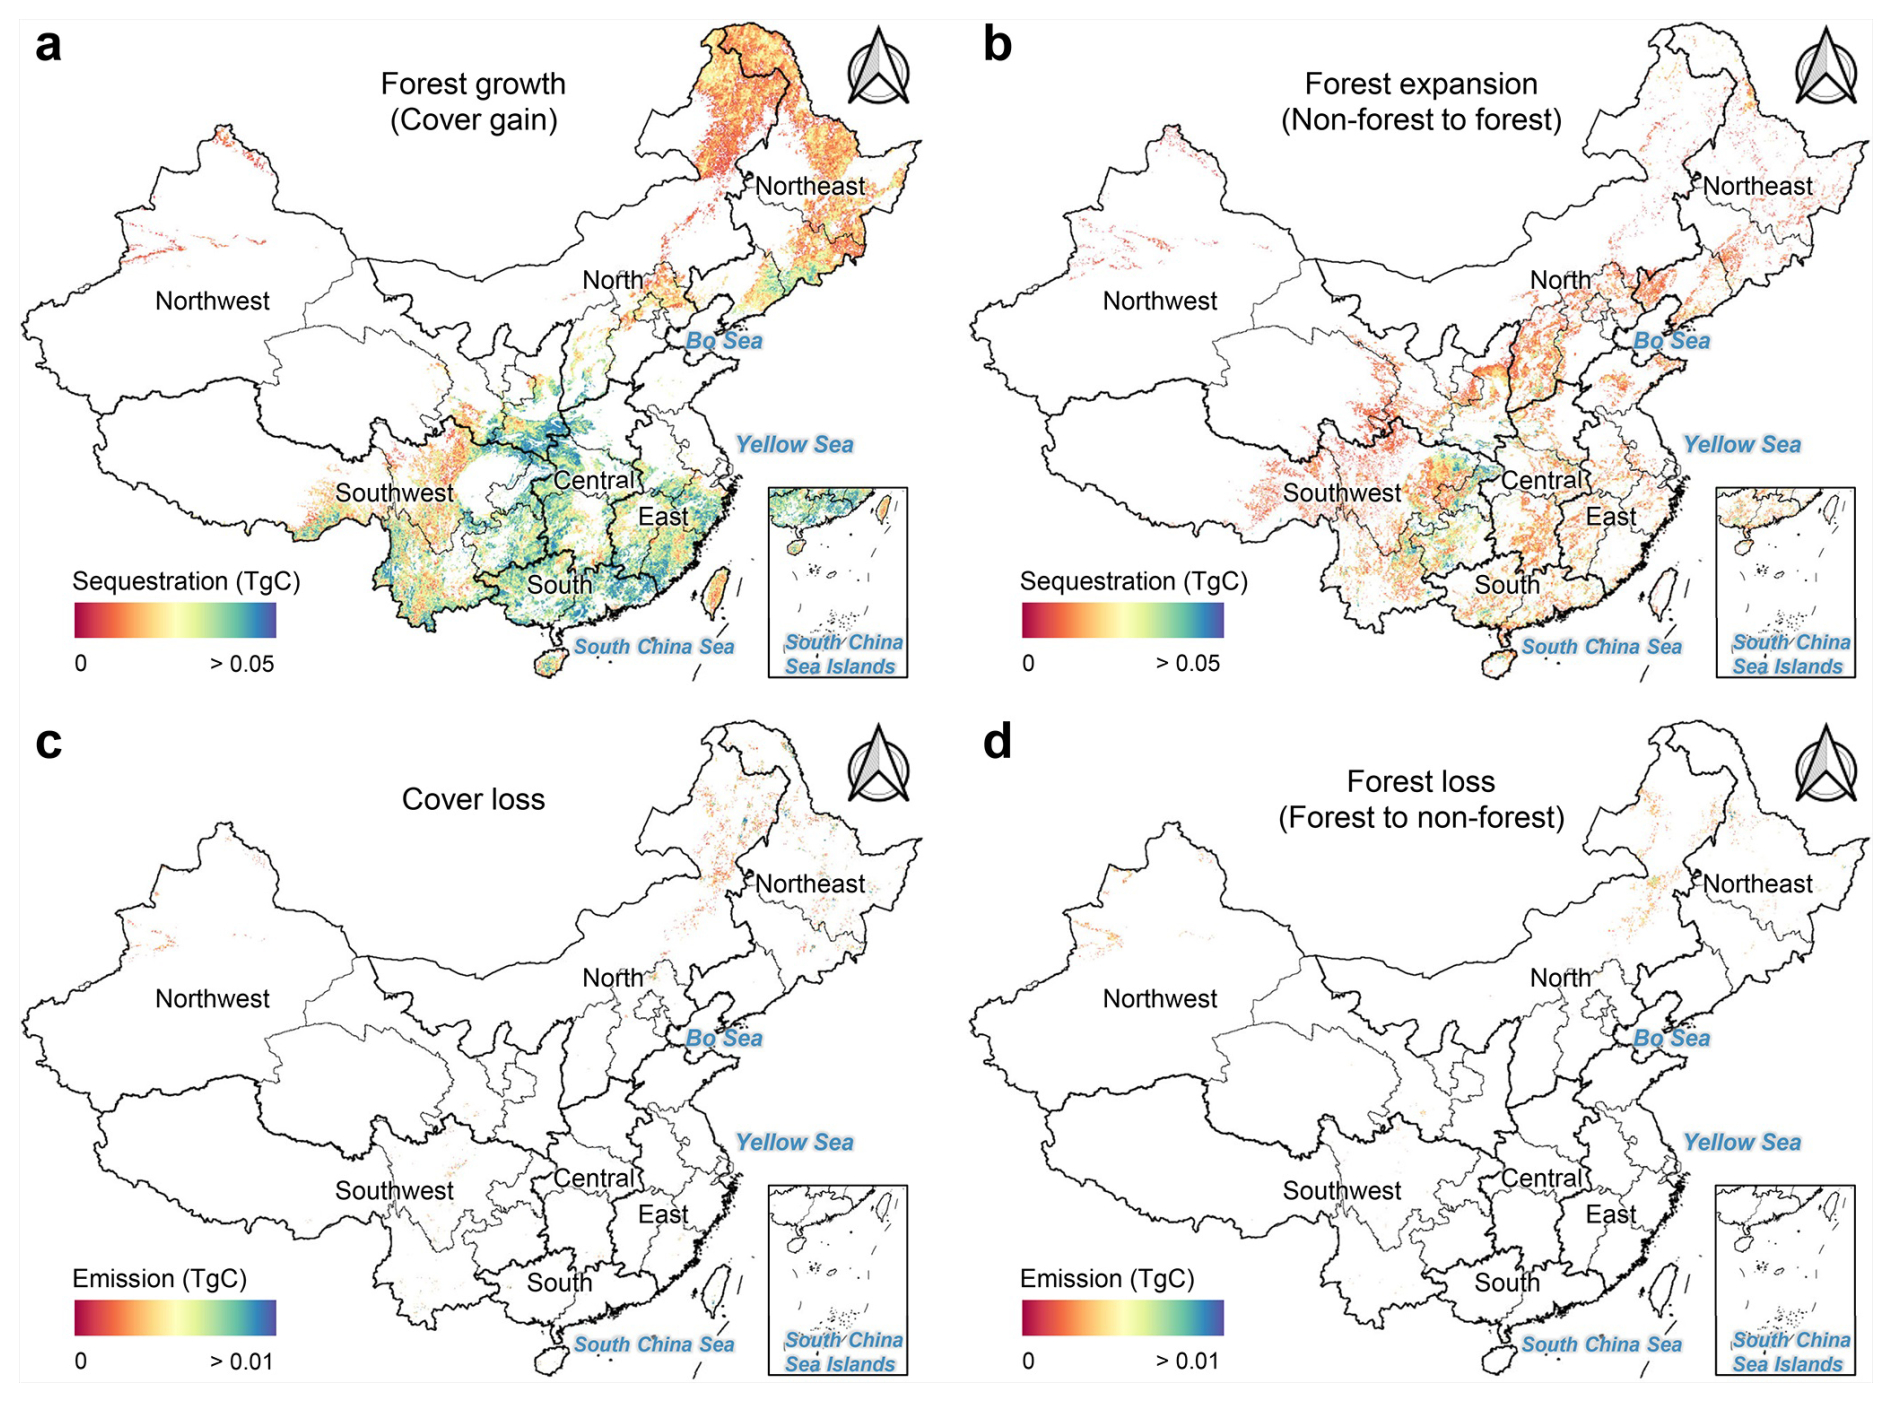
Figure 13AGC Spatial changes induced by forest dynamics in China between 1985 and 2023. (a) and (b) represent the spatial distribution of carbon sequestration driven by forest growth and expansion, respectively. (c) and (d) illustrate the spatial distribution of carbon emissions resulting from tree cover loss and forest loss, respectively.
We observed that approximately 65.1 % (5.75 PgC) of the carbon sequestration was due to forest growth, while the remaining 34.9 % (3.09 PgC) resulted from forest expansion (Fig. 14). Although forest growth contributed more to the AGC stock increment, this finding suggests that afforestation activities since 1985 have significantly boosted AGC, accounting for nearly one-third of the total increase. These initiatives have involved planting new forests on previously non-forested land and restoring degraded forest areas, thus expanding China's forested landscapes and bolstering their carbon sequestration capacity. This substantial contribution underscores the positive impact of forest conservation policies and enhanced management practices, which have facilitated forest recovery, maturation, and increased carbon sequestration over time. In terms of carbon emissions, tree cover loss accounted for 47.77 % of the AGC reduction, while forest loss (forest to non-forest transitions) was responsible for 52.23 %. This indicates that complete deforestation had a more substantial impact on AGC loss than reductions in canopy density.
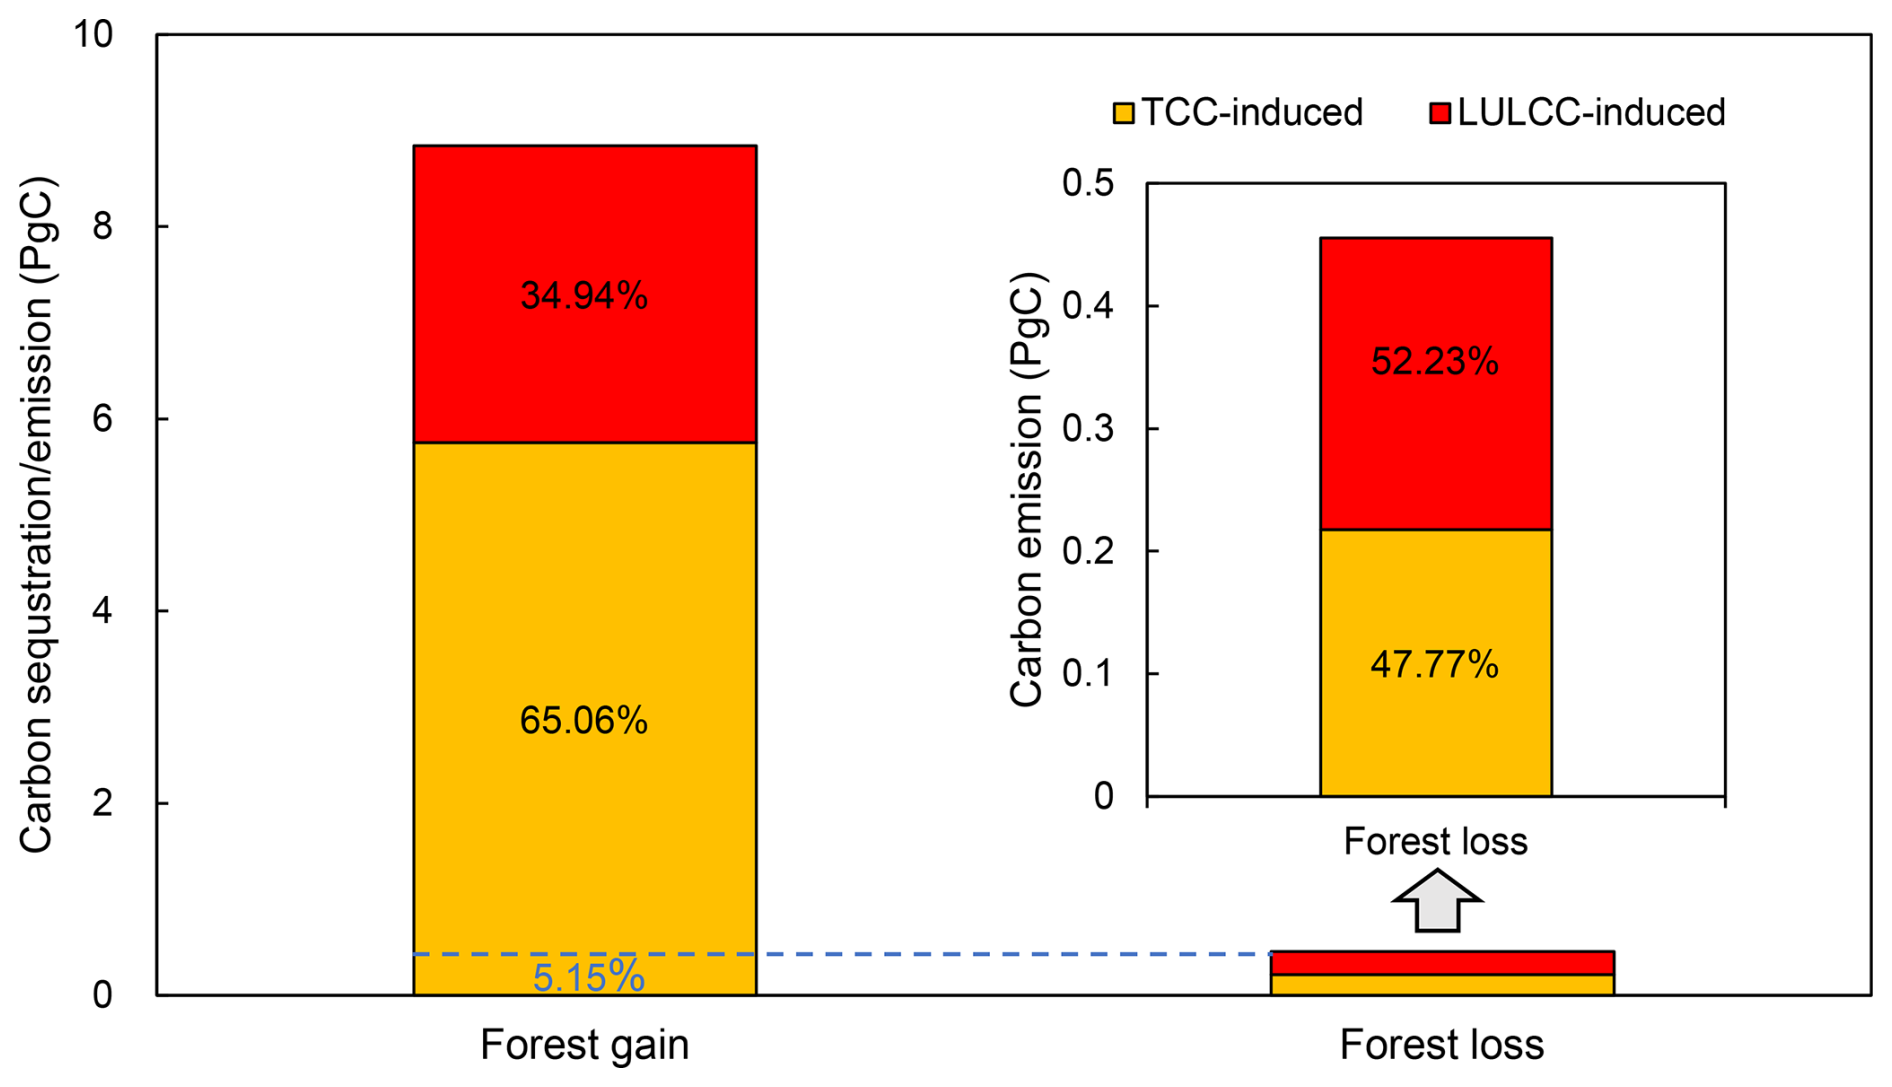
Figure 14Quantification of AGC changes induced by forest dynamics in China between 1985 and 2023.
The contrasting spatial dynamics between carbon sequestration and emissions underscore the complexity of AGC changes over the past four decades. While large areas of China have acted as carbon sinks due to reforestation and forest regeneration, other regions have simultaneously contributed to significant carbon emissions through deforestation and land degradation. This dual impact highlights the critical importance of targeted forest management strategies aimed at enhancing carbon sequestration while minimizing deforestation and forest degradation, ensuring a balanced and sustainable approach to forest carbon dynamics in the future.
4.1 Comparison with external AGBD datasets
4.1.1 Static and spatial comparison
In pixel-level comparisons of our AGBD map against datasets from Zarin et al. (2016), Hu et al. (2016), Su et al. (2016), Santoro et al. (2021), Yang et al. (2023), and ESA CCI (see Sect. S2 for more information about the external AGBD datasets), the average differences were −5.86, −45.23, 24.78, 47.91, 19.55, and 60.14 Mg ha−1, respectively (Fig. 15). Our map aligns more closely with Zarin et al. (2016), Su et al. (2016), Yang et al. (2023), while larger discrepancies are observed with the Hu, Santoro, and ESA CCI datasets. Specifically, the percentage of pixels with absolute differences less than 50 and 25 Mg ha−1, respectively, are as follows: Zarin et al. (49.5 %, 25.9 %), Hu et al. (50.7 %, 27.6 %), Su et al. (59.8 %, 33.9%), Santoro et al. (53.2 %, 26.4 %), Yang et al. (65.8 %, 39.0 %), and ESA CCI (38.1 %, 18.2 %).
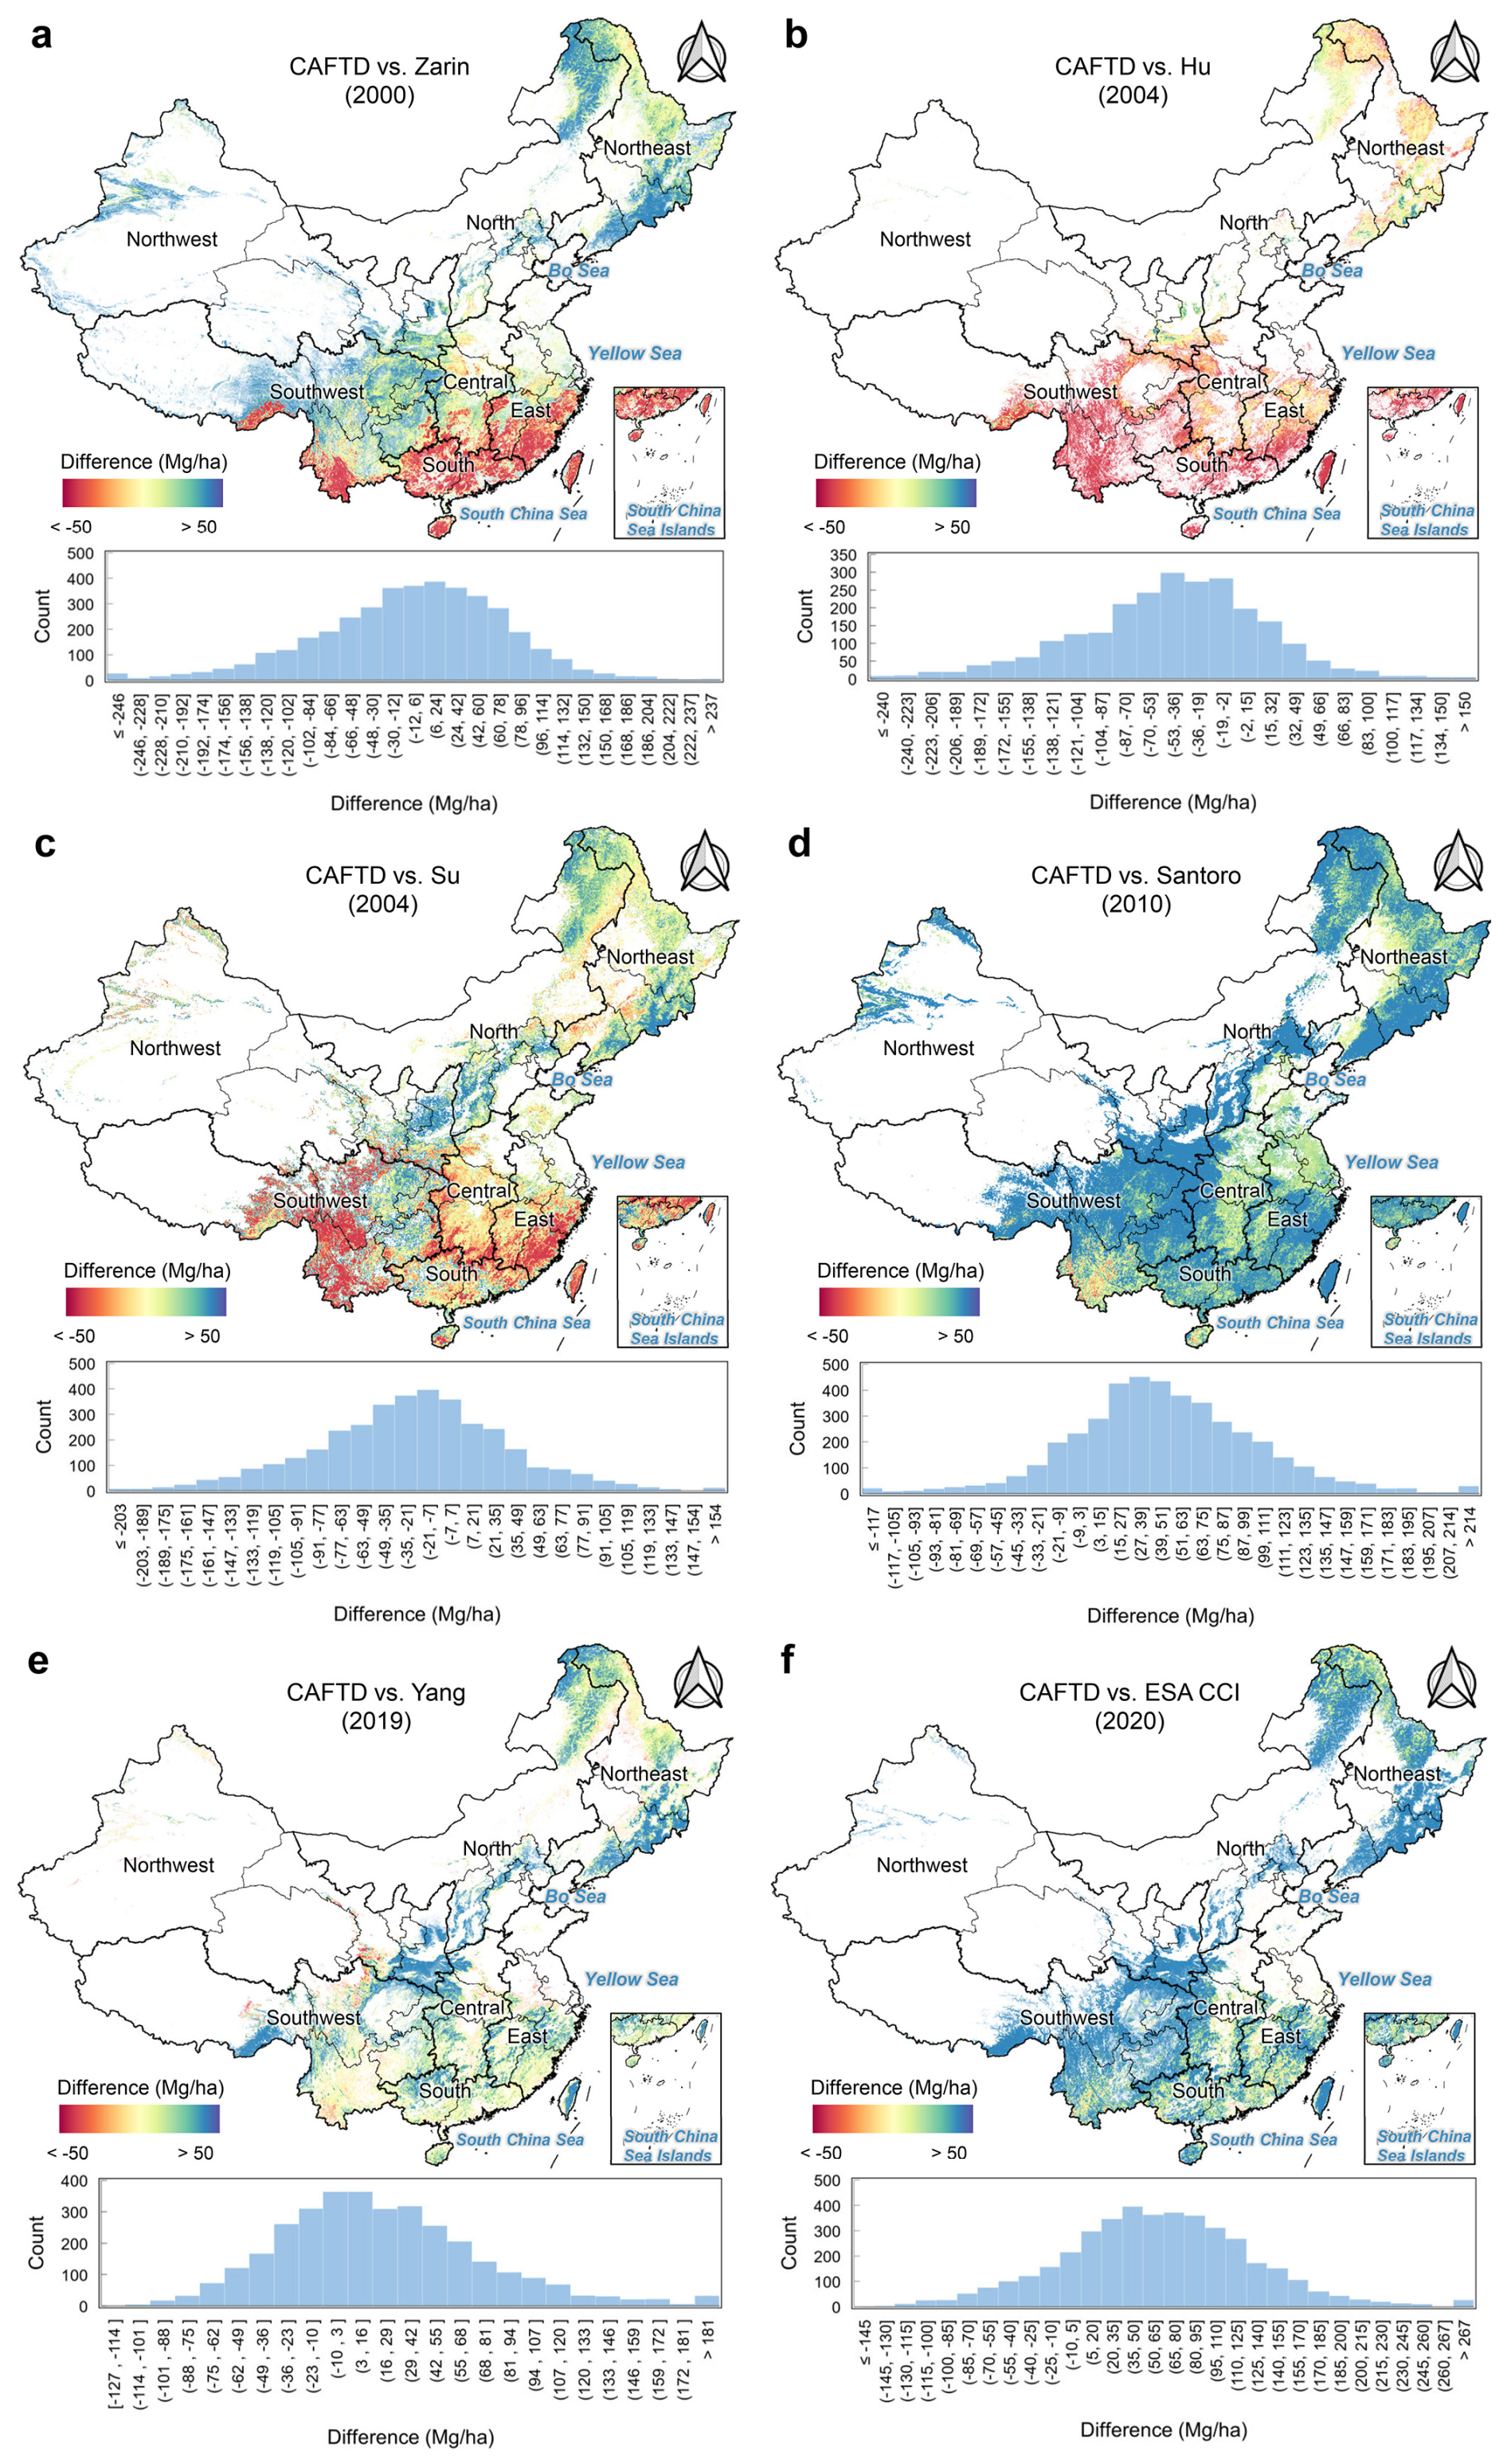
Figure 15Difference between the generated AGBD map and external AGBD datasets. (a)–(f) are pixel-level differences between the estimated forest AGBD from CFATD and the forest AGBD from Zarin et al. (2016), Hu et al. (2016), Su et al. (2016), Yang et al. (2023), and ESA CCI, respectively (the estimated AGBD minus external AGBD).
In southern, eastern, and southwestern China, our estimates are more than 50 Mg ha−1 lower than those of Zarin, Hu, and Su. The coarser spatial resolution of these products likely leads to aggregation bias, potentially overestimating AGBD in fragmented forest landscapes. Temporal mismatches and intensive human activities in these regions exacerbate the differences. Conversely, our estimates in northern and northwestern regions are higher than Zarin and Su but align well with Hu, with minimal differences (< 25 Mg ha−1). Compared to Santoro and ESA CCI, our map consistently reports higher AGBD across China, as their global focus and lack of region-specific samples likely lead to underestimations. The Santoro and ESA CCI maps, which report average AGBD of 57.05 and 64.88 Mg ha−1 for 2010 and 2020, respectively, represent the lowest levels listed in Table S1. The Yang map shows strong spatial consistency with ours but underestimates AGBD in hotspots like the Qinling Mountains, southern Tibet, and Taiwan province due to limited field samples and spectral saturation.
Key differences among datasets stem from their capacity to capture spatial variability, manage spatial resolution, and comprehensively represent forested regions. Our map captures fine-scale patterns, such as higher AGBD in forest interiors and lower AGBD at edges (Fig. 16), outperforming Yang in variability representation, while Zarin, Santoro, and ESA CCI also perform well in this aspect. Coarse-resolution datasets, such as the Hu map (Fig. 16f) and Su map (Fig. 16g) (1000 m), show significantly reduced accuracy in fragmented landscapes, making them unsuitable for precise carbon accounting. Furthermore, the quality of forest thematic maps plays a critical role in AGBD mapping; only CFATD, Zarin, and Santoro effectively detected shelterbelts within agricultural areas, whereas other datasets either partially missed or entirely failed to capture these features (The third scenario of Fig. 16).
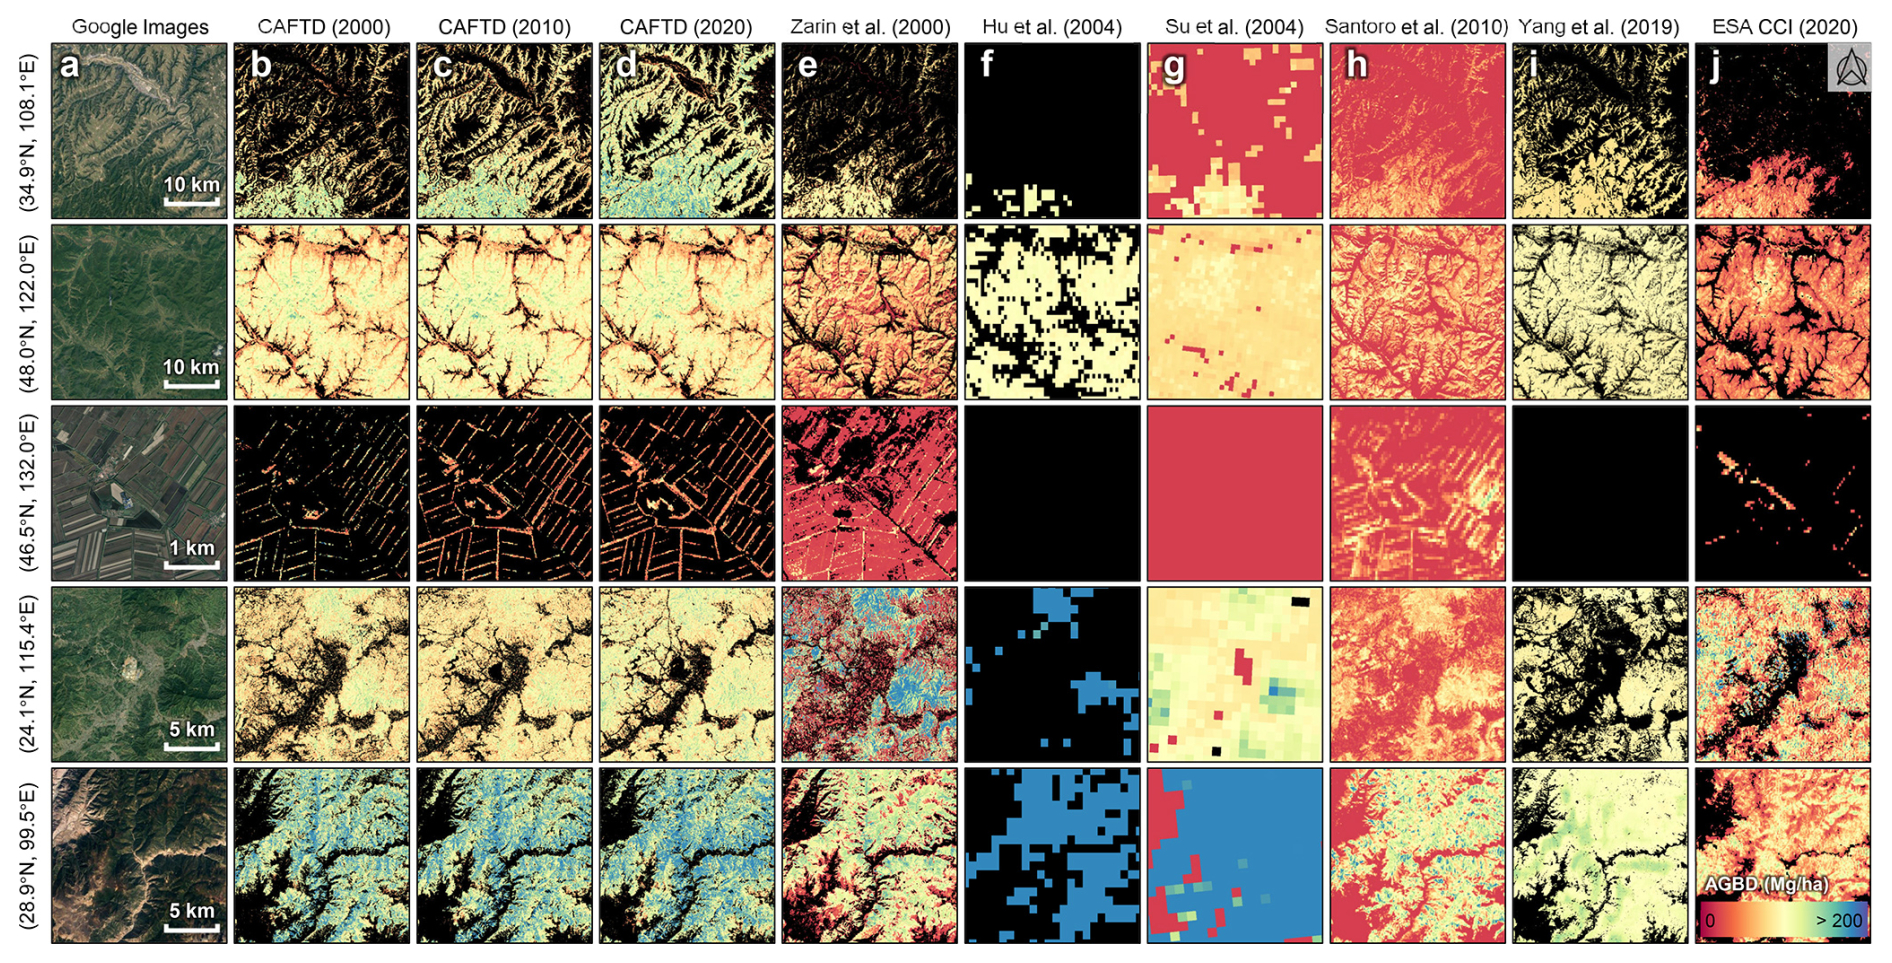
Figure 16Comparison of AGBD product details across different datasets. (a) Google high-resolution imagery (© Google Earth); (b)–(d) represent the CFATD products for the years 2000, 2010, and 2020, respectively; (e)–(j) display AGBD maps from Zarin et al. (2016), Hu et al. (2016), Su et al. (2016), Santoro et al. (2021), Yang et al. (2023), and ESA CCI. Each row corresponds to subregions representing different forest types. Note: The numbers in parentheses indicate the corresponding year of each dataset.
4.1.2 Dynamic and trend comparison
Our AGBD dataset reveals a consistent upward trend from 1985 to 2023, highlighting the steady recovery and effective management of China's forests (Fig. 17). This trajectory is broadly in line with national afforestation and conservation programs, and provides a robust depiction of long-term carbon stock dynamics (Zeng et al., 2023). To benchmark our results, we compared them with four independent AGB time-series datasets (see Sect. S2).
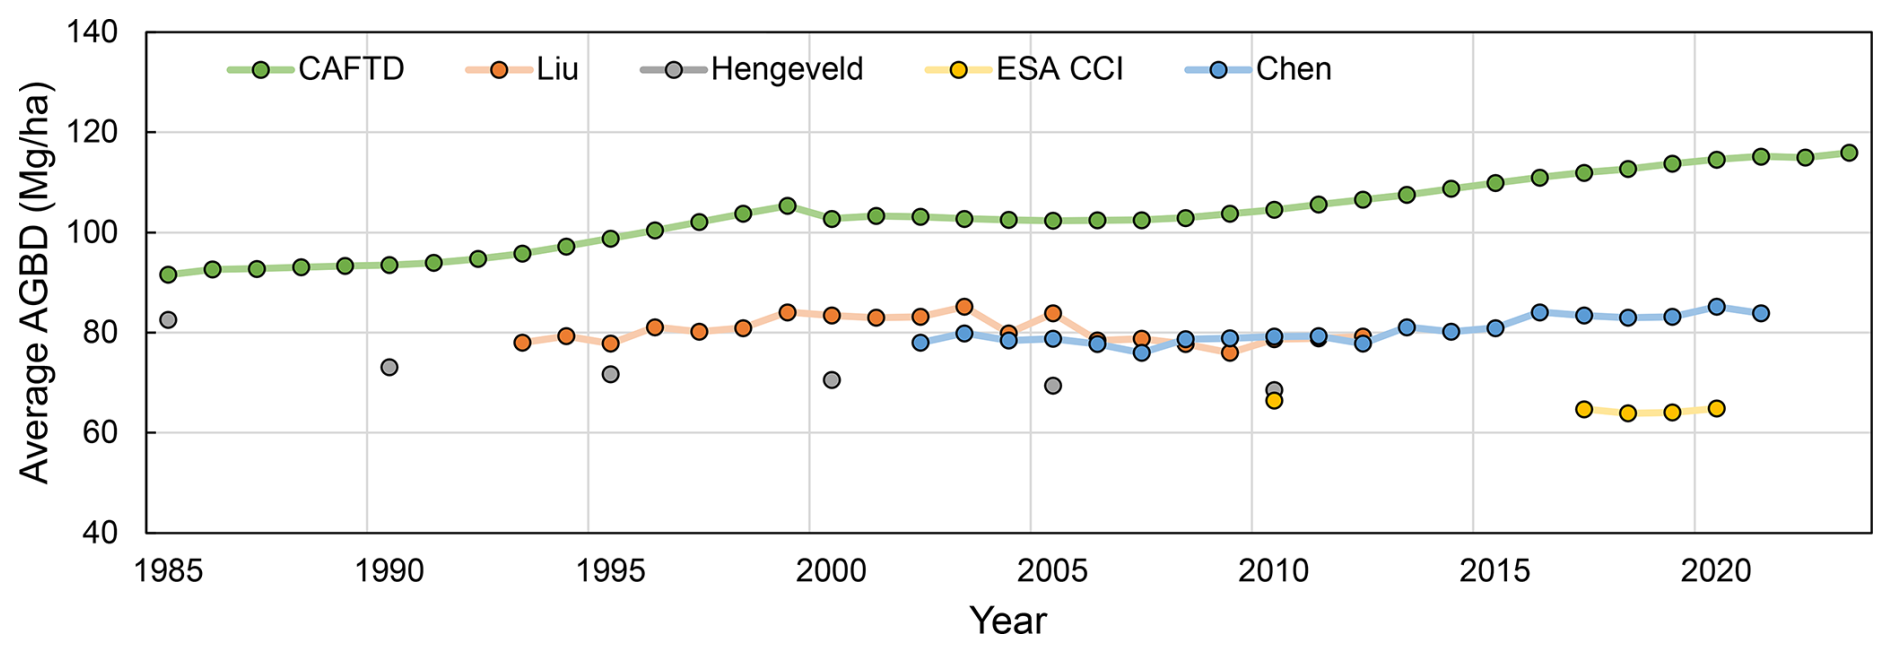
The comparison highlights substantial differences in both magnitude and temporal pattern. For instance, the Hengeveld dataset (Hengeveld et al., 2015) exhibits pronounced fluctuations, including a decline during the late 1990s and early 2000s, while the ESA CCI product shows a general decrease in the 2010s. Chen et al. (2023) also report consistently lower AGBD values than our estimates. These discrepancies arise from several key factors: (1) spatial resolution – most global products are provided at ≥ 1 km resolution, which smooths local heterogeneity and suppresses extremes captured by our 30 m dataset; (2) forest definition and masking – different tree-cover thresholds (e.g., Chen et al., 2023 use > 15 % canopy cover) alter the mapped forest extent and introduce mixed pixels, leading to lower mean AGBD. Notably, when Chen's product is aggregated with the 1 km forest cover map used by Hu et al. (2016), its average AGBD increases substantially, ranging from 68.94 Mg ha−1 in 2002 to 75.58 Mg ha−1 in 2021, highlighting the sensitivity of biomass estimates to forest definitions. (3) input data and modeling approaches – radar- or lidar-upscaled products differ in their sensitivity to canopy structure compared with optical or inventory-driven models; (4) many existing datasets rely on coarse LULC or forest masks that cannot effectively capture China's large-scale afforestation efforts (Cai et al., 2024), thereby underestimating biomass gains; and (5) temporal coverage and reference data – the calibration periods and reference samples vary among products, creating temporal mismatches in trend estimation (Quegan et al., 2019; Santoro et al., 2021).
Despite these differences, our dataset shows stronger agreement with independent evidence from national forest inventory statistics and regional studies (Fang et al., 2001; Liu et al., 2015; Piao et al., 2005; Zeng et al., 2023), all of which support a long-term upward trajectory of China's forest biomass. This comparison further underscores the value of high-resolution, long-term mapping for capturing heterogeneous forest dynamics in China.
4.2 Limitations and future improvement
Current AGBD maps often overestimate low values and underestimate high values – a persistent pattern well documented in previous studies (Réjou-Méchain et al., 2019; Rodríguez-Veiga et al., 2019). These discrepancies are largely driven by sensor limitations, such as the saturation of optical and radar signals in high-biomass forests, leading to systematic underestimation in dense tropical or subtropical stands. The overestimation of low AGBD is more complex, often arising from regression models fitted to limited or non-representative plot data. Additional systematic biases can result from measurement errors, incorrect allometric models, and environmental factors (e.g., precipitation, snow cover) that influence remote sensing signals (Santoro et al., 2021). Furthermore, mismatches between the spatial resolution of remote sensing data and the size or geolocation accuracy of field plots can distort pixel-level estimates, underscoring the need for improved plot–pixel matching and more representative field measurements. It is important to note that the validation accuracy in this study was achieved using a strictly curated dataset. Including raw field plots without visual screening for homogeneity would likely result in significantly lower correlations due to the scale mismatch between field measurements and satellite pixels.
Against this backdrop, our estimates indicate a substantial increase in mean forest AGBD from 95.74 to 122.69 Mg ha−1 and in total AGC stock from 5.50 to 13.97 PgC over the study period. These upward trends are broadly consistent with the scale and trajectory of China's large-scale afforestation and forest rehabilitation programmes since the 1980s – especially post-1999 initiatives such as the Grain-for-Green Program – which have simultaneously expanded forest area and increased stand biomass through natural growth and management. Independent comparisons with provincial NFI statistics and several external products show similar upward trajectories (see Figs. 5 and 17), lending confidence to the observed direction of change.
Nevertheless, we acknowledge several sources of systematic uncertainty that could affect the magnitude of these increases. First, optical indices tend to saturate in very high-biomass forests, potentially biasing estimates downward in tropical and old-growth stands. Second, our definition of forest (≥ 20 % tree-cover threshold) directly influences the mapped forest extent and thus the total AGC stock; a higher threshold would yield lower total area and carbon estimates (see Sect. S5). Third, the use of a fixed biomass-to-carbon conversion factor (0.5) ignores species- and region-specific variation in carbon content, which may introduce bias in regional and national totals. Finally, the GEDI footprint AGBD dataset, which informs part of our modelling framework, lacks direct training data from China and neighbouring countries such as Russia (Duncanson et al., 2022). Although the Level 4A algorithm is designed for geographic transferability (Kellner et al., 2023), the absence of local calibration data may still introduce uncertainty in parts of China.
While deep learning approaches have been employed here to reduce spectral saturation effects and improve estimation accuracy, further advances are possible. Integrating multi-source remote sensing data (optical, radar, LiDAR) can better capture forest structural complexity and mitigate the limitations of individual sensors (see Sect. S6). Developing region- and forest-type-specific allometric models will further refine biomass estimation in heterogeneous landscapes. Expanding calibration and validation with more extensive and diverse ground data, particularly from underrepresented regions, will improve both accuracy and transferability. Incorporating time-series data into modelling frameworks can also help distinguish between short-term fluctuations and long-term growth trends (Araza et al., 2022; Duncanson et al., 2019).
To guide proper use of these maps, we note several best-use recommendations: the products are most reliable at regional to national scales rather than for individual plots; caution is warranted when interpreting high-biomass tropical or subtropical forests due to potential saturation, and users are encouraged to cross-validate with other datasets when conducting local analyses; and users should consider forest definition thresholds and local biomass-to-carbon conversion factors when estimating carbon stocks. Where possible, independent validation with local field data is recommended before applying these maps for management or policy decisions. Finally, continued development of deep learning models and integration of multi-source data are likely to further enhance both the accuracy and applicability of future AGB products.
The China Forest AGB Time Series Dataset (CFATD) generated by this study is accessible via the Google Earth Engine script at this link: https://code.earthengine.google.com/4f8ad8d32ddb84e826e941a95f31f9be (last access: 22 February 2025). Please note that access to the script requires a Google Earth Engine login. Users also can download the CFATD from Zenodo: (Part I: 1985–1993) https://doi.org/10.5281/zenodo.12620984 (Cai et al., 2025a), (Part II: 1994–2001) https://doi.org/10.5281/zenodo.12637101 (Cai et al., 2025b), (Part III: 2002–2008) https://doi.org/10.5281/zenodo.12655492 (Cai et al., 2025c), (Part IV: 2009–2015) https://doi.org/10.5281/zenodo.12658255 (Cai et al., 2025d), (Part V: 2016–2021) https://doi.org/10.5281/zenodo.12742210 (Cai et al., 2025e), (Part VI: 2022–2023) https://doi.org/10.5281/zenodo.12747329 (Cai et al., 2025f).
In this study, we developed a comprehensive approach to estimate the spatiotemporal distribution of forest AGB across China by integrating multisource datasets – including spectral, climatic, topographic, and tree cover data – within a deep learning framework. Using over 50 000 GEDI sample points, we trained a ResNet model to produce the China Forest AGB Time Series Dataset (CFATD), a 30 m resolution dataset spanning 1985 to 2023, accompanied by uncertainty estimates. Validation with the 2019–2021 GEDI dataset (R2 = 0.91, RMSE = 16.49 Mg ha−1, Bias = 0.50 Mg ha−1) and multi-year ground survey data (R2 = 0.63, RMSE = 68.26 Mg ha−1, Bias = −19.87 Mg ha−1) confirmed the robustness of the AGB time series maps, which effectively capture the dynamics of forest biomass. The CFATD not only aligns with existing products in spatial consistency but also provides an improved representation of fine-scale spatial heterogeneity and temporal trends. Our nationwide AGB estimates revealed that as of 2023, China's average forest AGBD was 122.69 ± 13.94 Mg ha−1. The regions with the highest AGB carbon densities were concentrated in the Southwest, Northwest, Northeast, and Taiwan. The total forest AGC stock was estimated at 13.97 ± 0.87 PgC, with 41.5 % concentrated in five provinces, highlighting the uneven distribution of forest resources. Between 1985 and 2023, average AGBD increased from 91.58 ± 9.27 to 122.69 ± 13.94 Mg ha−1, and total carbon stock rose from 5.50 ± 0.23 to 13.97 ± 0.87 PgC, with an annual net accumulation rate of 0.22 PgC. We found that 65.1 % of the increased AGC stock was attributed to forest growth, with the remaining 34.9 % attributed to forest expansion. In terms of carbon emissions, tree cover loss contributed 47.8 % of AGC reductions, while forest loss (forest-to-non-forest transitions) accounted for 52.2 %. The CFATD fills a critical gap by providing the first long-term, high-resolution forest AGB dataset for China. This dataset will be crucial for monitoring forest carbon dynamics, assessing climate change impacts, and guiding forest management and conservation policies.
The supplement related to this article is available online at https://doi.org/10.5194/essd-17-6993-2025-supplement.
YC and XLiu designed the research. YC conducted the research and wrote the draft of the paper. XLiu, PZhu and XLi supervised the research. All co-authors reviewed and revised the paper.
At least one of the (co-)authors is a member of the editorial board of Earth System Science Data. The peer-review process was guided by an independent editor, and the authors also have no other competing interests to declare.
Publisher's note: Copernicus Publications remains neutral with regard to jurisdictional claims made in the text, published maps, institutional affiliations, or any other geographical representation in this paper. While Copernicus Publications makes every effort to include appropriate place names, the final responsibility lies with the authors. Views expressed in the text are those of the authors and do not necessarily reflect the views of the publisher.
We would like to thank the Earth Engine Uplift Support Team for granting the storage quota, which has greatly facilitated the progress of this research.
This work was supported in part by the National Science Foundation for Distinguished Young Scholars of China under grant no. 42225107; in part by the National Key Research and Development Program under grant no. 2022YFB3903402; in part by the Key Program of the National Natural Science Foundation of China (grant no. 42330507); and in part by the National Natural Science Foundation of China under grant nos. (42171409, 42171410, and 42401505).
This paper was edited by Zhen Yu and reviewed by three anonymous referees.
Adler, P. B., Smull, D., Beard, K. H., Choi, R. T., Furniss, T., Kulmatiski, A., Meiners, J. M., Tredennick, A. T., and Veblen, K. E.: Competition and coexistence in plant communities: intraspecific competition is stronger than interspecific competition, Ecology Letters, 21, 1319–1329, https://doi.org/10.1111/ele.13098, 2018.
Araza, A., De Bruin, S., Herold, M., Quegan, S., Labriere, N., Rodriguez-Veiga, P., Avitabile, V., Santoro, M., Mitchard, E. T. A., Ryan, C. M., Phillips, O. L., Willcock, S., Verbeeck, H., Carreiras, J., Hein, L., Schelhaas, M.-J., Pacheco-Pascagaza, A. M., Da Conceição Bispo, P., Laurin, G. V., Vieilledent, G., Slik, F., Wijaya, A., Lewis, S. L., Morel, A., Liang, J., Sukhdeo, H., Schepaschenko, D., Cavlovic, J., Gilani, H., and Lucas, R.: A comprehensive framework for assessing the accuracy and uncertainty of global above-ground biomass maps, Remote Sensing of Environment, 272, 112917, https://doi.org/10.1016/j.rse.2022.112917, 2022.
Avitabile, V., Herold, M., Heuvelink, G. B. M., Lewis, S. L., Phillips, O. L., Asner, G. P., Armston, J., Ashton, P. S., Banin, L., Bayol, N., Berry, N. J., Boeckx, P., De Jong, B. H. J., DeVries, B., Girardin, C. A. J., Kearsley, E., Lindsell, J. A., Lopez-Gonzalez, G., Lucas, R., Malhi, Y., Morel, A., Mitchard, E. T. A., Nagy, L., Qie, L., Quinones, M. J., Ryan, C. M., Ferry, S. J. W., Sunderland, T., Laurin, G. V., Gatti, R. C., Valentini, R., Verbeeck, H., Wijaya, A., and Willcock, S.: An integrated pan-tropical biomass map using multiple reference datasets, Global Change Biology, 22, 1406–1420, https://doi.org/10.1111/gcb.13139, 2016.
Babcock, C., Finley, A. O., Cook, B. D., Weiskittel, A., and Woodall, C. W.: Modeling forest biomass and growth: Coupling long-term inventory and LiDAR data, Remote Sensing of Environment, 182, 1–12, https://doi.org/10.1016/j.rse.2016.04.014, 2016.
Baccini, A., Goetz, S. J., Walker, W. S., Laporte, N. T., Sun, M., Sulla-Menashe, D., Hackler, J., Beck, P. S. A., Dubayah, R., Friedl, M. A., Samanta, S., and Houghton, R. A.: Estimated carbon dioxide emissions from tropical deforestation improved by carbon-density maps, Nature Clim. Change, 2, 182–185, https://doi.org/10.1038/nclimate1354, 2012.
Bi, W., He, W., Zhou, Y., Ju, W., Liu, Y., Liu, Y., Zhang, X., Wei, X., and Cheng, N.: A global 0.05° dataset for gross primary production of sunlit and shaded vegetation canopies from 1992 to 2020, Sci. Data, 9, 213, https://doi.org/10.1038/s41597-022-01309-2, 2022.
Cai, Y., Li, X., Zhang, M., and Lin, H.: Mapping wetland using the object-based stacked generalization method based on multi-temporal optical and SAR data, International Journal of Applied Earth Observation and Geoinformation, 92, 102164, https://doi.org/10.1016/j.jag.2020.102164, 2020.
Cai, Y., Xu, X., Zhu, P., Nie, S., Wang, C., Xiong, Y., and Liu, X.: Unveiling spatiotemporal tree cover patterns in China: The first 30 m annual tree cover mapping from 1985 to 2023, ISPRS J. Photogramm. Remote Sens., https://doi.org/10.1016/j.isprsjprs.2024.08.001, 2024.
Cai, Y., Zhu, P., Xu, X., Li, X., Zhang, H., Nie, S., Wang, C., Wang, J., Shen, Q., Wu, C., Li, B., Liu, X., and Chen, Y.: CFATD: The First High-Spatiotemporal-Resolution Mapping of Forest Aboveground Biomass in China from 1985 to 2023 (Part I: 1985–1993), Zenodo [data set], https://doi.org/10.5281/zenodo.12620984, 2025a.
Cai, Y., Zhu, P., Xu, X., Li, X., Zhang, H., Nie, S., Wang, C., Wang, J., Shen, Q., Wu, C., Li, B., Liu, X., and Chen, Y.: CFATD: The First High-Spatiotemporal-Resolution Mapping of Forest Aboveground Biomass in China from 1985 to 2023 (Part II: 1994–2001), Zenodo [data set], https://doi.org/10.5281/zenodo.12637101, 2025b.
Cai, Y., Zhu, P., Xu, X., Li, X., Zhang, H., Nie, S., Wang, C., Wang, J., Shen, Q., Wu, C., Li, B., Liu, X., and Chen, Y.: CFATD: The First High-Spatiotemporal-Resolution Mapping of Forest Aboveground Biomass in China from 1985 to 2023 (Part III: 2002–2008), Zenodo [data set], https://doi.org/10.5281/zenodo.12655492, 2025c.
Cai, Y., Zhu, P., Xu, X., Li, X., Zhang, H., Nie, S., Wang, C., Wang, J., Shen, Q., Wu, C., Li, B., Liu, X., and Chen, Y.: CFATD: The First High-Spatiotemporal-Resolution Mapping of Forest Aboveground Biomass in China from 1985 to 2023 (Part IV: 2009–2015), Zenodo [data set], https://doi.org/10.5281/zenodo.12658255, 2025d.
Cai, Y., Zhu, P., Xu, X., Li, X., Zhang, H., Nie, S., Wang, C., Wang, J., Shen, Q., Wu, C., Li, B., Liu, X., and Chen, Y.: CFATD: The First High-Spatiotemporal-Resolution Mapping of Forest Aboveground Biomass in China from 1985 to 2023 (Part V: 2016–2021), Zenodo [data set], https://doi.org/10.5281/zenodo.12742210, 2025e.
Cai, Y., Zhu, P., Xu, X., Li, X., Zhang, H., Nie, S., Wang, C., Wang, J., Shen, Q., Wu, C., Li, B., Liu, X., and Chen, Y.: CFATD: The First High-Spatiotemporal-Resolution Mapping of Forest Aboveground Biomass in China from 1985 to 2023 (Part VI: 2022–2023), Zenodo [data set], https://doi.org/10.5281/zenodo.12747329, 2025f.
Cai, Y., Li, X., Zhu, P., Nie, S., Wang, C., Liu, X., and Chen, Y.: China Earth Observation Data Cube: The 30-m Seamless Annual Leaf-On Landsat Composites from 1985 to 2023, J. Remote Sens., 5, 0698, https://doi.org/10.34133/remotesensing.0698, 2025g.
Cairns, M. A., Brown, S., Helmer, E. H., and Baumgardner, G. A.: Root biomass allocation in the world's upland forests, Oecologia, 111, 1–11, https://doi.org/10.1007/s004420050201, 1997.
Chen, Y., Feng, X., Fu, B., Ma, H., Zohner, C. M., Crowther, T. W., Huang, Y., Wu, X., and Wei, F.: Maps with 1 km resolution reveal increases in above- and belowground forest biomass carbon pools in China over the past 20 years, Earth Syst. Sci. Data, 15, 897–910, https://doi.org/10.5194/essd-15-897-2023, 2023.
Chung, Y. and Neiswanger, W.: Beyond pinball loss: Quantile methods for calibrated uncertainty quantification, Advances in Neural Information Processing Systems, 34, 10971–10984, https://https://proceedings.neurips.cc/paper_files/paper/2021/file/5b168fdba5ee5ea262cc2d4c0b457697-Paper.pdf (last access: 12 June 2021.
Coops, N. C., Tompalski, P., Goodbody, T. R. H., Queinnec, M., Luther, J. E., Bolton, D. K., White, J. C., Wulder, M. A., Van Lier, O. R., and Hermosilla, T.: Modelling lidar-derived estimates of forest attributes over space and time: A review of approaches and future trends, Remote Sensing of Environment, 260, 112477, https://doi.org/10.1016/j.rse.2021.112477, 2021.
Davidson, E. A. and Janssens, I. A.: Temperature sensitivity of soil carbon decomposition and feedbacks to climate change, Nature, 440, 165–173, https://doi.org/10.1038/nature04514, 2006.
Dixon, D. J., Zhu, Y., and Jin, Y.: Canopy height estimation from PlanetScope time series with spatio-temporal deep learning, Remote Sensing of Environment, 318, 114518, https://doi.org/10.1016/j.rse.2024.114518, 2025.
Duncanson, L., Kellner, J. R., Armston, J., Dubayah, R., Minor, D. M., Hancock, S., Healey, S. P., Patterson, P. L., Saarela, S., Marselis, S., Silva, C. E., Bruening, J., Goetz, S. J., Tang, H., Hofton, M., Blair, B., Luthcke, S., Fatoyinbo, L., Abernethy, K., Alonso, A., Andersen, H.-E., Aplin, P., Baker, T. R., Barbier, N., Bastin, J. F., Biber, P., Boeckx, P., Bogaert, J., Boschetti, L., Boucher, P. B., Boyd, D. S., Burslem, D. F. R. P., Calvo-Rodriguez, S., Chave, J., Chazdon, R. L., Clark, D. B., Clark, D. A., Cohen, W. B., Coomes, D. A., Corona, P., Cushman, K. C., Cutler, M. E. J., Dalling, J. W., Dalponte, M., Dash, J., de-Miguel, S., Deng, S., Ellis, P. W., Erasmus, B., Fekety, P. A., Fernandez-Landa, A., Ferraz, A., Fischer, R., Fisher, A. G., García-Abril, A., Gobakken, T., Hacker, J. M., Heurich, M., Hill, R. A., Hopkinson, C., Huang, H., Hubbell, S. P., Hudak, A. T., Huth, A., Imbach, B., Jeffery, K. J., Katoh, M., Kearsley, E., Kenfack, D., Kljun, N., Knapp, N., Král, K., Krůček, M., Labrière, N., Lewis, S. L., Longo, M., Lucas, R. M., Main, R., Manzanera, J. A., Vásquez Martínez, R., Mathieu, R., Memiaghe, H., Meyer, V., Monteagudo Mendoza, A., Monerris, A., Montesano, P., Morsdorf, F., Næsset, E., Naidoo, L., Nilus, R., O’Brien, M., Orwig, D. A., Papathanassiou, K., Parker, G., Philipson, C., Phillips, O. L., Pisek, J., Poulsen, J. R., Pretzsch, H., Rüdiger, C., Saatchi, S., Sanchez-Azofeifa, A., Sanchez-Lopez, N., Scholes, R., Silva, C. A., Simard, M., Skidmore, A., Stereńczak, K., Tanase, M., Torresan, C., Valbuena, R., Verbeeck, H., Vrska, T., Wessels, K., White, J. C., White, L. J. T., Zahabu, E., and Zgraggen, C.: The Importance of Consistent Global Forest Aboveground Biomass Product Validation, Surv. Geophys., 40, 979–999, https://doi.org/10.1007/s10712-019-09538-8, 2019.
Duncanson, L., Kellner, J. R., Armston, J., Dubayah, R., Minor, D. M., Hancock, S., Healey, S. P., Patterson, P. L., Saarela, S., Marselis, S., Silva, C. E., Bruening, J., Goetz, S. J., Tang, H., Hofton, M., Blair, B., Luthcke, S., Fatoyinbo, L., Abernethy, K., Alonso, A., Andersen, H.-E., Aplin, P., Baker, T. R., Barbier, N., Bastin, J. F., Biber, P., Boeckx, P., Bogaert, J., Boschetti, L., Boucher, P. B., Boyd, D. S., Burslem, D. F. R. P., Calvo-Rodriguez, S., Chave, J., Chazdon, R. L., Clark, D. B., Clark, D. A., Cohen, W. B., Coomes, D. A., Corona, P., Cushman, K. C., Cutler, M. E. J., Dalling, J. W., Dalponte, M., Dash, J., de-Miguel, S., Deng, S., Ellis, P. W., Erasmus, B., Fekety, P. A., Fernandez-Landa, A., Ferraz, A., Fischer, R., Fisher, A. G., García-Abril, A., Gobakken, T., Hacker, J. M., Heurich, M., Hill, R. A., Hopkinson, C., Huang, H., Hubbell, S. P., Hudak, A. T., Huth, A., Imbach, B., Jeffery, K. J., Katoh, M., Kearsley, E., Kenfack, D., Kljun, N., Knapp, N., Král, K., Krůček, M., Labrière, N., Lewis, S. L., Longo, M., Lucas, R. M., Main, R., Manzanera, J. A., Martínez, R. V., Mathieu, R., Memiaghe, H., Meyer, V., Mendoza, A. M., Monerris, A., Montesano, P., Morsdorf, F., Næsset, E., Naidoo, L., Nilus, R., O'Brien, M., Orwig, D. A., Papathanassiou, K., Parker, G., Philipson, C., Phillips, O. L., Pisek, J., Poulsen, J. R., Pretzsch, H., Rüdiger, C., Saatchi, S., Sanchez-Azofeifa, A., Sanchez-Lopez, N., Scholes, R., Silva, C. A., Simard, M., Skidmore, A., Stereńczak, K., Tanase, M., Torresan, C., Valbuena, R., Verbeeck, H., Vrska, T., Wessels, K., White, J. C., White, L. J. T., Zahabu, E., and Zgraggen, C.: Aboveground biomass density models for NASA's Global Ecosystem Dynamics Investigation (GEDI) lidar mission, Remote Sensing of Environment, 270, 112845, https://doi.org/10.1016/j.rse.2021.112845, 2022.
Fang, H., Fan, L., Ciais, P., Xiao, J., Fensholt, R., Chen, J., Frappart, F., Ju, W., Niu, S., Xiao, X., Yuan, W., Xia, J., Li, X., Liu, L., Qin, Y., Chang, Z., Yu, L., Dong, G., Cui, T., Li, X., and Wigneron, J.-P.: Satellite-based monitoring of China's above-ground biomass carbon sink from 2015 to 2021, Agricultural and Forest Meteorology, 356, 110172, https://doi.org/10.1016/j.agrformet.2024.110172, 2024.
Fang, J., Chen, A., Peng, C., Zhao, S., and Ci, L.: Changes in forest biomass carbon storage in China between 1949 and 1998, Science, 292, 2320–2322, https://doi.org/10.1126/science.1058629, 2001.
Fang, J., Oikawa, T., Kato, T., Mo, W., and Wang, Z.: Biomass carbon accumulation by Japan's forests from 1947 to 1995, Global Biogeochemical Cycles, 19, 2004GB002253, https://doi.org/10.1029/2004GB002253, 2005.
FAO: Global forest resources assessment 2020: Main report, Food and Agriculture Organization of the United Nations, Rome, https://doi.org/10.4060/ca9825en, 2020.
Fu, Y., Li, R., Zhu, Z., Xue, Y., Ding, H., Wang, X., Na, J., and Xia, W.: SCARF: A new algorithm for continuous prediction of biomass dynamics using machine learning and Landsat time series, Remote Sensing of Environment, 314, 114348, https://doi.org/10.1016/j.rse.2024.114348, 2024.
H. Nguyen, T., Jones, S., Soto-Berelov, M., Haywood, A., and Hislop, S.: Landsat time-series for estimating forest aboveground biomass and its dynamics across space and time: A Review, Remote Sensing, 12, 98, https://doi.org/10.3390/rs12010098, 2019.
Harris, N. L., Gibbs, D. A., Baccini, A., Birdsey, R. A., De Bruin, S., Farina, M., Fatoyinbo, L., Hansen, M. C., Herold, M., Houghton, R. A., Potapov, P. V., Suarez, D. R., Roman-Cuesta, R. M., Saatchi, S. S., Slay, C. M., Turubanova, S. A., and Tyukavina, A.: Global maps of twenty-first century forest carbon fluxes, Nat. Clim. Chang., 11, 234–240, https://doi.org/10.1038/s41558-020-00976-6, 2021.
He, K., Zhang, X., Ren, S., and Sun, J.: Deep residual learning for image recognition, in: 2016 IEEE Conference on Computer Vision and Pattern Recognition (CVPR), 2016 IEEE Conference on Computer Vision and Pattern Recognition (CVPR), Las Vegas, NV, USA, 9997 citations (Semantic Scholar/DOI) [2024-08-17], 770–778, https://doi.org/10.1109/CVPR.2016.90, 2016.
Hengeveld, G. M., Gunia, K., Didion, M., Zudin, S., Clerkx, A. P. P. M., and Schelhaas, M. J.: Global 1-degree Maps of Forest Area, Carbon Stocks, and Biomass, 1950–2010, ORNL DAAC [data set], https://doi.org/10.3334/ORNLDAAC/1296, 2015.
Hu, T., Su, Y., Xue, B., Liu, J., Zhao, X., Fang, J., and Guo, Q.: Mapping global forest aboveground biomass with spaceborne LiDAR, optical imagery, and forest inventory data, Remote Sensing, 8, 565, https://doi.org/10.3390/rs8070565, 2016.
Huy, B., Truong, N. Q., Khiem, N. Q., Poudel, K. P., and Temesgen, H.: Deep learning models for improved reliability of tree aboveground biomass prediction in the tropical evergreen broadleaf forests, Forest Ecology and Management, 508, 120031, https://doi.org/10.1016/j.foreco.2022.120031, 2022.
Kellner, J. R., Armston, J., and Duncanson, L.: Algorithm theoretical basis document for GEDI footprint aboveground biomass density, Earth and Space Science, 10, e2022EA002516, https://doi.org/10.1029/2022EA002516, 2023.
Laffitte, B., Zhou, T., Yang, Z., Ciais, P., Jian, J., Huang, N., Seyler, B. C., Pei, X., and Tang, X.: Timescale Matters: Finer Temporal Resolution Influences Driver Contributions to Global Soil Respiration, Global Change Biology, 31, e70118, https://doi.org/10.1111/gcb.70118, 2025.
Le Toan, T., Quegan, S., Davidson, M. W. J., Balzter, H., Paillou, P., Papathanassiou, K., Plummer, S., Rocca, F., Saatchi, S., Shugart, H., and Ulander, L.: The BIOMASS mission: Mapping global forest biomass to better understand the terrestrial carbon cycle, Remote Sensing of Environment, 115, 2850–2860, https://doi.org/10.1016/j.rse.2011.03.020, 2011.
Liu, J., Li, S., Ouyang, Z., Tam, C., and Chen, X.: Ecological and socioeconomic effects of China's policies for ecosystem services, Proceedings of the National Academy of Sciences, 105, 9477–9482, https://doi.org/10/fm83c9, 2008.
Liu, Y. Y., Van Dijk, A. I. J. M., De Jeu, R. A. M., Canadell, J. G., McCabe, M. F., Evans, J. P., and Wang, G.: Recent reversal in loss of global terrestrial biomass, Nature Clim. Change, 5, 470–474, https://doi.org/10.1038/nclimate2581, 2015.
Lu, D., Chen, Q., Wang, G., Liu, L., Li, G., and Moran, E.: A survey of remote sensing-based aboveground biomass estimation methods in forest ecosystems, International Journal of Digital Earth, 9, 63–105, https://doi.org/10.1080/17538947.2014.990526, 2016.
Lu, F., Hu, H., Sun, W., Zhu, J., Liu, G., Zhou, W., Zhang, Q., Shi, P., Liu, X., Wu, X., Zhang, L., Wei, X., Dai, L., Zhang, K., Sun, Y., Xue, S., Zhang, W., Xiong, D., Deng, L., Liu, B., Zhou, L., Zhang, C., Zheng, X., Cao, J., Huang, Y., He, N., Zhou, G., Bai, Y., Xie, Z., Tang, Z., Wu, B., Fang, J., Liu, G., and Yu, G.: Effects of national ecological restoration projects on carbon sequestration in China from 2001 to 2010, Proceedings of the National Academy of Sciences, 115, 4039–4044, https://doi.org/10/gdfsgr, 2018.
Luo, Y., Zhang, X., Wang, X., and Lu, F.: Biomass and its allocation of Chinese forest ecosystems: Ecological Archives E095–177, Ecology, 95, 2026–2026, https://doi.org/10.1890/13-2089.1, 2014.
Matasci, G., Hermosilla, T., Wulder, M. A., White, J. C., Coops, N. C., Hobart, G. W., and Zald, H. S. J.: Large-area mapping of Canadian boreal forest cover, height, biomass and other structural attributes using Landsat composites and lidar plots, Remote Sensing of Environment, 209, 90–106, https://doi.org/10.1016/j.rse.2017.12.020, 2018.
Moesinger, L., Dorigo, W., de Jeu, R., van der Schalie, R., Scanlon, T., Teubner, I., and Forkel, M.: The global long-term microwave Vegetation Optical Depth Climate Archive (VODCA), Earth Syst. Sci. Data, 12, 177–196, https://doi.org/10.5194/essd-12-177-2020, 2020.
Pan, Y., Birdsey, R. A., Phillips, O. L., Houghton, R. A., Fang, J., Kauppi, P. E., Keith, H., Kurz, W. A., Ito, A., Lewis, S. L., Nabuurs, G.-J., Shvidenko, A., Hashimoto, S., Lerink, B., Schepaschenko, D., Castanho, A., and Murdiyarso, D.: The enduring world forest carbon sink, Nature, 631, 563–569, https://doi.org/10.1038/s41586-024-07602-x, 2024.
Piao, S., Fang, J., Zhu, B., and Tan, K.: Forest biomass carbon stocks in China over the past 2 decades: Estimation based on integrated inventory and satellite data, J. Geophys. Res., 110, 2005JG000014, https://doi.org/10.1029/2005JG000014, 2005.
Piao, S., Fang, J., Ciais, P., Peylin, P., Huang, Y., Sitch, S., and Wang, T.: The carbon balance of terrestrial ecosystems in China, Nature, 458, 1009–1013, https://doi.org/10.1038/nature07944, 2009.
Quegan, S., Le Toan, T., Chave, J., Dall, J., Exbrayat, J.-F., Minh, D. H. T., Lomas, M., D'Alessandro, M. M., Paillou, P., Papathanassiou, K., Rocca, F., Saatchi, S., Scipal, K., Shugart, H., Smallman, T. L., Soja, M. J., Tebaldini, S., Ulander, L., Villard, L., and Williams, M.: The European Space Agency BIOMASS mission: Measuring forest above-ground biomass from space, Remote Sensing of Environment, 227, 44–60, https://doi.org/10.1016/j.rse.2019.03.032, 2019.
Réjou-Méchain, M., Barbier, N., Couteron, P., Ploton, P., Vincent, G., Herold, M., Mermoz, S., Saatchi, S., Chave, J., De Boissieu, F., Féret, J.-B., Takoudjou, S. M., and Pélissier, R.: Upscaling Forest Biomass from Field to Satellite Measurements: Sources of Errors and Ways to Reduce Them, Surv. Geophys., 40, 881–911, https://doi.org/10.1007/s10712-019-09532-0, 2019.
Rodríguez-Veiga, P., Quegan, S., Carreiras, J., Persson, H. J., Fransson, J. E. S., Hoscilo, A., Ziółkowski, D., Stereńczak, K., Lohberger, S., Stängel, M., Berninger, A., Siegert, F., Avitabile, V., Herold, M., Mermoz, S., Bouvet, A., Le Toan, T., Carvalhais, N., Santoro, M., Cartus, O., Rauste, Y., Mathieu, R., Asner, G. P., Thiel, C., Pathe, C., Schmullius, C., Seifert, F. M., Tansey, K., and Balzter, H.: Forest biomass retrieval approaches from earth observation in different biomes, International Journal of Applied Earth Observation and Geoinformation, 77, 53–68, https://doi.org/10.1016/j.jag.2018.12.008, 2019.
Roy, D. P., Kovalskyy, V., Zhang, H. K., Vermote, E. F., Yan, L., Kumar, S. S., and Egorov, A.: Characterization of Landsat-7 to Landsat-8 reflective wavelength and normalized difference vegetation index continuity, Remote Sens. Environ., 185, 57–70, https://doi.org/10.1016/j.rse.2015.12.024, 2016.
Santoro, M., Cartus, O., Carvalhais, N., Rozendaal, D. M. A., Avitabile, V., Araza, A., de Bruin, S., Herold, M., Quegan, S., Rodríguez-Veiga, P., Balzter, H., Carreiras, J., Schepaschenko, D., Korets, M., Shimada, M., Itoh, T., Moreno Martínez, Á., Cavlovic, J., Cazzolla Gatti, R., da Conceição Bispo, P., Dewnath, N., Labrière, N., Liang, J., Lindsell, J., Mitchard, E. T. A., Morel, A., Pacheco Pascagaza, A. M., Ryan, C. M., Slik, F., Vaglio Laurin, G., Verbeeck, H., Wijaya, A., and Willcock, S.: The global forest above-ground biomass pool for 2010 estimated from high-resolution satellite observations, Earth Syst. Sci. Data, 13, 3927–3950, https://doi.org/10.5194/essd-13-3927-2021, 2021.
Sen, P. K.: Estimates of the regression coefficient based on Kendall's Tau, Journal of the American Statistical Association, 63, 1379–1389, https://doi.org/10.1080/01621459.1968.10480934, 1968.
Shendryk, Y.: Fusing GEDI with earth observation data for large area aboveground biomass mapping, International Journal of Applied Earth Observation and Geoinformation, 115, 103108, https://doi.org/10.1016/j.jag.2022.103108, 2022.
Sitch, S., Huntingford, C., Gedney, N., Levy, P. E., Lomas, M., Piao, S. L., Betts, R., Ciais, P., Cox, P., Friedlingstein, P., Jones, C. D., Prentice, I. C., and Woodward, F. I.: Evaluation of the terrestrial carbon cycle, future plant geography and climate-carbon cycle feedbacks using five Dynamic Global Vegetation Models (DGVMs), Global Change Biology, 14, 2015–2039, https://doi.org/10.1111/j.1365-2486.2008.01626.x, 2008.
Su, Y., Guo, Q., Xue, B., Hu, T., Alvarez, O., Tao, S., and Fang, J.: Spatial distribution of forest aboveground biomass in China: Estimation through combination of spaceborne lidar, optical imagery, and forest inventory data, Remote Sensing of Environment, 173, 187–199, https://doi.org/10.1016/j.rse.2015.12.002, 2016.
Usoltsev, V. A.: Eurasian forest biomass and primary production data, Ural Branch of Russian Academy of Sciences, Yekaterinburg, 570 pp., https://elar.usfeu.ru/handle/123456789/3059 (last access: 3 May 2024), 2010.
Wang, J., Feng, L., Palmer, P. I., Liu, Y., Fang, S., Bösch, H., O'Dell, C. W., Tang, X., Yang, D., Liu, L., and Xia, C.: Large Chinese land carbon sink estimated from atmospheric carbon dioxide data, Nature, 586, 720–723, https://doi.org/10.1038/s41586-020-2849-9, 2020.
Wulder, M. A., Hermosilla, T., White, J. C., and Coops, N. C.: Biomass status and dynamics over Canada's forests: Disentangling disturbed area from associated aboveground biomass consequences, Environ. Res. Lett., 15, 094093, https://doi.org/10.1088/1748-9326/ab8b11, 2020.
Wulder, M. A., Roy, D. P., Radeloff, V. C., Loveland, T. R., Anderson, M. C., Johnson, D. M., Healey, S., Zhu, Z., Scambos, T. A., Pahlevan, N., Hansen, M., Gorelick, N., Crawford, C. J., Masek, J. G., Hermosilla, T., White, J. C., Belward, A. S., Schaaf, C., Woodcock, C. E., Huntington, J. L., Lymburner, L., Hostert, P., Gao, F., Lyapustin, A., Pekel, J.-F., Strobl, P., and Cook, B. D.: Fifty years of Landsat science and impacts, Remote Sens. Environ., 280, 113195, https://doi.org/10.1016/j.rse.2022.113195, 2022.
Xu, L., Saatchi, S. S., Yang, Y., Yu, Y., Pongratz, J., Bloom, A. A., Bowman, K., Worden, J., Liu, J., Yin, Y., Domke, G., McRoberts, R. E., Woodall, C., Nabuurs, G.-J., de-Miguel, S., Keller, M., Harris, N., Maxwell, S., and Schimel, D.: Changes in global terrestrial live biomass over the 21st century, Sci. Adv., 7, eabe9829, https://doi.org/10.1126/sciadv.abe9829, 2021.
Yang, J. and Huang, X.: The 30 m annual land cover dataset and its dynamics in China from 1990 to 2019, Earth Syst. Sci. Data, 13, 3907–3925, https://doi.org/10.5194/essd-13-3907-2021, 2021.
Yang, Q., Niu, C., Liu, X., Feng, Y., Ma, Q., Wang, X., Tang, H., and Guo, Q.: Mapping high-resolution forest aboveground biomass of China using multisource remote sensing data, GIScience & Remote Sensing, 60, 2203303, https://doi.org/10.1080/15481603.2023.2203303, 2023.
Yu, Z., Ciais, P., Piao, S., Houghton, R. A., Lu, C., Tian, H., Agathokleous, E., Kattel, G. R., Sitch, S., Goll, D., Yue, X., Walker, A., Friedlingstein, P., Jain, A. K., Liu, S., and Zhou, G.: Forest expansion dominates China's land carbon sink since 1980, Nat. Commun., 13, 5374, https://doi.org/10.1038/s41467-022-32961-2, 2022.
Zarin, D. J., Harris, N. L., Baccini, A., Aksenov, D., Hansen, M. C., Azevedo-Ramos, C., Azevedo, T., Margono, B. A., Alencar, A. C., Gabris, C., Allegretti, A., Potapov, P., Farina, M., Walker, W. S., Shevade, V. S., Loboda, T. V., Turubanova, S., and Tyukavina, A.: Can carbon emissions from tropical deforestation drop by 50 % in 5 years?, Global Change Biology, 22, 1336–1347, https://doi.org/10.1111/gcb.13153, 2016.
Zeng, W., Chen, X., and Yang, X.: Estimating changes of forest carbon storage in China for 70 years (1949–2018), Sci. Rep., 13, 16864, https://doi.org/10.1038/s41598-023-44097-4, 2023.
Zhang, R., Zhou, X., Ouyang, Z., Avitabile, V., Qi, J., Chen, J., and Giannico, V.: Estimating aboveground biomass in subtropical forests of China by integrating multisource remote sensing and ground data, Remote Sensing of Environment, 232, 111341, https://doi.org/10.1016/j.rse.2019.111341, 2019.
Zhu, Z., Wang, S., and Woodcock, C. E.: Improvement and expansion of the Fmask algorithm: Cloud, cloud shadow, and snow detection for Landsats 4–7, 8, and Sentinel 2 images, Remote Sens. Environ., 159, 269–277, https://doi.org/10.1016/j.rse.2014.12.014, 2015.
Zotta, R.-M., Moesinger, L., van der Schalie, R., Vreugdenhil, M., Preimesberger, W., Frederikse, T., de Jeu, R., and Dorigo, W.: VODCA v2: multi-sensor, multi-frequency vegetation optical depth data for long-term canopy dynamics and biomass monitoring, Earth Syst. Sci. Data, 16, 4573–4617, https://doi.org/10.5194/essd-16-4573-2024, 2024.