the Creative Commons Attribution 4.0 License.
the Creative Commons Attribution 4.0 License.
 | 09 Dec 2025
Long-term hourly stream-water flux data to study the effects of forest management on solute transport processes at the catchment scale
Frank Herrmann
Andreas Lücke
Thomas Pütz
Harry Vereecken
A substantial body of knowledge concerning the functioning of catchments has been derived from the observation and quantification of solute and suspended matter fluxes in rivers. The Wüstebach catchment is a hydrological observatory that is part of the German TERENO (Terrestrial Environmental Observatories) network. In 2013, the Eifel National Park undertook a partial deforestation of the spruce forest with the objective of facilitating the regrowth of a natural forest. This data paper presents 16 years of estimated hourly stream-water flux data of nine continuously monitored macro- and micronutrients, as well as dissolved ionic aluminum and dissolved organic carbon (DOC), along with the measured solute concentrations and discharge rates observed in the Wüstebach catchment (from 2010 to 2024).
To estimate hourly stream-water fluxes from weekly manual grab samples and event autosampler data, we employed the R software package LOADFLEX, which implements a number of solute prediction methods, including regressions, interpolations, the period-weighted approach, and the more recently developed composite method. A comparison of the predicted nitrate concentrations with hourly nitrate reference data was conducted to assess the optimal prediction approach for the Wüstebach catchment. The analysis showed that the composite model is best suited to calculate the nitrate fluxes. Accordingly, this model was selected to calculate the fluxes of all considered macro- and micronutrients, dissolved aluminum and DOC. Flux data were compiled in the same way for a neighboring reference catchment with similar characteristics but without clear-cutting, in order to identify the effects of deforestation and afforestation on the cycling and transport of nutrients. We anticipate that this comprehensive data set will facilitate new insights into the influence of deforestation and afforestation on solute fluxes at the catchment scale. The dataset, entitled “Wüstebach data paper: Long-term hourly solute flux data 2010–2024”, is shared via Forschungszentrum Jülich: https://doi.org/10.26165/JUELICH-DATA/AKAMNQ (Bogena and Herrmann, 2025).
- Article
(12347 KB) - Full-text XML
- BibTeX
- EndNote


Stream discharge and dissolved concentrations of anions, cations and DOC determine how much solute mass is exported from catchments (Wang et al., 2024). In recent decades, a substantial body of research has been conducted to examine the impact of deforestation and extensive forest die-off on solute transport at the catchment scale, e.g. Keller, 1970; Feller, 2005; Mikkelson et al., 2013; Georgiev et al., 2021; Vilhar et al., 2022; Rajwa-Kuligiewicz and Bojarczuk, 2024. There is evidence that forest dieback is increasing due to climate change (Deuffic et al., 2020). For instance, following the successive 2018–2019 hot droughts, an extensive mortality event was observed in forests in Germany (Obladen et al., 2021; Xu et al., 2025), with serious consequences for the water quality of rivers (Musolff et al., 2024), reservoirs (Kong et al., 2022), and groundwater (Winter et al., 2025). Long-term data before and after forest clear-cut, in combination with water quality models, improve research into the effects of forest dieback and the subsequent recovery of forests (Chen et al., 2024; Musolff et al., 2024).
Nevertheless, there is still a notable lack of comprehensive long-term data sets of stream-water fluxes with high temporal resolution covering all important anions and cations and accompanying studies of the effects of forest dieback and clear-cut on the water and nutrient balance in a holistic approach (Mollenhauer et al., 2018). To address this research gap, a deforestation experiment was conducted in 2013 in the Wüstebach catchment (Bogena et al., 2015) as part of the German TERENO (Terrestrial Environmental Observatories) initiative (Zacharias et al., 2011, 2024) to investigate the solute flux response to the clear-cutting operation
Solute flux estimates are an indispensable element of whole-catchment manipulation experiments for many decades (e.g. Likens et al., 1970). The total solute flux for given period, ΦT, is the convolution of solute concentration C and discharge Q over time t (Aulenbach and Hooper, 2006):
Solving Eq. (1) requires continuous measurements of solute concentrations and discharge. While continuous discharge data (e.g. at 10 min resolution) is often available, solute concentrations are typically measured on a weekly or event basis as was the case in this study. A plethora of methods have been proposed to determine ΦT from discontinuous data including straightforward period-weighted means and linear and nonlinear statistical models (Birgand et al., 2010; Cox et al., 2008; Preston et al., 1989; Worrall et al., 2013). These methods are employed for the purpose of interpolating the actually measured solute concentrations to a higher temporal resolution (e.g. hourly). More sophisticated flux calculation methodologies have been incorporated into software applications, including FLUX (Walker, 1996), LOADEST (Runkel et al., 2004), and EGRET (Hirsch and De Cicco, 2015). The most comprehensive solute flux calculation software package to date is LOADFLEX (Appling et al., 2015), which includes several estimation models and an algorithm for estimating the prediction uncertainty. LOADFLEX has been used already for solute flux calculations in several studies, e.g. Brunet et al., 2021; Coble et al., 2018; Harley et al., 2023; McDowell et al., 2019.
In this data paper, we provide 16 years of hourly data on the fluxes of nine regularly monitored macro- and micronutrients, as well as dissolved ionic aluminum and DOC, in the Wüstebach catchment. This work also updates and expands on earlier solute flux calculations in the Wüstebach that were based only on simple weekly averages (Płaczkowska et al., 2022). To determine the most appropriate method for determining continuous solute concentrations, four well-known methods (i.e. rectangular interpolation, two regression models and a composite model) were applied to the example of nitrate and compared with high-resolution nitrate measurements taken in the Wüstebach stream over a period of two years. We also compared the results of the DOC flux predictions using the four methods. Finally, the composite model was used to determine all solute fluxes for the Wüstebach catchment and a neighboring reference catchment that was not affected by the clear-cutting.
The presented high-resolution flux data are of great importance as they reflect the effects of clear-cutting measures as well as climate change on the biogeochemical cycles in river catchments. Furthermore, these long-term data can also be interpreted in the context of the environmental observation data available within TERENO (e.g. land-surface-atmosphere exchange fluxes, soil water storage and chemistry, as well as vegetation properties).
The experimental Wüstebach headwater catchment (39 ha; WU14, Fig. 1) belongs to the Lower Rhine/Eifel Observatory of the TERENO network (Bogena et al., 2018; Zacharias et al., 2024) and is located in the Eifel National Park (50°30′16′′ N, 06°20′00′′ E). The area is predominantly covered by Norway spruce (Picea abis L.), with altitudes ranging from 595 to 628 m a.s.l. and an average slope of 3.6 %. The region belongs to the temperate oceanic climate (Cfb) according to the Köppen climate classification system, with an average annual temperature of approx. 7 °C and an average annual precipitation and runoff of approx. 1200 and 700 mm, respectively (Graf et al., 2014). The subsoil is composed of Devonian slate, which is overlayed by a periglacial solifluction layer with a maximum depth of 2 m. Cambisols and Planosols are typically found at groundwater distant sites, whereas Gleysols and Histosols have developed as a result of groundwater influence in the riparian zone of the valley (Fig. 1).
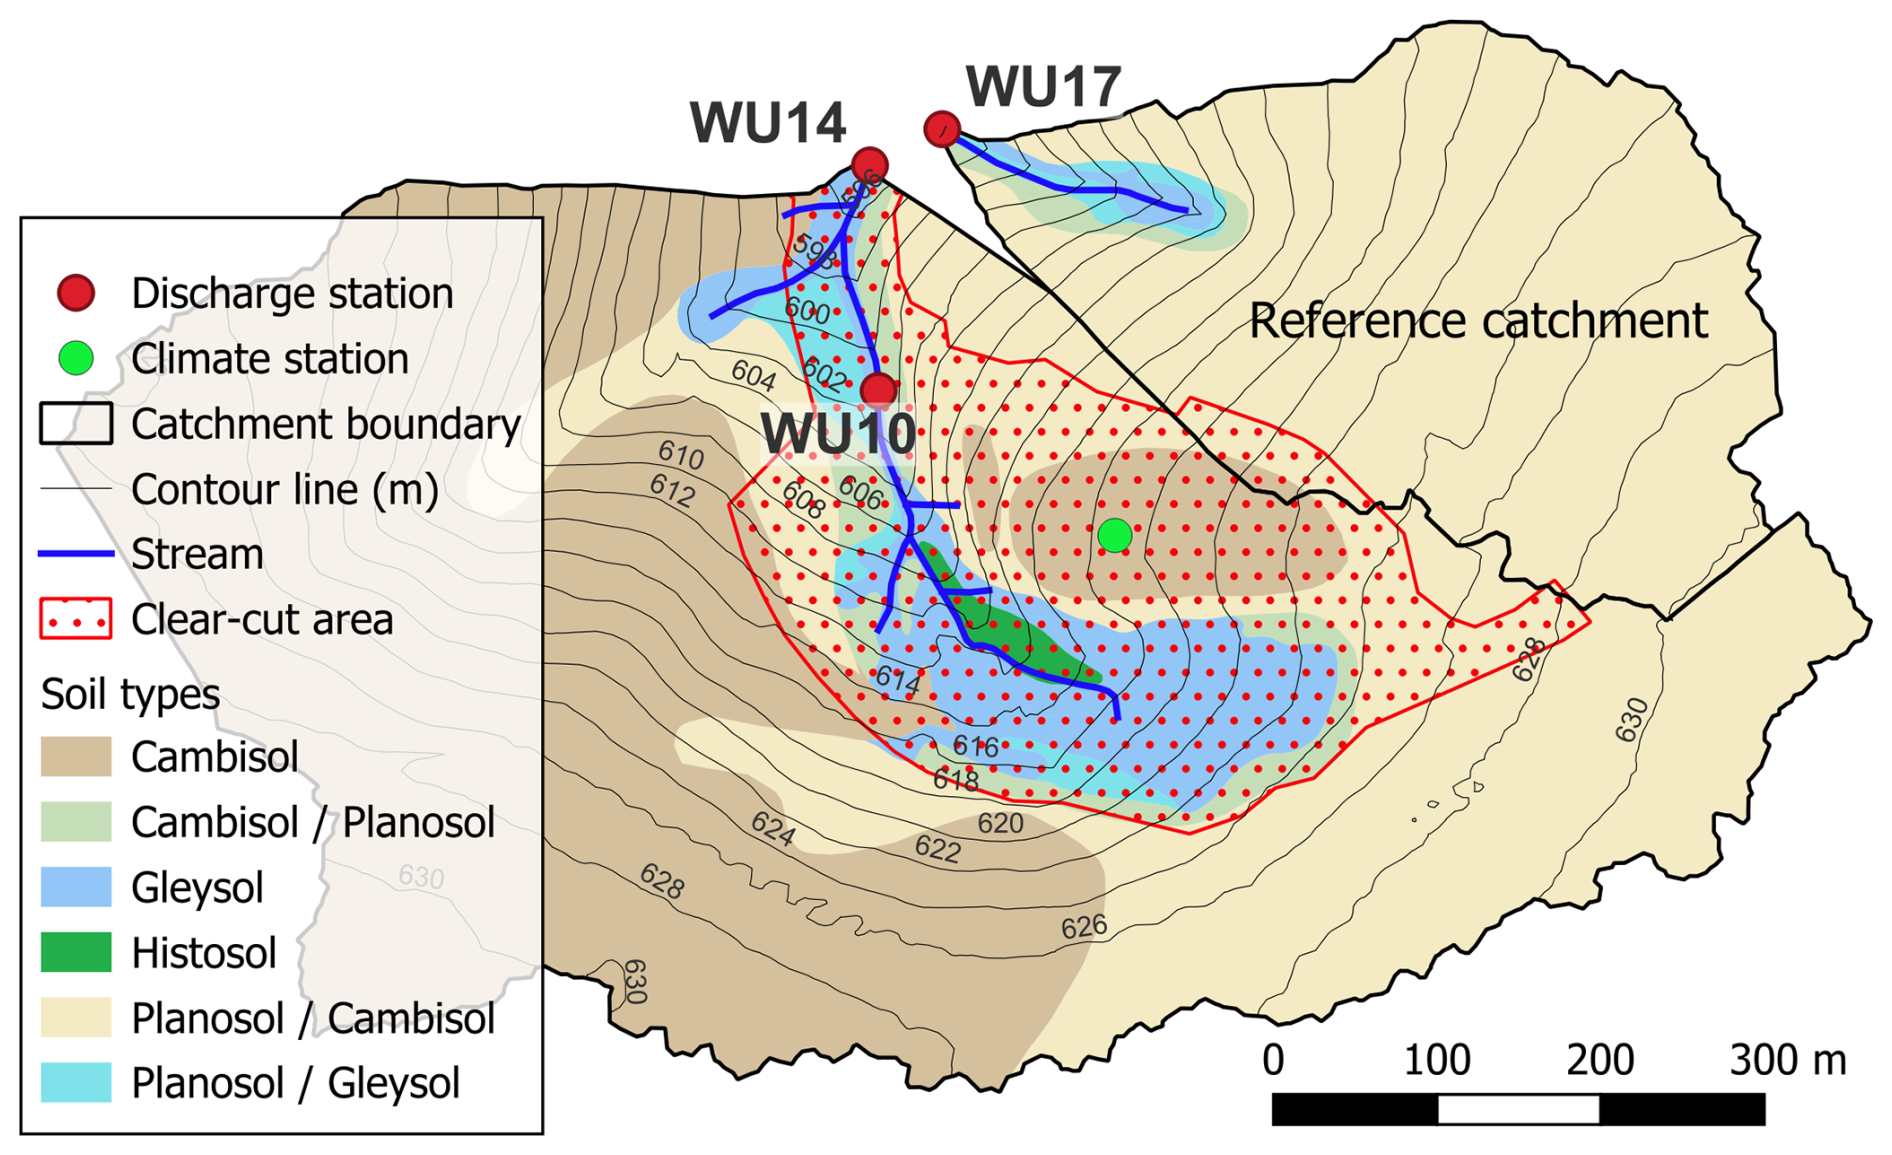
Figure 1Map showing the main soil types of the Wüstebach and reference catchments and the deforestation area. The contour lines and the locations of the climate station WU_K_2 and the discharge stations WU10, WU14 and WU17 are also shown (geographical coordinates of the stations are given in Table A2).
A smaller tributary catchment with similar characteristics serves as an undisturbed reference catchment for the clear-cut experiment (WU17, Fig. 1). The similarity, which is important to investigate the impact of deforestation on the hydrological system, was confirmed by comparing the runoff dynamics of both catchments before deforestation over a period of more than three years (Wiekenkamp et al., 2016a).
Between 2004 and 2024, a series of forest management measures were carried out in the catchment areas of the Wüstebach and reference streams to promote more near-natural and resilient forest stands (Table A1). Underplanting was applied repeatedly, with young beech trees planted beneath existing spruce canopies in multiple years across various parts of the catchments (Fig. A1). This approach supported natural regeneration and enhanced species diversity. Thinning was another frequently used measure, involving the selective removal of trees to reduce stand density and improve growth conditions for the remaining trees, with treated areas ranging from 5.25 to 12.2 ha. In addition, selective sanitation felling was performed in 2007 and 2020 to remove beetle-infested spruces and prevent further pest spread.
In 2013, a larger area was entirely cleared through clear-cutting, allowing for the regrowth of near-natural vegetation in the riparian zone. Within the clear-cut area, a fenced enclosure covering 1.98 ha was established in 2014 to protect young sycamore maple plantations from wildlife browsing (Fig. A1). Additionally, the removal of natural regeneration was carried out in 2013, 2016, and 2024 to eliminate unwanted spruce seedlings that could interfere with the establishment of near-natural vegetation.
By comparing the water balance components of the Wüstebach catchment (WU14) and the reference catchment (WU17) for the hydrological year 2012, which predates the deforestation measure and therefore represents undisturbed baseline conditions, we found that the initial assumption of an 11.5 ha catchment area for WU17, derived from a digital elevation model, resulted in an underestimation of runoff and an overestimation of evapotranspiration (Table A3). After re-evaluating the contributing area based on hydrological evidence, the catchment area was corrected to 7 ha. This adjustment resulted in a more consistent water balance, with evapotranspiration aligning well with eddy covariance measurements from the ICOS station DE-RuW (Table A3), thereby improving the accuracy of subsequent solute flux calculations on a per-unit-area basis.
Over the past two decades, the Wüstebach catchment has been the subject of intensive research, with a particular focus on hydrological (Bogena et al., 2010; Rosenbaum et al., 2012; Graf et al., 2014; Stockinger et al., 2014; Wiekenkamp et al., 2016b) and biogeochemical processes (Bol et al., 2015; Gottselig et al., 2017; Weigand et al., 2017). From August to September 2013, 8.6 ha of the Wüstebach catchment area were cleared in order to allow natural succession to a mixed forest to occur (Fig. 1).
More recently, studies investigated also the effects of the deforestation on hydrological and land surface processes in the Wüstebach catchment (Ney et al., 2019; Wiekenkamp et al., 2016a, 2019; Bogena et al., 2021; Wang et al., 2021; Robinson et al., 2022; Wang et al., 2022; Heistermann et al., 2022; Płaczkowska et al., 2022, 2024). The clear-cut measure has had a significant impact on the hydrological system of the Wüstebach catchment, affecting several key hydrological processes (Wiekenkamp et al., 2019). Following the clear-cutting, evapotranspiration was initially reduced by approximately 50 % and this decline was observed to subside and return towards pre-cut values during the first two years (Ney et al., 2019). Wiekenkamp et al. (2016a) observed that the reduction in evapotranspiration resulted in an increase in soil water content within the deforested catchment area during the initial two-year period following deforestation, particularly during the summer months. Furthermore, Wiekenkamp et al. (2019) revealed that the partial clear-cut resulted in an increase in the occurrence of preferential flow within the deforested area. In consequence, this has led to an increased frequency of high flows. Wang et al. (2022) and Robinson et al. (2022) investigated the deforestation effects on nutrient transport and found that following the clear-cut operation, there was a notable increase in DOC and nitrate concentration levels in stream water. For instance, for DOC, a 60 % increase was observed in the Wüstebach stream within the first two years after deforestation (Wang et al., 2022). In addition, Robinson et al. (2022) showed that stream water nutrient concentration levels increased following the clear-cutting operation, reaching a peak approximately two to three years later and subsequently returning to pre-deforestation levels after approximately five years.
3.1 Precipitation and discharge measurements
Precipitation is measured at the climate station WU_K_2 located in the clear-cut area (Fig. 1) using a weighing rain gauge (Pluvio2, Ott Hydromet GmbH, Kempten, Germany). Precipitation data which were not available at WU_K_2 (e.g. before the clear-cut) but used in this work for gap-filling came from the official climate station Kalterherberg (German Weather Service, DWD), which is located 8 km to the west at 535 m a.s.l. In a previous study, it was demonstrated that the precipitation data from climate station Kalterherberg are representative for the Wüstebach catchment (Graf et al., 2014).
Continuous stream discharge measurements were conducted at the outlets of the Wüstebach and control streams (WU14 and WU17) at a temporal resolution of 10 min. Data from another Wüstebach discharge station (WU10) was used for gap-filling. The low flow measurements are taken using a V-notch weir, while the medium to high flow measurements are taken using a Parshall flume (ecoTech Umwelt-Messsysteme GmbH, Germany). Both weir types employ a pressure sensor (PDL, ecoTech Umwelt-Messsysteme GmbH, Germany) to measure water level fluctuations at ten-minute intervals. The precision of these measurements is ±0.25 %. The water levels from the two discharge gauging weirs were converted into discharge values using well-established stage-discharge relationships. Subsequently, the two discharge datasets were combined based on the water levels measured in the V-notch weir: If the water level is below 5 cm, the discharge values derived from the V-notch weir are utilized. Conversely, when the water level is above 10 cm, the discharge values from the Parshall flume are employed. The weighted mean of both discharge values was then calculated for water levels between 5 and 10 cm (Bogena et al., 2015).
The measured discharge time-series have several gaps for technical reasons. Since a complete discharge record is necessary for solute load calculation, the data gaps were filled using a multi-tiered approach. First, the data gaps at WU14 were filled with the help of the data from WU10. The ratios of the discharge values at the two discharge stations were calculated for all times for which pairs of measurements were available. These ratios vary within a characteristic range. For periods without available discharge data at both stations, the ratios were linearly interpolated. Using the resulting gapless time-series of ratios as estimators, the gap-filling of the discharge values was performed. In a similar way, the gaps at WU17 were filled based on ratios to discharge values from WU14.
Figure 2 shows the gap-filled precipitation record as well as the gap-filled discharge hydrographs at WU14 and WU17 for the entire observation period from 2010 to 2024.
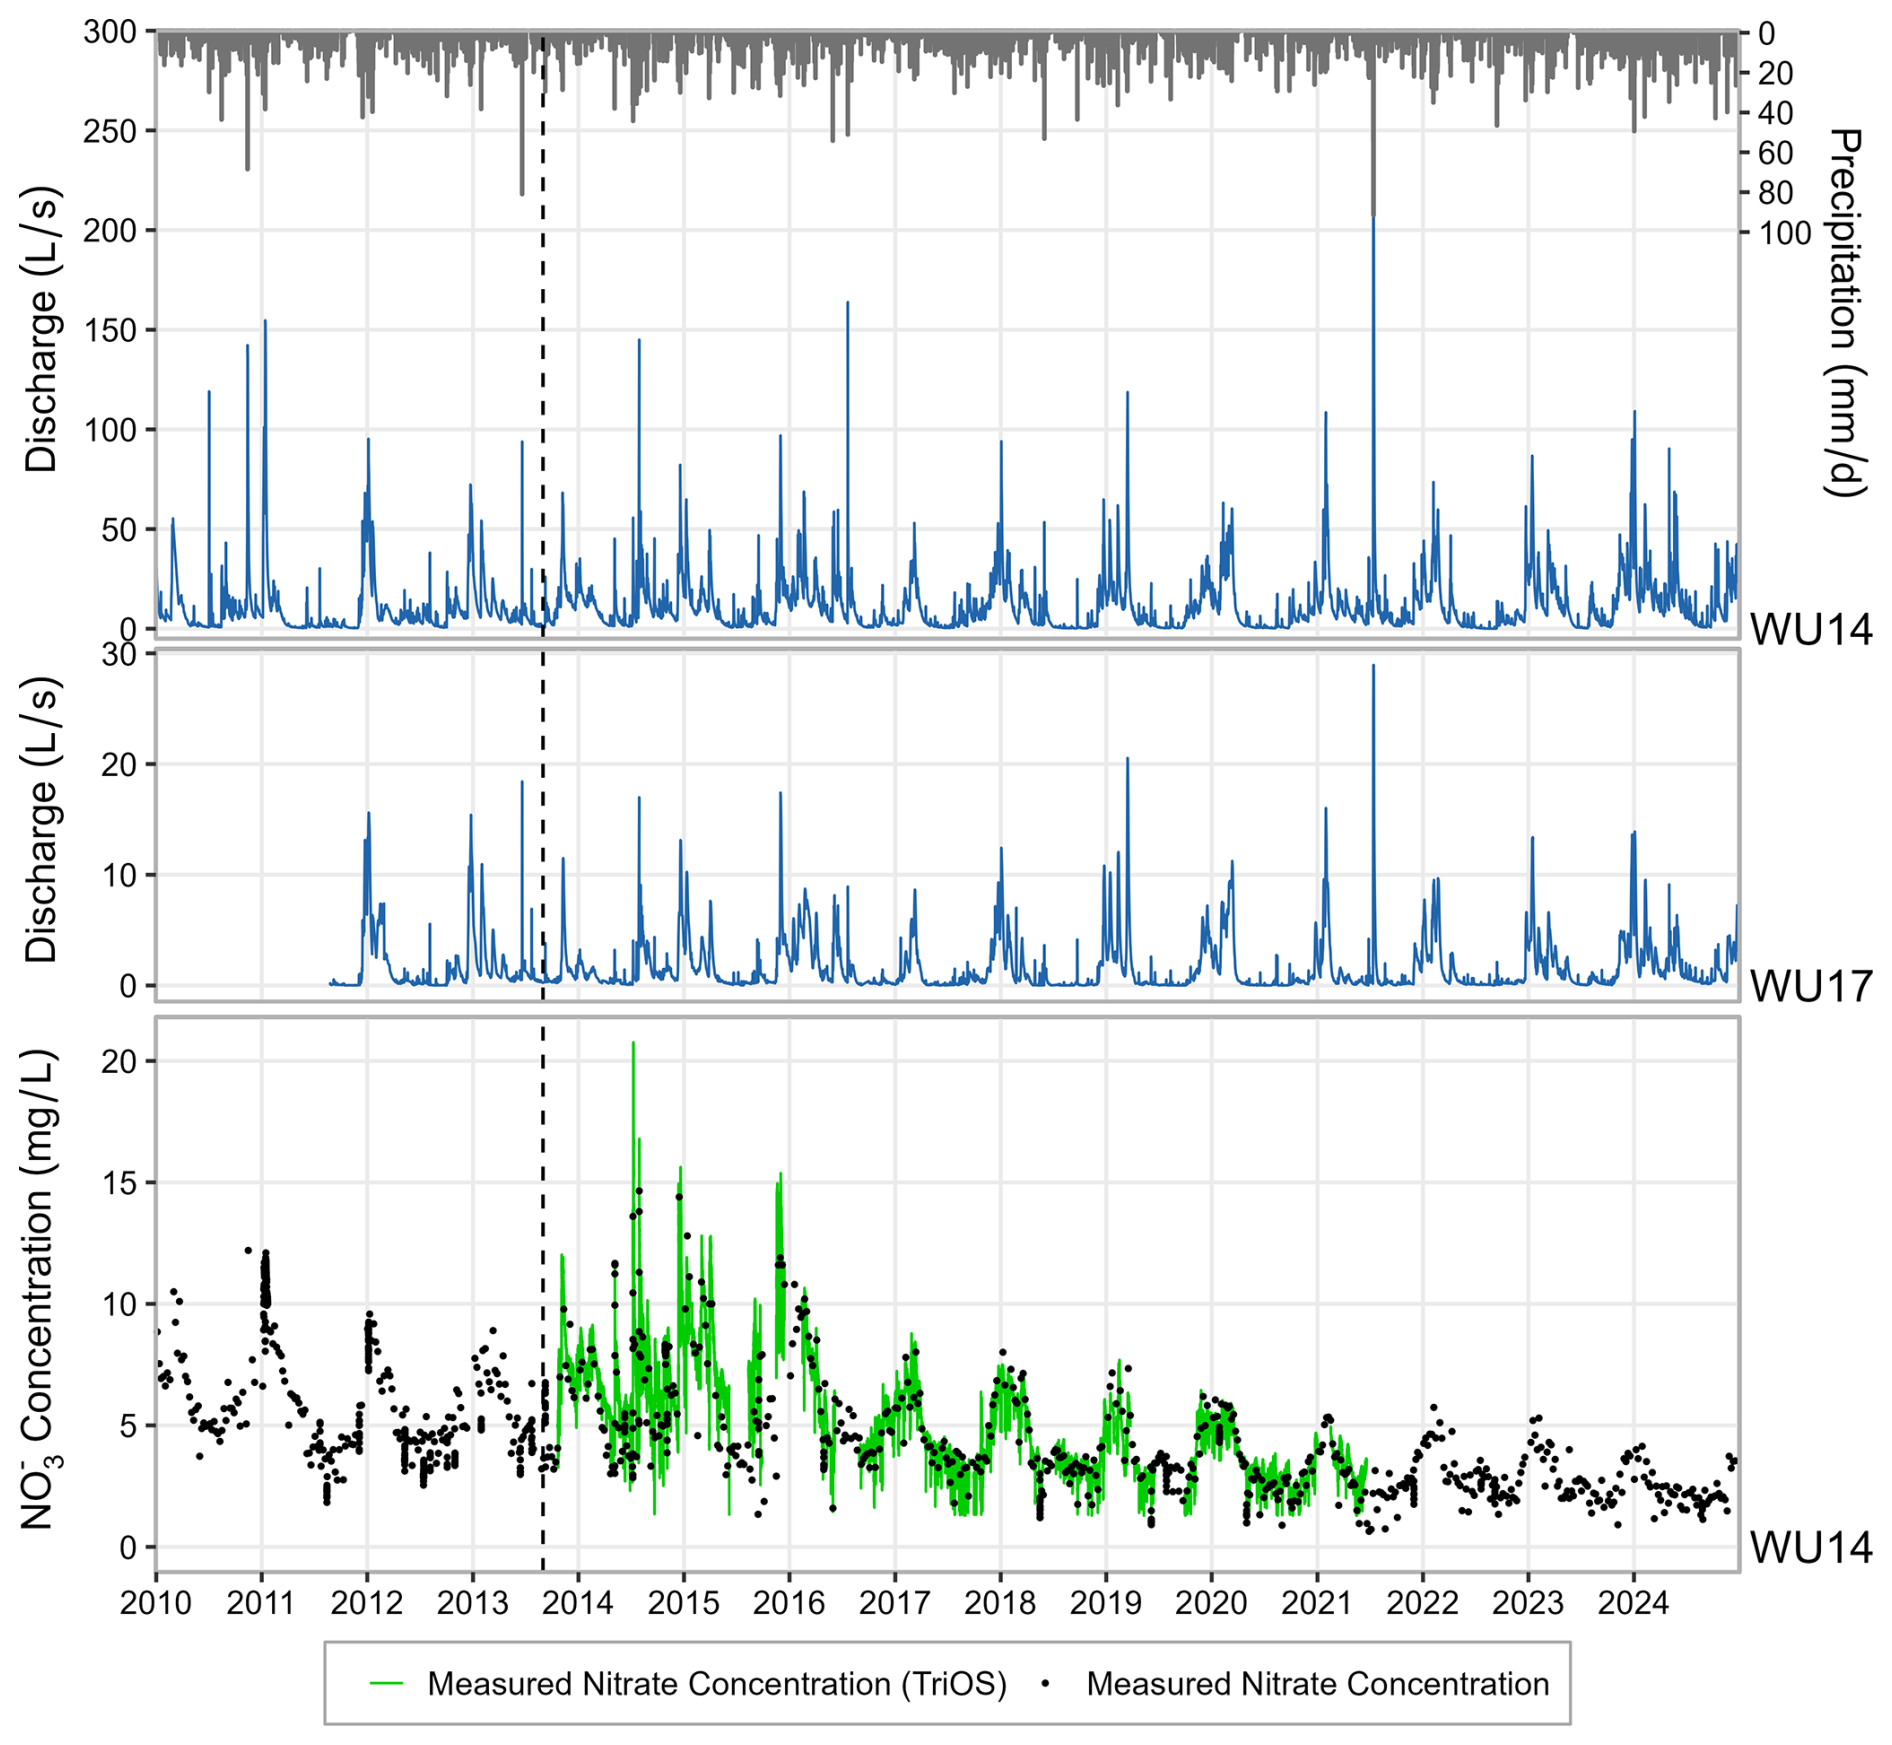
Figure 2Precipitation and discharge time series at WU14 and WU17 (top and centre panels). Nitrate concentrations from weekly grab and event samples as well as the continuous nitrate concentrations measured with the TriOS sensor at WU14 (lower panel). The dashed line indicates the time of clear-cutting.
The average discharge during the 16-year record of WU14 was 9.61 L s−1 (2.16 mm d−1) and 1.47 L s−1 (1.16) mm d−1 for the record of WU17 from August 2011 to the end of 2024 (Fig. 2). The highest measured discharge was 50.57 and 28.95 mm h−1 at WU14 and WU17 in the summer of 2021 (Fig. 2), when a flood disaster occurred in western Germany (Saadi et al., 2023). Typically, the largest discharges are recorded in the winter half-year, while the summer periods are characterized by low discharge conditions, especially at WU17 (Fig. 2).
3.2 Physicochemical parameters of water quality
Several physicochemical parameters of water quality (i.e. electrical conductivity, pH, redox potential and temperature) are measured at a resolution of 10 min using a multi-probe sensor (YSI 6820, YSI Inc.) at stations WU14 and WU17. These measurements allow the detection of short-term changes in the chemistry of stream water, e.g. after intense precipitation events. A comparison of the statistical distributions of the physical parameter values (see Figs. A2 and A3) illustrate that although the pH (median = 6.25 and 6.15 at WU14 and WU17, respectively) and the redox potential (median = 259 and 287 mV at WU14 and WU17, respectively) show a high degree of similarity, there is a significant difference in their electrical conductivities (median = 230 and 60 µS cm−1 at WU14 and WU17, respectively). This difference can be explained by the heavy use of deicing salts on the road that runs south through the Wüstebach catchment area (Płaczkowska et al., 2024). Furthermore, the mean stream water temperature at WU14 (9.4 °C) is slightly higher than at WU17 (8.5 °C), reflecting the lower shading effect in the deforested Wüstebach catchment (Figs. A2 and A3). However, these differences should not limit the usability of the reference stream for the investigation of the effects of deforestation on matter fluxes in the Wüstebach catchment.
3.3 Solute concentrations
In order to determine the solute fluxes, both weekly sampling data of the flowing water (grab samples) and event-based samplings at stations WU14 and WU17 were employed. Event-driven sampling was carried out using autosamplers (AWS 2002, Ecotech, Germany) with an hourly sampling interval to detect rapid changes in water chemistry during high flow. Additionally, WU14 was equipped with an optical sensor (TriOS proPS, Rastede, Germany) to measure variations in nitrate concentrations at 10 min intervals (Bogena et al., 2018). Spectral absorbance data obtained from optical sensors such as the TriOS require careful calibration and quality control. In this study, we used only the nitrate data, as the SAK254 signal from the TriOS sensor showed a weak correlation with DOC concentrations obtained from grab samples (R2 = 0.55). Outliers were first removed using minimum and maximum nitrate thresholds of 0 and 15 mg L−1, respectively, with the latter corresponding to the highest concentration measured in the laboratory. The cleaned dataset was then calibrated against nitrate concentrations from grab samples to correct for measurement offset (Fig. A4), yielding an RMSE of 1.262 mg L−1.
For the sampling HDPE bottles were used, which were pre-rinsed with flowing water and then completely filled to avoid air space. All samples were filtered in the laboratory (0.45 µm) and stored at 4°C prior to analysis. Major anions (Cl−, NO3−, SO, NH, PO) and cations (Al3+, Fetot, Ca2+, Mg2+, Na+, K+) were measured using ion chromatography and inductively coupled plasma–optical emission spectrometry (ICP-OES), respectively. The DOC concentration was determined as non-purgeable organic carbon (Shimadzu TOC-VCPN). Given that the concentrations of NH and PO were typically near or below the detection limit (0.06 and 0.08 mg L−1), they were excluded from the data analysis.
Figure 3 presents solute concentration boxplots of the most important macro- and micronutrients, as well as dissolved aluminum and DOC, determined from the weekly and event-based stream water samples taken at WU14.
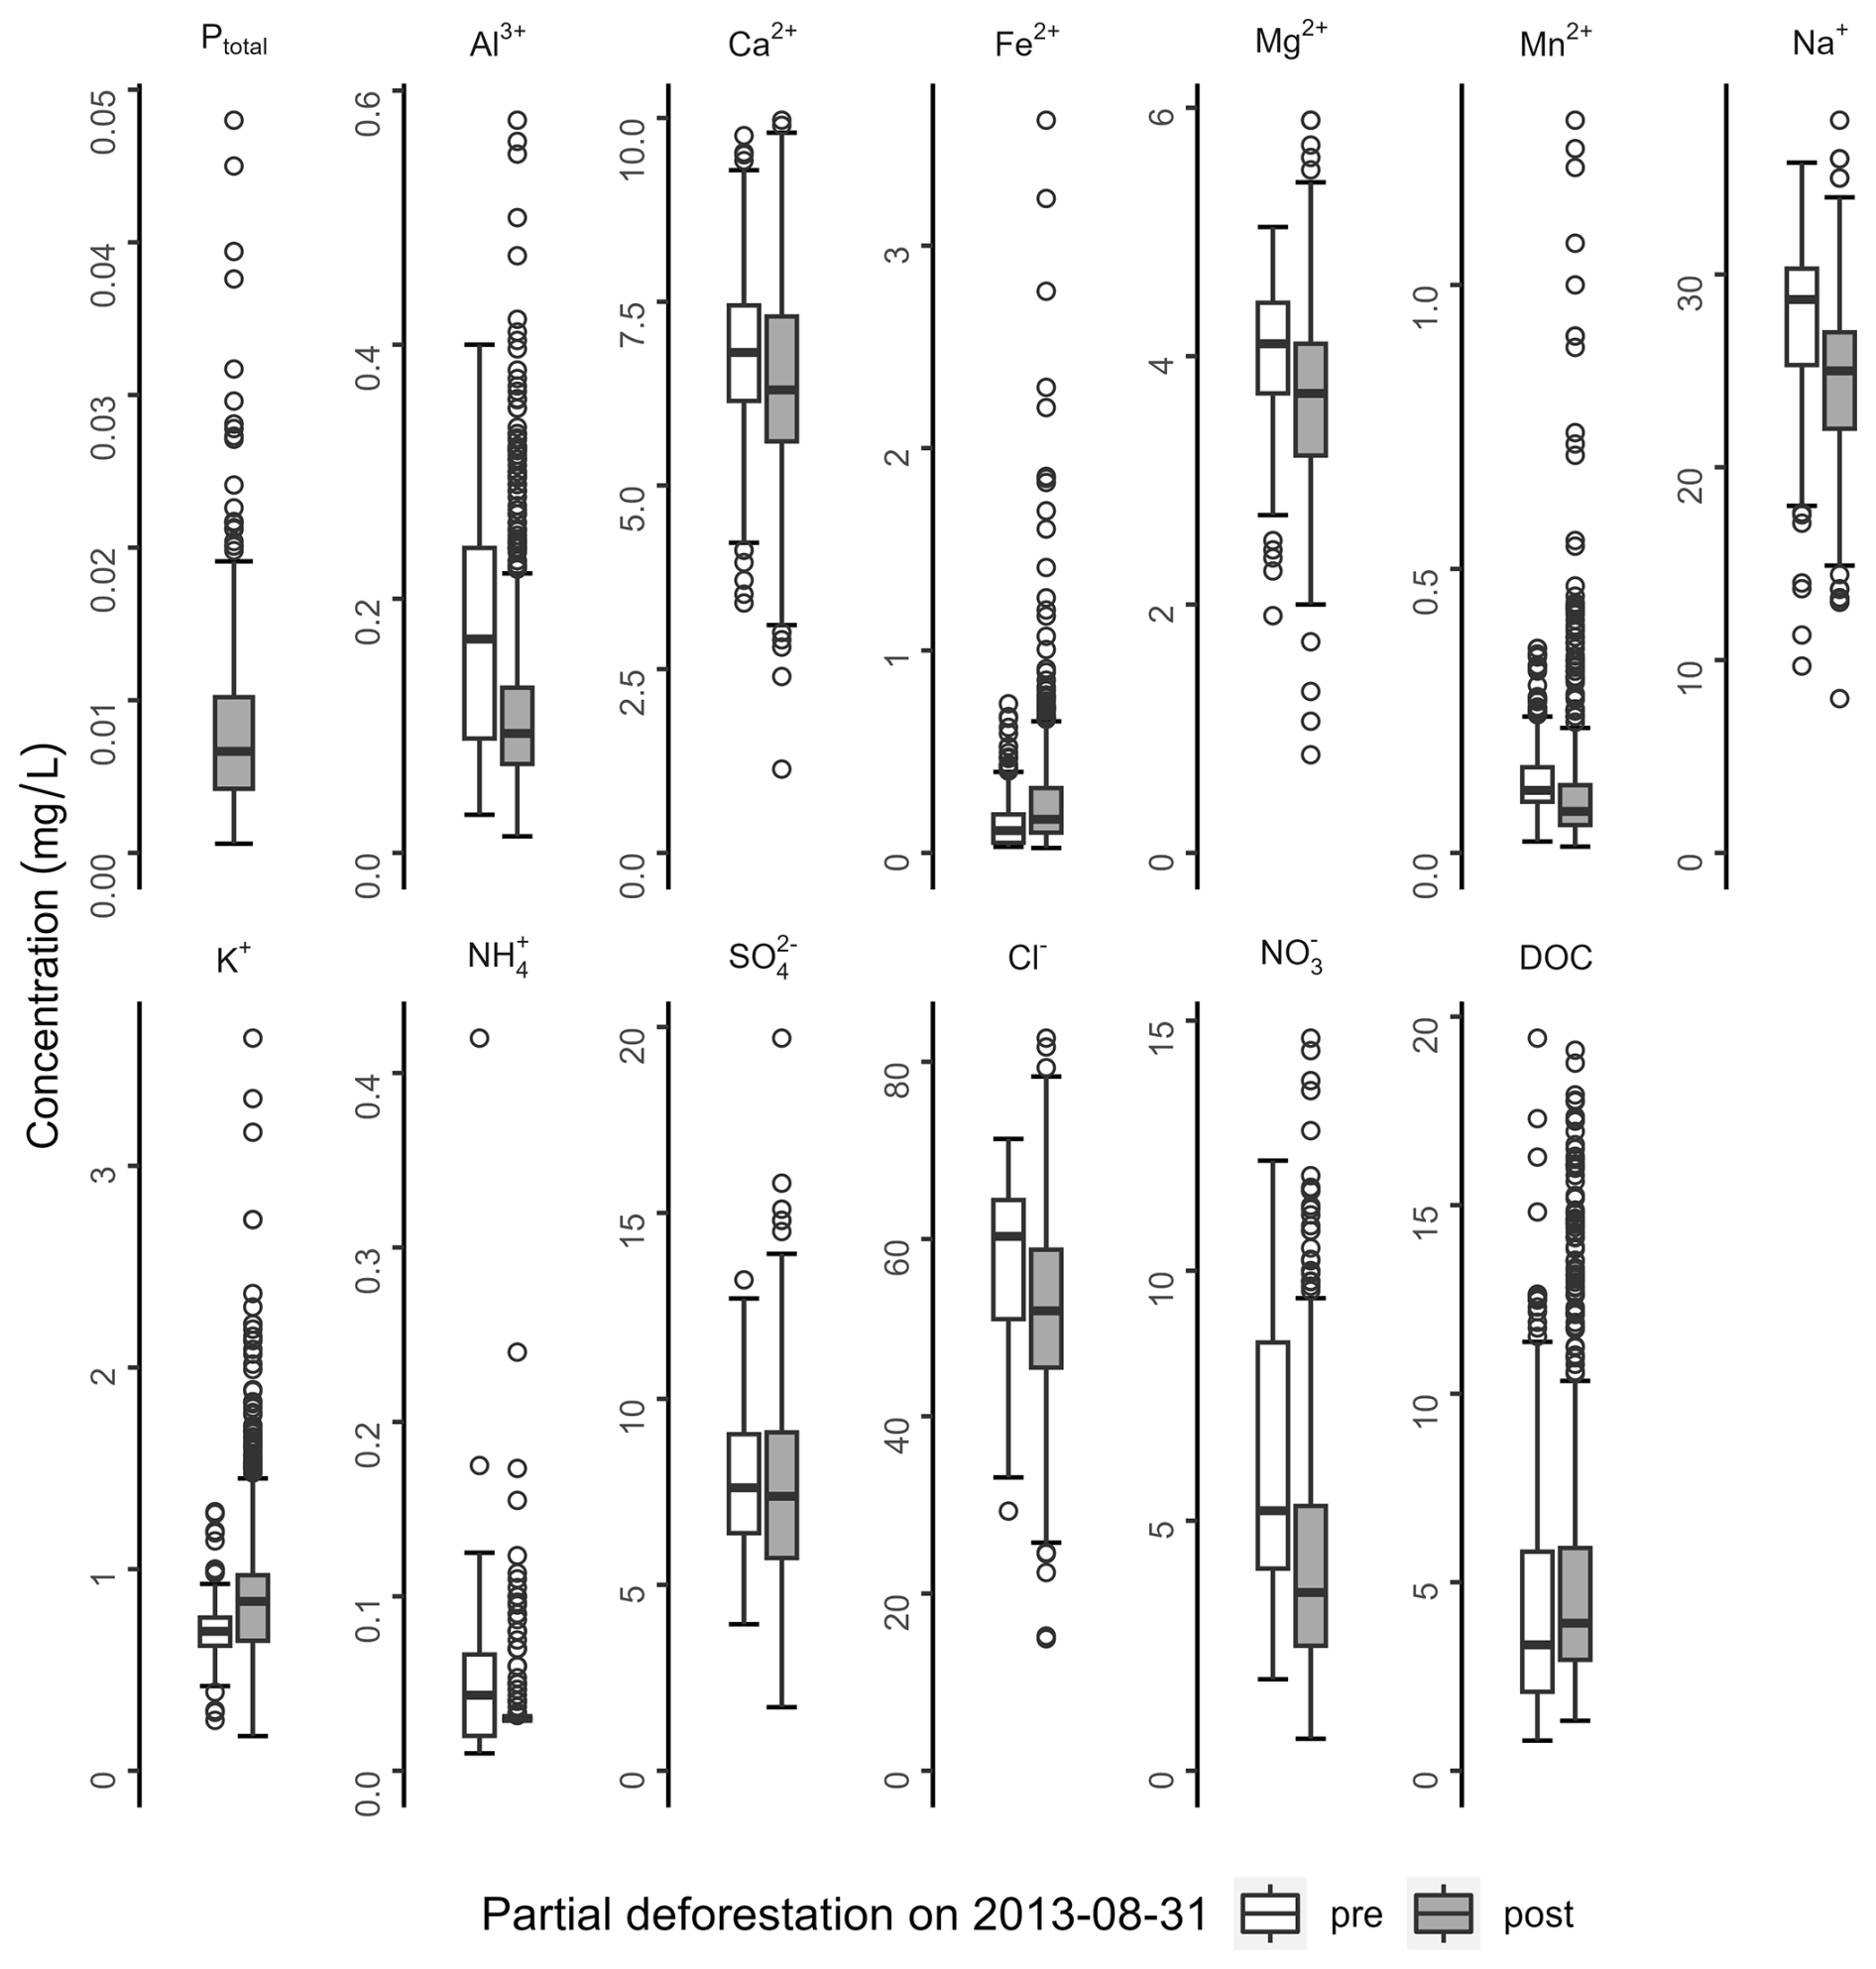
Figure 3Boxplots showing the distributions of all considered macro- and micronutrients, dissolved aluminum and DOC determined from stream water samples taken at discharge station WU14. The box shows the median and the interquartile range, and the whiskers extend to 1.5 times the interquartile range away from the box. Information on the number of stream water samples collected before and after the clear-cut for each solute, as well as the start and end dates of the sampling period, is provided in Table A4.
The solute concentrations in the Wüstebach stream were mostly low (median of all solutes = 3.52 mg L−1), with Na+ showing the highest concentrations among the cations (median = 25.7 mg L−1) and Cl− as the dominant anion (median = 53.0 mg L−1). The high NaCl content and corresponding high EC values (Fig. A2) are mainly caused by the large amount of road deicing salts entering the headwater of the Wüstebach catchment (Płaczkowska et al., 2024). In contrast, since the reference catchment is not affected by these salt inputs (median Na 2.90 mg L−1, median Cl 4.94 mg L−1, Fig. A5), the median of all solute concentrations in the reference stream was significantly lower at 2.50 mg L−1.
Using the nitrate and DOC concentration data, we selected the most appropriate method for calculating the hourly concentrations of all the other dissolved substances considered, which are needed for the solute flux estimation (see Sect. 3.4). In this way, the selected model should encompass both solutes that are more associated with subsurface transport processes (i.e. nitrate) as well as overland flow transport processes (i.e. DOC). Mean nitrate concentrations in both streams were generally low at 4.30 and 3.78 mg L−1 at WU14 and WU17, respectively. Overall, the measured stream nitrate concentrations during the study period ranged from 0.64 to 14.65 mg L−1 at WU14 and 0.03 to 9.51 mg L−1 at WU17 (see Figs. 3 and A5) with strong seasonal variations (Fig. 2). In addition, at WU14 the nitrate concentration shows a long-term downward trend from 2016 onwards (Fig. 2), which is linked to the growth of new vegetation in the clear-cut area, which, compared to the former spruce forest, takes up higher amounts of nitrogen from the soil (Płaczkowska et al., 2022).
Regarding the export of dissolved organic matter, the behavior of both streams was very similar: DOC concentrations ranged at WU14 from 0.08 to 19.4 mg L−1 and at WU17 from 0.13 to 19.2 mg L−1 (see Figs. 3 and A5). DOC concentrations were positively related to discharge only during the summer half year (Fig. 4). This suggests that surface runoff after high intensity precipitation events plays a crucial role in transporting DOC from soils to surface waters (Strohmeier et al., 2013). The medium DOC concentration at WU14 (i.e. 4.82 mg L−1) was about a quarter higher than at WU17 (i.e. 3.63 mg L−1), which can be explained by the clear-cut measure that induced higher DOC concentrations over a few years after the clear-cut (Robinson et al., 2022).
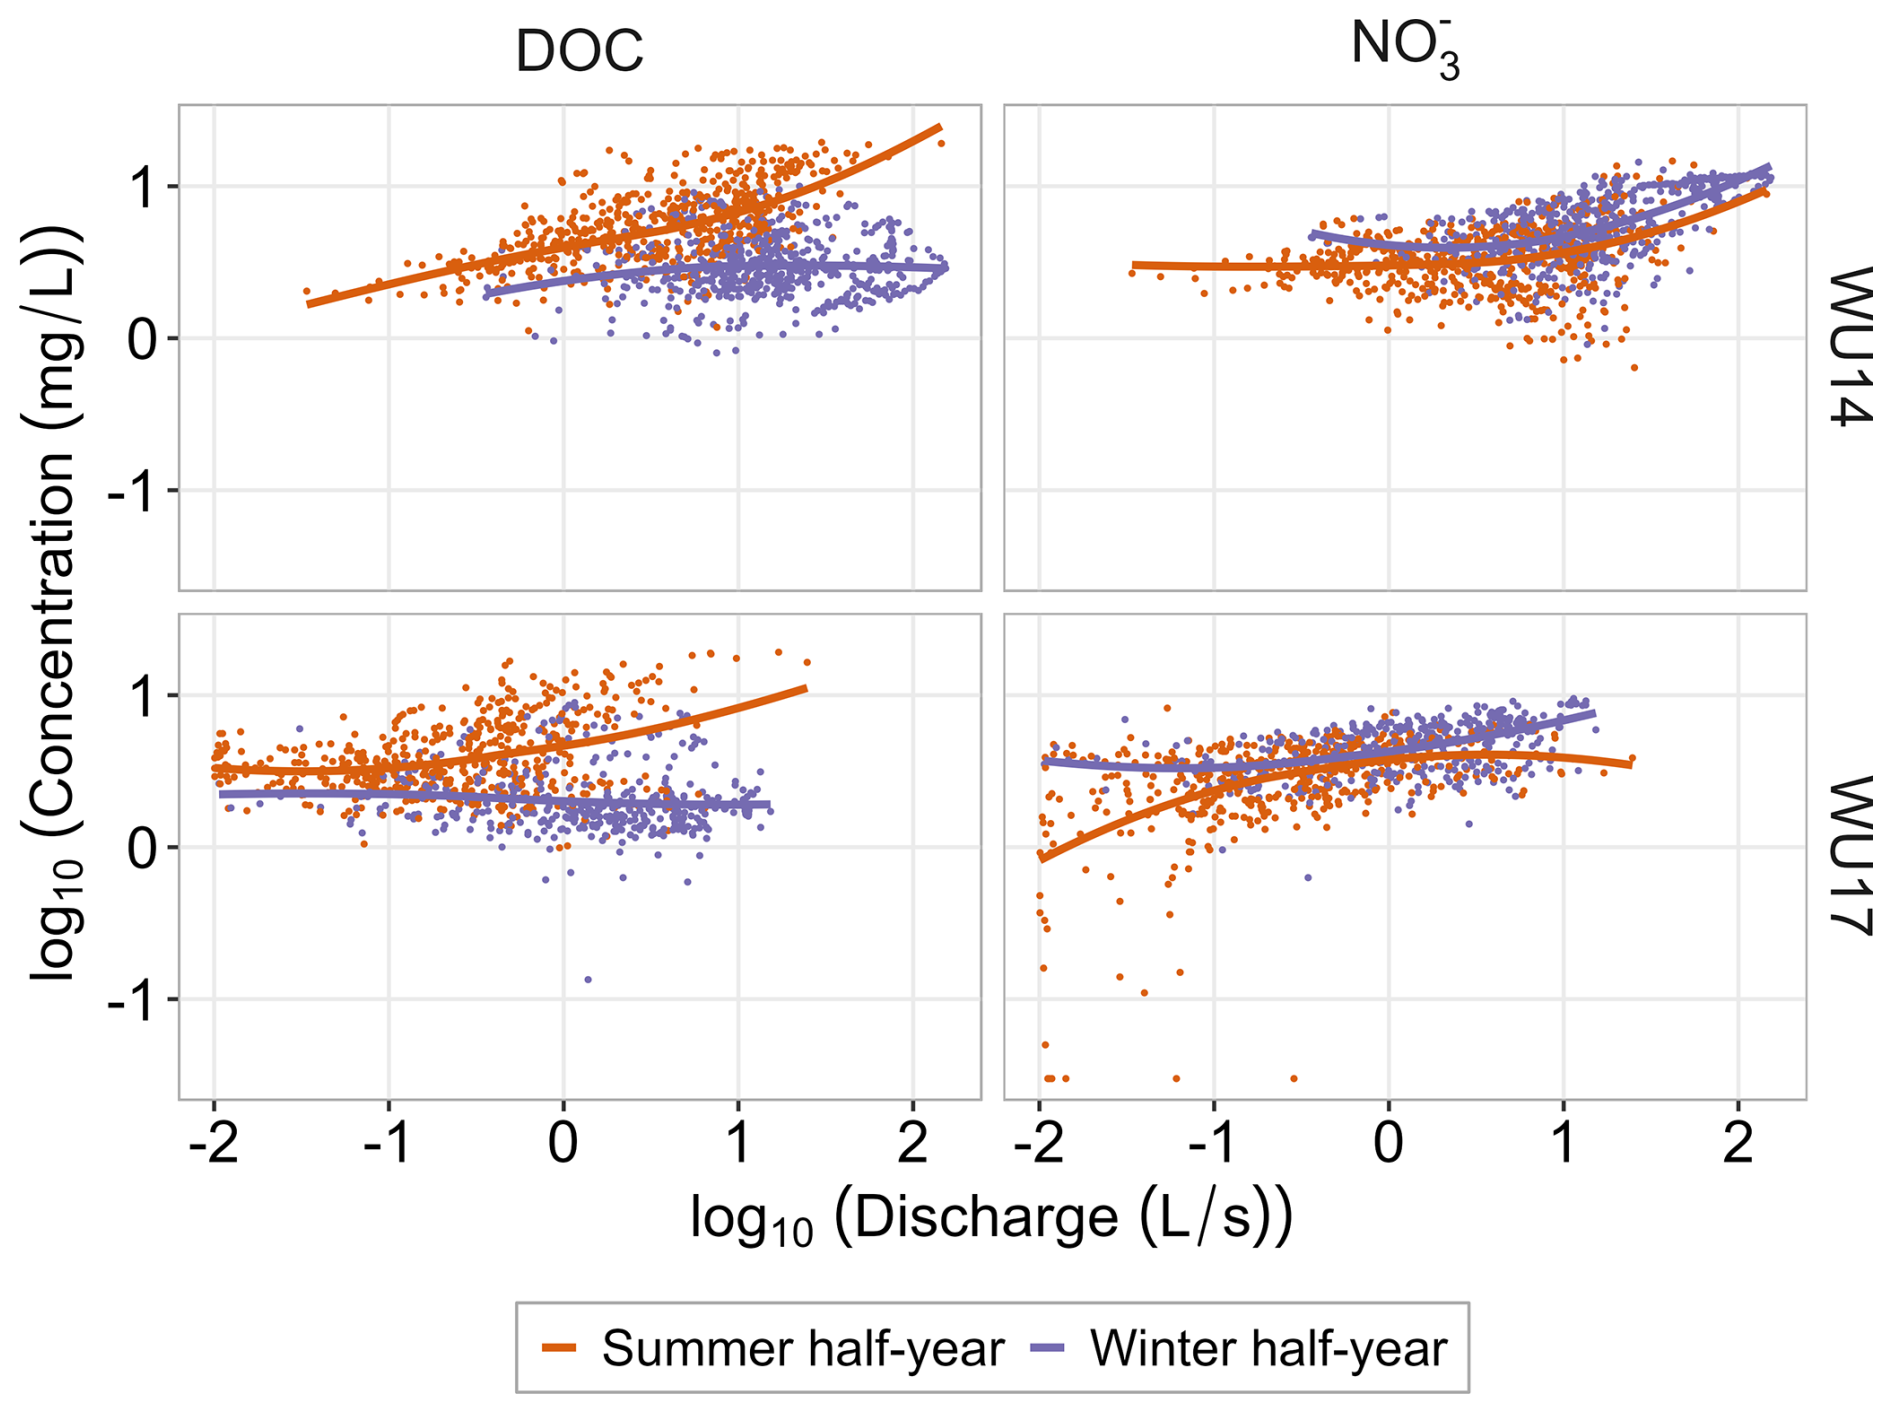
Figure 4Log–log scatter plots of DOC and nitrate versus discharge measured at stations WU14 and WU17, differentiated by summer and winter half-year. LOESS (Locally Estimated Scatterplot Smoothing) trend lines are shown to highlight non-linear relationships, especially for DOC during the summer half-year.
In contrast to DOC, nitrate concentrations show a strong positive trend with discharge during the winter months, while in the summer months this relationship was weaker, especially at WU14 (Fig. 4). The non-linear correlations of DOC and nitrate concentrations with discharge present varying challenges for the solute concentration models, which is the reason for choosing these two solutes for the selection of the most appropriate method.
3.4 Solute flux calculation
The measured weekly grab sample-based and event sampling-based stream solute concentrations and associated discharge values from the discharge stations were employed to generate models for the prediction of continuous hourly concentrations utilizing the R package LOADFLEX (Appling et al., 2015). Furthermore, LOADFLEX was employed to construct composite models that rectify the inherent biases in the regression analysis through the interpolation of prediction residuals and their subsequent incorporation into the predicted values (Aulenbach and Hooper, 2006; Huntington et al., 1994). The optimal solute concentration models were selected by minimizing the Akaike Information Criteria values through the utilization of the intrinsic functions provided by LOADFLEX.
Continuous solute concentration data are required to calculate hourly flux data. In order to find the most appropriate solute model for predicting continuous concentration observations, we compare the four basic types of models implemented in LOADFLEX (i.e. interpolation models, simple linear regression models, RLOADEST regression models and composite models). We use the nitrate concentrations measured at station WU14 as a reference example, as we also have high-resolution nitrate data from the TriOS probe that can be used for model validation.
The first and simplest model used in this study is the interpolation method, which has been used in many studies of solute and sediment fluxes (e.g. Buso et al., 2000; Vanni et al., 2001) when regression models are unsatisfactory (e.g. due to a weak relationship between the predictor and solute observations). Here, we employ the rectangular interpolation implemented in LOADFLEX, which is mathematically equivalent to a period-weighted averaging method (Likens, 2013).
The second solute concentration model used in this study is the linear regression method, which has long been an alternative to interpolation models for estimating substance flows, since it requires only limited time series of solute concentrations, as long as the predictor data, e.g. runoff, is available for the entire period of interest (Preston et al., 1989; Robertson and Roerish, 1999).
Next, we employed one of the more intricate RLOADEST regression models (Lorenz et al., 2015; Runkel and De Cicco, 2017), specifically the seven-parameter model proposed by Cohn et al. (1992), which is also incorporated in LOADFLEX:
where C is the solute concentration, Q is the discharge, T is time in years, and and are centering variables for which the average of the original variables is subtracted from each individual value. The errors, denoted ε, are assumed to be independent and normally distributed. The seven adjustment parameters, βi, have to be fitted with the observation data. The βi parameters are used to scale the influences of Q and T, as well as annual seasonality on solute concentrations. Potential biases due to the logarithmic retransformation are circumvented through an adjusted maximum likelihood estimation (AMLE) algorithm (Appling et al., 2015). It should also be noted that the RLOADEST provides in total nine different prediction models of which the seven-parameter model is the most complex (Kelly et al., 2018). We refer to Cohn et al. (1992) for more information on the model derivation and application.
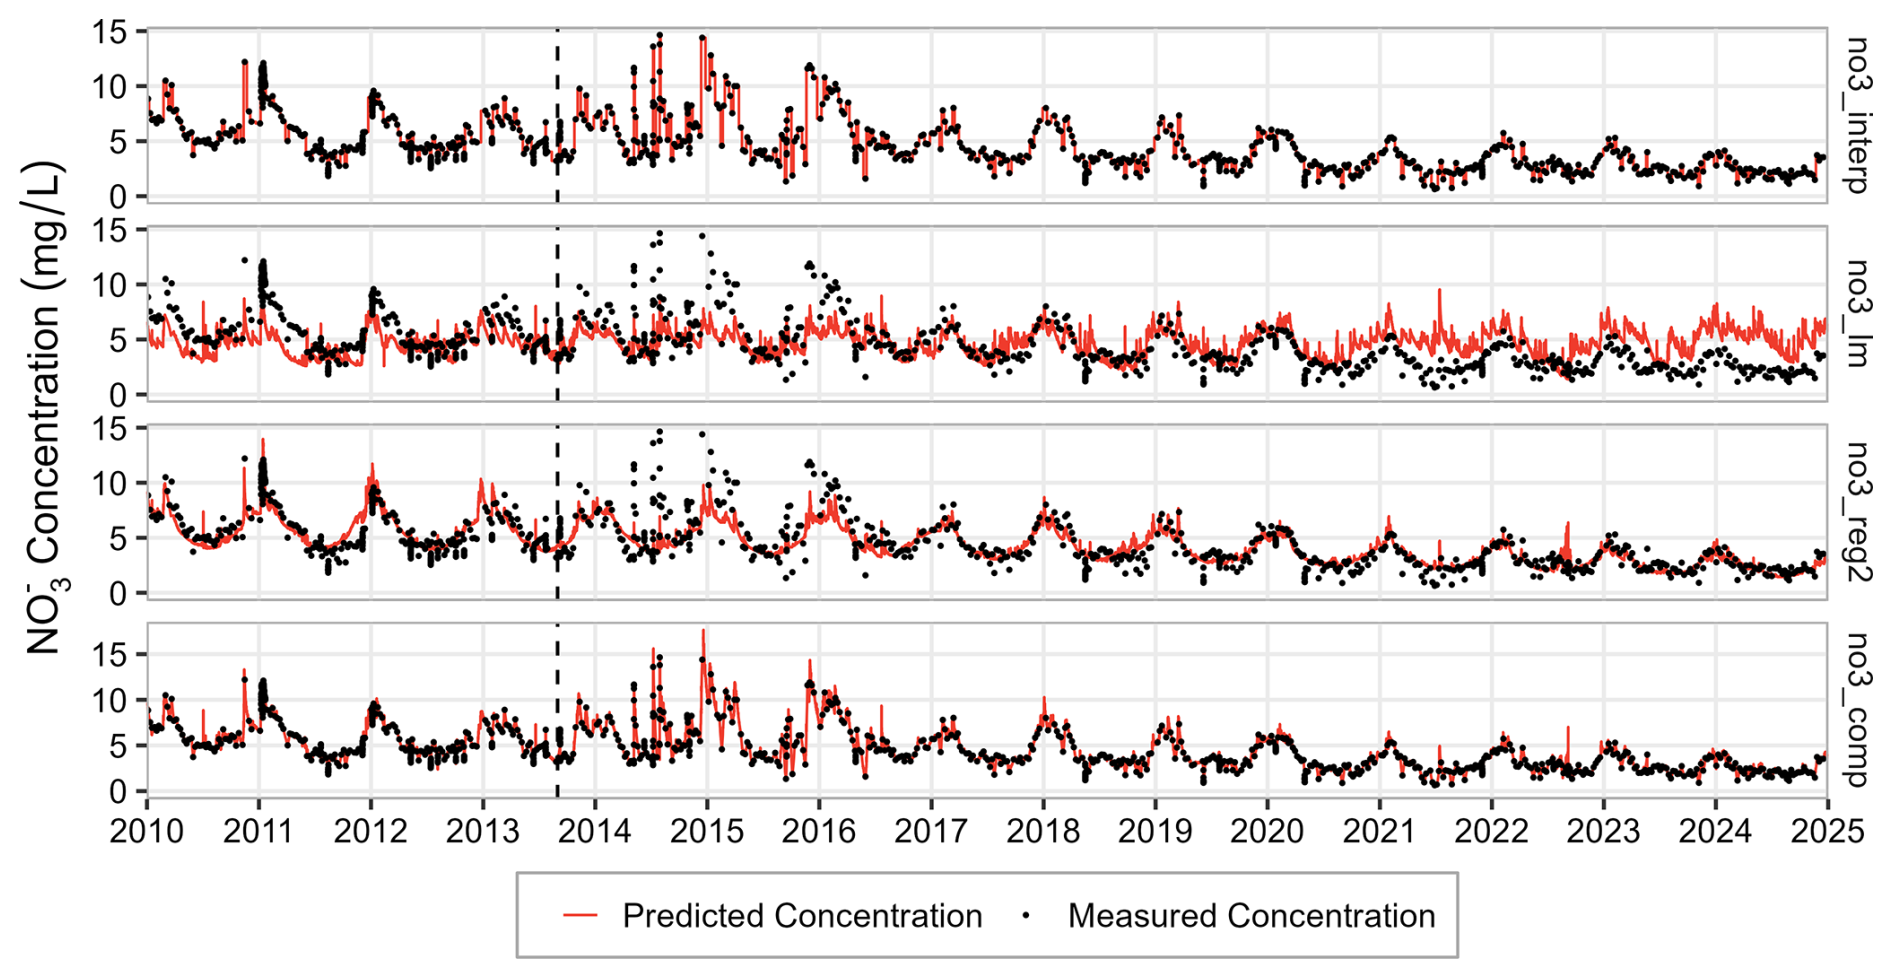
Figure 5Nitrate prediction models fitted to the measured values from weekly samples at WU14 using functions implemented in the LOADFLEX package. Subplots show observed concentrations (black dots) and predicted concentrations (orange lines) for 2010 to 2024 for rectangular interpolation (no3_interp), linear regression model (no3_lm), RLOADEST regression model (no3_reg2), and composite model (no3_comp). The dashed line indicates the time of clear-cutting.
Finally, we employed the composite model suggested by Aulenbach and Hooper (2006) as a fourth method, which is mostly used in cases where regression predictions are available but exhibit medium-range biases (Appling et al., 2015). The composite method corrects systematic biases in solute concentrations predicted by a regression model by adjusting these predictions to observations with a linearly interpolated function of the model residuals between the measurement time steps. Thus, by making use of all the available data, it should provide more accurate predictions at the temporal resolution of the predictors (Kelly et al., 2018). The composite model can use any regression model, which in this case is the RLOADEST regression model shown in Eq. (2). The residuals (e.g. absolute differences) are then calculated from the predictions and observations. The composite model then corrects the regression model predictions by adding the residuals to predictions or multiplying the predictions by the relative residuals.
3.5 Statistical methods for model validation
To validate the model results against the TriOS-measured nitrate concentrations, we used three well-known statistical methods: root mean square error (RMSE), Nash-Sutcliffe efficiency (NSE), and percent bias (PBIAS), which are briefly described here. RMSE is one of the most used error index statistics and is defined as follows:
in which is the vector of predicted solute concentrations, n is the number of data points and Ci is the vector of observed concentrations.
The Nash-Sutcliffe efficiency (NSE) determines the relative magnitude of the residual variance compared to the variance of observations and is computed as follows (Nash and Sutcliffe, 1970):
in which is the arithmetic mean of predicted concentrations.
Finally, PBIAS quantifies the mean tendency of the simulated solute concentrations to exceed or fall below the observations and is calculated as follows (Gupta et al., 1999):
According to Moriasi et al. (2007), the output of a model for the concentration of dissolved substances can be considered satisfactory if NSE exceeds 0.50 and PBIAS is within ±70 %.
We used an average quality measure, AQM, derived from NSE, RMSE and PBIAS to select the most appropriate model for flow calculation. AQM is defined as:
where NSE*, RMSE* and PBIAS* indicate the standardized metrics. Since NSE already lies between 0 and 1, NSE corresponds to NSE* when negative values are set to 0. The standardized RMSE* (i.e. RMSE mapped on a scale from 0 to 1) is calculated with:
where RMSEmax is the worst RMSE value. Correspondingly, is PBIAS* calculated using:
4.1 Comparison of different solute prediction models
The panels in Fig. 5 illustrate the nitrate prediction results at WU14 obtained using rectangular interpolation, linear regression, RLOADEST regression, and composite modelling for the whole observation period. The corresponding results at WU17 are presented in Fig. A6.
In addition, Fig. 5 shows both observed nitrate concentrations by the TriOS sensor and predicted nitrate concentrations at WU14 for the years 2014 and 2020 to highlight the performance differences between the various models. These two years were chosen because the data from the TriOS sensor is almost complete and because the nitrate concentrations show significant differences. The discrepancies between the model performances are particularly evident during the nitrate concentration peaks in July and December 2014, during which the linear and RLOADEST regression models severely underestimate nitrate concentration, whereas the other methods perform well. The performance of the linear regression model also deteriorates from 2020 onwards, leading to significantly excessive nitrate concentrations, particularly in the winter months.
Since there is a general positive correlation between nitrate concentrations and runoff (Fig. 4), the linear regression model always calculates increasing concentrations with increasing runoff. However, there are obviously many inverted concentration peaks in 2020 (Fig. 6), indicating dilution effects that were less pronounced in 2014 when nitrate levels were generally higher due to clear-cutting. These observations are also reflected in the efficiency statistics (Table 1), where in particular the linear regression model shows poor quality indices for all variants. Overall, the rectangular interpolation and the composite model showed the best performances.
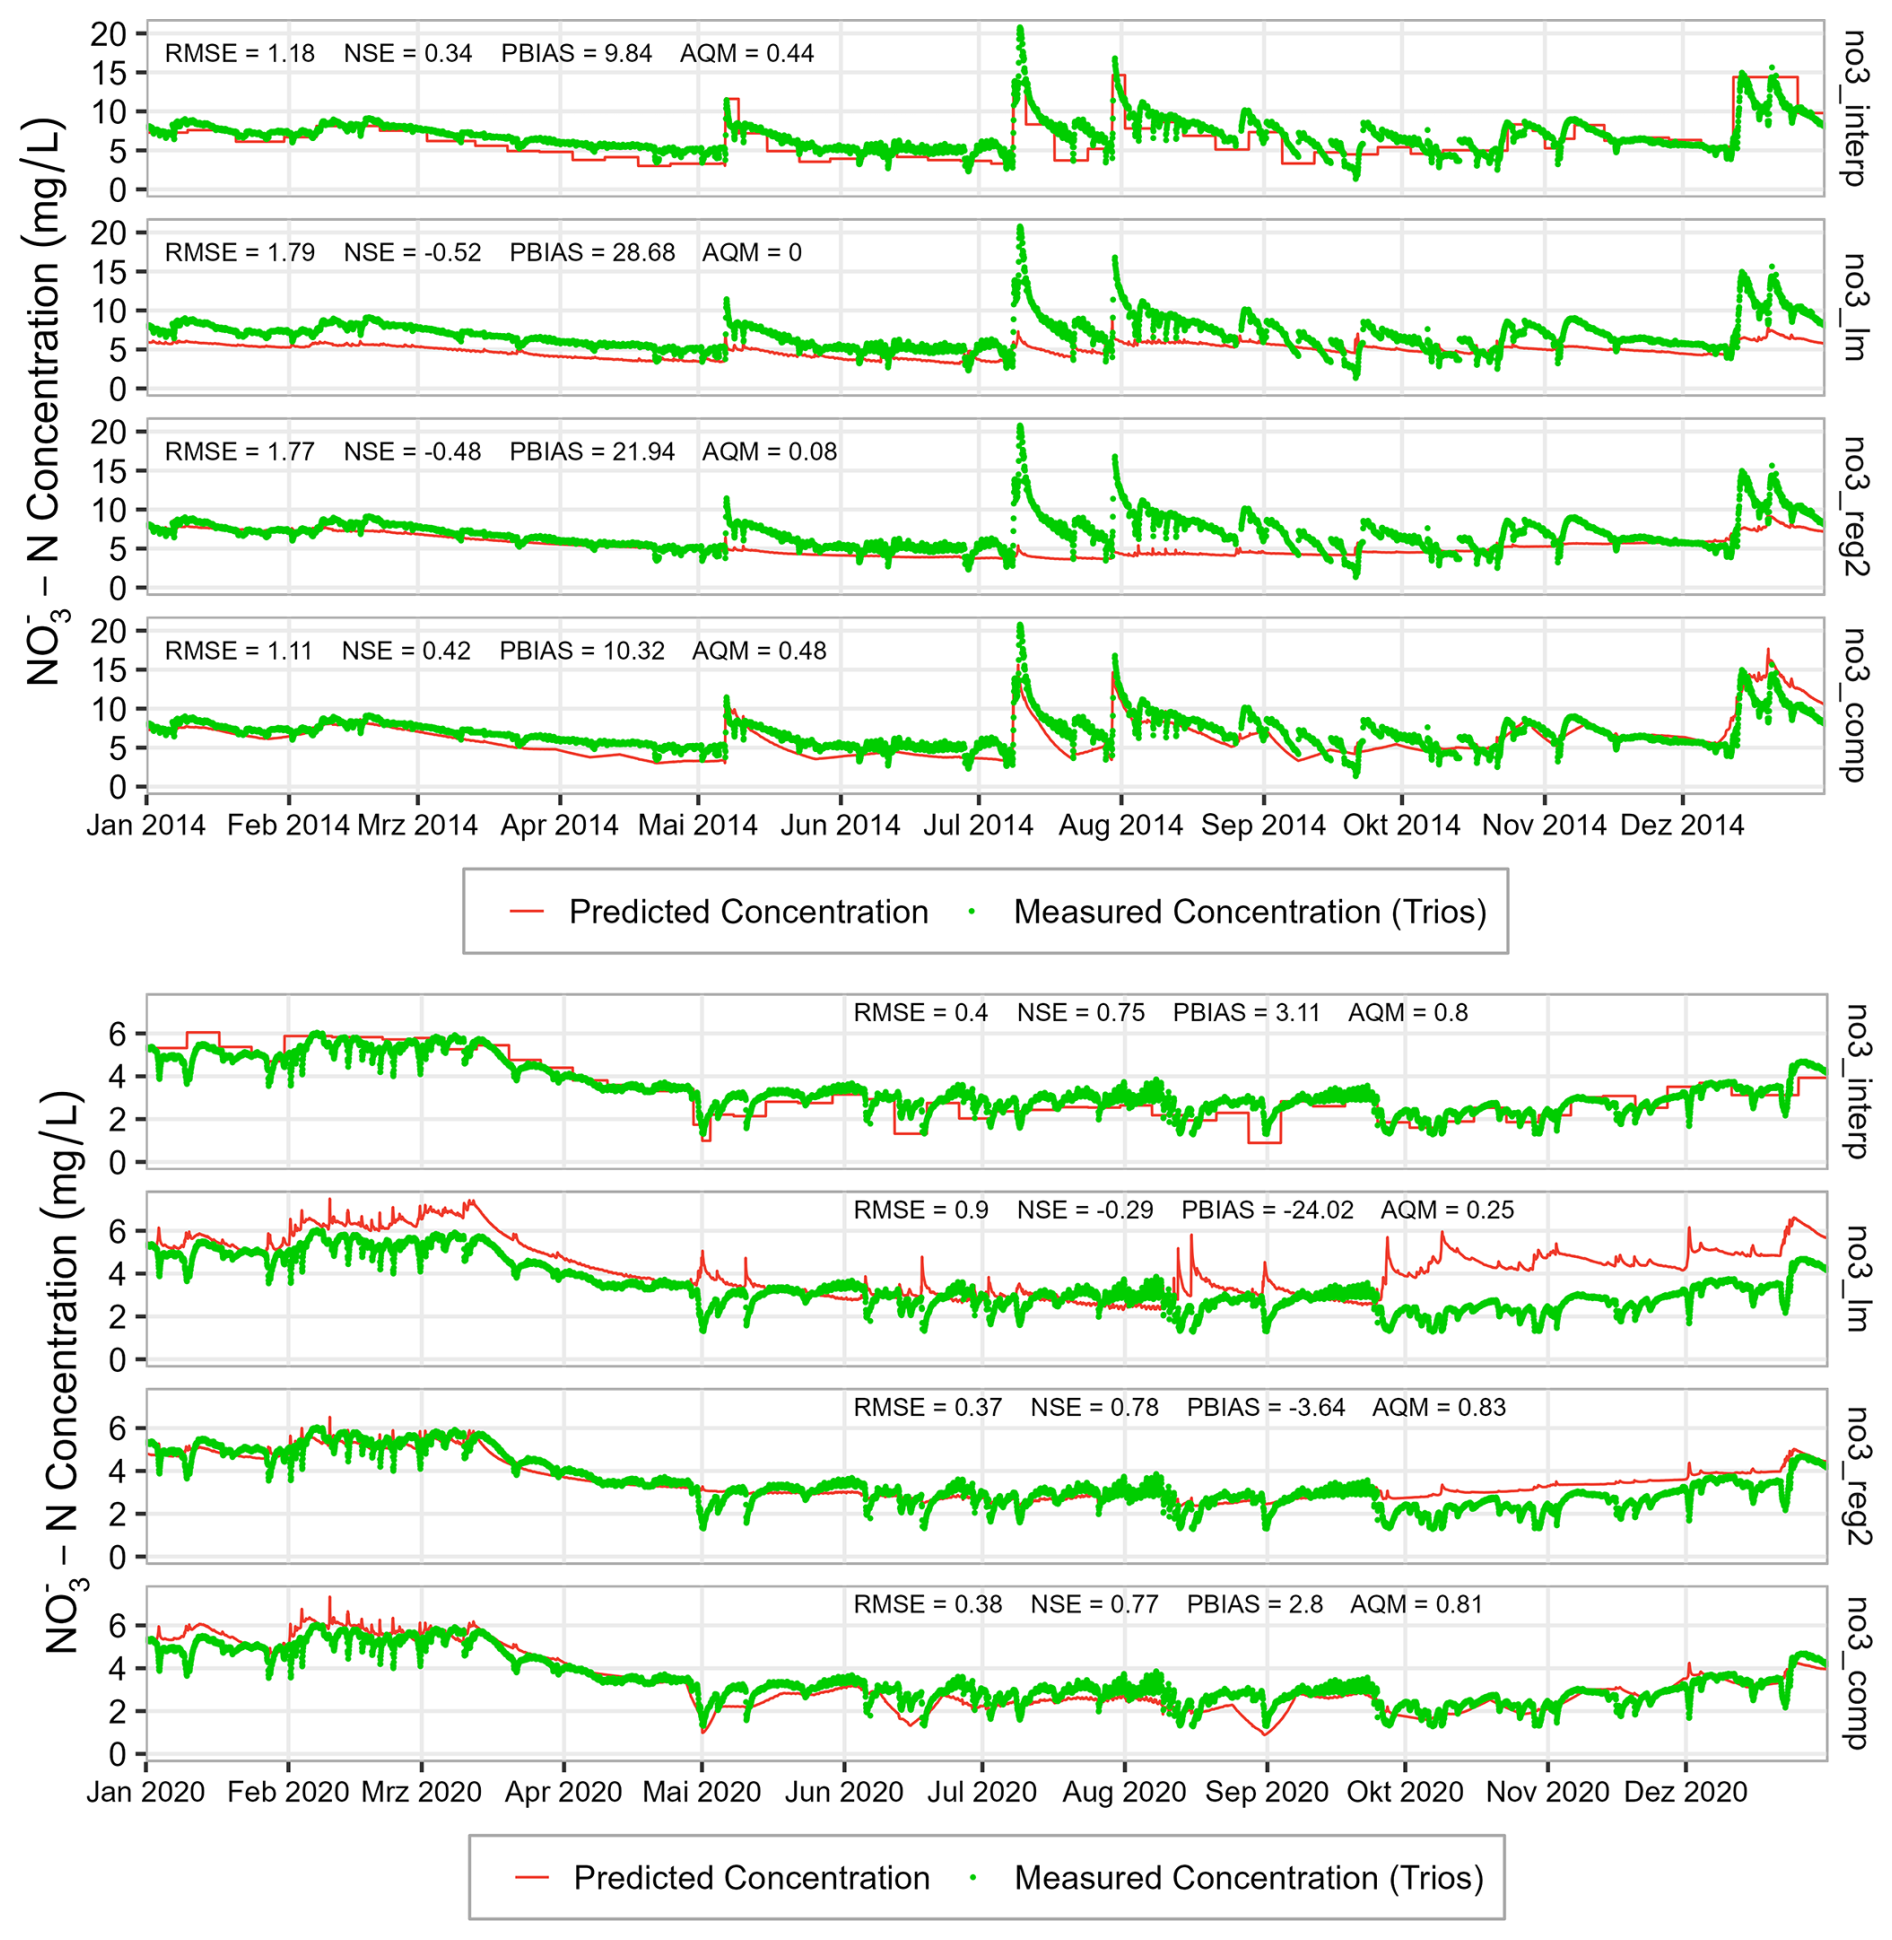
Figure 6Predicted nitrate concentrations at WU14 using the four prediction models and the high-resolution nitrate concentrations measured with the TriOS sensor for the years 2014 (upper panel) and 2020 (lower panel). Subplots show observed concentrations (green dots) and predicted concentrations (orange lines) for rectangular interpolation (no3_interp), linear regression model (no3_lm), RLOADEST regression model (no3_reg2), and composite model (no3_comp).
Table 1Summary statistics of the model validation using the hourly nitrate concentration measured with the TriOS probe for the years 2014 and 2020. Bold values indicate the highest quality, and italic values indicate the lowest.
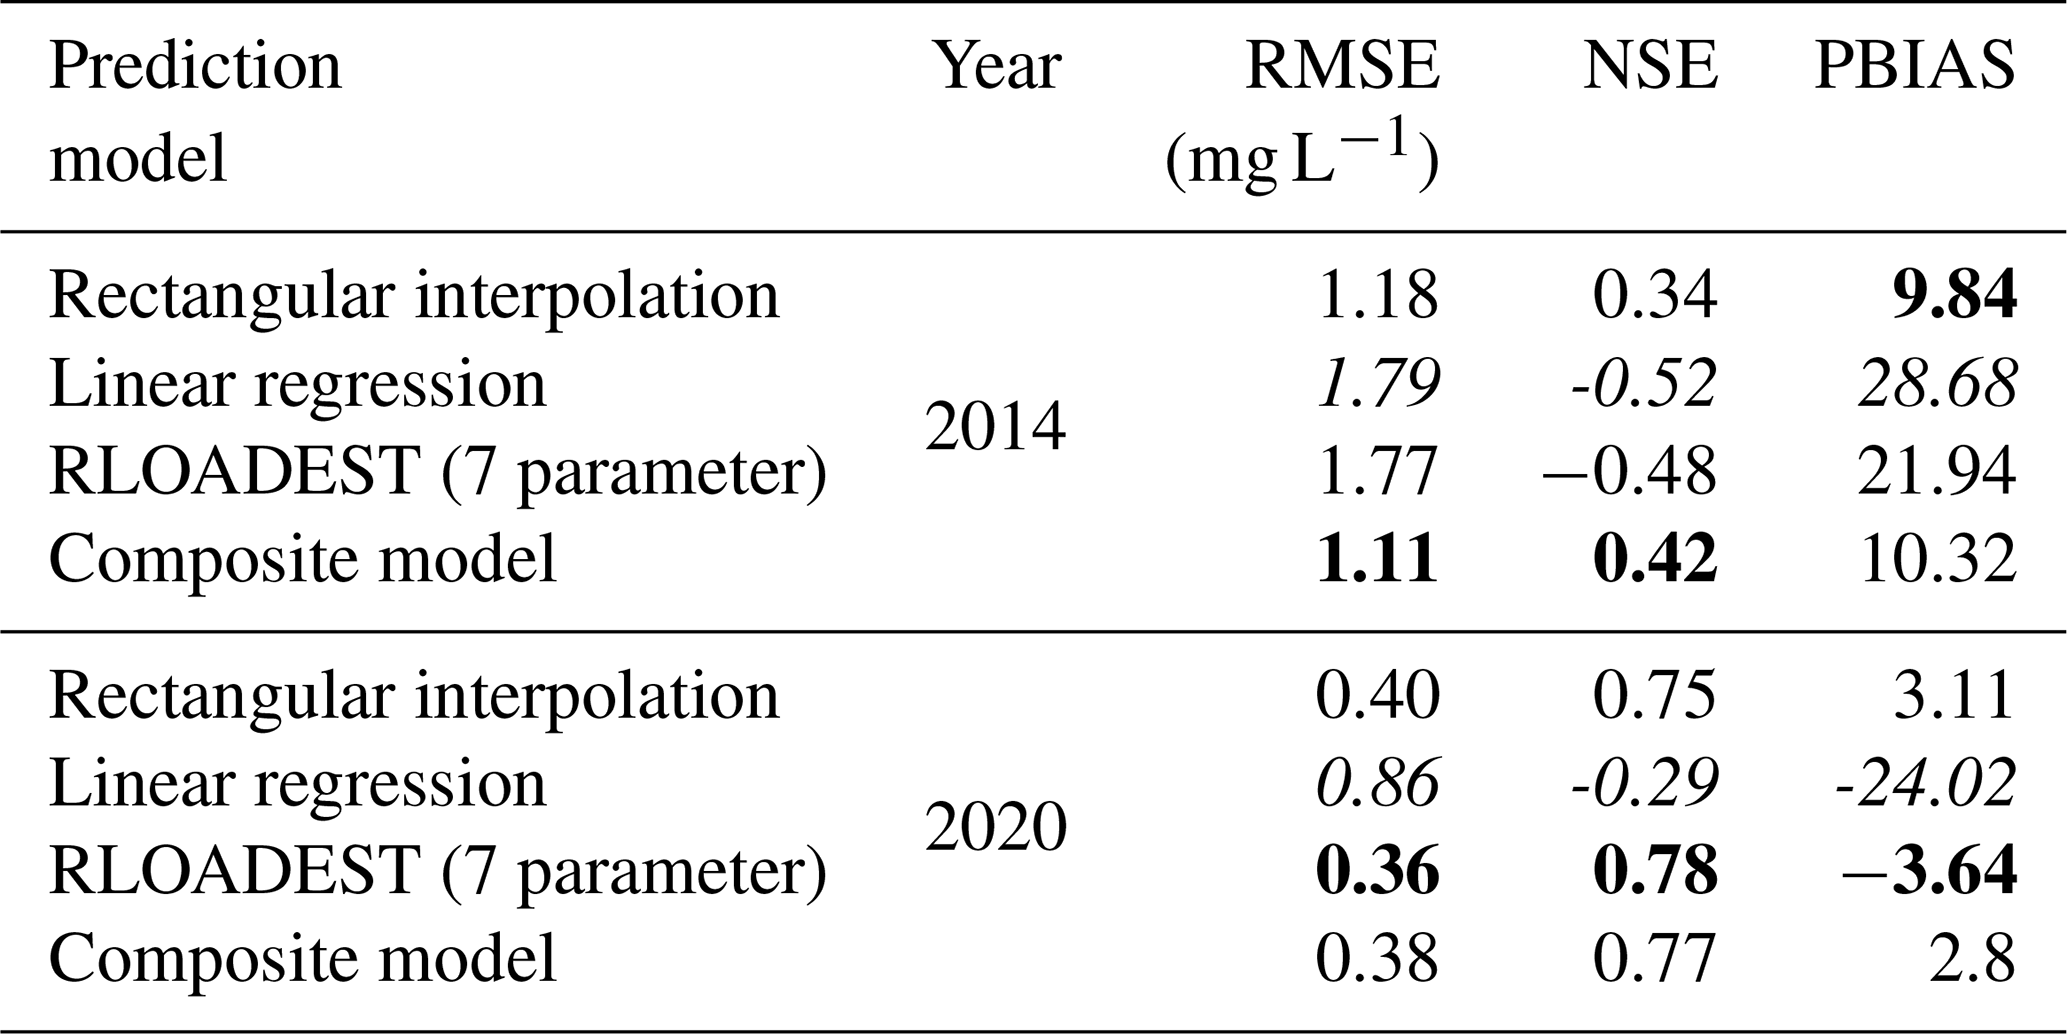
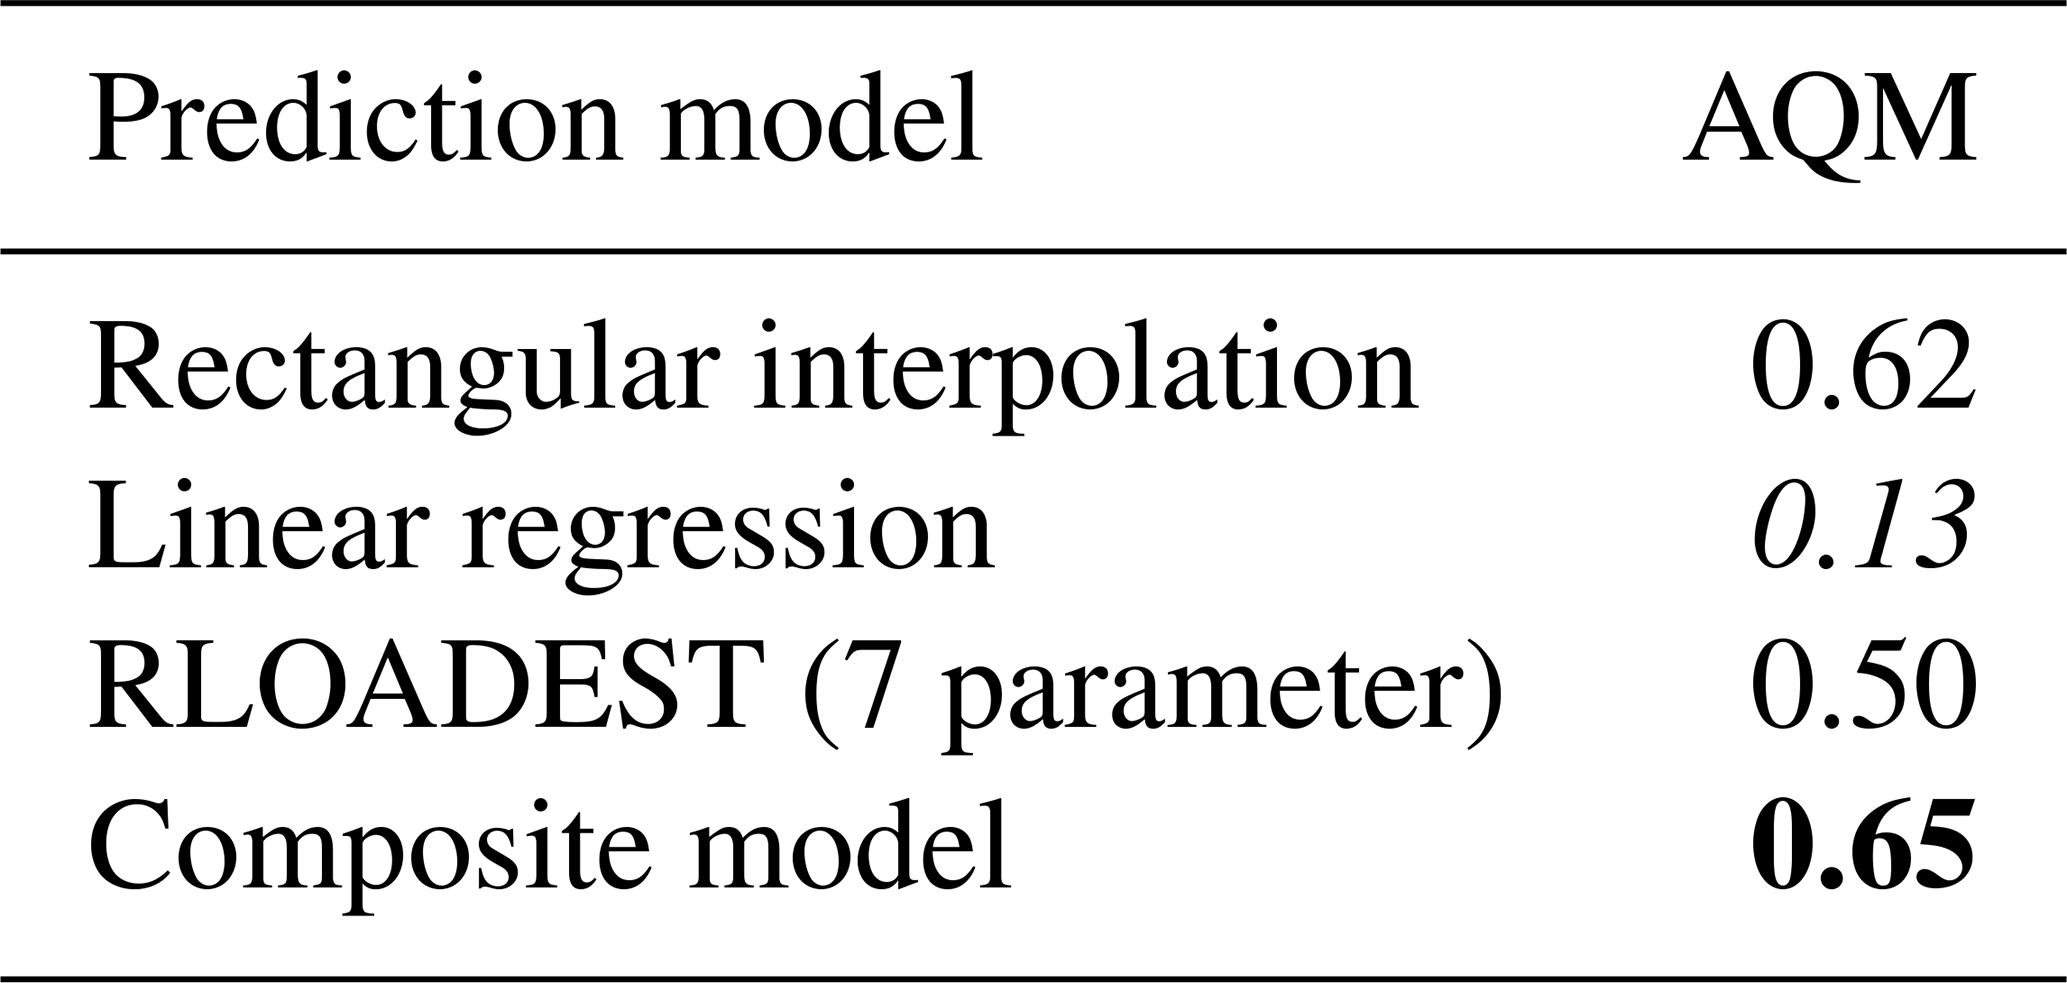
Table 2 summarizes the AQM values, which show that the composite model provides the best model performance in predicting nitrate concentrations for the Wüstebach for the years 2014 and 2020.
Table 2Average quality measures (AQM) for four solute prediction models in predicting nitrate concentrations in the Wüstebach stream for 2014 and 2020. Green fields indicate the highest quality, while red fields indicate the lowest quality. Values in bold indicate the highest quality, while values in italics indicate the lowest quality.
In a next step, the annual nitrate fluxes, which were determined on the basis of the continuous nitrate concentrations from the various solution models, were compared (Fig. 7). As expected, the annual nitrate fluxes based on the linear model deviate significantly from the other methods, which show a very similar trend. In addition, the annual nitrate fluxes were also calculated on the basis of the weekly and event-based sampling dates (hereafter referred to only as “weekly sampling”) and are also presented in Fig. 6 to see how the choice of the solute concentration model affects the calculation of the annual flux. In the dry year of 2018, the four models overestimate the flux derived from weekly sampling by approx. 211 kg yr−1. Total nitrate fluxes for 2014 and 2020, based on the continuous discharge and nitrate data from the TriOS sensor, were 2560.1 and 1143.3 kg yr−1, respectively. The linear model deviates the most from these values with 29.7 %, whereas the rectangular interpolation and composite model deviate by only 2.94 % and 4.09 %, respectively.
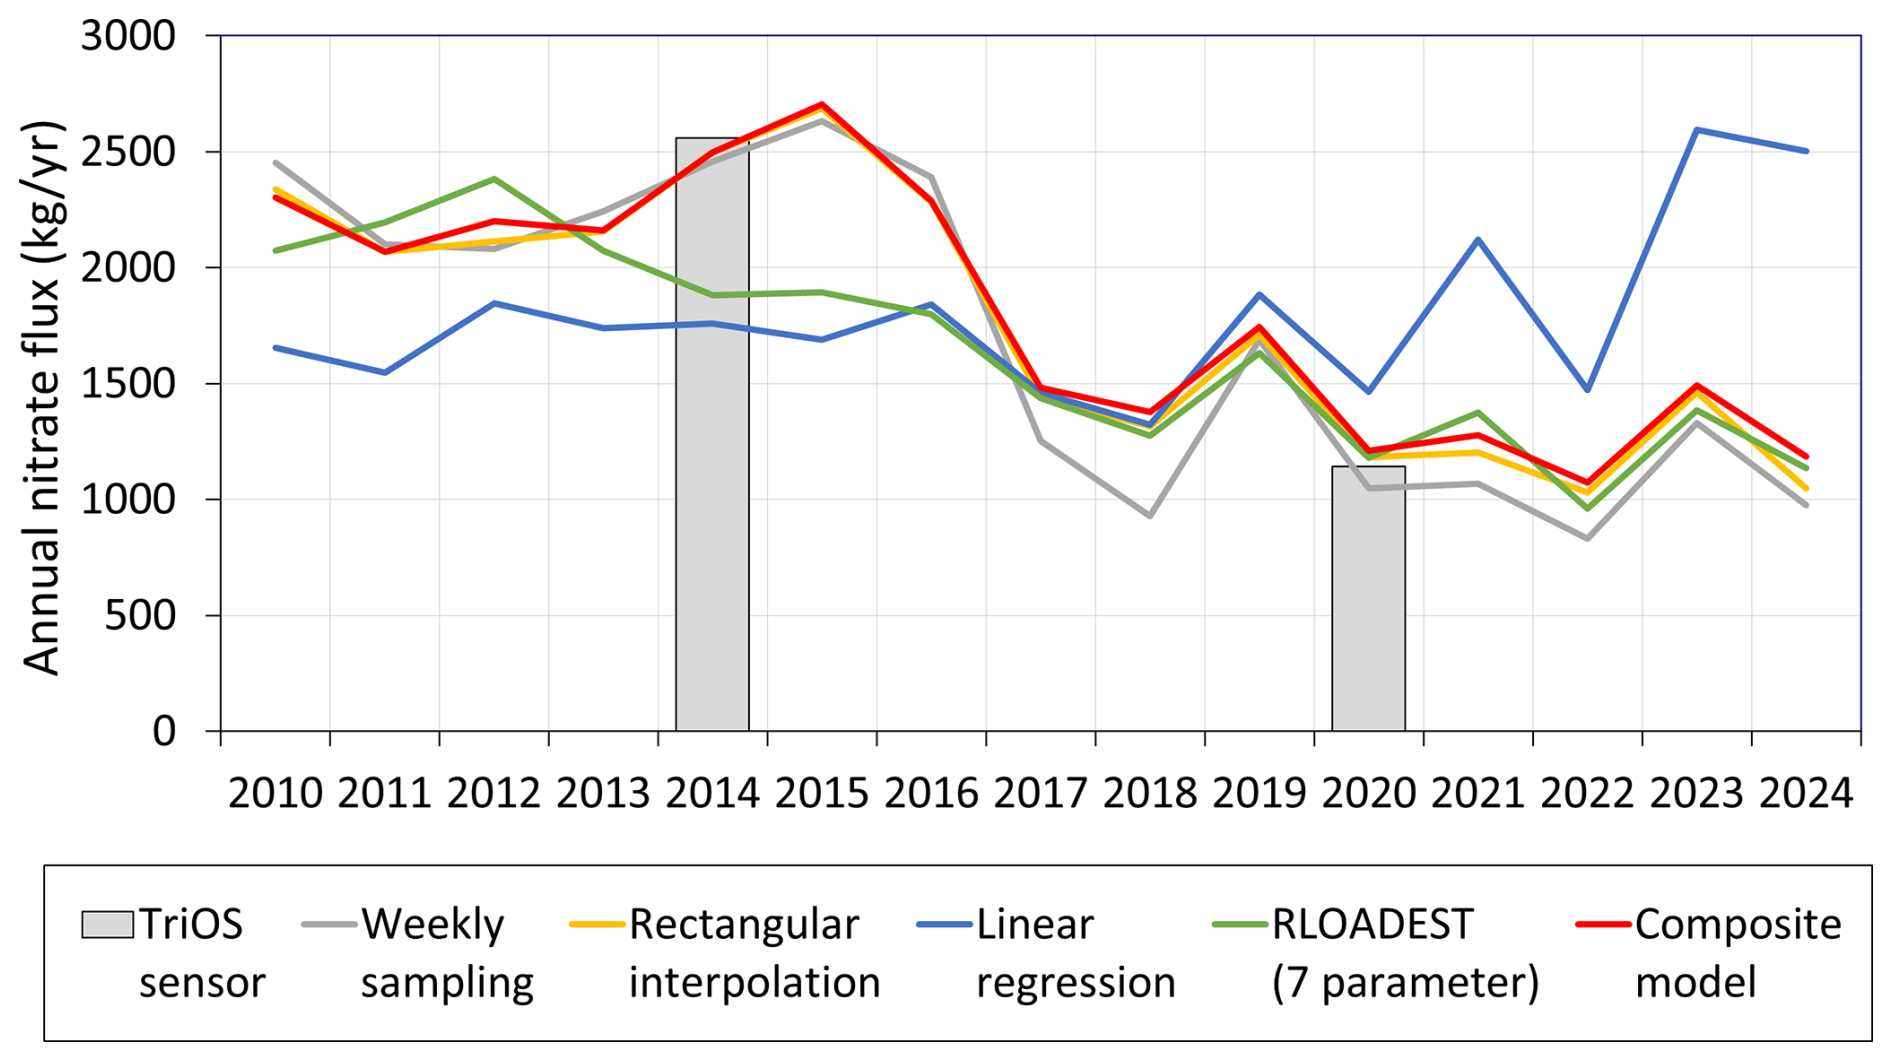
Figure 7Predictions of the annual nitrate fluxes at WU14 using different solute models, weekly sampling data, as well as hourly nitrate concentration measurements with the TriOS-sensor for 2014 and 2020.
The predicted DOC concentrations at WU14 and WU 17 are presented in Fig. A7. To assess the effects of the different concentration models on the calculation of the DOC flux, annual DOC fluxes over the entire period were also calculated (Fig. 8).
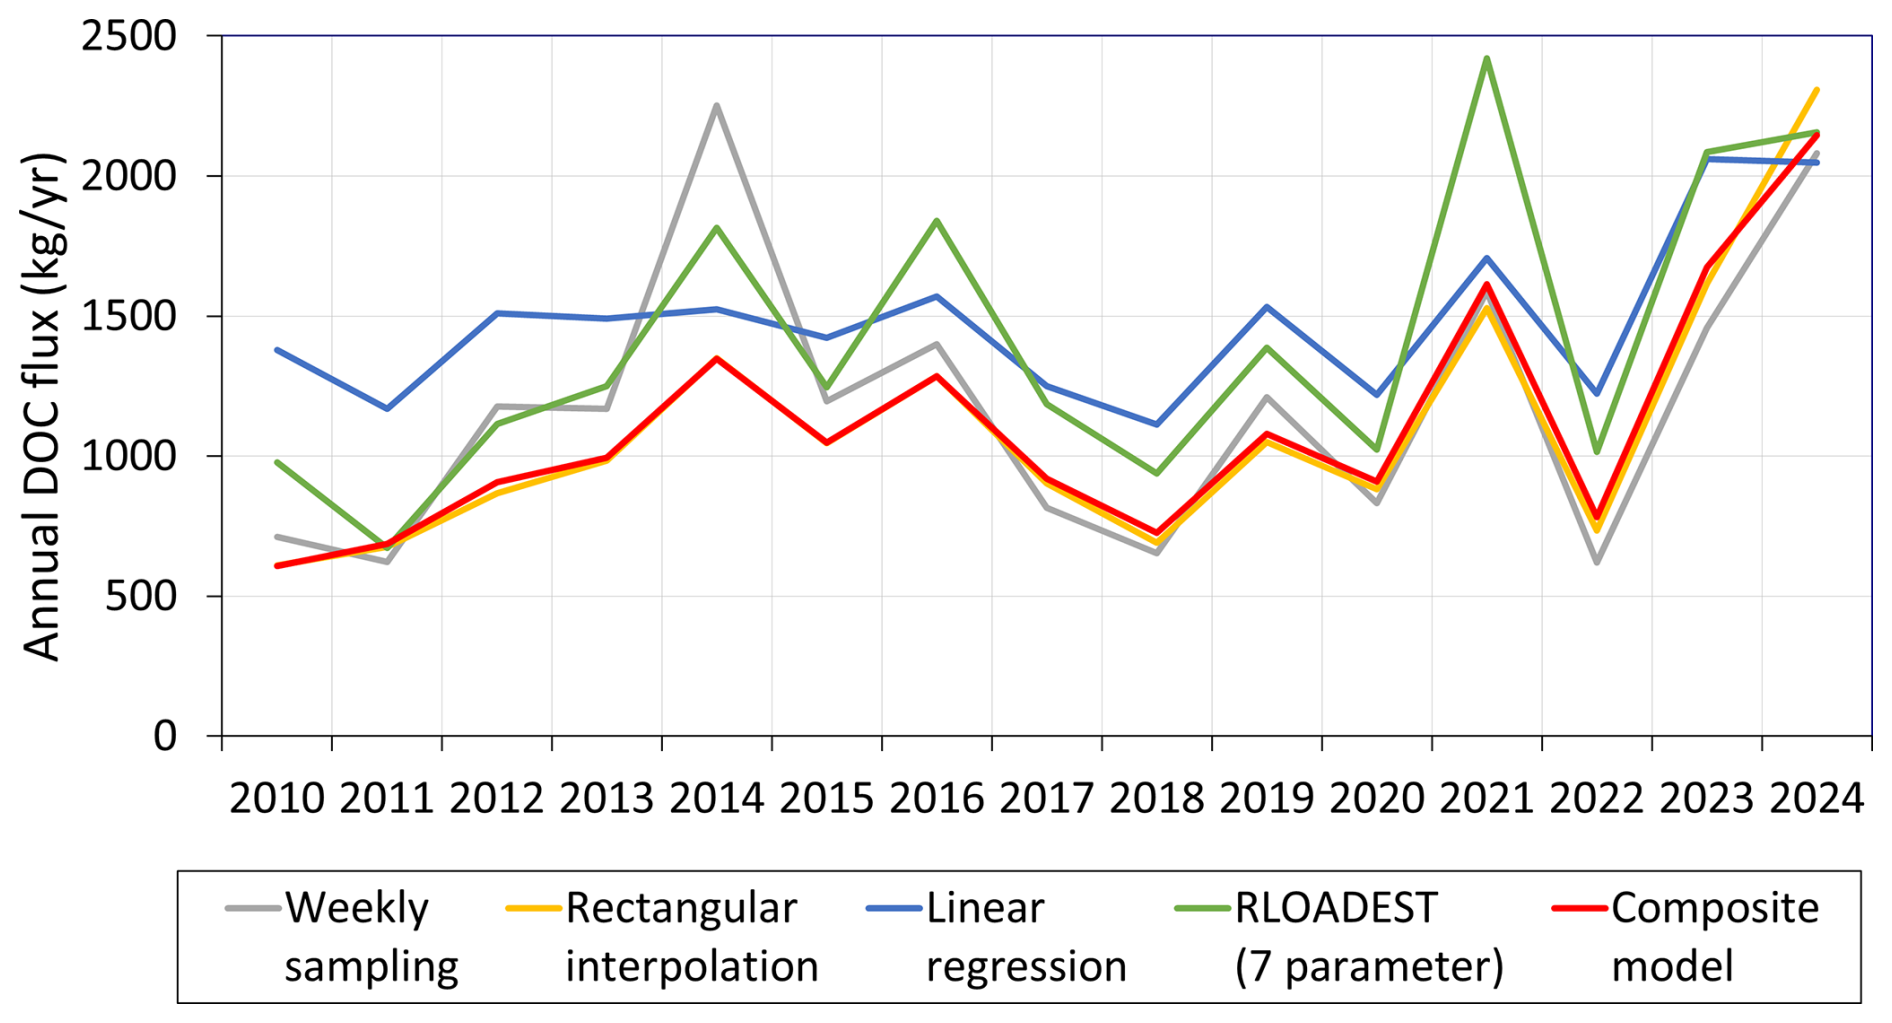
Figure 8Predictions of the annual DOC fluxes at WU14 using different solute models as well as the weekly sampling data.
Compared to the annual DOC flux calculated using the composite model, the linear regression (42.1 %) and the RLOADEST method (48.5 %) show the greatest deviations, while the `weekly sampling' variant only deviates by 6 %. The smallest deviation in annual DOC flux occurs in relation to rectangular interpolation methods is (−1.5 %).
4.2 Predicted solute concentrations
Figures 9 and A8 show the predicted hourly concentrations of all considered solutes using the composite model at WU14 and WU17, respectively.
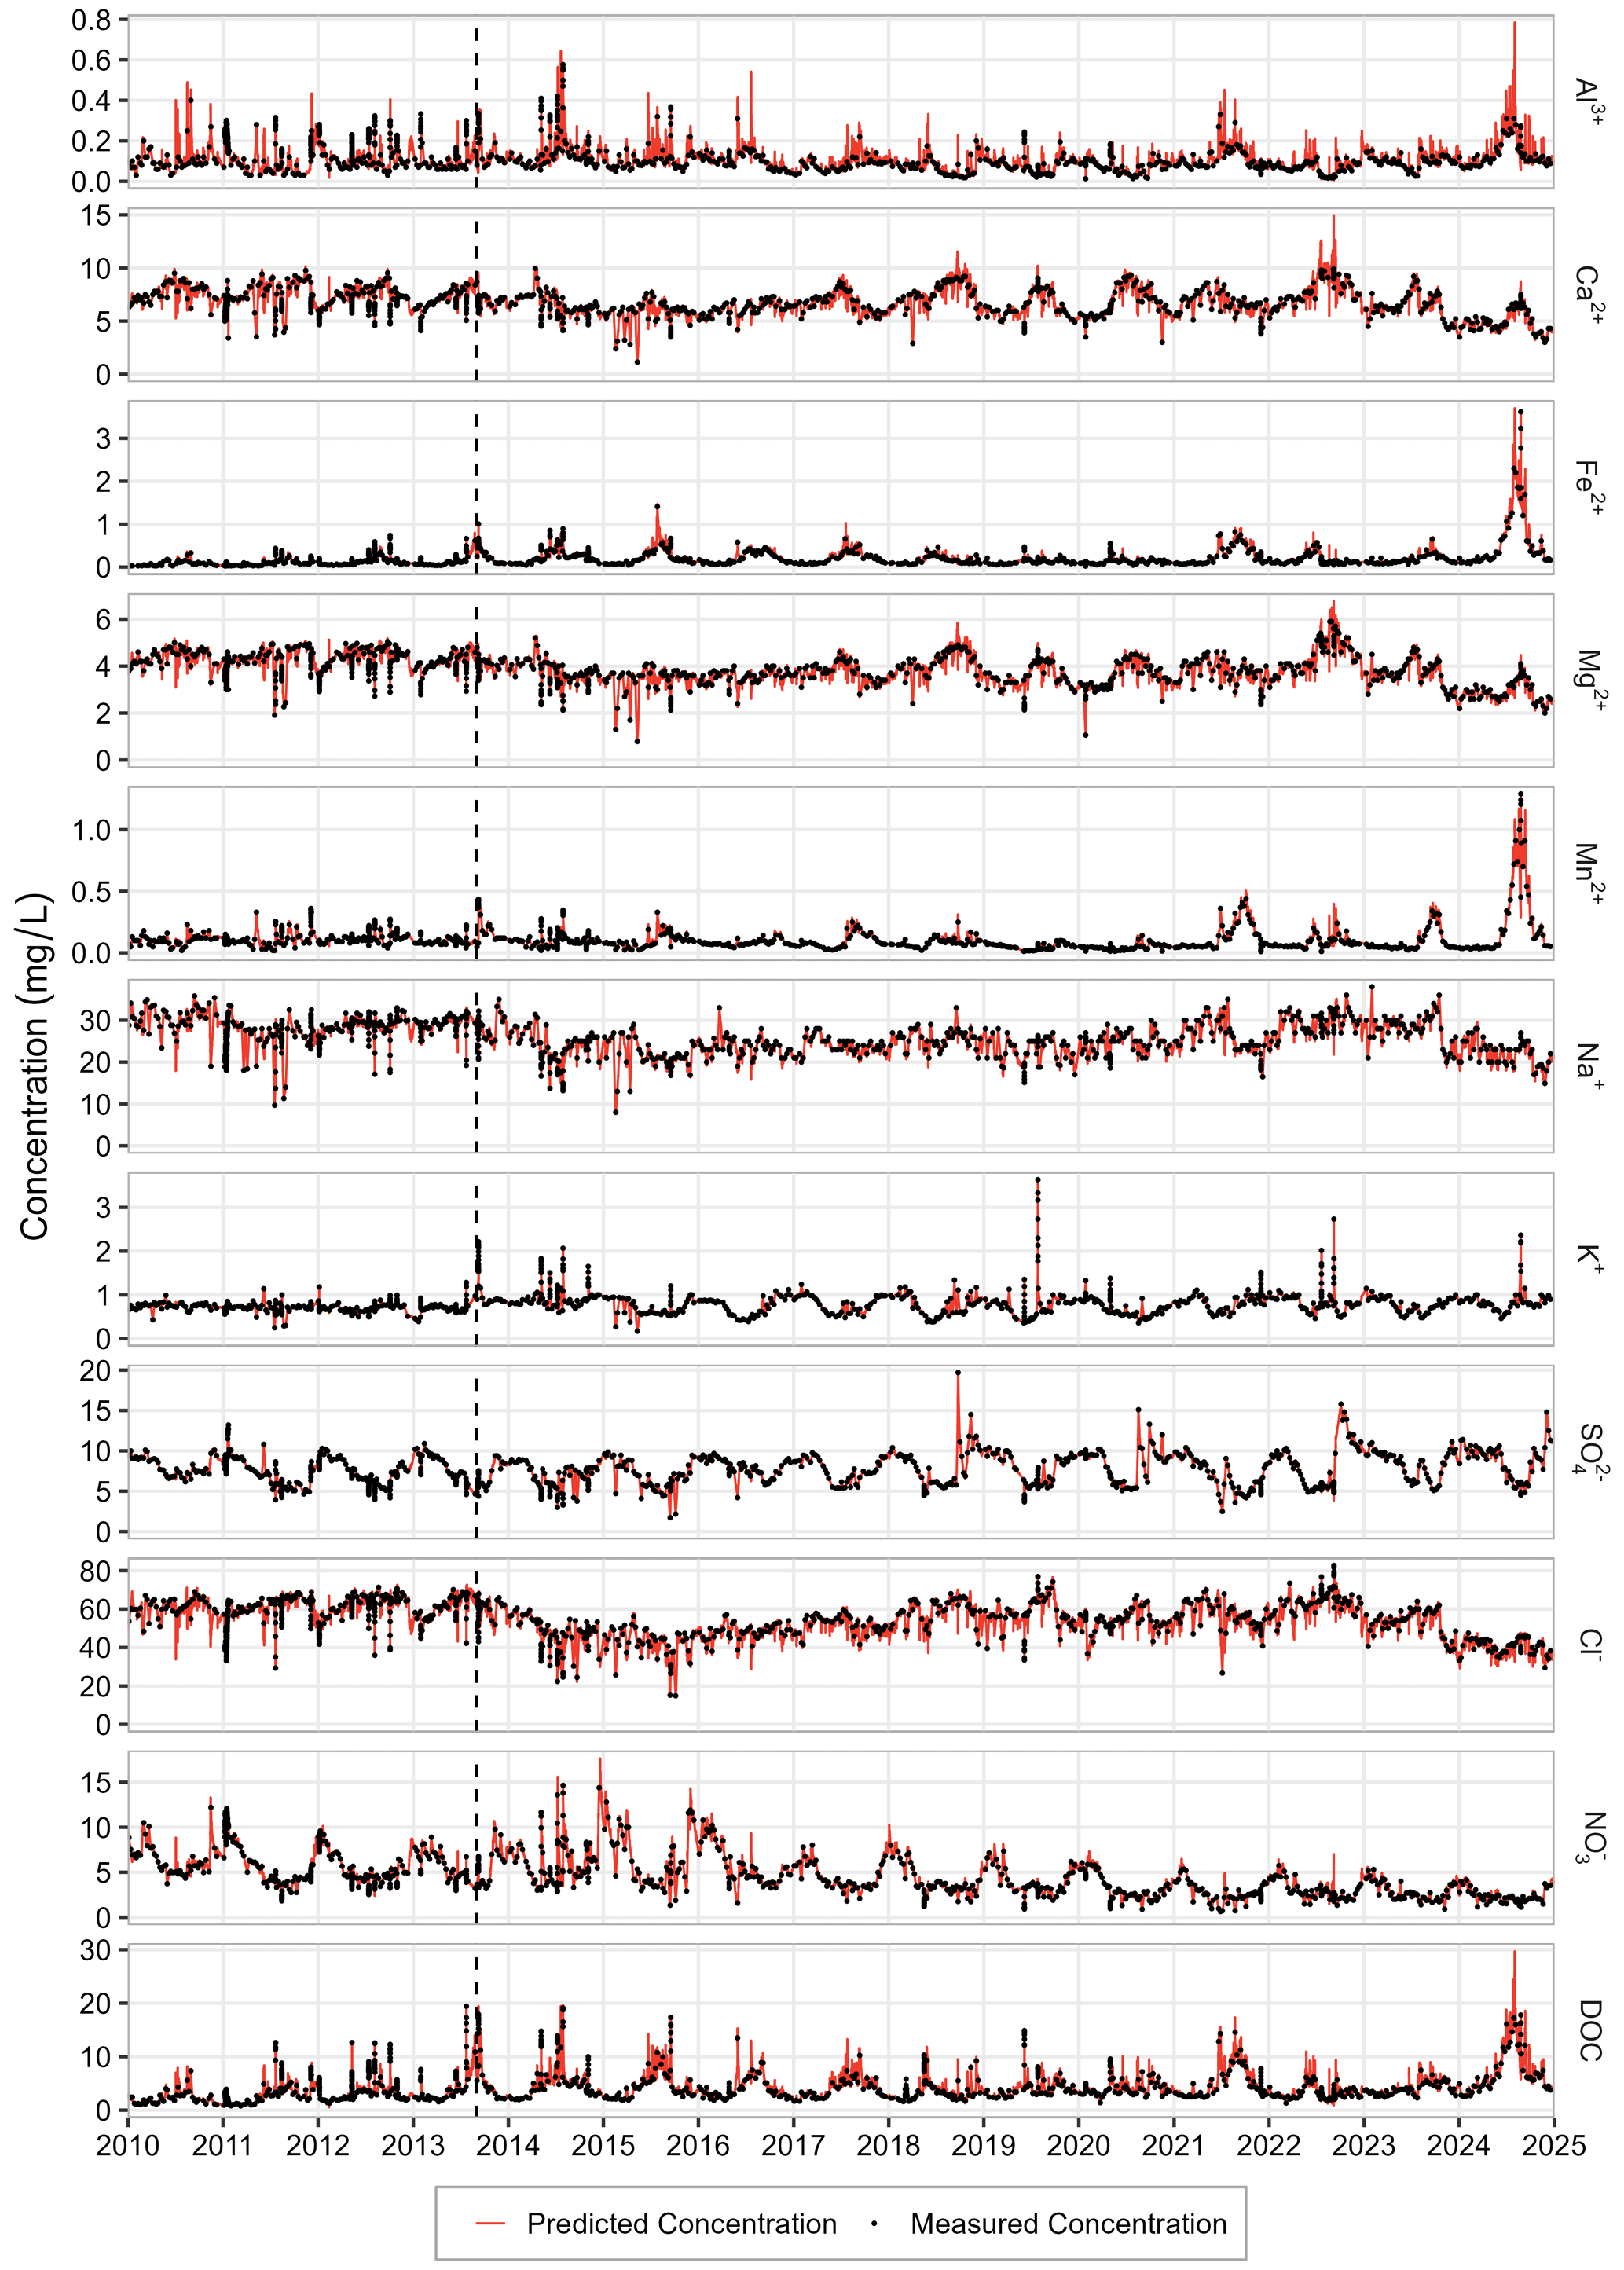
Figure 9Predicted hourly concentrations of all considered solutes at WU14 using the composite model. The dashed line indicates the time of clear-cutting.
The solute concentrations at WU14 and WU17 exhibit sub-daily and seasonal variations of varying intensity, which are obviously very well reproduced by the composite model. However, it should be noted that the model produces a few concentration peaks for Al3+, Ca2+, NO and DOC, which are not supported by the observations.
The annual average concentrations of the solutes considered show varying long-term trends (Fig. A9a). For example, in the Wüstebach stream (WU14), the concentrations of Mg2+ and NO show significant decreasing trends during the complete observation period, while DOC and Fe2+ show significant increasing trends at a significance level of 0.05 (Table A5). Interestingly, the reference stream (WU17) shows similar trends for most solutes, indicating that the deforestation in the Wüstebach catchment is not the primary cause of these trends (Fig. A9b, Table A5). For example, the decreasing trend in nitrate concentration is presumably related to the underplanting of beeches throughout the entire spruce stand, which absorb additional nitrogen from the soil. The background to the underplanting is that the entire spruce stand will be cleared by the mid-2030s, allowing a near-natural mixed beech forest to develop. It should be noted that nitrate export patterns at long-term scales (analyzed using low-frequency data) and at event scales (analyzed using high-frequency data) can differ substantially, as different mechanisms dominate at different temporal scales (Winter et al., 2024).
An interesting anomaly is that in the Wüstebach the Fe2+ concentrations in 2024 were significantly higher than in previous years (average Fe2+ concentration for 2010–2023 was 0.15 mg L−1 and for 2024 it was 0.57 mg L−1, an increase of 283 %). One hypothesis for the high iron concentrations in the Wüstebach stream is that they are related to the anomalous redox conditions in the soils of the riparian zone (Tittel et al., 2022). In support of this thesis the alluvial soils in the riparian zone of the Wüstebach catchment (corresponds to the blue colors in Fig. 1) were saturated for longer periods than usual due to the wetter conditions in the last two years (i.e. the mean annual precipitation for 2010–2022 was 1141 mm and for 2023–2024 it was 1488 mm). Under waterlogged conditions, oxygen availability decreases, creating an anaerobic environment that promotes microbial reduction of ferric (Fe3+) oxides to soluble ferrous (Fe2+) iron (Ekström et al., 2016). If this occurs in hydraulically connected soils, Fe2+ is transported into the stream. This hypothesis is also supported by the exceptionally high Mn2+ concentrations in 2024 (average Mn2+ concentration for 2010–2023 was 0.09 mg L−1 and for 2024 it was 0.25 mg L−1, an increase of 172 %), since manganese (Mn4+) oxides are also reduced under waterlogged conditions (Canfield et al., 1993; Škerlep et al., 2023). In addition, higher Fe2+ and Mn2+ concentrations were also found in groundwater samples taken in the riparian zone in 2024 (data not shown), whereas Fe2+ and Mn2+ concentrations in the reference stream (WU17) showed no increase in 2024 due to the lack of a larger riparian zone.
This example illustrates the advantage of long-term data series on the one hand, and on the other hand, the existence of complementary data, such as the additional measurements in the reference catchment, to reveal the complex relationships in solute transport.
4.3 Predicted solute fluxes
Figure 10 shows the predicted annual fluxes per unit area (km2) of all considered solutes using the composite model for the Wüstebach and reference streams, respectively. The conversion to a unit area facilitates the comparison of fluxes for different streams. In the reference stream, the annual solute fluxes of the ions considered ranged from less than 39.1 kg km−2 a−1 (Fe2+) to 4929.5 kg km−2 a−1 (SO4−). The fluxes of NO and Cl− are in the middle range at 1958.2 and 2033.7 kg km−2 a−1, respectively. The cations with the highest mean annual fluxes were Ca and Na with 1128.6 and 1127.1 kg km−2 a−1, respectively. The lowest annual solute fluxes occurred in the drought year 2018 (47 % of the average total annual solute fluxes), mainly due to low runoff in that year (67 % of the long-time average observed runoff at WU17).
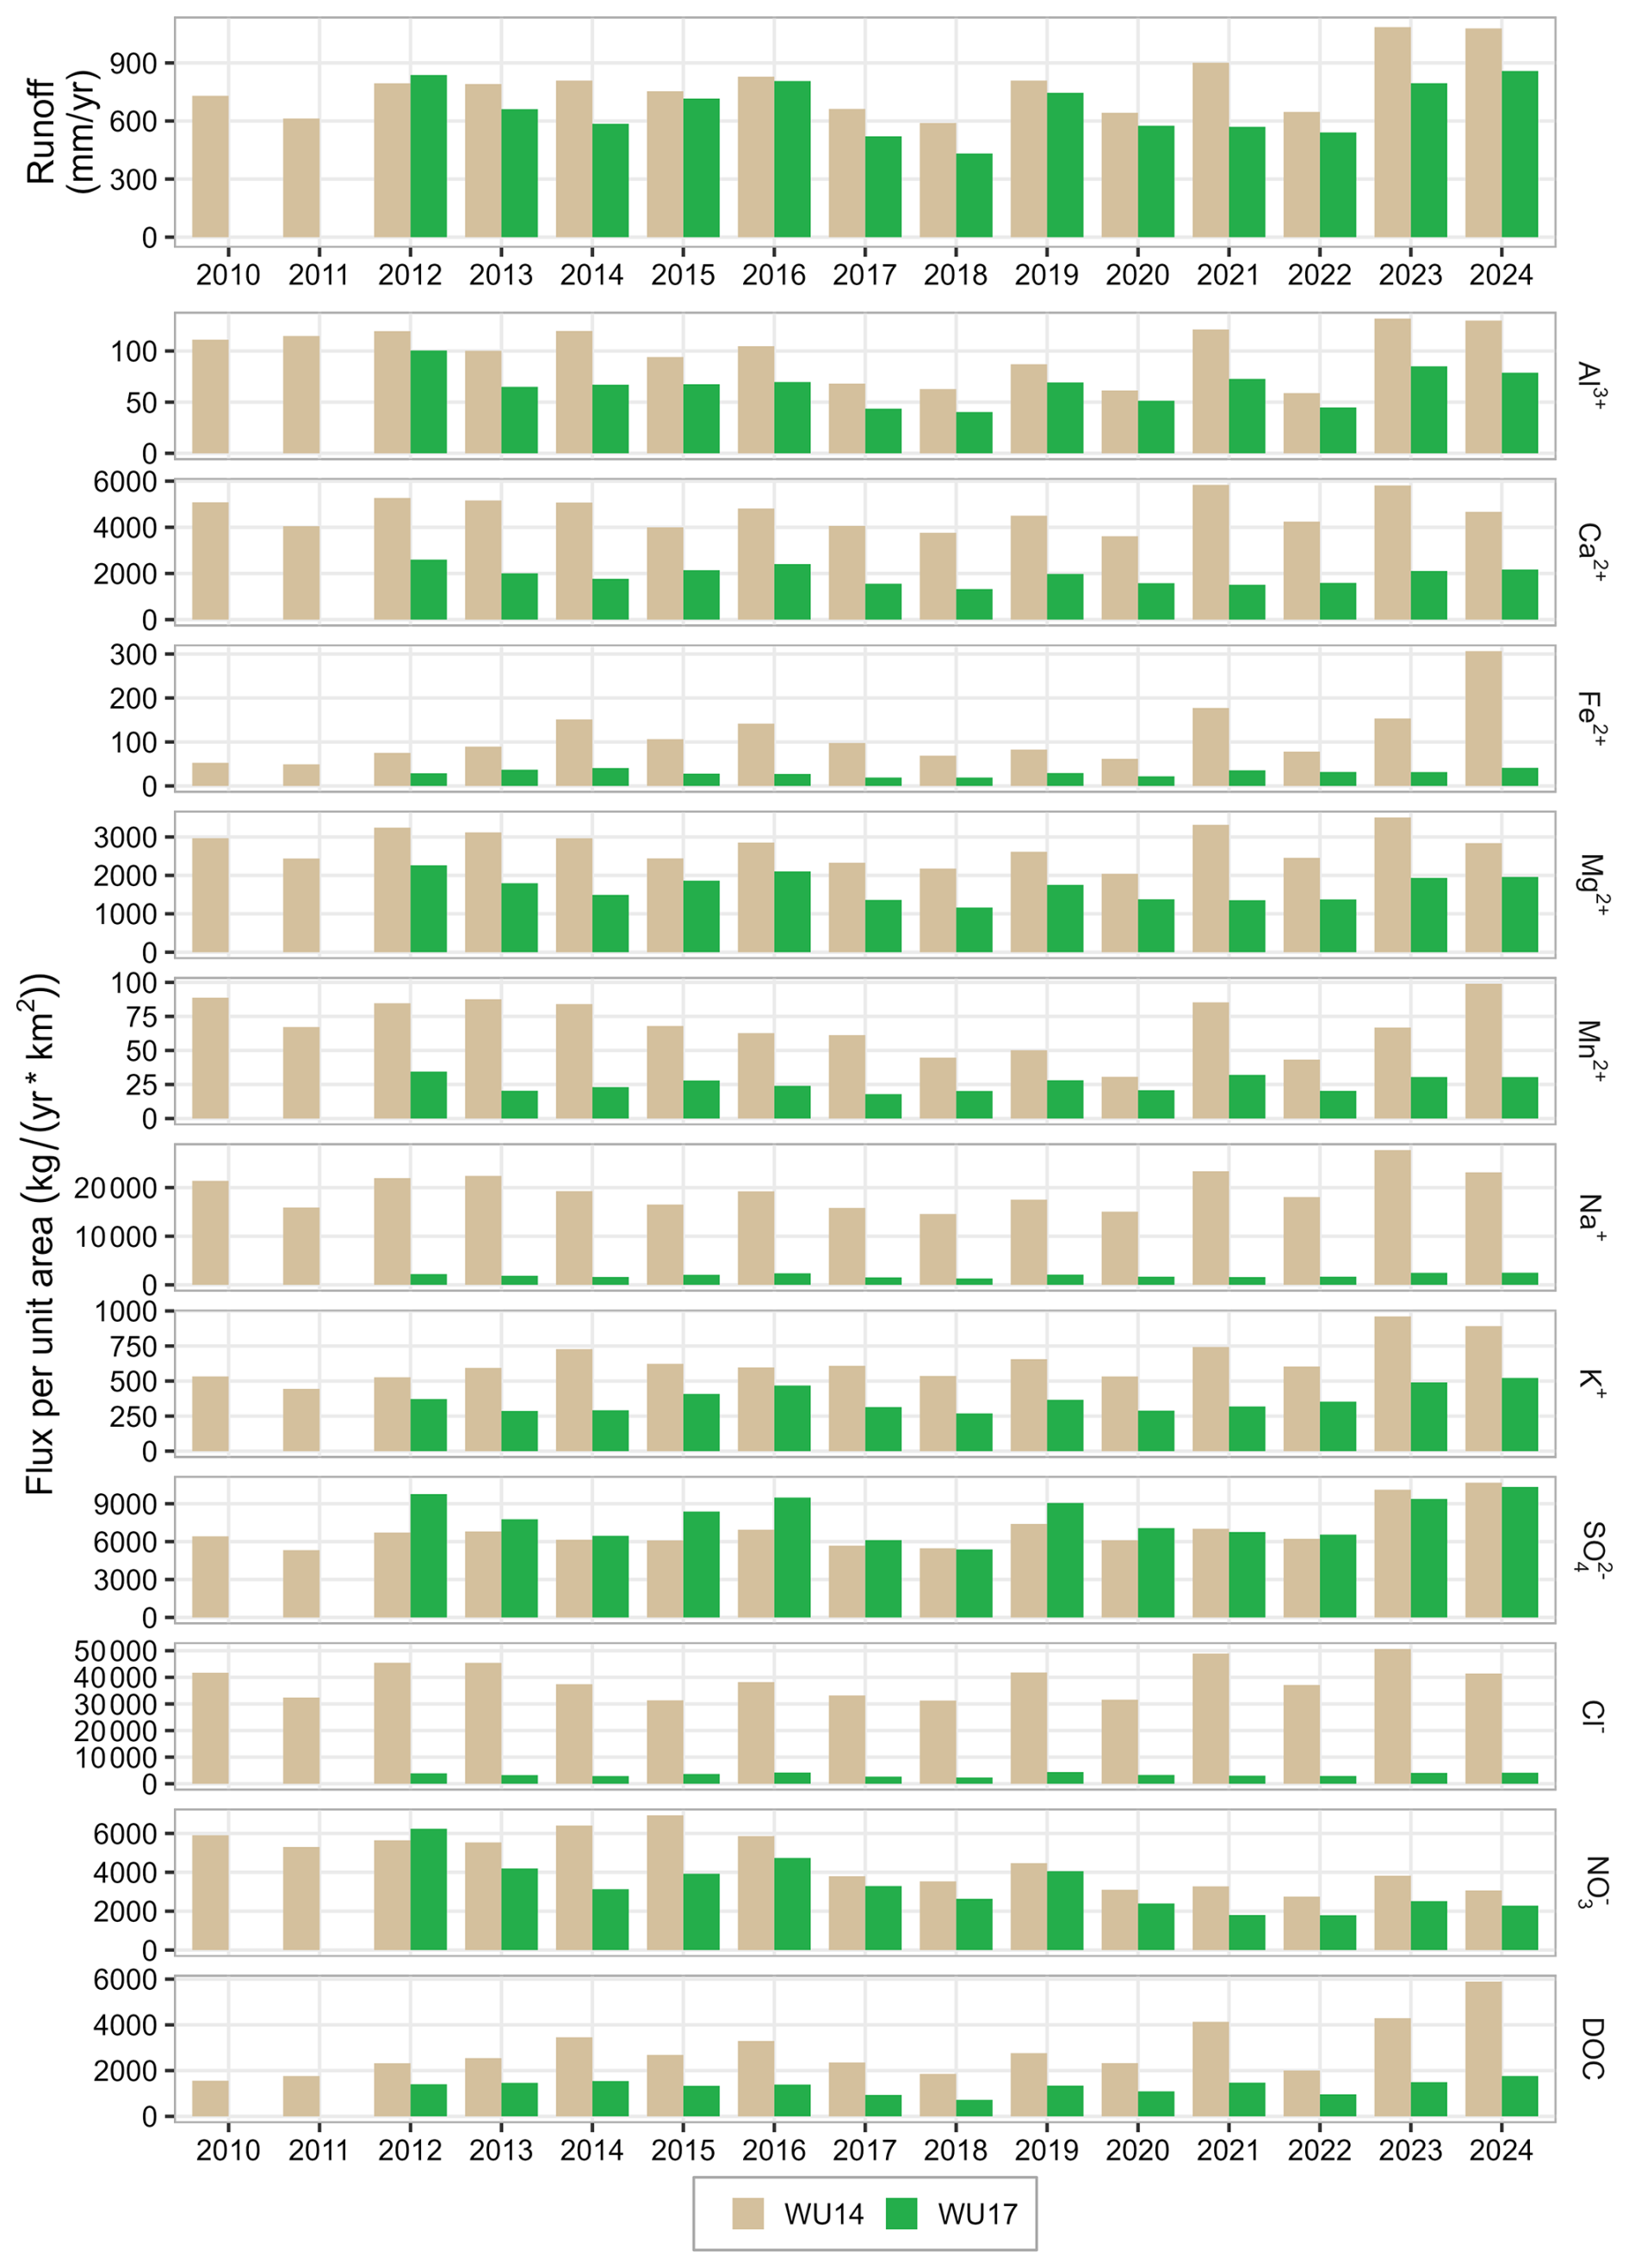
Figure 10Runoff and annual fluxes of all considered solutes using the composite model for the Wüstebach (WU14) and reference stream (WU17), respectively.
In the Wüstebach stream, the average annual total solute flux (i.e. 77.9 t km−2 a−1) was six times higher than in the reference stream (i.e. 13.0 t km−2 a−1). One reason for this was that the total annual flow of dissolved substances of Na+ and Cl− was sixteen and eighteen times higher in the Wüstebach stream, i.e. 18.6 and 37.4 t km−2 a−1, respectively , due to the input of de-icing salt on the road that crosses the catchment (Płaczkowska et al., 2022, 2024).
In the Wüstebach stream, five solutes show significant long-term trends in the annual fluxes: Fe2+, K+ and DOC show significant increasing trends while those of NO and SO show significant decreasing trends (Fig. A10a, Table A5). In contrast, the reference stream shows only significant decreasing trends of NO (Fig. A10b, Table A5).
The described long-term data set, the R scripts to generate the plots from the data and the geospatial data presented in Fig. 1 are directly accessible via a digital object identifier (DOI) and is freely available at https://doi.org/10.26165/JUELICH-DATA/AKAMNQ (Bogena and Herrmann, 2025). All timestamps associated with the data records are recorded in Coordinated Universal Time (UTC). Table A6 in the Appendix provides an overview of the published data files. Further data from instrumentation in the Wüstebach catchment are freely available via the TERENO data portal TEODOOR (http://teodoor.icg.kfa-juelich.de/, last access: 3 December 2025). In addition, inquiries about data and research collaborations can be directed to the lead author (h.bogena@fz-juelich.de).
In this data paper, we present 16 years of hourly stream-water flux data of nine continuously monitored macro- and micronutrients, as well as dissolved ionic aluminum and DOC, in the Wüstebach catchment. The basis for the solute fluxes is continuous discharge and water quality data collected as part of a deforestation experiment. To enable analysis of the effects of the deforestation measure on solute transport, these data were also collected in a neighboring catchment (i.e. reference stream).
To ascertain the most appropriate method for predicting continuous solute concentrations, four well-known methods were applied and compared with high-resolution nitrate measurements taken in the Wüstebach stream over a period of two years. We found that both the rectangular interpolation and the composite model performed equally well in predicting solute concentrations in the Wüstebach stream.
Preliminary data analysis of the comprehensive data set on concentrations and stream-water fluxes of dissolved substances shows great potential for analyzing the influence of deforestation and afforestation on the fluxes of dissolved substances at the catchment scale. In addition, the effects of extreme dry and wet years on the concentrations and fluxes of substances can be investigated in more detail using the environmental monitoring data available at the Wüstebach site.
The data processing employed in this study is currently state of the art. However, this may be subject to alteration considering future research. Consequently, we offer raw data and undertake to revise the published dataset with an incremental version, should novel data processing methodologies be endorsed in the future. Since the measurements in Wüstebach are still ongoing, we also plan to update the stream-water flux time series regularly, e.g. every three years.
Table A1Forest management interventions and affected areas in the Wüstebach and reference catchments (2004–2024) (unpublished data from Eifel National Park).
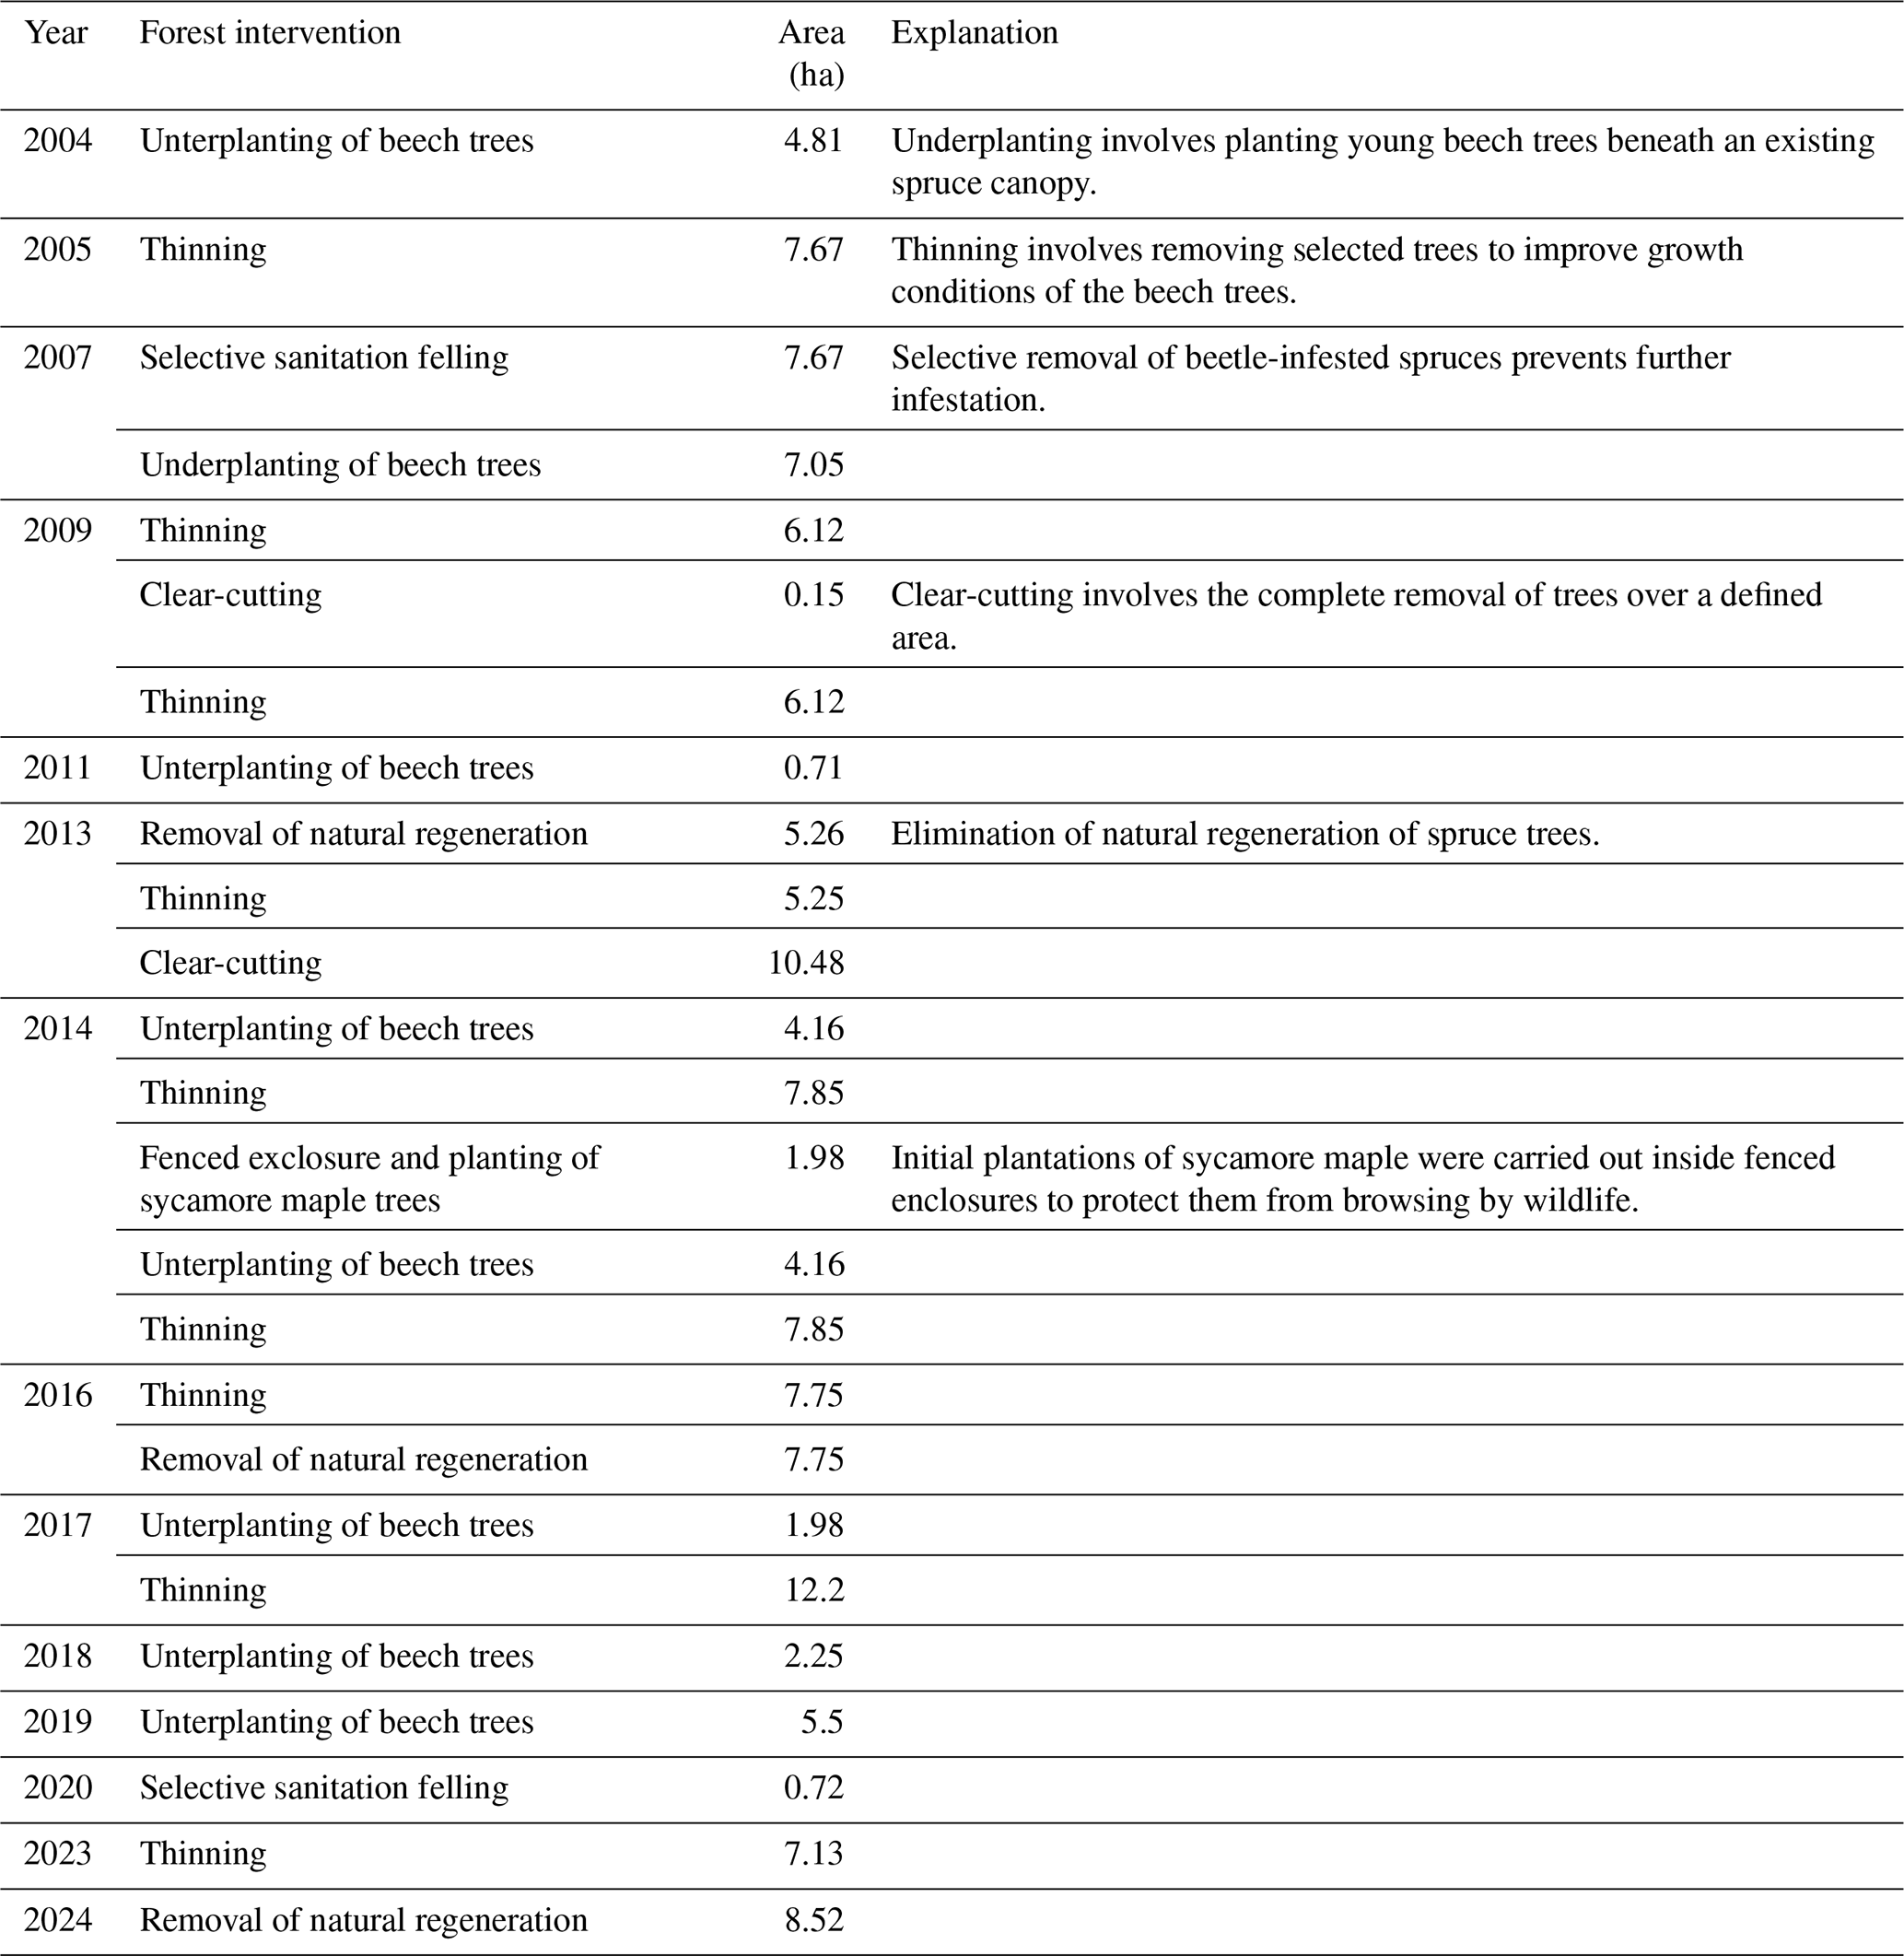
Table A2Type of measurement and geographical coordinates of the TERENO stations used in this study.
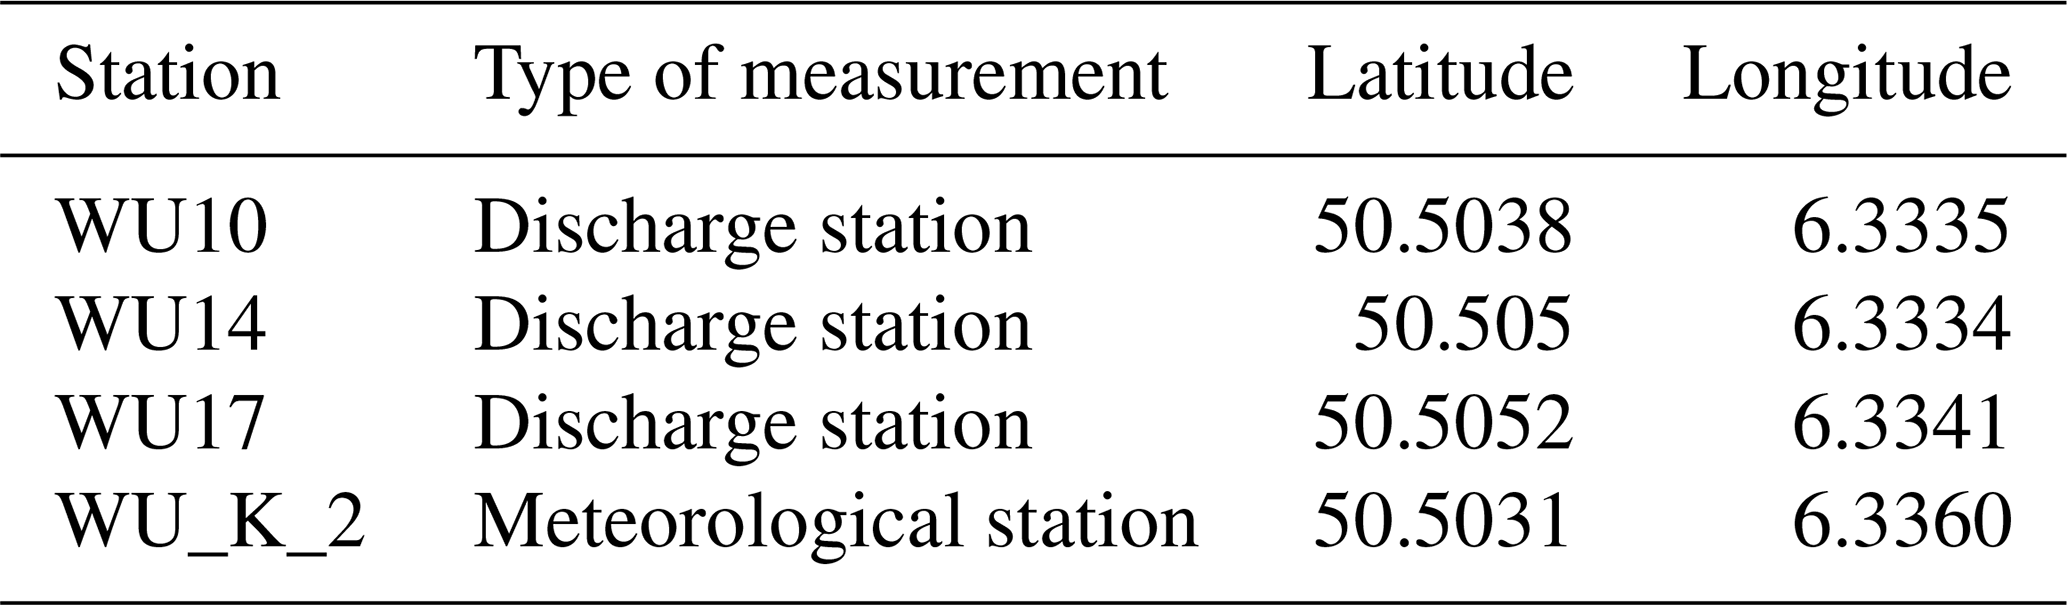
Table A3Water balance components for the hydrological year 2012 in the Wüstebach catchment (WU14) and the reference catchment (WU17), comparing different catchment area assumptions. The year 2012 was selected as it was not affected by the deforestation measure. Measured evapotranspiration (ET) from eddy covariance measurements at the ICOS station DE-RuW in the Wüstebach catchment (https://meta.icos-cp.eu/resources/stations/ES_DE-RuW, last access: 3 December 2025) is also presented.
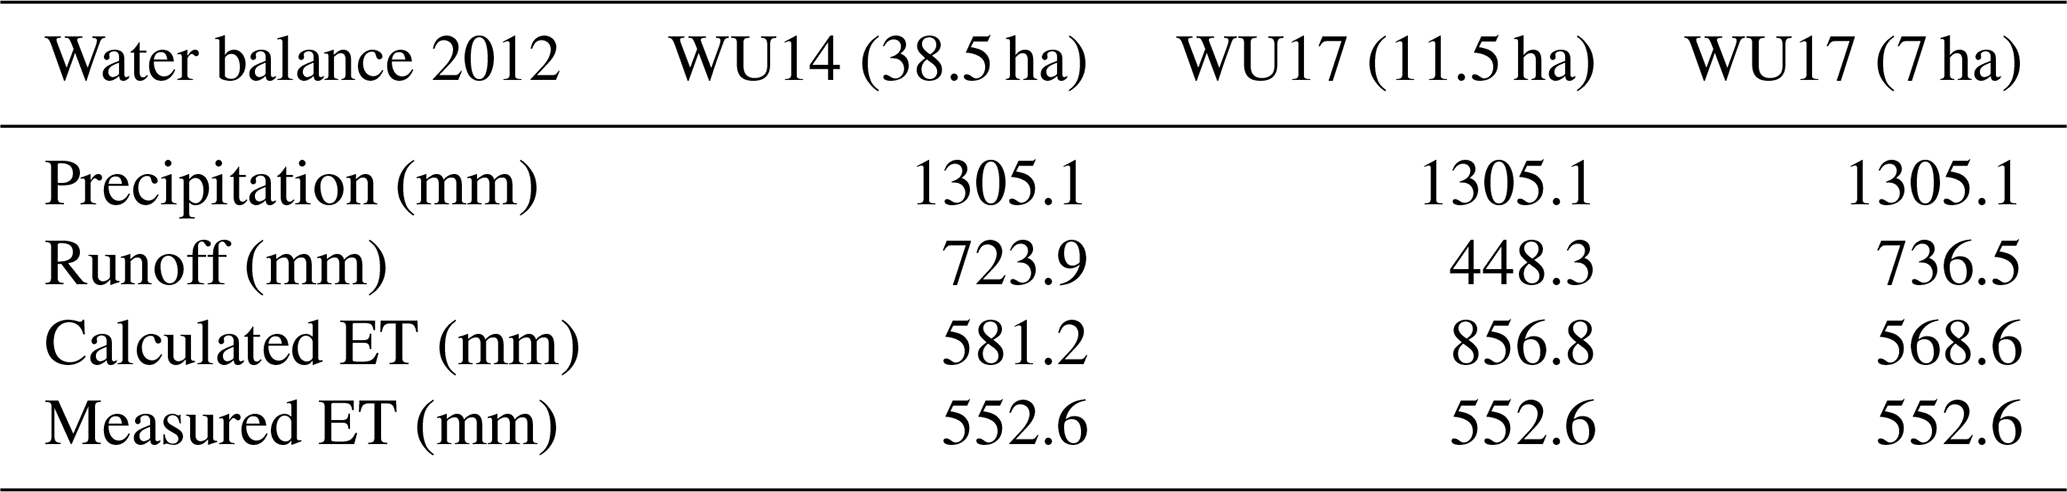
Table A4Number of stream water samples collected before and after the clear-cut for each solute, including start and end dates.
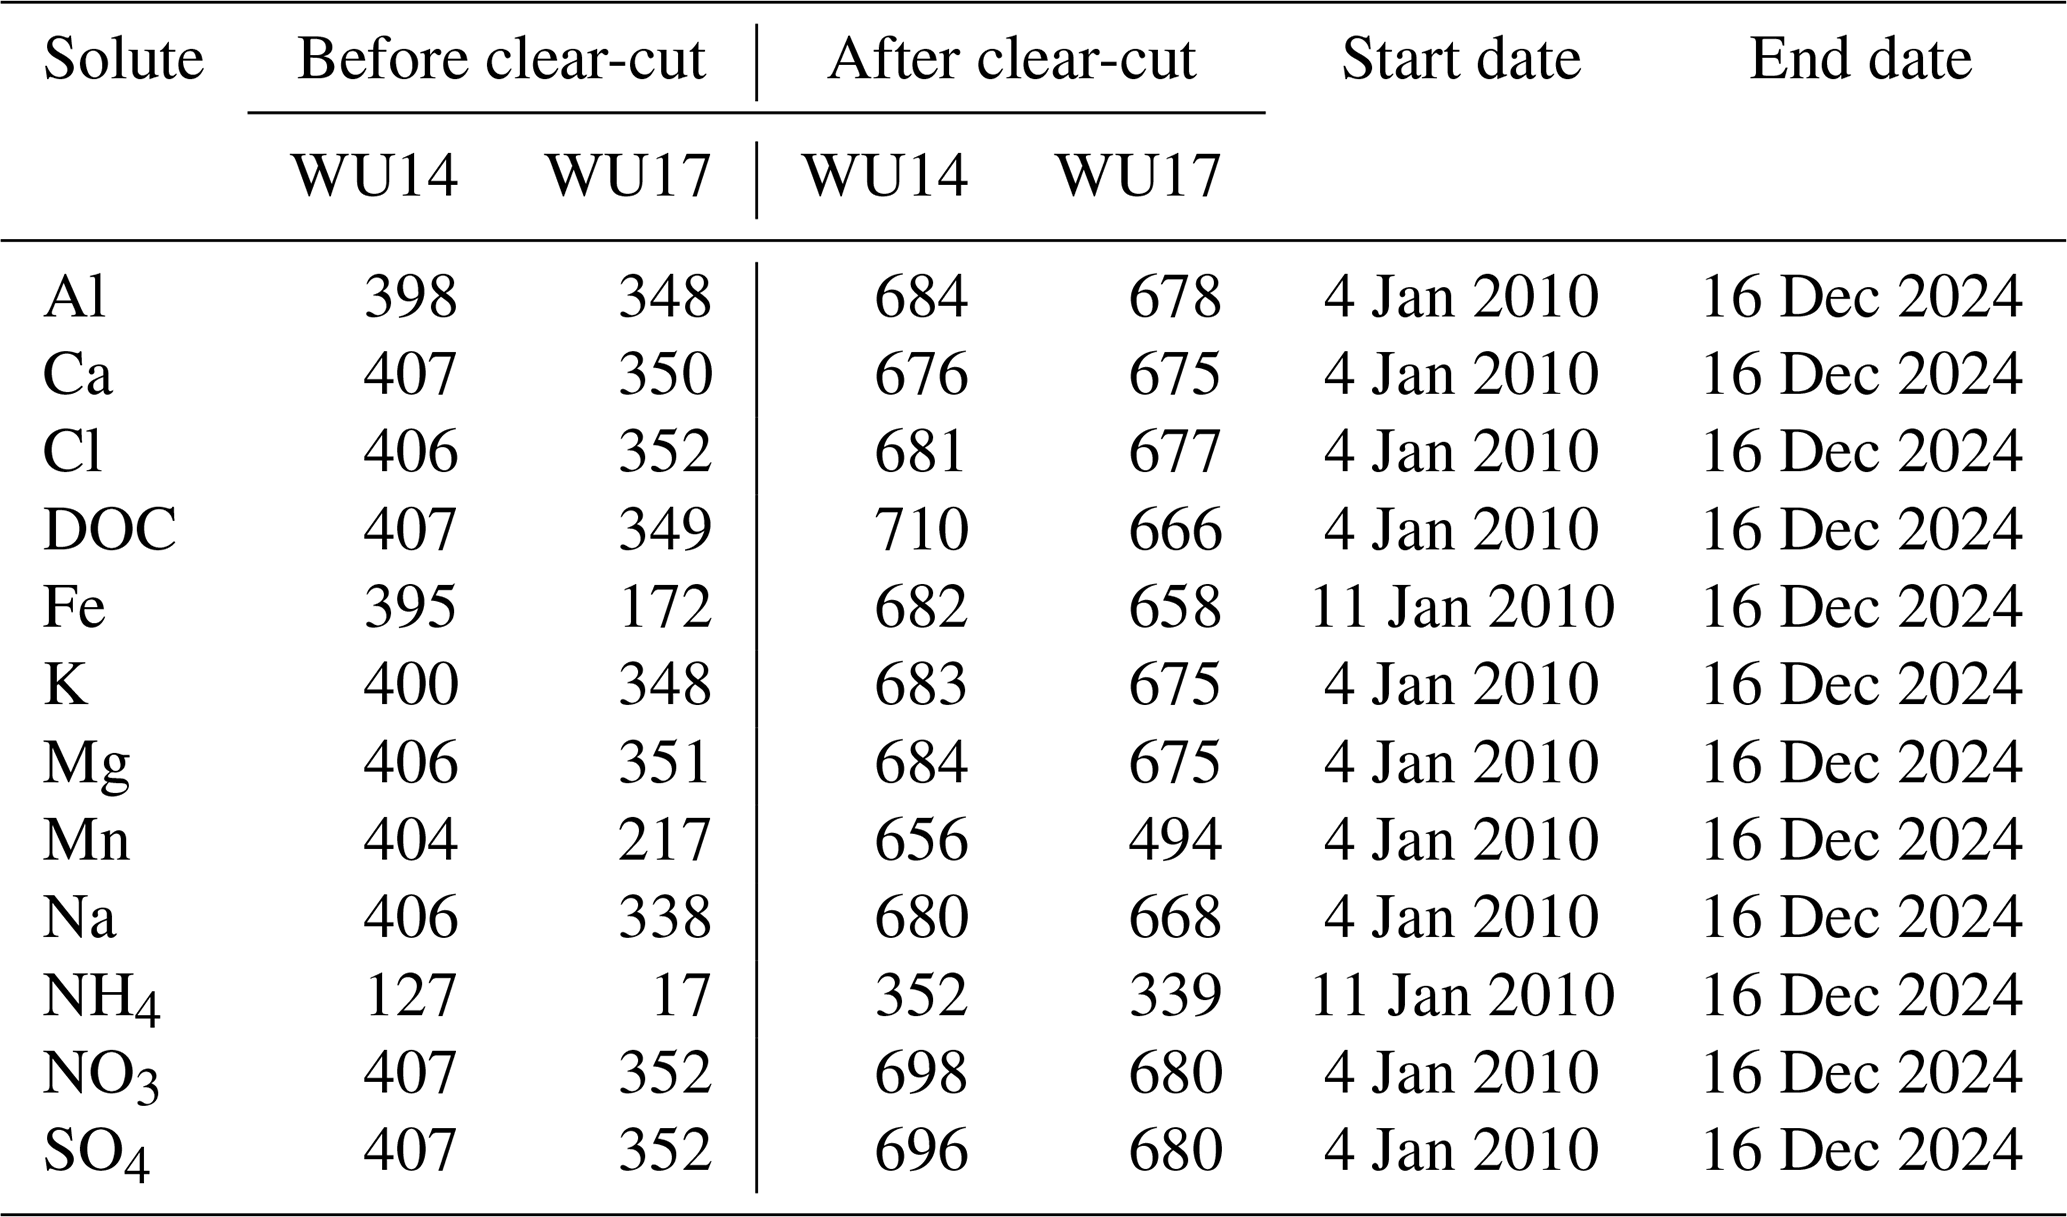
Table A5Results of the annual trend analysis. Significant trends (i.e. p-value < 0.05) are highlighted in bold. See also Fig. A10a.
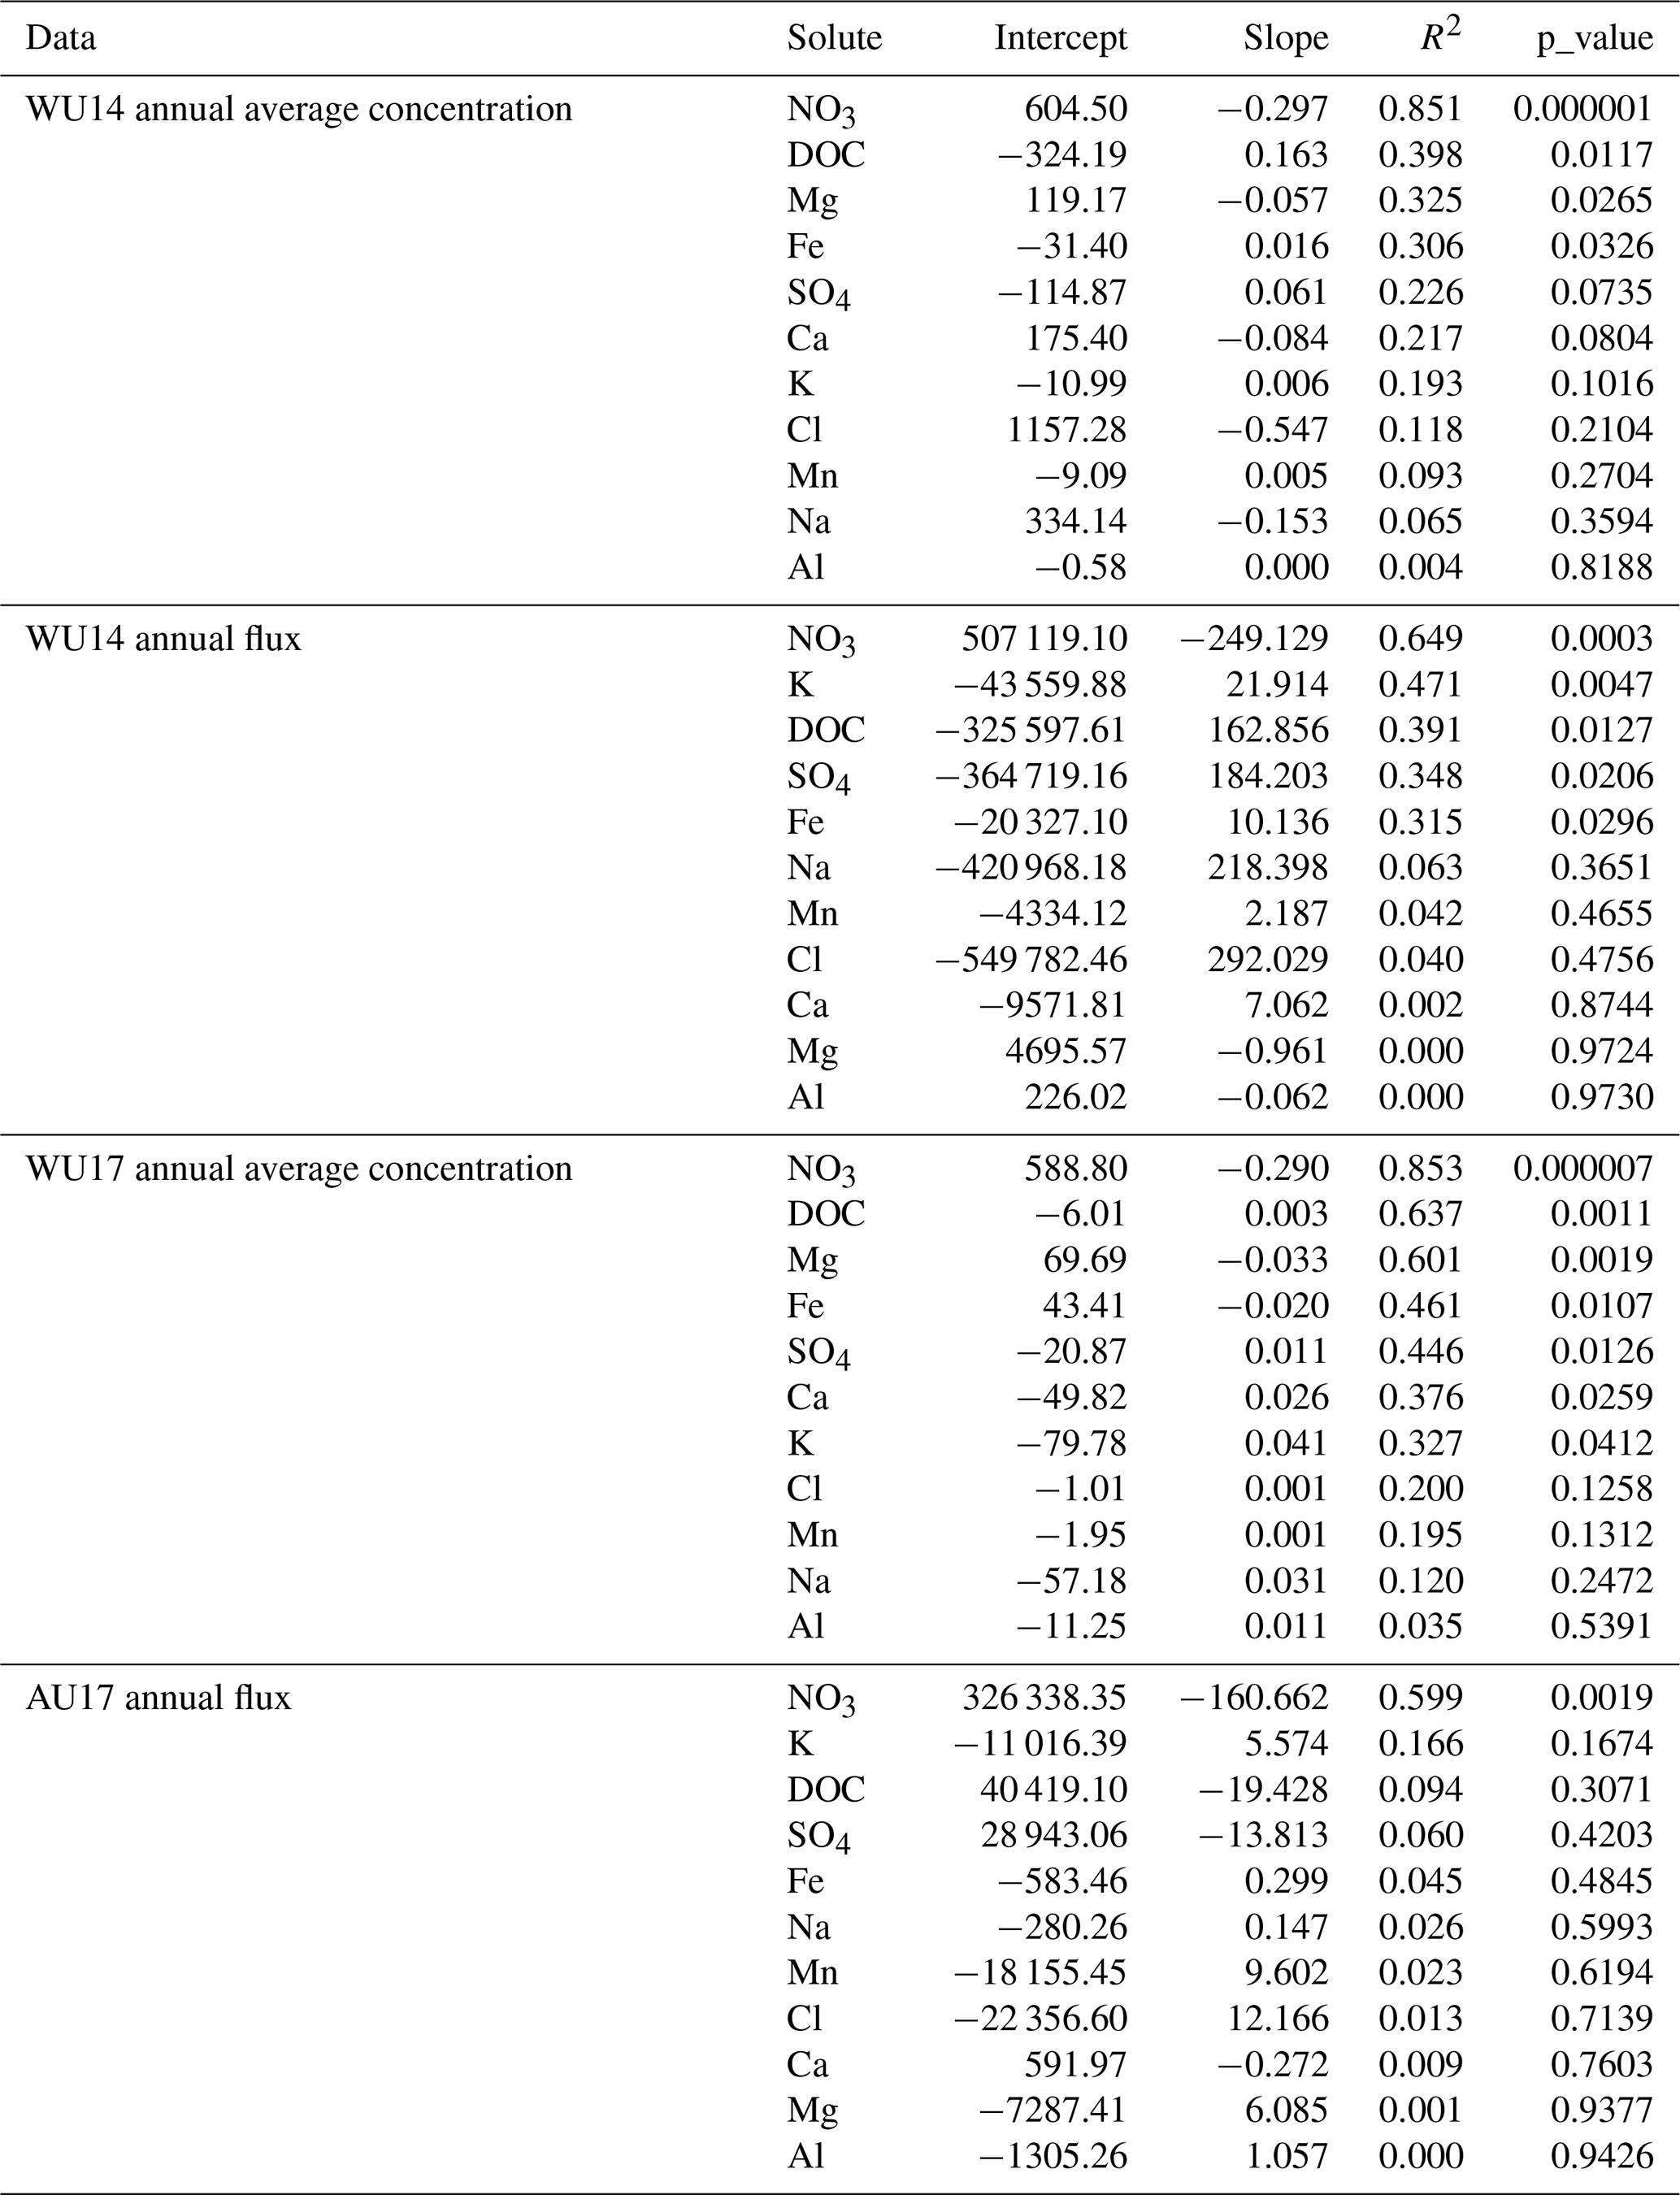
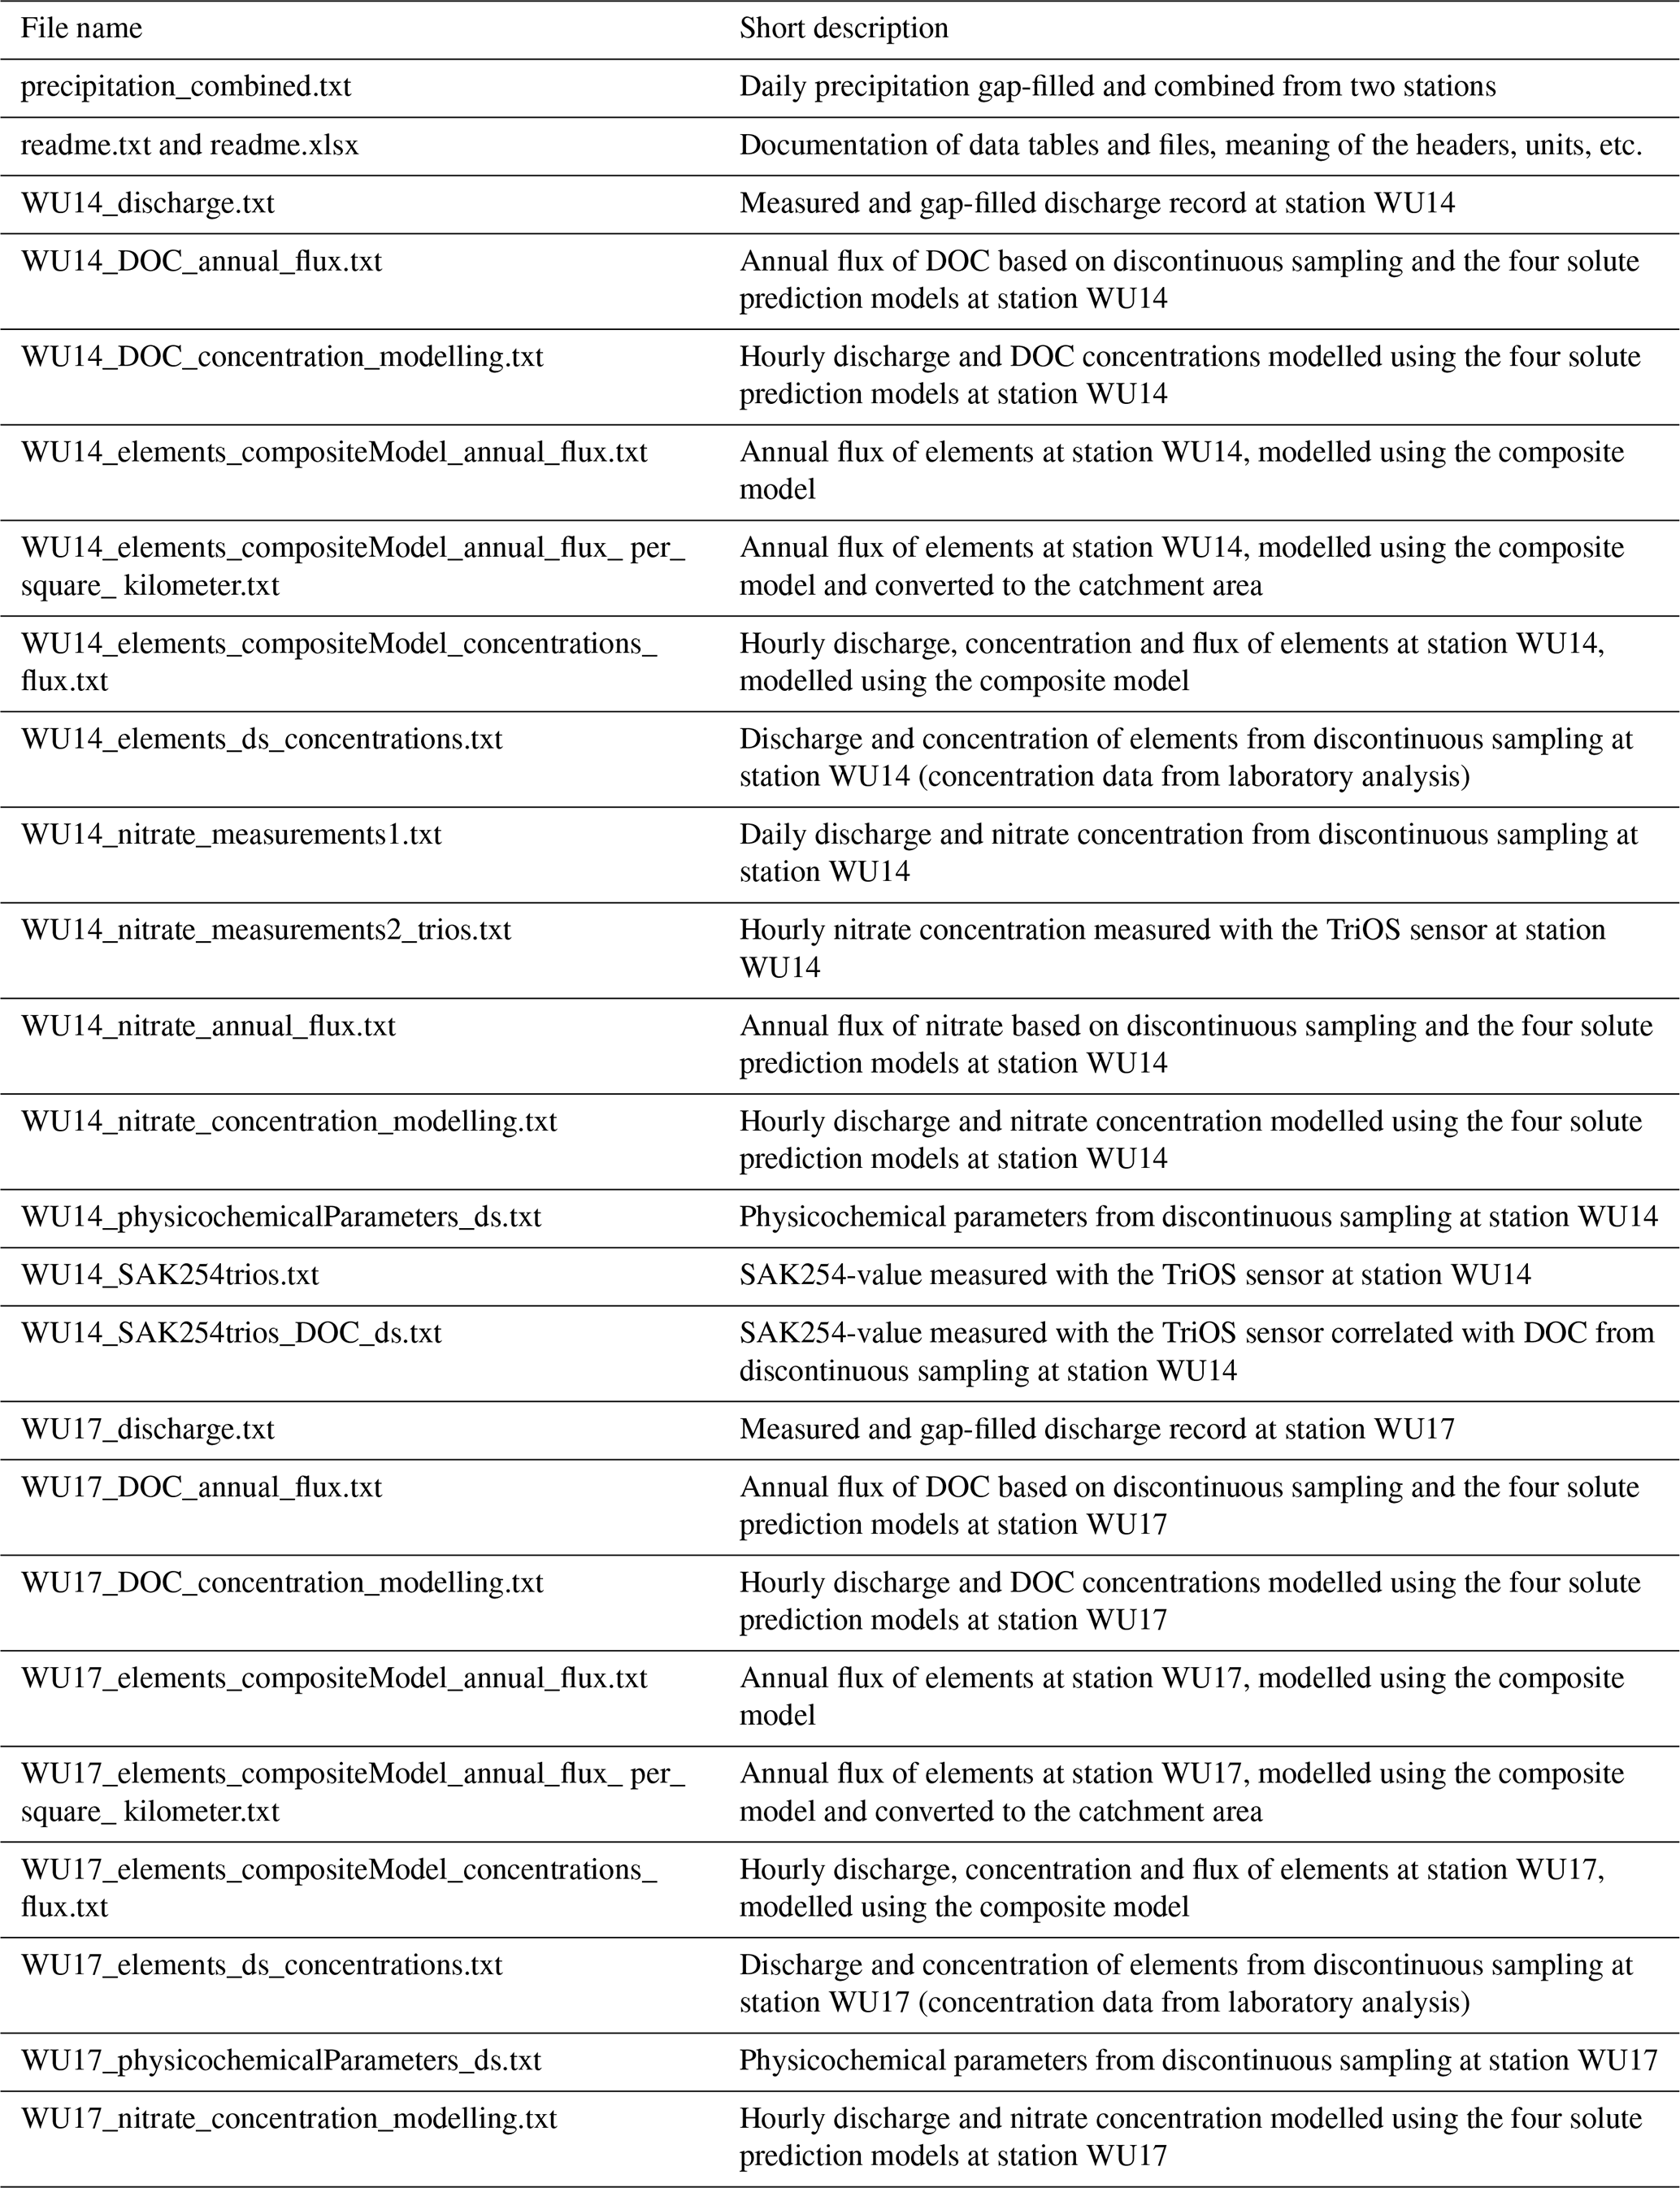
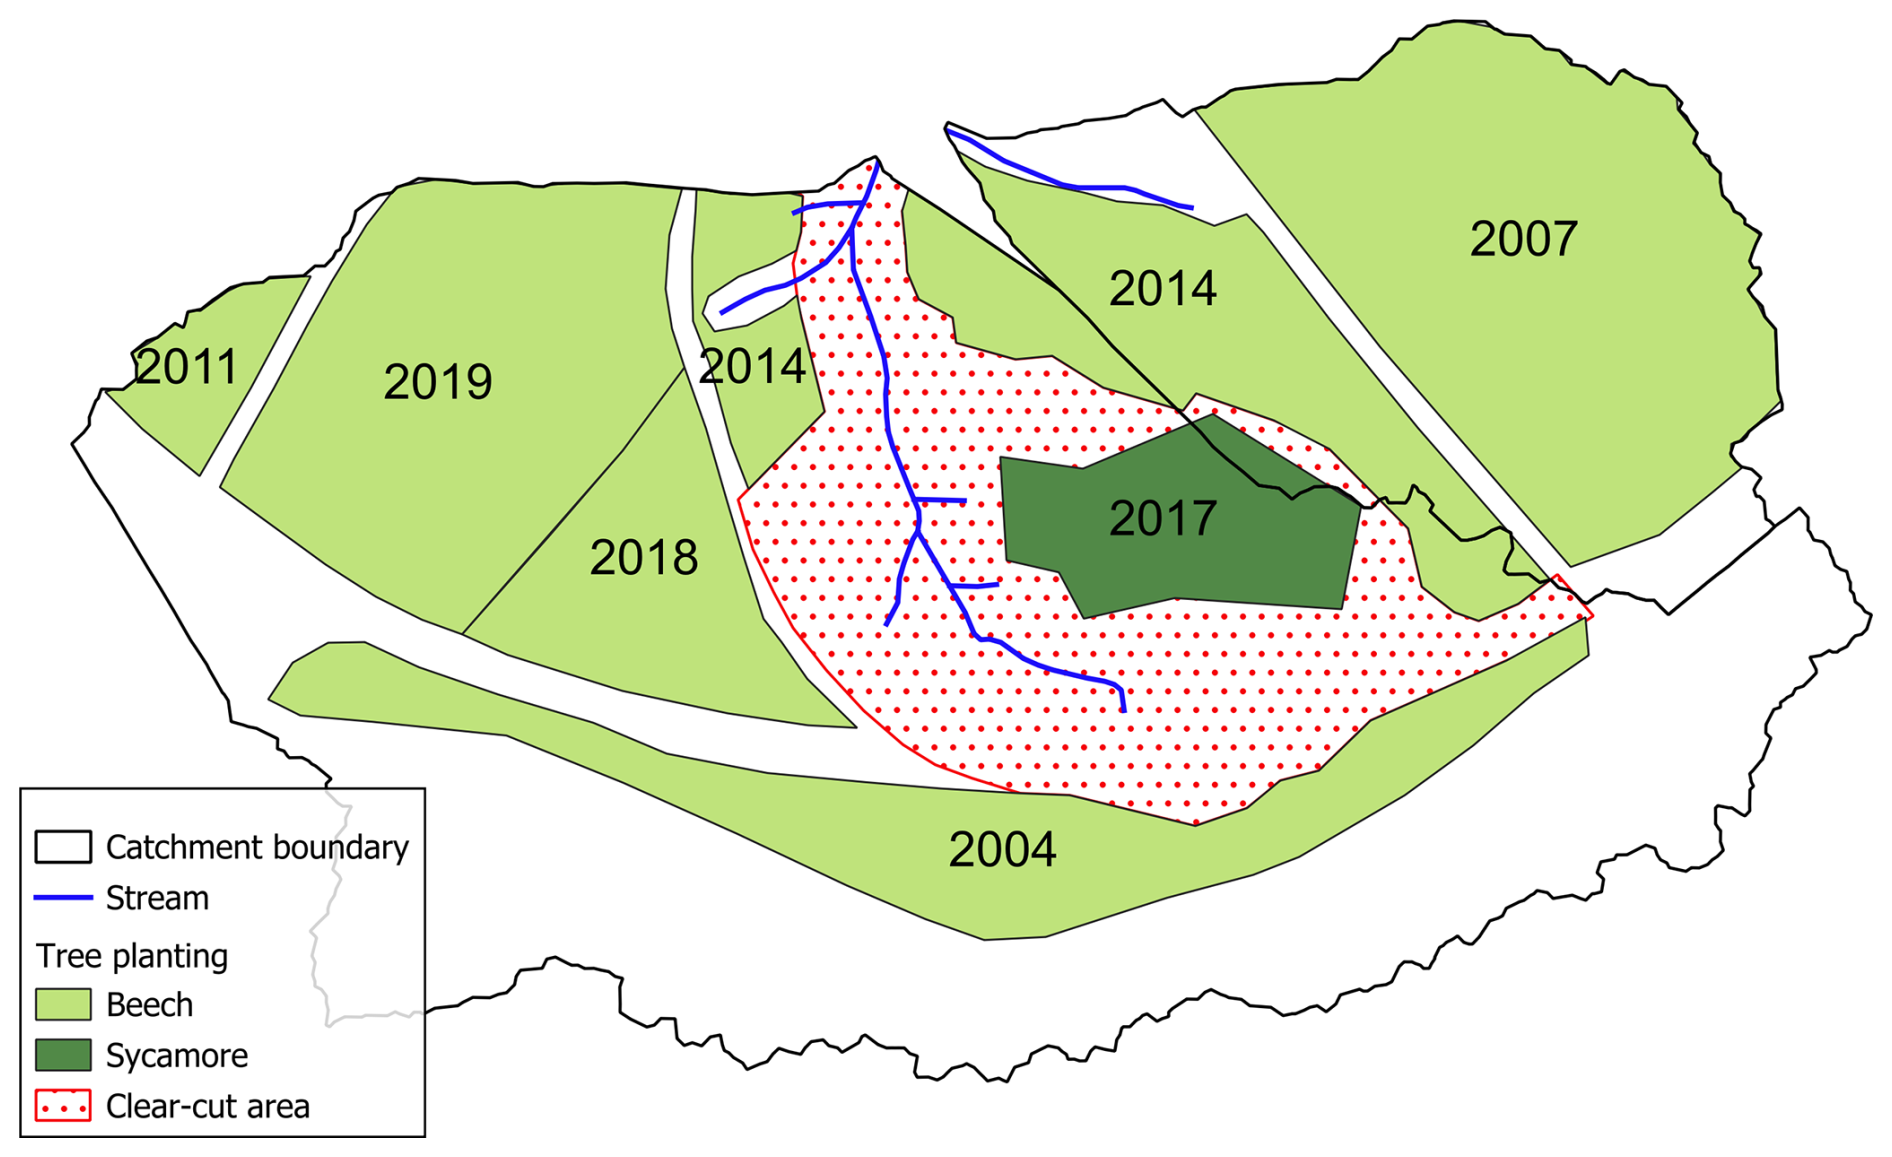
Figure A1Planting areas of beech (Fagus sylvatica L.) and sycamore maple (Acer pseudoplatanus L.) with details of the planting year in the study area (unpublished data from Eifel National Park).
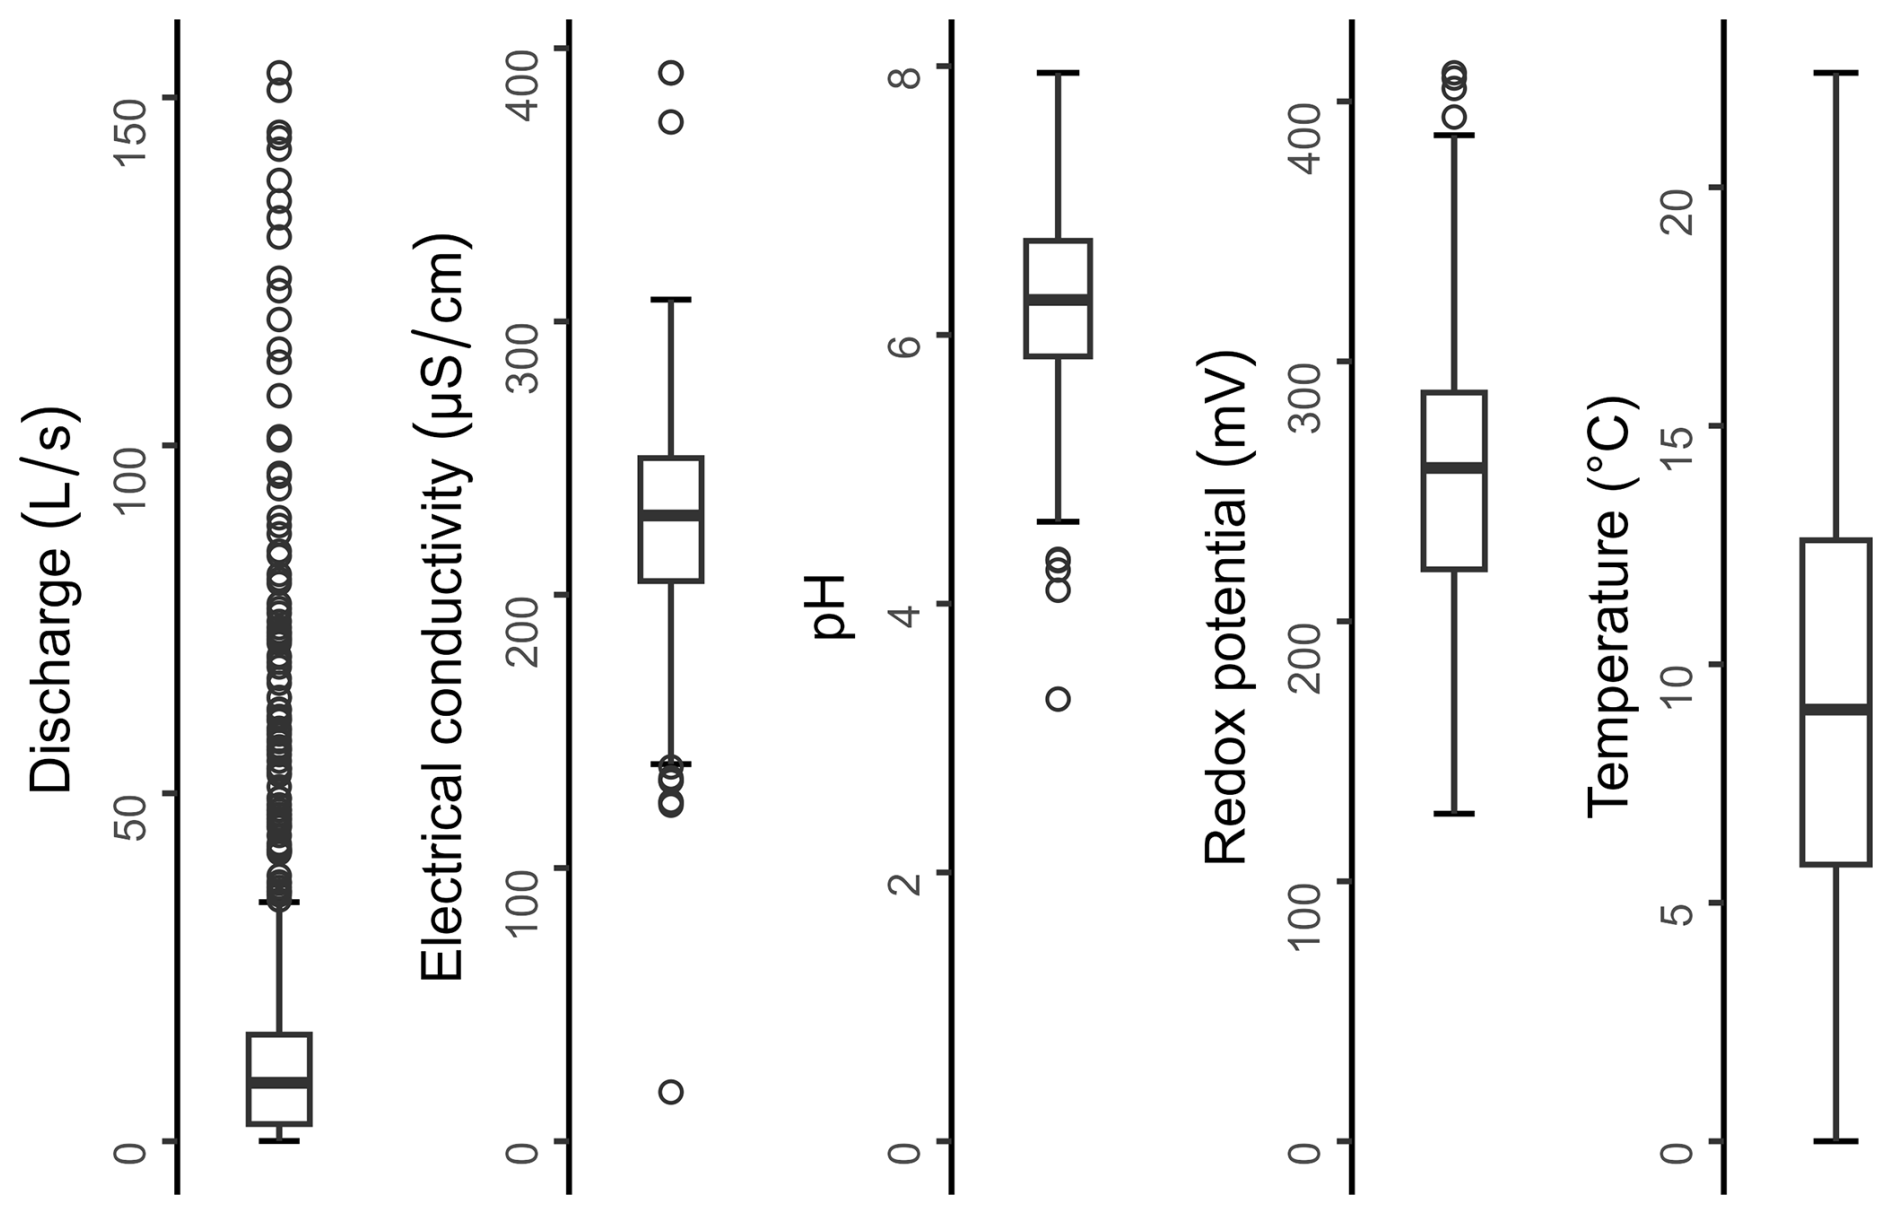
Figure A2Boxplots showing the distributions of physicochemical stream water parameters (i.e. electrical conductivity, pH, redox potential and temperature) measured using a multi-probe sensor at station WU14. The box shows the median and the interquartile range and the whiskers extend to 1.5 times the interquartile range away from the box.
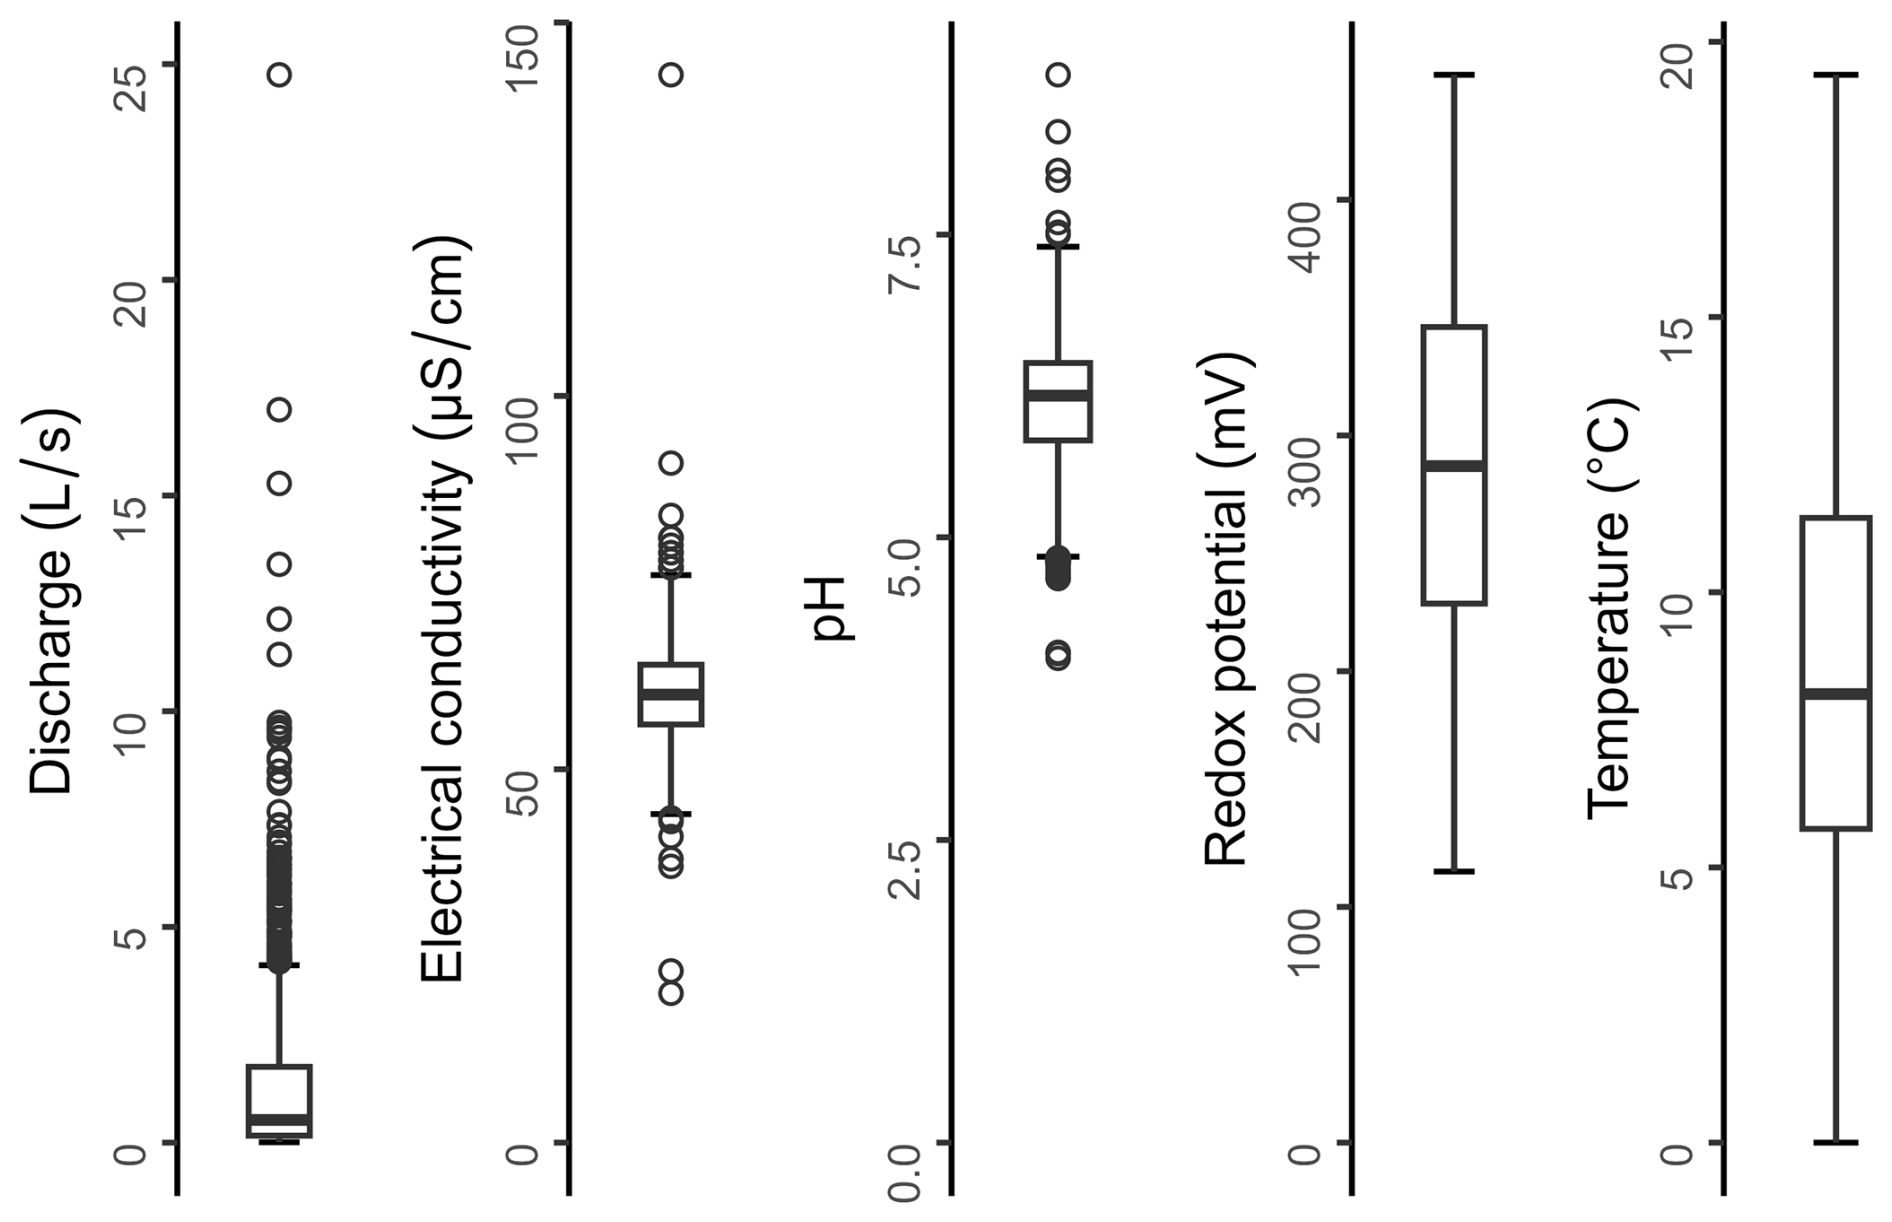
Figure A3Boxplots showing the distributions of physicochemical stream water parameters (i.e. electrical conductivity, pH, redox potential and temperature) measured using a multi-probe sensor at station WU17. The box shows the median and the interquartile range and the whiskers extend to 1.5 times the interquartile range away from the box.
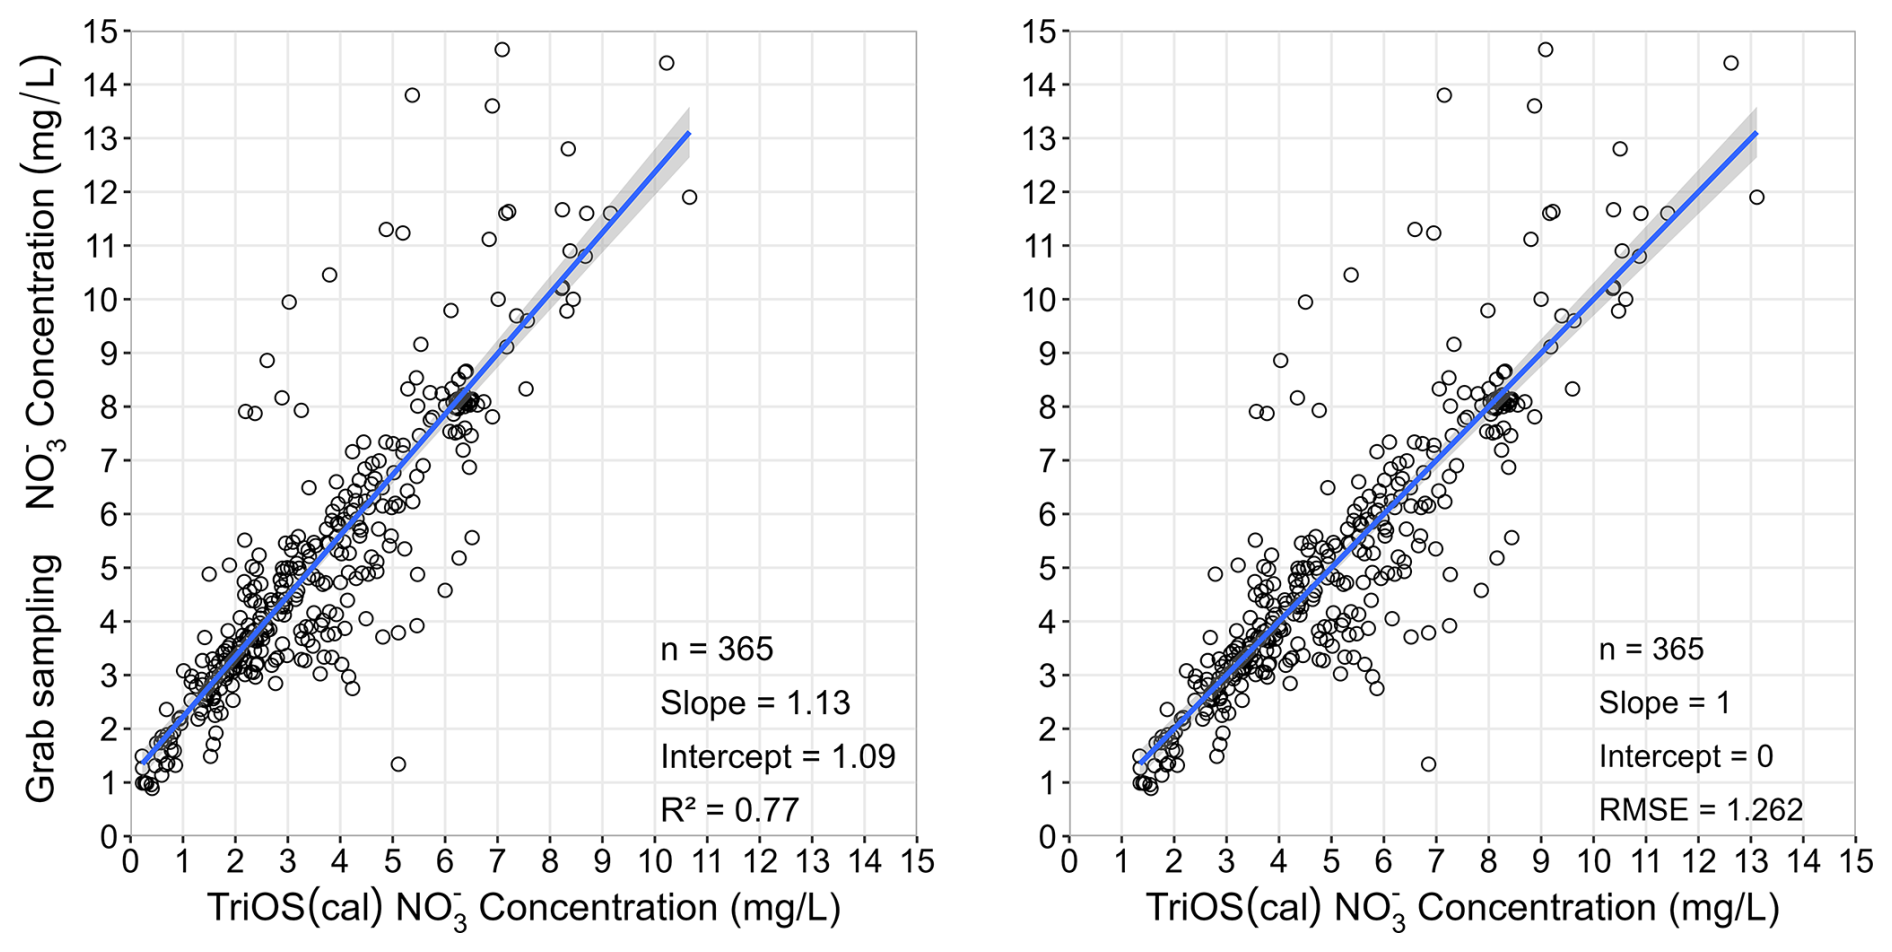
Figure A4Correlation between nitrate concentrations measured by the TriOS optical sensor and grab samples (left), and between calibrated TriOS nitrate concentrations and grab sample concentrations (right). Corresponding R2 and RMSE values are also shown.
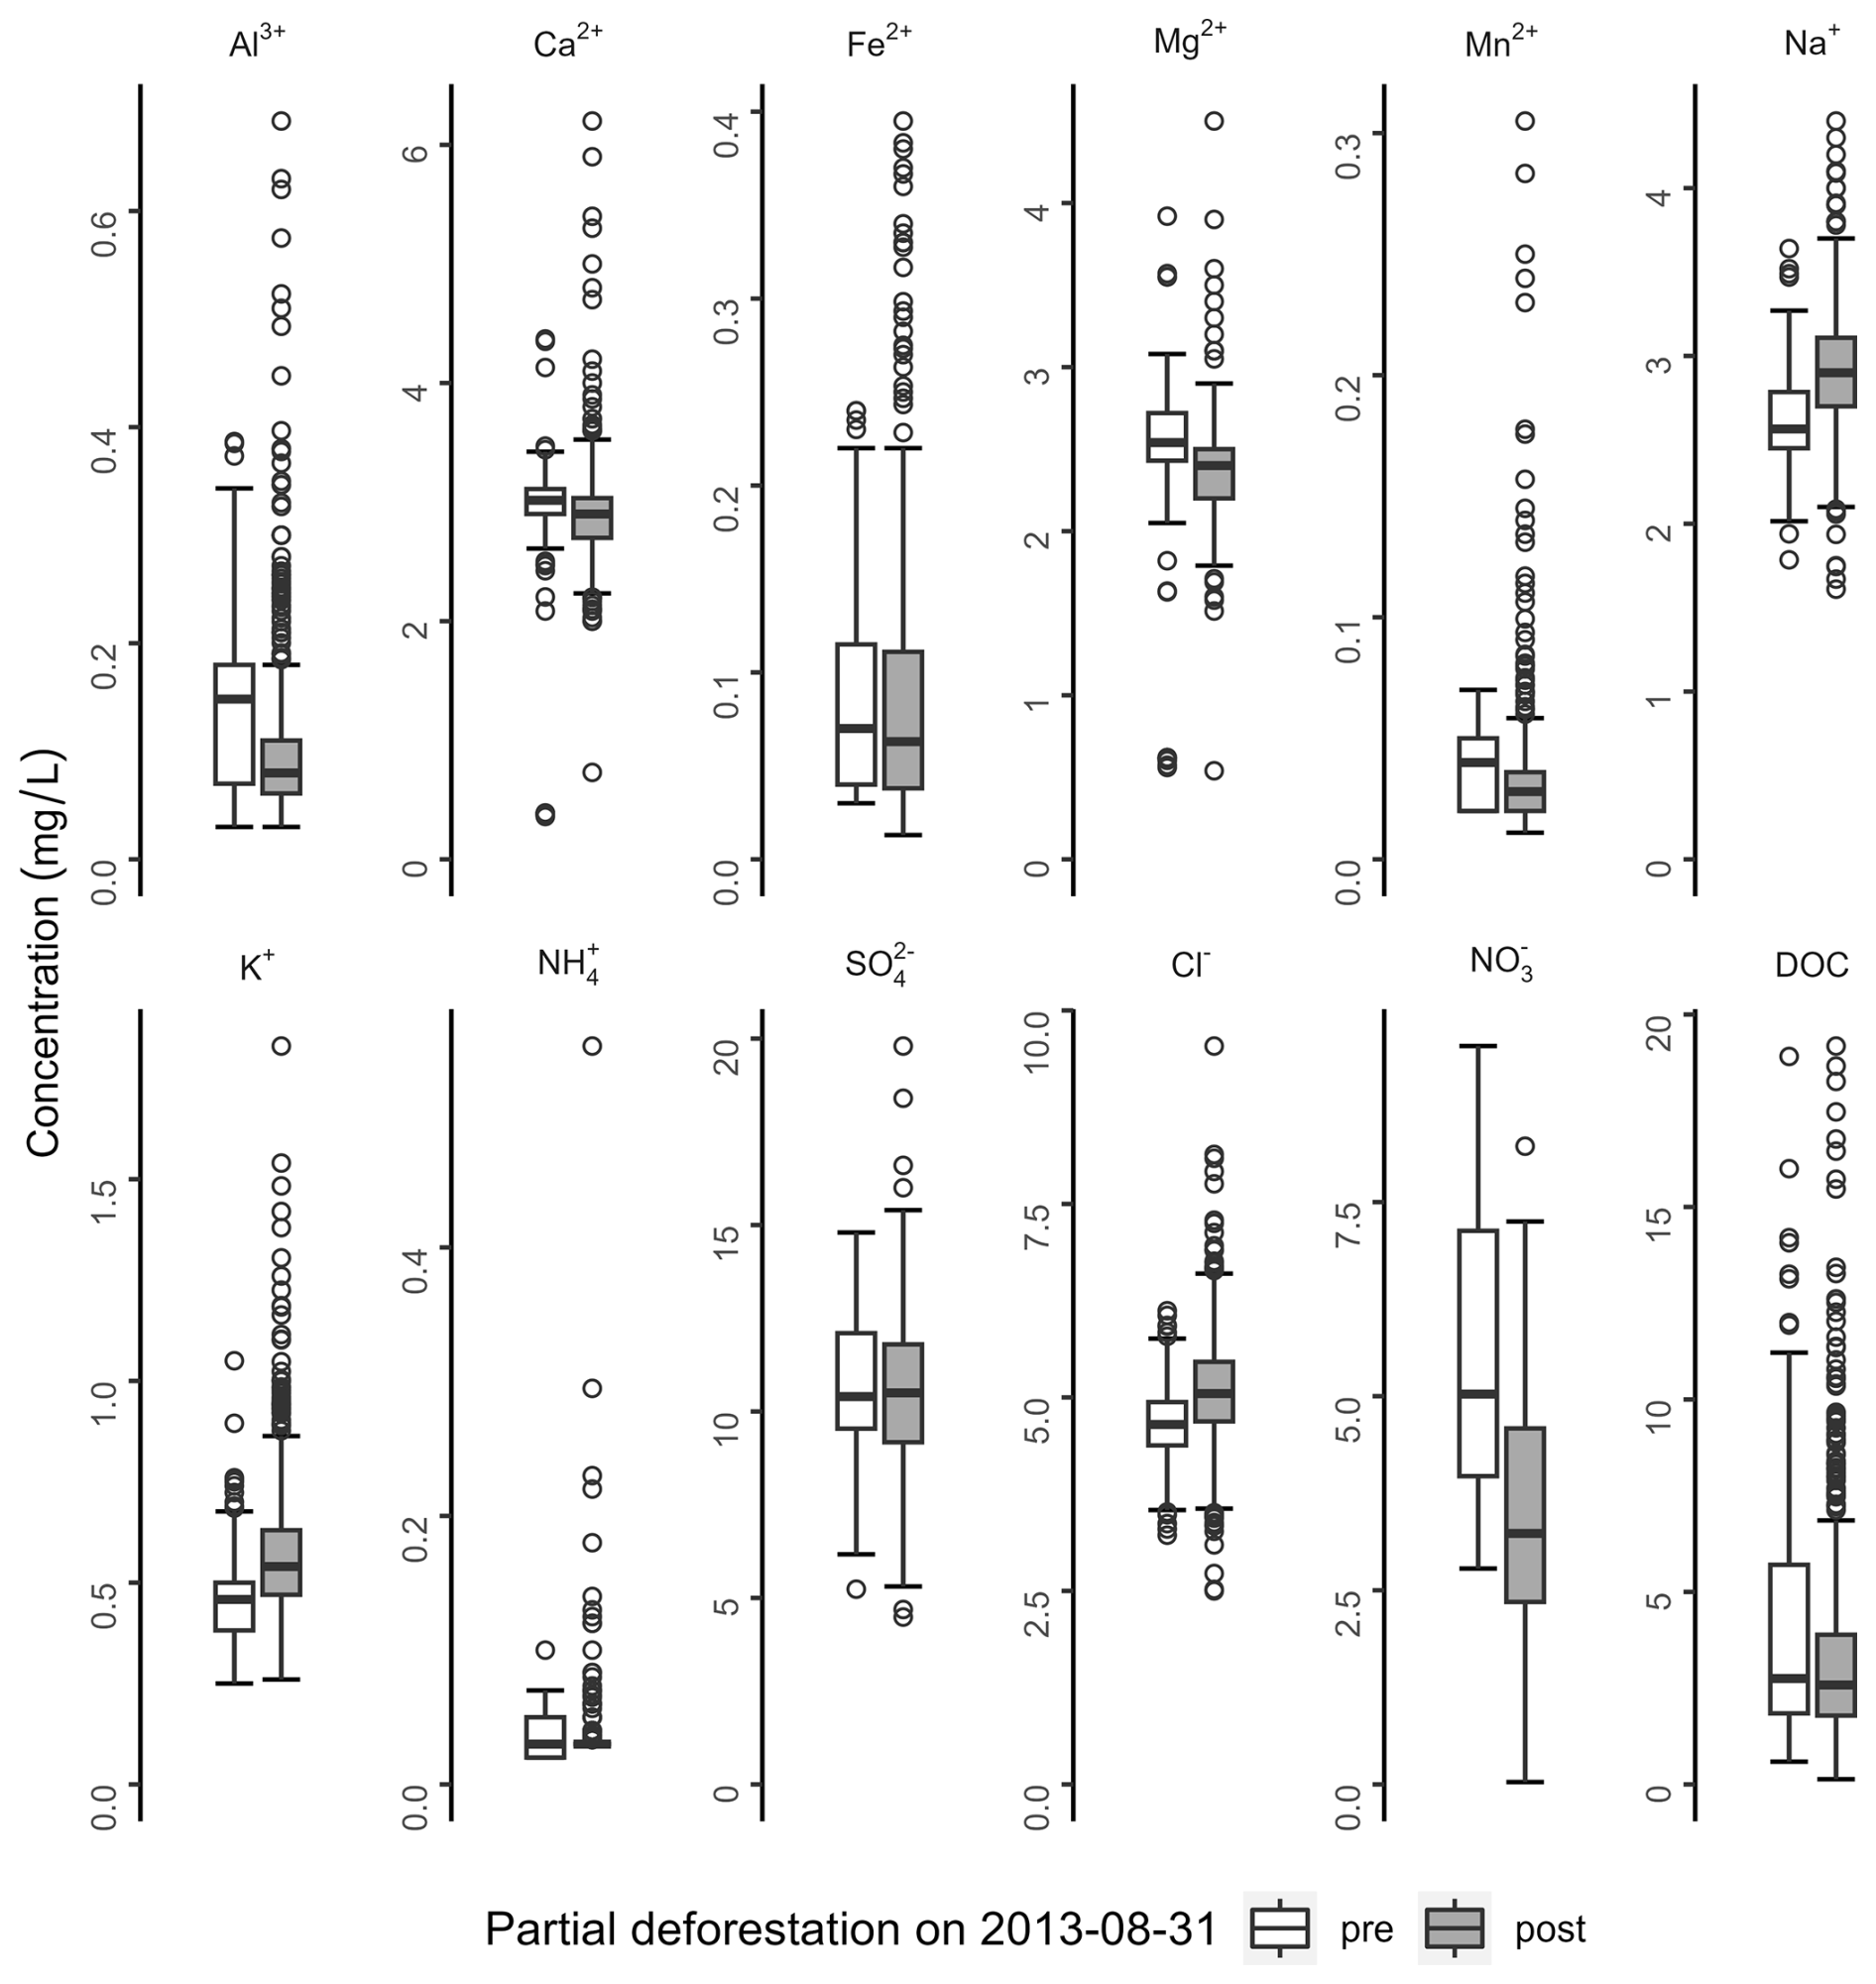
Figure A5Boxplots showing the distributions of all considered macro- and micronutrients, dissolved aluminum and DOC determined from stream water samples taken at discharge station WU17. The box shows the median and the interquartile range, and the whiskers extend to 1.5 times the interquartile range away from the box. Information on the number of stream water samples collected before and after the clear-cut for each solute, as well as the start and end dates of the sampling period, is provided in Table A4.
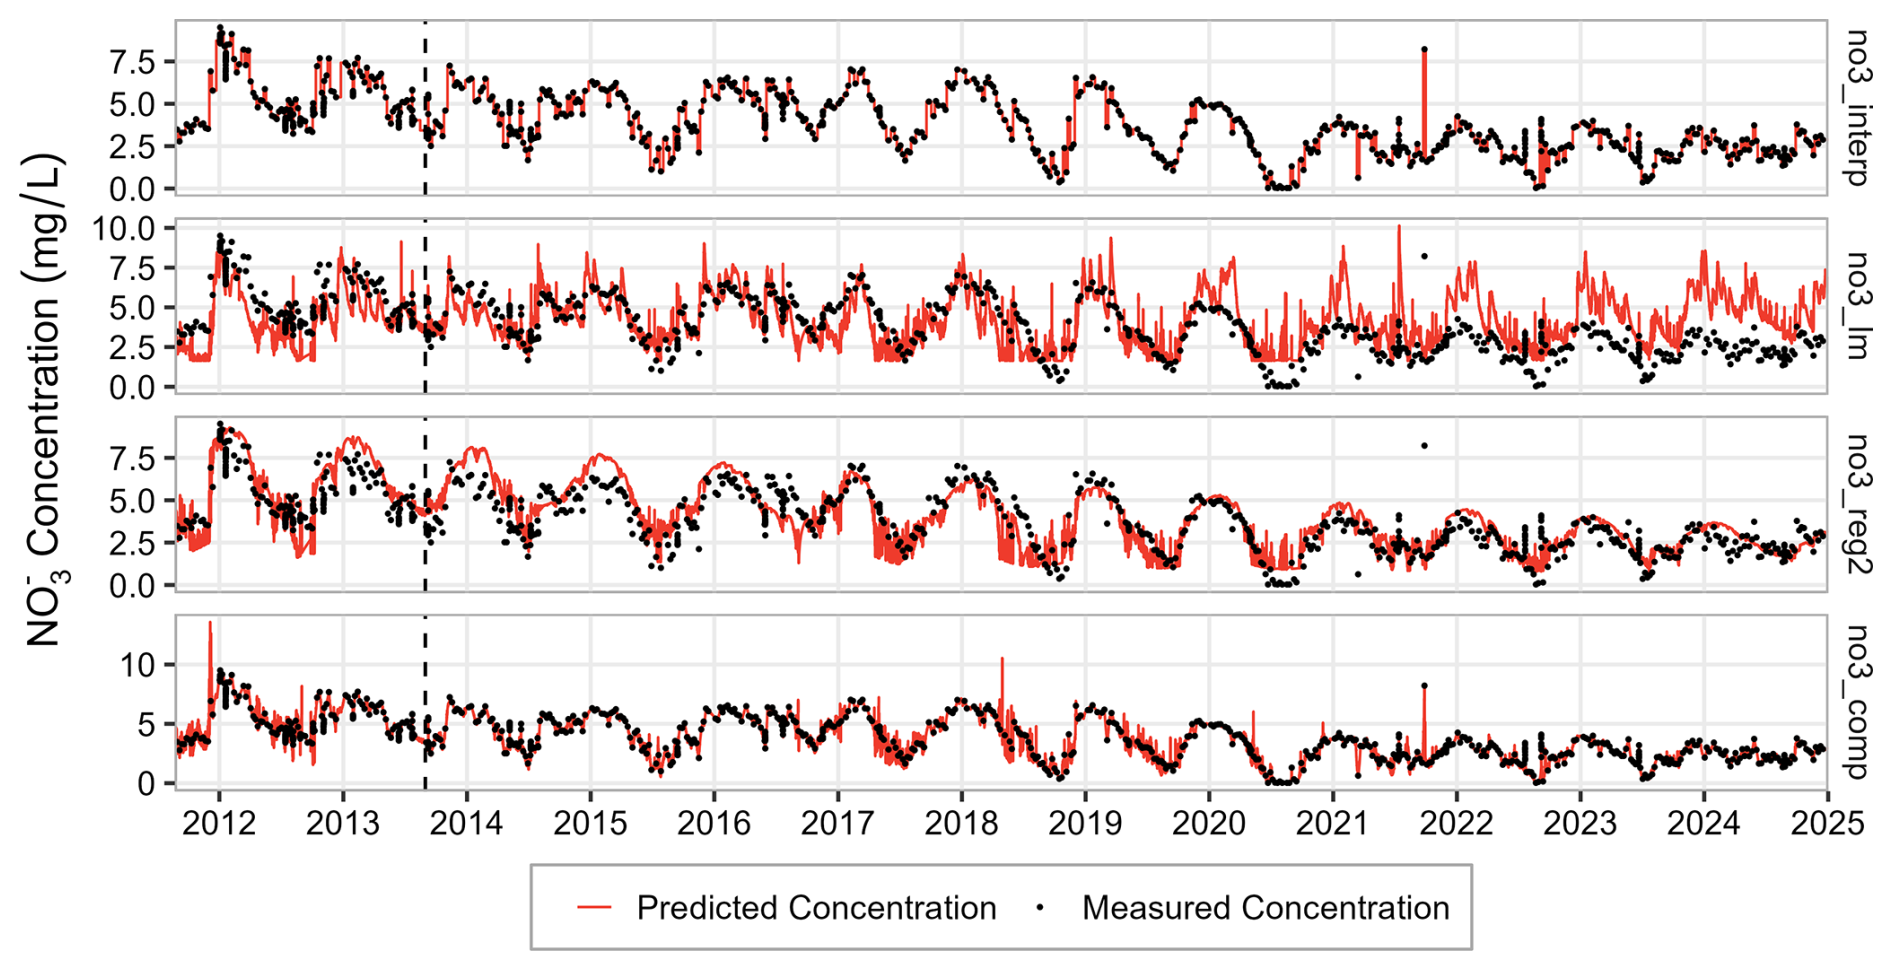
Figure A6Nitrate prediction models fitted to the measured values from weekly samples at WU17 using functions implemented in the LOADFLEX package. Subplots show predicted concentrations for rectangular interpolation (no3_interp), linear regression model (no3_lm), RLOADEST regression model (no3_reg2), and composite model (no3_comp). The dashed line indicates the time of clear-cutting.
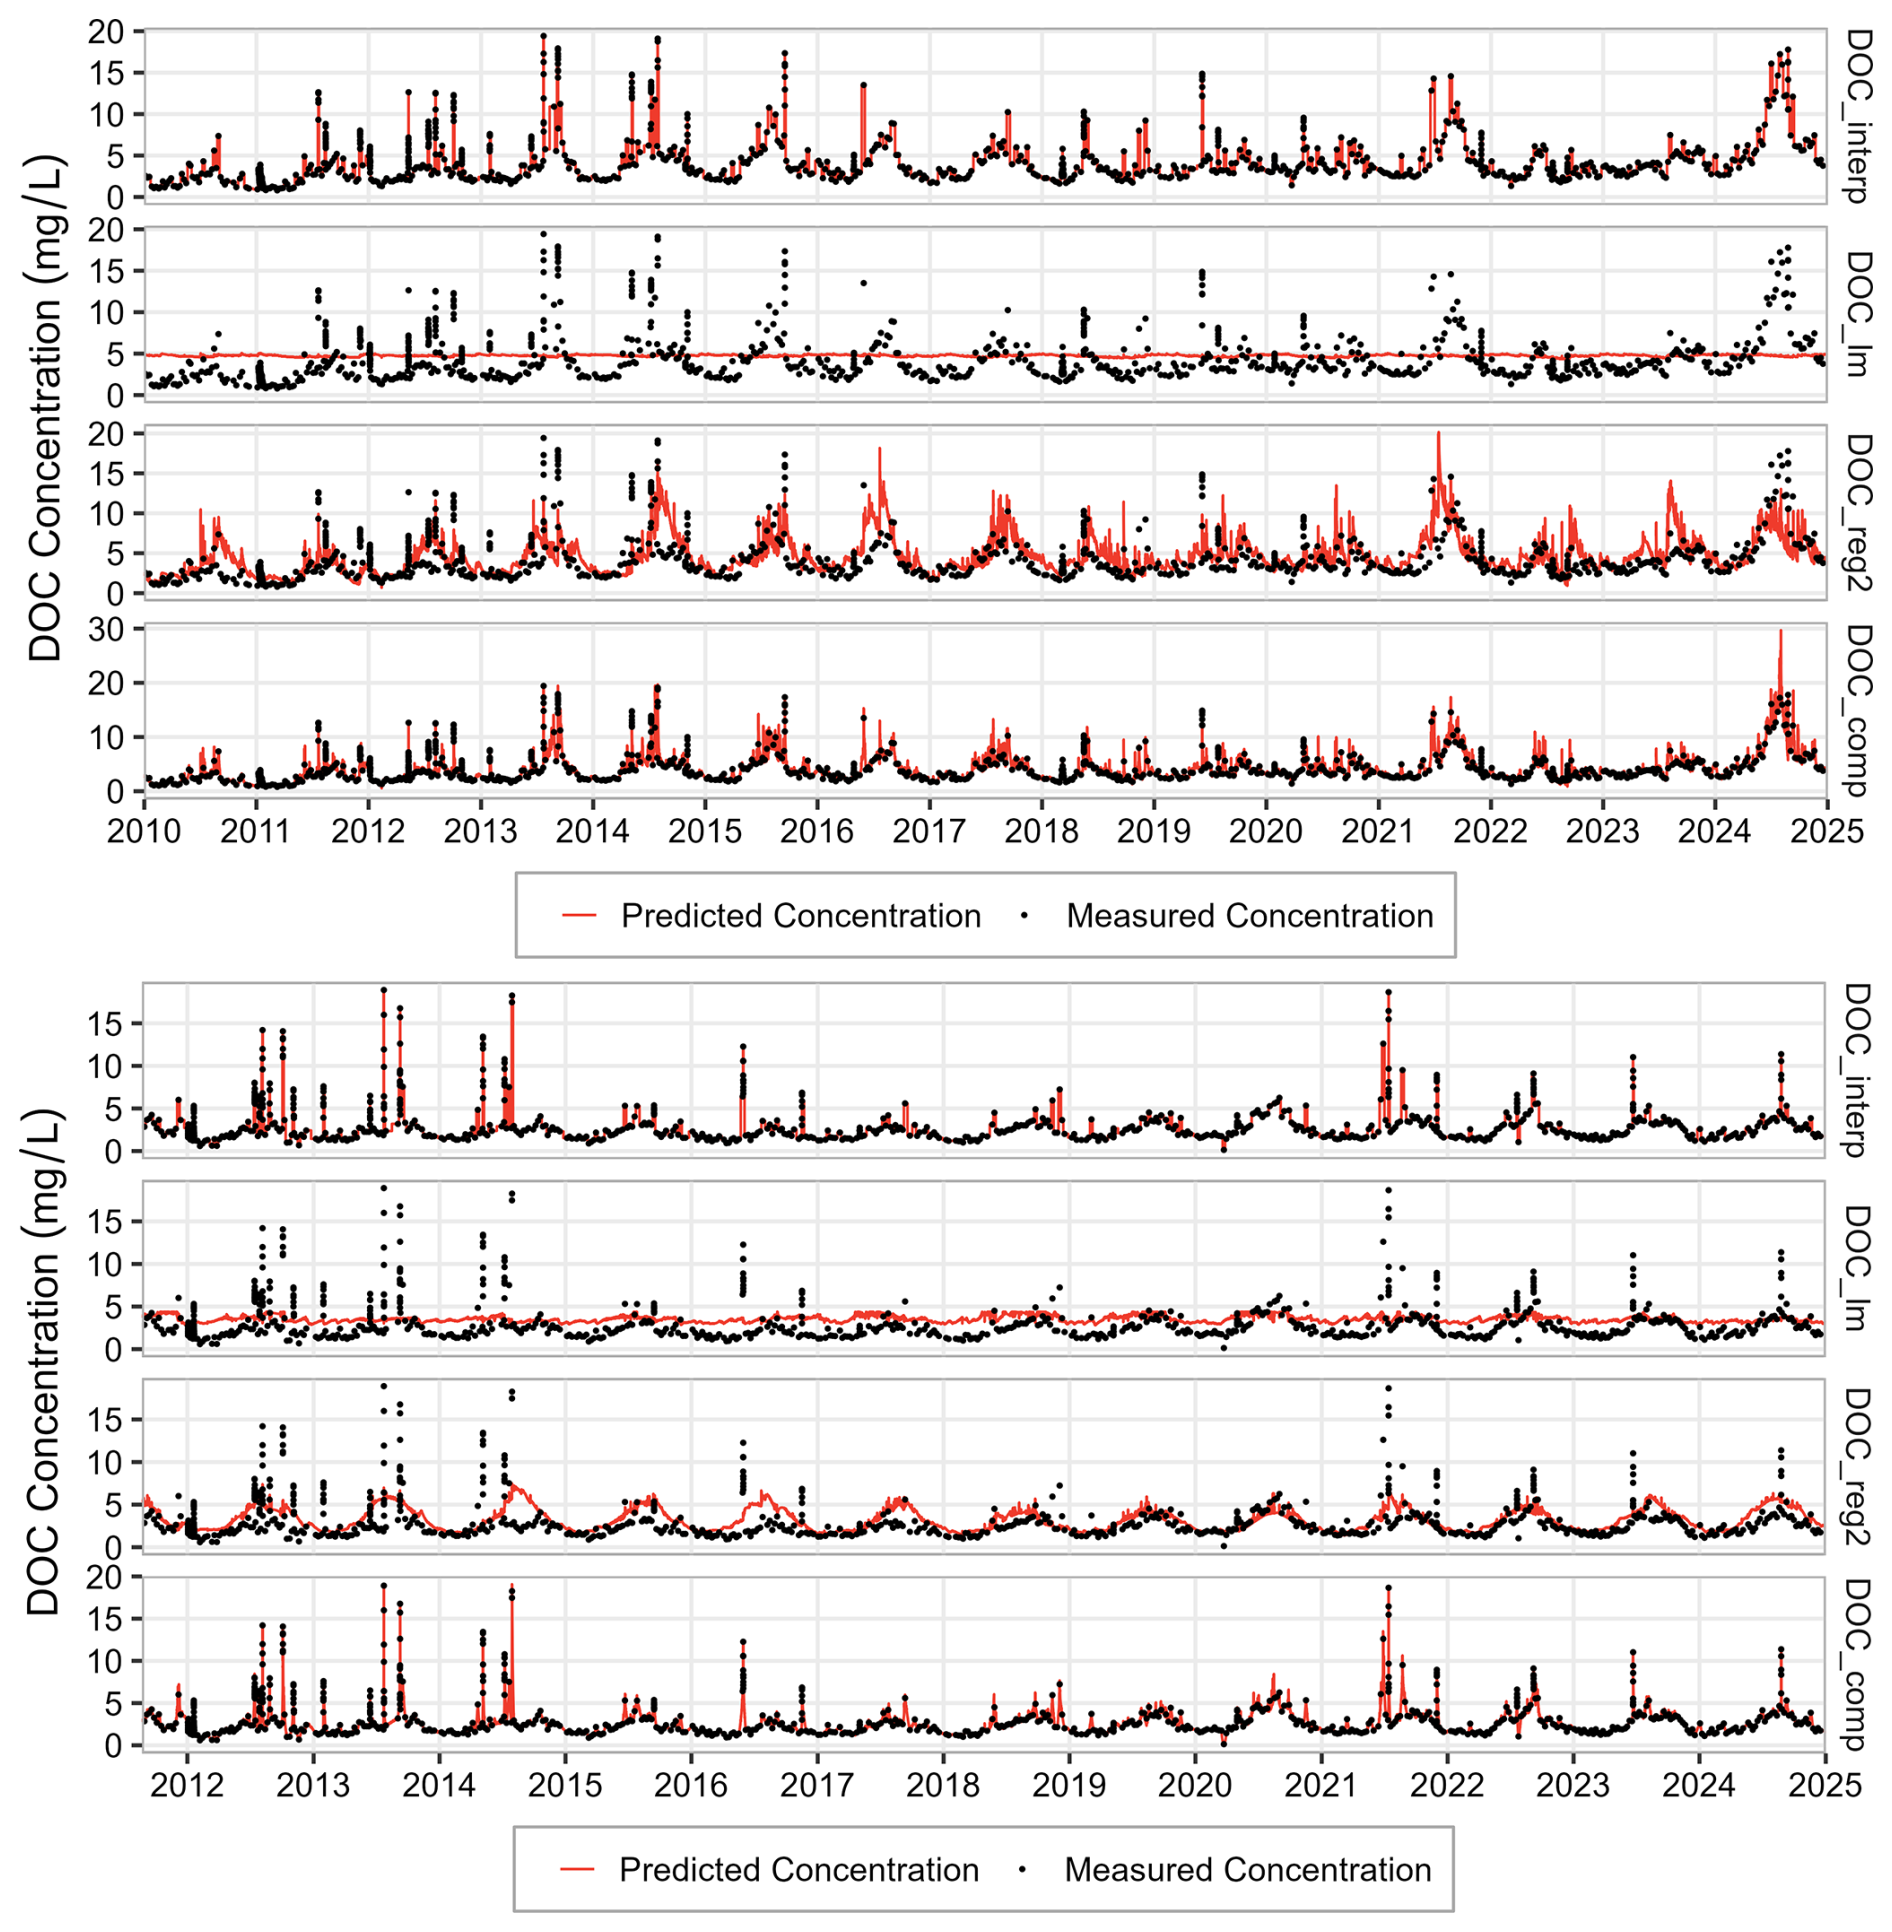
Figure A7DOC concentrations from event and grab-based samples (black dots) at WU14 (above panel) and WU17 (below panel), respectively, and from four prediction models (red lines) implemented in the LOADFLEX package. Subplots show predicted concentrations for rectangular interpolation (DOC_interp), linear regression model (DOC_lm), RLOADEST regression model (DOC_reg2), and composite model (DOC_comp).
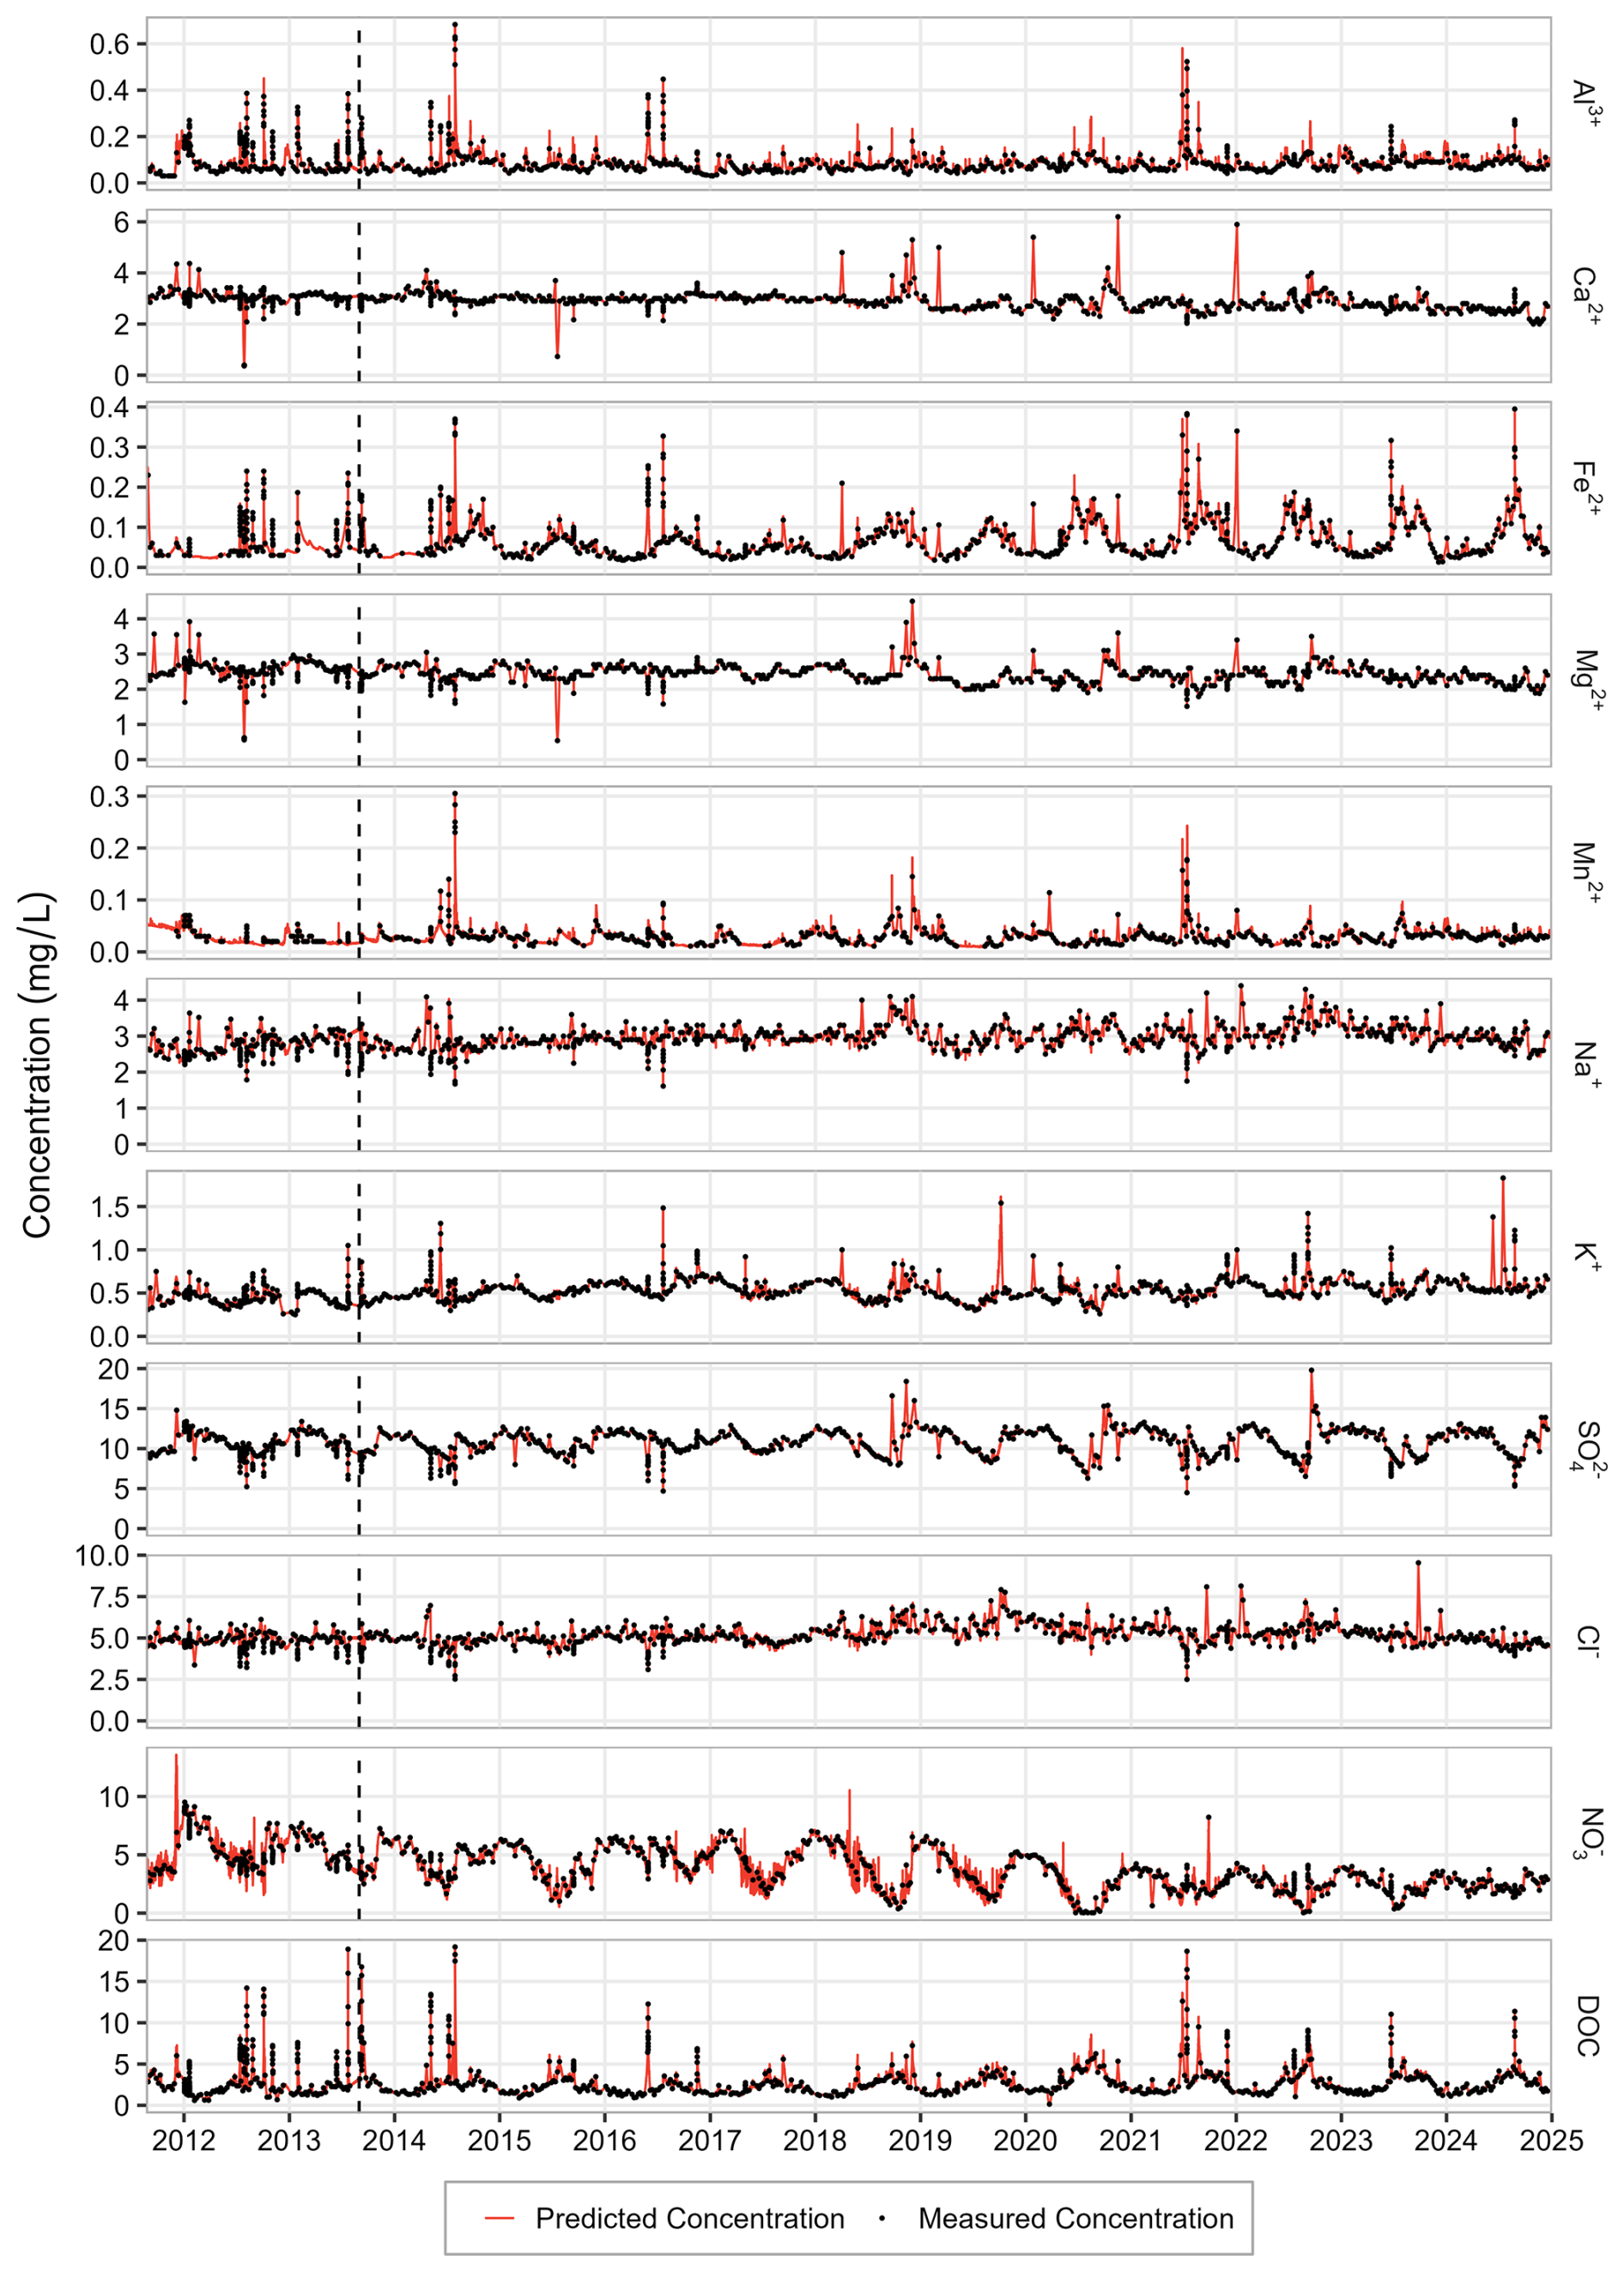
Figure A8Predicted hourly concentrations of all considered solutes at WU14 using the composite model. The dashed line indicates the time of clear-cutting.
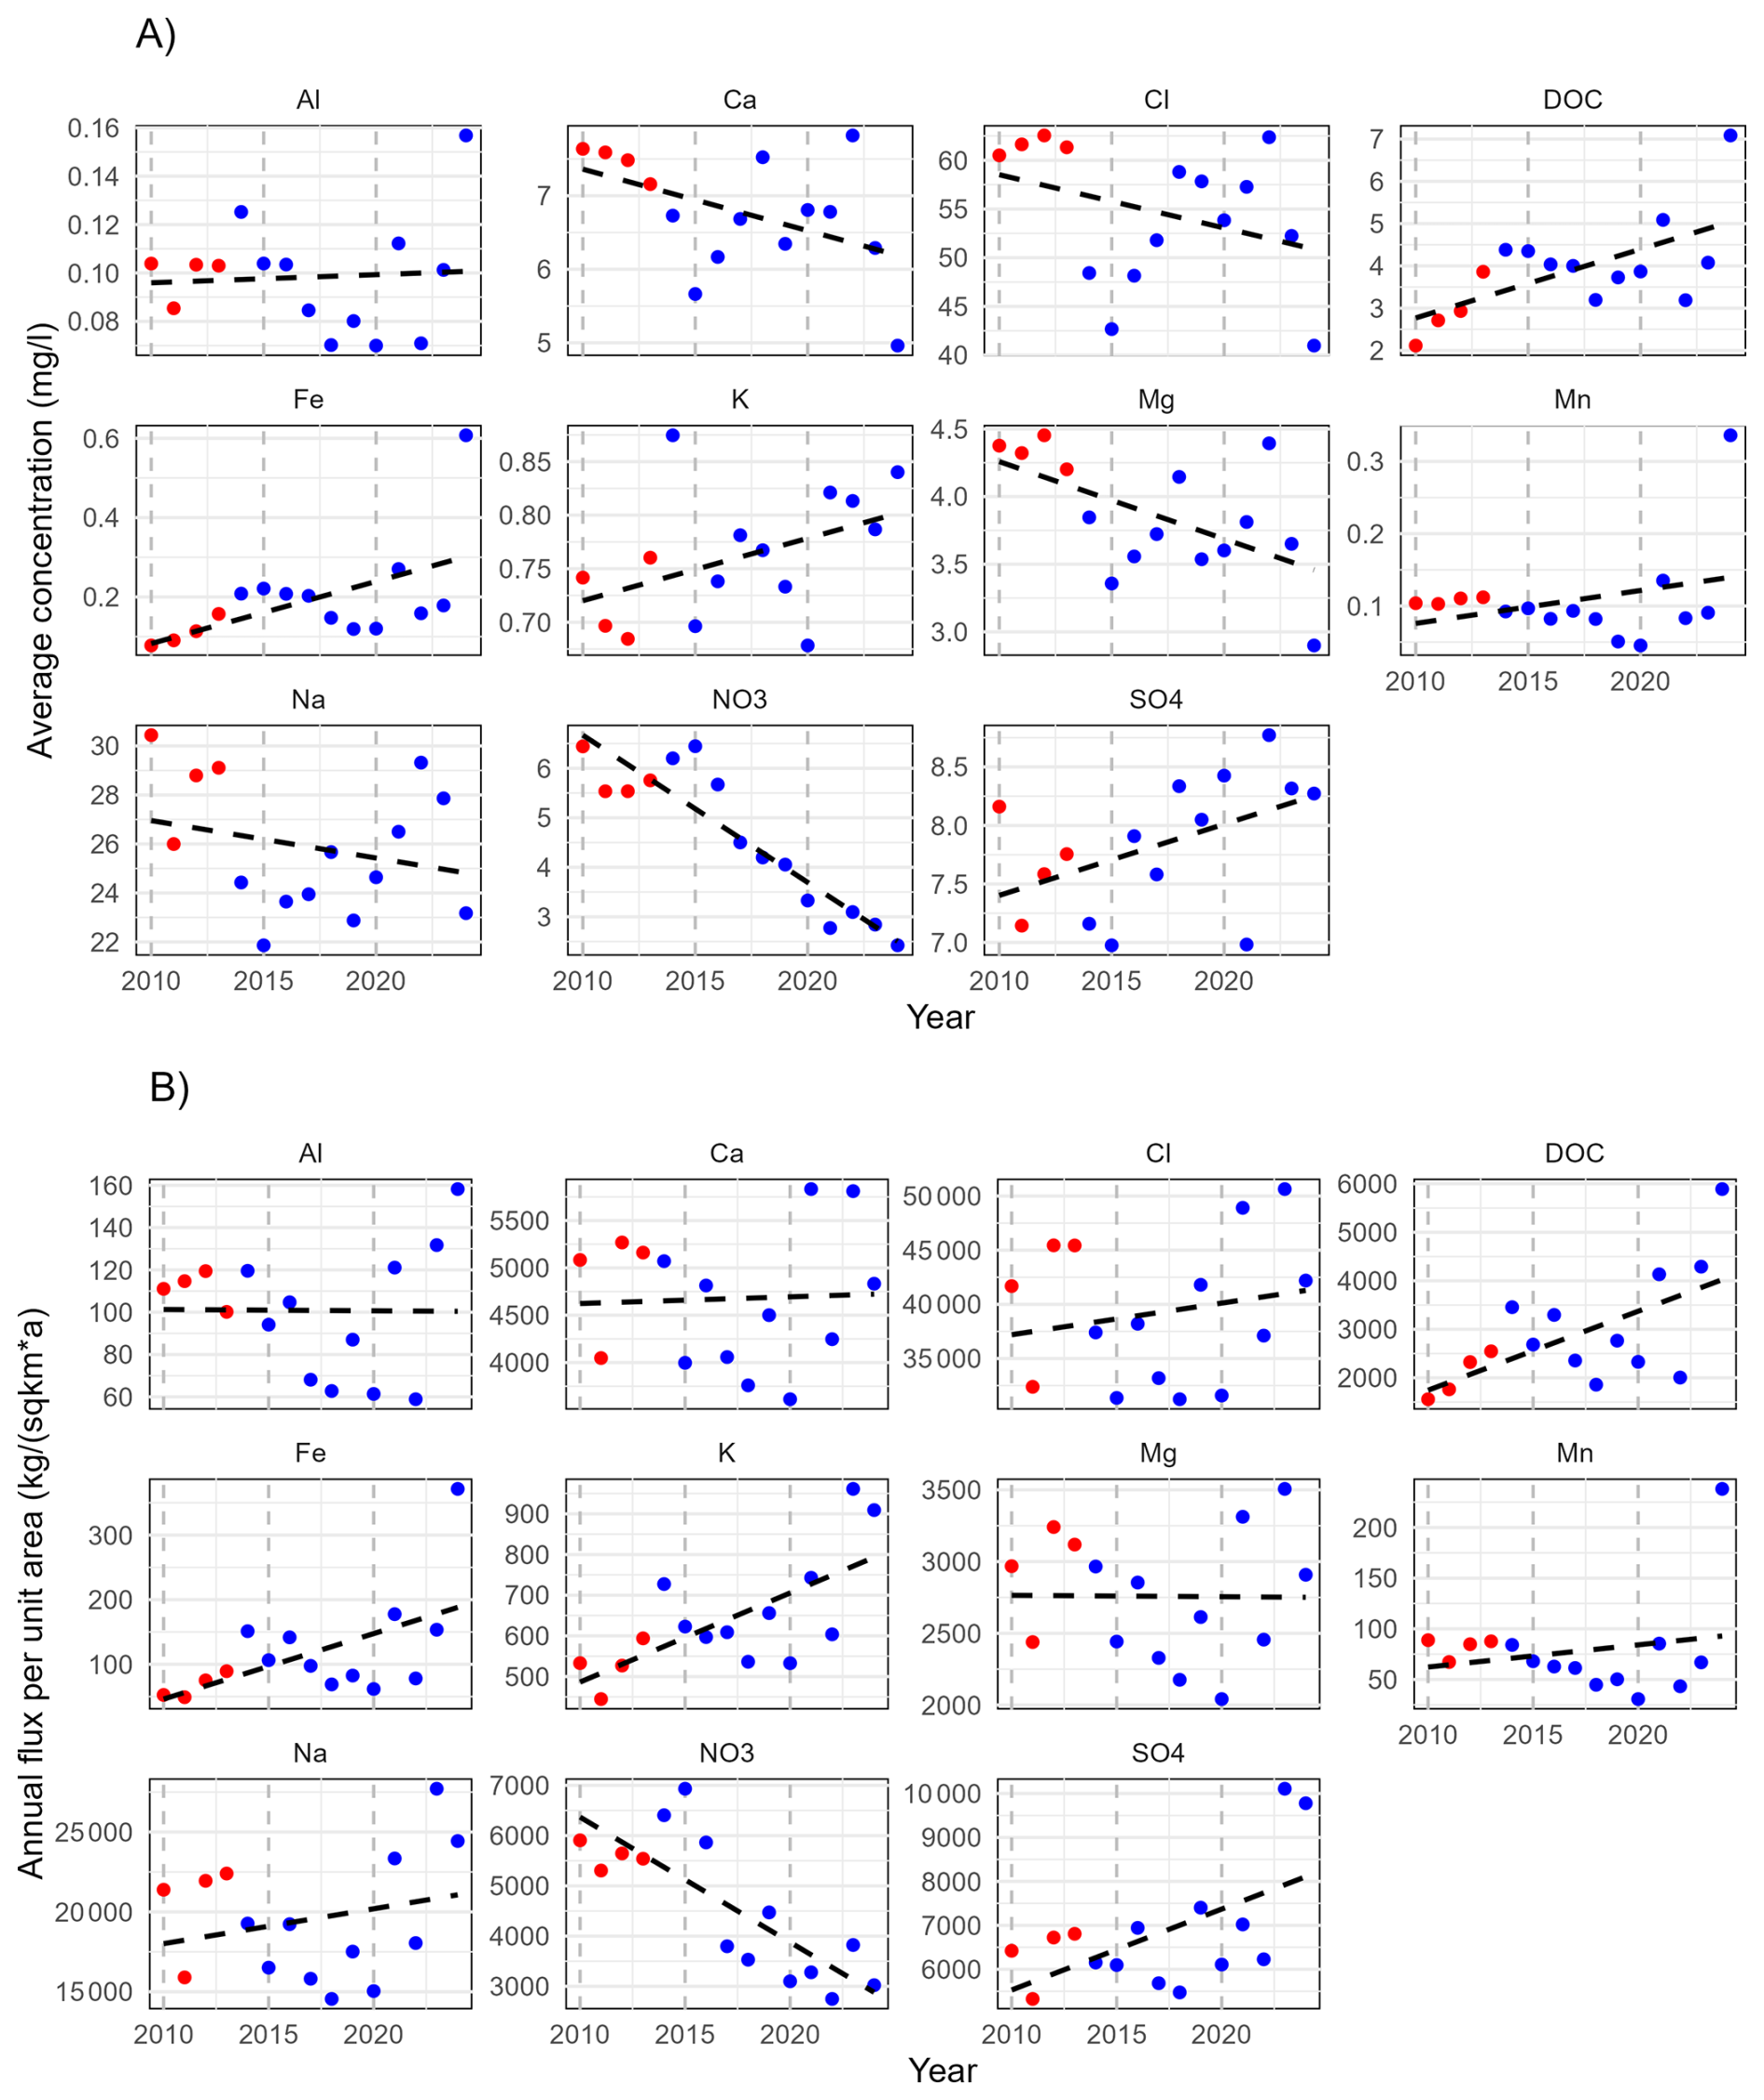
Figure A9Annual average concentrations of the solutes considered at (a) WU14 and (b) WU17, and linear trend lines. The red dots indicate the years before deforestation.
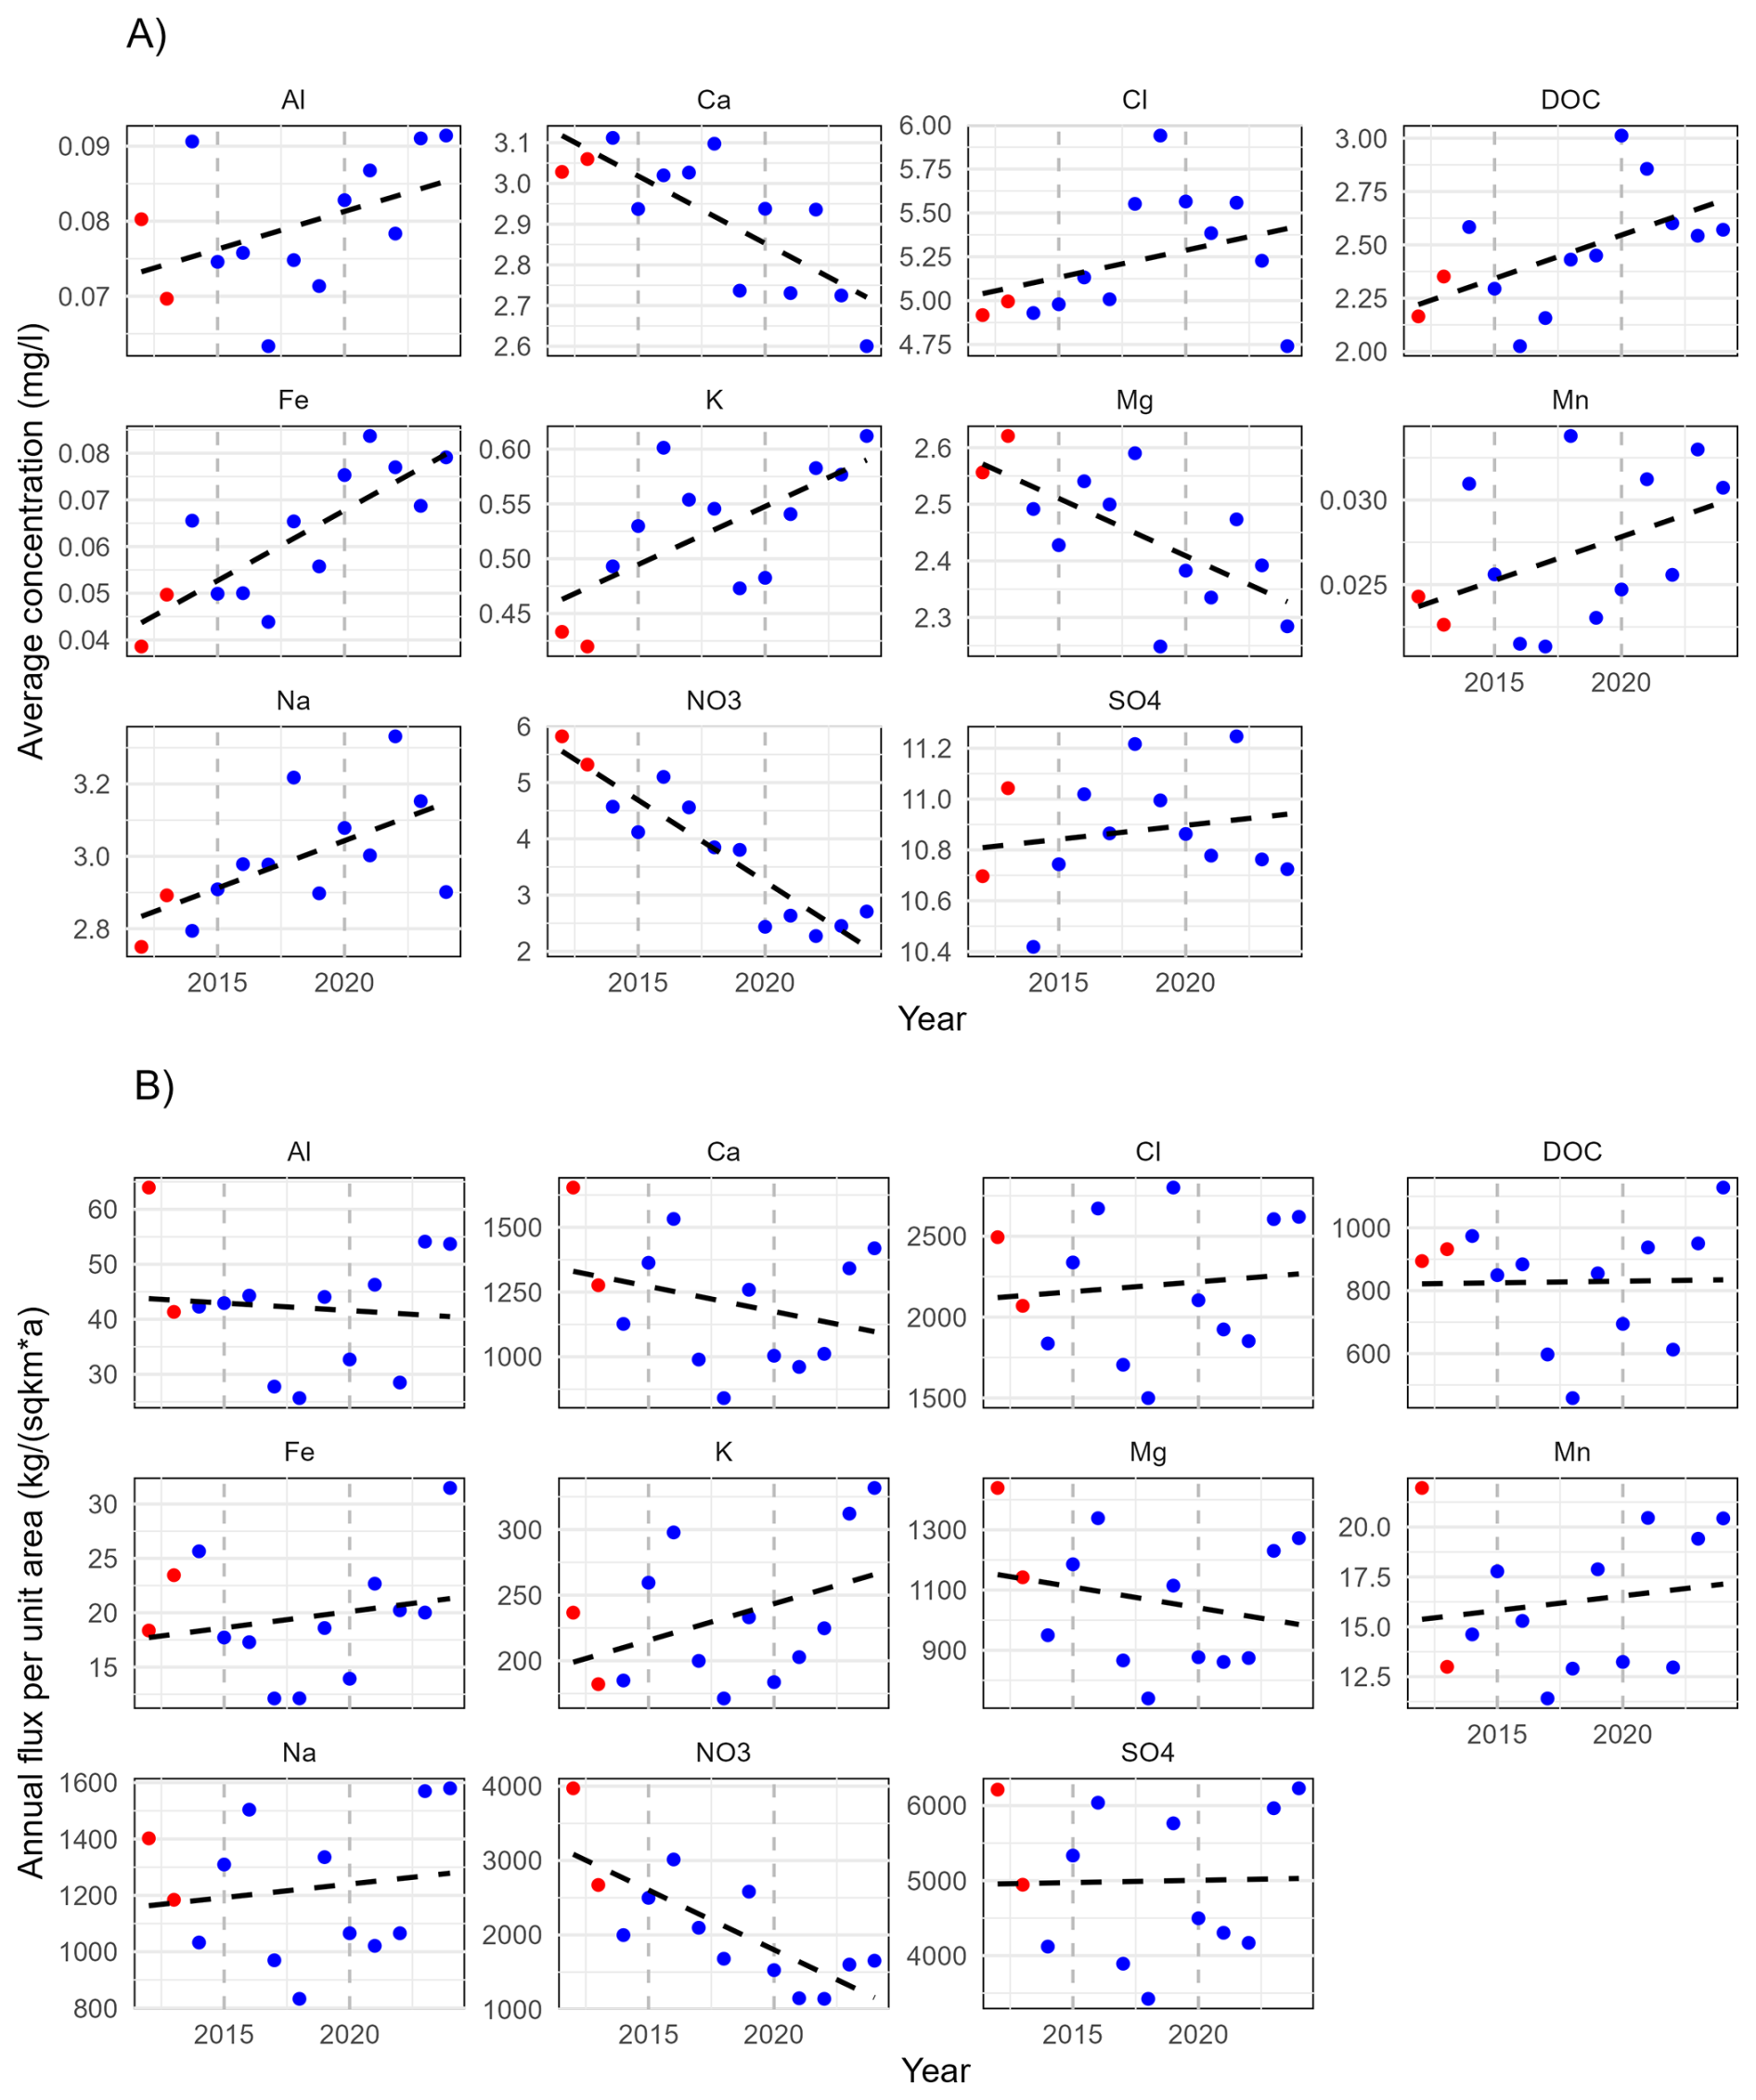
Figure A10Annual fluxes of the solutes considered at (a) WU14 and (b) WU17, and linear trend lines. The red dots indicate the years before deforestation.
HRB conceptualized the study, led the data compilation and editing of the manuscript. FH and HRB developed the R scripts for data pre-processing, solute estimation post-processing and performed the formal analysis. HRB wrote the first manuscript draft, and all authors contributed to editing the final version of the manuscript.
The contact author has declared that none of the authors has any competing interests.
Publisher’s note: Copernicus Publications remains neutral with regard to jurisdictional claims made in the text, published maps, institutional affiliations, or any other geographical representation in this paper. While Copernicus Publications makes every effort to include appropriate place names, the final responsibility lies with the authors. Views expressed in the text are those of the authors and do not necessarily reflect the views of the publisher.
The Agrosphere Institute of the Forschungszentrum Jülich GmbH funds the operation of the Wüstebach catchment, including instrumentation maintenance and salaries of all field and laboratory technicians. These data were collected using support by TERENO (Terrestrial Environmental Observatories) funded by the Helmholtz-Gemeinschaft and can be used without any further approval or charges. For the use of the data in a publication, presentation or other research material, please quote the data according to the TERENO disclaimer. We thank Antonio Voss, Phillip Meulendick, Ferdinand Engels, Rainer Harms, Werner Küpper, Andrea Ecker, Stephanie Stork, Sirgit Kummer, Herbert Rützel, Martina Krause, and Holger Wissel for supporting the sampling, chemical analysis and regular maintenance of the experimental set-up. Finally, we would like to thank the Eifel National Park for providing forest management information its constant support of our research.
The article processing charges for this open-access publication were covered by the Forschungszentrum Jülich.
This paper was edited by James Thornton and reviewed by two anonymous referees.
Appling, A. P., Leon, M. C., and McDowell, W. H.: Reducing bias and quantifying uncertainty in watershed flux estimates: the R package loadflex, Ecosphere, 6, 1–25, https://doi.org/10.1890/ES14-00517.1, 2015.
Aulenbach, B. T. and Hooper, R. P.: The composite method: an improved method for stream-water solute load estimation, Hydrol. Process., 20, 3029–3047, https://doi.org/10.1002/hyp.6147, 2006.
Birgand, F., Faucheux, C., Gruau, G., Augeard, B., Moatar, F., and Bordenave, P.: Uncertainties in Assessing Annual Nitrate Loads and Concentration Indicators: Part 1. Impact of Sampling Frequency and Load Estimation Algorithms, Trans. ASABE, 53, 437–446, https://doi.org/10.13031/2013.29584, 2010.
Bogena, H. and Herrmann, F.: Wüstebach data paper: Long-term hourly solute flux data 2010–2024, Jülich DATA [data set], https://doi.org/10.26165/JUELICH-DATA/AKAMNQ, 2025.
Bogena, H. R., Herbst, M., Huisman, J. A., Rosenbaum, U., Weuthen, A., and Vereecken, H.: Potential of Wireless Sensor Networks for Measuring Soil Water Content Variability, Vadose Zone J., 9, 1002–1013, https://doi.org/10.2136/vzj2009.0173, 2010.
Bogena, H. R., Bol, R., Borchard, N., Brüggemann, N., Diekkrüger, B., Drüe, C., Groh, J., Gottselig, N., Huisman, J. A., Lücke, A., Missong, A., Neuwirth, B., Pütz, T., Schmidt, M., Stockinger, M., Tappe, W., Weihermüller, L., Wiekenkamp, I., and Vereecken, H.: A terrestrial observatory approach to the integrated investigation of the effects of deforestation on water, energy, and matter fluxes, Sci. China Earth Sci., 58, 61–75, https://doi.org/10.1007/s11430-014-4911-7, 2015.
Bogena, H. R., Montzka, C., Huisman, J. A., Graf, A., Schmidt, M., Stockinger, M., von Hebel, C., Hendricks-Franssen, H. J., van der Kruk, J., Tappe, W., Lücke, A., Baatz, R., Bol, R., Groh, J., Pütz, T., Jakobi, J., Kunkel, R., Sorg, J., and Vereecken, H.: The TERENO-Rur Hydrological Observatory: A Multiscale Multi-Compartment Research Platform for the Advancement of Hydrological Science, Vadose Zone J., 17, 180055, https://doi.org/10.2136/vzj2018.03.0055, 2018.
Bogena, H. R., Stockinger, M. P., and Lücke, A.: Long-term stable water isotope and runoff data for the investigation of deforestation effects on the hydrological system of the Wüstebach catchment, Germany, Hydrol. Process., 35, e14006, https://doi.org/10.1002/hyp.14006, 2021.
Bol, R., Lücke, A., Tappe, W., Kummer, S., Krause, M., Weigand, S., Pütz, T., and Vereecken, H.: Spatio-temporal Variations of Dissolved Organic Matter in a German Forested Mountainous Headwater Catchment, Vadose Zone J., 14, vzj2015.01.0005, https://doi.org/10.2136/vzj2015.01.0005, 2015.
Brunet, C. E., Gemrich, E. R. C., Biedermann, S., Jacobson, P. J., Schilling, K. E., Jones, C. S., and Graham, A. M.: Nutrient capture in an Iowa farm pond: Insights from high-frequency observations, J. Environ. Manage., 299, 113647, https://doi.org/10.1016/j.jenvman.2021.113647, 2021.
Buso, D. C.: Chemistry of precipitation, streamwater, and lakewater from the Hubbard Brook Ecosystem Study: a record of sampling protocols and analytical procedures, US Department of Agriculture, Forest Service, Northeastern Research Station, 275, 2000.
Canfield, D. E., Thamdrup, B., and Hansen, J. W.: The anaerobic degradation of organic matter in Danish coastal sediments: Iron reduction, manganese reduction, and sulfate reduction, Geochim. Cosmochim. Acta, 57, 3867–3883, https://doi.org/10.1016/0016-7037(93)90340-3, 1993.
Chen, M., Jomaa, S., Lausch, A., Beudert, B., Ghaffar, S., Jia, W., and Rode, M.: Impact of Forest Dieback on Hydrology and Nitrogen Export Using a New Dynamic Water Quality Model, Water Resour. Res., 60, e2024WR037341, https://doi.org/10.1029/2024WR037341, 2024.
Coble, A. A., Wymore, A. S., Shattuck, M. D., Potter, J. D., and McDowell, W. H.: Multiyear Trends in Solute Concentrations and Fluxes From a Suburban Watershed: Evaluating Effects of 100-Year Flood Events, J. Geophys. Res. Biogeosciences, 123, 3072–3087, https://doi.org/10.1029/2018JG004657, 2018.
Cohn, T. A., Caulder, D. L., Gilroy, E. J., Zynjuk, L. D., and Summers, R. M.: The validity of a simple statistical model for estimating fluvial constituent loads: An Empirical study involving nutrient loads entering Chesapeake Bay, Water Resour. Res., 28, 2353–2363, https://doi.org/10.1029/92WR01008, 1992.
Cox, N. J., Warburton, J., Armstrong, A., and Holliday, V. J.: Fitting concentration and load rating curves with generalized linear models, Earth Surf. Process. Landf., 33, 25–39, https://doi.org/10.1002/esp.1523, 2008.
Deuffic, P., Garms, M., He, J., Brahic, E., Yang, H., and Mayer, M.: Forest Dieback, a Tangible Proof of Climate Change? A Cross-Comparison of Forest Stakeholders' Perceptions and Strategies in the Mountain Forests of Europe and China, Environ. Manage., 66, 858–872, https://doi.org/10.1007/s00267-020-01363-9, 2020.
Ekström, S. M., Regnell, O., Reader, H. E., Nilsson, P. A., Löfgren, S., and Kritzberg, E. S.: Increasing concentrations of iron in surface waters as a consequence of reducing conditions in the catchment area, J. Geophys. Res. Biogeosciences, 121, 479–493, https://doi.org/10.1002/2015JG003141, 2016.
Feller, M. C.: Forest harvesting and streamwater inorganic chemistry in western north America: a review, J. Am. Water Resour. Assoc., 41, 785–811, https://doi.org/10.1111/j.1752-1688.2005.tb04464.x, 2005.
Georgiev, K. B., Beudert, B., Bässler, C., Feldhaar, H., Heibl, C., Karasch, P., Müller, J., Perlík, M., Weiss, I., and Thorn, S.: Forest disturbance and salvage logging have neutral long-term effects on drinking water quality but alter biodiversity, For. Ecol. Manag., 495, 119354, https://doi.org/10.1016/j.foreco.2021.119354, 2021.
Gottselig, N., Wiekenkamp, I., Weihermüller, L., Brüggemann, N., Berns, A. E., Bogena, H. R., Borchard, N., Klumpp, E., Lücke, A., Missong, A., Pütz, T., Vereecken, H., Huisman, J. A., and Bol, R.: A Three-Dimensional View on Soil Biogeochemistry: A Dataset for a Forested Headwater Catchment, J. Environ. Qual., 46, 210–218, https://doi.org/10.2134/jeq2016.07.0276, 2017.
Graf, A., Bogena, H. R., Drüe, C., Hardelauf, H., Pütz, T., Heinemann, G., and Vereecken, H.: Spatiotemporal relations between water budget components and soil water content in a forested tributary catchment, Water Resour. Res., 50, 4837–4857, https://doi.org/10.1002/2013WR014516, 2014.
Gupta, H. V., Sorooshian, S., and Yapo, P. O.: Status of Automatic Calibration for Hydrologic Models: Comparison with Multilevel Expert Calibration, J. Hydrol. Eng., 4, 135–143, https://doi.org/10.1061/(ASCE)1084-0699(1999)4:2(135), 1999.
Harley, J. R., Biles, F. E., Brooks, M. K., Fellman, J., Hood, E., and D'Amore, D. V.: Riverine Dissolved Inorganic Carbon Export From the Southeast Alaskan Drainage Basin With Implications for Coastal Ocean Processes, J. Geophys. Res. Biogeosciences, 128, e2023JG007609, https://doi.org/10.1029/2023JG007609, 2023.
Heistermann, M., Bogena, H., Francke, T., Güntner, A., Jakobi, J., Rasche, D., Schrön, M., Döpper, V., Fersch, B., Groh, J., Patil, A., Pütz, T., Reich, M., Zacharias, S., Zengerle, C., and Oswald, S.: Soil moisture observation in a forested headwater catchment: combining a dense cosmic-ray neutron sensor network with roving and hydrogravimetry at the TERENO site Wüstebach, Earth Syst. Sci. Data, 14, 2501–2519, https://doi.org/10.5194/essd-14-2501-2022, 2022.
Hirsch, R. M. and De Cicco, L. A.: User guide to exploration and graphics for RivEr Trends (EGRET) and data Retrieval: R packages for hydrologic data. Version 2.0., U.S. Geological Survey, Reston, Virginia, USA, https://pubs.usgs.gov/publication/tm4A10 (last access: 3 December 2025), 2015.
Huntington, T. G., Hooper, R. P., and Aulenbach, B. T.: Hydrologic processes controlling sulfate mobility in a small forested watershed, Water Resour. Res., 30, 283–295, https://doi.org/10.1029/93WR02950, 1994.
Keller, H. M.: Der Chemismus kleiner Bache in teilweise bewaldeten Einzugsgebieten in der Flyschzone eines Voralpentales, Mitteilgn. Schweiz. Anst. F. Forstl. Vers., 46, 113–155, 1970.
Kelly, P. T., Vanni, M. J., and Renwick, W. H.: Assessing uncertainty in annual nitrogen, phosphorus, and suspended sediment load estimates in three agricultural streams using a 21-year dataset, Environ. Monit. Assess., 190, 91, https://doi.org/10.1007/s10661-018-6470-4, 2018.
Kong, X., Ghaffar, S., Determann, M., Friese, K., Jomaa, S., Mi, C., Shatwell, T., Rinke, K., and Rode, M.: Reservoir water quality deterioration due to deforestation emphasizes the indirect effects of global change, Water Res., 221, 118721, https://doi.org/10.1016/j.watres.2022.118721, 2022.
Likens, G. E.: Biogeochemistry of a Forested Ecosystem, Springer, New York, NY, https://doi.org/10.1007/978-1-4614-7810-2, 2013.
Likens, G. E., Bormann, F. H., Johnson, N. M., Fisher, D. W., and Pierce, R. S.: Effects of Forest Cutting and Herbicide Treatment on Nutrient Budgets in the Hubbard Brook Watershed-Ecosystem, Ecol. Monogr., 40, 23–47, https://doi.org/10.2307/1942440, 1970.
Lorenz, D. R., Runkel, R., and De Cicco, L.: Rloadest: river load estimation, U.S. Geol. Surv. Software, Mounds View, Minnesota, USA, https://ldecicco-usgs.r-universe.dev/rloadest/rloadest.pdf (last access: 3 December 2025), 2015.
McDowell, W. H., McDowell, W. G., Potter, J. D., and Ramírez, A.: Nutrient export and elemental stoichiometry in an urban tropical river, Ecol. Appl., 29, e01839, https://doi.org/10.1002/eap.1839, 2019.
Mikkelson, K. M., Dickenson, E. R. V., Maxwell, R. M., McCray, J. E., and Sharp, J. O.: Water-quality impacts from climate-induced forest die-off, Nat. Clim. Change, 3, 218–222, https://doi.org/10.1038/nclimate1724, 2013.
Mollenhauer, H., Kasner, M., Haase, P., Peterseil, J., Wohner, C., Frenzel, M., Mirtl, M., Schima, R., Bumberger, J., and Zacharias, S.: Long-term environmental monitoring infrastructures in Europe: observations, measurements, scales, and socio-ecological representativeness, Sci. Total Environ., 624, 968–978, https://doi.org/10.1016/j.scitotenv.2017.12.095, 2018.
Moriasi, D. N., Arnold, J. G., Van Liew, M. W., Bingner, R. L., Harmel, R. D., and Veith, T. L.: Model Evaluation Guidelines for Systematic Quantification of Accuracy in Watershed Simulations, Trans. ASABE, 50, 885–900, https://doi.org/10.13031/2013.23153, 2007.
Musolff, A., Tarasova, L., Rinke, K., and Ledesma, J. L. J.: Forest Dieback Alters Nutrient Pathways in a Temperate Headwater Catchment, Hydrol. Process., 38, e15308, https://doi.org/10.1002/hyp.15308, 2024.
Nash, J. E. and Sutcliffe, J. V.: River flow forecasting through conceptual models part I – A discussion of principles, J. Hydrol., 10, 282–290, https://doi.org/10.1016/0022-1694(70)90255-6, 1970.
Ney, P., Graf, A., Bogena, H., Diekkrüger, B., Drüe, C., Esser, O., Heinemann, G., Klosterhalfen, A., Pick, K., Pütz, T., Schmidt, M., Valler, V., and Vereecken, H.: CO2 fluxes before and after partial deforestation of a Central European spruce forest, Agric. For. Meteorol., 274, 61–74, https://doi.org/10.1016/j.agrformet.2019.04.009, 2019.
Obladen, N., Dechering, P., Skiadaresis, G., Tegel, W., Keßler, J., Höllerl, S., Kaps, S., Hertel, M., Dulamsuren, C., Seifert, T., Hirsch, M., and Seim, A.: Tree mortality of European beech and Norway spruce induced by 2018–2019 hot droughts in central Germany, Agric. For. Meteorol., 307, 108482, https://doi.org/10.1016/j.agrformet.2021.108482, 2021.
Płaczkowska, E., Mostowik, K., Bogena, H. R., and Leuchner, M.: The Impact of Partial Deforestation on Solute Fluxes and Stream Water Ionic Composition in a Headwater Catchment, Water, 15, 107, https://doi.org/10.3390/w15010107, 2022.
Płaczkowska, E., Kijowska-Strugała, M., Ketzler, G., Bogena, H. R., and Leuchner, M.: Solute fluxes in headwater catchments with contrasting anthropogenic impact, Geomorphology, 454, 109166, https://doi.org/10.1016/j.geomorph.2024.109166, 2024a.
Płaczkowska, E., Kijowska-Strugała, M., Ketzler, G., Bogena, H. R., and Leuchner, M.: Solute fluxes in headwater catchments with contrasting anthropogenic impact, Geomorphology, 454, 109166, https://doi.org/10.1016/j.geomorph.2024.109166, 2024b.
Preston, S. D., Bierman, V. J., and Silliman, S. E.: An evaluation of methods for the estimation of tributary mass loads, Water Resour. Res., 25, 1379–1389, https://doi.org/10.1029/WR025i006p01379, 1989.
Rajwa-Kuligiewicz, A. and Bojarczuk, A.: Streamflow response to catastrophic windthrow and forest recovery in subalpine spruce forest, J. Hydrol., 634, 131078, https://doi.org/10.1016/j.jhydrol.2024.131078, 2024.
Robertson, D. M. and Roerish, E. D.: Influence of various water quality sampling strategies on load estimates for small streams, Water Resour. Res., 35, 3747–3759, https://doi.org/10.1029/1999WR900277, 1999.
Robinson, K.-L., Bogena, H. R., Wang, Q., Cammeraat, E., and Bol, R.: Effects of deforestation on dissolved organic carbon and nitrate in catchment stream water revealed by wavelet analysis, Front. Water, 4, 1003693, https://doi.org/10.3389/frwa.2022.1003693, 2022.
Rosenbaum, U., Bogena, H. R., Herbst, M., Huisman, J. A., Peterson, T. J., Weuthen, A., Western, A. W., and Vereecken, H.: Seasonal and event dynamics of spatial soil moisture patterns at the small catchment scale, Water Resour. Res., 48, 2011WR011518, https://doi.org/10.1029/2011WR011518, 2012.
Runkel, R. and De Cicco, L.: USGS-R/rloadest: River Load Estimation, U. S. Geological Survey (USGS), https://water.usgs.gov/software/loadest/ (last access: 3 December 2025), 2017.
Runkel, R. L., Crawford, C. G., and Timothy, A. C.: Load Estimator (LOADEST): A FORTRAN program for estimating constituent loads in streams and rivers, U. S. Geological Survey (USGS), https://www.usgs.gov/data/data-and-rloadest-models-used-estimate-sediment-and-nutrient (last access: 3 December 2025), 2004.
Saadi, M., Furusho-Percot, C., Belleflamme, A., Trömel, S., Kollet, S., and Reinoso-Rondinel, R.: Comparison of Three Radar-Based Precipitation Nowcasts for the Extreme July 2021 Flooding Event in Germany, J. Hydrometeorol., 24, 1241–1261, https://doi.org/10.1175/JHM-D-22-0121.1, 2023.
Škerlep, M., Nehzati, S., Sponseller, R. A., Persson, P., Laudon, H., and Kritzberg, E. S.: Differential Trends in Iron Concentrations of Boreal Streams Linked to Catchment Characteristics, Glob. Biogeochem. Cycles, 37, e2022GB007484, https://doi.org/10.1029/2022GB007484, 2023.
Stockinger, M. P., Bogena, H. R., Lücke, A., Diekkrüger, B., Weiler, M., and Vereecken, H.: Seasonal soil moisture patterns: Controlling transit time distributions in a forested headwater catchment, Water Resour. Res., 50, 5270–5289, https://doi.org/10.1002/2013WR014815, 2014.
Strohmeier, S., Knorr, K.-H., Reichert, M., Frei, S., Fleckenstein, J. H., Peiffer, S., and Matzner, E.: Concentrations and fluxes of dissolved organic carbon in runoff from a forested catchment: insights from high frequency measurements, Biogeosciences, 10, 905–916, https://doi.org/10.5194/bg-10-905-2013, 2013.
Tittel, J., Büttner, O., Friese, K., Lechtenfeld, O. J., Schuth, S., Von Tümpling, W., and Musolff, A.: Iron Exports From Catchments Are Constrained by Redox Status and Topography, Glob. Biogeochem. Cycles, 36, e2021GB007056, https://doi.org/10.1029/2021GB007056, 2022.
Vilhar, U., Kermavnar, J., Kozamernik, E., Petrič, M., and Ravbar, N.: The effects of large-scale forest disturbances on hydrology – An overview with special emphasis on karst aquifer systems, Earth-Sci. Rev., 235, 104243, https://doi.org/10.1016/j.earscirev.2022.104243, 2022.
Walker, W. W.: Simplified procedures for eutrophication assessment and prediction: user manual, U.S. Army Engineer Waterways Experiment Station, Vicksburg, Mississippi, USA, https://www.waterboards.ca.gov/losangeles/board_decisions/basin_plan_amendments/technical_documents/64_New/07_0712/BATHTUB_Manual.pdf (last access: 3 December 2025), 1996.
Wang, J., Bogena, H., Süß, T., Graf, A., Weuthen, A., and Brüggemann, N.: Investigating the controls on greenhouse gas emission in the riparian zone of a small headwater catchment using an automated monitoring system, Vadose Zone J., 20, https://doi.org/10.1002/vzj2.20149, 2021.
Wang, J., Bouchez, J., Dolant, A., Floury, P., Stumpf, A. J., Bauer, E., Keefer, L., Gaillardet, J., Kumar, P., and Druhan, J. L.: Sampling frequency, load estimation and the disproportionate effect of storms on solute mass flux in rivers, Sci. Total Environ., 906, 167379, https://doi.org/10.1016/j.scitotenv.2023.167379, 2024.
Wang, Q., Qu, Y., Robinson, K.-L., Bogena, H., Graf, A., Vereecken, H., Tietema, A., and Bol, R.: Deforestation alters dissolved organic carbon and sulfate dynamics in a mountainous headwater catchment – A wavelet analysis, Front. For. Glob. Change, 5, 1044447, https://doi.org/10.3389/ffgc.2022.1044447, 2022.
Weigand, S., Bol, R., Reichert, B., Graf, A., Wiekenkamp, I., Stockinger, M., Luecke, A., Tappe, W., Bogena, H., Puetz, T., Amelung, W., and Vereecken, H.: Spatiotemporal Analysis of Dissolved Organic Carbon and Nitrate in Waters of a Forested Catchment Using Wavelet Analysis, Vadose Zone J., 16, vzj2016.09.0077, https://doi.org/10.2136/vzj2016.09.0077, 2017.
Wiekenkamp, I., Huisman, J. A., Bogena, H. R., Graf, A., Lin, H. S., Drüe, C., and Vereecken, H.: Changes in measured spatiotemporal patterns of hydrological response after partial deforestation in a headwater catchment, J. Hydrol., 542, 648–661, https://doi.org/10.1016/j.jhydrol.2016.09.037, 2016a.
Wiekenkamp, I., Huisman, J. A., Bogena, H. R., Lin, H. S., and Vereecken, H.: Spatial and temporal occurrence of preferential flow in a forested headwater catchment, J. Hydrol., 534, 139–149, https://doi.org/10.1016/j.jhydrol.2015.12.050, 2016b.
Wiekenkamp, I., Huisman, J. A., Bogena, H. R., and Vereecken, H.: Effects of Deforestation on Water Flow in the Vadose Zone, Water, 12, 35, https://doi.org/10.3390/w12010035, 2019.
Winter, C., Jawitz, J. W., Ebeling, P., Cohen, M. J., and Musolff, A.: Divergence Between Long-Term and Event-Scale Nitrate Export Patterns, Geophys. Res. Lett., 51, e2024GL108437, https://doi.org/10.1029/2024GL108437, 2024.
Winter, C., Müller, S., Kattenborn, T., Stahl, K., Szillat, K., Weiler, M., and Schnabel, F.: Forest Dieback in Drinking Water Protection Areas – A Hidden Threat to Water Quality, Earths Future, 13, e2025EF006078, https://doi.org/10.1029/2025EF006078, 2025.
Worrall, F., Howden, N. J. K., and Burt, T. P.: Assessment of sample frequency bias and precision in fluvial flux calculations – An improved low bias estimation method, J. Hydrol., 503, 101–110, https://doi.org/10.1016/j.jhydrol.2013.08.048, 2013.
Xu, C., Förster, M., Beckschäfer, P., Talkner, U., Klinck, C., and Kleinschmit, B.: Modeling European beech defoliation at a regional scale gradient in Germany from northern lowlands to central uplands using geo-ecological parameters, Sentinel-2 and National Forest Condition Survey data, For. Ecol. Manag., 576, 122383, https://doi.org/10.1016/j.foreco.2024.122383, 2025.
Zacharias, S., Bogena, H., Samaniego, L., Mauder, M., Fuß, R., Pütz, T., Frenzel, M., Schwank, M., Baessler, C., Butterbach-Bahl, K., Bens, O., Borg, E., Brauer, A., Dietrich, P., Hajnsek, I., Helle, G., Kiese, R., Kunstmann, H., Klotz, S., Munch, J. C., Papen, H., Priesack, E., Schmid, H. P., Steinbrecher, R., Rosenbaum, U., Teutsch, G., and Vereecken, H.: A Network of Terrestrial Environmental Observatories in Germany, Vadose Zone J., 10, 955–973, https://doi.org/10.2136/vzj2010.0139, 2011.
Zacharias, S., Loescher, H. W., Bogena, H., Kiese, R., Schrön, M., Attinger, S., Blume, T., Borchardt, D., Borg, E., Bumberger, J., Chwala, C., Dietrich, P., Fersch, B., Frenzel, M., Gaillardet, J., Groh, J., Hajnsek, I., Itzerott, S., Kunkel, R., Kunstmann, H., Kunz, M., Liebner, S., Mirtl, M., Montzka, C., Musolff, A., Pütz, T., Rebmann, C., Rinke, K., Rode, M., Sachs, T., Samaniego, L., Schmid, H. P., Vogel, H., Weber, U., Wollschläger, U., and Vereecken, H.: Fifteen Years of Integrated Terrestrial Environmental Observatories (TERENO) in Germany: Functions, Services, and Lessons Learned, Earths Future, 12, e2024EF004510, https://doi.org/10.1029/2024EF004510, 2024.