the Creative Commons Attribution 4.0 License.
the Creative Commons Attribution 4.0 License.
 | 08 Dec 2025
Long-term land–atmosphere energy and water exchange observational dataset over central Tibetan Plateau
Haipeng Yu
Guantian Wang
Zeyong Hu
Yaoming Ma
Maoshan Li
Weiqiang Ma
Lianglei Gu
Fanglin Sun
Hongchun Gao
Shujin Wang
Fuquan Lu
In recent decades, the climate of Tibetan Plateau has undergone notable changes, which has a strong influence on global climate systems and human activities, making it a research hotspot. However, due to its extreme elevation, harsh environment, and complex underlying surface, long-term observations of the central Plateau's atmospheric vertical profiles have been challenging and scientific data sharing is crucial and in urgent need. This paper presents a 9-year observational dataset (2014–2022) with hourly temporal resolution from the Nagqu region of northern Tibet. The dataset is a combination of four field stations covering the central Tibetan Plateau, which recorded near-surface meteorological data, radiation budget, turbulent fluxes, and soil hydrothermal characteristics. All observational items in this dataset underwent data processing and quality control to ensure data quality. This dataset represents the most detailed raw observational data on the central Tibetan Plateau's spatial coverage and recent changes. It holds significant value in revealing energy and water exchanges between the land surface and the atmosphere on the Tibetan Plateau. Main datasets are freely available at the National Tibetan Plateau/Third Pole Environment Data Center (https://doi.org/10.11888/Meteoro.tpdc.270010, Hu et al., 2019 and https://cstr.cn/18406.11.Meteoro.tpdc.270010, last access: 5 November 2025) and additionally at National Tibetan Plateau/Third Pole Environment Data Center (https://doi.org/10.11888/Atmos.tpdc.300325, Wang et al., 2023a and https://cstr.cn/18406.11.Atmos.tpdc.300325, last access: 5 November 2025).
- Article
(8147 KB) - Full-text XML
- BibTeX
- EndNote


The Tibetan Plateau (TP), with an average altitude exceeding 4000 m, is the world's largest mountain range, often referred to as the “Third Pole” (Qiu, 2008). It is the source of many major rivers, including the Yangtze, Yellow, Mekong, and Brahmaputra, which provide freshwater to 1.4 billion people (Immerzeel et al., 2020). It is also known as the “Asian Water Tower” (Immerzeel et al., 2010). The plateau's substantial absorption of solar radiation renders it the warmest region in the mid-troposphere. This plays a key role in the evolution of the East Asian Summer Monsoon and Indian Summer Monsoon systems (Wu et al., 2007, 2012; Li et al., 2018; Zhang et al., 2019b), which in turn affect circulation patterns in East Asia, and even the Northern Hemisphere (Fan et al., 2023; Curio and Scherer, 2016; Sun et al., 2022). The intricate surface characteristics of the TP make it particularly susceptible to external disturbances in the context of global warming (Li et al., 2022; Kang et al., 2010). Meteorological observations indicate that surface warming on the TP commenced at an earlier and more accelerated pace than in other regions at the same latitude (Liu and Chen, 2000). Climate change on the TP has resulted in most regions becoming warmer and moister, while the southern part has become warmer and drier (Yang et al., 2014). These changes in temperature and moisture have further led to significant shifts in many environmental systems on the plateau, including precipitation (Yang et al., 2011), glaciers (Yao et al., 2012), lakes (Lei et al., 2014), and vegetation (Shen et al., 2015). Therefore, in-depth research on TP not only helps us better understand the impact of global warming on its unique ecosystems and climatic features, but also is crucial for assessing its contribution to regional and even global water cycles and energy balance. In recent decades, a multitude of comprehensive observation stations have been established with the objective of strengthening climate change research on the TP. These include the Third Pole Environment Observation and Research Platform and the Integrated Three-Dimensional Observation Research Platform for Third Pole Environment (Ma et al., 2018, 2023). The establishment of these observation stations has resulted in a significant improvement in the availability of data on land–atmosphere interactions on the plateau. The comprehensive data network has enhanced the quality of land surface models and corrected satellite retrievals (Ma et al., 2024). However, due to factors such as transportation and maintenance costs, most observations are concentrated in the eastern part of the TP, with limited long-term observations of the plateau's interior, especially in the high-altitude regions of northern Tibet (Shen and Xiong, 2016; Duan and Xiao, 2015).
The central Tibetan Plateau (CTP) belongs to a typical plateau climate with an average altitude exceeding 4500 m. It is bordered by the Kunlun and Tanggula Mountains to the northwest and the Nyenchen Tanglha Mountains to the south, covering an area of 446 000 km2, which represents one-fifth of the total area of Tibet. The CTP is known as the “Roof of the Roof of the World”, representing the highest and most typical plateau form on the TP. Due to its high altitude, the substrate is dominated by cold-resistant vegetation, with an annual precipitation of 154.9 mm and approximately 50 rainy days, characterizing a typical subarctic semi-arid monsoon climate (Li et al., 2017). During clear weather, the downward shortwave radiation peaks at 1200 W m−2, which is significantly higher than inland observations (He et al., 2010). The period from May to September is characterised by warm and moist conditions, with frequent rainfall, while October to April is cold and dry with prevalent strong winds. During the summer months, the CTP serves as a thermal core area, with surface heating being a key factor in making the plateau a heat source. The thermal effect of the CTP influences not only the plateau itself but also weather and climate systems in East Asia, and even the Northern Hemisphere (Zhao et al., 2019). Over the past 40 years, the warming trend on the CTP has been significantly higher than in lower-altitude areas, with surface temperature warming rates and precipitation amounts also higher than in eastern regions of the TP (Chen et al., 2003; Liu et al., 2009; Yang et al., 2002). The number of consecutive dry days on the central TP has been steadily decreasing in conjunction with accelerated warming and moistening (Ciwangdunzhu et al., 2018), while its lakes are experiencing strong expansion or contraction (Zhang et al., 2019a; Lei et al., 2013, 2014). Some lakes serve as heat sources year-round and have an annual evaporation rate of 312.9 mm (Guo et al., 2014). Concurrently, glaciers on the CTP are rapidly melting, and permafrost areas are shrinking, severely impacting the surrounding environment (Jin et al., 2009; Sun et al., 2020b). A substantial evidence base indicates that the CTP's ecological environment is highly fragile, and the surface heat exchange in this region is significant for climate change. However, there remains substantial uncertainty regarding the impact mechanisms (Song et al., 2012; Yang et al., 2014). This can be attributed to the harsh environment, frequent extreme weather such as strong winds and hail showers, and faulty observation equipment. Furthermore, much of the region's intricate topography is unsuitable for human habitation, resulting in a sparsely populated area, inadequate transportation infrastructure, and delayed equipment maintenance. This has led to the availability of relatively limited long-term and stable observational data for the CTP.
To fill these gaps, a series of mesoscale observation networks have been established in the vicinity of the Nagqu Observation Network of Plateau Climate and Environment (NPCE). The NPCE commenced observations in 1997 and serves as a link between the East Asian Monsoon and the Indian Monsoon, as well as a transition zone between the monsoon systems and westerly circulation. It is a region of significant thermal activity on the plateau, and the central zone for China's Third Atmospheric Science Experiment on the TP. This distinctive geographical position gives NPCE a pivotal role in TP research. Following decades of observations, data from the Nagqu observing network has become an important platform for research on land–atmosphere interactions in northern Tibet. It has provided significant support for studies on boundary layer observations (Gu et al., 2022; Ueno et al., 2012), land–atmosphere energy transfer (Yang et al., 2010; Gu et al., 2015; Li et al., 2015), substrate evaporation (Zou et al., 2018), soil hydrothermal balance (Bian et al., 2012; Fu et al., 2022), and numerical simulations (Deng et al., 2021; Li and Hu, 2009; Sun et al., 2020a). In recent years, there has been a gradual increase in the availability of field datasets to the public with free access. In order to optimise the potential value of scientific datasets, we describe and provide a high-time-resolution dataset. This dataset comprises nine years of near-surface meteorological, radiation, turbulent flux, and soil hydrothermal observations from NPCE. It provides a more accurate and comprehensive depiction of land–atmosphere interactions and boundary layer structure on the TP, playing a key role in numerical simulations and climate assessments.
The paper is organized as follows: Sect. 2 provides an overview of NPCE's geographic location, observation equipment, variables, data processing, and data availability. Section 3 presents near-surface meteorological, radiation, turbulent flux, and soil hydrothermal observations, discussing data integrity. Section 4 comprises a discussion, and Sect. 5 is conclusion.
2.1 Site descriptions
The NPCE is affiliated with the Northwest Institute of Eco-Environment and Resources, Chinese Academy of Sciences, was established on 4 May 2009, with observational activities commencing on 1 April 1997. The central station is situated in Niaoqu Village, Luoma Town, Seni District, Nagqu City, Tibet Autonomous Region (longitude 91.90° E, latitude 31.37° N, altitude 4509 m), near the Tanggula Mountains, where the Indian monsoon and the East Asian monsoon intersect. The observation field is relatively flat and open, with abundant water resources and situated in an area characterised by pastoral activities. The substrate vegetation is primarily alpine grassland, with a relatively clean atmosphere and a low aerosol content. The station's unique geographic location and subsurface characteristics are significant for the observation and study of high-altitude climate environments.
Over more than 20 years, NPCE has developed into a network of four atmospheric boundary layer physics and land surface process observation points in the Nagqu region and along the Qinghai-Tibet Highway. The locations in Fig. 1 are BJ, Amdo, NewD66, and MS3478. These represent different substrate characteristics, namely plateau grassland, plateau meadow, plateau wetland, and plateau bareland. Since plant roots are primarily concentrated in the shallow soil layers of the plateau, root biomass in the 0–10 cm layer accounts for 70 % of the total root biomass (Su et al., 2021). This leads to pronounced seasonal variations in the surface soil at each observation site. In addition to vegetation, variations in soil temperature and moisture are influenced by precipitation, soil properties, and underlying permafrost. The correlation between soil temperature and air temperature gradually decreases with increasing depth (Wang et al., 2023b). Consequently, the different underlying surfaces within the Nagqu observation network represent distinct environmental features of the TP, their interannual variation trends and influencing factors exhibit notable differences (Sun et al., 2016). In 2014, NPCE became a member of the Chinese Academy of Sciences Cold Region Surface Process and Environmental Monitoring Research Network and the Chinese Academy of Sciences Land Surface Process Research Network.
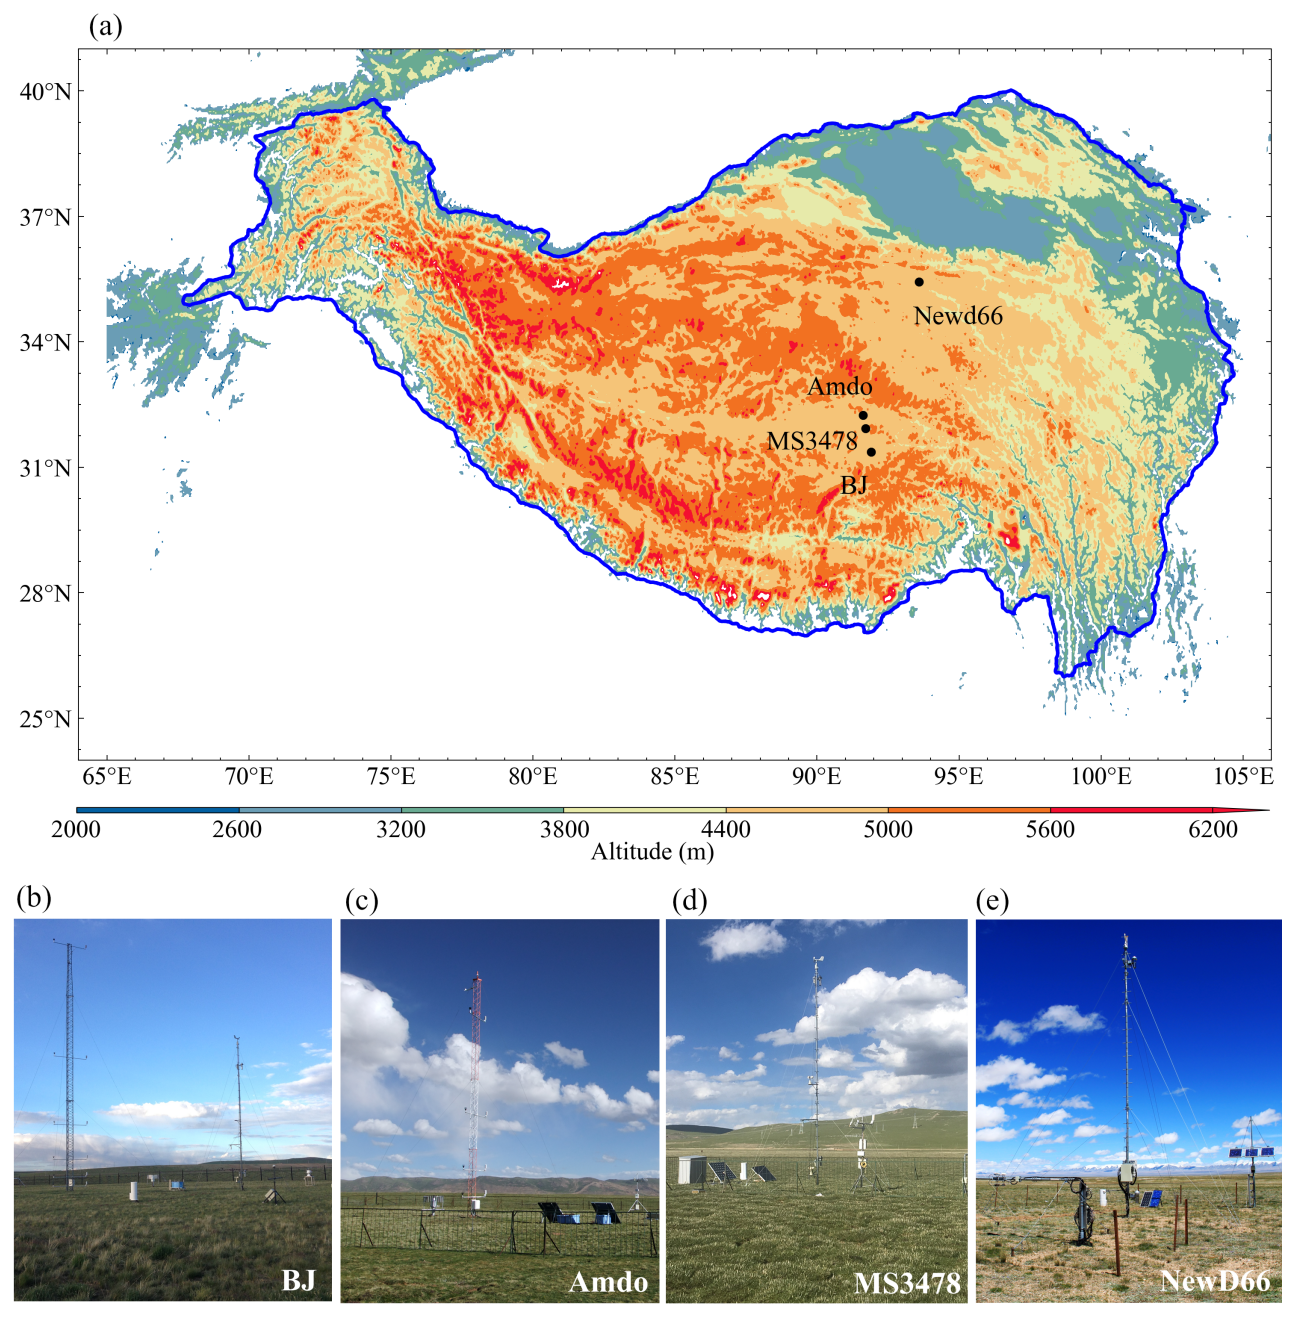
Figure 1Geographic locations of the observation stations of NPCE (a) and on-site image of BJ (b), Amdo (c), MS3478 (d), and NewD66 (e).
2.2 Observation infrastructure and data processing
The NPCE utilises automatic observation mode, capable of sustaining continuous observation throughout the year. In order to ensure the continuity and accuracy of the observation data, the maintenance engineers are responsible for conducting on-site inspections and maintenance of the infrastructures at regular intervals at each observation station and collect the observation data. All data are transmitted to the data centre for processing to facilitate timely and effective detection of technical problems.
The NPCE near-surface meteorological observation system consists of Planetary Boundary Layer (PBL) towers and Automatic Weather Stations (AWS). These instruments measure vertical profiles of meteorological conditions, including air temperature, relative humidity, wind direction and wind speed within the boundary layer. Observation heights range from 0.75–12 m at BJ and Amdo, and approximately 1 and 10 m at NewD66 and MS3478. The observation probes deployed at each station were of the same type to ensure consistency, but the specific observation heights varied slightly across different stations. The vertical soil hydrothermal characteristics were measured at each station with multilayer soil temperature and moisture probes located between 5–160 cm from the surface, with a proportional distribution of observation depths. High-frequency Eddy Covariance (EC) systems were installed at the four stations after 2012, allowing for the capture of sensible, latent and carbon dioxide fluxes, with a sampling frequency of 0.1 s and an output interval of 30 min. Surface observations encompass surface air temperature, humidity, radiative quadrature, atmospheric pressure, precipitation, and snow depth. All observations are recorded at a sampling frequency of 10 s and an output interval of 30 min. More details of the observation instruments are listed in Table 1. Station BJ is also equipped with a ground-based microwave radiometer, a blowing snow observation instrument, and a wind profile radar. The ground-based microwave radiometer (MWP967KV) can observe temperature and humidity profiles up to 10 km above the surface under all weather conditions, with a 2 min output interval. The FlowCapt FC4 blowing snow sensor inverts digital signals by collecting the acoustic pressure of the blowing snow particles as they impact. The CFL-03 pulsed Doppler wind profile radar (WPR) can capture the wind speed and wind direction profile. It has a detection range of 300 to 3000 m and an output interval of 5 min. These observational instruments collectively constitute a well-established monitoring system capable of comprehensively tracking weather events across the central TP and their associated impacts.
Table 1Detailed information about observation stations and instruments of NPCE.
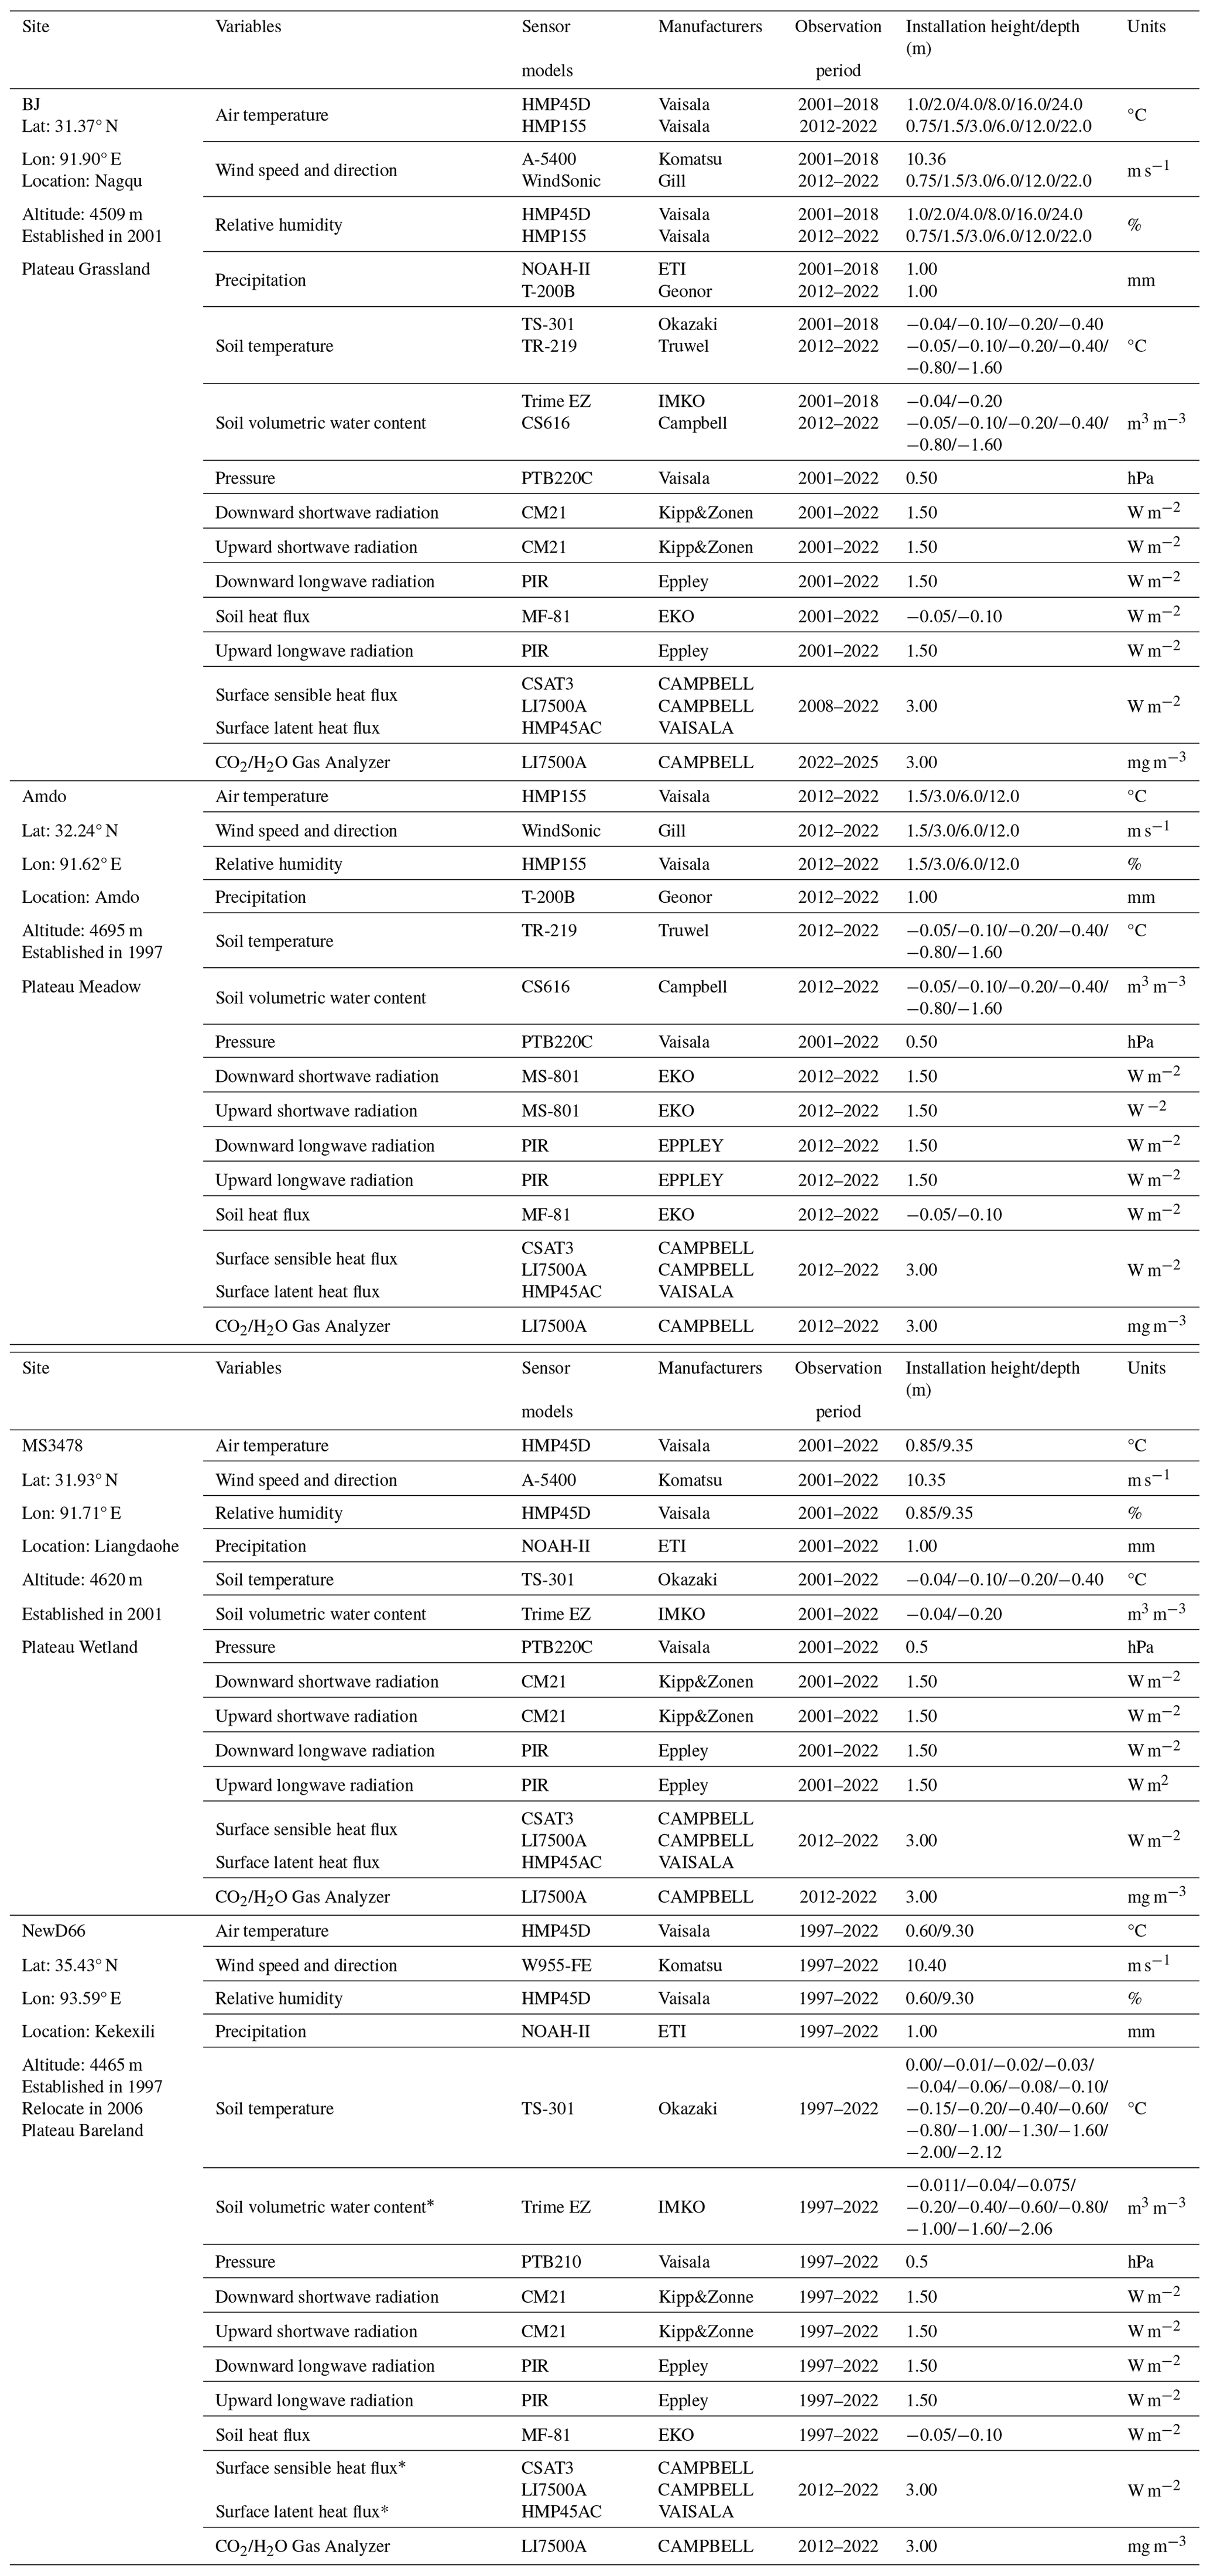
Note: All data presented herein exhibit availability greater than 50 %, with the mark “*” specifically indicating availability below 80 %.
For near-surface micrometeorological observations in complex environments, quality control of data processing is crucial. In order to ensure the consistency of data at each site in the harsh natural environment of the TP, engineers firstly check the data in terms of range, which is a constant value set according to the climatic conditions of the TP and ignore the seasonal variations. Factors such as the replacement of original parts and extreme weather can lead to temporary sensor malfunction. This can result in no change or unrealistic jumps in the data for several hours. These factors can make it difficult to properly deal with the issue during the range check. Consequently, engineers will utilise manual quality control at the conclusion of the process, based on empirical observations, to rectify or eliminate anomalous intervals and thereby ensure that outliers do not adversely affect the mean observations. The removed missing measurements and outliers are denoted by NAN or −9999. Moreover, three categories of quality classification are employed for turbulent fluxes. 0 denotes the highest quality of flux, 1 denotes flux suitable for general analysis, and 2 denotes flux with possible anomalies.
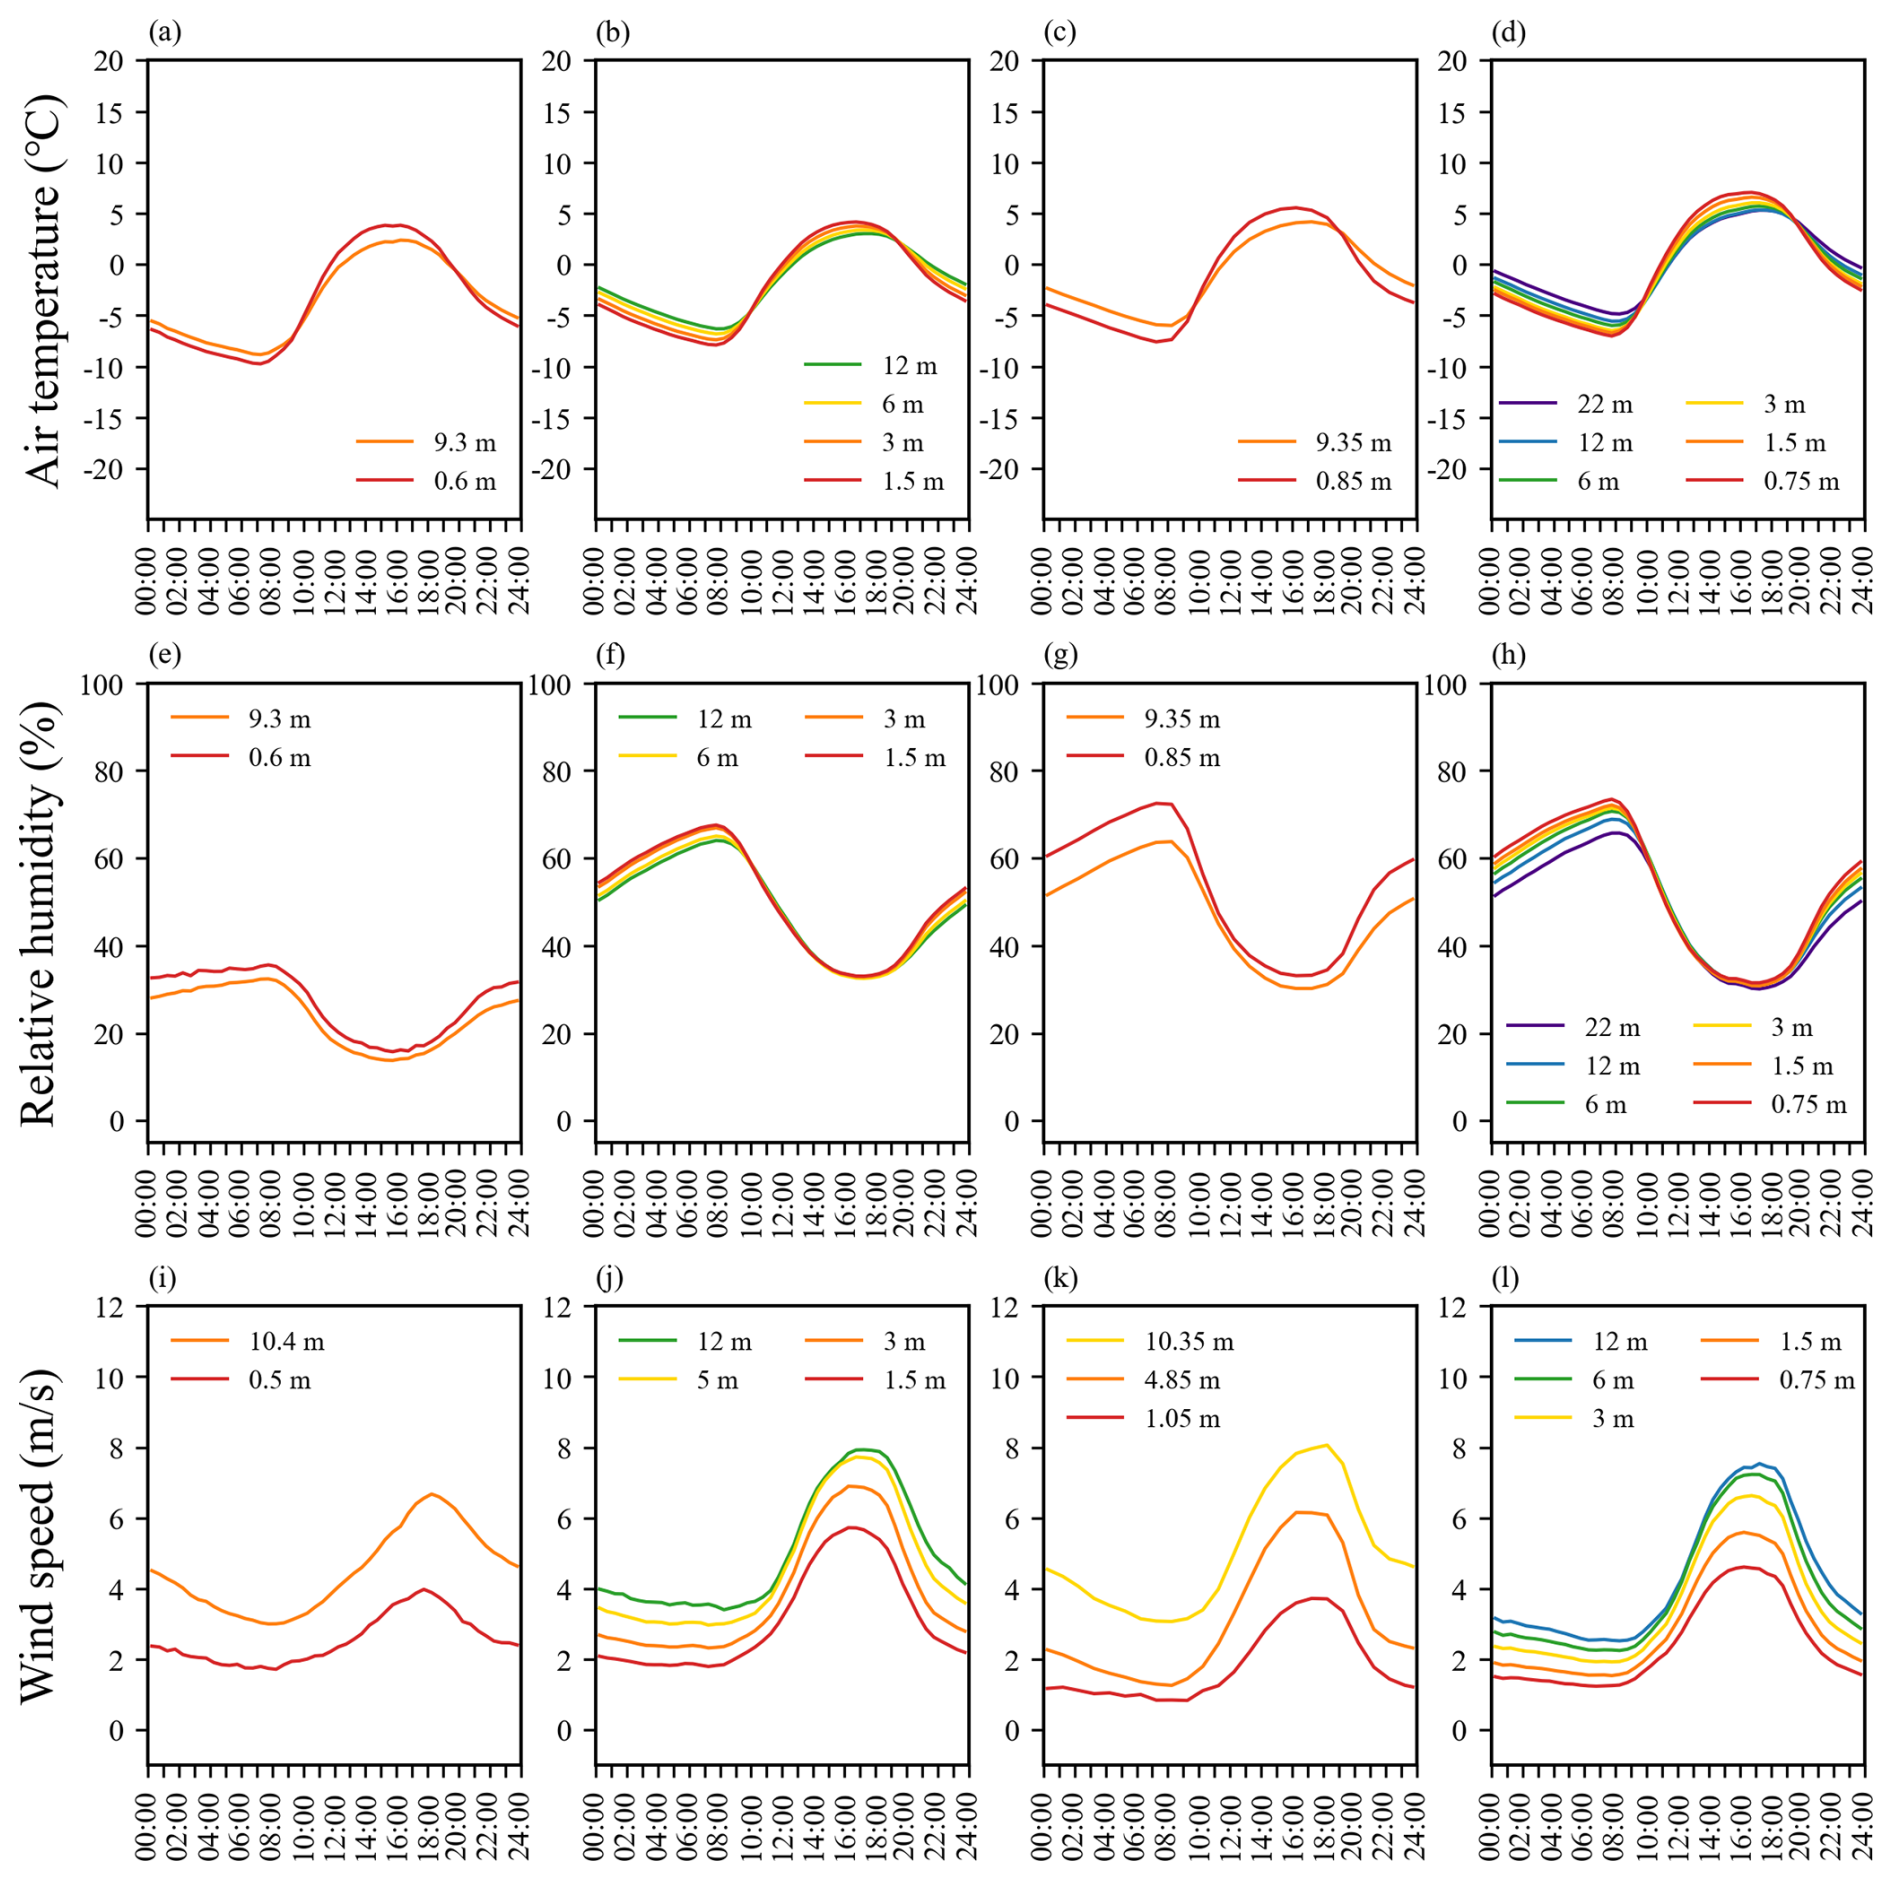
Figure 2Diurnal variations of temperature at different heights of the PBL tower at NewD66 (a), Amdo (b), MS3478 (c) and BJ (d), with corresponding relative humidity (e–h) and wind speed (i–l) at each station.
3.1 Near-surface meteorological data (air temperature, relative humidity, wind speed)
The main variables measured in near-surface micrometeorology are surface temperature, relative humidity and wind speed. Surface air pressure is a single-level observation, which decreases with altitude, while the other variables are gradient observations. Figure 2 compares the diurnal cycles of temperature, relative humidity and wind speed at different sites to illustrate the micrometeorological characteristics influenced by the different underlying surfaces. Most sites exhibit a maximum temperature at 18:00 LT and a minimum at 09:00 LT, indicating a clear diurnal pattern. As a result of latitudinal effects, the average temperature at the stations increases from north to south. The northernmost station NewD66 records a minimum temperature of −9.73 °C and a maximum of 3.84 °C, while the southernmost station BJ records a minimum temperature of −7.02 °C and a maximum of 7.05 °C. Irrespective of the water vapour content, relative humidity tends to decrease during the day and increase at night. The most pronounced diurnal variations are observed at lower altitudes. This is because daytime solar radiation heats the surface and atmosphere, making it harder for lower air layers to saturate, which naturally reduces relative humidity. The wind speed generally increases with altitude and shows a diurnal variation, being lower at night and higher during the day. MS3478 is situated in a plateau wetland, where the abundance of vegetation increases friction with the underlying surface, resulting in significantly reduced surface wind speeds at this station in comparison to other locations.
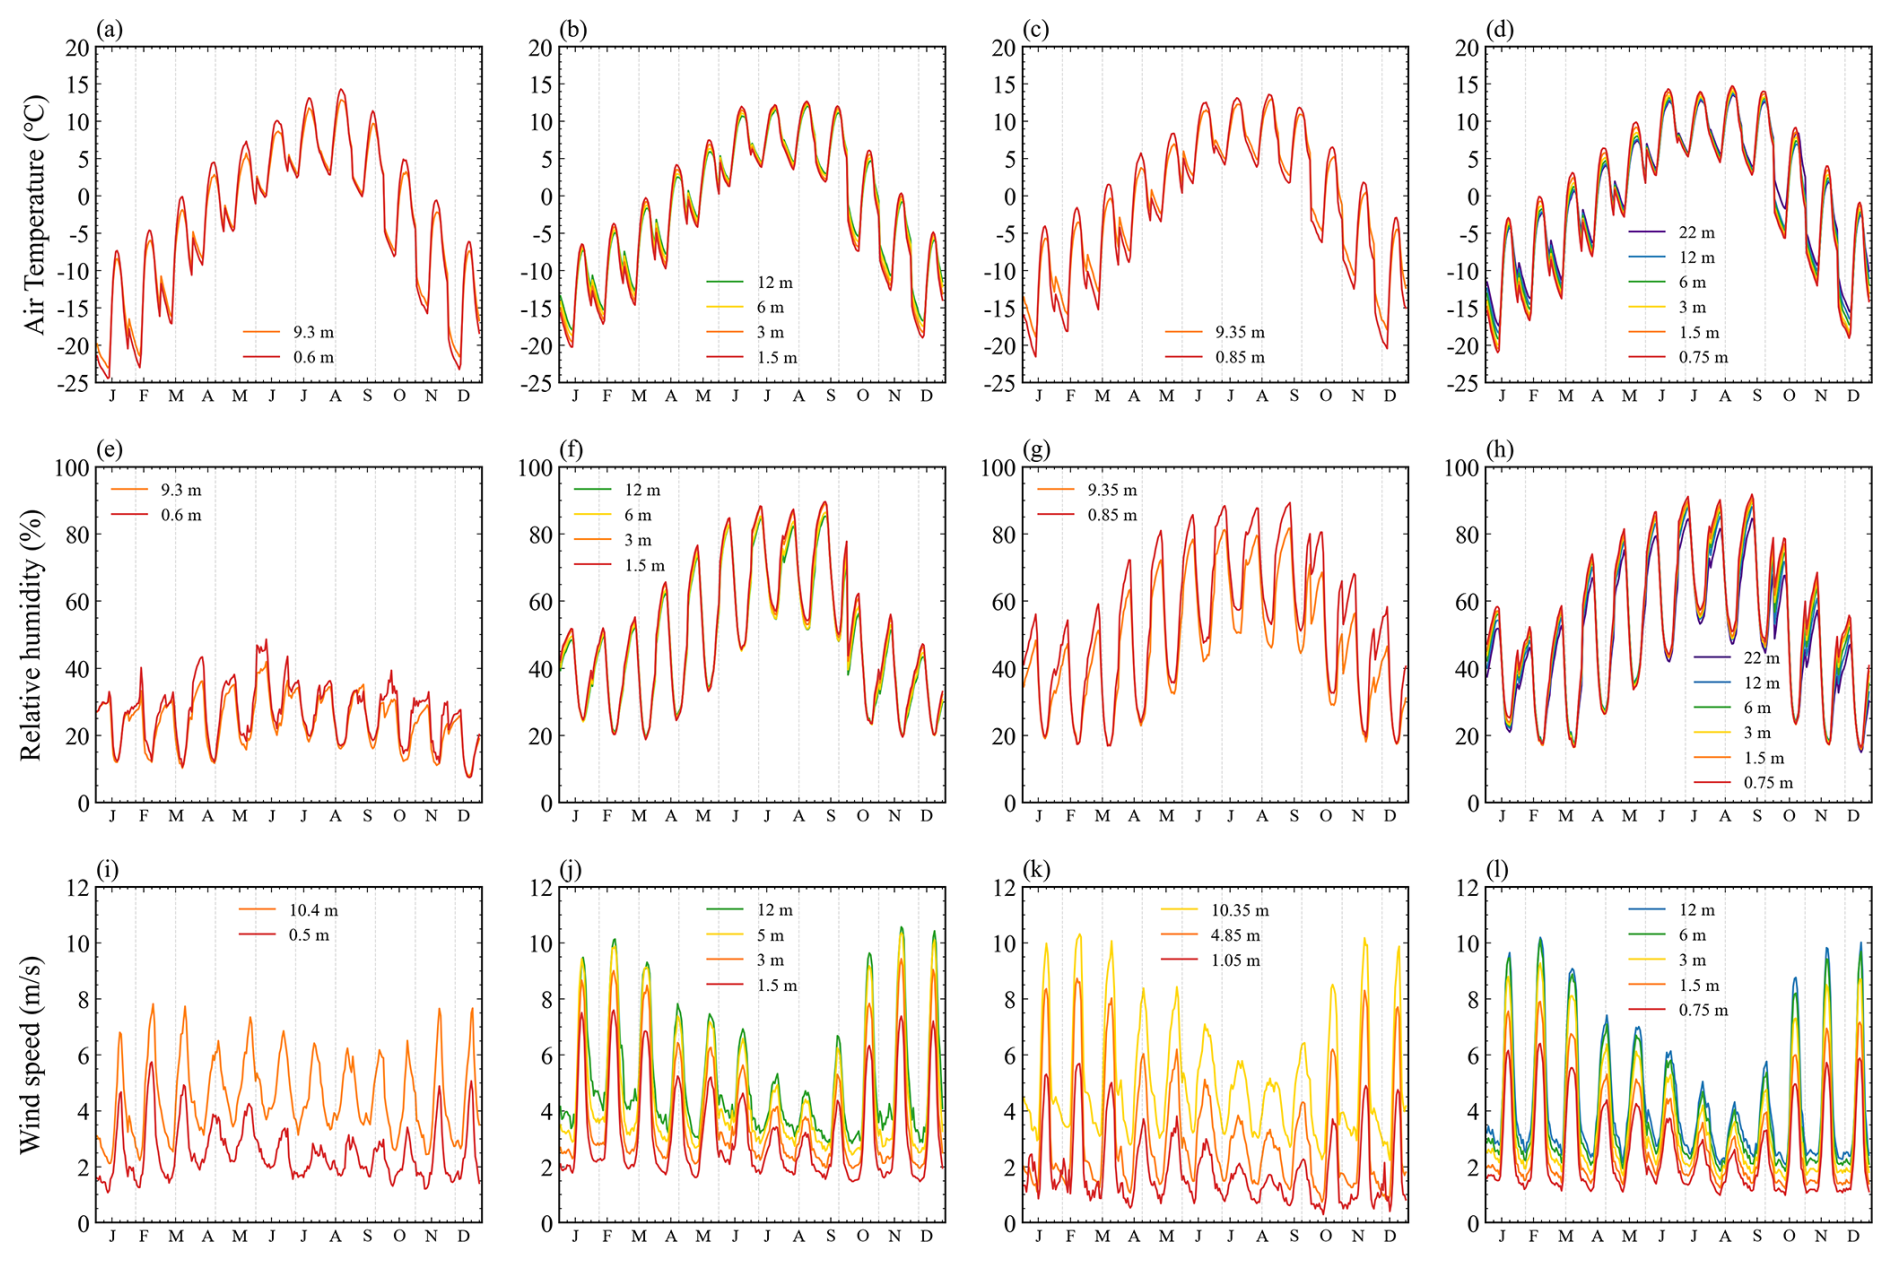
Figure 3Monthly diurnal variations of temperature at different heights of the PBL tower at NewD66 (a), Amdo (b), MS3478 (c) and BJ (d), with corresponding relative humidity (e–h) and wind speed (i–l) at each station.
Most stations exhibited notable seasonal fluctuations in temperature, relative humidity and wind speed (Fig. 3). Due to its cold bareland substrate, the NewD66 station experiences more pronounced diurnal temperature variations, with nighttime temperatures lower than those observed at other stations, occasionally reaching below −20 °C in January. In summer, with less pronounced diurnal variations than in winter, temperatures peak at all sites, reaching approximately 13 °C during the day and approximately 6 °C at night. Diurnal variations in relative humidity also show seasonal patterns, with NewD66 remaining consistently lower, never exceeding 50 %, and showing small variations in spring and even smaller variations in summer. In contrast, the most pronounced diurnal variations in relative humidity are observed during the spring at the other stations. As water vapour increases over the plateau, nighttime relative humidity remains above 50 % at all sites in summer, with diurnal humidity variations gradually decreasing. Wind speeds show greater diurnal variation in winter and increase with altitude. Peak wind speeds of more than 10 m s−1 are observed at the Amdo and BJ stations. In summer, the 12 m wind speed at the Amdo and BJ sites peaks at 4.3 m s−1 in August. Surface wind speeds at MS3478 are consistently low, but upper-level wind speeds are similar to those observed at the other sites. Consequently, MS3478 exhibits the most pronounced gradient in wind speed.
Figure 4 presents an annual cycle series, comprising daily mean values derived from gradient observations. At the NewD66 station, winter temperatures are demonstrably lower than at the other stations. In summer, the peak is reached at a later point in time and the duration is shorter. Other stations reach their highest temperatures in June and remain high until early September. With the onset of the monsoon season, continuous water vapour is transported from the ocean to the interior of the TP, resulting in a warming and humidification region. The stations begin to humidify rapidly in early May, reaching a peak in July with daily average relative humidity up to 80 %. They then dry rapidly by the end of September, with the end of the monsoon season. The NewD66 station is a plateau bareland, and is only humid for a short period in June, the rest of the year the relative humidity is below 30 %. Wind speeds at all stations show a pattern of being lower in summer and higher in winter. The TP is characterised by prevailing westerlies in winter, with daily mean wind speeds reaching 7 m s−1. In contrast, the summer months are more humid with frequent changes in weather systems, resulting in average surface wind speeds of less than 4 m s−1. Wind speeds at the NewD66 station are lower in winter than at other stations, but higher in summer.
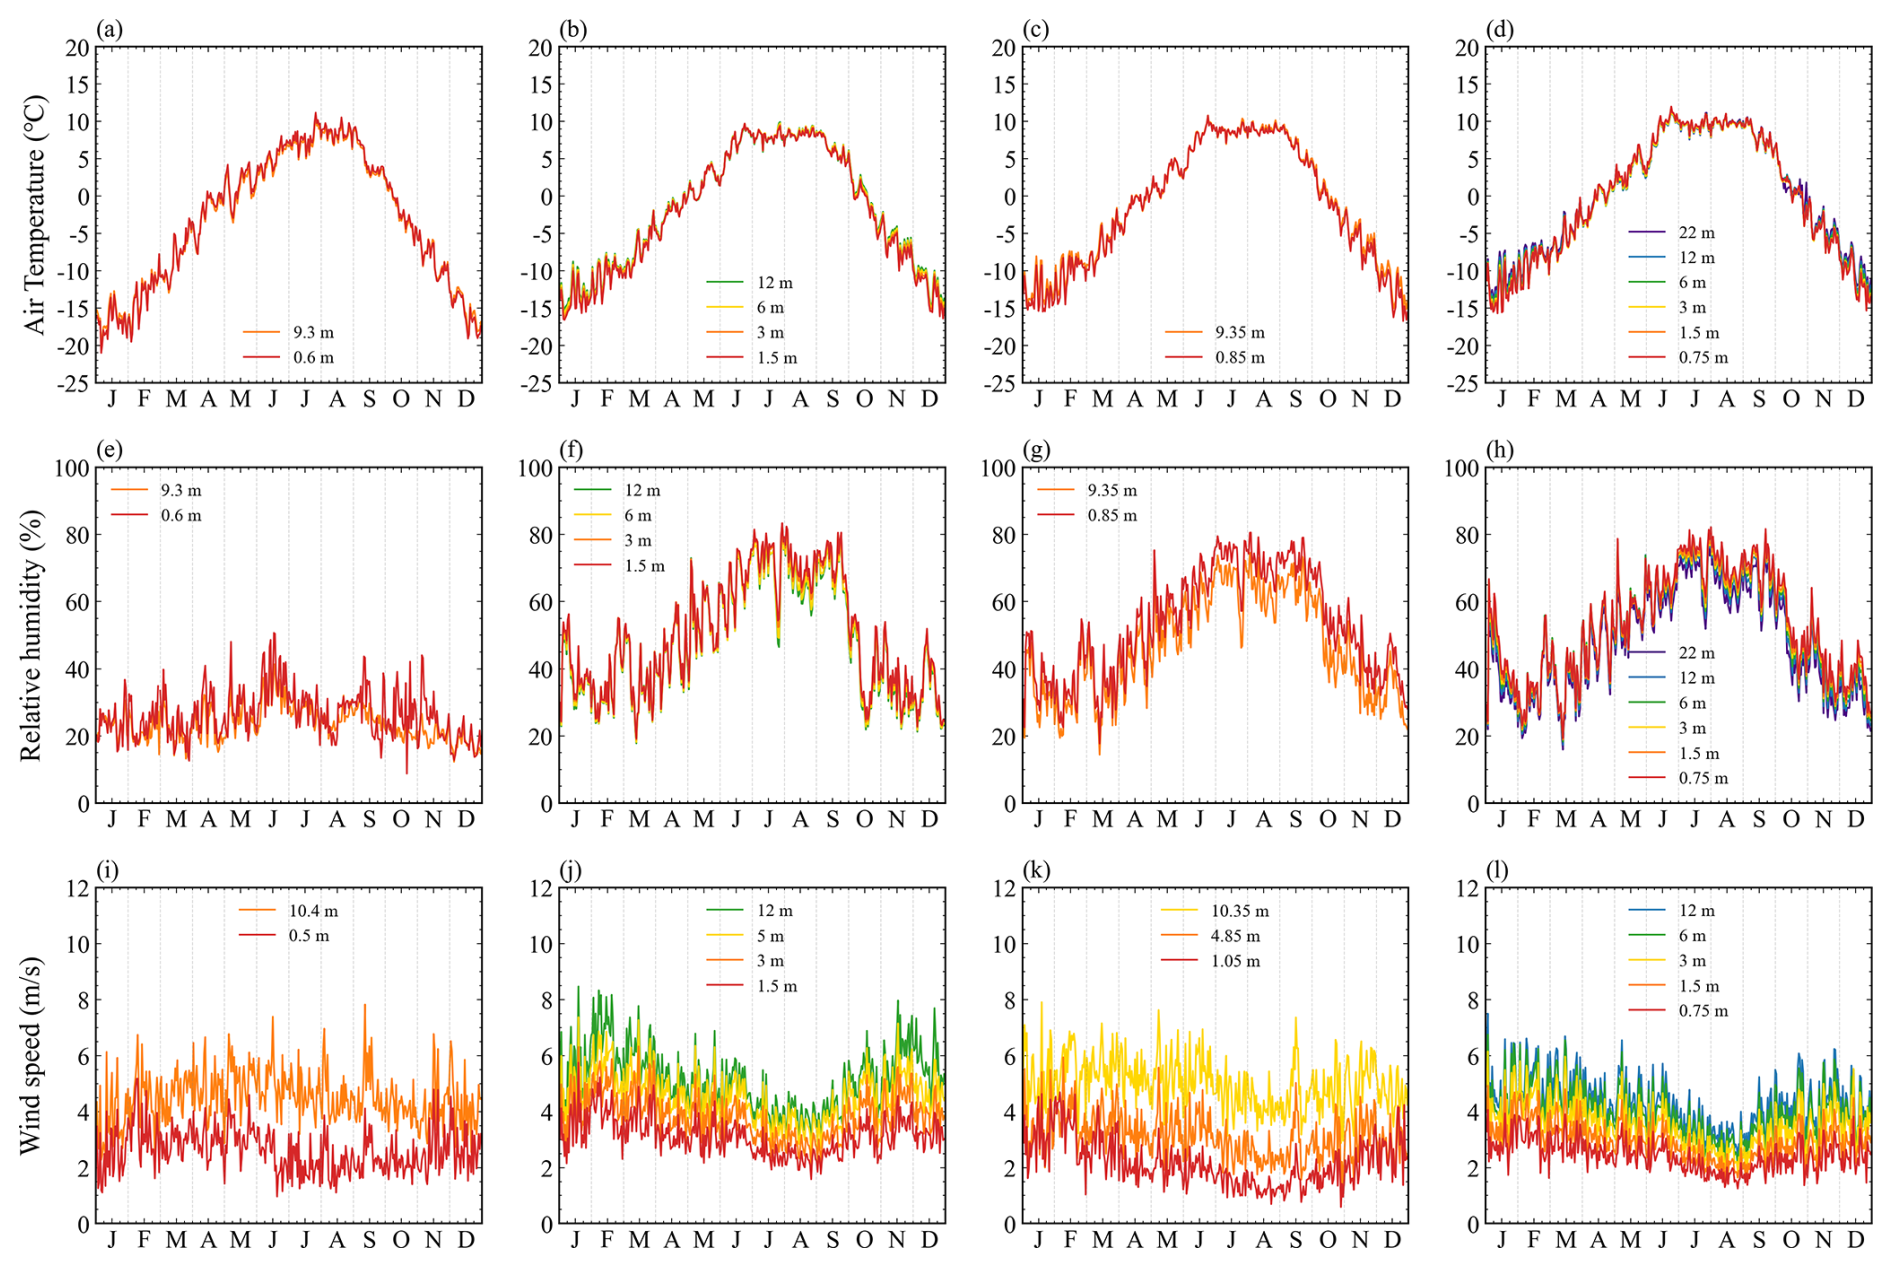
Figure 4Daily mean of temperature at different heights of the PBL tower at NewD66 (a), Amdo (b), MS3478 (c) and BJ (d), with corresponding relative humidity (e–h) and wind speed (i–l) at each station.
Wind directions at the TP differ significantly between the monsoon and non-monsoon seasons (Fig. 5). Influenced by the South Asian and East Asian summer monsoons, northeast winds dominate during the monsoon season, accounting for 39 % of the observations. In winter, there are fewer weather systems and most of the winds are steady westerly winds, with westerly winds accounting for up to 83 % of the observations at different stations. MS3478 records different wind directions than the other stations. It has a consistently high frequency of southeast winds in both summer and winter, probably due to the surrounding topography.
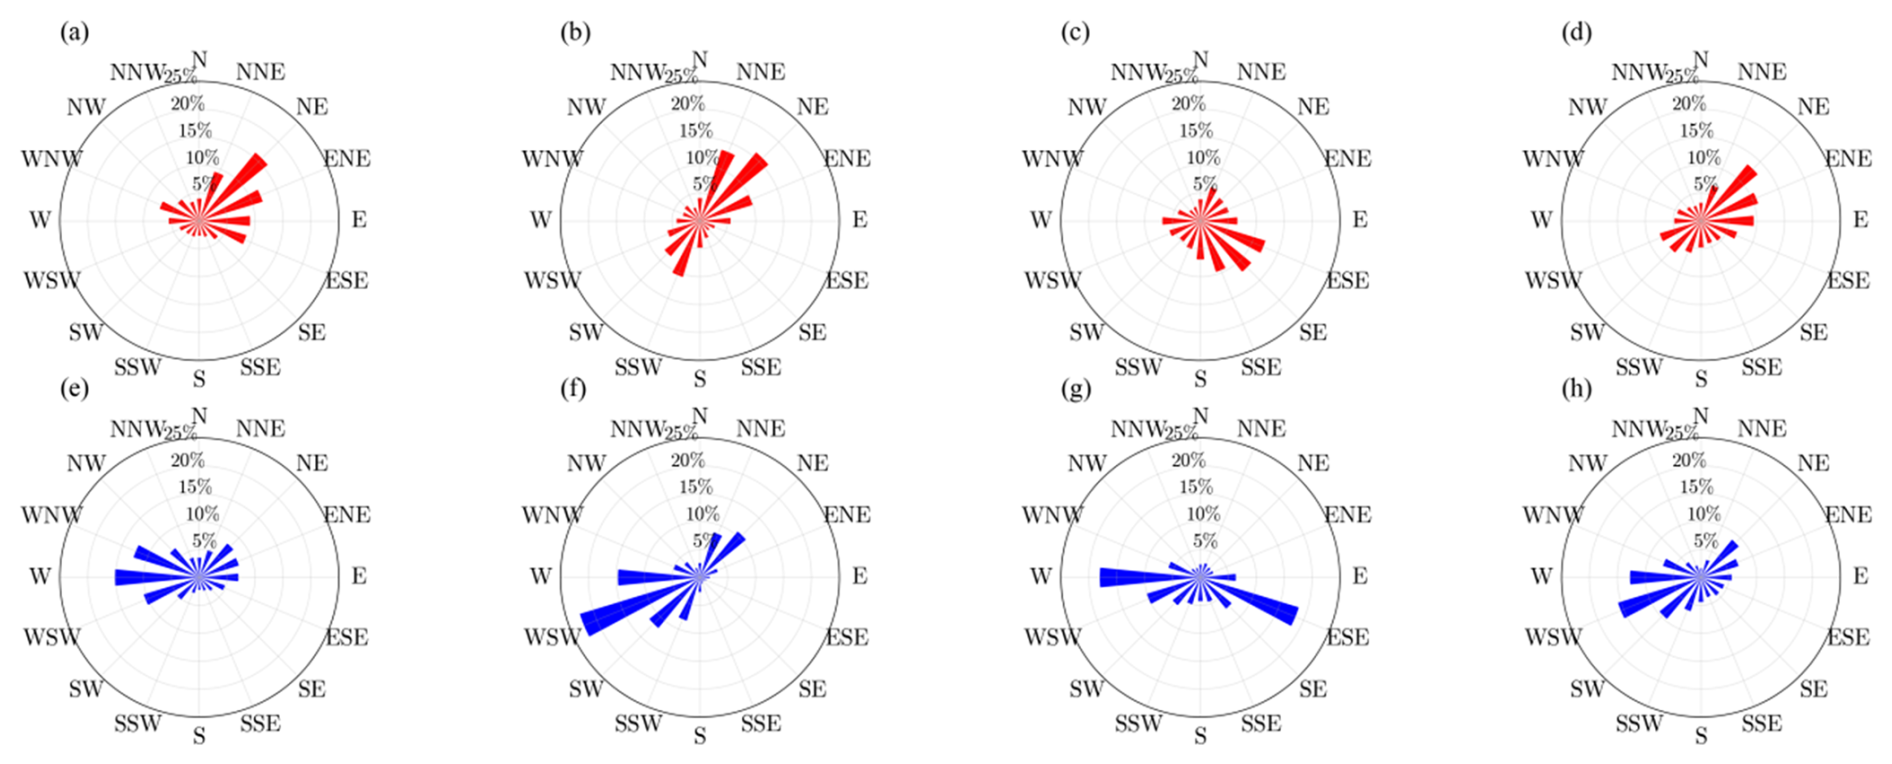
Figure 5Wind direction during the monsoon season at NewD66 (a, 10.4 m), Amdo (b, 12.0 m), MS3478 (c, 10.35 m), and BJ (d, 12.0 m), compared to their wind direction during the non-monsoon season (e–h).
3.2 Radiation fluxes
Downward shortwave radiation (Rsd) is the primary source of energy at the surface, and all stations show similar diurnal patterns of Rsd. Observations indicate that the TP begins to absorb solar radiation at 07:00 LT and stops completely at 21:00 LT as the sun sets (Fig. 6). The maximum Rsd occurs in the afternoon and reaches 732 W m−2. Seasonal variations demonstrate that Rsd is lowest in winter, increases continuously until spring and peaks in May. This is followed by a decrease during the monsoon season, which is likely due to the effects of frequent summer rainfall on the plateau and cloud cover. Since there is little variation in Rsd, differences in upward shortwave radiation (Rsu) are mainly due to variations in surface albedo. The trend in Rsu at all stations is consistent with that of Rsd, with the highest values observed in May, a decrease during the summer months and the minimum in winter. The start and end times of Rsu at each station align with those of Rsd, as illustrated in Fig. 5c. MS3478 and BJ stations exhibit slightly lower Rsu values. MS3478 is plateau wetland, and the area near BJ station is a pasture with extensive vegetation cover in summer, which does not strongly reflect sunlight. Consequently, the lower albedo at these two stations results in relatively lower Rsu values. Longwave radiation is influenced by factors such as water vapour content, aerosol content, temperature stratification and cloud thickness. It shows more pronounced seasonal variations than shortwave radiation. The lowest levels of downward longwave radiation (Rld) are observed in winter, while the highest levels are observed in summer. The diurnal variation of Rld is the smallest of the four radiation components, fluctuating within a range of 45 W m−2. Upward longwave radiation (Rlu) is minimal in January, increases steadily until June, and stabilises at 370 W m−2 during the summer months (June to August). At station MS3478, Rlu is relatively lower, remaining around 350 W m−2 during the summer. The minimum of Rlu occurs at 08:00 LT, coinciding with the lowest surface temperatures. The maximum values occur in the afternoon and show greater diurnal variations compared to Rld, with fluctuations up to 140 W m−2. Net surface radiation exhibits a clear diurnal cycle, with peaks in the afternoon and slightly negative values at night. This highlights the process of surface heating the atmosphere during the day and cooling it at night. Annual variations show that net surface radiation is highest in summer and lowest in winter.
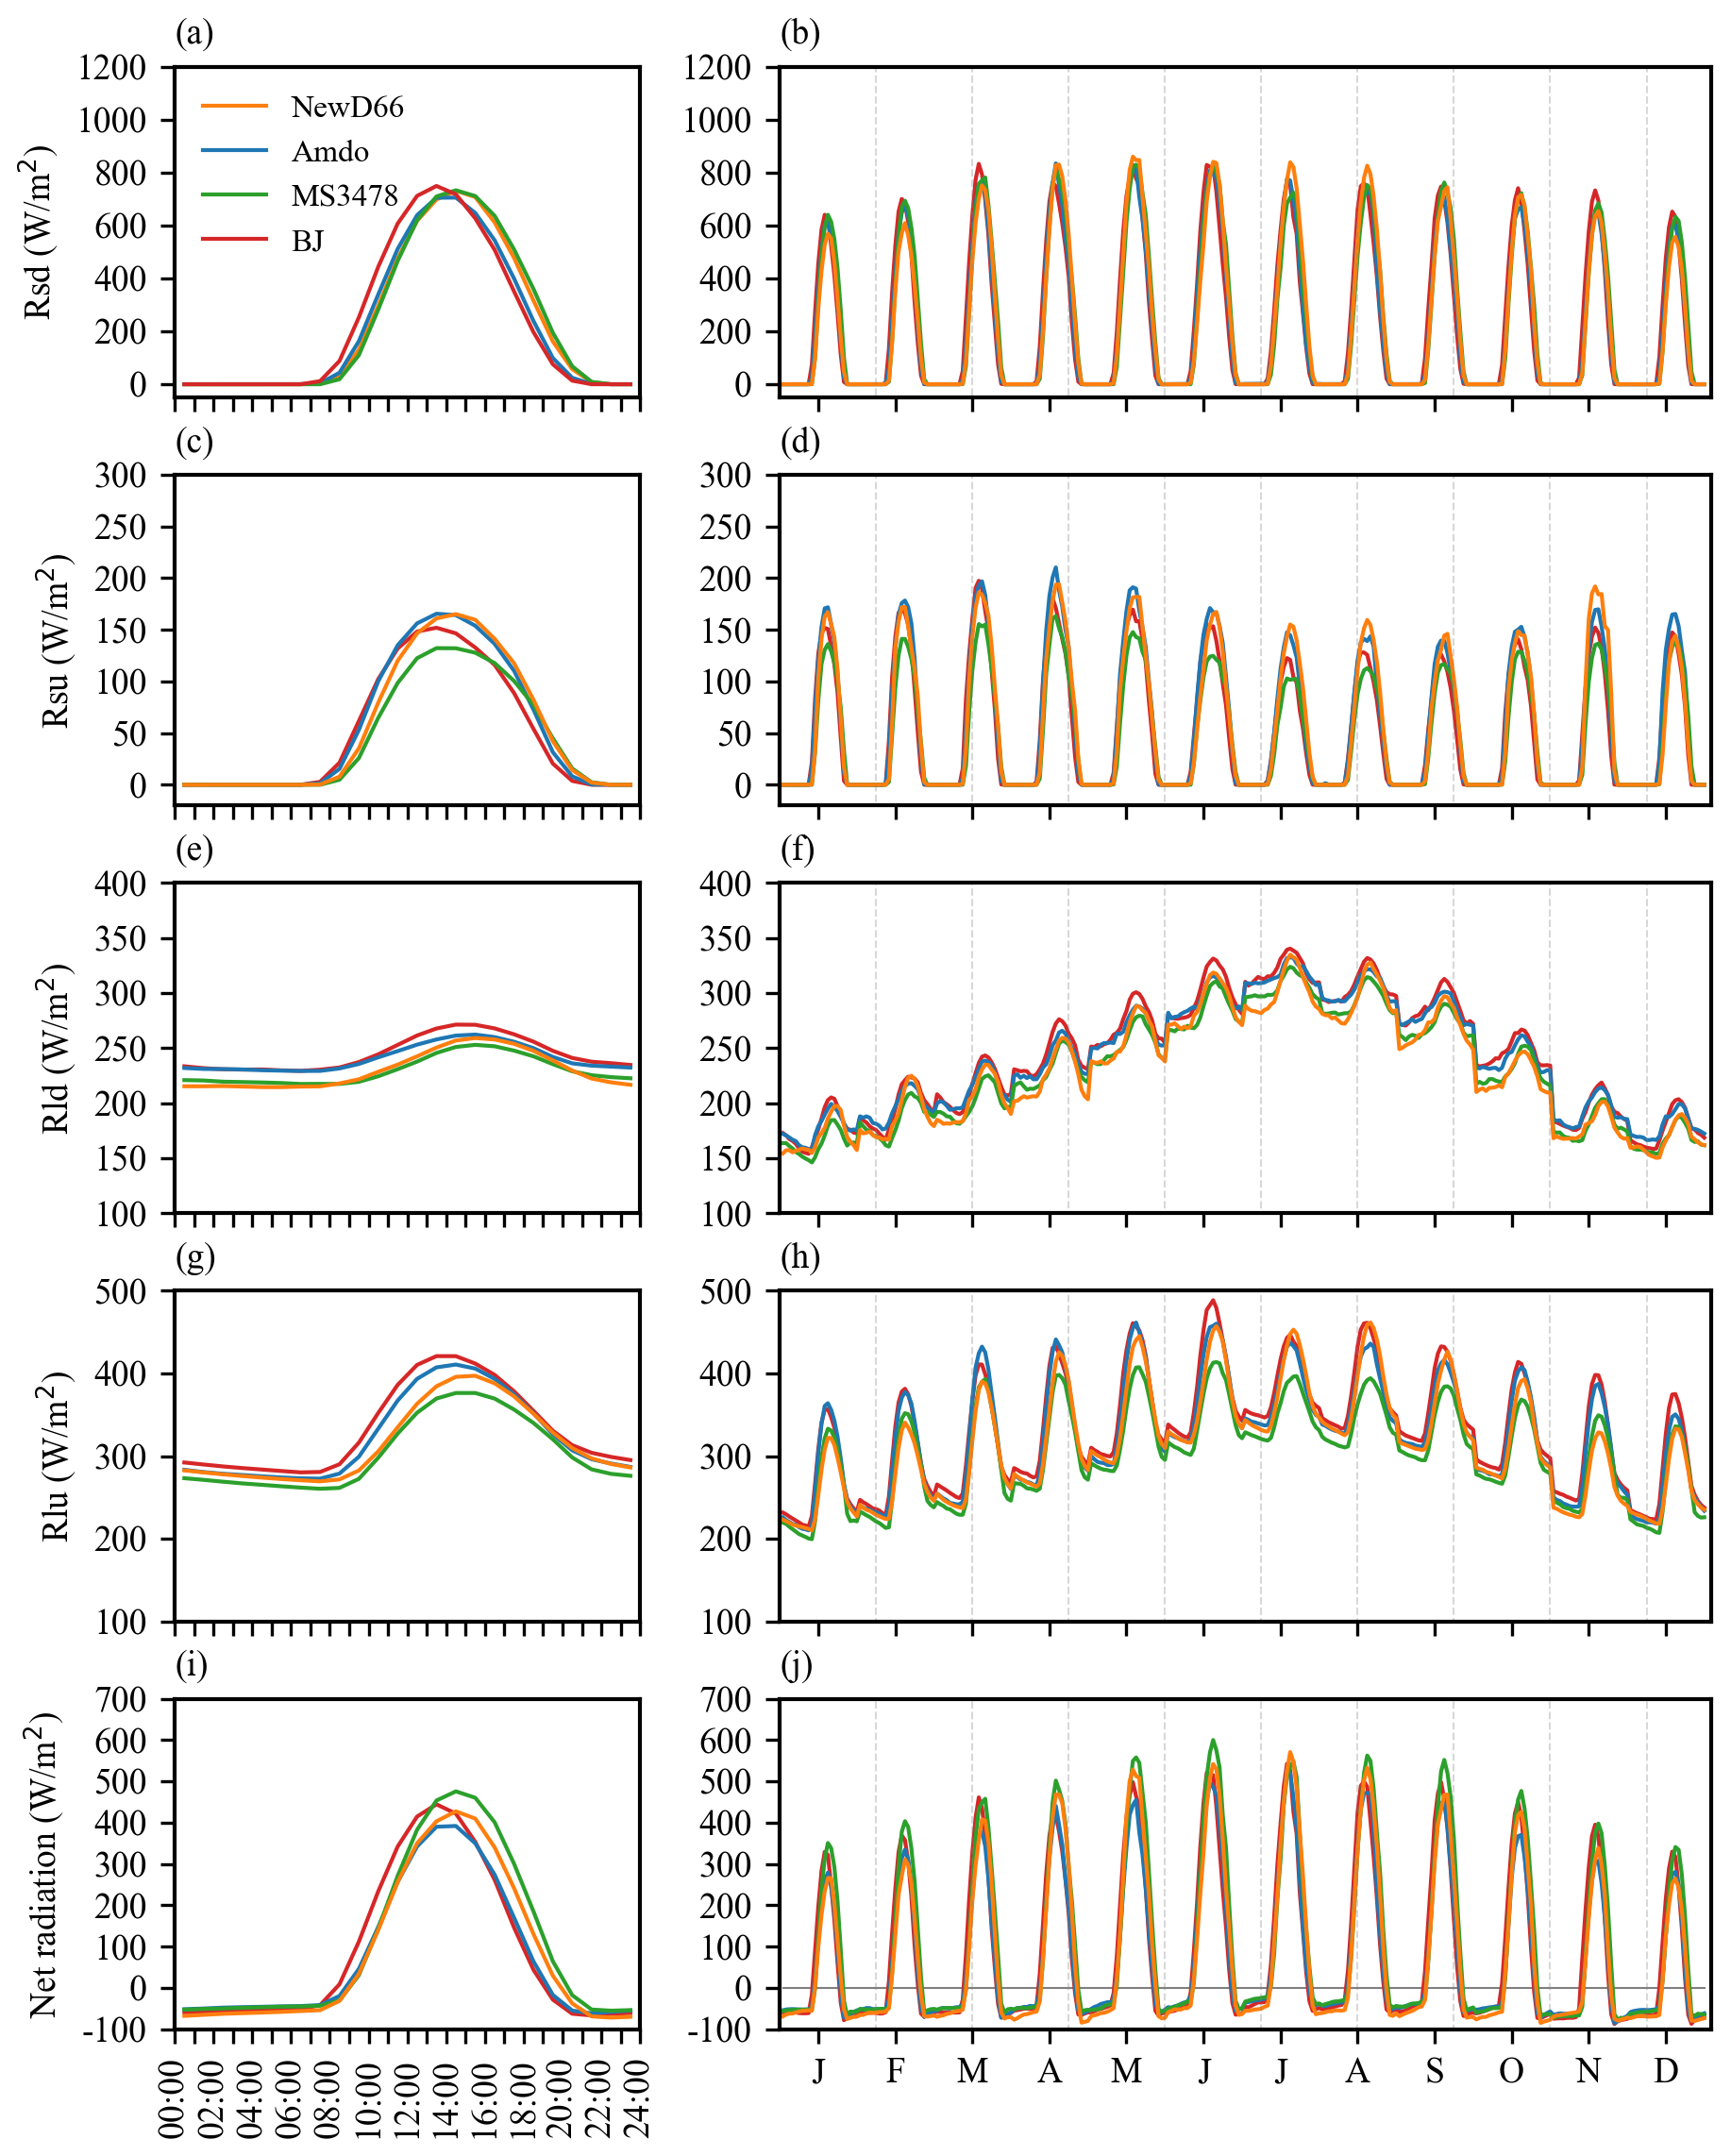
Figure 6Diurnal variations (a, c, e, g, i) and monthly variations of the diurnal (b, d, f, h, j) downward shortwave radiation (a, b), upward shortwave radiation (c, d), downward longwave radiation (e, f), upward longwave radiation (g, h), and net radiation (i, j) at the 4 stations.
3.3 Surface heat flux and CO2 flux
Sensible heat flux (SH), latent heat flux (LH) and soil hear flux (SHF) are the primary forms of energy transfer between the surface and the atmosphere. Figure 7 illustrates the monthly diurnal cycles and annual variations of SH and LH at each station. SH is influenced by the temperature difference between the surface and the atmosphere, as well as weather systems associated with precipitation, leading to numerous transient fluctuations. Seasonal variations demonstrate stronger SH at each station in spring and weaker in summer. The daily peaks occur at 14:00 LT, with negative values at night in winter, indicating clear temperature inversions. While net radiation increases steadily in spring, the energy absorbed by the surface before March is mainly used to melt snow. The onset of the monsoon season in May is accompanied by a rapid increase in water vapour on the TP, with a gradual dominance of LH transfer. Consequently, SH peaks in April at each station, with MS3478 (a plateau wetland) peaking in February. The Asian monsoon system transports substantial moisture into the plateau during the summer, resulting in low peaks in sensible heat flux at all stations, with a daily average of 20 W m−2. In summer, the NewD66 station experiences the highest SH, while the MS3478 station experiences the lowest SH, reflecting the differences in water vapour content between the plateau bareland and plateau wetland.
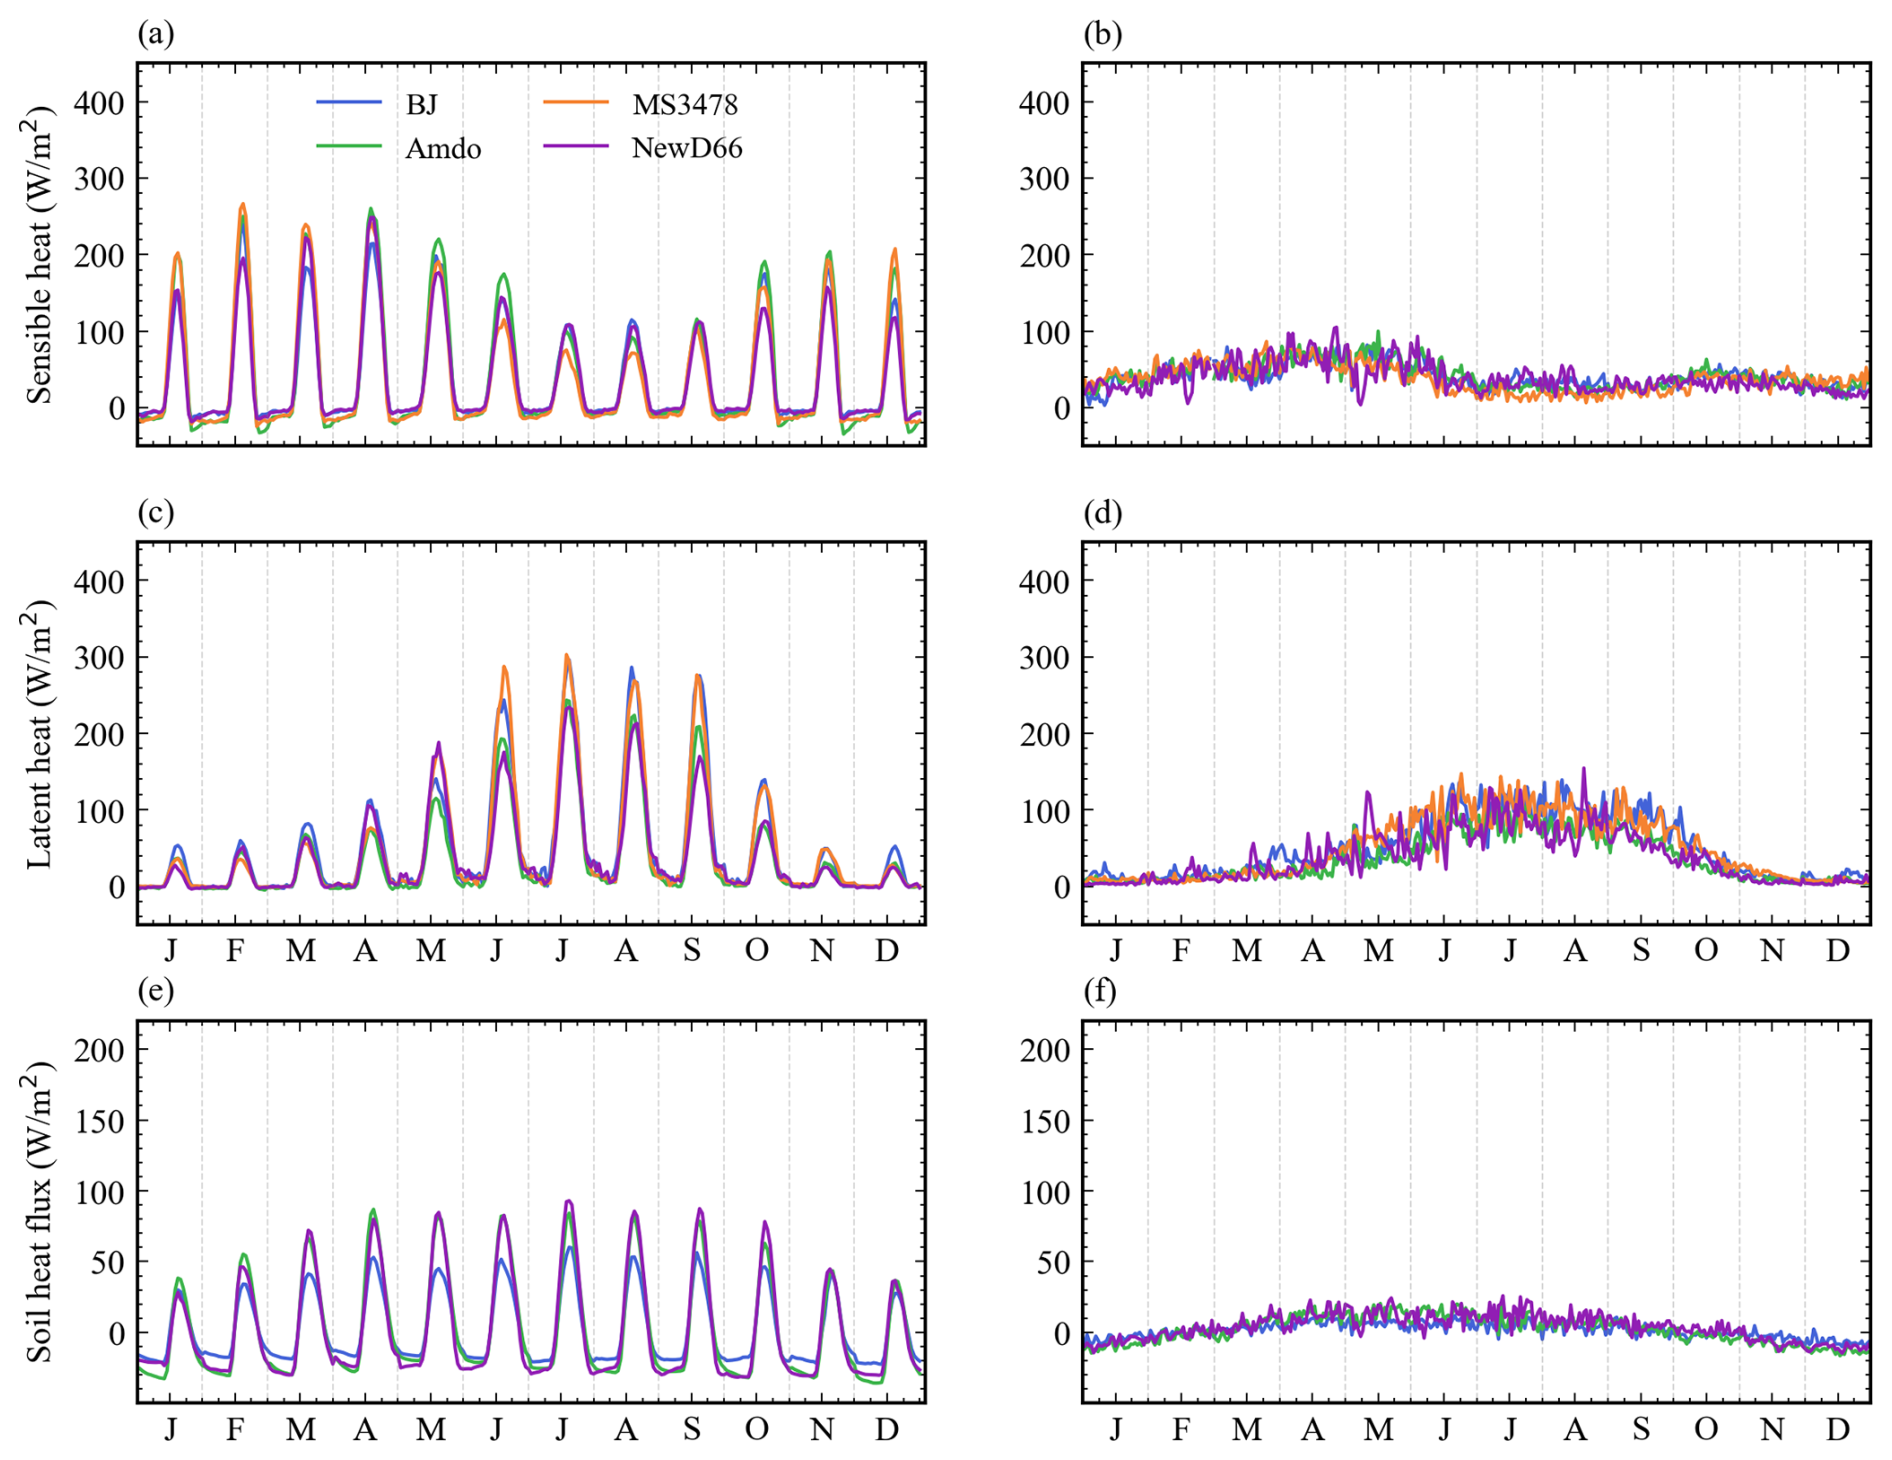
Figure 7Monthly variations of the diurnal (a, c, e) and daily mean (b, d, f) sensible heat (a, b), latent heat (c, d), and soil heat flux (e, f) at the 4 stations.
The seasonal variation trend of LH is in opposition to that of SH. During the winter, the plateau is characterised by a relatively cold and dry climate, with LH peaks not exceeding 60 W m−2 at all stations. As the monsoon season commences in May, LH rapidly rises, maintaining levels above 100 W m−2 throughout the summer until it begins to decline in October. Peaks in LH occur in July at all stations, with MS3478's peak appearing earlier in June due to its higher moisture content and remaining high throughout the summer. In winter, nighttime LH approaches zero, but retains weak positive values in summer, indicating that no clear temperature inversions occur at night, and even contributing to heating the atmosphere in the early hours of the night. Figure 7d shows significant fluctuations in LH during the summer months, which are attributed to the frequent alterations in weather patterns. The diurnal cycle of LH is also influenced by the occurrence of extreme rainfall episodes.
SHF is defined as the heat transfer from the land surface to deeper soil layers, is a key component of the surface energy balance. As illustrated in Fig. 7e and f, the seasonal variation in SHF is relatively moderate compared to SH and LH, with seasonal maxima remaining below 100 W m−2. A clear diurnal cycle is observed, characterized by a peak in the afternoon and a minimum during the night. The largest diurnal variation in SHF occurred at Amdo Station from January to April. In contrast, during May to September when surface thermal activity is most intense, Newd66 Station consistently exhibited high levels of diurnal variability. In terms of daily mean values, SHF was highest from May to July and lowest in December. It is noteworthy that Newd66 Station showed the most pronounced diurnal fluctuation, which may be attributed to its plateau bareland underlying surface, which is characterised by a simple composition and high sensitivity to external disturbances. Furthermore, interannual variability was greatest at Newd66 Station, where the amplitude of SHF reached 40 W m−2, while at BJ Station, the variation was comparatively subdued, with an amplitude of only 22.7 W m−2 throughout the annual cycle.
As shown in Fig. 8a, CO2 concentrations exhibit a diurnal cycle characterized by an increase during nighttime and a decrease during daytime. This cycle shows minimal monthly variation across the observation period. The NewD66 station displays only a weak diurnal signal between June and August, which may be attributed to the sparse vegetation over the bareland underlying surface, resulting in a relatively limited influence on local CO2. In contrast, the diurnal cycle of CO2 concentration is more pronounced at the BJ and MS3478 stations due to their dense vegetation. Figure 8b illustrates the annual variation in CO2 concentration. The BJ station consistently exhibits lower CO2 levels throughout the year, with more pronounced fluctuations during summer. Seasonal amplitude is greater at Amdo in summer and at MS3478 in winter. The most substantial annual variation is observed at NewD66, where CO2 concentrations reach a minimum in April and peak in June.
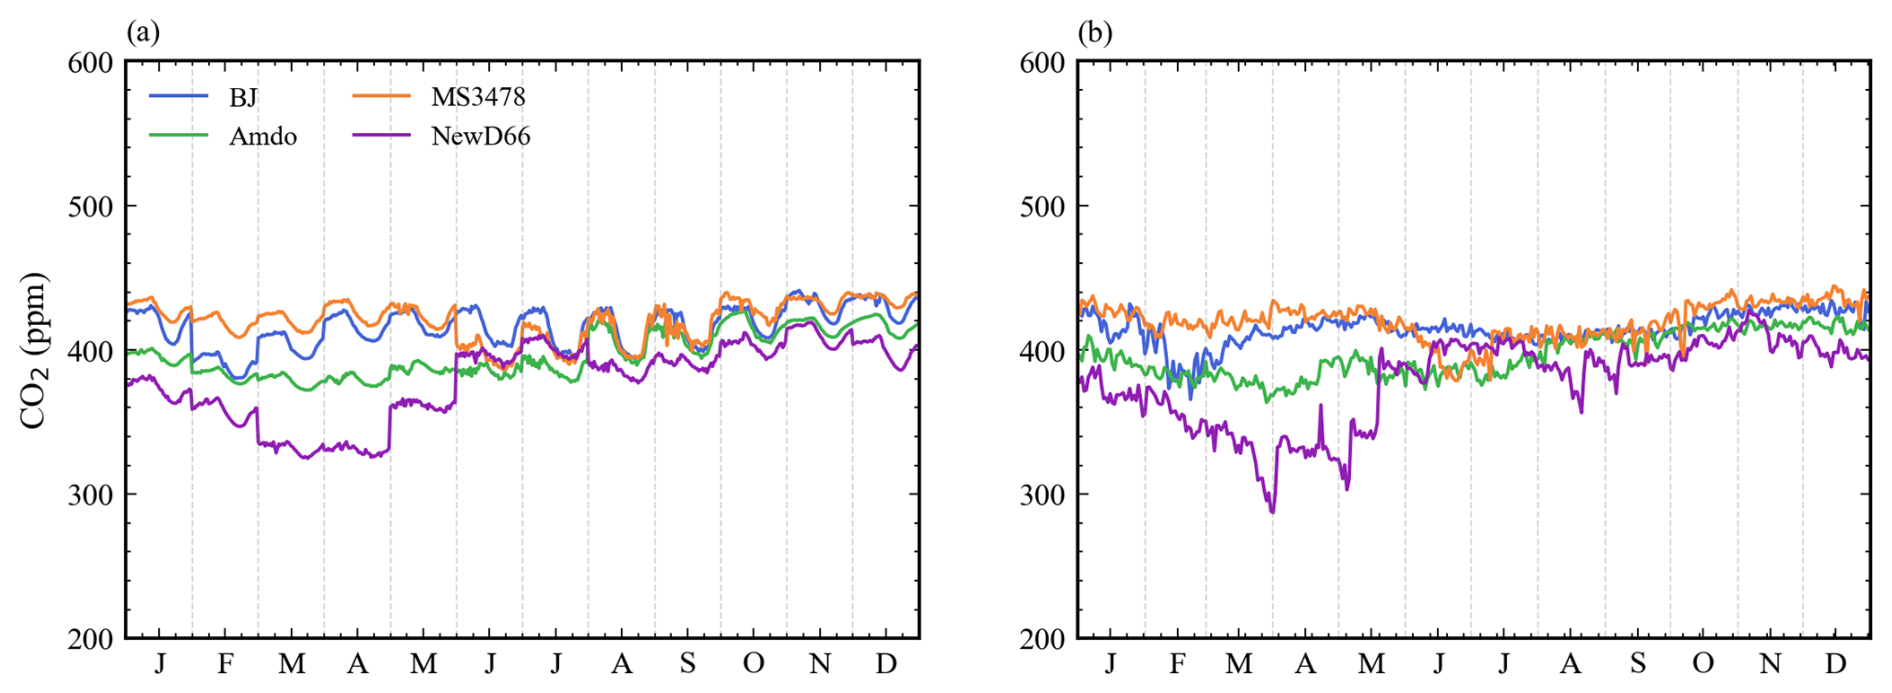
Figure 8Monthly variations of the diurnal (a) and daily mean (b) CO2 concentration at the 4 stations.
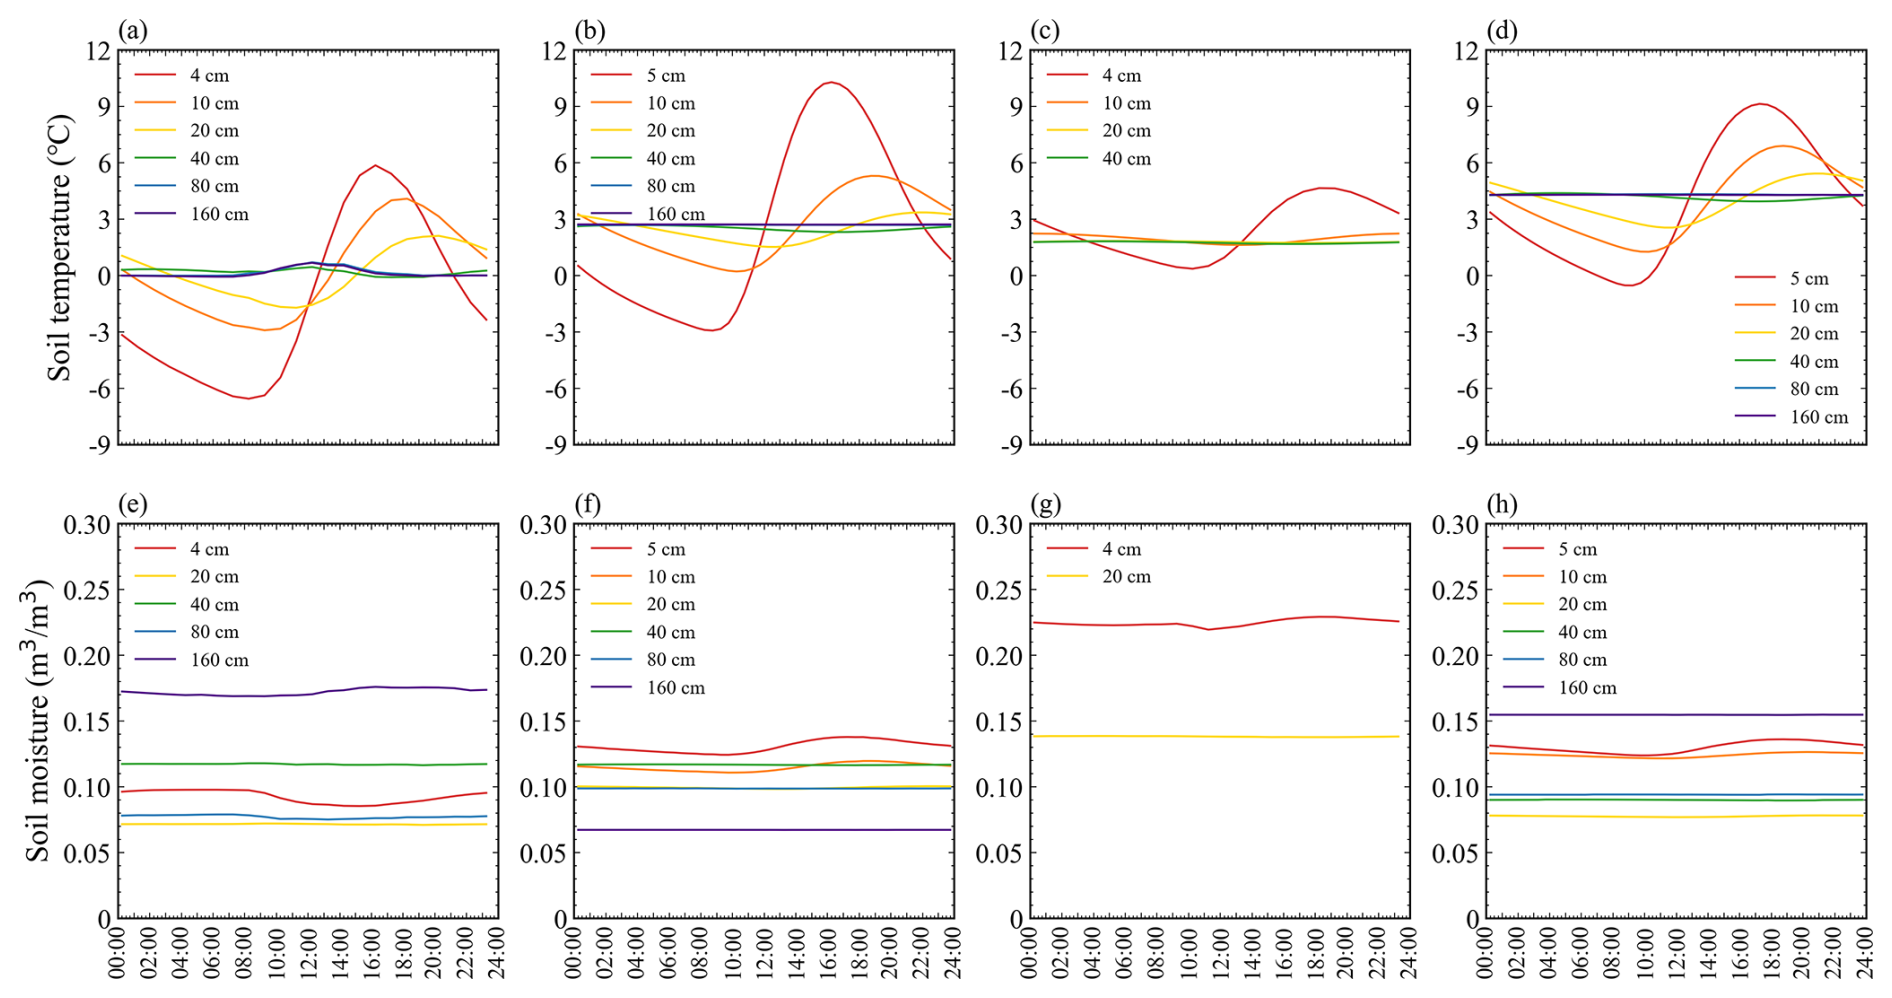
Figure 9Layered soil temperature at NewD66 (a), Amdo (b), MS3478 (c), and BJ (d) observation, and corresponding layered soil moisture (e–h) at each station.
3.4 Soil hydrothermal characteristics
Soil thermal and moisture variations have a significant impact on energy and moisture exchange between the surface and the atmosphere. Due to varying observation conditions, soil observation depths differ between stations. Figure 9 shows that all stations exhibit a diurnal cycle in soil temperature, with cooling at night and warming during the day. Soil temperature variation diminishes with increasing depth, with 4, 10, and 20 cm depths showing a 2 h delay in heating and cooling cycles. Significant spatial variation is observed due to differences in soil type, porosity, and substrate. The soil temperature at NewD66 station tends to be lower than at other sites, with 4 cm depths reaching a minimum of −6.56 °C at night. This is due to a lack of moisture in the surrounding air, which results in a greater daily heating effect, reaching 5.86 °C by 16:00 LT. At 160 cm, a slight midday fluctuation is observed, which is not seen at other stations. MS3478, a plateau wetland, exhibits a diurnal variation of 4.29 °C at 4 cm depth, with a slight rise at 10 cm at 22:00 LT, and minimal diurnal variation below 10 cm.
The diurnal cycle of soil moisture is weak at the shallowest layer, with fluctuations not exceeding 0.015 m3 m−3. Below 10 cm, soil moisture shows no clear diurnal cycle. The overall soil moisture at NewD66 station is relatively low, but it does not vary linearly with depth. For example, 5 cm depth soil moisture is 0.09 m3 m−3, while 160 cm depth moisture remains consistently at 0.17 m3 m−3. The soil moisture data from the BJ station exhibits a comparable pattern, with slight fluctuations at the 5 cm depth, maintaining an average of approximately 0.13 m3 m−3, and negligible variation at the 160 cm depth, remaining at 0.15 m3 m−3. In contrast, the soil moisture at the 160 cm depth from Amdo is considerably lower than that observed in the shallow layers, likely due to the presence of a permafrost layer, which results in a consistently low liquid water content. MS3478's soil moisture exhibits no significant diurnal variation, with 4 cm depth soil moisture averaging 0.22 m3 m−3 and 20 cm depth soil moisture averaging 0.13 m3 m−3, which are both significantly higher than those observed at other stations.
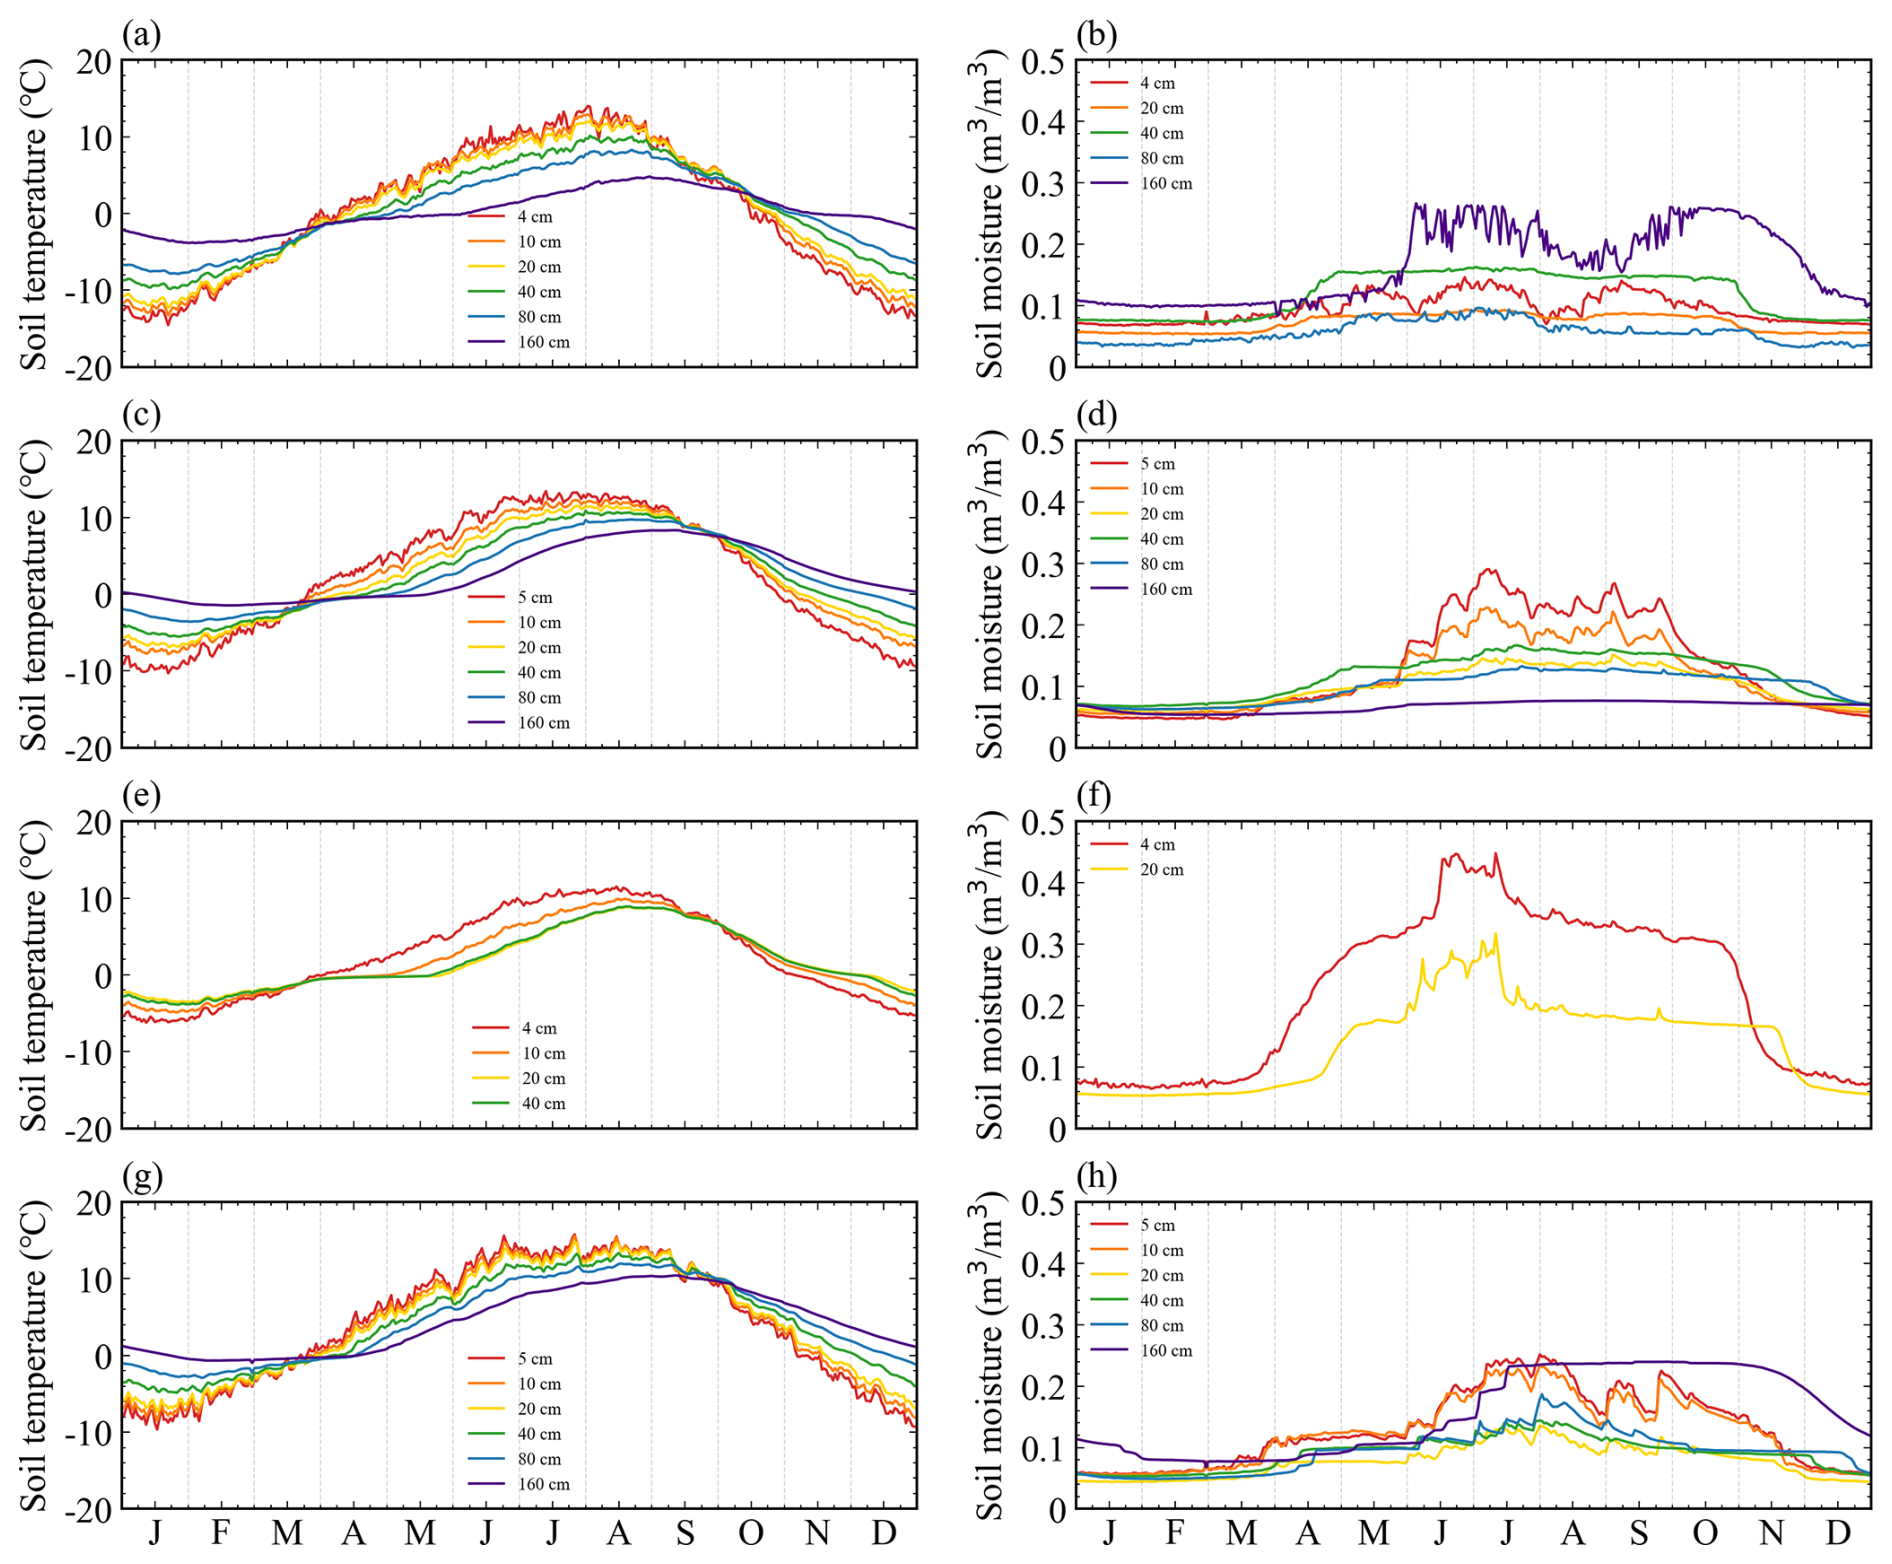
Figure 10Daily mean soil temperature (a) and soil moisture (b) at NewD66, same in Amdo (c, d), MS3478 (e, f), and BJ (g, h).
Soil temperature and moisture exhibit clear annual variations at each station, with soil temperature delaying more with increasing observation depth (Fig. 10). Surface soil temperatures peak in July, 40 cm depth temperatures in August, and 160 cm depth temperatures in September. The greatest annual variation in soil temperature is observed in NewD66's 4 cm depth soil temperature, reaching 28.56 °C, while the smallest is observed in MS3478's, at 17.74 °C. A similar trend is observed in soil moisture, with higher levels observed in summer and lower levels in winter. Soil moisture increases in spring due to the melting of snow and ice, and in summer due to precipitation. In the absence of rainfall, surface evaporation and runoff results in a rapid decrease in soil moisture. There are significant differences in soil moisture between stations, with substantial fluctuations in surface moisture, indicating vertical variation in the soil moisture profile. NewD66's 4 cm depth soil moisture exhibits minimal annual variation, increasing by only 0.05 m3 m−3 in summer. However, 160 cm depth moisture rapidly increases to 0.24 m3 m−3 in summer, then gradually decreases in November, coinciding with the point at which 160 cm depth soil temperatures exceed 0 °C. The soil moisture at all layers of Amdo is below 0.1 m3 m−3 in winter, with 5 cm depth moisture reaching 0.29 m3 m−3 in summer, and decreasing with increasing depth. MS3478's humid air contributes to higher soil moisture, with 4 cm depth moisture maintaining levels above 0.3 m3 m−3 from May to October, even exceeding 0.8 m3 m−3 at times. BJ's 4 cm depth moisture rises in April, peaking in August at 0.25 m3 m−3. The lowest 20 cm depth moisture is observed year-round, at only 0.12 m3 m−3 in July. The 160 cm depth moisture rapidly rises in June, maintaining 0.24 m3 m−3 until November.
Near-surface micrometeorology, soil hydrothermal characteristics, and turbulent flux observation datasets are openly available from the National Cryosphere Desert Data Center and the National Tibetan Plateau Data Center (https://doi.org/10.11888/Meteoro.tpdc.270010, Hu et al., 2019 and https://data.tpdc.ac.cn/en/data/87c7641d-cd5d-4cfc-a412-1468c47a29be, last access: 5 November 2025; https://doi.org/10.11888/Atmos.tpdc.300325, Wang et al., 2023a and https://data.tpdc.ac.cn/en/data/7377f0ae-19c3-4549-a63b-c82fb5ffc1dd, last access: 5 November 2025). Following a rigorous screening process that included the identification and elimination of missing values, the physical range check, and the manual quality control, valid data in CSV format is available for download. The file names adhere to the convention of station_datatype_year.csv, and all data files utilise UTC+8 as the designated time standard. Each CSV-formatted data file name includes the name of the variable, the observed height/depth, and the unit.
As demonstrated in previous sections, the NPCE reliably reflects the characteristics of various variables across different underlying surface and temporal scales, thereby showcasing the reliability and completeness of the data. The challenging environment and dispersed stations on the CTP make it difficult to maintain equipment. Frequent extreme weather events contribute to recurrent instrument malfunctions, such as sensor drift, calibration error, environmental interference, and power supply issues. These constraints further highlight the value and importance of the data collected under such demanding conditions. The scarcity of field observation data has long been a barrier to in-depth research on the TP. Thus, long-term observations and scientific data sharing are crucial for research on the plateau. This paper introduces land–atmosphere interaction data from several observation stations centred around Nagqu. The dataset comprises 9 years (2014–2022) of hourly continuous series of near-surface meteorological, radiation, turbulent flux, and soil hydrothermal characteristics. This enables effective exploration of the entire process of land–atmosphere interactions on the plateau. Additionally, all data were manually checked for outliers and subjected to quality control. The long-term half-hourly dataset from NPCE provides the opportunity to conduct high-precision numerical simulations at the local level. This enables in-depth research to be conducted on the mechanisms by which the land and atmosphere interact on the plateau and also provides support for comprehensive research into the plateau's energy and water cycles and climate change.
The NPCE is a comprehensive research platform with the primary goal of observing and studying the impacts of weather and climate change on the Tibetan Plateau, water resource utilisation, ecological environmental protection, and human activities. The main objective of the NPCE is based on a plateau climate and the water-energy cycle. In recent years, a range of processes have been the focus of detailed analysis, including non-homogeneous terrain turbulence transfer mechanisms, radiation balance components and energy allocation processes. The analysis has been informed by long-term in situ meteorological observations (Huang and Ma, 2016). The spatial and temporal variability of SH and LH under complex topographic forcing is a particular highlight (Xie et al., 2018), and energy closure in the central part of the northern Tibetan plateau is further discussed (Li et al., 2015, 2016). Satellite-derived products have been utilised to address the spatial representation limitations inherent in field observations (Ma et al., 2006, 2009, 2014). Furthermore, ground-based observations were utilised to validate and calibrate the remote sensing estimates of sensed LH, thereby improving the accuracy of the remote sensing algorithms (Zhong et al., 2019). A distributed sensor network was utilised to monitor soil temperature and humidity gradients, thereby enabling the systematic quantification of the disparities in soil moisture and heat fluxes between permafrost and seasonal permafrost. In these areas, phase change LH associated with freeze-thaw transitions have been demonstrated to influence surface energy distribution (Liu et al., 2015; Fu et al., 2022). A comprehensive analysis of the pattern of boundary layer changes on the CTP has been conducted utilising PBL towers, as well as MWR and radiosonde data (Wang et al., 2025; Sun et al., 2020b, 2021). The integration of multi-source observations (Near-surface meteorological data, EC system, boundary layer observation, and satellite inversion) has modified the model representation of land–atmosphere energy balance processes, and further refinement of the parameterisation scheme has been applied to soil freeze-thaw processes (Deng et al., 2021). The enhanced numerical simulation accuracy of blowing snow processes in the CLM model facilitates a more profound comprehension of surface processes and cryosphere changes in local area (Xie et al., 2021, 2023).
The data presented in the paper is the average result after filtering out missing values. However, in practical applications, considering the difficulty of instrument maintenance, there may inevitably be anomalies or data discontinuities. As a key observation project on the CTP, the NPCE is implementing an ambitious plan to enhance its monitoring capabilities for understanding global climate dynamics due to its high altitude and ecological sensitivity. This initiative focuses on acquiring advanced instrumentation and expanding monitoring sites to deepen insights into atmospheric, hydrological, and ecological processes, particularly in the CTP and the upper Nu River (Salween River) basin. For instrument acquisition, the station will deploy Raman lidar systems, which are highly specialized for simultaneous detection of water vapor and aerosols in the lower atmosphere. These Raman lidar systems utilize laser-based spectroscopy to provide high-resolution measurements of water vapor concentrations, enabling detailed analysis of moisture transport and its influence on regional climate patterns. Additionally, the same Raman lidar systems will measure aerosol properties, such as particle size, concentration, and distribution, which are essential for studying air quality, aerosol-cloud interactions, and their impact on radiative forcing in the plateau's unique environment. To complement these atmospheric measurements, the station will acquire advanced greenhouse gas analyzers specifically designed to monitor carbon dioxide and methane fluxes from soil and vegetation respiration, providing critical data on biogeochemical cycles and the carbon dynamics of high-altitude ecosystems under changing climatic conditions.
The site expansion plan involves establishing new monitoring stations on the CTP and the upper Nu River basin to broaden the scope of environmental observations. The CTP, with its expansive high-altitude grasslands, offers a unique setting to study the interplay between atmospheric processes and ecosystem responses to climate change. Similarly, the upper Nu River basin, a vital hydrological region, will host new sites to investigate water cycles, soil moisture dynamics, and vegetation responses to environmental shifts. By expanding coverage in the upstream Nu River, the station aims to capture spatial and temporal variations in hydrological and ecological parameters, supporting research on water resource management, ecosystem resilience, and climate adaptation strategies in this ecologically sensitive area.
All the authors were involved in the generation of the introduced dataset. HY, GW, FS and FL wrote the manuscript with contributions from all the other authors.
The contact author has declared that none of the authors has any competing interests.
Publisher's note: Copernicus Publications remains neutral with regard to jurisdictional claims made in the text, published maps, institutional affiliations, or any other geographical representation in this paper. While Copernicus Publications makes every effort to include appropriate place names, the final responsibility lies with the authors. Views expressed in the text are those of the authors and do not necessarily reflect the views of the publisher.
We sincerely thank all the scientists, engineers and students who participated in the field observations, as well as in the maintenance of the instruments and the processing of the data. We acknowledge the Computing Center in Xi'an for providing the computing resources.
This research has been supported by the Science and Technology Projects of Xizang Autonomous Region, China (grant no. XZ202501JD0022), National Natural Science Foundation of China (grant nos. 42330609, U2442207), the Youth Innovation Promotion Association of Chinese Academy of Sciences (grant no. 2021427), the West Light Foundation (grant no. xbzg-zdsys-202409) of the Chinese Academy of Sciences, Key talent project in Gansu and Central Guidance Fund for Local Science and Technology Development Projects in Gansu (grant no. 24ZYQA031).
This paper was edited by Tobias Gerken and reviewed by two anonymous referees.
Bian, L., Gao, Z., Ma, Y., Koike, T., Ma, Y., Li, Y., Sun, J., Hu, Z., and Xu, X.: Seasonal Variation in Turbulent Fluxes over Tibetan Plateau and Its Surrounding Areas: Research Note, J. Meteorol. Soc. Jpn., 90C, 157–171, 2012.
Chen, B., Chao, W., and Liu, X.: Enhanced climatic warming in the Tibetan plateau due to doubling CO2: A model study, Clim. Dynam., 20, 401–413, 2003.
Ciwangdunzhu, C., Du, J., and Danzengcuojie, D.: Spatial-temporal Change of Consecutive Dry Days in Changtang National Nature Reserve of Tibet During 1971–2017, Chin. Agricult. Sci. Bull., 34, 118–122, 2018.
Curio, J. and Scherer, D.: Seasonality and spatial variability of dynamic precipitation controls on the Tibetan Plateau, Earth Syst. Dynam., 7, 767–782, https://doi.org/10.5194/esd-7-767-2016, 2016.
Deng, M., Meng, X., Lu, Y., Li, Z., Zhao, L., Hu, Z., Chen, H., Shang, L., Wang, S., and Li, Q.: Impact and sensitivity analysis of soil water and heat transfer parameterizations in Community Land Surface Model on the Tibetan Plateau, J. Adv. Model. Earth Syst., 13, e2021MS002670, https://doi.org/10.1029/2021MS002670, 2021.
Duan, A. and Xiao, Z.: Does the climate warming hiatus exist over the Tibetan Plateau?, Sci. Rep., 5, 13711, https://doi.org/10.1038/srep13711, 2015.
Fan, X., Li, Y., and Li, L.: Synoptic-Scale Effects of Atmospheric Heat Source over Key Areas of the Tibetan Plateau on Its Downstream Rainfall in Summer, J. Climate, 36, 3647–3666, 2023.
Fu, C., Hu, Z., Yang, Y., Deng, M., Yu, H., Lu, S., Wu, D., and Fan, W.: Responses of Soil Freeze-Thaw Processes to Climate on the Tibetan Plateau from 1980 to 2016, Remote Sens., 14, 5907, https://doi.org/10.3390/rs14235907, 2022.
Gu, L., Yao, J., Hu, Z., and Zhao, L.: Comparison of the surface energy budget between regions of seasonally frozen ground and permafrost on the Tibetan Plateau, Atmos. Res., 153, 553–564, 2015.
Gu, L., Yao, J., Hu, Z., Ma, Y., Sun, F., Yu, H., Wang, S., Yang, Y., Guo, R., and Qin, Y.: Characteristics of the atmospheric boundary layer's structure and heating (cooling) rate in summer over the Northern Tibetan Plateau, Atmos. Res., 269, 106045, https://doi.org/10.1016/j.atmosres.2022.106045, 2022.
Guo, Y., Zhang, Y., Ma, Y., and Ma, N.: Surface heat source intensity and surface water/energy balance in Shuanghu, northern Tibetan Plateau, Acta Geogr. Sin., 69, 983–992, 2014.
He, H., Hu, Z., Xun, X., Hao, L., Gu, L., Sun, J., and Xu, L.: The variation characteristics of surface radiation in wetlands on the northern Tibetan Plateau, Acta Energ. Solar. Sin., 31, 561–567, 2010.
Hu, Z., Gu, L., Sun, F., and Wang, S.: Dataset of meteorological elements of Nagqu Station of Plateau Climate and Environment (2014–2017), National Tibetan Plateau/Third Pole Environment Data Center [data set], https://doi.org/10.11888/Meteoro.tpdc.270010, 2019.
Huang, F. and Ma, W.: Analysis of Long-Term Meteorological Observation for Weather and Climate Fundamental Data over the Northern Tibetan Plateau, Adv. Meteorol., 2016, 4878353, https://doi.org/10.1155/2016/4878353, 2016.
Immerzeel, W., Van Beek, L., and Bierkens, M.: Climate change will affect the Asian water towers, Science, 328, 1382–1385, 2010.
Immerzeel, W., Lutz, A., Andrade, M., Bahl, A., Biemans, H., Bolch, T., Hyde, S., Brumby, S., Davies, B., Elmore, A., Emmer, A., Feng, M., Fernández, A., Haritashya, U., Kargel, J., Koppes, M., Kraaijenbrink, P., Kulkarni, A., Mayewski, P., Nepal, S., Pacheco, P., Painter, T., Pellicciotti, F., Rajaram, H., Rupper, S., Sinisalo, A., Shrestha, A., Viviroli, D., Wada, Y., Xiao, C., Yao, T., and Baillie, J.: Importance and vulnerability of the world's water towers, Nature, 577, 364–369, 2020.
Jin, H., He, R., Cheng, G., Wu, Q., Wang, S., Lü, L., and Chang, X.: Changes in frozen ground in the Source Area of the Yellow River on the Qinghai–Tibet Plateau, China, and their eco-environmental impacts, Environ. Res. Lett., 4, 045206, https://doi.org/10.1088/1748-9326/4/4/045206, 2009.
Kang, S., Xu, Y., You, Q., Flügel, W., Pepin, N., and Yao, T.: Review of climate and cryospheric change in the Tibetan Plateau, Environ. Res. Lett., 5, 015101, https://doi.org/10.1088/1748-9326/5/1/015101, 2010.
Lei, Y., Yao, T., Bird, B., Yang, K., Zhai, J., and Sheng, Y.: Coherent lake growth on the central Tibetan Plateau since the 1970s: Characterization and attribution, J. Hydrol., 483, 61–67, 2013.
Lei, Y., Yang, K., Wang, B., Sheng, Y., Bird, B., Zhang, G., and Tian, L.: Response of inland lake dynamics over the Tibetan Plateau to climate change, Climatic Change, 125, 281–290, 2014.
Li, G., Chen, H., Xu, M., Zhao, C., Zhong, L., Li, R., Fu, Y., and Gao, Y.: Impacts of topographic complexity on modeling moisture transport and precipitation over the Tibetan Plateau in summer, Adv. Atmos. Sci., 39, 1151–1166, 2022.
Li, M., Babel, W., Chen, X., Zhang, L., Sun, F., Wang, B., Ma, Y., Hu, Z., and Foken, T.: A 3-year dataset of sensible and latent heat fluxes from the Tibetan Plateau, derived using eddy covariance measurements, Theor. Appl. Climatol., 122, 457–469, 2015.
Li, M., Su, Z., Ma, Y., Chen, X., Zhang, L., and Hu, Z.: Characteristics of land–atmosphere energy and turbulent fluxes over the plateau steppe in central Tibetan Plateau, Sci. Cold Arid Reg., 8, 103–115, 2016.
Li, L., Liu, Q., Zhang, Y., Liu, L., Ding, M., and Gu, C.: Spatial distribution and variation of precipitation in the Qiangtang Plateau, Geogr. Res., 36, 2047–2060, 2017.
Li, W., Guo, W., Qiu, B., Xue, Y., Hsu, P., and Wei, J.: Influence of Tibetan Plateau snow cover on East Asian atmospheric circulation at medium-range time scales, Nat. Commun., 9, 4243, https://doi.org/10.1038/s41467-018-06762-5, 2018.
Li, Y. and Hu, Z.: A Study on Parameterization of Surface Albedo over Grassland Surface in the Northern Tibetan Plateau, Adv. Atmos. Sci., 26, 161–168, 2009.
Liu, H., Hu, Z., Yang, Y., Wang, Y., Sun, G., and Huang, R.: Simulation of the freezing-thawing processes at Nagqu Area over Qinghai-Xizang Plateau, Plateau Meteorol., 34, 676–683, 2015.
Liu, X. and Chen, B.: Climatic warming in the Tibetan Plateau during recent decades, Int. J. Climatol., 20, 1729–1742, 2000.
Liu, X., Cheng, Z., Yan, L., and Yin, Z.: Elevation dependency of recent and future minimum surface air temperature trends in the Tibetan Plateau and its surroundings, Global Planet. Change, 68, 164–174, 2009.
Ma, W., Ma, Y., Li, M., Hu, Z., Zhong, L., Su, Z., Ishikawa, H., and Wang, J.: Estimating surface fluxes over the north Tibetan Plateau area with ASTER imagery, Hydrol. Earth Syst. Sci., 13, 57–67, https://doi.org/10.5194/hess-13-57-2009, 2009.
Ma, Y., Zhong, L., Su, Z., Ishikawa, H., Menenti, M., and Koike, T.: Determination of regional distributions and seasonal variations of land surface heat fluxes from Landsat-7 Enhanced Thematic Mapper data over the central Tibetan Plateau area, J. Geophys. Res.-Atmos., 111, https://doi.org/10.1029/2005JD006742, 2006.
Ma, Y., Zhu, Z., Zhong, L., Wang, B., Han, C., Wang, Z., Wang, Y., Lu, L., Amatya, P., Ma, W., and Hu, Z.: Combining MODIS, AVHRR and in situ data for evapotranspiration estimation over heterogeneous landscape of the Tibetan Plateau, Atmospheric Chemistry and Physics, 14, 1507–1515, https://doi.org/10.5194/acp-14-1507-2014, 2014.
Ma, Y., Wang, Y., and Han, C.: Regionalization of land surface heat fluxes over the heterogeneous landscape: from the Tibetan Plateau to the Third Pole region, Int. J. Remote Sens., 39, 5872–5890, 2018.
Ma, Y., Yao, T., Zhong, L., Wang, B., Xu, X., Hu, Z., Ma, W., Sun, F., Han, C., Li, M., Chen, X., Wang, J., Li, Y., Gu, L., Xie, Z., Liu, L., Sun, G., Wang, S., Zhou, D., Zuo, H., Xu, C., Liu, X., Wang, Y., and Wang, Z.: Comprehensive study of energy and water exchange over the Tibetan Plateau: A review and perspective: From GAME/Tibet and CAMP/Tibet to TORP, TPEORP, and TPEITORP, Earth-Sci. Rev., 237, 104312, https://doi.org/10.1016/j.earscirev.2023.104312, 2023.
Ma, Y., Xie, Z., Chen, Y., Liu, S., Che, T., Xu, Z., Shang, L., He, X., Meng, X., Ma, W., Xu, B., Zhao, H., Wang, J., Wu, G., and Li, X.: Dataset of spatially extensive long-term quality-assured land–atmosphere interactions over the Tibetan Plateau, Earth Syst. Sci. Data, 16, 3017–3043, https://doi.org/10.5194/essd-16-3017-2024, 2024.
Qiu, J.: China: the third pole, Nature, 454, 393–397, 2008.
Shen, M., Piao, S., Jeong, S., Zhou, L., Zeng, Z., Ciais, P., Chen, D., Huang, M., Jin, C., Li, L., Li, Y., Myneni, R., Yang, K., Zhang, G., Zhang, Y., and Yao, T.: Evaporative cooling over the Tibetan Plateau induced by vegetation growth, P. Natl. Acad. Sci. USA, 112, 9299–9304, 2015.
Shen, Y. and Xiong, A.: Validation and comparison of a new gauge-based precipitation analysis over mainland China, Int. J. Climatol., 36, 252–265, 2016.
Song, C., You, S., Ke, L., Liu, G., and Zhong, X.: Phenological variation of typical vegetation types in northern Tibet and its response to climate changes, Acta Ecol. Sin., 04, 41–51, 2012.
Su, Y., Zhang, Y., Shang, L., Wang, S., Hu, G., Song, M., and Zhou, K.: Root-induced alterations in soil hydrothermal properties in alpine meadows of the Qinghai-Tibet Plateau, Rhizosphere, 20, 100451, https://doi.org/10.1016/j.rhisph.2021.100451, 2021.
Sun, C., Xu, X., Wang, P., Yang, D., Zhang, S., Wang, C., and Cai, W.: The warming and wetting ecological environment changes over the Qinghai-Tibetan Plateau and the driving effect of the Asian summer monsoon, J. Trop. Meteorol., 28, 95–108, 2022.
Sun, G., Hu, Z., Ma, Y., Xie, Z., Wang, J., and Yang, S.: Simulation analysis of local land atmosphere coupling in rainy season over a typical underlying surface in the Tibetan Plateau, Hydrol. Earth Syst. Sci., 24, 5937–5951, https://doi.org/10.5194/hess-24-5937-2020, 2020a.
Sun, G., Hu, Z., Ma, Y., Xie, Z., Yang, S., and Wang, J.: Analysis of local land–atmosphere coupling in rainy season over a typical underlying surface in Tibetan Plateau based on field measurements and ERA5, Atmos. Res., 243, 105025, https://doi.org/10.1016/j.atmosres.2020.105025, 2020b.
Sun, G., Hu, Z., Ma, Y., Xie, Z., Sun, F., Wang, J., and Yang, S.: Analysis of local land atmosphere coupling characteristics over Tibetan Plateau in the dry and rainy seasons using observational data and ERA5, Sci. Total Environ., 774, 145138, https://doi.org/10.1016/j.scitotenv.2021.145138, 2021.
Sun, J., Qin, X., and Yang, J.: The response of vegetation dynamics of the different alpine grassland types to temperature and precipitation on the Tibetan Plateau, Environ. Monit. Assess., 188, 20, https://doi.org/10.1007/s10661-015-5014-4, 2016.
Sun, J., Yang, K., Guo, W., Wang, Y., He, J., and Lu, H.: Why has the inner Tibetan Plateau become wetter since the mid-1990s?, J. Climate, 33, 8507–8522, 2020.
Ueno, K., Sugimoto, S., Tsutsui, H., Taniguchi, K., Hu, Z., and Wu, S.: Role Of Patchy Snow Cover On The Planetary Boundary Layer Structure During Late Winter Observed In The Central Tibetan Plateau, J. Meteorol. Soc. Jpn., 90c, 145–155, 2012.
Wang, G., Hu, Z., Yu, H., Sun, G., Niu, R., and Wang, X.: Land-atmosphere coupling characteristics in summer based on microwave radiometer data at Nagqu site of Tibetan Plateau, Atmos. Res., 320, 108074, https://doi.org/10.7522/j.issn.1000-0534.2023.00020, 2025.
Wang, S., Hu, Z., Gu, L., and Sun, F.: Comprehensive observation data set of multi-sphere land–atmosphere interaction at 8 sites in the westerly zone and monsoon zone from 2018 to 2022 National Tibetan Plateau/Third Pole, Environment Data Center [data set], https://doi.org/10.11888/Atmos.tpdc.300325, 2023a.
Wang, Y., Liu, X., Lv, M., and Zhang, Z.: Mechanisms and influencing factors of hydrothermal processes in active layer soils on the Qinghai-Tibet Plateau under freeze–thaw action, Catena, 220, 106694, https://doi.org/10.1016/j.catena.2022.106694, 2023b.
Wu, G., Liu, Y., Zhang, Q., Duan, A., Wang, T., Wan, R., Liu, X., Li, W., Wang, Z., and Liang, X.: The influence of mechanical and thermal forcing by the Tibetan Plateau on Asian climate, J. Hydrometeorol., 8, 770–789, 2007.
Wu, G., Liu, Y., He, B., Bao, Q., Duan, A., and Jin, F.: Thermal Controls on the Asian Summer Monsoon, Sci. Rep., 2, 404, https://doi.org/10.1038/srep00404, 2012.
Xie, J., Yu, Y., Liu, C., and Ge, J.: Characteristics of Surface Sensible Heat Flux over the Qinghai-Tibetan Plateau and Its Response to Climate Change, Plateau Meteorol., 37, 28–42, 2018.
Xie, Z., Ma, W., Ma, Y., Hu, Z., Sun, G., Han, Y., Hu, W., Su, R., and Fan, Y.: Decision tree-based detection of blowing snow events in the European Alps, Hydrol. Earth Syst. Sci., 25, 3783–3804, https://doi.org/10.5194/hess-25-3783-2021, 2021.
Xie, Z., Ma, Y., Ma, W., Hu, Z., and Sun, G.: Comparison of varied complexity parameterizations in estimating blowing snow occurrences, J. Hydrol., 619, 129291, https://doi.org/10.1016/j.jhydrol.2023.129291, 2023.
Yang, K., Koike, T., Fujii, H., Tamagawa, K., and Hirose, N.: Improvement of Surface Flux Parameterizations with a Turbulence-Related Length, Q.. J. Roy. Meteorol. Soc., 128, 2073–2087, 2002.
Yang, K., He, J., Tang, W., Qin, J., and Cheng, C.: On downward shortwave and longwave radiations over high altitude regions: Observation and modeling in the Tibetan Plateau, Agr. Forest Meteorol., 150, 38–46, 2010.
Yang, K., Ye, B., Zhou, D., Wu, B., Foken, T., Qin, J., and Zhou, Z.: Response of hydrological cycle to recent climate changes in the Tibetan Plateau, Climatic Change, 109, 517–534, 2011.
Yang, K., Wu, H., Qin, J., Lin, C., Tang, W., and Chen, Y.: Recent climate changes over the Tibetan Plateau and their impacts on energy and water cycle: A review, Global Planet. Change, 112, 79–91, 2014.
Yao, T., Thompson, L., Yang, W., Yu, W., Gao, Y., Guo, X., Yang, X., Duan, K., Zhao, H., Xu, B., Pu, J., Lu, A., Xiang, Y., Kattel, D., and Joswiak, D.: Different glacier status with atmospheric circulations in Tibetan Plateau and surroundings, Nat. Clim. Change, 2, 663–667, 2012.
Zhang, G., Luo, W., Chen, W., and Zheng, G.: A robust but variable lake expansion on the Tibetan Plateau, Sci. Bull., 64, 1306–1309, 2019a.
Zhang, T., Wang, T., Krinner, G., Wang, X., Gasser, T., Peng, S., Piao, S., and Yao, T.: The weakening relationship between Eurasian spring snow cover and Indian summer monsoon rainfall, Sci. Adv., 5, eaau8932, https://doi.org/10.1126/sciadv.aau8932, 2019b.
Zhao, Y., Xu, X., Liu, L., Zhang, R., Xu, H., Wang, Y., and Li, J.: Effects of convection over the Tibetan Plateau on rainstorms downstream of the Yangtze River Basin, Atmos. Res., 219, 24–35, 2019.
Zhong, L., Zou, M., Ma, Y., Huang, Z., Xu, K., Wang, X., Ge, N., and Cheng, M.: Estimation of downwelling shortwave and longwave radiation in the Tibetan Plateau under all-sky conditions, J. Geophys. Res.-Atmos., 124, 11086–11102, 2019.
Zou, M., Zhong, L., Ma, Y., Hu, Y., and Feng, L.: Estimation of actual evapotranspiration in the Nagqu river basin of the Tibetan Plateau, Theor. Appl. Climatol., 132, 1039–1047, 2018.