the Creative Commons Attribution 4.0 License.
the Creative Commons Attribution 4.0 License.
 | 25 Nov 2025
In situ-measured benthic fluxes of dissolved inorganic phosphorus in the Baltic Sea
Nils Ekeroth
Hannah Berk
Andy W. Dale
Mikhail Kononets
Wytze K. Lenstra
Aada Palo
Anders Tengberg
Sebastiaan J. van de Velde
Stefan Sommer
Caroline P. Slomp
Per O. J. Hall
Sedimentary recycling of phosphorus is a key aspect of eutrophication. Here, we present data on benthic fluxes of dissolved inorganic phosphorus (DIP) from the Baltic Sea, an area with a long eutrophication history. The presented dataset contains 498 individual fluxes measured in situ with three types of benthic chamber landers at 59 stations over 20 years, and data cover most of the Baltic Sea subbasins (Hylén et al., 2025, https://doi.org/10.5281/zenodo.14812160). The dataset further contains information about bottom-water dissolved oxygen (O2) concentrations, sedimentary organic carbon (OC) content and sediment type. The DIP fluxes differ considerably between basins depending on OC loading and the level of O2 depletion and generally increase from the coast to the central basins. Several stations have been visited on multiple occasions, also at times with different O2 concentrations, which enables investigation of the immediate effects of shifting bottom-water O2 concentrations on the benthic DIP release. The Baltic Sea-wide benthic DIP release is estimated to be 389–484 kton yr−1 based on a data integration based on sediment type and O2 conditions during three years with varying extents of hypoxia and anoxia (2004, 2013 and 2018). The dataset reveals a lack of flux measurements in winter months, coastal areas, and sandy and coarse sediments; these should be targeted in future studies. Overall, intercomparisons between samplings and landers as well as rigorous data evaluation show that the data are of high quality. As such, this data set will, alone and together with other environmental data, be important for marine management and studies on mechanisms in benthic phosphorus cycling.
- Article
(9286 KB) - Full-text XML
- BibTeX
- EndNote


The Baltic Sea (Fig. 1) is a semi-enclosed sea in northern Europe with a long history of impacts from human activities and has been suggested to act as a “time machine” for the future coastal ocean (Reusch et al., 2018). Most notably, large parts of the central Baltic Sea suffer from eutrophication-induced oxygen (O2) depletion (Carstensen et al., 2014; Conley et al., 2009). While the O2 depletion has been argued to sustain the eutrophication through elevated sedimentary phosphorus (P) recycling under hypoxic (0–63 µM O2) and anoxic (0 µM O2) bottom water conditions (Vahtera et al., 2007), the magnitude of sedimentary P release in different parts of the Baltic Sea has not previously been quantified at the system scale. Importantly, the basins of the Baltic Sea differ substantially from each other in environmental conditions as well as in input rates and sources of organic matter, macro and micronutrients (of the latter, especially iron; Kuliński et al., 2022). This spatial variability, combined with a long tradition of environmental monitoring in the area (Reusch et al., 2018), makes the Baltic Sea suitable for assessing factors that affect P recycling in sediments.
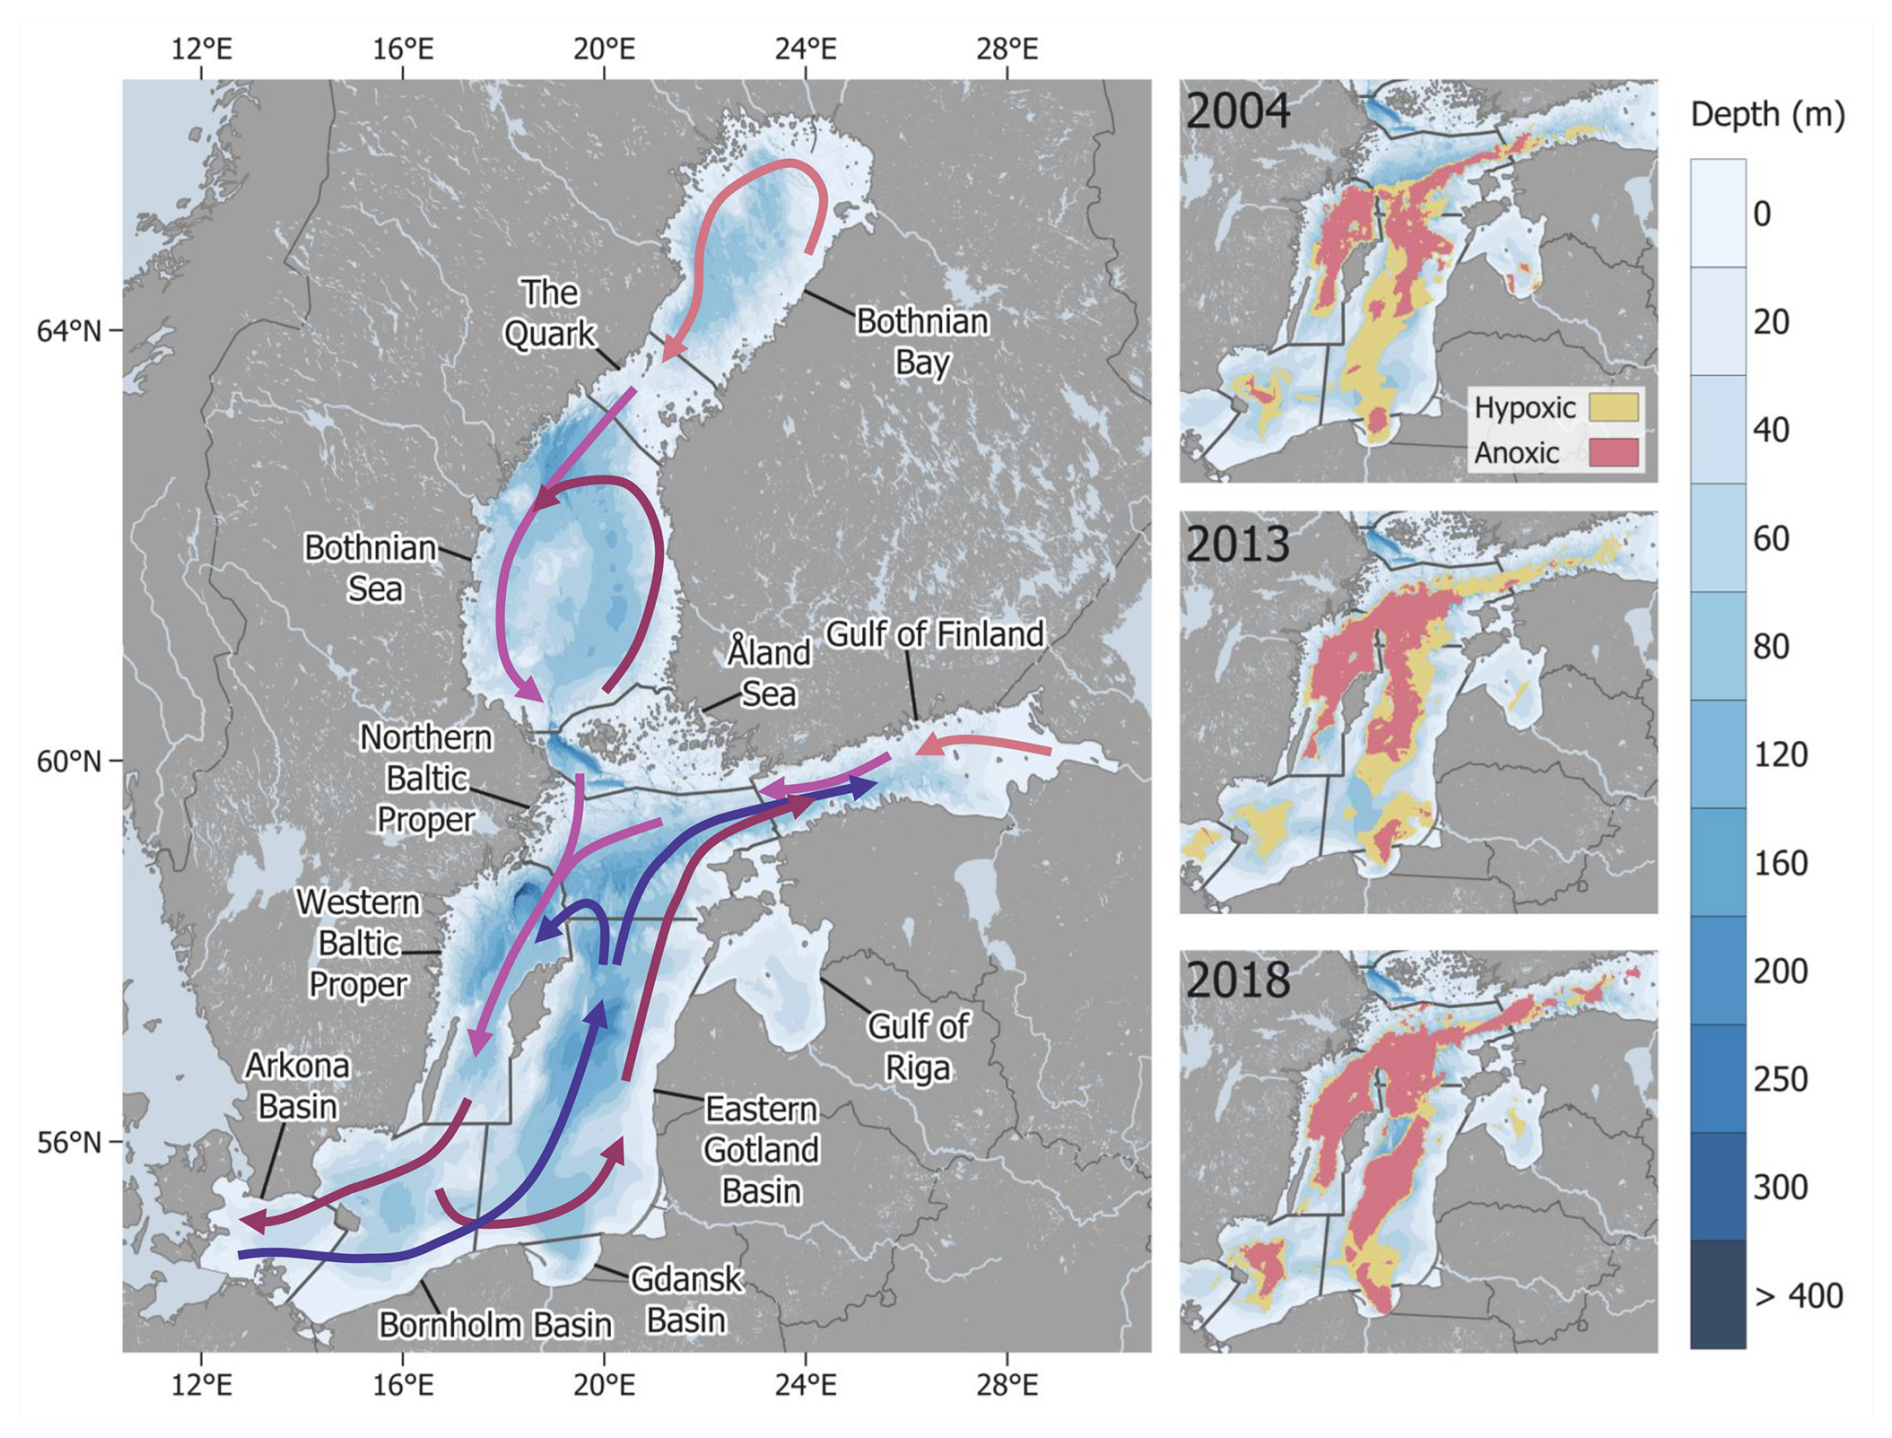
Figure 1(a) Map of the Baltic Sea and its subbasins. We do not, in this study, consider the Kattegat and the Belt Sea (situated to the west of the Arkona Basin) as being part of the Baltic Sea due to their nature as a transition zone located outside the Danish straits, although they are listed as subbasins by the Baltic Marine Environment Protection Commission (HELCOM). The pink arrows show surface currents, where darker colours represent higher salinities, and the blue arrows show deep-water currents (Eilola et al., 2008). (b) Extent of hypoxic (yellow) and anoxic (red) areas in 2004 (small hypoxic-anoxic area), 2013 (medium hypoxic-anoxic area) and 2018 (large hypoxic-anoxic area), obtained from Hansson and Viktorsson (2021).
The varied environmental conditions in the Baltic Sea are largely related to strong salinity gradients, driven by the freshwater input and the connection to the North Sea via the narrow and shallow (∼ 20 m deep) Danish straits (Snoeijs-Leijonmalm et al., 2017). Over 200 rivers discharge into the Baltic Sea, primarily into the northern and eastern parts. While less saline surface water leaves the Baltic Sea through the Danish Straits, a deeper current of more saline water enters the Baltic Sea from the North Sea. The high freshwater input causes an increase in surface salinity from ∼ 2 in the north to ∼ 10 in the south and increasing salinity with depth (∼ 3–16), resulting in strong vertical density gradients in the southern (more saline) basins. The tidal amplitude in the Baltic Sea is low (< 10 cm) and is generally masked by sea-level variations driven by changes in atmospheric pressure (Novotny et al., 2006). Due to the shallow depths of the Danish straits, the water exchange is limited, and the water residence time in the Baltic Sea is about 30–40 years (Meier, 2007) The average depth of the Baltic Sea is 57 m, but many basins reach water depths over 200 m (Leppäranta and Myrberg, 2009) and several deep points exist (e.g., Gotland deep 249 m, Landsort deep 459 m, Ulvö deep 293 m). Wave-induced resuspension of sediments in the Baltic Sea occurs down to water depths of 40–60 m (Danielsson et al., 2007). This resuspension contributes to the shuttling of particles from shallow erosional areas to deep accumulation areas (Jonsson et al., 1990; Leipe et al., 2011; Nilsson et al., 2021). However, local conditions strongly affect sedimentation and the highest sediment accumulation rates are found in small coastal basins, particularly in archipelagos (Mitchell et al., 2021).
The Baltic Sea is divided into three main basins, which in turn consist of multiple subbasins (Fig. 1). The Gulf of Bothnia (Bothnian Bay, the Quark, Bothnian Sea) is situated in the northernmost part of the Baltic Sea. The catchment area consists primarily of forests, and the riverine input of terrestrial material is relatively large (Miltner and Emeis, 2001). The Gulf of Bothnia is the least saline and stratified basin in the Baltic Sea, as sills separate it from the southern basins and decrease the inflow of saline deep water (Snoeijs-Leijonmalm et al., 2017). The Gulf of Finland is situated in the easternmost part of the Baltic Sea. This shallow basin is surrounded mainly by forests and non-arable land but also comprises some agricultural and urban areas (Miltner and Emeis, 2001). The basin receives a high freshwater input from the Neva River (17 % of the total riverine input; HELCOM, 2018b), causing the stratification to be weak in the eastern part and increase toward the open connection with the Baltic Proper (Snoeijs-Leijonmalm et al., 2017). The Baltic Proper is situated in the southern part of the Baltic Sea and is divided into six subbasins: the Arkona Basin, the Bornholm Basin, the Gulf of Riga, the Northern Gotland Basin, the Western Gotland Basin and the Eastern Gotland Basin. The catchment area of the basin mainly comprises agricultural land, pastures and forests (Miltner and Emeis, 2001). The basin is strongly stratified due to large differences in salinity between the surface and bottom waters. In addition to minor inflows of saline water from the North Sea, so-called major Baltic inflows (MBIs) currently occur about once every 10 years and renew the bottom water (Fischer and Matthäus, 1996).
The drainage area of the Baltic Sea is nearly five times larger than its surface area and is inhabited by ∼ 85 million people (Snoeijs-Leijonmalm et al., 2017). The population growth and intensification of agriculture increased the nutrient input to the Baltic Sea in the early to mid-1900s (Gustafsson et al., 2012; HELCOM, 2018a; Zillén et al., 2008), which caused a threefold increase in the primary production in the Baltic Proper and Gulf of Finland (Gustafsson et al., 2012; Savchuk et al., 2008; Schneider and Kuss, 2004). Subsequent organic matter degradation has driven a high consumption of O2, leaving 13 % and 16 % of the Baltic Proper bottom water hypoxic and anoxic, respectively, in 2022 (Fig. 1; Hansson and Viktorsson, 2023). Despite a considerable decrease in the nutrient load from land since the mid-1980s, there has been no concomitant reduction of the water column P pool (Jilbert et al., 2011; Savchuk, 2018). The stability of the pelagic P pool has been attributed to the long water residence time, intense sedimentary P recycling, and a decreased capacity of the sediment to retain P due to bottom-water O2 depletion (Conley et al., 2009; Gustafsson et al., 2017; Jilbert et al., 2011; Vahtera et al., 2007). Models suggest that the sedimentary recycling of dissolved inorganic phosphorus (DIP) in the entirety of the Baltic Sea releases 229 kton P yr−1 to the water column (Gustafsson et al., 2012). While this estimate of the benthic DIP release represents conditions in the early 2010s, it is nine times higher than the current input of total P to the Baltic Sea via rivers (26 kton P in 2020; HELCOM, 2023). However, an estimate of the sedimentary P recycling on the Baltic Sea system scale based on measurements of DIP release from the sediment is currently lacking.
Here, we present a dataset of sediment-water fluxes of DIP from 59 sites in the Baltic Sea, measured in situ with benthic chamber landers between 2001 and 2021. Fluxes measured directly in incubations generally give considerably more accurate estimates of the sediment-water solute exchange than fluxes calculated from pore-water profiles, as the low vertical resolution of data obtained from pore water can obscure strong chemical gradients (Kononets et al., 2021; Nilsson et al., 2019; Sundby et al., 1986; van de Velde et al., 2023). Furthermore, in bioirrigated sediments, pore-water profiles must be combined with site-specific transport coefficients to obtain reliable fluxes. Flux incubations conducted in situ further have the advantage of more closely replicating ambient conditions, as it can be difficult to maintain low O2 conditions in ex situ incubations. We combine the measured DIP fluxes with seafloor substrate data and the areal extent of bottom-water O2 depletion to calculate the integrated annual sedimentary DIP release in the entirety of the Baltic Sea.
2.1 Benthic chamber landers
Three types of benthic chamber landers were used to measure the DIP fluxes: the big and small University of Gothenburg landers (UGOT; Kononets et al., 2021) from Sweden, the ALBEX lander from the Royal Netherlands Institute for Sea Research (NIOZ) in the Netherlands (Witbaard et al., 2000), and two GEOMAR Biogeochemical Observatories (BIGO; Sommer et al., 2006) from Germany (Table 1). These benthic chamber landers have been described in detail elsewhere (Table 1).
Table 1Description of the benthic chamber landers.
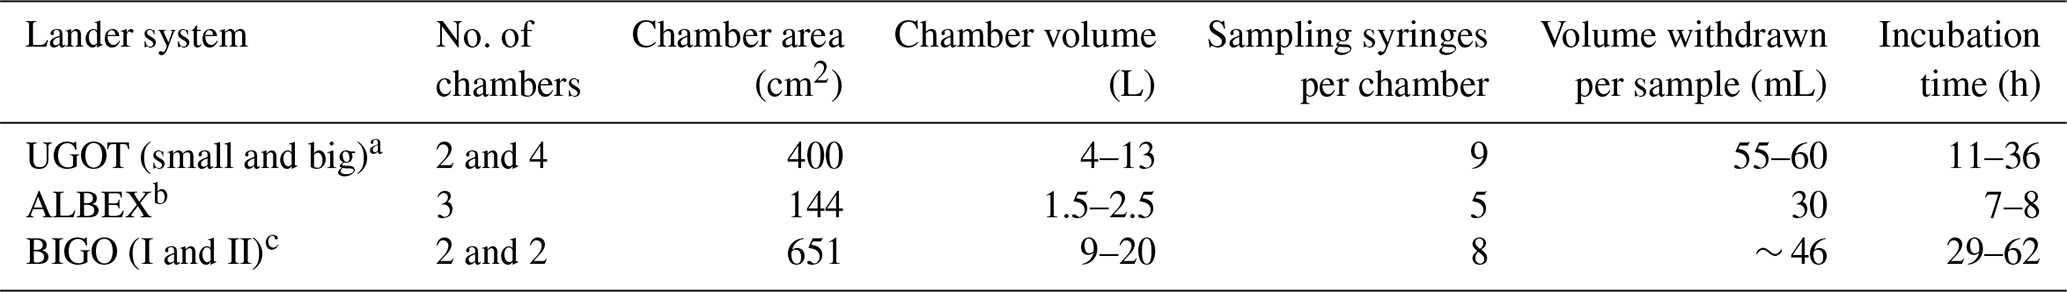
a Kononets et al. (2021), b Lenstra et al. (2021), c Sommer et al. (2006).
Briefly, each chamber incubates an area of sediment and a volume of overlying water. Syringes connected to the chamber withdraw water at pre-set times, with an equal volume of ambient bottom water simultaneously entering the chamber. Sensors continuously measure the O2 concentrations inside and outside the chambers. Besides being used to calculate O2 fluxes, the O2 data also confirms that no leakages or disturbances occurred during the incubations. Depending on the lander system, successful incubations are further corroborated by, e.g., measurements of turbidity and pressure within the chambers to confirm that resuspension did not occur and that syringes were triggered at the right time, or retrieval of the incubated sediment at the end of the deployment for visual observation (Kononets et al., 2021; Sommer et al., 2006; Witbaard et al., 2000). Previous intercalibration studies have shown that the chamber design does not significantly impact the measured flux (Tengberg et al., 2004, 2005).
2.2 Data collection
Data of DIP fluxes measured in situ with benthic chamber landers have been compiled from published data (Ekeroth et al., 2016a; Hylén et al., 2021; Noffke et al., 2016; Sommer et al., 2017; Viktorsson et al., 2012, 2013), amended with previously unpublished fluxes. All fluxes were re-evaluated according to the procedure described in Sect. 2.3. Measurements have been conducted in 8 of 14 HELCOM-defined subbasins, with the highest density of sampling sites in the Western and Eastern Gotland Basins and the Gulf of Finland (Figs. 1, 2).
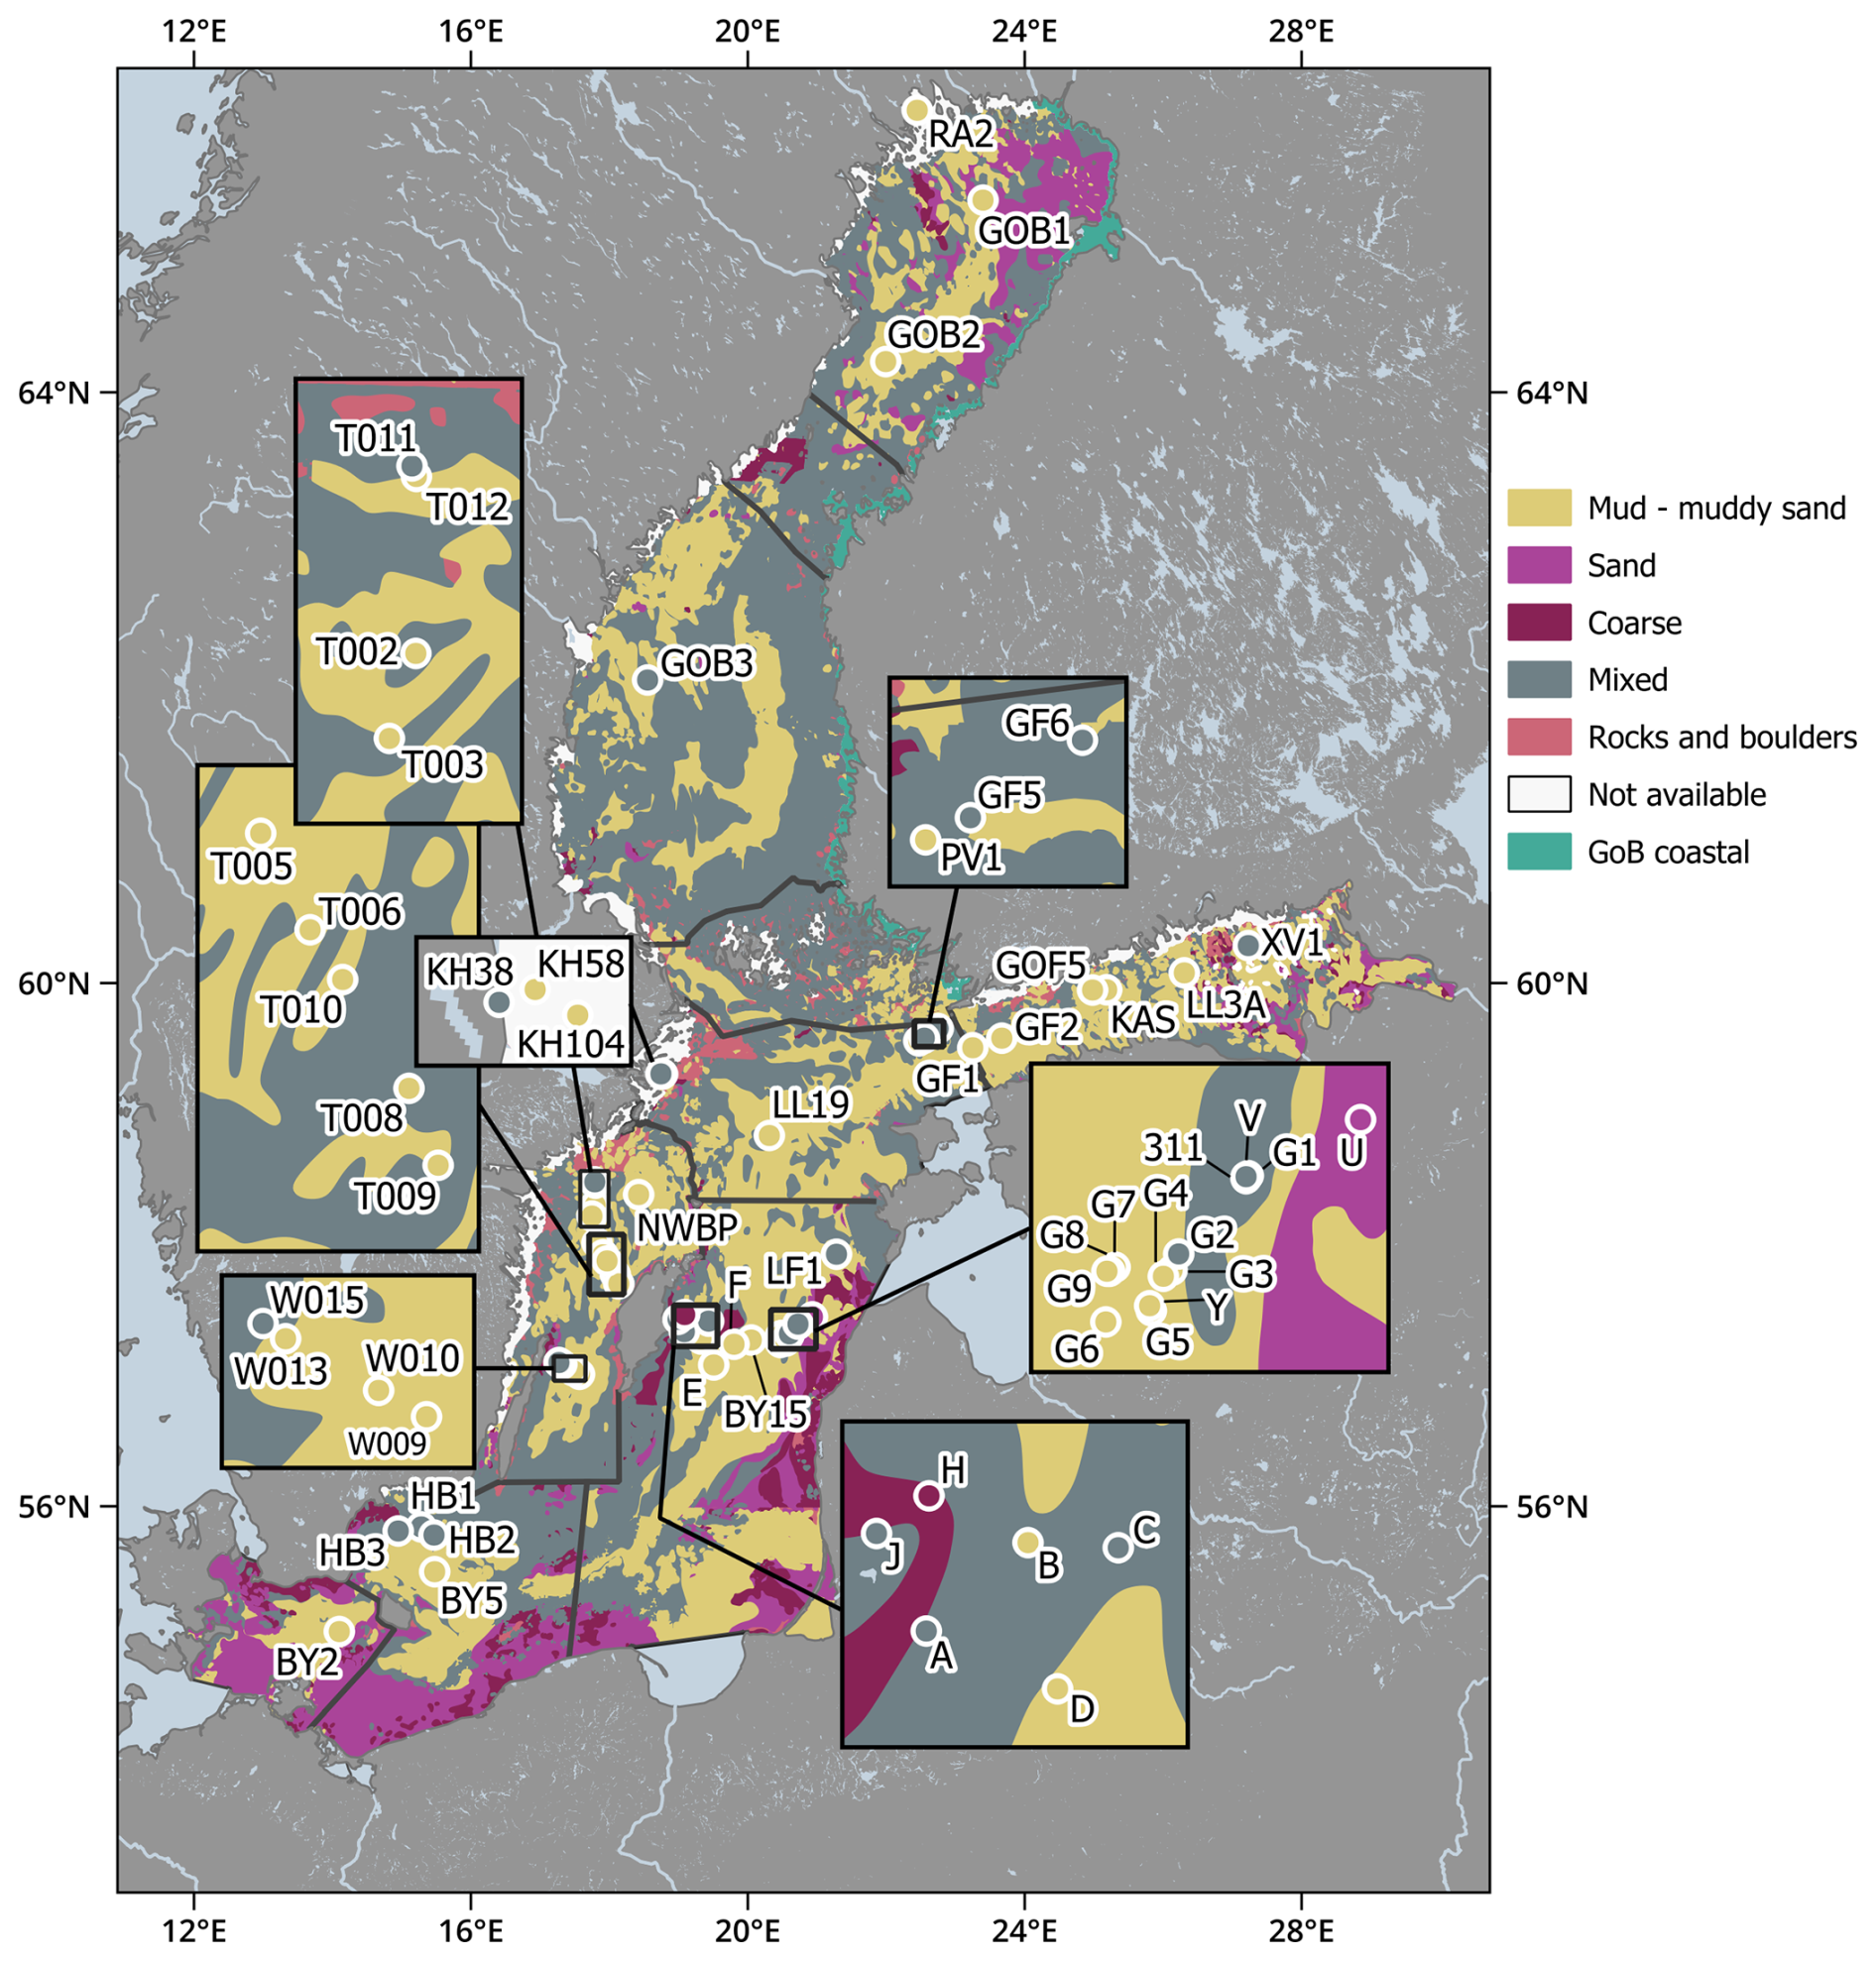
Figure 2Map of sediment types and stations sampled using benthic chamber landers in the Baltic Sea, based on data from EMODnet. “Not available” marks data excluded (Swedish and Finnish archipelago areas) or data not publicly available; “GoB coastal” is represented by station RA2 (Sect. 2.3). The colours of the markers show the sediment types identified at the stations during sampling.
The sampling sites have been classified according to bottom-water O2 concentrations and sediment type (Table 2). Bottom-water O2 concentrations were measured by optodes: Aanderaa model 3830/3835 (accuracy better than 5 % or 8 µM, whichever is greater; Bittig et al., 2018; Tengberg et al., 2006) on the UGOT and BIGO landers, and JFE Advantech model RINKO I (2 % accuracy) on the ALBEX lander. The O2 classification is based on concentrations where oxic is > 63 µM O2, hypoxic is 0–63 µM O2, and anoxic is 0 µM O2 (or < 3 µM, the detection limit of Winkler titrations). The sediment type at each station was obtained from the EMODnet Geology Project seabed substrate data (1:1 000 000 scale, with the smallest cartographic unit of 4 km2), which follows the “Folk 5” classification scheme (Table A1, Fig. 2). Due to the relatively coarse resolution of the EMODnet data, field observations of sediment cores occasionally indicated that the actual sediment type differed from that inferred from EMODnet. Thus, adjustments to the sediment type classifications were needed for some stations. Due to the lack of grain size distribution data, measured sediment organic carbon (OC) content was used as a proxy for distinguishing between the sediment types “mixed” and “mud–muddy sand”, which contain more and less than 5 % gravel, respectively (Kaskela et al., 2019). Gravel in sediment generally indicates that the seafloor is subject to sediment erosion, which typically results in lower OC content than in accumulation sediment (such as mud). We thus assume that mud – muddy sand has a higher OC content than mixed sediment. Indeed, the median OC content at the sediment surface (top 0–2 cm) at stations classified through EMODnet as consisting of mixed sediment is 1.4 %, compared to 8.3 % OC for mud – muddy sand. A cut-off value of 3 % OC was chosen to differentiate mud-muddy sand sediment from mixed sediment. Thus, all sediments classified as mixed according to EMODnet but with a higher OC content than 3 % were reclassified as mud – muddy sand. Conversely, all sediments classified as mud – muddy sand according to EMODnet but with a lower OC content than 3 % were reclassified as mixed.
2.3 Sediment-water flux measurements
The lengths of the benthic chamber lander incubations were adjusted depending on the reactivity of the sediment, with shorter incubations in more reactive areas to minimise the changes to the chemical environment inside the chambers (Table 1). The samples from the UGOT landers were filtered through pre-rinsed 0.45 µm cellulose acetate filters and were stored at 4–6 °C or frozen until analysis. Samples from the ALBEX lander were filtered through 0.45 µm nylon filters and were acidified with 5 µL suprapur HCl per ml of sample before storage at 4 °C until analysis. The samples from the BIGO landers were filtered through 0.2 µm cellulose acetate filters before storage at 4–6 °C until analysis. Concentrations of DIP were, in all cases, determined by the ammonium molybdate method using segmented flow colorimetric analysis (Koroleff, 1983) with an analytical precision better than 3 %. All methods used to measure the DIP are routinely used for seawater, so no differences in concentrations are expected between methodologies. Furthermore, the resulting fluxes are not affected by methodological differences, as they are calculated from the change in DIP concentration in samples measured with the same methodology. Other solutes were measured in parallel to DIP; these data are presented in the studies listed in Table 2.
Table 2Description of stations. Note that the station names from references 7 and 8 have been modified; all original station names are included in the accompanying dataset (Hylén et al., 2025). Basins: BP = Baltic Proper, GOB = Gulf of Bothnia, GOF = Gulf of Finland. Subbasins: Bor. B = Bornholm Basin, EGB = Eastern Gotland Basin, BB = Bothnian Bay, BS = Bothnian Sea, GOF = Gulf of Finland, NBP = Northern Baltic Proper, WGB = Western Gotland Basin. Oxygen (O2) status: O = oxic, H = hypoxic, A = anoxic. OC = sedimentary organic carbon content (% dry weight), average of top 0–2 cm.
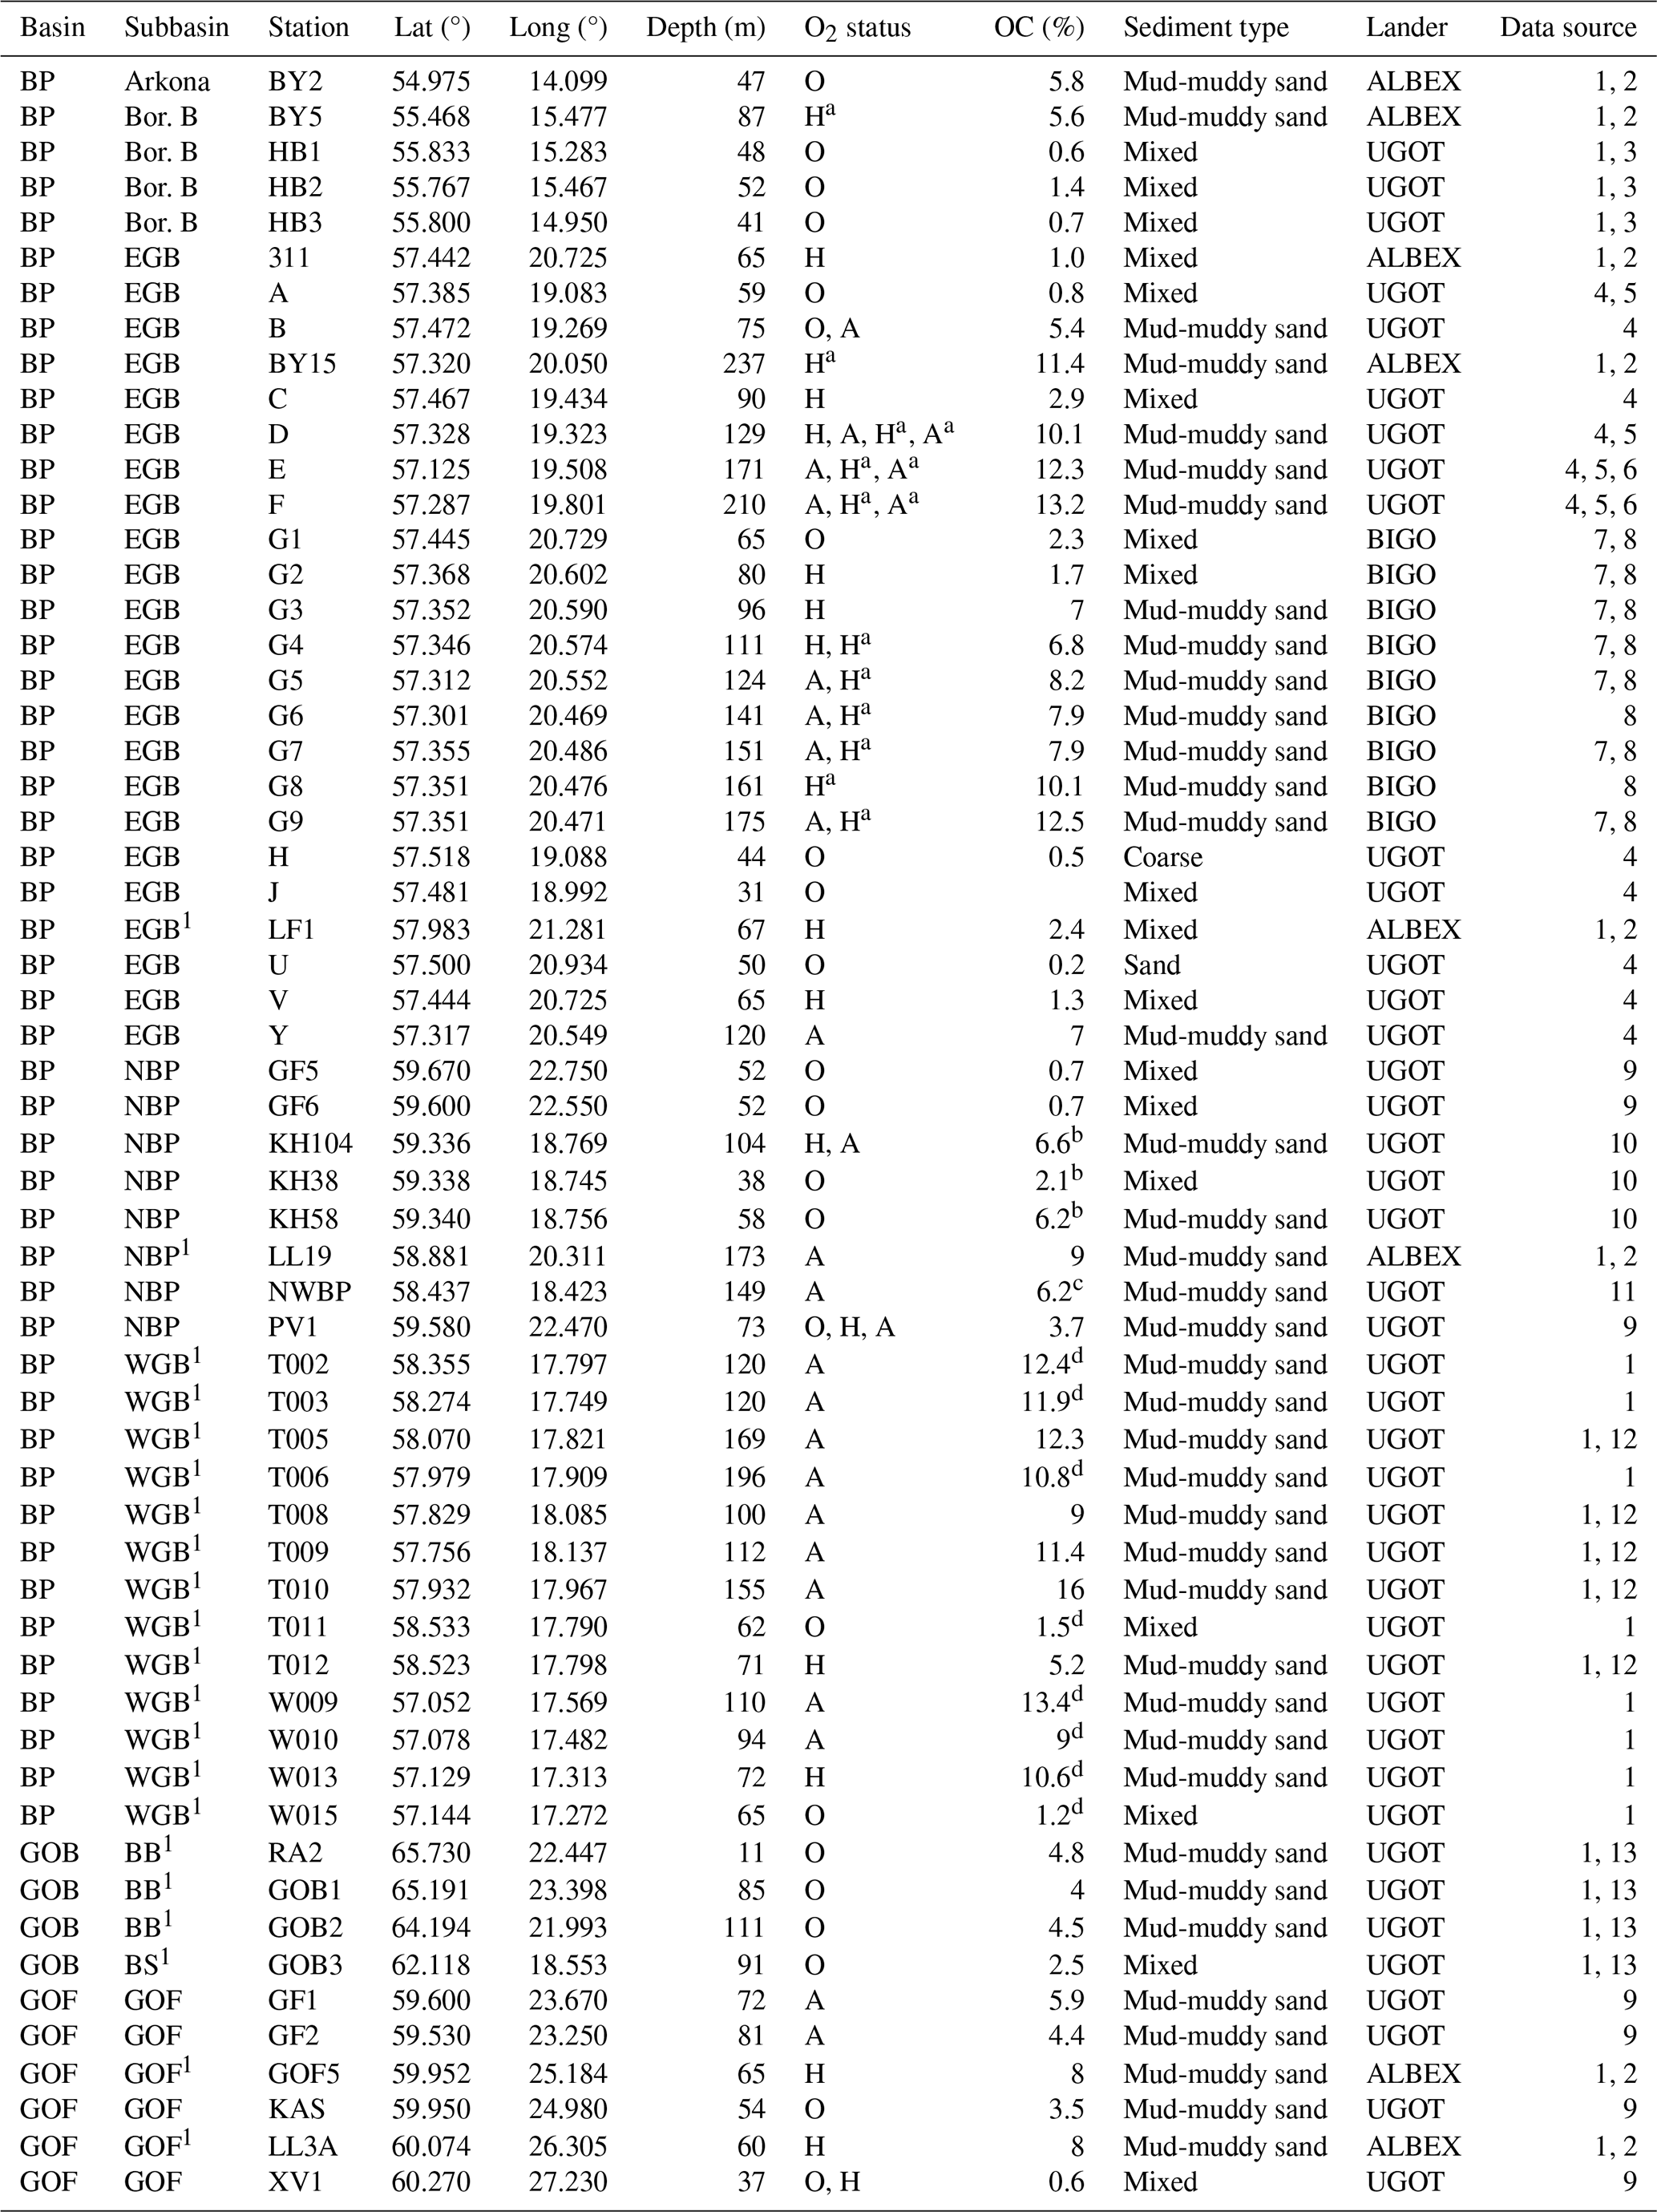
a influenced by major Baltic inflow. btotal carbon. c 0–1 cm sediment depth. d OC samples collected and analysed as in van de Velde et al. (2023). (1) This study. (2) Hermans et al. (2019). (3) Nilsson et al. (2019). (4) Viktorsson et al. (2013). (5) Hylén et al. (2021). (6) Hall et al. (2017) (7) Noffke et al. (2016). (8) Sommer et al. (2017). (9) Viktorsson et al. (2012). (10) Ekeroth et al. (2016a). (11) Ekeroth et al. (2016b). (12) van de Velde et al. (2023). (13) Bonaglia et al. (2017).
All DIP sediment-water fluxes were calculated from raw data and were quality-controlled using the R-script FLUXER (Hylén and van de Velde, 2025). In brief, the flux J (mmol m−2 d−1) was calculated as:
where ddt is the change in concentration in the incubated water over time (mmol m−3 d−1), and H is the height of the incubated water (m). Positive and negative values of J indicate fluxes directed out of and into the sediment, respectively. The value of ddt was obtained from the slope of a simple or quadratic linear regression model fitted to data of time versus DIP concentrations in the chambers. The choice of model was based on the Akaike information criterion score, corrected for small sample sizes (Hurvich and Tsai, 1989). To ensure a good model fit and investigate whether the assumptions for linear regression were fulfilled, the data quality was evaluated with diagnostic graphs. A plot of residuals versus fitted values was used to assess linearity and homoscedasticity, a scale-location plot to assess homoscedasticity, a plot of residuals versus time to assess whether errors were random (i.e., independent of tie or sample order), a normal quantile-quantile (Q–Q) plot to assess whether errors were normally distributed. An influence plot was further used to identify points with potentially strong influences on the model, such that the addition or removal of the point changes the model fit drastically. The plot displayed studentised deleted residuals, which indicate outliers (points that do not follow the same trend for the dependent variable as the other points), hat values which identify leverage points (extreme values for the independent variable), and Cook's distance, which is a measure of how strongly single observations influence the estimated model parameters. Outliers were removed from 19 % of the incubations; these outliers were associated with known sampling issues or were obvious for other parameters as well (e.g., dissolved inorganic carbon, dissolved inorganic nitrogen) and were clearly distinguishable from the rest of the data. Examples of chamber data are shown in Fig. A1.
Following verification of the model and data quality, the initial slope of the regression line was multiplied by the chamber water height to obtain the flux. About 32 % of regression models gave slopes with p≥0.05; these slopes were still used to calculate fluxes after confirming through visual inspection that the resulting fluxes were not outliers (Sect. 3.1). These regression models with p≥0.05 were retained in the data set to avoid systematically removing low-to-zero fluxes.
2.4 Calculation of integrated sedimentary DIP release
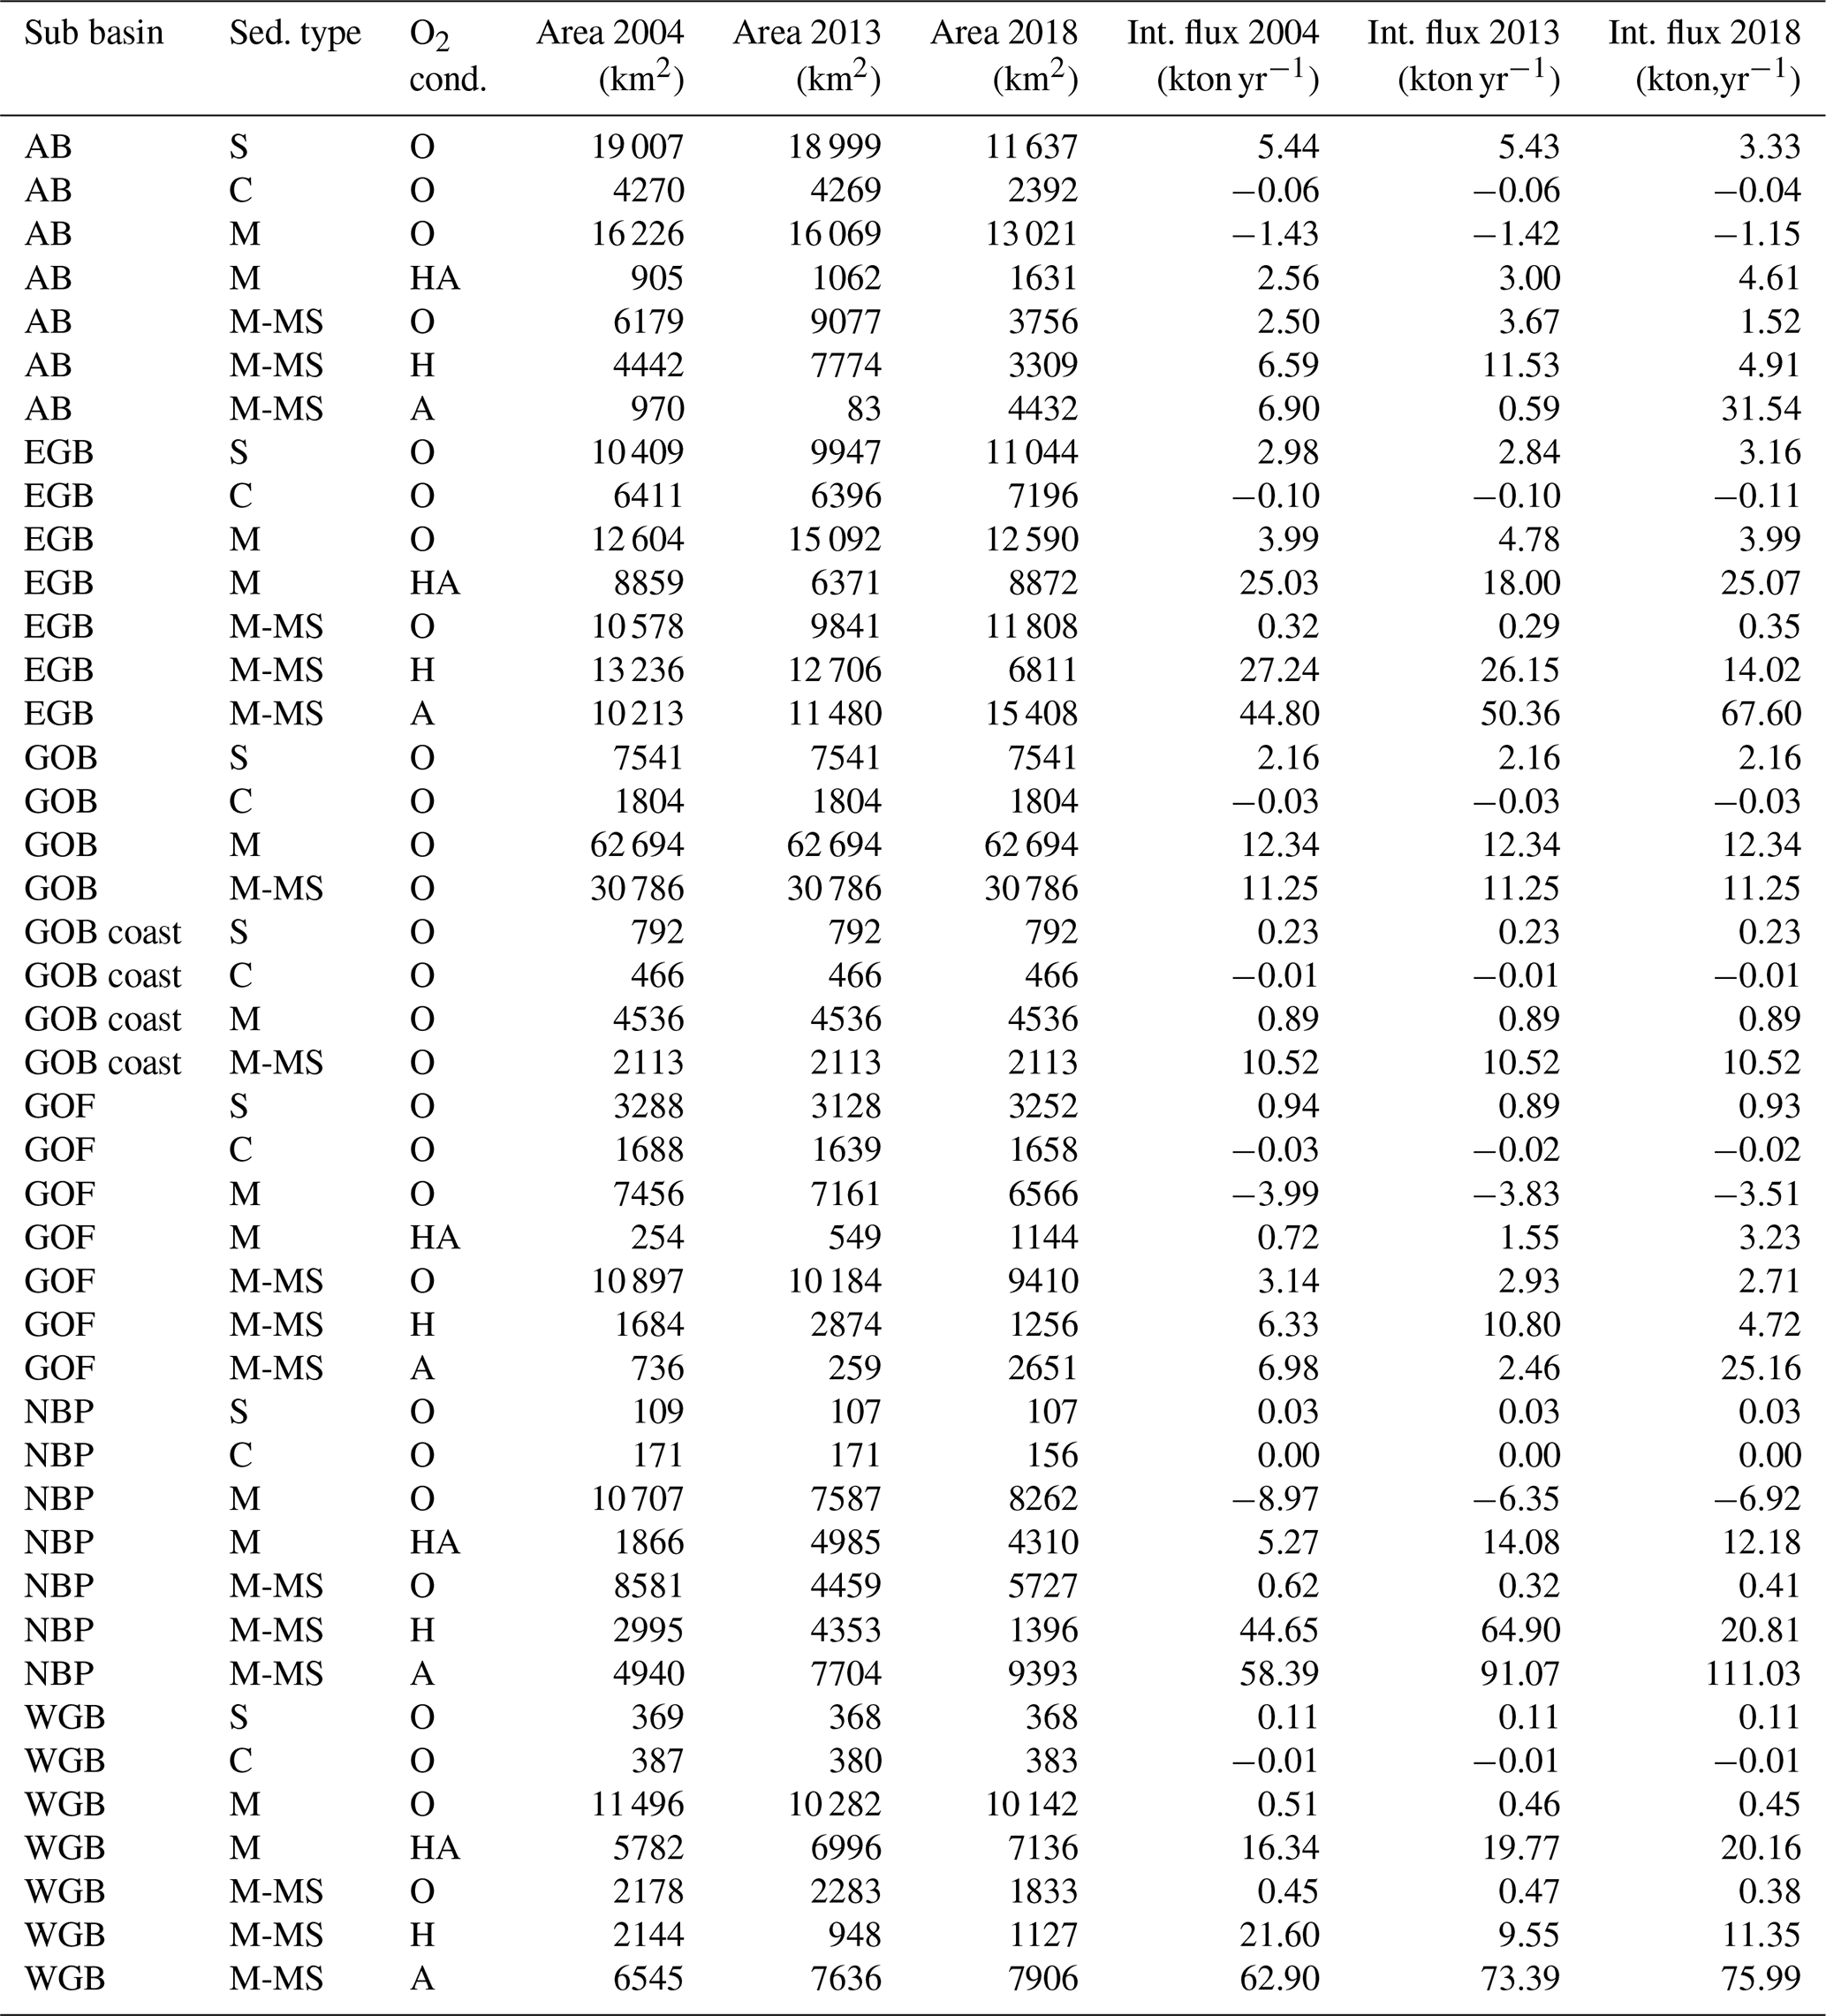
The in-situ measured DIP fluxes were upscaled to calculate an integrated annual sedimentary DIP release for the Baltic Sea system. Calculations were carried out for three years with different extents of the O2-depleted area: 2004 (small – 45 740 km2 hypoxic, 32 060 km2 anoxic), 2013 (medium – 51 221 km2 hypoxic, 38 920 km2 anoxic) and 2018 (large – 29 408 km2 hypoxic, 62 214 km2 anoxic). The upscaling was based on the areal proportions of different sediment types (Table 2) under oxic, hypoxic and anoxic bottom water within each subbasin, calculated with the geographic information system (GIS) software QGIS (version 3.22.1, Fig. A2). Coastal regions with archipelago areas, obtained from HELCOM, were excluded from the seafloor substrate layer due to lack of flux measurements (Fig. 2). The seafloor substrate layer was subsequently intersected with subbasin borders obtained from the Baltic Marine Environment Protection Commission (HELCOM) and the extent of O2-depleted (hypoxic, anoxic) bottom water (Hansson and Viktorsson, 2021) to calculate the extent of each combination of seafloor type and O2 condition within each subbasin.
The integrated sedimentary DIP release was calculated by summing the average DIP load per combination of sediment type, O2 condition and subbasin. Some parts of the HELCOM area do not have a sediment substrate classification in EMODnet; in the internal load calculations, it was assumed that the relative partitioning of sediment substrates in the unknown areas was the same as in the remainder of the subbasin. Benthic DIP flux data were not available for each combination of sediment type, O2 condition and subbasin. When flux data for a particular combination were missing for one basin, values from similar conditions in other basins were used (Table A2). Sand and coarse-grained sediments underlying O2-depleted waters are scarce in the Baltic Sea, and no integrated loads were calculated from such areas. Integrated loads were also not calculated for the Gulf of Riga and the Gdansk Bay, as no in situ flux measurements are available from these areas. Fluxes measured at stations under the influence of MBIs were excluded as they represent an extreme case.
Due to the lack of or low number of measurements in certain areas, we deem it misleading to provide uncertainties for the upscaling calculations. As described above, data for specific combinations of subbasin, sediment type and O2 condition do not always exist and have been replaced with measurements from other basins. The generally similar DIP fluxes in areas with the same sediment types and O2 conditions (Sect. 3.1) justify this approach. When data from one subbasin is used for other subbasins, an uncertainty can be calculated for the values used to estimate the average sedimentary DIP release. However, in those cases, the uncertainty does not reflect how accurately the actual DIP flux is estimated in that area. There are also unquantified uncertainties in the extent of the different sediment types and O2-depleted areas, which need to be considered when calculating the uncertainty for the integrated DIP fluxes. Hence, the upscaling calculations should be seen as indicative (Sect. 3.2).
3.1 DIP fluxes
Between 2001 and 2021, 498 benthic fluxes of DIP were measured in situ with benthic chamber landers at 59 stations in the Baltic Sea during a total of 112 sampling occasions (station visits), corresponding to 155 lander deployments (Hylén et al., 2025). Of the stations, 49 were in the Baltic Proper, six in the Gulf of Finland and four in the Gulf of Bothnia. Most of the sites comprised mud-muddy sand or mixed sediment, with only one station each representing sandy and coarse sediment (Fig. 3a). All three types of bottom-water O2 conditions (anoxic, hypoxic, oxic) were investigated in the Baltic Proper and the Gulf of Finland, whereas the Gulf of Bothnia was fully oxygenated (Fig. 3b). While measurements from most sites only cover one O2 condition, there is data of two O2 conditions from ten stations and of all three O2 conditions from one station. The majority of stations were located between 30–100 m depth, with most stations around 50 m depth (Fig. 3d). Only one station was situated shallower than 20 m depth. Samplings were conducted primarily in spring, summer and early autumn; no sampling occurred in January or December (Fig. 3c). At 14 stations, sampling occurred during three or four different months (Fig. A3). However, except for at station KH104, samplings were conducted across different years, only during two seasons, and aimed at observing shifts in O2 conditions. As a result, seasonal trends cannot be determined from this dataset.
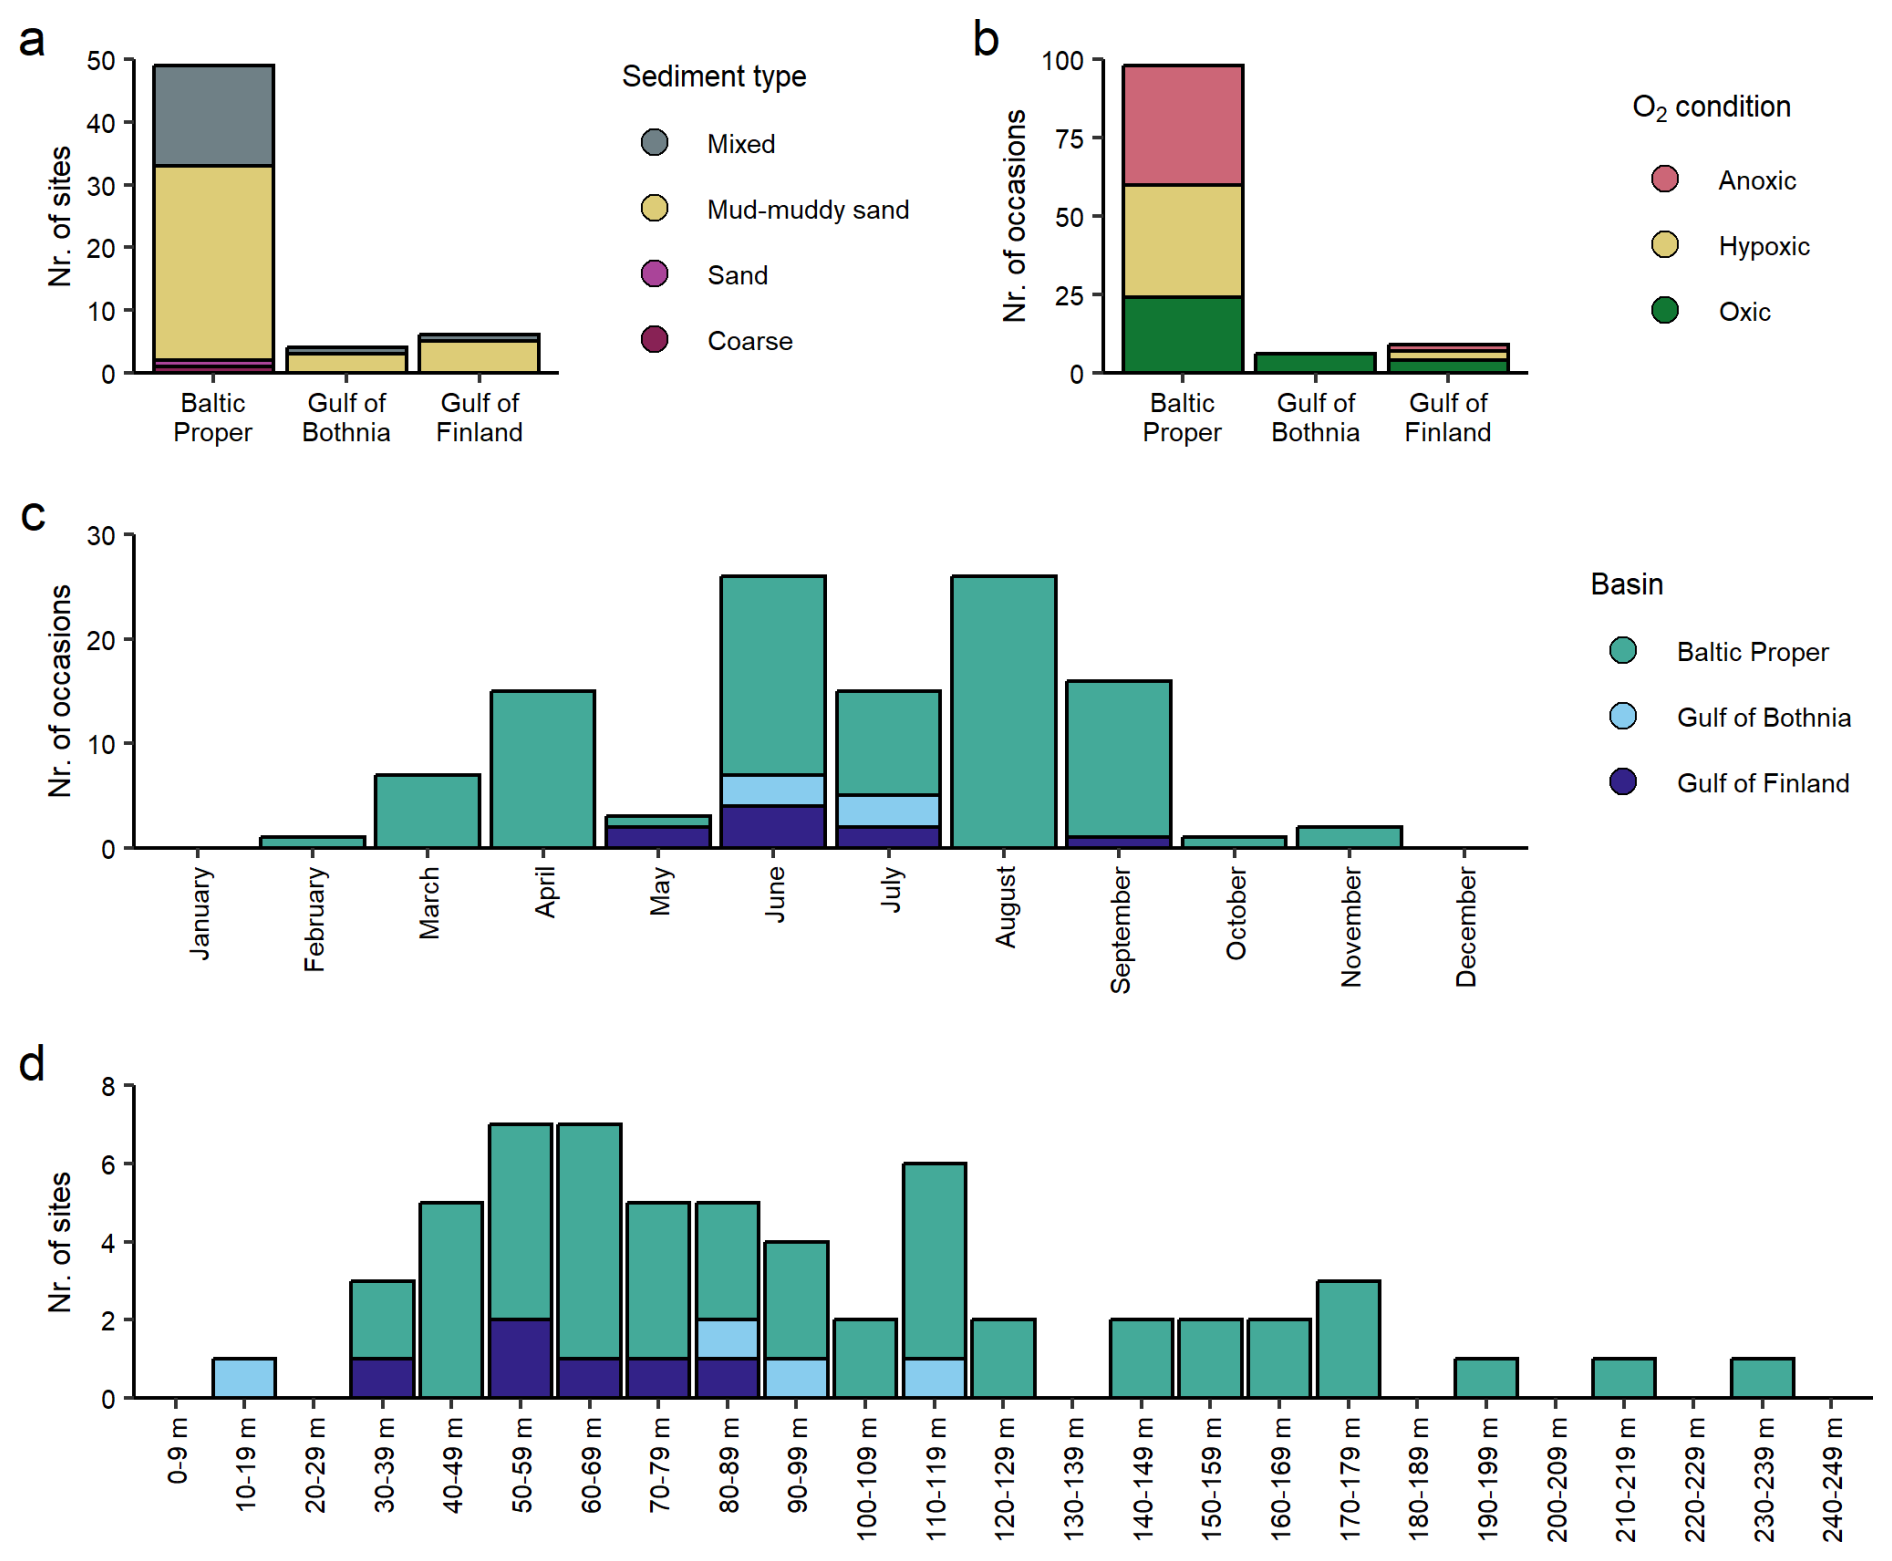
Figure 3Distribution of sites and sampling occasions (station visits) over (a) sediment types, (b) oxygen (O2) condition, (c) months, and (d) water depth.
The dataset consists of 498 individual DIP flux measurements (Fig. 4). Of these fluxes, 32 % were calculated from linear regressions for which the p-value of the slope was higher than 0.05. Most of these fluxes with high p-values were close to zero (−0.1–0.1 mmol m−2 d−1) and were measured in shallow, oxygenated areas where the DIP flux is expected to be low, and incubations would have had to be longer to measure a statistically significant change in concentration. Higher fluxes with high p-values were in line with replicates with low p-values from the same stations and other stations at similar depths and were therefore judged to be accurate. One measurement of good data quality (and p< 0.001) was abnormally high (8.5 mmol m−2 d−1 at T005, compared to 2.4 mmol m−2 d−1 in replicate chambers). Strongly elevated fluxes can result from a local deposit of highly reactive organic matter (e.g., a piece of seaweed, a dead fish), which agrees with an unusually high release of dissolved inorganic carbon from the same chamber at station T005 (van de Velde et al., 2023). Fluxes measured during the same deployment were generally consistent across chambers. However, at some sites, large variations in fluxes measured in replicate chambers indicate high local heterogeneity (Fig. A4). Large differences between replicate fluxes were mainly seen at O2-depleted accumulation sites, where sediment mixing and homogenisation are expected to be low. Although the flux measurements have been conducted with three different types of landers, data from stations in close proximity sampled by different landers (e.g., the eastern part of the EGB) suggest no systematic deviations depending on the lander type used (Fig. 5).
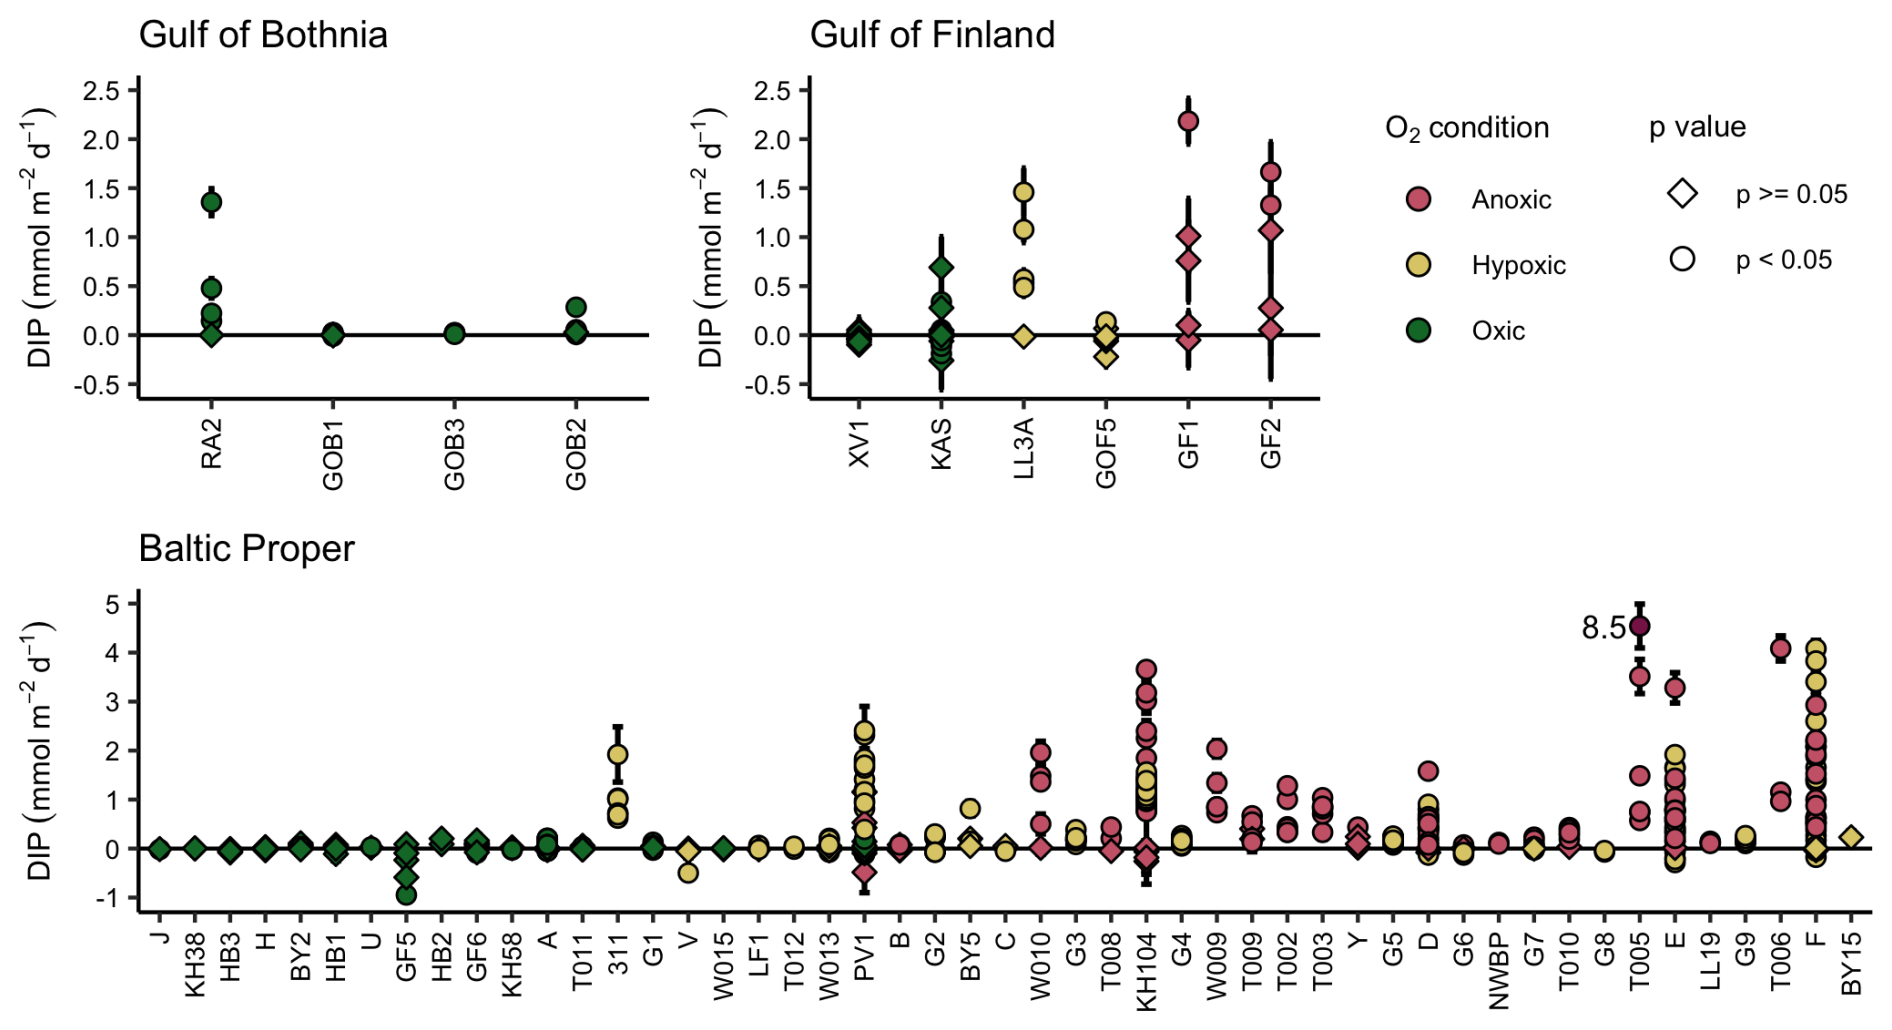
Figure 4Compilation of all individual fluxes of dissolved inorganic phosphorus (DIP) with increasing depth (left to right) and the p-values of the linear regressions used to calculate the fluxes. Each point represents a measurement from one chamber; error bars show the standard error of the flux (the standard error of the regression slope multiplied by the chamber height). A flux of 8.5 mmol m−2 d−1 measured at station T005 in the Baltic Proper is marked in dark purple.
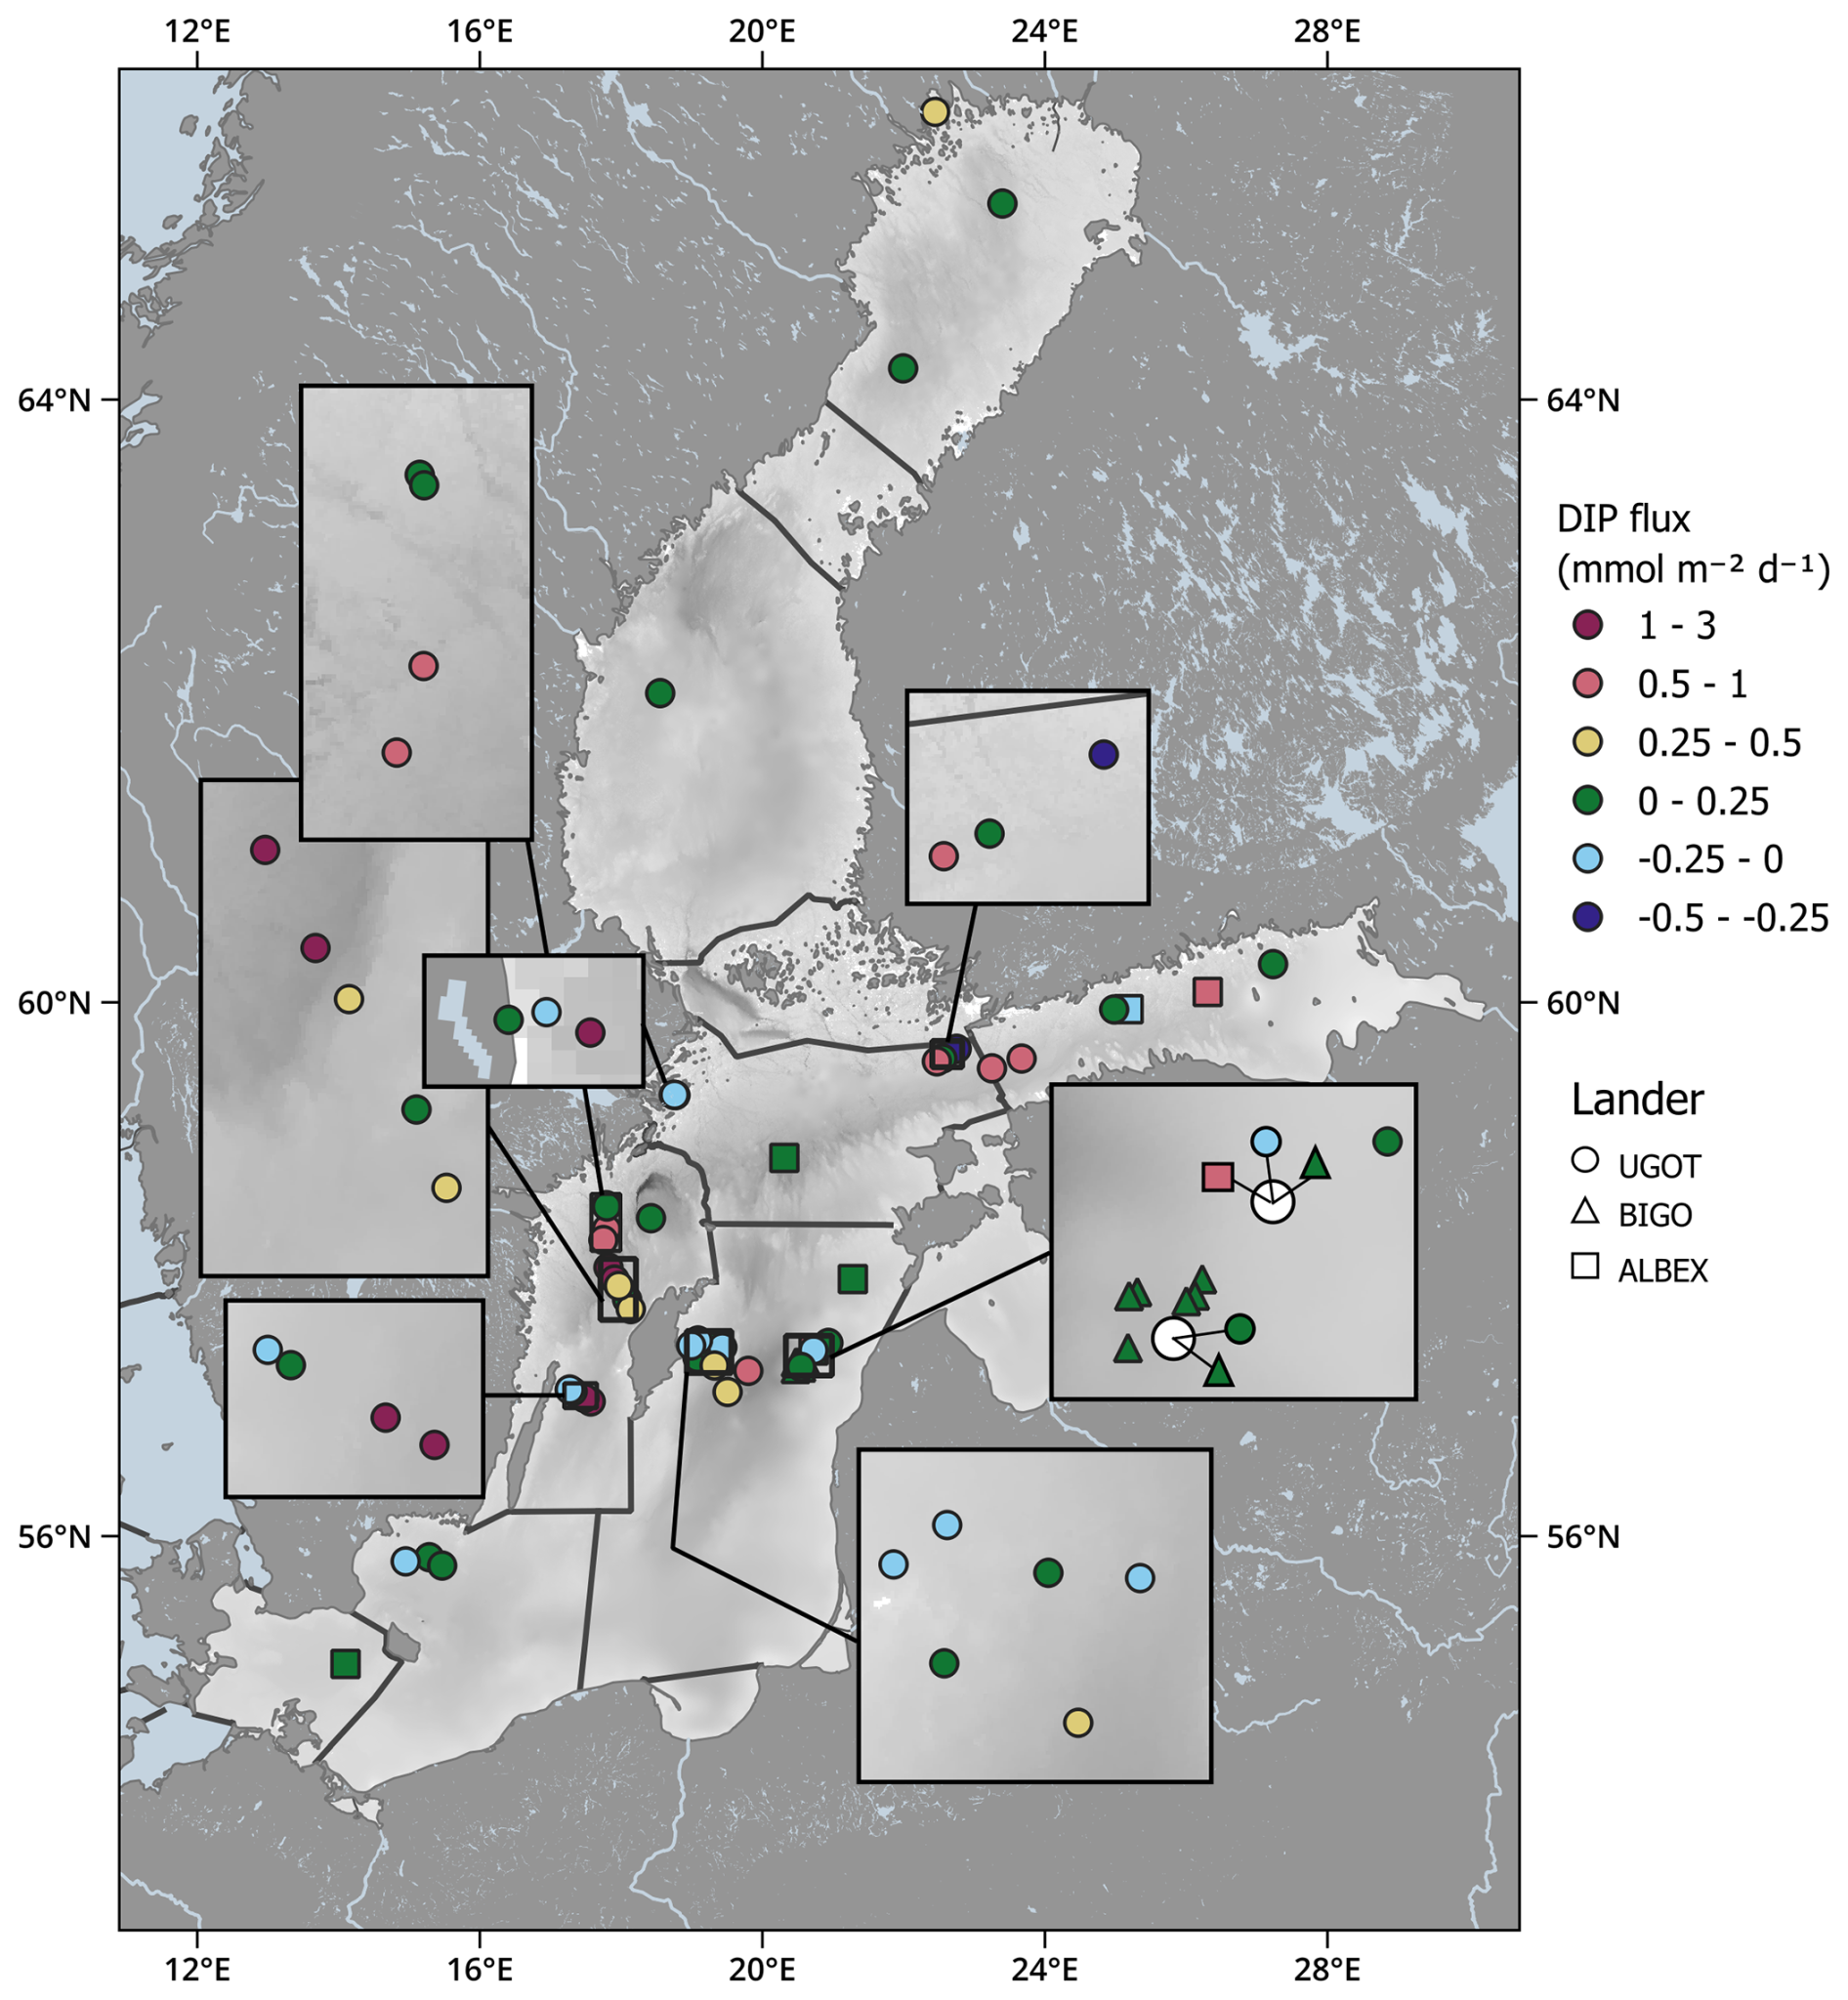
Figure 5Sediment-water fluxes of DIP in the Baltic Sea, as averages of all oxygen conditions and years per station. Data from samplings affected by major Baltic inflows are excluded.
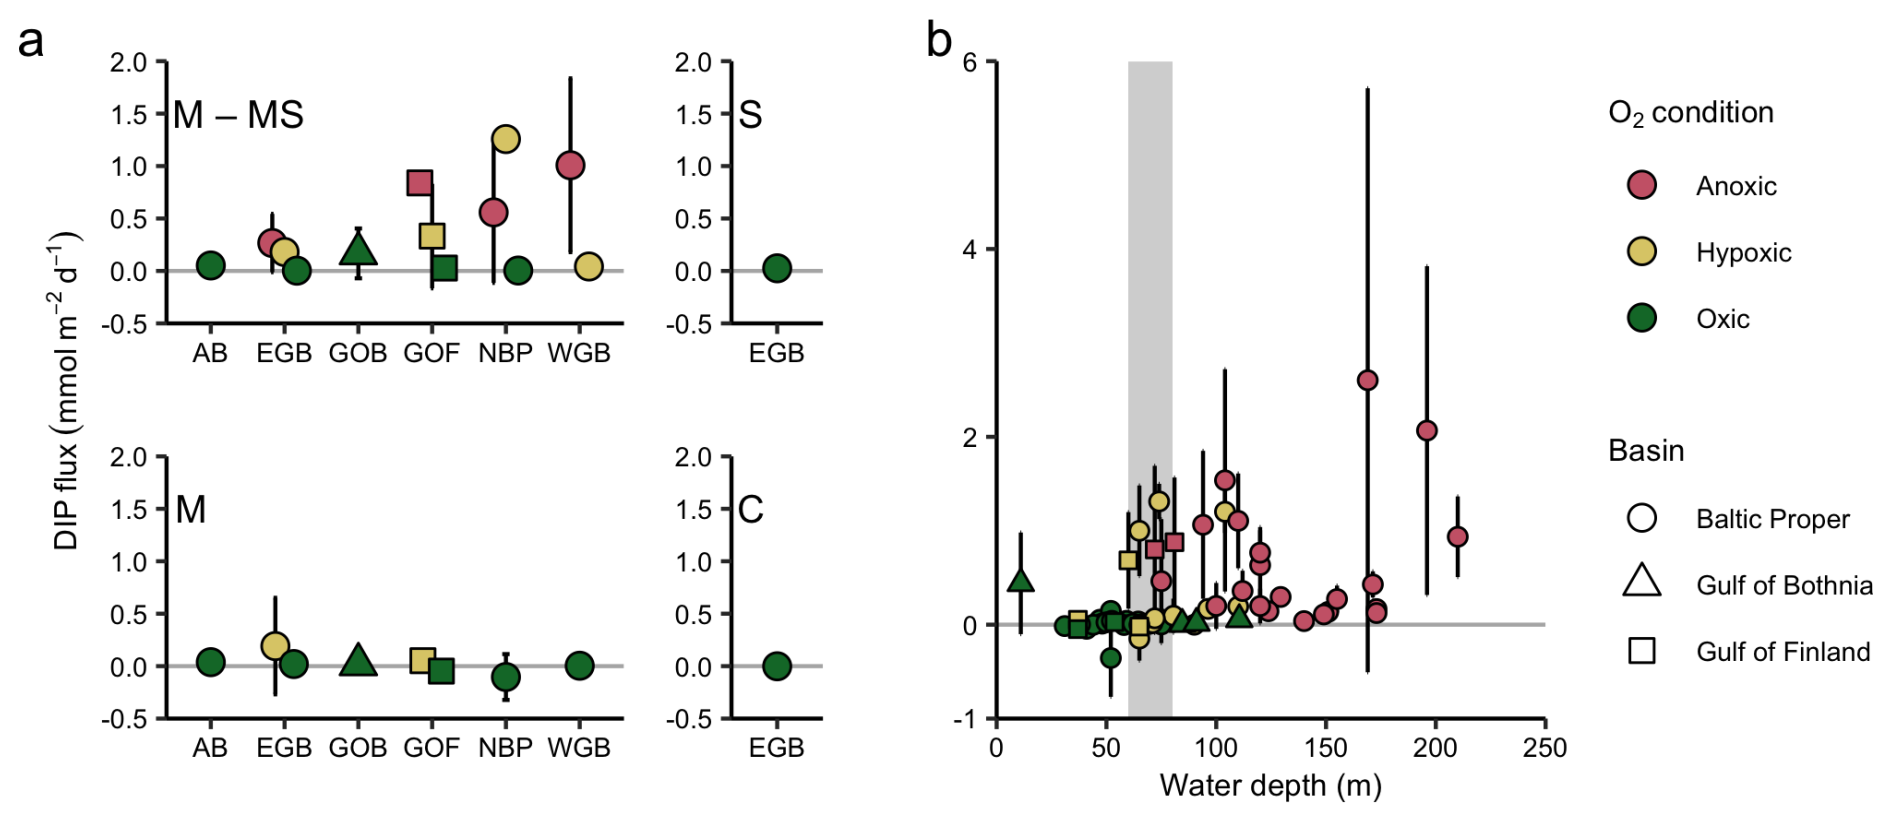
Figure 6(a) Sedimentary flux of DIP at different sediment types, (sub)basins and oxygen (O2) conditions. Sediment types: M–MS = mud – muddy sand, M = mixed, S = sand, C = coarse. Subbasins: AB = Arkona and Bornholm Basin, EGB = Eastern Gotland Basin, GOB = Gulf of Bothnia, GOF = Gulf of Finland, NBP = Northern Baltic Proper, WGB = Western Gotland Basin. (b) Fluxes of DIP versus water depth. Markers are average values for a station and O2 condition; error bars show standard deviations. Data from samplings affected by major Baltic inflows are excluded. The grey area marks the approximate depth of the halocline (60–80 m).
The magnitude of the DIP fluxes differs between subbasins, sediment types and O2 conditions (Fig. 6). The DIP release is generally higher from sediments consisting of mud – muddy sand than from other sediment types, and fluxes are elevated at sites with O2-depleted bottom waters (Fig. 6a). However, stations with mud – muddy sand are overrepresented in the dataset relative to the occurrence of this sediment type in the Baltic Sea (Table A1), and efforts to measure fluxes from other sediment types would likely improve our understanding of spatial differences in the benthic DIP release. Phosphorus dynamics are also strongly impacted by O2 through the adsorption of DIP onto iron oxides, which precipitate in oxic conditions and are reductively dissolved in anoxic conditions (Ruttenberg, 2014; Slomp, 2011). At stations experiencing varying bottom water O2 concentrations, such as stations around the oxycline, it is often unknown how long the site has experienced a specific O2 condition (Fig. 4). In those cases, it is not possible to elucidate whether the measured flux is a short-term response to changing environmental conditions or represents a steady state. Variations in organic matter input can occasionally be detected in the sedimentary DIP release. An increased deposition (and subsequent degradation) of organic matter is seen, for example, in measurements after an MBI in early 2015, which, despite bringing O2 to the central Baltic Proper and initially decreasing the DIP release, later led to an elevated sedimentary DIP efflux due to sediment resuspension and shuttling toward the central part of the EGB (Hylén et al., 2021; Fig. A5).
Despite temporal variations in the sedimentary DIP flux in the Baltic Sea, some spatial trends are clear. The DIP fluxes in the open basins of the Gulf of Bothnia are low and range between 0.01–0.06 mmol m−2 d−1 (Figs. 4–6). The flux is higher (0.44 mmol m−2 d−1) at a shallow site outside a river mouth in the Bothnian Bay (RA2, 12 m depth). Fluxes in shallow, oxygenated parts of the Baltic Proper and Gulf of Finland are similarly low or even negative, ranging between −0.35–0.15 mmol m−2 d−1. There are two areas of elevated DIP release (1–3 mmol m−2 d−1, Fig. 6b): one at or just below the halocline and the second in the deepest parts of the Baltic Proper basins. This pattern has been attributed to the shuttling of organic and inorganic particles from shallow to deep areas (Jilbert et al., 2011; Nilsson et al., 2019; Turnewitsch and Pohl, 2010). Iron oxides release adsorbed DIP upon reductive dissolution under the hypoxic-anoxic interface prevailing below the halocline, and organic matter is funnelled toward depocenters in the deeper parts of the basin, where it produces DIP when remineralised.
3.2 Integrated sedimentary release of DIP
The calculated integrated sedimentary DIP release represents 92 % of the Baltic Sea area after removal of the Gulf of Riga, the Gdansk Bay, and the archipelago areas in Sweden and Finland (Fig. 2). While the GOB is not impacted by O2 depletion and therefore is assumed to have the same DIP flux all three years for which the calculation is carried out, the areal extent of O2 depletion shifts between years in the other basins. The subbasins in the central Baltic Proper (EGB, NBP, WGB) are most affected by O2 depletion, and the hypoxic and anoxic areas range from 8 % to 30 % and 15 % to 44 % of the total area, respectively (Fig. A4, Table A3). The extent of anoxic and hypoxic areas is reflected in the integrated DIP release, with a higher release when the areal extent of the O2-depleted water is largest (Fig. 7a). Accordingly, the calculated integrated sedimentary DIP release for the entirety of the Baltic Sea is 389, 454 and 484 kton yr−1 during the smallest (2004), medium (2013) and largest (2018) extent of O2-depleted seafloor, respectively (Fig. 7). Individual subbasins do not always show the same temporal trends in DIP release as the Baltic Sea as a whole, but are dependent on the local extent of O2 depletion (Fig. A6, Table A3). The contribution from the subbasins to the total integrated DIP release further depends on their size (Table A3). While about a quarter of all sedimentary DIP release in the Baltic Sea occurs in the EGB (Fig. 7a), this high contribution is due to the large area of the EGB since the areal DIP release is considerably lower in this subbasin than in the NBP and WGB (Fig. 7b).
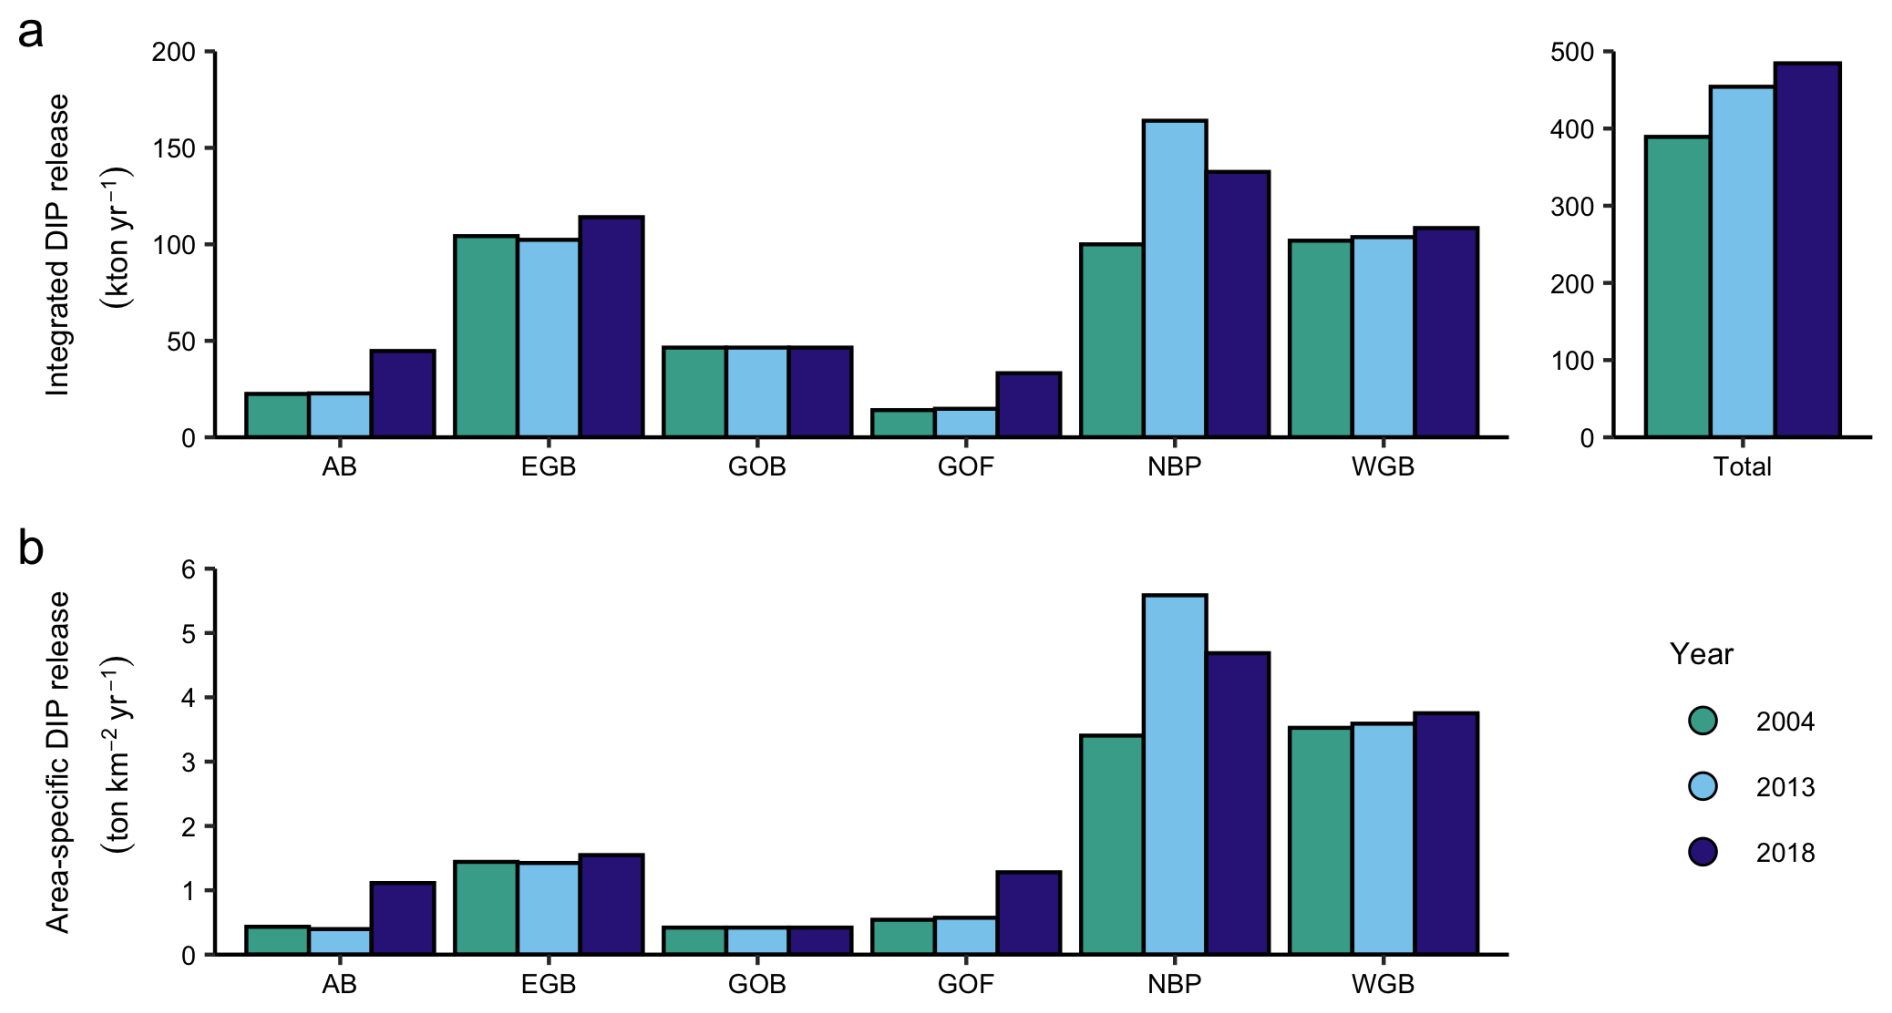
Figure 7Basin-wide sedimentary release of dissolved organic phosphorus (DIP) calculated from the in situ measured fluxes for three years with different extents of bottom-water oxygen depletion. Subbasins: AB = Arkona and Bornholm Basin, EGB = Eastern Gotland Basin, GOB = Gulf of Bothnia, GOF = Gulf of Finland, NBP = Northern Baltic Proper, WGB = Western Gotland Basin. (a) The integrated sedimentary DIP release. (b) Average area-specific sedimentary DIP release.
It should be noted that the DIP release obtained through our upscaling does not equal the net amount of DIP becoming available in the water column and surface water since manganese and iron oxide formed at the water column oxycline scavenge a considerable amount of the DIP released from sediments (0.02–0.04 mmol m−2 d−1 in the EGB, or 5 %–22 % of the sedimentary DIP release in hypoxic-anoxic parts of the EGB; Turnewitsch and Pohl, 2010). This mechanism traps the DIP at or below the oxycline and causes intense recycling in the deep parts of the anoxic basins. The calculated integrated sedimentary DIP release in the Baltic Proper is considerably higher than previous estimates based on upscaling of in situ measurements (308–365 kton yr−1 vs 110–150 kton yr−1 from Noffke et al. (2016) and Viktorsson et al. (2013)), but is smaller than a previous estimate from the Gulf of Finland (14–33 kton yr−1 vs 66 kton yr−1 in Viktorsson et al. (2012)). The upscaling calculations in the previous studies included fewer flux measurements, were based on DIP fluxes averaged over certain depth intervals (without considering the extent of different sediment types), and only accounted for anoxic sediments or depths greater than 60 m in the case of the Baltic Proper.
3.3 Limitations and potential applications
The coverage of in situ DIP flux measurements is good in fine-grained sediments; however, the assembled data reveals a lack of measurements in the Gulf of Riga and the Gdansk Bay and shows that few measurements have been conducted in coastal and shallow areas. Sandy and coarse sediments are also underrepresented in the measurements, likely due to the challenges these substrates pose to in situ benthic chamber incubations (Janssen et al., 2005; Kononets et al., 2021). Furthermore, due to challenging weather and storms, which make lander operations risky (Kononets et al., 2021), few flux measurements were conducted during the winter months. The lack of measurements from certain parts of the Baltic Sea and certain seasons might lead to errors in the upscaling calculations. For example, DIP fluxes could be low in coastal sediments where a high input of iron from land, low salinities, and high burial rates cause efficient trapping of P through adsorption to iron oxides and precipitation of vivianite (Carstensen et al., 2020; van Helmond et al., 2020; Slomp et al., 2013). The low primary production and settling of organic matter during the winter months would also be expected to result in a decreased benthic DIP flux compared to the rest of the year. Hence, an underrepresentation of potentially low or negative DIP fluxes in the dataset means we might overestimate the integrated sedimentary DIP release. When interpreting the upscaling results, it is also important to note that HELCOM's Baltic Sea subbasin boundaries do not reflect natural sediment gradients. Dividing benthic DIP fluxes according to administrative boundaries is relevant from a management perspective but could result in grouping data representing differing environmental conditions.
Since the same sites have not been sampled in more than one to two seasons, the dataset has limited use for interpreting seasonal trends. However, the dataset is sufficiently large to show clear spatial trends in the benthic DIP flux in the Baltic Sea (Fig. 6). The data cover different sediment types, geochemical conditions, salinities, and levels of O2 depletion, making it suitable for validating biogeochemical models. Furthermore, since high water column P concentrations have sustained the eutrophication of the Baltic Sea, data on the input and output of P are critical to deciding on mitigation measures. The presented dataset can be used to locate hot spots of sedimentary DIP release and evaluate the outcomes of mitigation attempts.
All geochemical data described in this paper are available from Zenodo (Hylén et al., 2025, https://doi.org/10.5281/zenodo.14812160). Seabed substrates can be accessed from EMODnet Bathymetry Concortium, 2022 (https://emodnet.ec.europa.eu/geonetwork/srv/eng/catalog.search#/metadata/6eaf4c6bf28815e973b9c60aab5734e3ef9cd9c4, last access: 25 August 2025), Swedish and Finnish coastal areas are available from HELCOM, 2022a (https://metadata.helcom.fi/geonetwork/srv/eng/catalog.search#/metadata/67d653b1-aad1-4af4-920e-0683af3c4a48, last access: 25 August 2025), and subbasin boundaries from HELCOM, 2022b (https://metadata.helcom.fi/geonetwork/srv/eng/catalog.search#/metadata/1456f8a5-72a2-4327-8894-31287086ebb5, last access: 25 August 2025). For the extents of O2-depleted areas, contact SMHI.
The described dataset combines DIP fluxes measured in situ in the Baltic Sea with key environmental variables regulating benthic Phosphorus cycling. The data cover the main subbasins in the Baltic Sea and contain several stations visited on multiple occasions and during varying bottom-water O2 conditions. As such, the dataset gives valuable information about spatial patterns in the sedimentary DIP release. With this dataset, we present novel estimates of the integrated annual sedimentary DIP release for the entire Baltic Sea, derived from measured fluxes and environmental parameters. The integrated annual sedimentary DIP release was estimated for three different years (2004, 2013 and 2018) representing different areal extents of bottom water oxygen depletion, suggesting a total sedimentary DIP release of 389–484 kton yr−1. It should be noted, however, that the benthic DIP release does not constitute a new input of P to the Baltic Sea but is the result of internal recycling. The efflux can only be seen as a net P input to the water column when previously oxic areas become anoxic, and reductive dissolution of iron and manganese oxides releases DIP stored in the sediment. The fluxes measured with the benthic chamber landers are generally of very high quality, and a rigorous statistical quality control procedure has been established to evaluate the data. Measurements conducted by different benthic chamber landers at sites in close proximity further show good agreement. The dataset can thereby reliably be used to investigate mechanisms relevant to benthic phosphorus cycling, to validate biogeochemical models, and to inform management about areas suitable for eutrophication mitigation attempts.
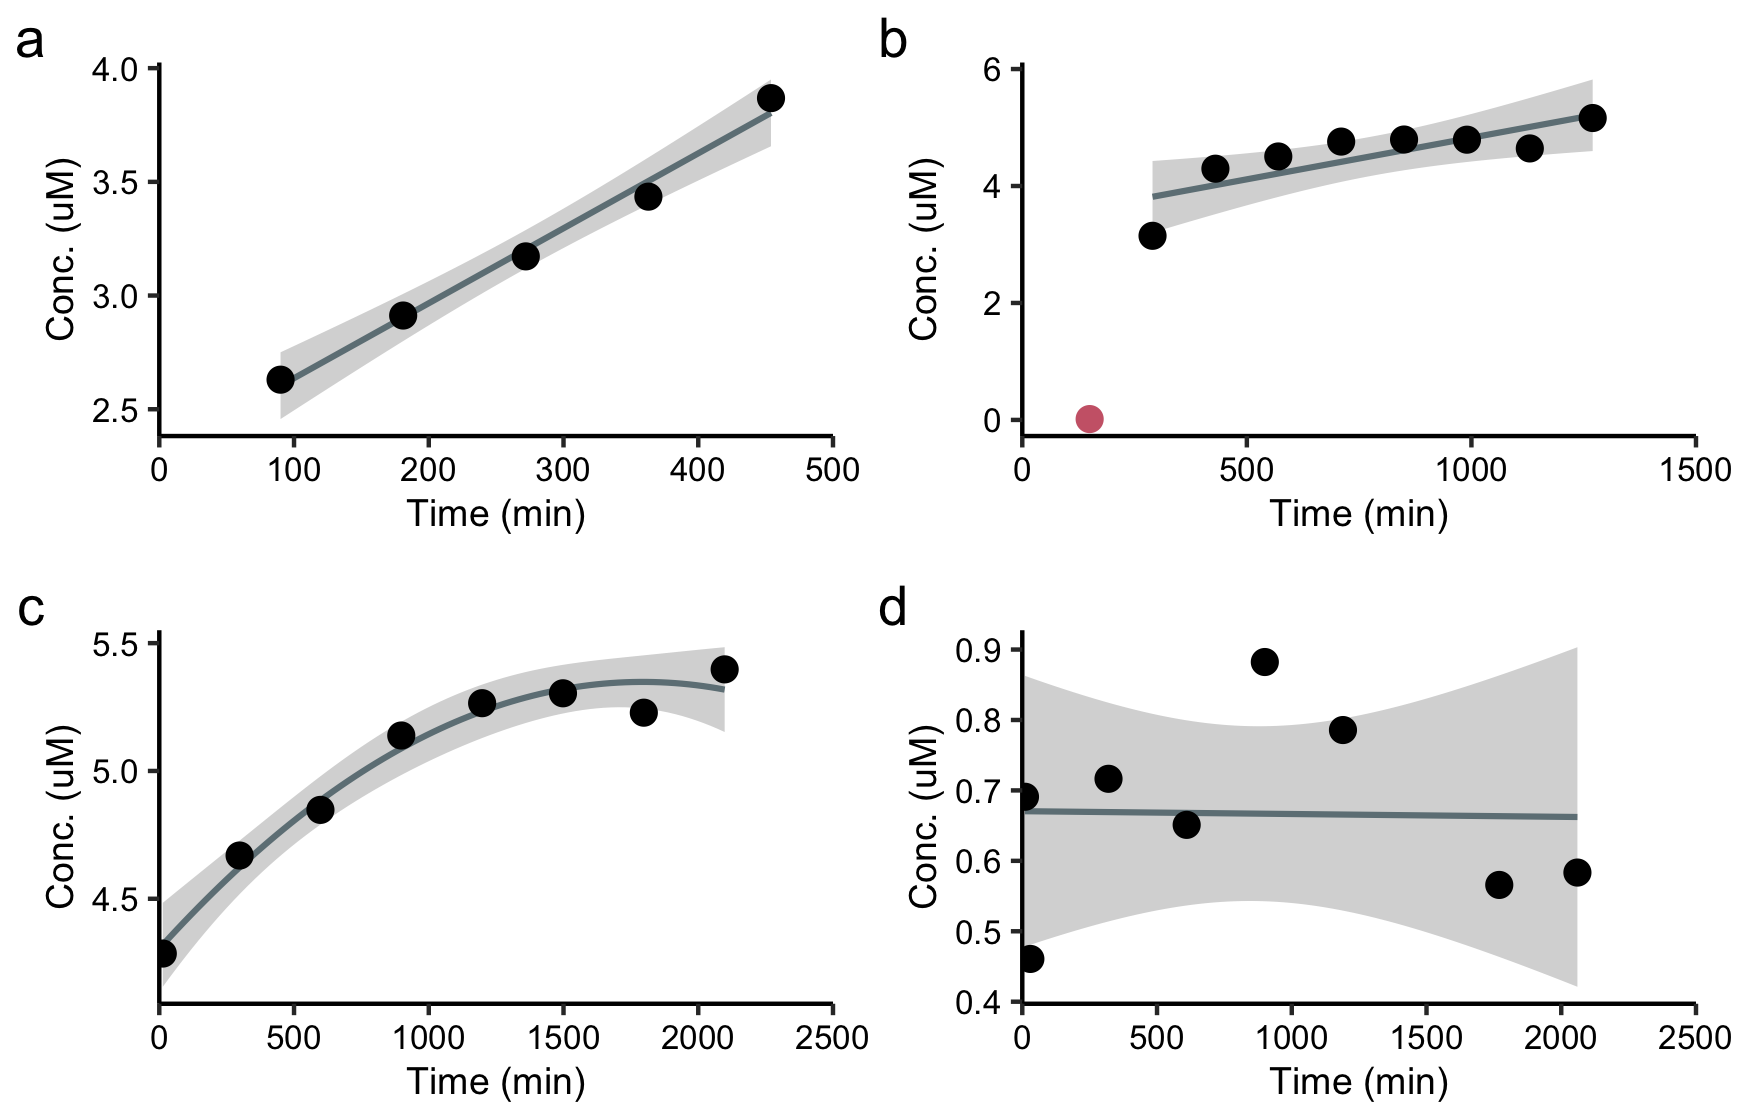
Figure A1Examples of incubation data used to calculate fluxes of DIP, showing regression lines (dark grey) with a 95 % confidence interval (light grey). (a) Station 311 in 2016, ALBEX lander deployment 2, chamber 1. Flux 0.73 mmol m−2 d−1, simple linear fit, p-value of slope < 0.01. (b) Station D in 2008, UGOT Big Lander deployment 1, chamber 3. Flux 0.40 mmol m−2 d−1, simple linear fit with one outlier (red) removed, p-value of slope < 0.05. (c) Station G7 in 2013 BIGO lander deployment 1, chamber 1. Flux 0.23 mmol m−2 d−1, quadratic fit, p-value of slope < 0.001. (d) Station W015 in 2020, UGOT Big Lander deployment 1, chamber 2. Flux −0.001 mmol m−2 d−1, simple linear fit, p-value of slope 0.96.
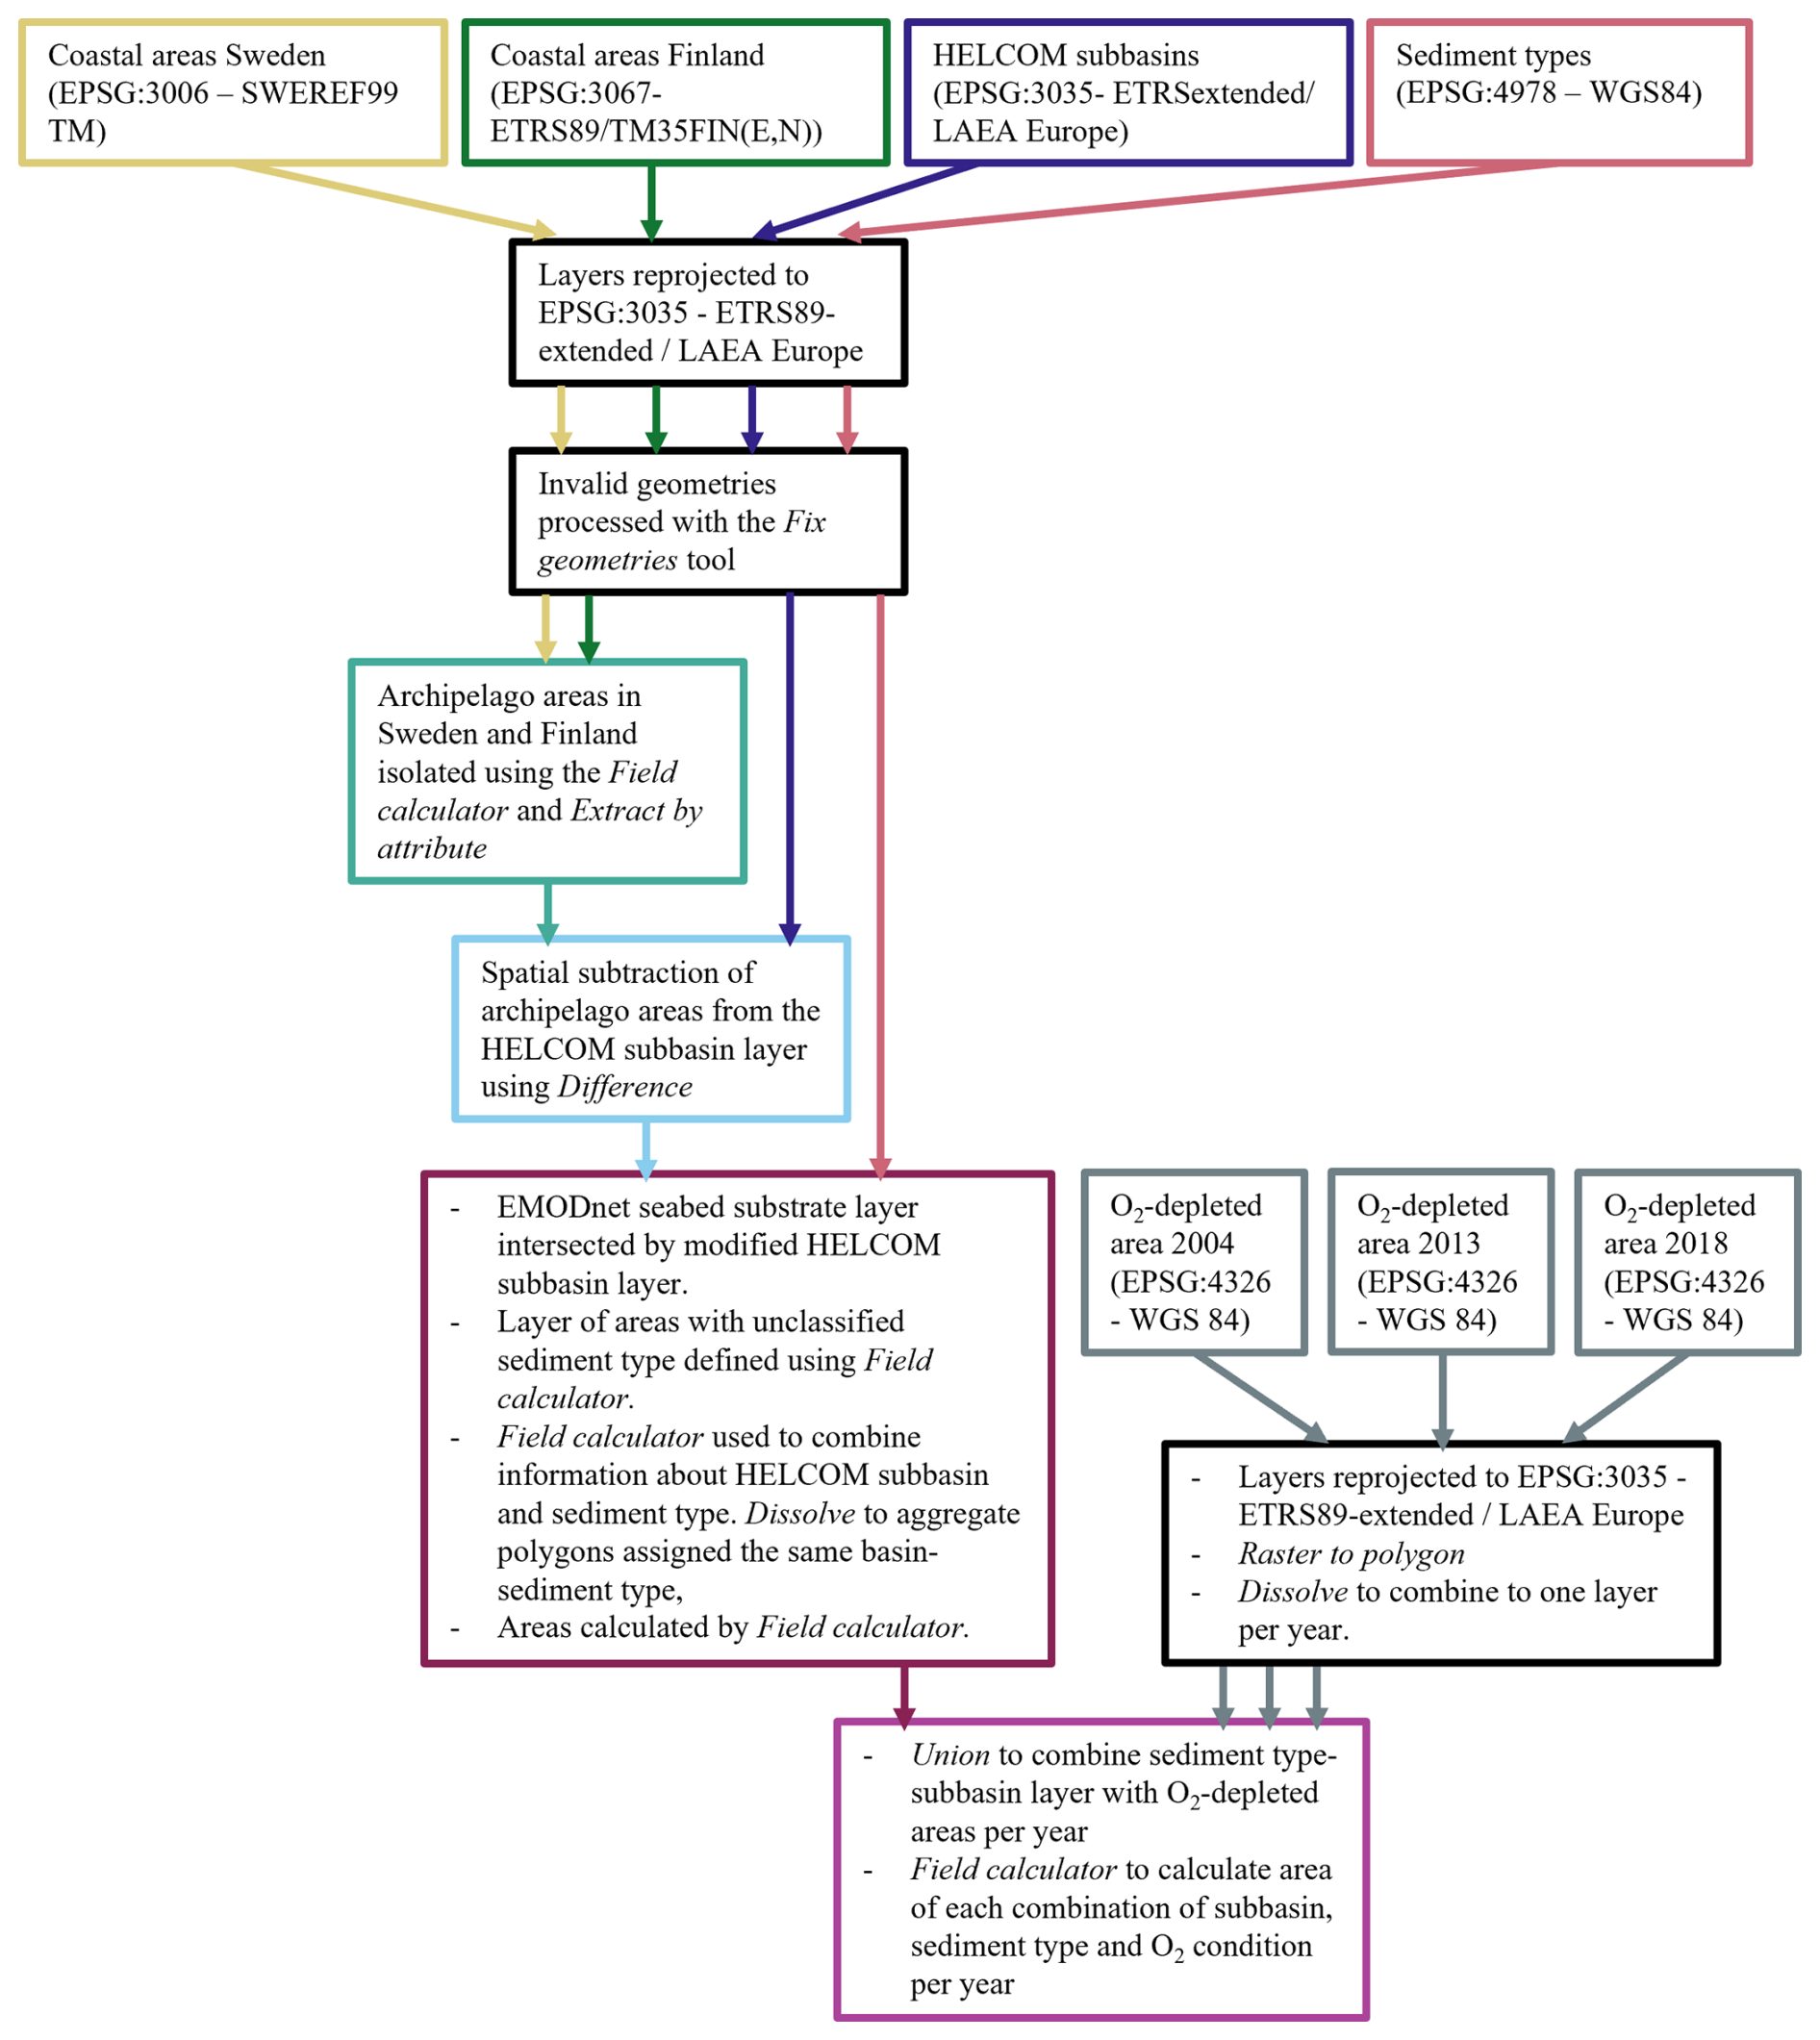
Figure A2Schematic description of the QGIS operations to obtain the areas for calculating the integrated sedimentary release of DIP in the Baltic Sea.
Table A1Sediment type definitions used in the Folk 5 classification scheme (Kaskela et al., 2019).
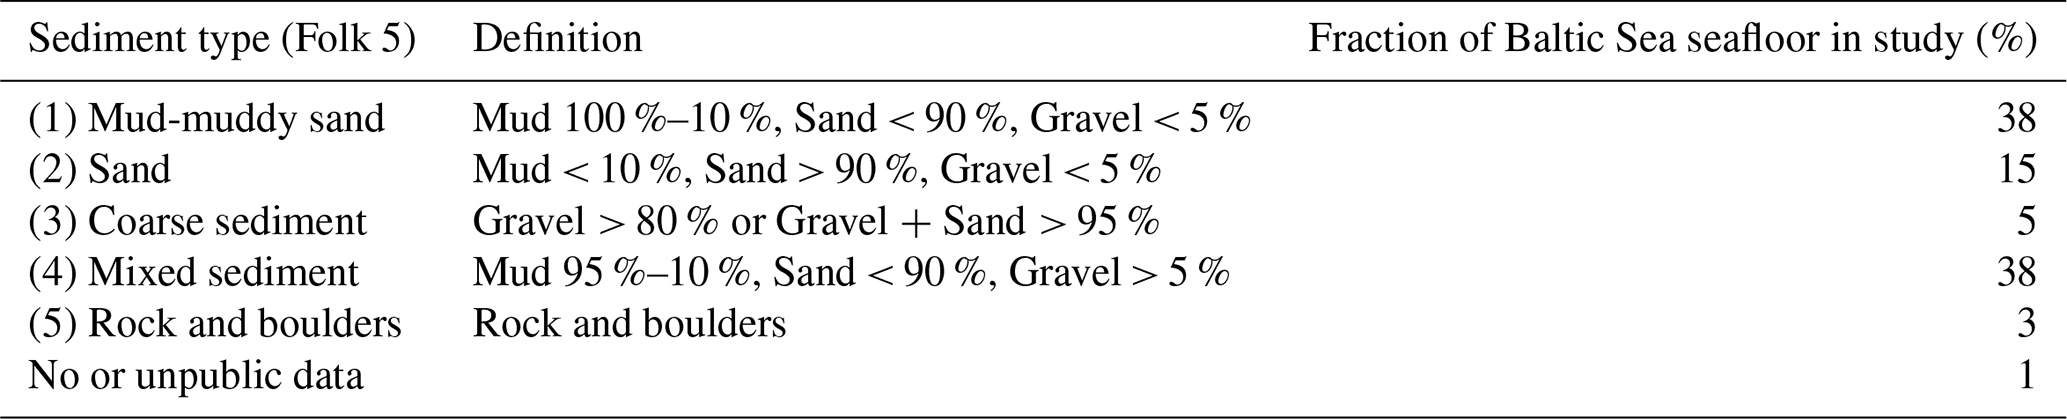
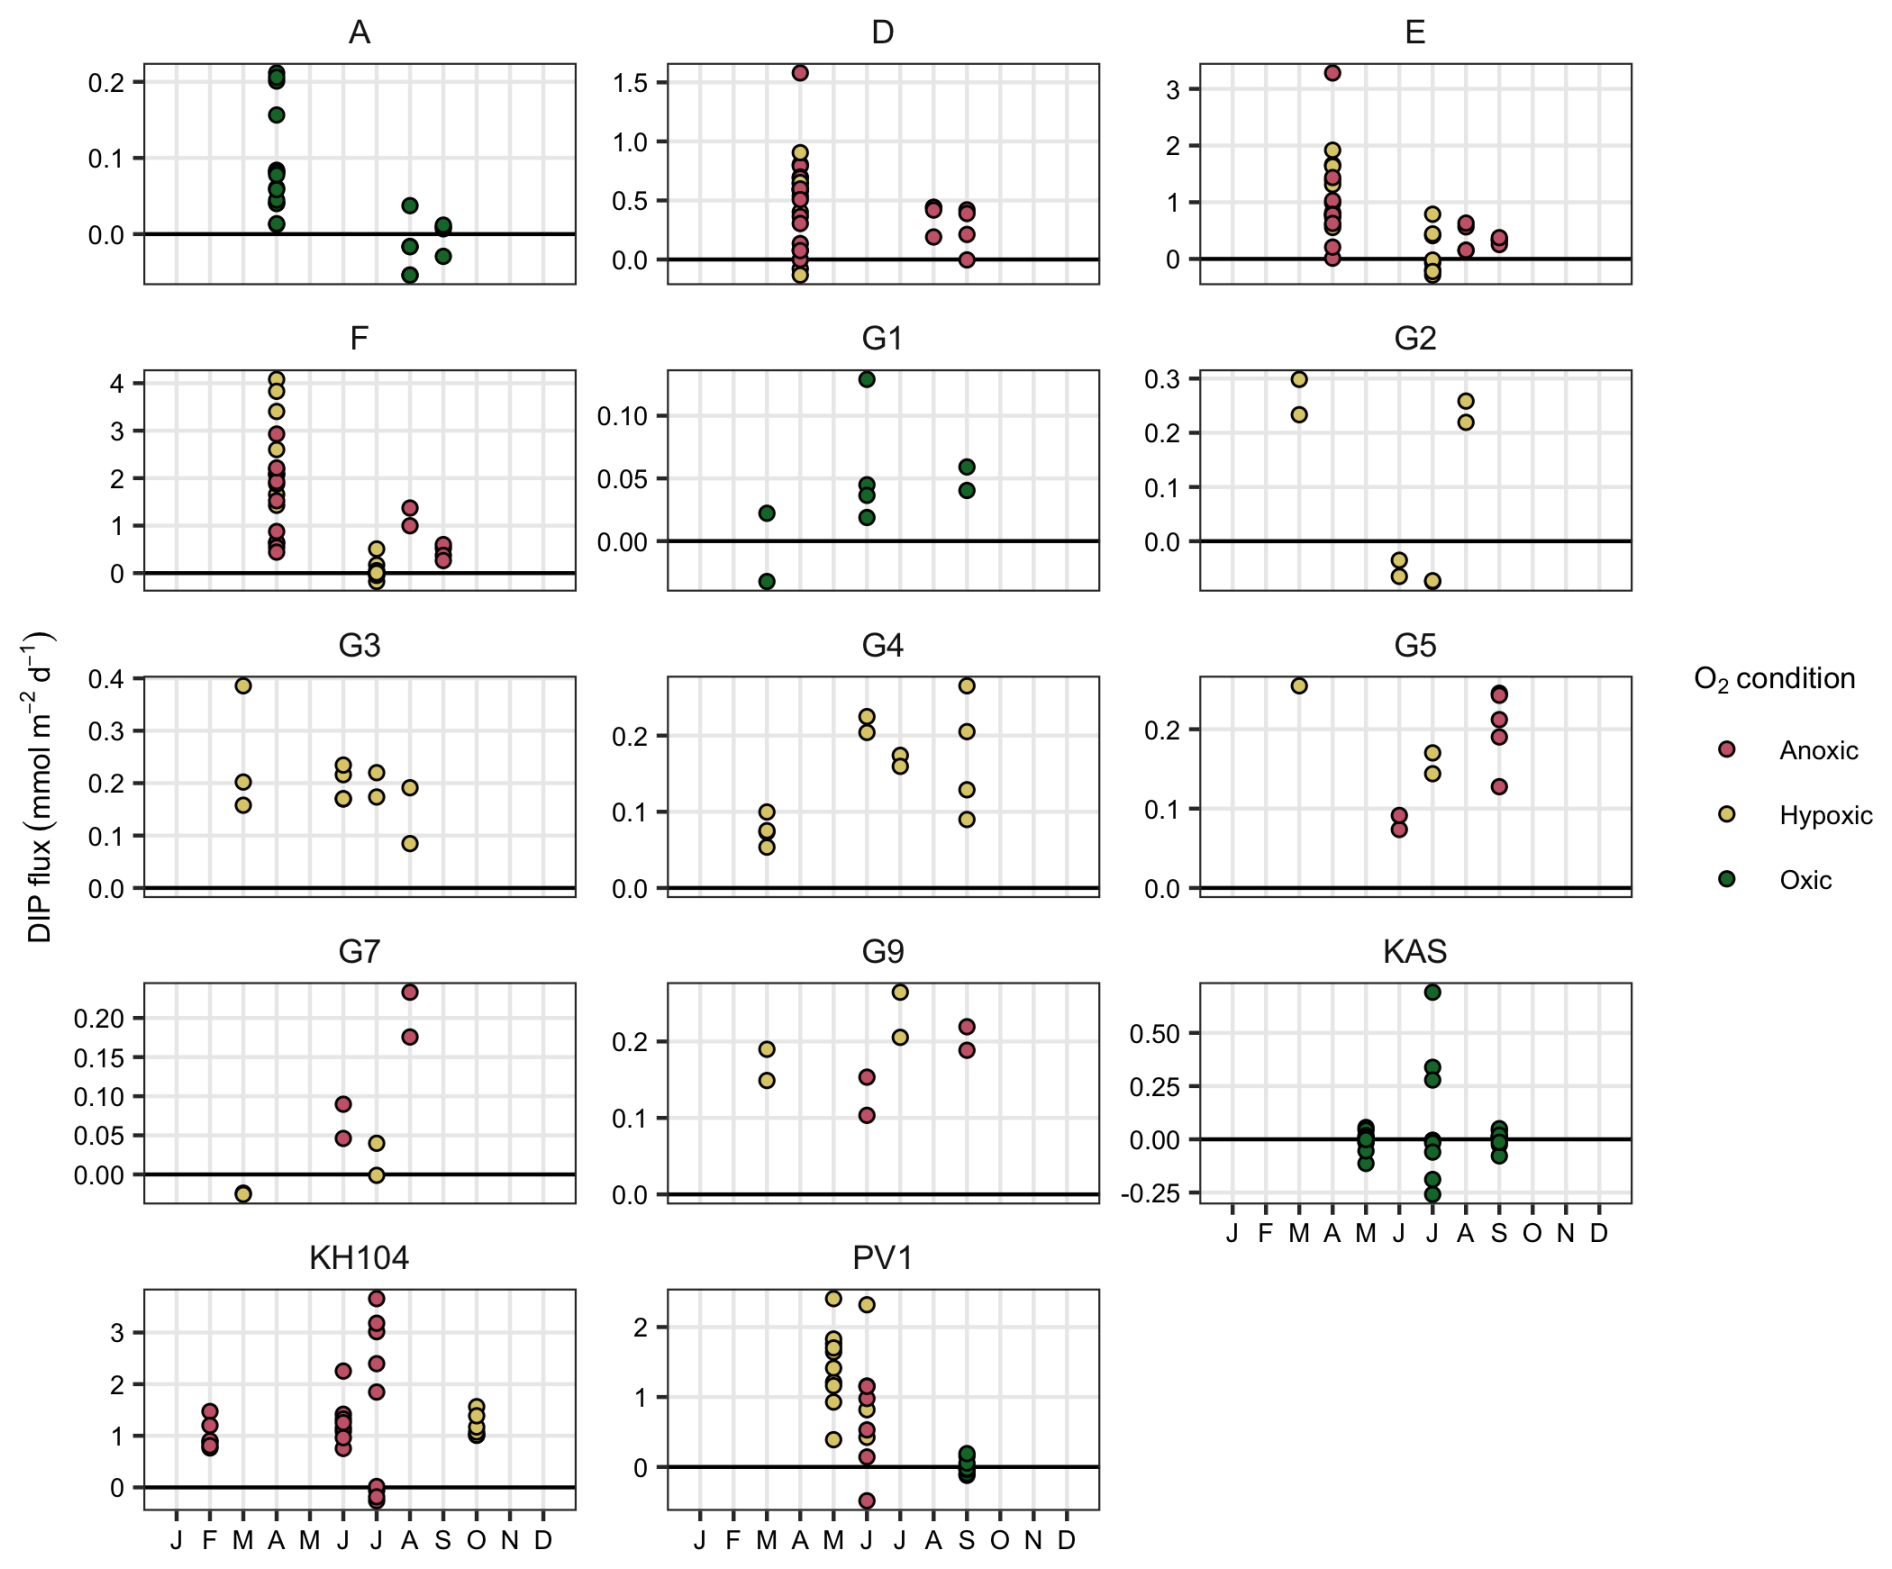
Figure A3Fluxes of DIP at stations sampled in at least three different months. In all cases except for station KH104, the samplings were not conducted within the same year.
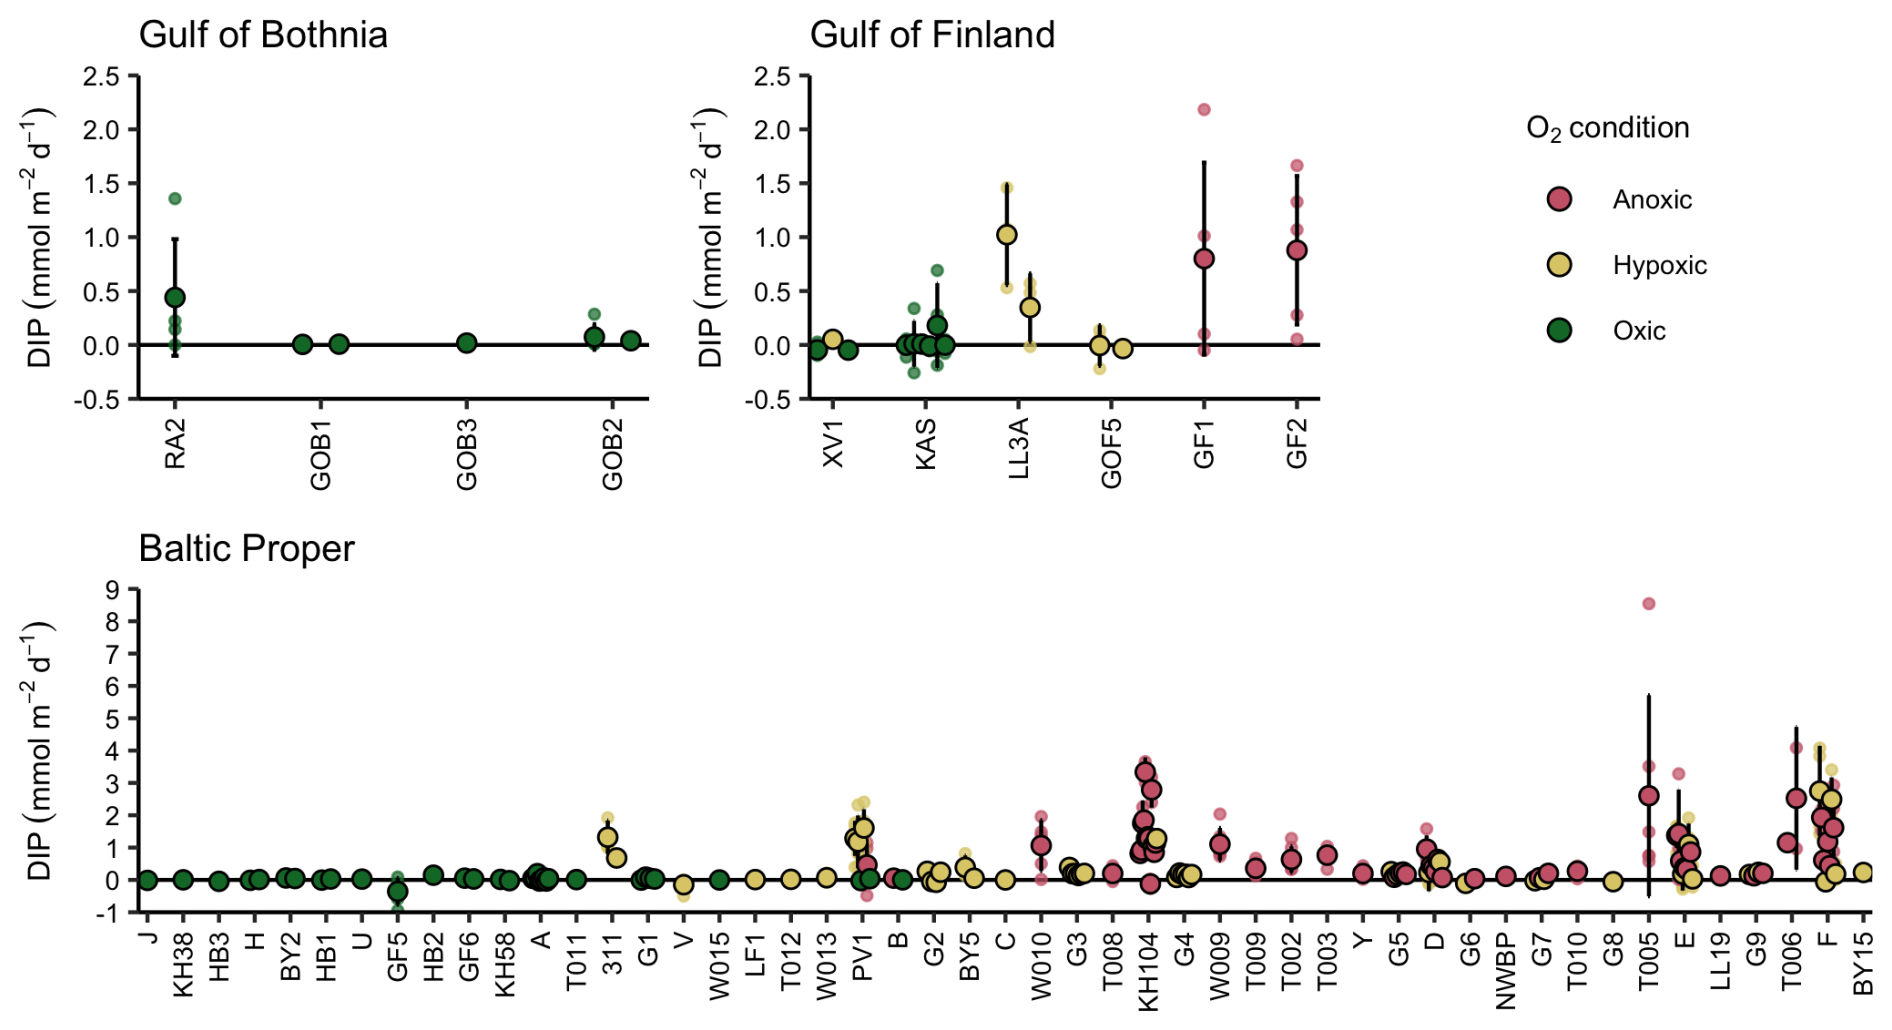
Figure A4Fluxes of dissolved inorganic phosphorus (DIP) with increasing depth (left to right). Small points indicate fluxes per chamber, large points indicate the mean flux per lander deployment, and the error bars show the standard deviation per deployment.
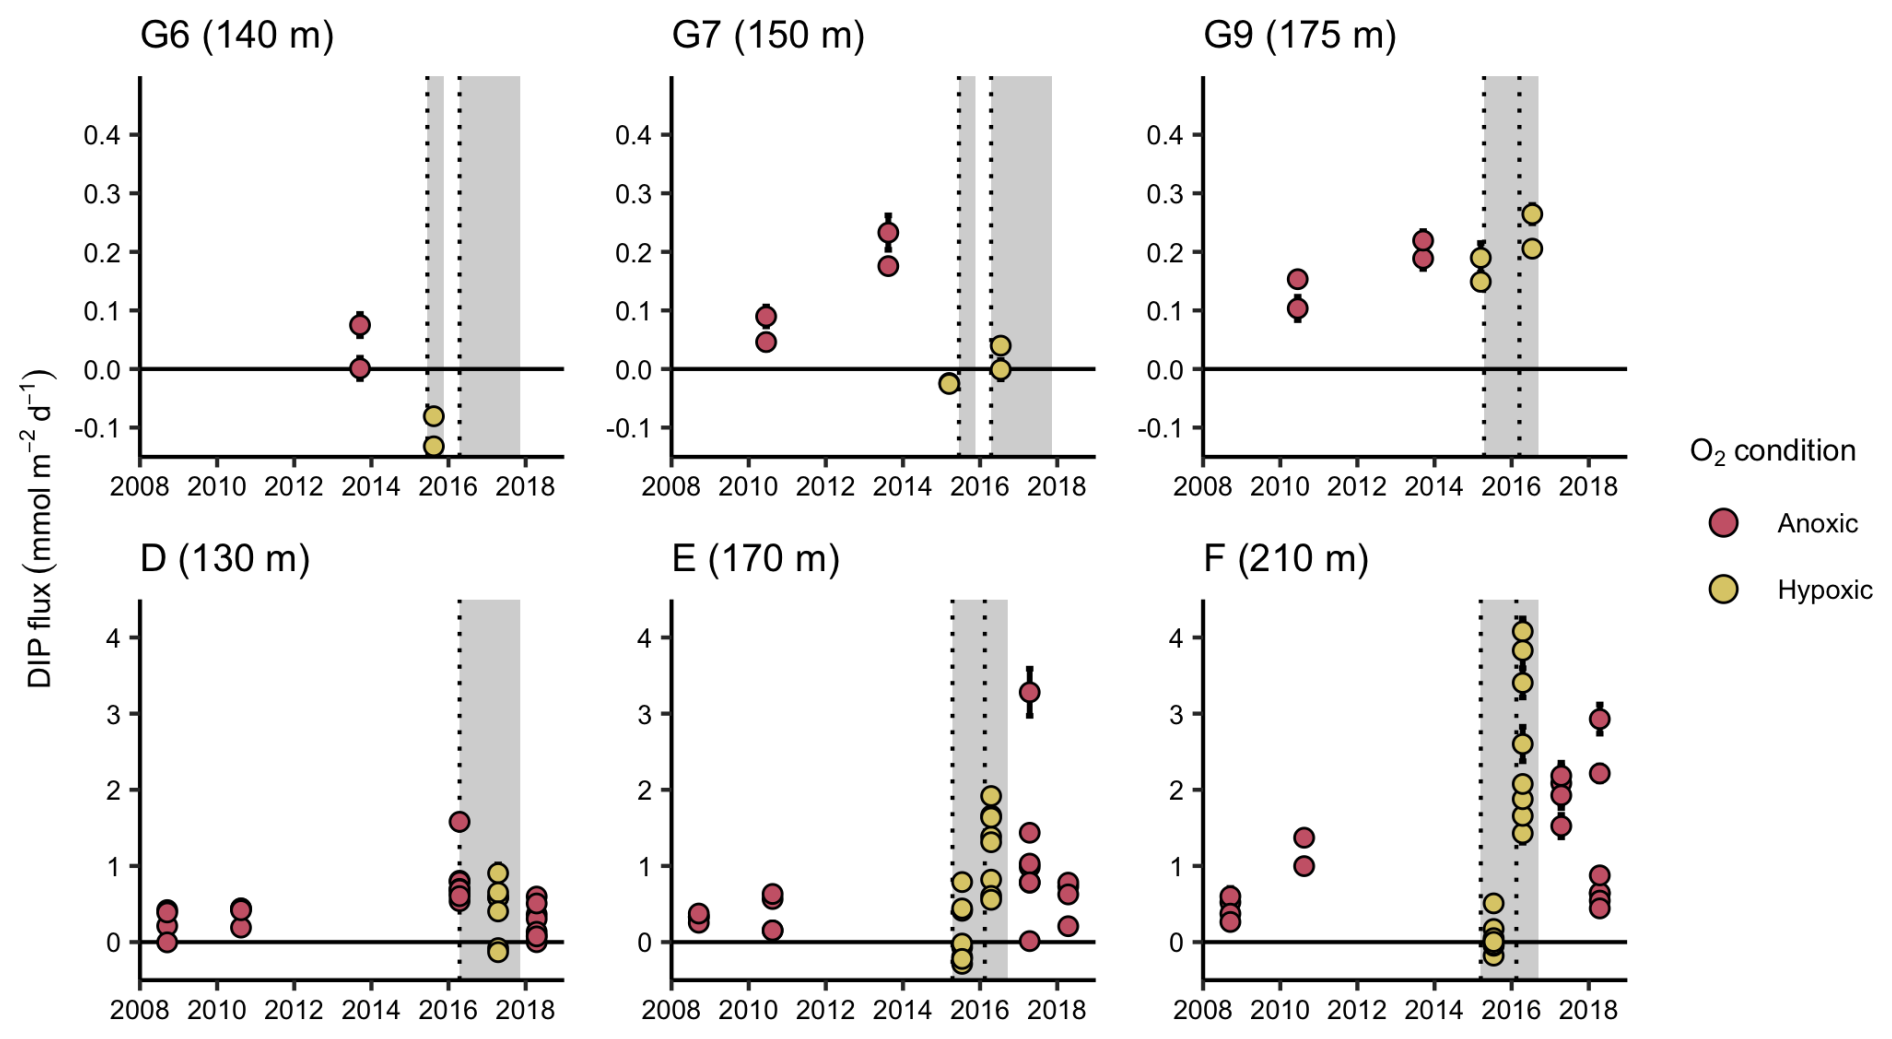
Figure A5Fluxes of DIP at stations affected by major Baltic inflows (MBIs). Stations G6, G7 and G9 are situated on the eastern side of the Eastern Gotland Basin, and stations D, E and F are situated on the western side and central part of the Eastern Gotland Basin. The timings of inflows are marked with dotted lines, and periods with oxygen (O2) in the water are marked with grey shading (water column O2 data from station BY15, SHARKweb SMHI, downloaded 20 November 2024). Error bars show the standard error of the flux.
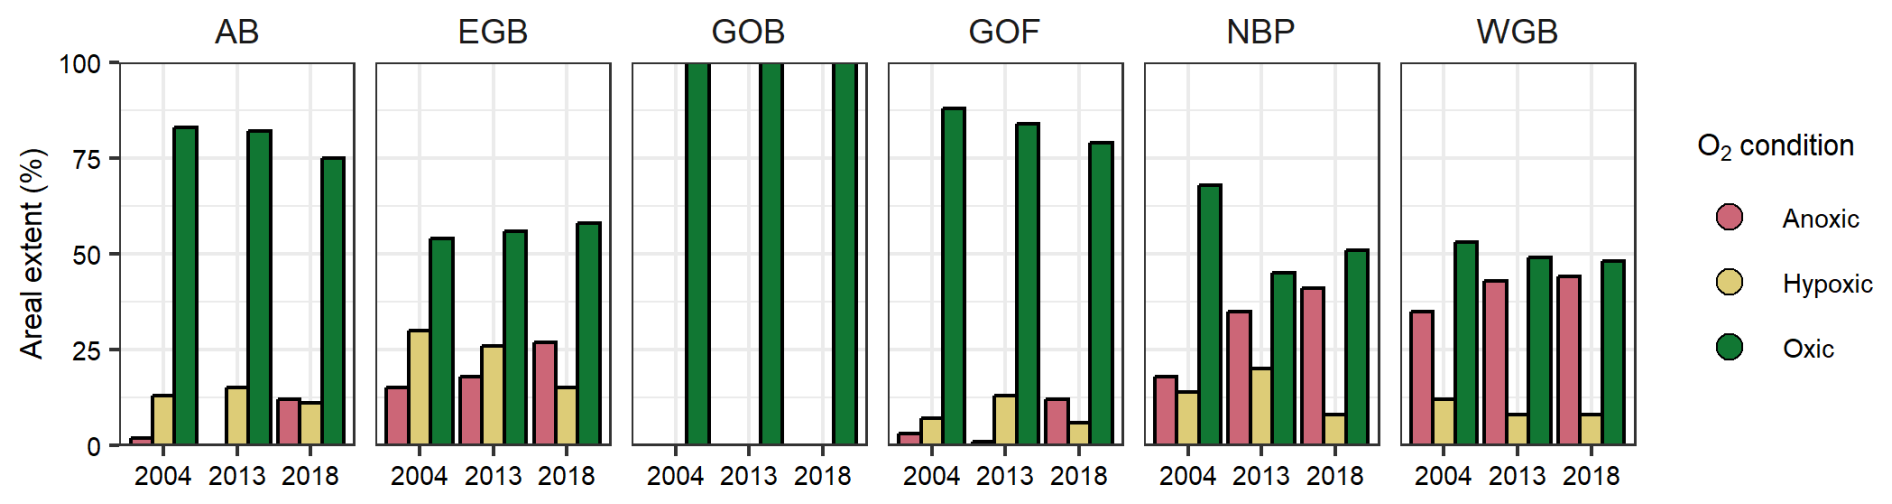
Figure A6Percentage of bottom area with anoxic, hypoxic and oxic bottom water in the three years used to calculate the integrated sedimentary release of DIP in the Baltic Sea. Subbasins: AB = Arkona and Bornholm Basin, EGB = Eastern Gotland Basin, GOB = Gulf of Bothnia, GOF = Gulf of Finland, NBP = Northern Baltic Proper, WGB = Western Gotland Basin.
Table A2Classification of flux data based on combination of subbasin, oxygen condition and sediment type for calculations of the integrated sedimentary release of DIP in the Baltic Sea. Italics mark when stations from other subbasins have been used for the classification.
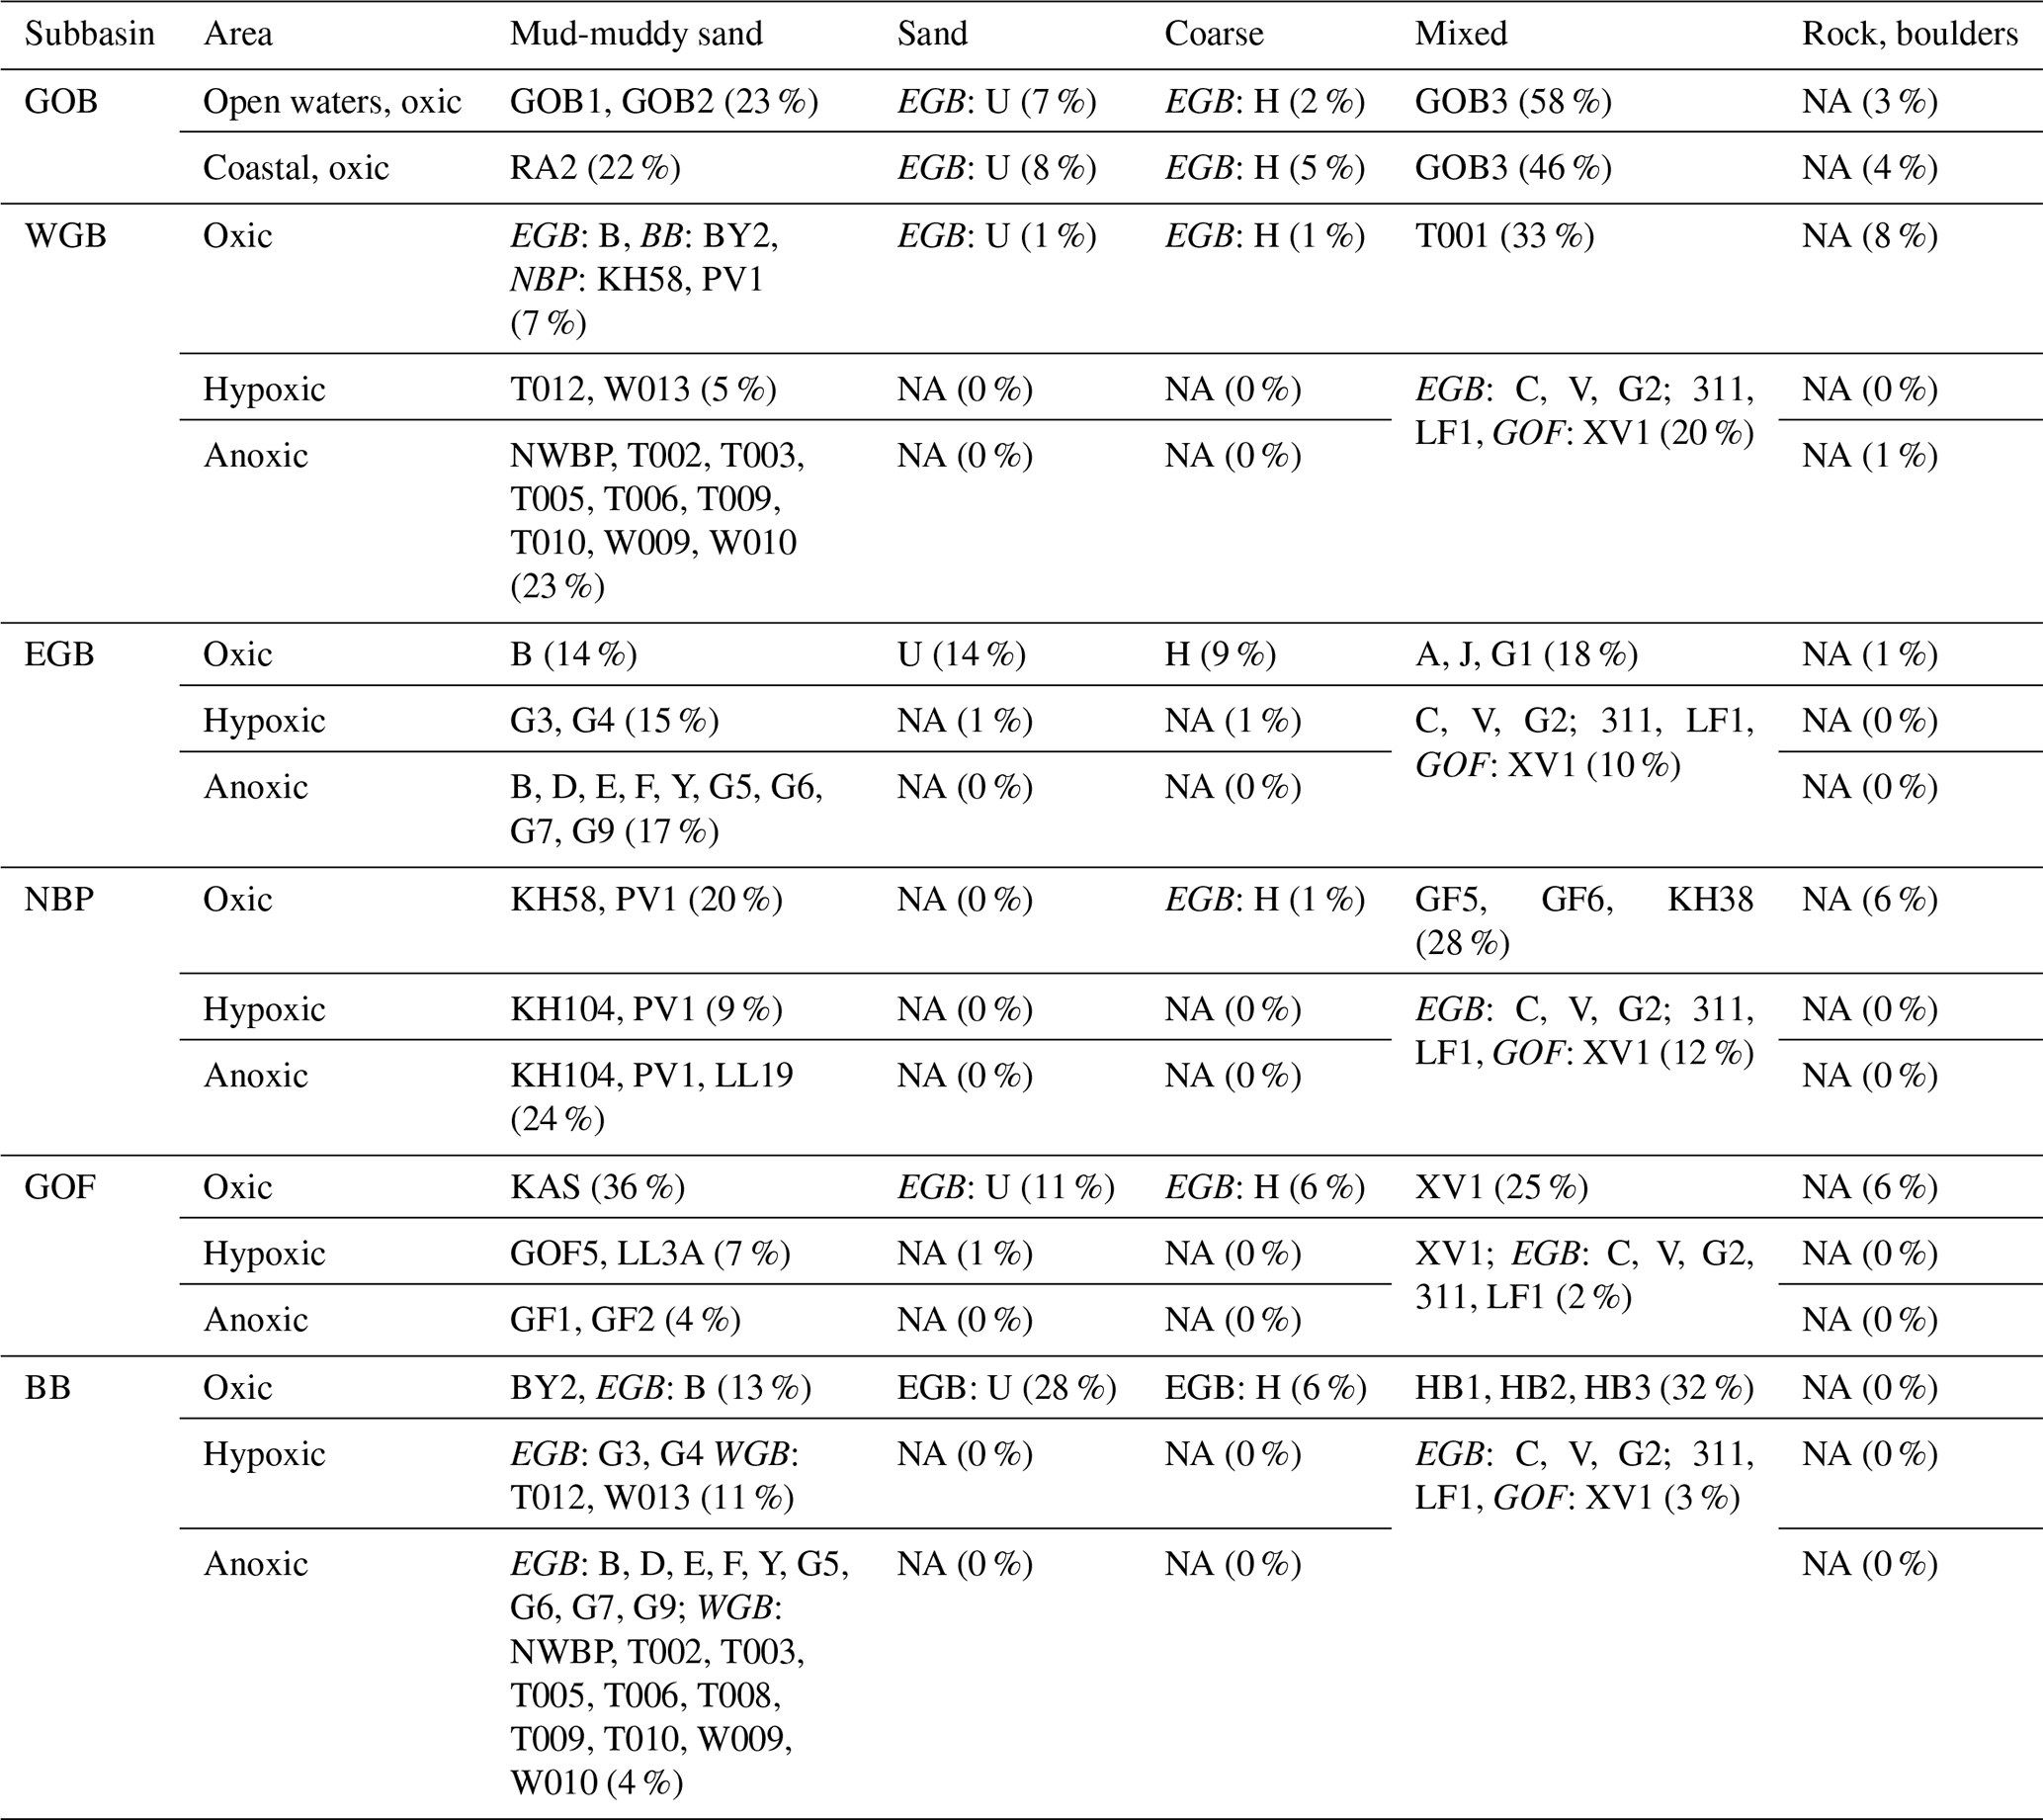
Table A3Areas and resulting integrated fluxes of DIP for individual combinations of subbasin, sediment type and oxygen (O2) conditions. S = sand, C = coarse, M = mixed, M-MS = mud-muddy sand, O = oxic, H = hypoxic, A = anoxic, HA = hypoxic and anoxic.
AH, NE, AD, MK, WL, AT, SV, SeS, CS and PH conducted the field work. AH and NE assembled the data. AH evaluated the flux data, produced the figures and wrote the original draft of the manuscript. NE, HB and AP conducted the upscaling calculations. SeS, CS and POJH obtained funding for the data collection. All authors contributed to the writing of the final version of the manuscript.
At least one of the (co-)authors is a member of the editorial board of Earth System Science Data. The peer-review process was guided by an independent editor, and the authors also have no other competing interests to declare.
Publisher’s note: Copernicus Publications remains neutral with regard to jurisdictional claims made in the text, published maps, institutional affiliations, or any other geographical representation in this paper. While Copernicus Publications makes every effort to include appropriate place names, the final responsibility lies with the authors. Views expressed in the text are those of the authors and do not necessarily reflect the views of the publisher.
We thank the captains and crews on the research vessels Skagerak, Fyrbyggaren, KBV005, Aranda, Poseidon, and Alkor for skilful support at sea and the dozen scientists who assisted with sampling during these research expeditions. Lena Viktorsson and Martin Hansson at the Swedish Meteorological and Hydrological Institute (SMHI) are thanked for providing data on the extent of oxygen-depleted waters. The Swedish Agency for Marine and Water Management, the main funder of the study, has been granted a permit to disseminate the data by the Swedish Maritime Administration.
This study was financially supported by the Swedish Research Council (grant nos. 621- 2007-4641, 621-2012-3965, and 2015-03717 to POJH) and by the Swedish Agency for Marine and Water Management (grant nos. 3159-19, 2535-20, and 1484-2022 to POJH). AH was funded by a junior postdoctoral fellowship from The Research Foundation–Flanders (FWO; project number 1241724N).
This paper was edited by Sabine Schmidt and reviewed by Beata Szymczycha and two anonymous referees.
Bittig, H. C., Körtzinger, A., Neill, C., van Ooijen, E., Plant, J. N., Hahn, J., Johnson, K. S., Yang, B., and Emerson, S. R.: Oxygen Optode Sensors: Principle, Characterization, Calibration, and Application in the Ocean, Frontiers in Marine Science, 4, https://doi.org/10.3389/fmars.2017.00429, 2018.
Bonaglia, S., Hylén, A., Rattray, J. E., Kononets, M. Y., Ekeroth, N., Roos, P., Thamdrup, B., Brüchert, V., and Hall, P. O. J.: The fate of fixed nitrogen in marine sediments with low organic loading: an in situ study, Biogeosciences, 14, 285–300, https://doi.org/10.5194/bg-14-285-2017, 2017.
Carstensen, J., Andersen, J. H., Gustafsson, B. G., and Conley, D. J.: Deoxygenation of the Baltic Sea during the last century, Proceedings of the National Academy of Sciences, 111, 5628–5633, https://doi.org/10.1073/pnas.1323156111, 2014.
Carstensen, J., Conley, D. J., Almroth-Rosell, E., Asmala, E., Bonsdorff, E., Fleming-Lehtinen, V., Gustafsson, B. G., Gustafsson, C., Heiskanen, A.-S., Janas, U., Norkko, A., Slomp, C. P., Villnäs, A., Voss, M., and Zilius, M.: Factors regulating the coastal nutrient filter in the Baltic Sea, Ambio, 49, 1194–1210, https://doi.org/10.1007/s13280-019-01282-y, 2020.
Conley, D. J., Björck, S., Bonsdorff, E., Carstensen, J., Destouni, G., Gustafsson, B. G., Hietanen, S., Kortekaas, M., Kuosa, H., Meier, H. E. M., Müller-Karulis, B., Nordberg, K., Norkko, A., Nürnberg, G., Pitkänen, H., Rabalais, N. N., Rosenberg, R., Savchuk, O. P., Slomp, C. P., Voss, M., Wulff, F., and Zillén, L.: Hypoxia-related processes in the Baltic Sea, Environmental Science and Technology, 43, 3412–3420, https://doi.org/10.1021/es802762a, 2009.
Danielsson, Å., Jönsson, A., and Rahm, L.: Resuspension patterns in the Baltic proper, Journal of Sea Research, 57, 257–269, https://doi.org/10.1016/j.seares.2006.07.005, 2007.
Eilola, K., Meier, H. E. M., Almroth-Rosell, E., and Höglund, A.: Transports and budgets of oxygen and phosphorus in the Baltic Sea, SMHI, Oceanografi 96 , 50 pp., 2008.
Ekeroth, N., Kononets, M. Y., Walve, J., Blomqvist, S., and Hall, P. O. J.: Effects of oxygen on recycling of biogenic elements from sediments of a stratified coastal Baltic Sea basin, Journal of Marine Systems, 154, 206–219, https://doi.org/10.1016/j.jmarsys.2015.10.005, 2016a.
Ekeroth, N., Blomqvist, S., and Hall, P. O. J.: Nutrient fluxes from reduced Baltic Sea sediment: effects of oxygenation and macrobenthos, Marine Ecology Progress Series, 544, 77–92, https://doi.org/10.3354/meps11592%2520MARINE, 2016b.
EMODnet Bathymetry Consortium: EMODnet Digital Bathymetry, EMODnet [data set], https://doi.org/10.12770/CF51DF64-56F9-4A99-B1AA-36B8D7B743A1, 2022.
Fischer, H. and Matthäus, W.: The importance of the Drogden Sill in the Sound for major Baltic inflows, Journal of Marine Systems, 9, 137–157, https://doi.org/10.1016/S0924-7963(96)00046-2, 1996.
Gustafsson, B. G., Schenk, F., Blenckner, T., Eilola, K. J., Meier, H. E. M., Müller-Karulis, B., Neumann, T., Ruoho-Airola, T., Savchuk, O. P., and Zorita, E.: Reconstructing the development of Baltic Sea eutrophication 1850–2006, Ambio, 41, 534–548, https://doi.org/10.1007/s13280-012-0318-x, 2012.
Gustafsson, E., Savchuk, O. P., Gustafsson, B. G., and Müller-Karulis, B.: Key processes in the coupled carbon, nitrogen, and phosphorus cycling of the Baltic Sea, Biogeochemistry, https://doi.org/10.1007/s10533-017-0361-6, 2017.
Hall, P. O. J., Almroth-Rosell, E., Bonaglia, S., Dale, A. W., Hylén, A., Kononets, M. Y., Nilsson, M. M., Sommer, S., van de Velde, S. J., and Viktorsson, L.: Influence of Natural Oxygenation of Baltic Proper Deep Water on Benthic Recycling and Removal of Phosphorus, Nitrogen, Silicon and Carbon, Frontiers in Marine Science, 4, 1–14, https://doi.org/10.3389/fmars.2017.00027, 2017.
Hansson, M. and Viktorsson, L.: Oxygen Survey in the Baltic Sea 2021 – Extent of Anoxia and Hypoxia, 1960–2021, SMHI, Gothenburg, Sweden, Report Oceanography 72, 90 pp., ISSN 0283-1112, 2021.
Hansson, M. and Viktorsson, L.: Oxygen Survey in the Baltic Sea 2022 – Extent of Anoxia and Hypoxia, 1960–2022, SMHI, Report Oceanography 74, 92 pp., ISSN 0283-1112, 2023.
HELCOM (The Baltic Marine Environment Protection Commission): HELCOM Thematic assessment of eutrophication 2011–-2016, HELCOM, Baltic Sea Environment Proceedings No. 156, 83 pp., ISSN:0357-2994, 2018a.
HELCOM (The Baltic Marine Environment Protection Commission): Input of nutrients by the seven biggest rivers in the Baltic Sea region, HELCOM, Baltic Sea Environment Proceedings No. 163, 31 pp., ISSN: 0357-2994, 2018b.
HELCOM (The Baltic Marine Environment Protection Commission): HELCOM Thematic assessment of eutrophication 2016–-2021, HELCOM, Baltic Sea Environment Proceedings No. 192, 53 pp., ISSN: 0357-2994, 2023.
HELCOM (The Baltic Marine Environment Protection Commission): HELCOM subbasins with coastal WFD waterbodies or watertypes 2022 (level 4a) [data set], https://metadata.helcom.fi/geonetwork/srv/eng/catalog.search#/metadata/67d653b1-aad1-4af4-920e-0683af3c4a48, 2022a.
HELCOM (The Baltic Marine Environment Protection Commission): PLC Subbasins [data set], https://metadata.helcom.fi/geonetwork/srv/eng/catalog.search#/metadata/1456f8a5-72a2-4327-8894-31287086ebb5, 2022b.
Hermans, M., Lenstra, W. K., Hidalgo-Martinez, S., van Helmond, N. A. G. M., Witbaard, R., Meysman, F. J. R., Gonzalez, S., and Slomp, C. P.: Abundance and Biogeochemical Impact of Cable Bacteria in Baltic Sea Sediments, Environmental Science & Technology, 53, 7494–7503, https://doi.org/10.1021/acs.est.9b01665, 2019.
Hurvich, C. M. and Tsai, C.-L.: Regression and Time Series Model Selection in Small Samples, Biometrika, 76, 297–307, 1989.
Hylén, A. and van de Velde, S.: FLUXER, Zenodo [code], https://doi.org/10.5281/ZENODO.14758688, 2025.
Hylén, A., van de Velde, S. J., Kononets, M., Luo, M., Almroth-Rosell, E., and Hall, P. O. J.: Deep-water inflow event increases sedimentary phosphorus release on a multi-year scale, Biogeosciences, 18, 2981–3004, https://doi.org/10.5194/bg-18-2981-2021, 2021.
Hylén, A., Ekeroth, N., Dale, A., Kononets, M., Lenstra, W., Tengberg, A., van de Velde, S., Sommer, S., Slomp, C., and Hall, P.: In situ measured benthic fluxes of dissolved inorganic phosphorus in the Baltic Sea, Zenodo [data set], https://doi.org/10.5281/ZENODO.14812160, 2025.
Janssen, F., Huettel, M., and Witte, U.: Pore-water advection and solute fluxes in permeable marine sediments (II): Benthic respiration at three sandy sites with different permeabilities (German Bight, North Sea), Limnology and Oceanography, 50, 779–792, https://doi.org/10.4319/lo.2005.50.3.0779, 2005.
Jilbert, T., Slomp, C. P., Gustafsson, B. G., and Boer, W.: Beyond the Fe-P-redox connection: preferential regeneration of phosphorus from organic matter as a key control on Baltic Sea nutrient cycles, Biogeosciences, 8, 1699–1720, https://doi.org/10.5194/bg-8-1699-2011, 2011.
Jonsson, P., Carman, R., and Wulff, F.: Laminated Sediments in the Baltic: A Tool for Evaluating Nutrient Mass Balances, Ambio, 19, 152–158, https://doi.org/10.2307/4313681, 1990.
Kaskela, A. M., Kotilainen, A. T., Alanen, U., Cooper, R., Green, S., Guinan, J., van Heteren, S., Kihlman, S., Van Lancker, V., Stevenson, A., and the EMODnet Geology Partners: Picking Up the Pieces – Harmonising and Collating Seabed Substrate Data for European Maritime Areas, Geosciences, 9, 84, https://doi.org/10.3390/geosciences9020084, 2019.
Kononets, M. Y., Tengberg, A., Nilsson, M. M., Ekeroth, N., Hylén, A., van de Velde, S. J., Rütting, T., Bonaglia, S., Blomqvist, S., and Hall, P. O. J.: In situ incubations with Gothenburg benthic chamber landers: Applications and quality control, Journal of Marine Systems, 214, 1–20, https://doi.org/10.1016/j.jmarsys.2020.103475, 2021.
Koroleff, F.: Determination of nutrients, in: Methods of seawater analysis, edited by: Grasshoff, K., Ehrhardt, M., and Kremling, K., Verlag Chemie, Weinheim, 125–187, ISBN 3527259988, 1983.
Kuliński, K., Rehder, G., Asmala, E., Bartosova, A., Carstensen, J., Gustafsson, B., Hall, P. O. J., Humborg, C., Jilbert, T., Jürgens, K., Meier, H. E. M., Müller-Karulis, B., Naumann, M., Olesen, J. E., Savchuk, O., Schramm, A., Slomp, C. P., Sofiev, M., Sobek, A., Szymczycha, B., and Undeman, E.: Biogeochemical functioning of the Baltic Sea, Earth Syst. Dynam., 13, 633–685, https://doi.org/10.5194/esd-13-633-2022, 2022.
Leipe, T., Tauber, F., Vallius, H., Virtasalo, J. J., Uścinowicz, S., Kowalski, N., Hille, S., Lindgren, S., and Myllyvirta, T.: Particulate organic carbon (POC) in surface sediments of the Baltic Sea, Geo-Marine Letters, 31, 175–188, https://doi.org/10.1007/s00367-010-0223-x, 2011.
Lenstra, W. K., Hermans, M., Séguret, M. J. M., Witbaard, R., Severmann, S., and Slomp, C. P.: Coastal hypoxia and eutrophication as key controls on benthic release and water column dynamics of iron and manganese in the Baltic Sea, Limnology and Oceanography, 1–20, https://doi.org/10.1002/lno.11644, 2021.
Leppäranta, M. and Myrberg, K.: Topography and hydrography of the Baltic Sea, in: Physical Oceanography of the Baltic Sea, Springer Berlin Heidelberg, Berlin, Heidelberg, 41–88, https://doi.org/10.1007/978-3-540-79703-6_3, 2009.
Meier, H. E. M.: Modeling the pathways and ages of inflowing salt- and freshwater in the Baltic Sea, Estuarine, Coastal and Shelf Science, 74, 610–627, https://doi.org/10.1016/j.ecss.2007.05.019, 2007.
Miltner, A. and Emeis, K. C.: Terrestrial organic matter in surface sediments of the baltic sea, Northwest Europe, as determined by CuO oxidation, Geochimica et Cosmochimica Acta, 65, 1285–1299, https://doi.org/10.1016/S0016-7037(00)00603-7, 2001.
Mitchell, P. J., Spence, M. A., Aldridge, J., Kotilainen, A. T., and Diesing, M.: Sedimentation rates in the Baltic Sea: A machine learning approach, Continental Shelf Research, 214, 104325, https://doi.org/10.1016/j.csr.2020.104325, 2021.
Nilsson, M. M., Kononets, M. Y., Ekeroth, N., Viktorsson, L., Hylén, A., Sommer, S., Pfannkuche, O., Almroth-Rosell, E., Atamanchuk, D., Andersson, H. J., Roos, P., Tengberg, A., and Hall, P. O. J.: Organic carbon recycling in Baltic Sea sediments – An integrated estimate on the system scale based on in situ measurements, Marine Chemistry, 209, 81–93, https://doi.org/10.1016/j.marchem.2018.11.004, 2019.
Nilsson, M. M., Hylén, A., Ekeroth, N., Kononets, M. Y., Viktorsson, L., Almroth-Rosell, E., Roos, P., Tengberg, A., and Hall, P. O. J.: Particle shuttling and oxidation capacity of sedimentary organic carbon on the Baltic Sea system scale, Marine Chemistry, 232, 1–10, https://doi.org/10.1016/j.marchem.2021.103963, 2021.
Noffke, A., Sommer, S., Dale, A. W., Hall, P. O. J., and Pfannkuche, O.: Benthic nutrient fluxes in the Eastern Gotland Basin (Baltic Sea) with particular focus on microbial mat ecosystems, Journal of Marine Systems, 158, 1–12, https://doi.org/10.1016/j.jmarsys.2016.01.007, 2016.
Novotny, K., Liebsch, G., Lehmann, A., and Dietrich, R.: Variability of sea surface heights in the Baltic Sea: An intercomparison of observations and model simulations, Marine Geodesy, 29, 113–134, https://doi.org/10.1080/01490410600738054, 2006.
Reusch, T. B. H., Dierking, J., Andersson, H. C., Bonsdorff, E., Carstensen, J., Casini, M., Czajkowski, M., Hasler, B., Hinsby, K., Hyytiäinen, K., Johannesson, K., Jomaa, S., Jormalainen, V., Kuosa, H., Kurland, S., Ojaveer, H., Refsgaard, J. C., Sandström, A., Schwarz, G., Laikre, L., MacKenzie, B. R., Margonski, P., Melzner, F., Oesterwind, D., Ojaveer, H., Refsgaard, J. C., Sandström, A., Schwarz, G., Tonderski, K., Winder, M., and Zandersen, M.: The Baltic Sea as a time machine for the future coastal ocean, Science Advances, 4, 1–16, https://doi.org/10.1126/sciadv.aar8195, 2018.
Ruttenberg, K. C.: The Global Phosphorus Cycle, in: Treatise on Geochemistry (2nd Edn.), edited by: Holland, H. D. and Turekian, K. K., Elsevier, Oxford, 499–558, https://doi.org/10.1016/B978-0-08-095975-7.00813-5, 2014.
Savchuk, O. P.: Large-scale nutrient dynamics in the Baltic Sea, 1970–2016, Frontiers in Marine Science, 5, 1–20, https://doi.org/10.3389/fmars.2018.00095, 2018.
Savchuk, O. P., Wulff, F., Hille, S., Humborg, C., and Pollehne, F.: The Baltic Sea a century ago – a reconstruction from model simulations, verified by observations, Journal of Marine Systems, 74, 485–494, https://doi.org/10.1016/j.jmarsys.2008.03.008, 2008.
Schneider, B. and Kuss, J.: Past and present productivity of the Baltic Sea as inferred from pCO2 data, Continental Shelf Research, 24, 1611–1622, https://doi.org/10.1016/j.csr.2004.06.023, 2004.
Slomp, C. P.: Phosphorus Cycling in the Estuarine and Coastal Zones, in: Treatise on Estuarine and Coastal Science, Elsevier, 201–229, https://doi.org/10.1016/B978-0-12-374711-2.00506-4, 2011.
Slomp, C. P., Mort, H. P., Jilbert, T., Reed, D. C., Gustafsson, B. G., and Wolthers, M.: Coupled Dynamics of Iron and Phosphorus in Sediments of an Oligotrophic Coastal Basin and the Impact of Anaerobic Oxidation of Methane, PLoS ONE, 8, https://doi.org/10.1371/journal.pone.0062386, 2013.
Snoeijs-Leijonmalm, P., Schubert, H., and Radziejewska, T. (Eds.): Biological Oceanography of the Baltic Sea, Springer, 696 pp., https://doi.org/10.1007/978-94-007-0668-2, 2017.
Sommer, S., Pfannkuche, O., Linke, P., Luff, R., Greinert, J., Drews, M., Gubsch, S., Pieper, M., Poser, M., and Viergutz, T.: Efficiency of the benthic filter: Biological control of the emission of dissolved methane from sediments containing shallow gas hydrates at Hydrate Ridge, Global Biogeochemical Cycles, 20, https://doi.org/10.1029/2004GB002389, 2006.
Sommer, S., Clemens, D., Yücel, M., Pfannkuche, O., Hall, P. O. J., Almroth-Rosell, E., Schulz-Vogt, H. N., and Dale, A. W.: Major Bottom Water Ventilation Events Do Not Significantly Reduce Basin-Wide Benthic N and P Release in the Eastern Gotland Basin (Baltic Sea), Frontiers in Marine Science, 4, 1–17, https://doi.org/10.3389/fmars.2017.00018, 2017.
Sundby, B., Anderson, L. G., Hall, P. O. J., Iverfeldt, Å., van der Loeff, M. M. R., and Westerlund, S. F. G.: The effect of oxygen on release and uptake of cobalt, manganese, iron and phosphate at the sediment-water interface, Geochimica et Cosmochimica Acta, 50, 1281–1288, https://doi.org/10.1016/0016-7037(86)90411-4, 1986.
Tengberg, A., Ståhl, H., Gust, G., Müller, V., Arning, U., Andersson, H. J., Hall, P. O. J., and Stahl, H.: Intercalibration of benthic flux chambers I. Accuracy of flux measurements and influence of chamber hydrodynamics, Progress in Oceanography, 60, 1–28, https://doi.org/10.1016/j.pocean.2003.12.001, 2004.
Tengberg, A., Hall, P. O. J., Andersson, U., Lindén, B., Styrenius, O., Boland, G., de Bovee, F., Carlsson, B., Ceradini, S., Devol, A., Duineveld, G., Friemann, J.-U., Glud, R. N., Khripounoff, A., Leather, J., Linke, P., Lund-Hansen, L., Rowe, G., Santschi, P., de Wilde, P., and Witte, U.: Intercalibration of benthic flux chambers: II. Hydrodynamic characterization and flux comparisons of 14 different designs, Marine Chemistry, 94, 147–173, https://doi.org/10.1016/j.marchem.2004.07.014, 2005.
Tengberg, A., Hovdenes, J., Andersson, H. J., Brocandel, O., Diaz, R. J., Hebert, D., Arnerich, T., Huber, C., Körtzinger, A., Khripounoff, A., Rey, F., Rönning, C., Schimanski, J., Sommer, S., and Stangelmayer, A.: Evaluation of a lifetime-based optode to measure oxygen in aquatic systems, Limnology and Oceanography: Methods, 4, 7–17, https://doi.org/10.4319/lom.2006.4.7, 2006.
Turnewitsch, R. and Pohl, C.: An estimate of the efficiency of the iron- and manganese-driven dissolved inorganic phosphorus trap at an oxic/euxinic water column redoxcline, Global Biogeochemical Cycles, 24, 1–15, https://doi.org/10.1029/2010GB003820, 2010.
Vahtera, E., Conley, D. J., Gustafsson, B. G., Kuosa, H., Pitkänen, H., Savchuk, O. P., Tamminen, T., Viitasalo, M., Voss, M., Wasmund, N., and Wulff, F.: Internal ecosystem feedbacks enhance nitrogen-fixing cyanobacteria blooms and complicate management in the Baltic Sea, AMBIO, 36, 186–194, https://doi.org/10.1579/0044-7447(2007)36[186:IEFENC]2.0.CO;2, 2007.
van de Velde, S. J., Hylén, A., Eriksson, M., James, R. K., Kononets, M. Y., Robertson, E. K., and Hall, P. O. J.: Exceptionally high respiration rates in the reactive surface layer of sediments underlying oxygen-deficient bottom waters, Proceedings of the Royal Society A: Mathematical, Physical and Engineering Sciences, 479, 20230189, https://doi.org/10.1098/rspa.2023.0189, 2023.
van Helmond, N. A. G. M., Robertson, E. K., Conley, D. J., Hermans, M., Humborg, C., Kubeneck, L. J., Lenstra, W. K., and Slomp, C. P.: Removal of phosphorus and nitrogen in sediments of the eutrophic Stockholm archipelago, Baltic Sea, Biogeosciences, 17, 2745–2766, https://doi.org/10.5194/bg-17-2745-2020, 2020.
Viktorsson, L., Almroth-Rosell, E., Tengberg, A., Vankevich, R., Neelov, I., Isaev, A., Kravtsov, V., and Hall, P. O. J.: Benthic Phosphorus Dynamics in the Gulf of Finland, Baltic Sea, Aquatic Geochemistry, 18, 543–564, https://doi.org/10.1007/s10498-011-9155-y, 2012.
Viktorsson, L., Ekeroth, N., Nilsson, M., Kononets, M., and Hall, P. O. J.: Phosphorus recycling in sediments of the central Baltic Sea, Biogeosciences, 10, 3901–3916, https://doi.org/10.5194/bg-10-3901-2013, 2013.
Witbaard, R., Duineveld, G. C. A., Van der Weele, J. A., Berghuis, E. M., and Reyss, J. P.: The benthic response to the seasonal deposition of phytopigments at the Porcupine Abyssal Plain in the North East Atlantic, Journal of Sea Research, 43, 15–31, https://doi.org/10.1016/S1385-1101(99)00040-4, 2000.
Zillén, L., Conley, D. J., Andrén, T., Andrén, E., and Björck, S.: Past occurrences of hypoxia in the Baltic Sea and the role of climate variability, environmental change and human impact, Earth-Science Reviews, 91, 77–92, https://doi.org/10.1016/j.earscirev.2008.10.001, 2008.