the Creative Commons Attribution 4.0 License.
the Creative Commons Attribution 4.0 License.
 | 21 Nov 2025
A 30 m resolution dataset of soil and water conservation terraces across China for 2000, 2010, and 2020
Enwei Zhang
Yueli Chen
Shengzhao Wei
Chenli Liu
Hongna Wang
Bowen Deng
Honghong Lin
Xue Yang
Yawen Li
Xingwu Duan
Terraces, as one of the most widely distributed and heavily invested soil and water conservation (SWC) measures in China, currently lack a comprehensive database containing spatiotemporal distribution and diverse classification types. This absence significantly hampers the accurate soil erosion assessment and SWC planning in China. To address this gap, we developed a two-stage mapping framework to classify various terrace measures and produced a new dataset named the Soil and Water Conservation Terrace Measures Dataset (SWCTMD). The dataset, spanning the years 2000 to 2020, was produced by integrating time-series Landsat imagery and digital elevation model data. The data incorporate SWC measure factors and four terrace types: level terraces, slope terraces, zig terraces, and slope-separated terraces. On average, the SWCTMD achieved OA of 91.7 % and F1 of 83.3 % for terraces, and 89.4 % OA and 78.9 % F1 for different terrace types, underscoring its high accuracy in terrace mapping. Comparative analysis demonstrated the superior robustness of the SWCTMD compared to existing products. This dataset demonstrated that terraces in China are predominantly concentrated in the Loess Plateau, Southwest and Southeast regions. From 2000 to 2020, the total terrace area increased by 41 594.1 km2, with slope terraces exhibiting the largest expansion, while decreases were primarily observed in peri-urban areas. Notably, the modeling results indicated that terraces had reduced soil erosion of cropland by approximately 1390 million tons in 2020. The SWCTMD can be employed to enhance the accuracy of soil erosion simulations and support long-term analysis of soil erosion trends. Furthermore, the dataset provides valuable applications for earth system modelling and contributes to research on land resource management, food security, biodiversity, and water cycle. The SWCTMD is freely available at https://doi.org/10.11888/Terre.tpdc.302400 (Duan, 2025).
- Article
(5464 KB) - Full-text XML
-
Supplement
(1392 KB) - BibTeX
- EndNote


Agricultural terraces are one of the most common cultivation techniques in mountainous and hilly areas, varying in shape and size. They consist of a flat cultivated section and nearly vertical risers. The risers are typically protected by dry stone, grass, scrub, or trees, and range from a few centimeters to several meters in height, with continuous or intermittent profiles (Arnáez et al., 2015). Terraces form an important soil and water conservation (SWC) measure (Wickama et al., 2014; Londero et al., 2018). Based on the structures of the field surface, terraces can be categorized into level terraces, slope terraces, zig terraces, and slope-separated terraces (Liu et al., 2013a). By reshaping the surface microtopography, terraces decrease the slope length and gradient and alter hydrological pathways (Deng et al., 2021). These changes reduce soil erosion and runoff, improve water and soil conservation, and increase crop yields (Adgo et al., 2013; Chen et al., 2017, 2020; Wei et al., 2021). Within established soil erosion assessment frameworks, terraces have been incorporated as a support practice factor in the Universal Soil Loss Equation (USLE) and the Revised Universal Soil Loss Equation (RUSLE) (Wischmeier and Smith, 1978; Renard et al., 1997). In the Chinese Soil Loss Equation (CSLE), terraces are specifically represented as an SWC engineering practice factor (Liu et al., 2020). However, many large-scale assessments of soil erosion neglect this factor due to insufficient data on the spatial distribution of terraces (Gobin et al., 2004; Teng et al., 2016). Therefore, the mapping of terraces is crucial for soil erosion research.
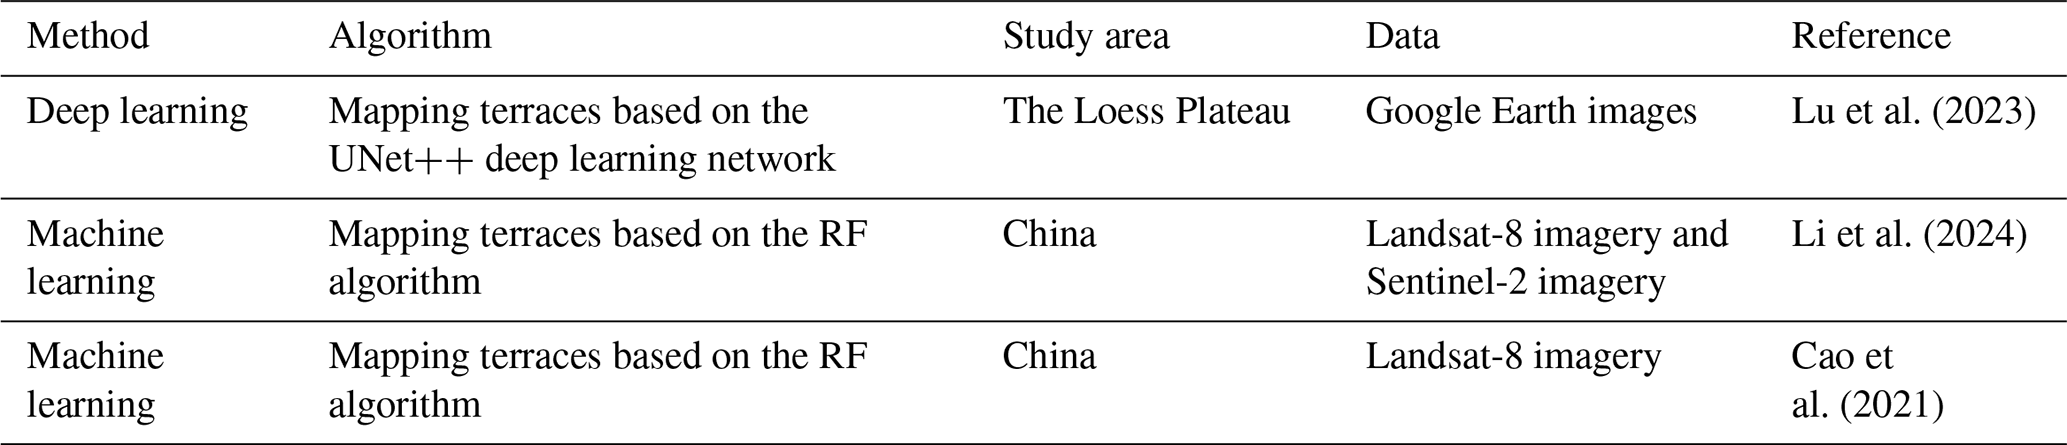
Efforts have been made to map terraces in China. Three primary methods have been employed to obtain spatial extent and location information of terraces. The first method is a government-initiated land resource survey. Terraces were considered in paddy field surveys during the second and third nationwide land surveys in China. Terraces located in extensive drylands, particularly on steep slopes, were often categorized simply as dryland or irrigated land, without distinguishing terrace types. The second method is to extract terrace information from land use data (Liu et al., 2021). Existing land use products in China, such as FROM-GLC, GlobeLand30, CLCD, CACD, and GLC_FCS30, generally classify terraces as cropland (Yu et al., 2013; Chen et al., 2015; Yang and Huang, 2021; Zhang et al., 2021; Tu et al., 2024). Among these, only the CNLUCC land use product further subdivides cropland into paddy field and dryland; however, this product also fails to distinguish terrace types on dryland (Liu et al., 2010). This limitation makes it challenging to extract information about terraces from existing land use data. The third method is to employ satellite images to identify terraces. For instance, Lu et al. (2023) employed deep learning methods to map terraces in the Loess Plateau based on high-resolution satellite images from October 2018 to February 2019. Li et al. (2024) produced a 30 m resolution terrace map for China using 2017 Sentinel-2 imagery and Landsat-8 imagery on the Google Earth Engine (GEE) platform through the random forest (RF) algorithm. Similarly, Cao et al. (2021) produced a 30 m resolution terrace map using 2018 Landsat-8 imagery and the RF algorithm on the GEE platform (Table 1). Although these maps have been widely used in soil erosion research (Li et al., 2023; Zhang et al., 2023), the limited classification of terrace types and the lack of long-term coverage restrict broader application at regional or national scales.
The effectiveness of terraces in SWC varies according to type. Level terraces, characterized by flat cultivated surfaces, can effectively reduce the amount, velocity, and energy of surface runoff and increase water infiltration, thereby effectively preventing the transportation of sediment (Wei et al., 2012; Chen et al., 2013; Arnáez et al., 2015). Zig terraces increase water infiltration and reduce runoff by creating micro-catchments (Wang et al., 2004). Conversely, slope terraces, with their uneven surfaces, are more prone to generating runoff than level terraces or zig terraces (Wei et al., 2016). Level terraces exhibit the most effective SWC benefits (de Oliveira et al., 2012). Compared to slope terraces, level terraces can reduce runoff by 56.5 % and sediment by 53.1 % (Chen et al., 2017). Ignoring terrace type can lead to inaccuracies in soil erosion assessment, and the absence of long-term terrace data hinders analyses of soil erosion trends.
Steep slope land accounts for more than one-third of the total cropland area in China. In recent decades, the construction of agricultural terraces has been the primary engineering measure for managing steep slope cropland (Liu et al., 2013b; Feng et al., 2017; Zhang et al., 2017). However, the existing terrace datasets lack detailed classification of terrace types and are limited to single-year data. These limitations have hindered soil erosion assessment, prediction, and SWC planning. To address this gap, we developed a two-stage mapping framework for terrace classification on the GEE platform. The first stage distinguishes terraces from non-terraces, while the second stage focuses on identifying different terrace types. Using this mapping framework, we developed the first long-term (2000 to 2020) national Soil and Water Conservation Terrace Measures Dataset (SWCTMD) of China. The dataset incorporates a detailed classification system. The accuracy of SWCTMD was evaluated using validation samples and compared with existing terrace maps. Additionally, the terrace dataset was used to identify spatial and temporal changes in terraces across China and to assess the SWC benefits provided by terraces.
Figure 1 illustrates the framework of 30 m resolution terrace mapping. The workflow includes sample collection, feature calculation, classification implementation, post-classification processing, and accuracy evaluation. Detailed information on each stage of the terrace mapping process is provided below.
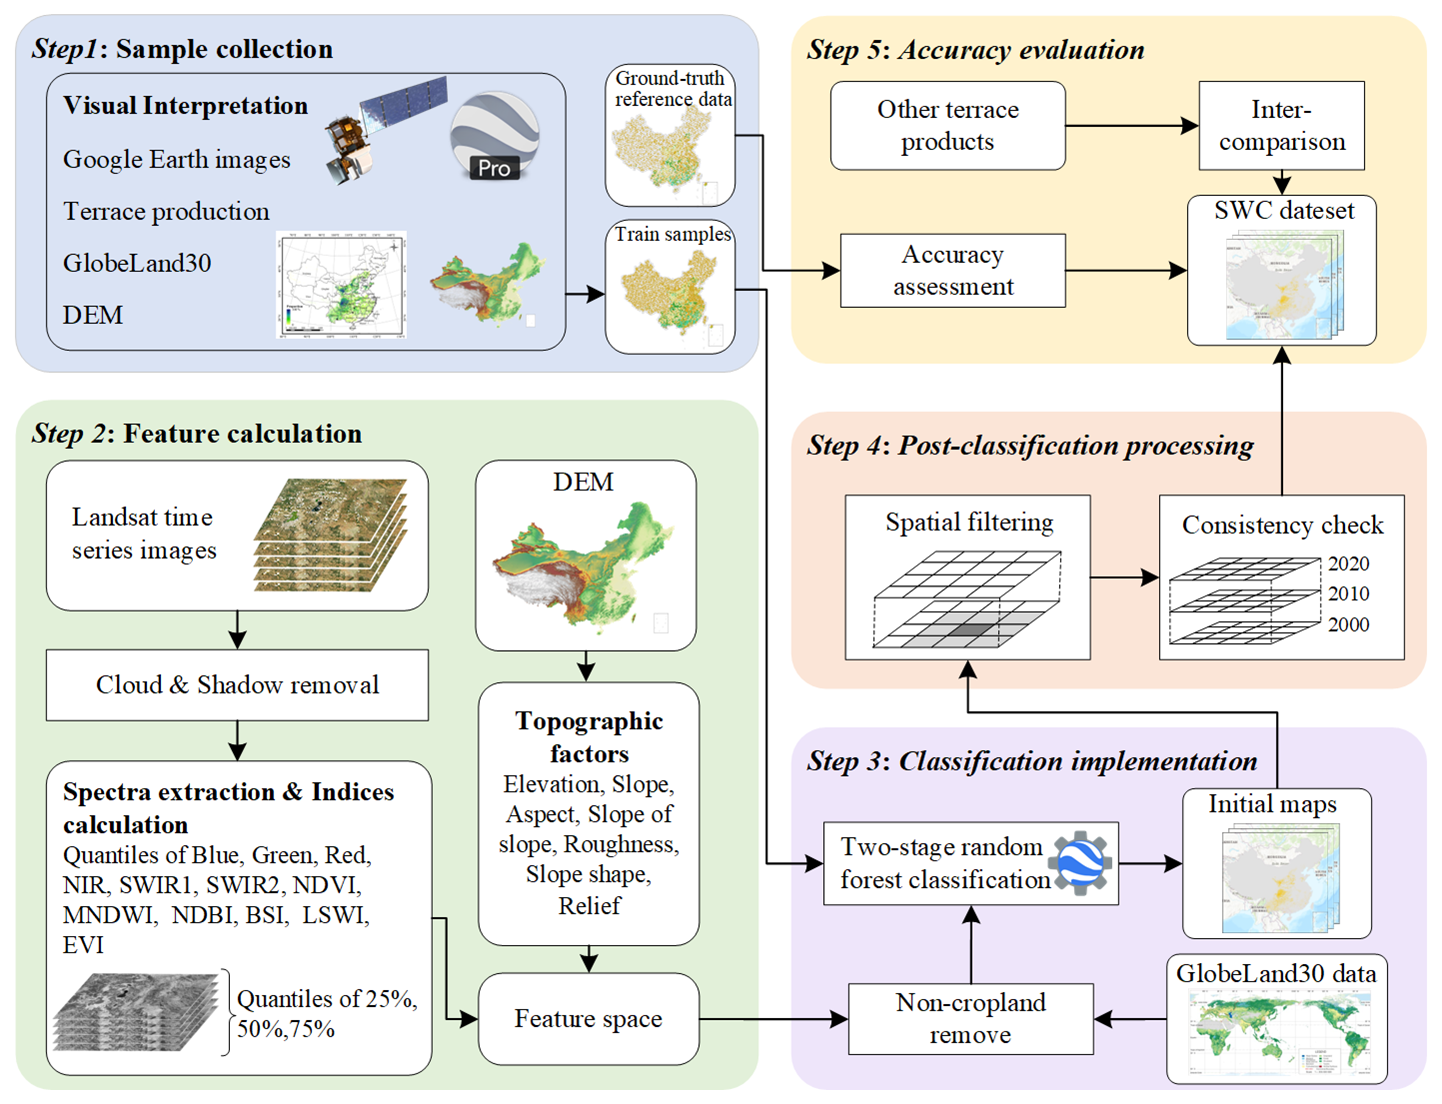
Figure 1The framework for mapping terrace.
2.1 The classification system and interpretation symbols
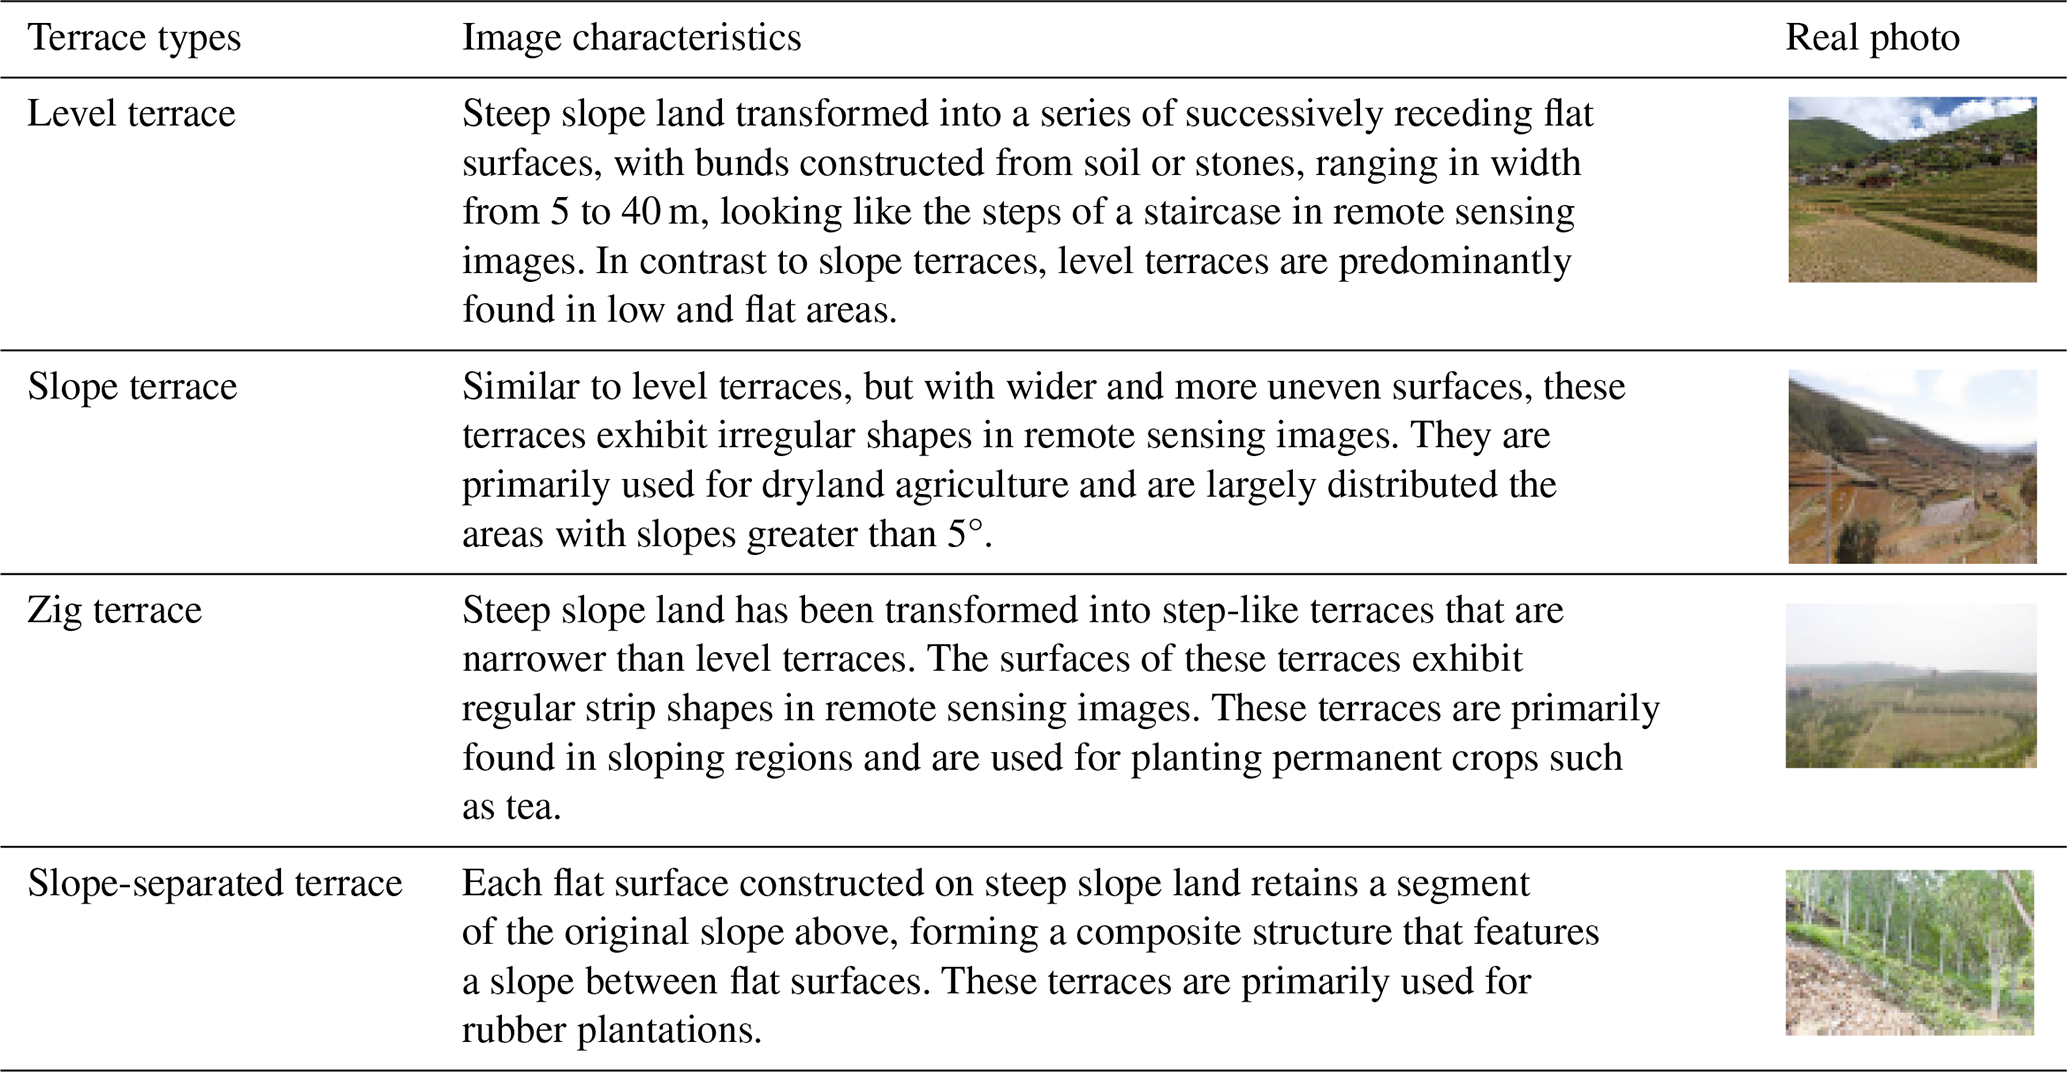
According to the findings of China's First National Census for Water (FNCW) (Liu et al., 2020), we identified the four major types of terraces: level terrace, slope terrace, zig terrace, and slope-separated terrace. The interpretation keys for the different terrace types included shape, size, texture, color, and location (Table 2).
2.2 Data and preprocessing
In this study, we primarily used Landsat surface reflectance (SR) data, the Copernicus digital elevation model (DEM) data, and GlobeLand30. Detailed information about these datasets is provided in Table S1 in the Supplement.
2.2.1 Landsat SR data
The study used Landsat-5/8 SR data, with a spatial resolution of 30 m and a temporal resolution of 16 d. The data were accessible through the GEE platform. The Landsat SR data from the sensors had been atmospherically corrected by the United States Geological Survey (USGS) utilizing the LEDAPS algorithm (Masek et al., 2006). These data included Quality Assessment (QA) masks that indicated the usability of the pixel data, produced using the CFMASK algorithm (Zhu and Woodcock, 2012). We used QA bands to identify and remove clouds and cloud shadows in each Landsat SR image, and missing data after cloud removal were filled using images from the previous year. Due to the inconsistency in the wavelength of band among different Landsat sensors (Roy et al., 2016), we used only Landsat-8 SR imagery for the SWCTMD in 2020, and Landsat-5 SR imagery for the SWCTMD in 2000 and 2010.
2.2.2 Copernicus DEM
Topographical features are essential characteristics that differentiate regular cropland and terrace, playing a crucial role in the identification of terraces. We used the Copernicus DEM data to calculate these topographical features. The Copernicus DEM is a Digital Surface Model with 30 m resolution, derived from radar satellite data acquired from 2010 to 2015 during the TanDEM-X mission. Compared to other DEM data (SRTM, ASTER GDEM, ALOS World 3D, and NASADEM), Copernicus DEM has the highest accuracy among open-source data (Guth and Geoffroy, 2021), exhibiting the greatest detail of terrain (Li et al., 2022a). The GEE platform provides access to the Copernicus DEM at 30 m resolution.
2.2.3 GlobeLand30
To improve the accuracy and efficiency of terrace identification, we used the union of cropland data from GlobeLand30 from 2000 to 2020 as the range for terrace identification. Then, we removed cropland with a slope of less than or equal to 2° (Ministry of Natural Resources of the People's Republic of China, 2019). GlobeLand30 is a widely used land use dataset with 30 m resolution that employs a pixel-object-knowledge classification method, effectively utilizing the advantages of various classification algorithms (Chen et al., 2015). The accuracy of cropland area and spatial location of GlobeLand30 is higher than the other four products (FROM-GLC, GlobCover, MODIS Collection 5, and MODIS Cropland) in China (Lu et al., 2016). The cropland from GlobeLand30 includes paddy fields, drylands, pastures, and permanent crop lands (e.g., tea and coffee plantations). Therefore, we adopted the cropland from GlobeLand30 as the range of terrace classification.
2.3 Feature space construction
Feature variables play a crucial role in the classification of remote sensing images. In this study, we constructed an input dataset comprising four aspects: spectrum, spectral indices, phenology, and topography. The six optical bands (red, green, blue, near-infrared, shortwave infrared 1, and shortwave infrared 2) from Landsat SR imagery for a specific year, along with the corresponding spectral indices (NDVI, MNDWI, NDBI, BSI, LSWI, and EVI), were composited into the 25th, 50th, and 75th percentiles utilizing the metrics-composite method. The percentiles effectively represent phenological information while simplifying time series information, thereby reducing annual time series noise and enhancing the accuracy of classification (Duan et al., 2024). In addition to the Landsat-based metrics, we incorporated seven frequently utilized topographic features: slope, aspect, slope of slope (SOS), relief (RF), slope shape (P), roughness (R), and elevation (Tang et al., 2016). The calculation method for feature variables is shown in Table S2. To eliminate multicollinearity among the feature variables, we removed highly correlated features based on two criteria: (a) a variance inflation factor (VIF) value for each feature less than 10, and (b) pairwise Pearson correlation coefficients are below 0.7 (Liao et al., 2021). Detailed information about the used features is provided in Tables S3, S4, and S5.
2.4 Collection of training samples
Samples are a critical component in supervised classification. We used manual visual interpretation methods to obtain samples from the years 2000, 2010, and 2020. To ensure that the collected samples were evenly distributed across the study area, we implemented a strategy of gathering samples by subregions. The study area was divided into 1641 subregions. Utilizing high-resolution images from Google Earth Pro software, we collected at least five samples from each subregion (Fig. S1). Through this method, we collected a total of 103 374 samples. Specifically, 34 891 samples were obtained in 2000, 34 072 samples were obtained in 2010, and 34 411 samples were obtained in 2020 (Table S6).
2.5 Ground-truth reference data
The terrace validation data were derived from the FNCW conducted between 2010 and 2012. These data were obtained through field surveys and provide detailed information about terraces, including terrace types and GPS coordinates. The survey covered croplands nationwide. A total of 14 986 survey sites were used for validation of terrace accuracy in 2010, comprising 3706 terrace samples and 11 280 non-terrace samples (Fig. 2). The statistics for different terrace types are listed in Table S7. Based on these data, the terrace validation samples for 2000 and 2020 were obtained by overlaying high-resolution remote sensing imagery from Google Earth Pro for verification.
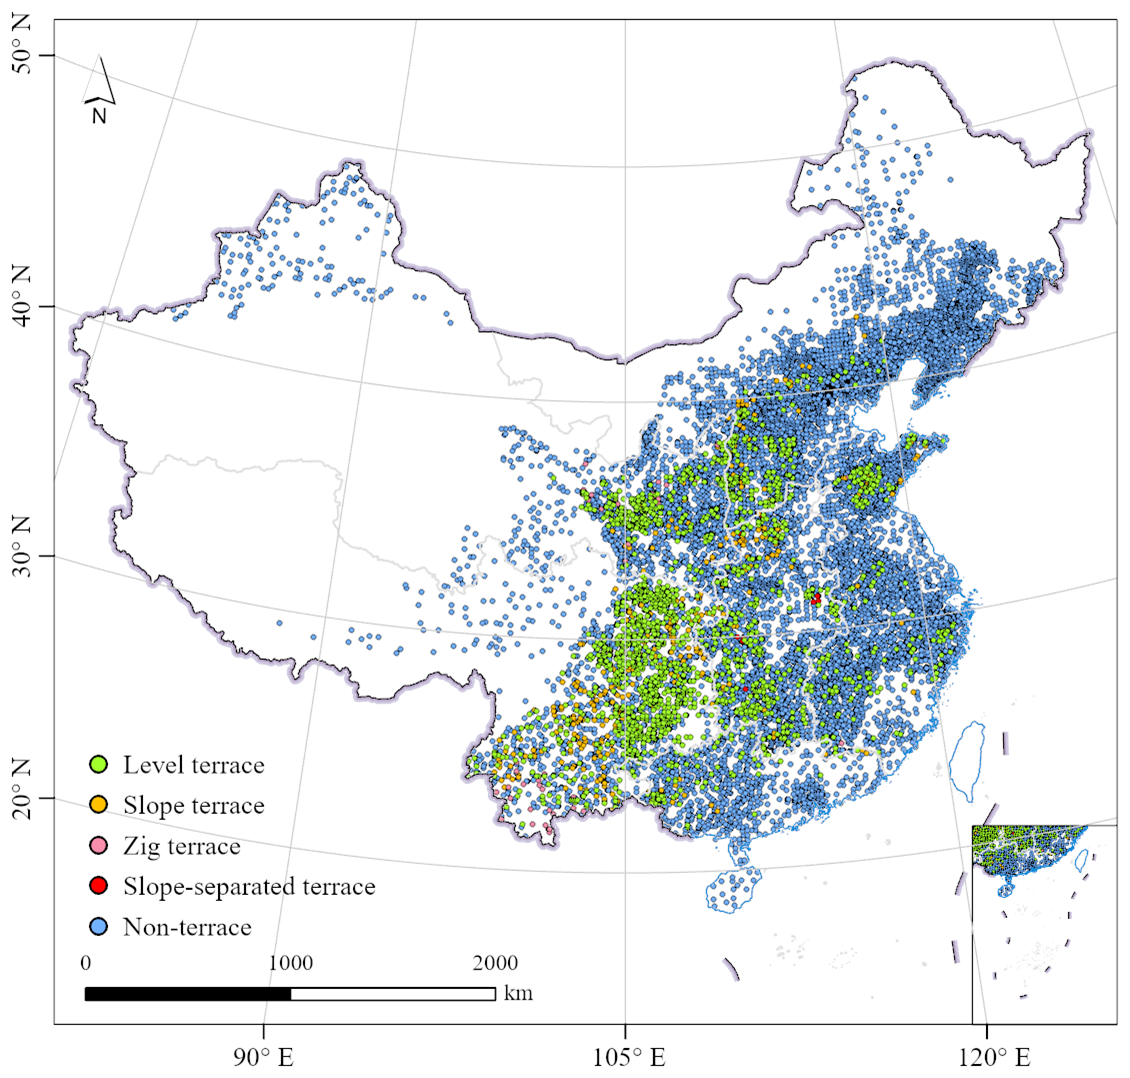
Figure 2The Spatial distribution of validation samples.
2.6 Terrace classification on the GEE platform
The GEE platform offers a variety of classification algorithms. We selected the widely used RF model for terrace classification, as the algorithm offers the advantages of remarkable performance, high efficiency, and interpretability (Rodriguez-Galiano et al., 2012; Gong et al., 2019). Two essential parameters must be set for the RF model. In this study, we set the number of trees to 500 and determined the number of variables per split as the rounded square root of the feature number. Other parameters were maintained at the default settings specified by the GEE platform (He et al., 2017; Gong et al., 2020). To alleviate the impact of crop spectral variability on classification accuracy, the study area was divided into six subregions (Fig. 3) (Li et al., 2024). The different terrace types within each region were classified separately. Given the sensitivity of the RF model to the ratio of samples across different classes (Chen et al., 2024), we implemented a two-stage mapping approach for classifying terraces within each region. In the first stage, RF was utilized to differentiate between terrace and non-terrace classes. In the second stage, RF was utilized to classify various terrace types, including level terraces, slope terraces, zig terraces, and slope-separated terraces. In Stage I of the mapping process, samples from both terrace and non-terrace samples were used, whereas only terrace samples were utilized in Stage II.
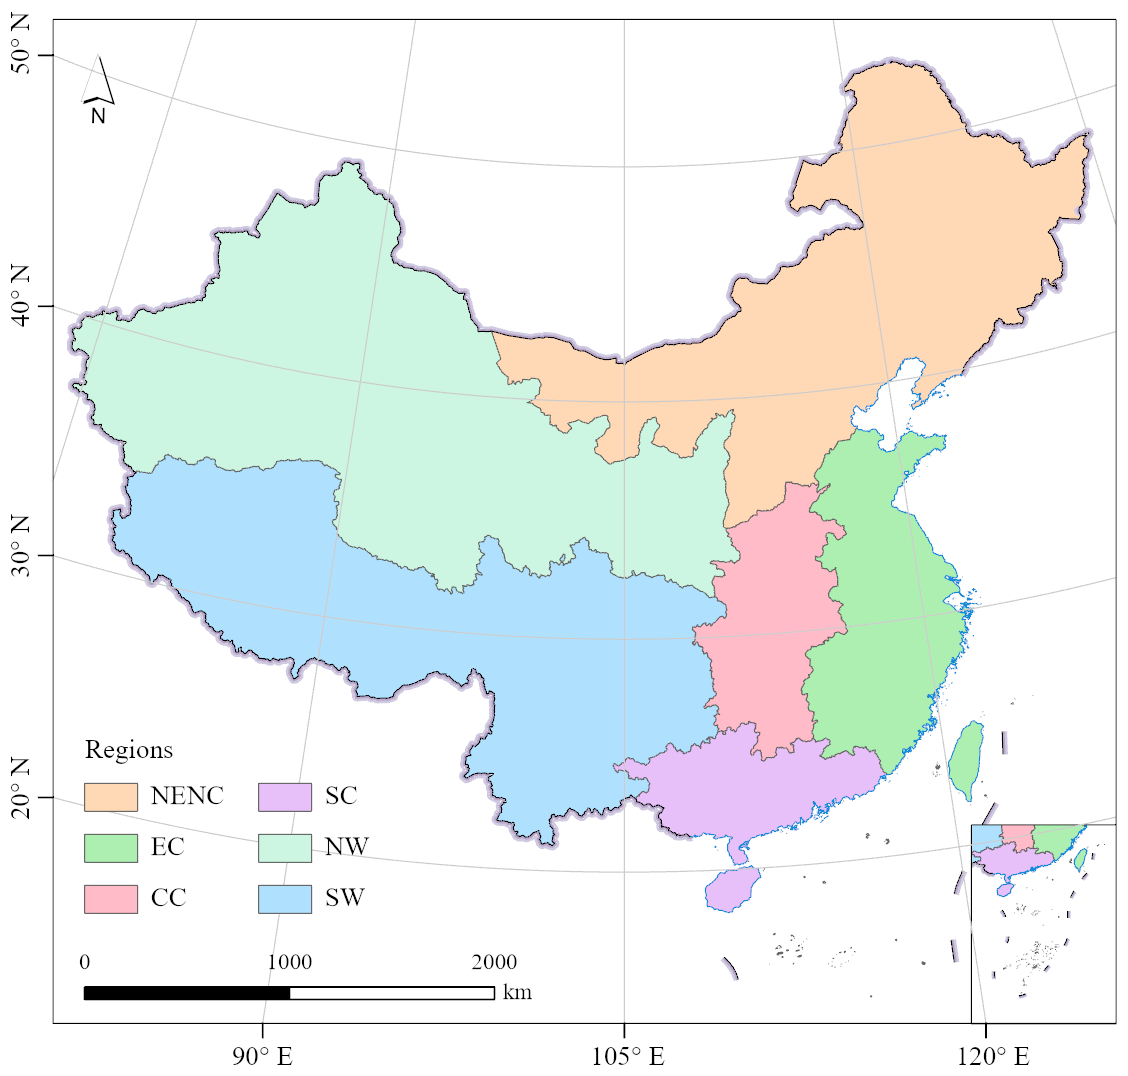
Figure 3Geographical regionalization in China. SW represents Southwest China. NW represents Northwest China. NENC represents Northeast and North China. SC represents South China. CC represents Central China. EC represents East China.
2.7 Post-classification processing
Both supervised and unsupervised classification methods in remote sensing rely on the spectral characteristics of image pixels. A critical issue is the presence of isolated pixels in the classification results, which exhibit high local spatial heterogeneity between neighboring pixels (Hirayama et al., 2019). This phenomenon, commonly known as the salt-and-pepper effect, is regarded as noise affecting accuracy. Terraces, being primarily constructed in hilly or mountainous regions, often exhibit a scattered and irregular distribution, which leads to an obvious salt-and-pepper effect in classified images. Given the small areas of terraces, we applied a mode filter with 3 × 3 px for spatial filtering processing to mitigate the salt-and-pepper effect from the classification results. To improve the overall quality of the mapping results, we conducted spatial-temporal consistency checks to suppress illogical land use conversions. Specifically, for areas that were cropland in both the previous year and the current year (excluding grain-for-green areas), we modified those areas that were previously terraces but were identified as non-terraces in the current year to terraces.
2.8 Accuracy assessment
It is an essential step to assess the accuracy of the products prior to utilizing data in related applications. The classification maps were evaluated using a confusion matrix calculated from validation samples. The confusion matrix is widely regarded as the standard method for evaluating the accuracy of classified images. This method offers quantitative assessment metrics, including the kappa coefficient (KA), overall accuracy (OA), the producer's accuracy (PA), and the user's accuracy (UA), which collectively assess the performance of the products. OA and KA measure the total map accuracy. PA and UA measure the omission and commission errors for each class. In addition, we calculated the F1 score, which reflects the balance between UA and PA. The KA, OA, PA, UA, and F1 metrics range from 0 to 1, where 1 indicates optimal performance and 0 represents the poorest performance. The formula for the F1 metric is shown in Eq. (1):
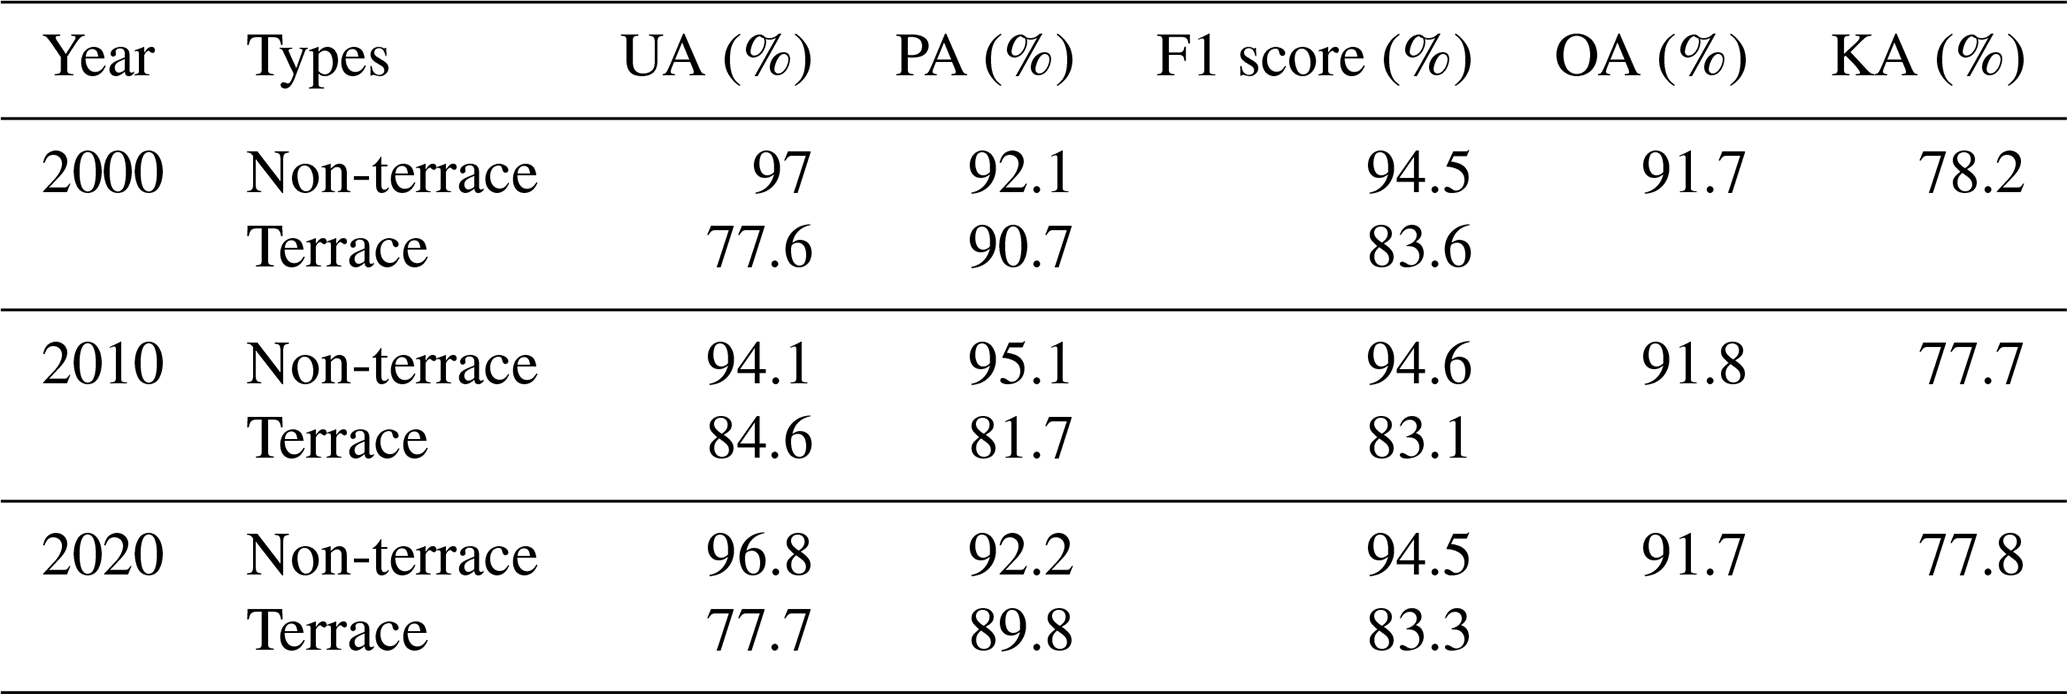
In this study, we constructed two confusion matrices: one to evaluate the accuracy of terraces and non-terraces, and the other to assess the accuracy of various terrace types.
3.1 Overall accuracy assessment
Two confusion matrices corresponding to different terrace classification levels were generated using the validation samples. For the classification of terrace and non-terrace, the OA ranged from 91.7 % to 91.8%, with KA ranging from 77.7 % to 78.2%, and F1-scores ranging from 83.1 % to 94.6 % (Table 3). For terrace class, the UA ranged from 77.6 % to 84.6%, and the PA ranged from 81.7 % to 90.7%, and the F1 above 80%, indicating that the overall classification performs well.
For different terrace types, the OA ranged from 88.8 % to 89.8%, KA ranged from 65.1 % to 69.5%, and F1 scores ranged from 68.9 % to 93.9 % (Table 4). Level terraces exhibited the highest classification accuracy, followed by slope-separated terraces, slope terraces, and zig terraces. From the UA and PA, the commission errors were lower than the omission errors for different types of terraces. Level terraces had the lowest misclassification error among the terrace types.
Table 4The accuracy matrix for the different types of terraces.
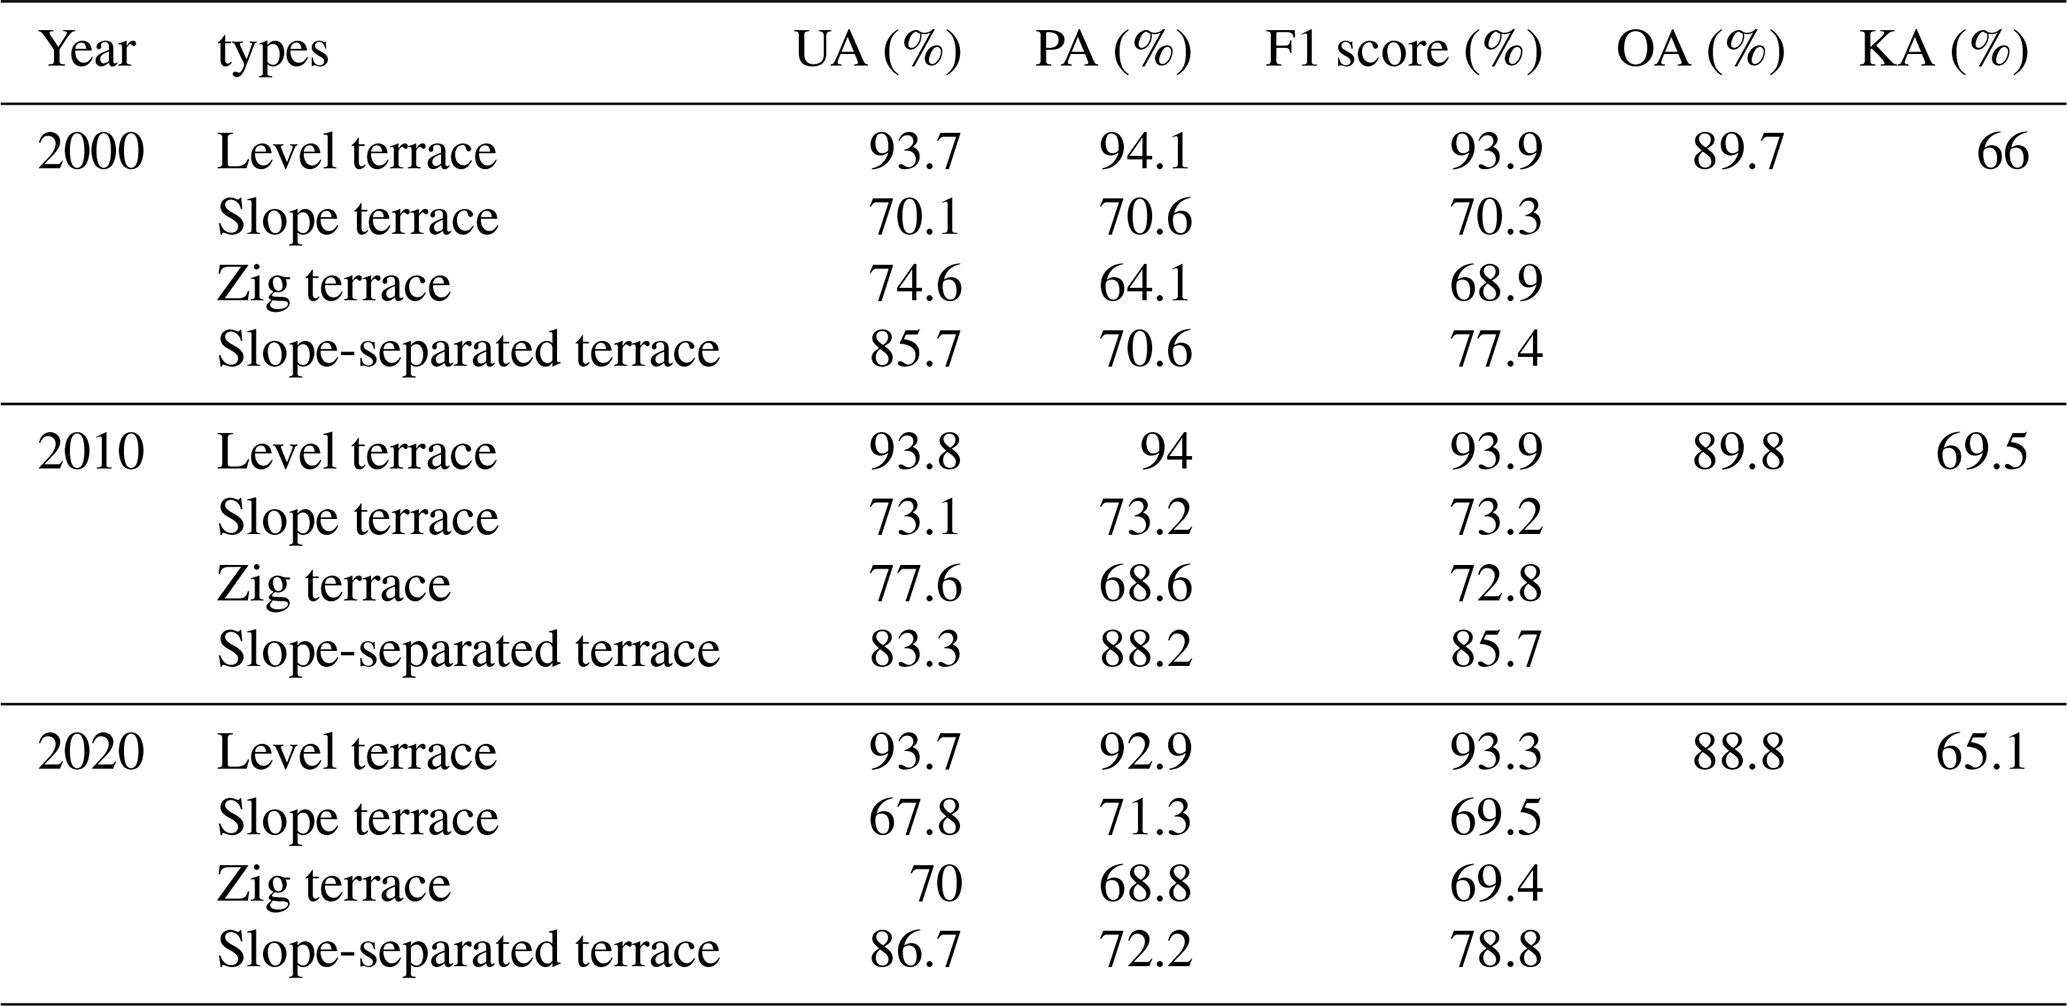
Figure 4 illustrates the spatial consistency between the SWCTMD and two existing datasets: the 2018 China Terrace Map (CTM2018) (Cao et al., 2021) and the 2017 China Terrace Map (CTM2017) (Li et al., 2024). SWCTMD exhibited the highest accuracy. Compared to SWCTMD and CTM2018, CTM2017 exhibited relatively lower accuracy for both typical terrace and non-terraces areas (regions B, C, D, F and G in Fig. 4b). For typical terraces, SWCTMD and CTM2018 show similar identification performance (regions A, B, C, D and F in Fig. 4b). However, for atypical terraces, such as zig terraces located in Yunnan Province, SWCTM successfully identified these as terraces, whereas CTM2018 failed to identify them as terraces (regions E in Fig. 4b). Conversely, for non-terrace areas situated in the Middle-Lower Yangtze River, SWCTMD accurately classified these as non-terraces, while CTM2018 erroneously classified them as terrace areas (regions G in Fig. 4b). At the provincial scale, the majority of provinces exhibit larger terrace areas in SWCTMD compared to both CTM2018 and CTM2017 (Tables S8 and S9).
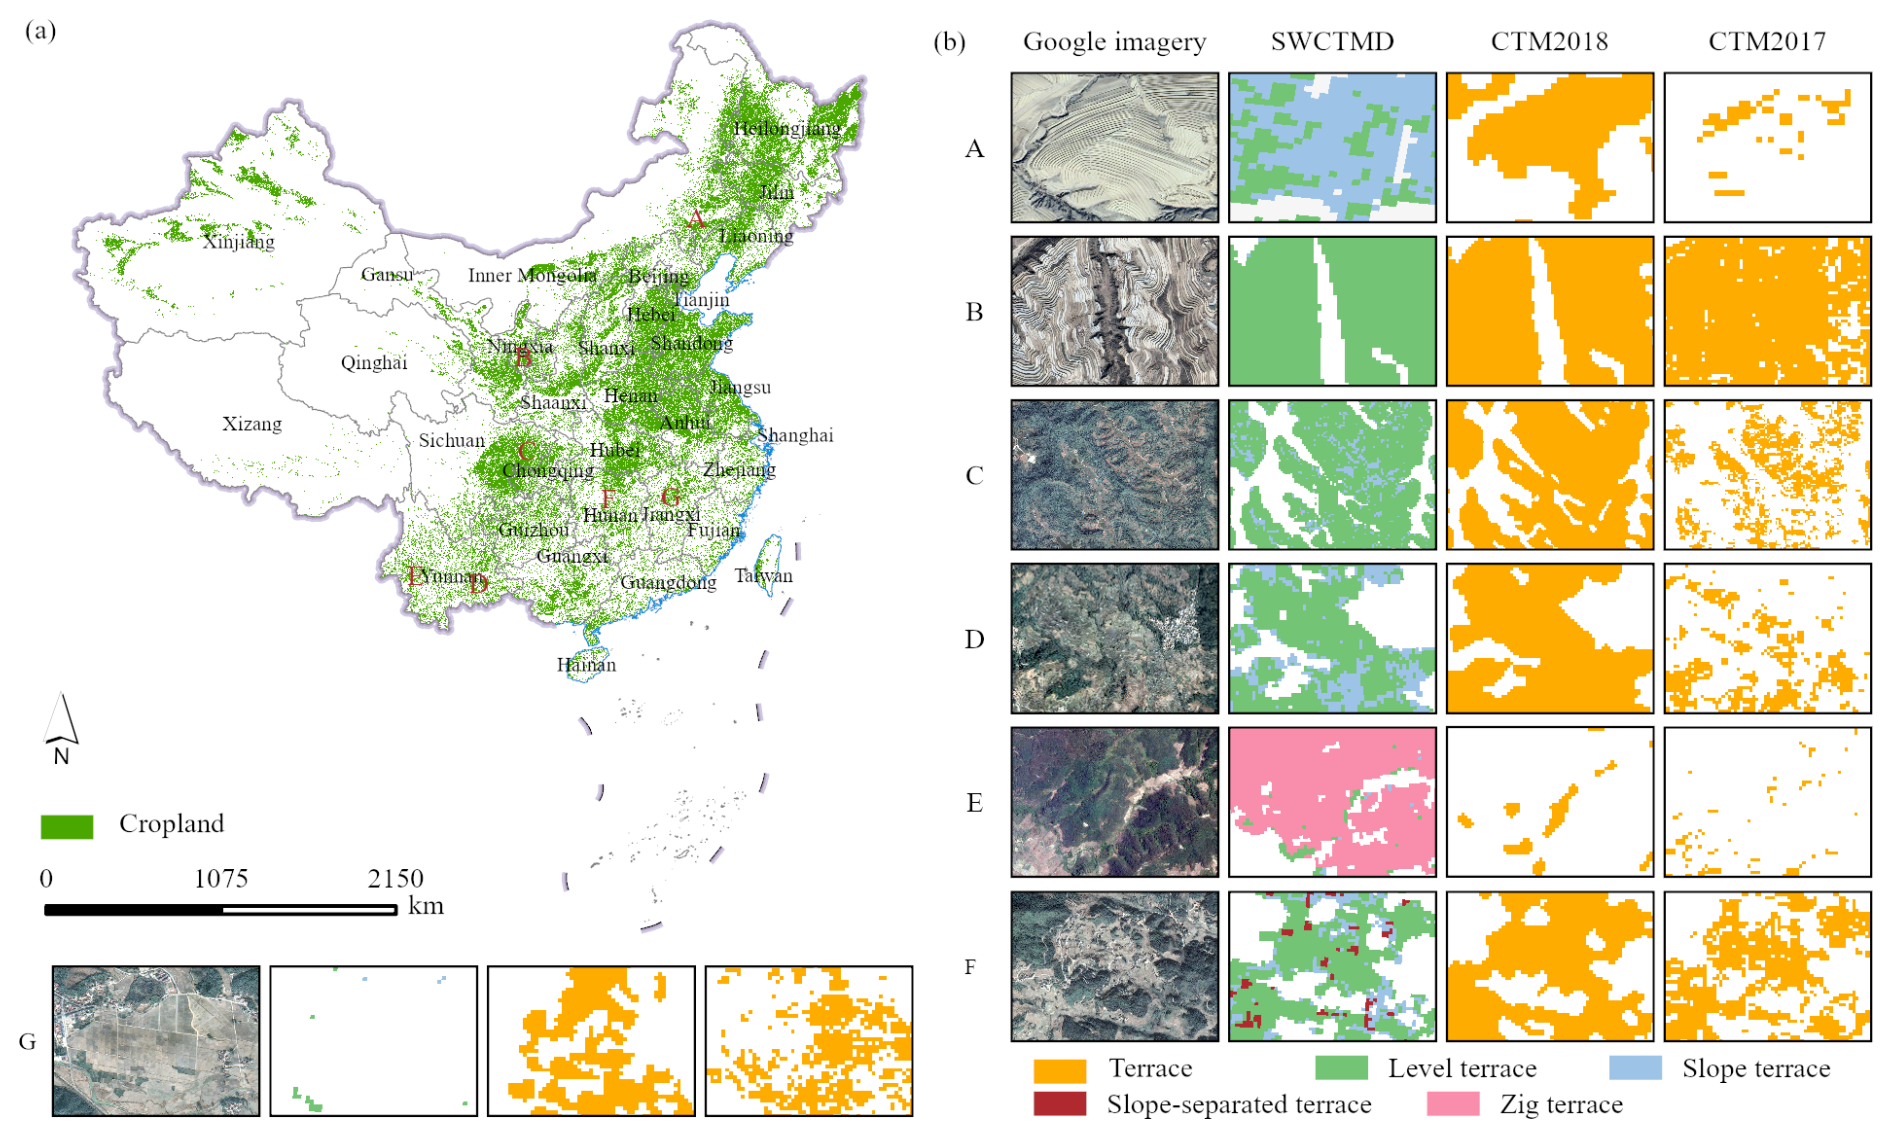
Figure 4Regional comparisons of the three terraces datasets. (a) The distribution of cropland in China in 2020. (b) The spatial distributions of the three terraces datasets. All Google imagery was generated using ©Google Earth.
3.2 Accuracy assessment in different regions
The classification of terraces across different regions performed well, but there were significant differences in accuracy among the regions. The Southwest and Northwest had the highest concentrations of terraces. Southwest China achieved superior classification performance due to its pronounced terrace morphology and spectral characteristics. Southwest China demonstrated the highest classification precision, with average values of UA, PA, F1, OA, and KA at 89.8 %, 95.8 %, 92.7 %, 90.2 %, and 77.9 %, respectively (Table S10). Northwest China followed closely, with corresponding average values of 75.2 %, 91.6 %, 82.3 %, 89.6 %, and 75.1 %. In contrast, Northeast and North China, South China, Central China, and East China have relatively flat terrain, with terraces being similar to the surrounding cropland, resulting in relatively lower classification accuracy. The mean F1 scores were 70.6 %, 77.5 %, 81 %, and 73.8 %, respectively. The mean OA scores were 94.5 %, 91.3 %, 87.8 %, and 91.7 %, respectively, and the KA were around 70 % (Table S10).
The overall classification accuracy for different terrace types across all regions was well. Northwest China, Northeast and North China, Central China, and South China had the highest classification accuracy, followed by Southwest China and East China. The average UA, PA, F1, OA, and KA values of Northwest China, Northeast and North China, Central China, and South China were 82.3 %, 81.1 %, 81.5 %, 90.4 %, 67.9 %. The average UA, PA, F1, OA, and KA values for Southwest China and East China were 76.5 %, 77.9 %, 77.1 %, 90 %, 64.4 % (Table S11). Among all terrace types, level terraces had the highest classification accuracy across all regions, followed by slope-separated terraces, slope terraces, and zig terraces.
3.3 Spatiotemporal variation of terraces in China
Terraces are primarily distributed across the hills, basins, and plateaus of China (Figs. 5a and S2). The Sichuan Basin exhibited the highest concentration of terraces, followed by the Yunnan-Guizhou Plateau and the Loess Plateau. Terraces are also extensively found in the hilly regions of central and southeastern China. Level terraces are distributed in the gentler slopes of hilly regions in China. Sloped terraces are most densely distributed across Yunnan and the Loess Plateau, with lesser occurrence in the hilly regions of central and southeastern China. Zig terraces are mostly distributed in Southwest China and Northwest China, while slope-separated terraces are mostly located in Southwest China and Central China (Fig. 5a and b). In terms of spatial changes, the increasing terraces are mainly distributed in the Yunnan-Guizhou Plateau, the Loess Plateau, the Sichuan Basin, and South China from 2000 to 2020 (Fig. 6a). These areas are severely affected by soil erosion. Yunnan and Guangxi are the provinces with the largest increase in terraces (Fig. 6b). The decreasing terraces are mainly distributed around urban areas from 2000 to 2020, where urban expansion has occupied some terrace areas.
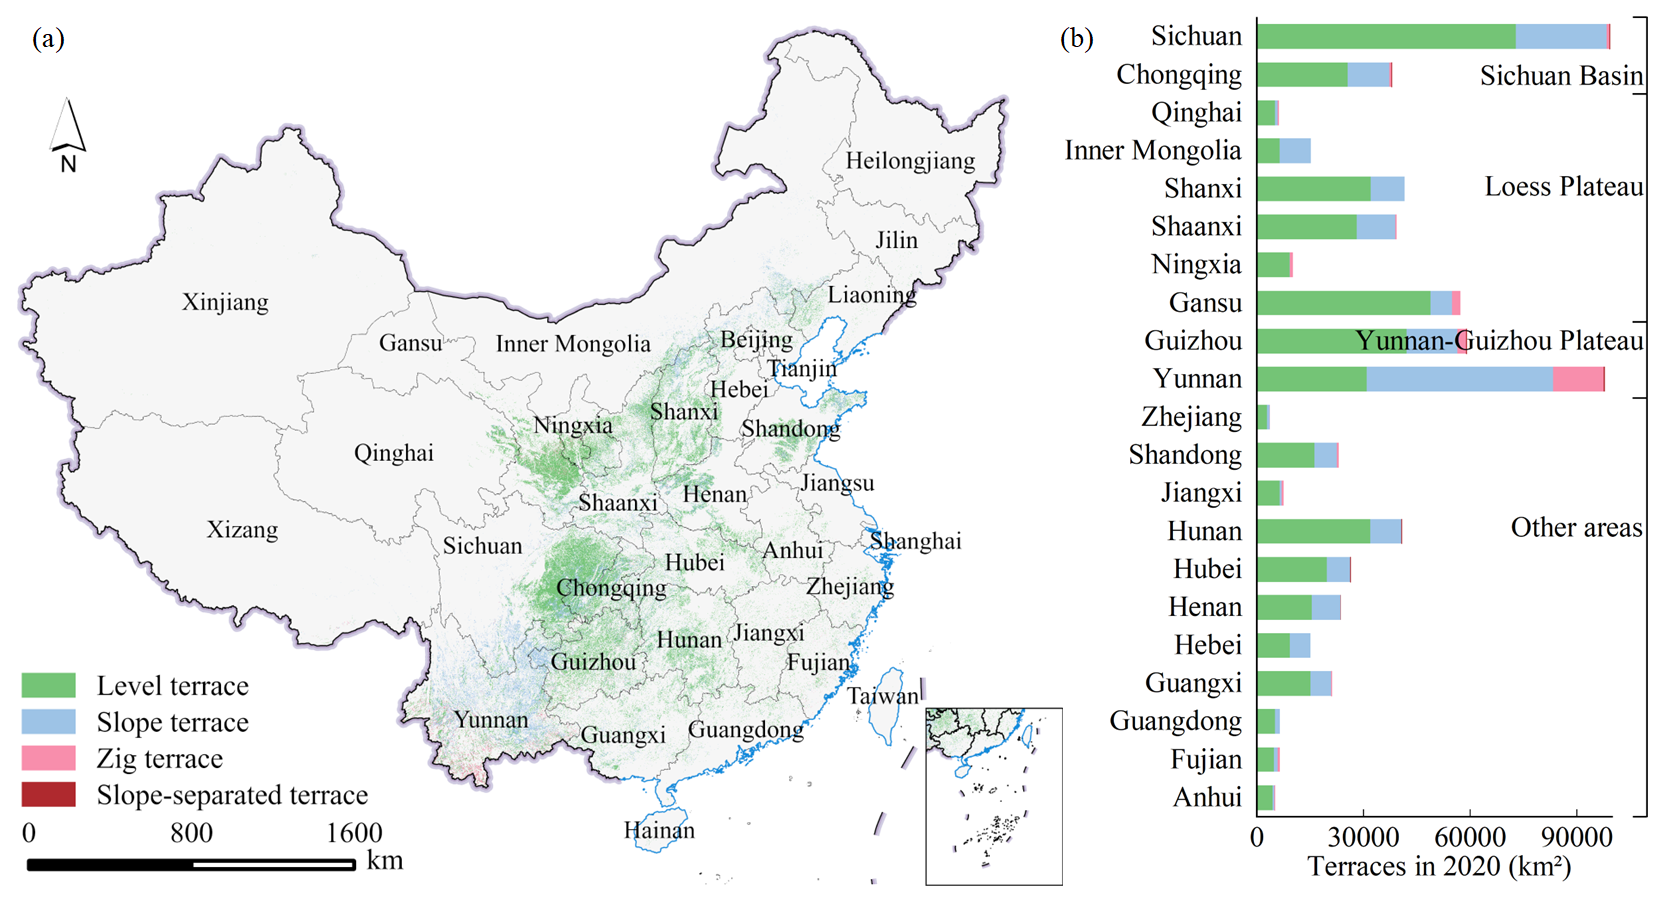
Figure 5The spatial patterns of different terrace types at the pixel and provincial. (a) The spatial distribution of different terraces in China in 2020. (b) The different terrace areas in provinces in 2020.
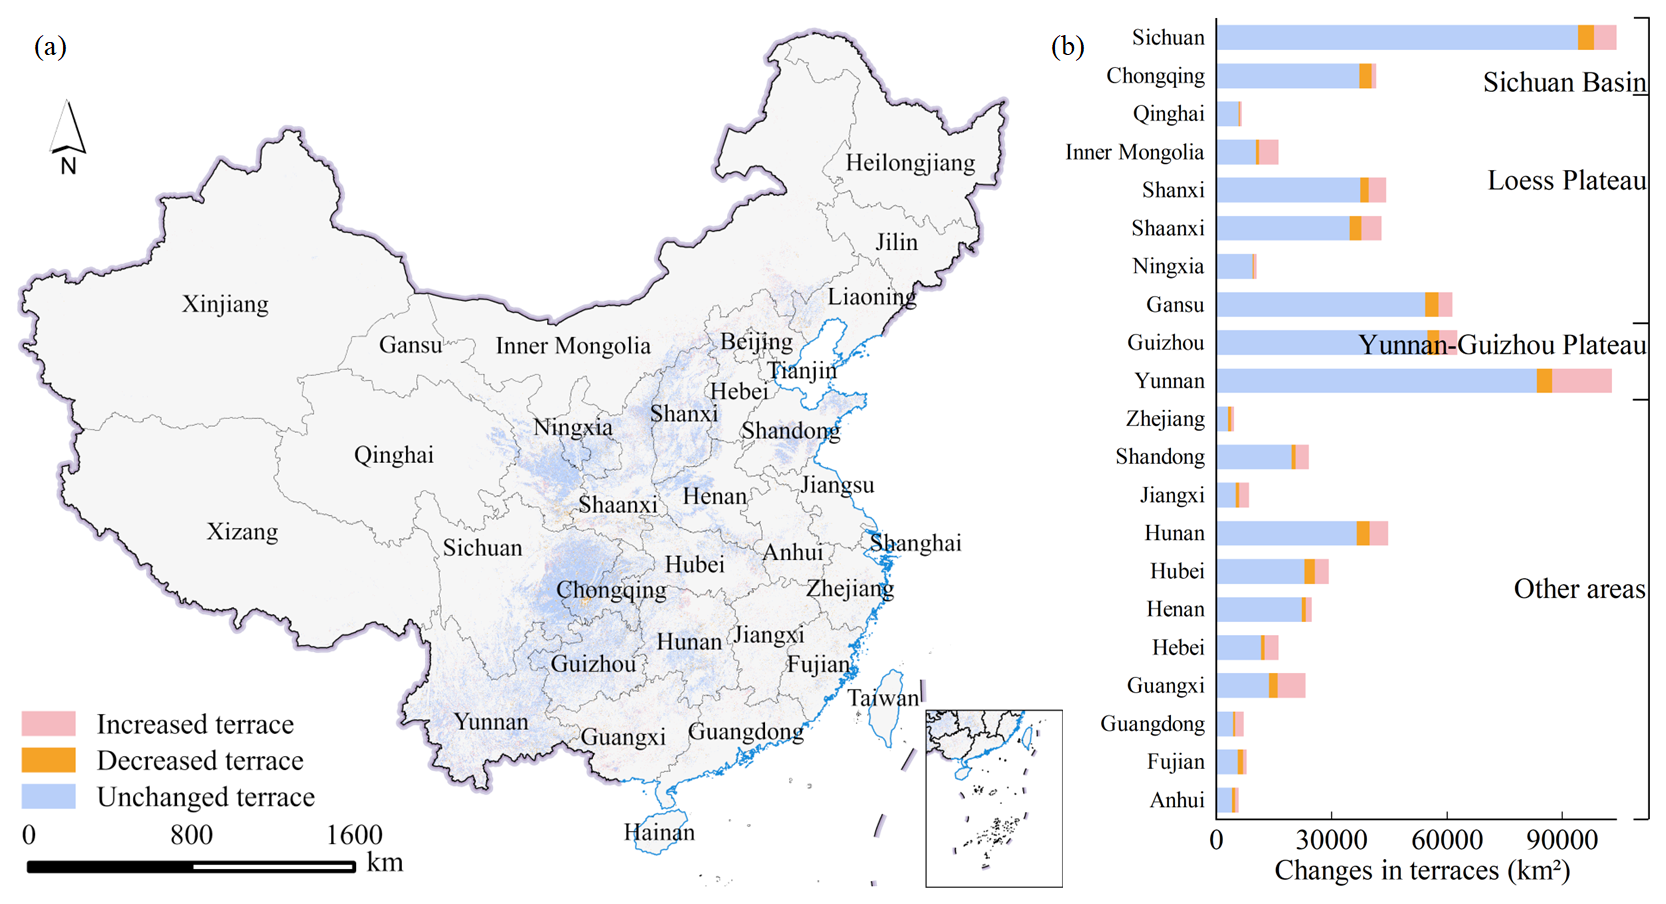
Figure 6The spatial changes of the terrace at the pixel and provincial. (a) The spatial changes in terraces from 2000 to 2020. (b) Changes in the terrace areas across different provinces from 2000 to 2020.
The provinces with the largest terrace areas were Sichuan, Yunnan, Guizhou, Gansu, Shanxi, Hunan, Shaanxi, and Chongqing, while other provinces had relatively smaller terrace areas (Fig. 7a). Among these, Chongqing, Sichuan, Guizhou, and Yunnan exhibited the highest percentage of terraces, with over 80 % of cropland converted to terraces (Fig. 7b). From 2000 to 2020, Yunnan, Guangxi, Shanxi, and Shaanxi experienced the most significant increases in terrace areas, increasing by 11 372.4 km2 (13.1 %), 5192.4 km2 (32.9 %), 2395 km2 (6.1 %), and 2295 km2 (6.2 %), respectively (Fig. 7a). In terms of terrace types, the areas of level terraces, slope terraces, zig terraces and slope-separated terraces increased by 5701.4 km2 (1.3 %), 29 876.3 km2 (18.9 %), 5886.5 km2 (31.4 %), and 129.9 km2 (24.9 %), respectively, with the slope terrace having the largest increase (Fig. 7c, d, e and f). Overall, China's total terrace area expanded from 612 885.4 km2 in 2000 to 654 479.5 km2 in 2020, an increase of 6.8 % (Fig. 7g).
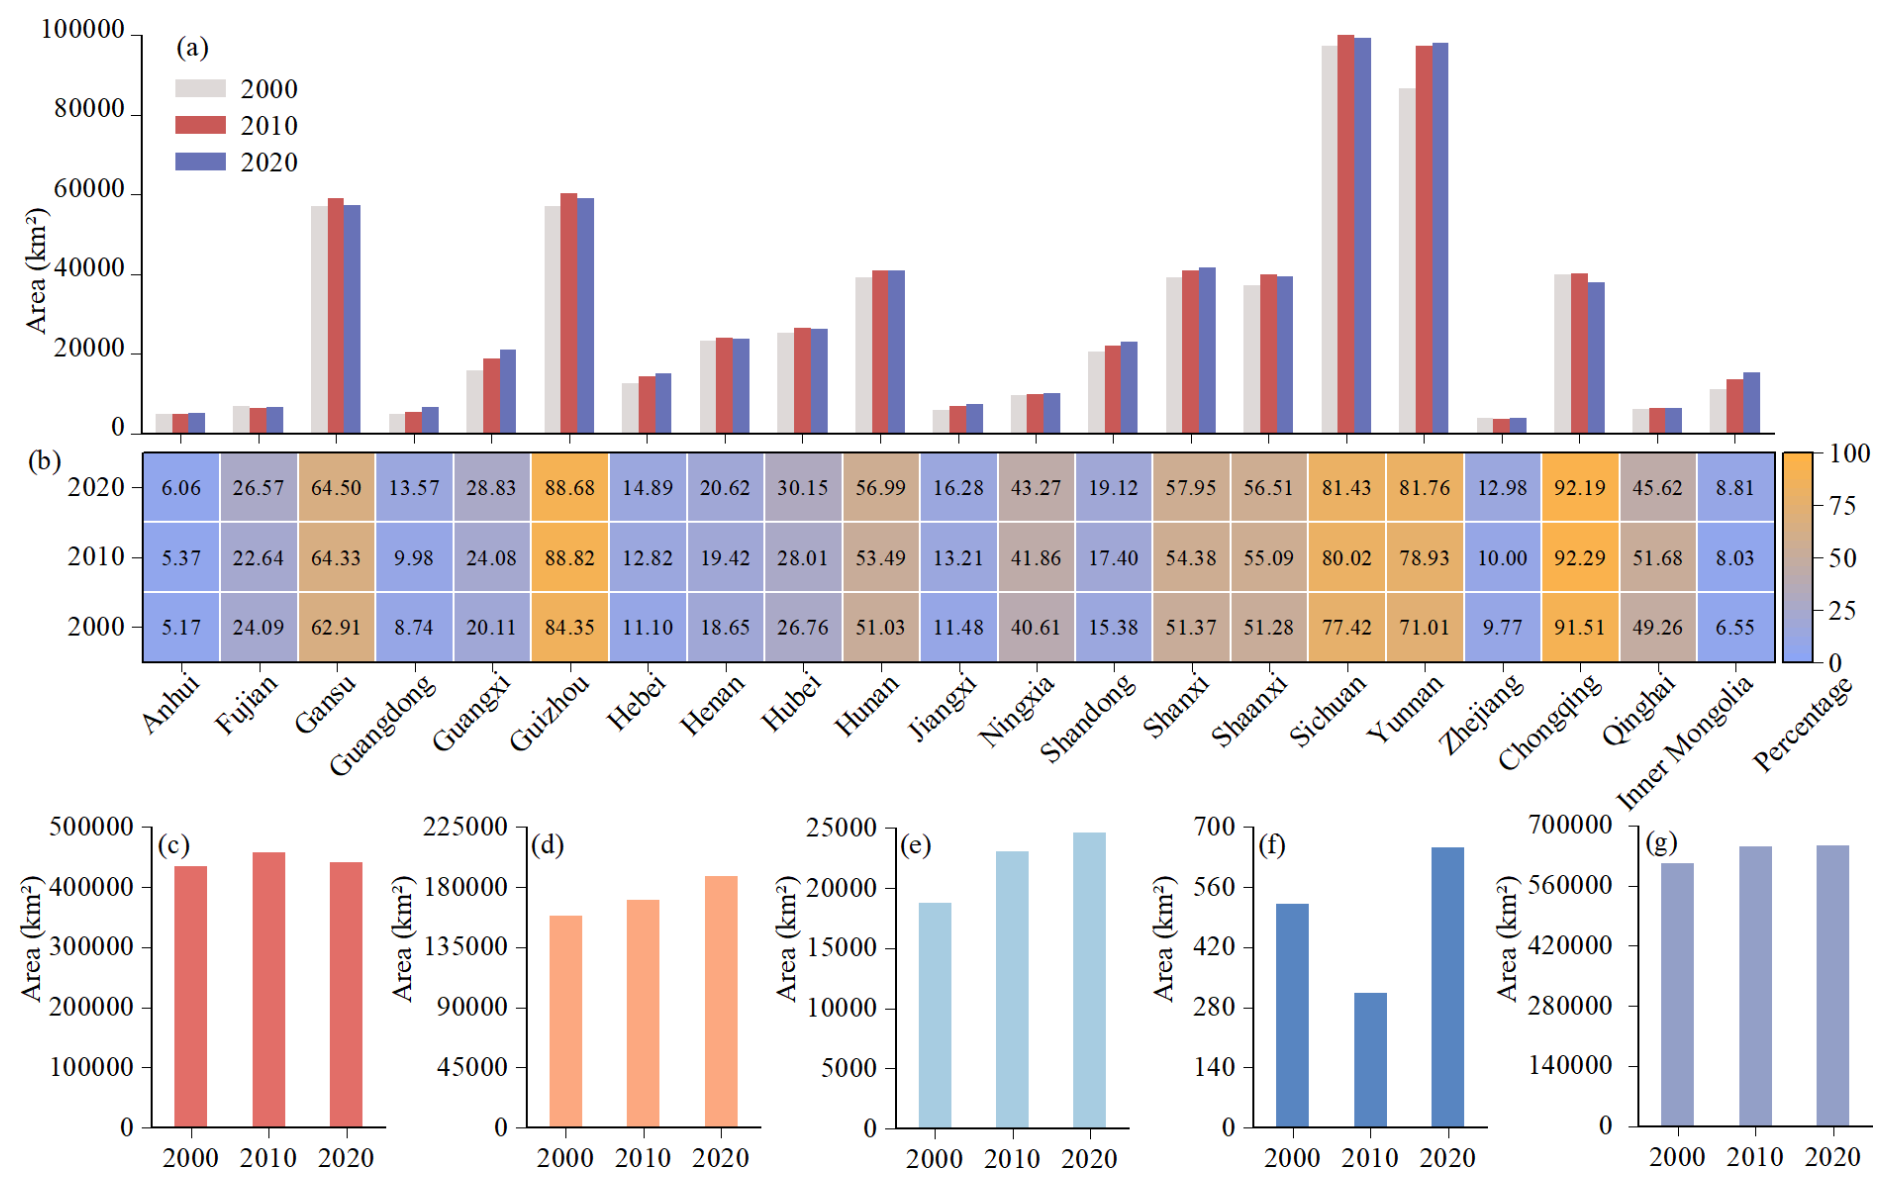
Figure 7The changes of terrace areas at provincial and types from 2000 to 2020. (a) The changes of terrace area in different provinces. (b) The proportion of terraces to cropland in different provinces. (c–f) The areas of level terrace, slope terrace, zig terrace, and slope-separated terrace. (g) The total terrace areas of China.
3.4 SWC measure factor and responses of soil erosion to terraces
The SWC measure factor (E) value for each terrace measure was given according to the FNCW and published literature (Table S12) (Duan et al., 2020; Liu et al., 2020). Using these parameters, we generated spatial distribution maps of E for the years 2000, 2010, and 2020 (Fig. S3). With these data, we utilized the CSLE to assess cropland soil erosion across China in 2020 (Notes S1, S2 and S3). Figure 8 illustrates the soil erosion modulus under the terrace scenario in 2020. The average soil erosion modulus for cropland was 8 t ha−1 yr−1, with a total eroded area of 842 685 km2. Compared to the scenario without terrace measures, the average soil erosion modulus of cropland decreased by 7 t ha−1 yr−1 (46.5 %), and the erosion area was reduced by 223 134.8 km2 (20.9 %) (Fig. S4a and b). Collectively, terrace measures reduced approximately 1390 million tons of cropland soil erosion, accounting for 46.5 % of the total erosion on croplands. Spatially, the reduction in erosion was primarily concentrated in the Loess Plateau, Sichuan Basin, and Yunnan-Guizhou Plateau. Ningxia, Gansu, Sichuan, Chongqing, Qinghai, Guizhou, Shanxi, and Yunnan exhibited the largest decreases, with reductions of about 65 %–75 %.
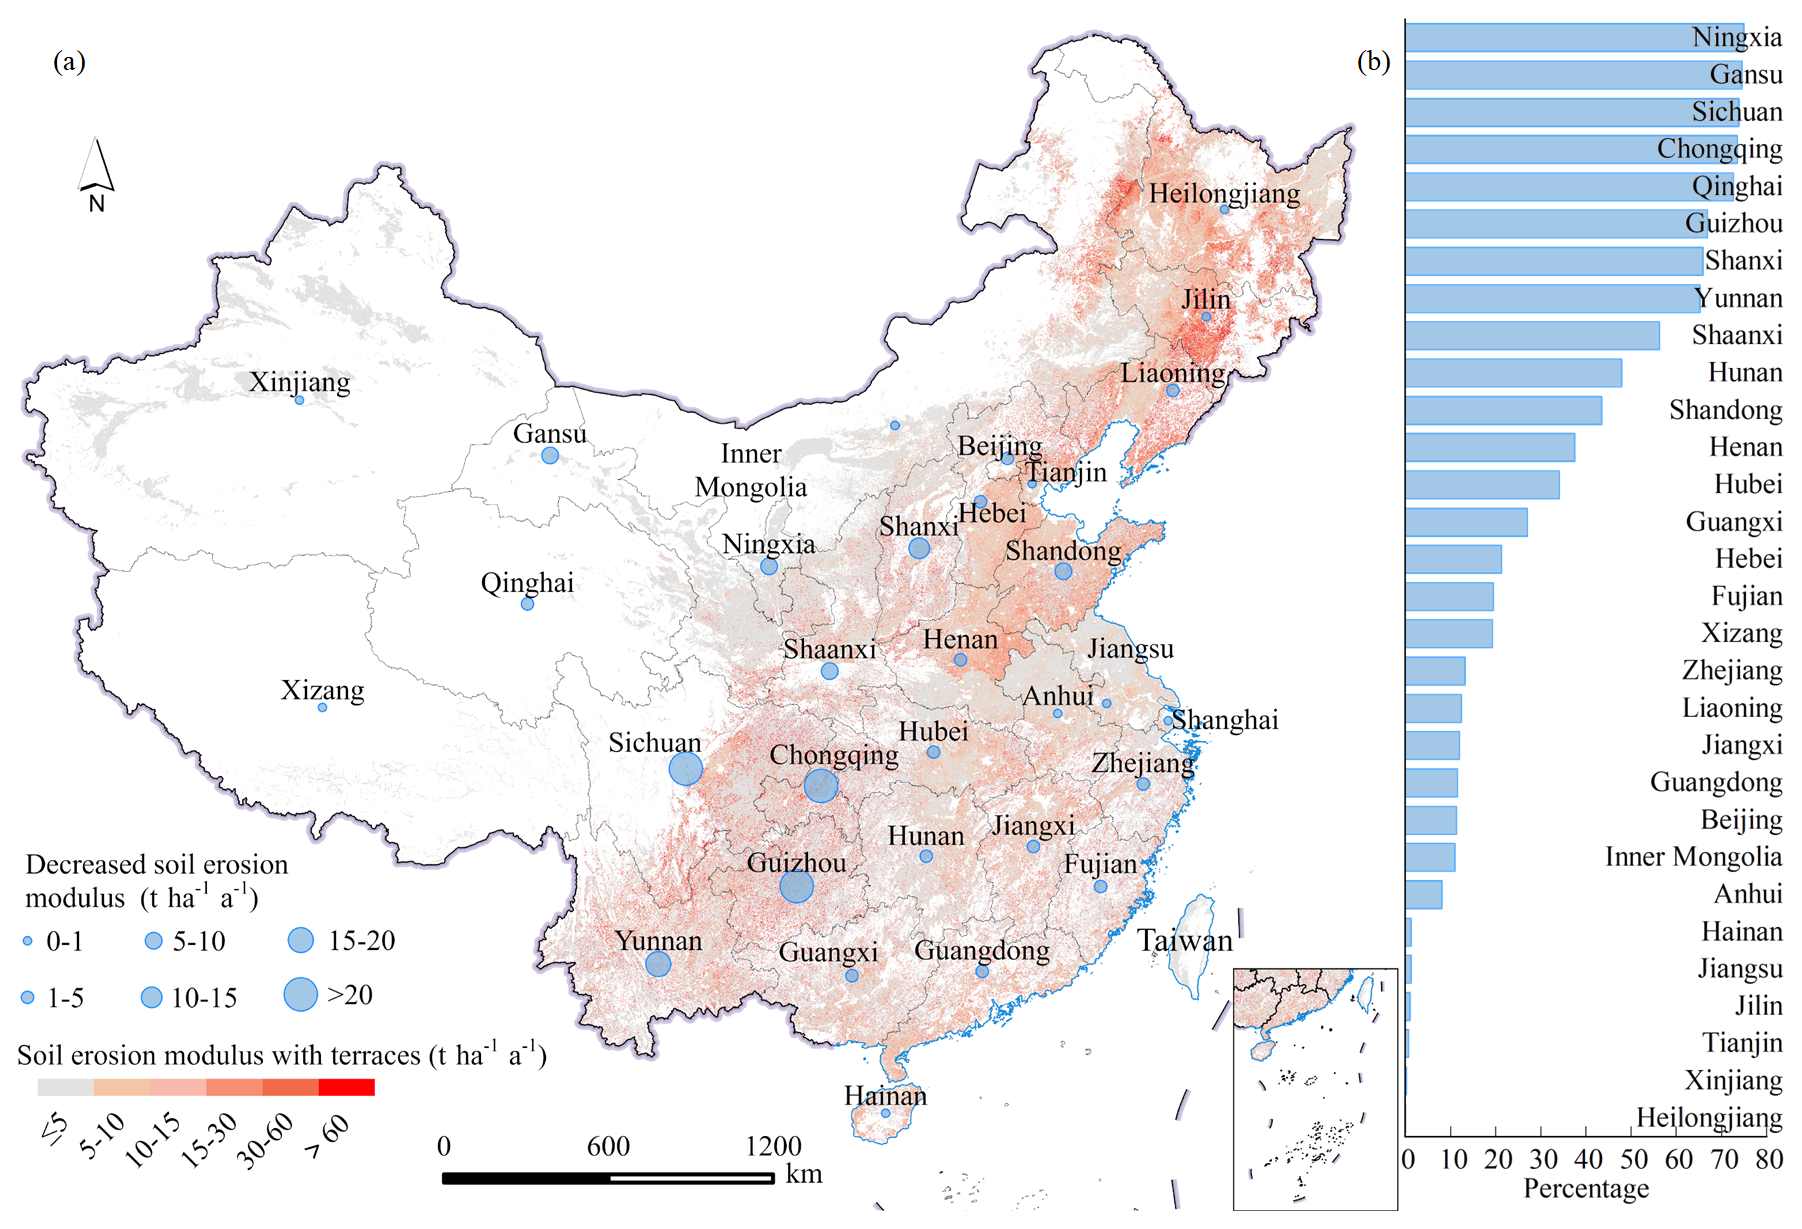
Figure 8The effects of terraces on soil erosion in different provinces. (a) The soil erosion alleviated by terraces. (b) The percentage represents the amount of soil erosion alleviated by terraces as a proportion of the total soil erosion without terraces.
4.1 Comprehensive and Reliability of SWCTMD
We compared the 2020 terrace area estimated by SWCTMD with those from CTM2018 and CTM2017. SWCTMD exhibited the largest terrace area compared to CTM2018 and CTM2017. The areal discrepancies can be attributed to the following reasons. First, CTM2017 and CTM2018 predominantly focused on the most typical level terraces, whereas our research encompasses a broader range of terrace types, including non-typical terraces such as slope terraces, zig terraces, and slope-separated terrace. Second, each dataset employed distinct cropland for terrace classification. SWCTMD utilized the union of cropland with slopes exceeding 2° from the 2000, 2010, and 2020 GlobeLand30 cropland data, whereas CTM2018 employed only the 2010 GlobeLand30 cropland data, and CTM2017 adopted FROM-GLC cropland data. Third, CTM2018 excluded isolated patches smaller than 9000 m2 from its classification scheme. However, since SWCTMD constrains its classification to cropland with slopes exceeding 2°, the identified terrace areas in Anhui, Fujian, Jiangxi, and Zhejiang provinces were smaller than those from CTM2018. In these provinces, CTM2018 included terraces with slopes below 2°, which is classified as non-terraces according to the technical regulations of the third nationwide land survey. Overall, our dataset provides more comprehensive coverage for terraces and exhibits higher accuracy and robustness.
4.2 Spatial pattern of terraces
The Sichuan Basin, Loess Plateau, and the Yunnan-Guizhou Plateau are the three regions with the highest concentration of terraces in China. Other areas, characterized by relatively gentle slopes, have fewer terraces. In the hilly areas of the Sichuan Basin and the Yunnan-Guizhou Plateau, humans have constructed terraces through a long-term process of adapting to nature by reshaping mountainous landscapes (Zhang et al., 2008; Duan et al., 2020). This process has also fostered unique cultural and social practices associated with terraces (Zhan and Jin, 2015; Zhang et al., 2024). These regions face challenges such as limited cultivated land resources, steep slopes, and intense precipitation (Liu et al., 2014; Li et al., 2016; Wang and Dai, 2020). The construction of terraces not only produces additional cultivable land but also optimizes water resource utilization and reduces soil erosion (Wei et al., 2017).
In recent years, the Chinese Land Consolidation projects and the Well-Facilitated Farmland projects have prioritized slope-to-terrace conversion as the primary land consolidation strategy in mountainous regions (Tang et al., 2019). This initiative has significantly increased the terrace area in southwestern China. In the Loess Plateau, terraces are primarily constructed for SWC and ecological restoration. Natural factors such as fragmented mountainous terrain, loose soil, and intense rainfall, combined with human activities of deforestation, overgrazing, and cultivation on steep slope, have made the Loess Plateau one of China's most severely eroded regions (Wang et al., 2010; Liang et al., 2015). Over the past few decades, large-scale programs such as Grain-for-Green and terrace construction initiatives have been implemented to combat soil and water loss (Fu et al., 2017). Most terraces in the Loess Plateau are dryland terraces, predominantly located in Gansu, Ningxia, Shanxi, and Shaanxi Provinces. In northeast China, cropland have long slope lengths, and gentle slope degrees (Liu et al., 2020), resulting in fewer terraces being built. In contrast, in the hilly regions of central and southeastern China, terraces have also been constructed despite gentler slopes. Unlike the Sichuan Basin, Loess Plateau, and Yunnan-Guizhou Plateau, where terraces serve as a necessity for managing steep terrain, the primary motivation in these areas is to expand the amount of land for the cultivation of economic crops such as tea and fruit trees (Li et al., 2022b). However, in mountainous and hilly regions, urban expansion has occupied some formerly terraced areas.
4.3 Soil conservation of terraces
Due to the lack of large-scale terrace distribution data, many previous continental-scale soil erosion assessments have generally not considered the influence of terraces, such as Europe, Australia, and Africa (Gobin et al., 2004; Teng et al., 2016; Salhi et al., 2025). This has led to overestimation of cropland soil erosion. Wang et al. (2021b) estimated cropland erosion at 1939.7 × 106 t in 2015 without accounting for terraces. Conversely, our study indicated cropland erosion at 1599.4 × 106 t in 2020, closely aligning with the 2011 FNCW result of 1640.0 × 106 t. Regarding the erosion reduction effects of terraces, Li et al. (2024) mapped terrace in 2017 and found that terraces reduced cropland erosion by 950 million tons. In contrast, our study estimates that terraces reduced cropland erosion by 1390 million tons in 2020. The discrepancy between the two results from Li et al. (2024) failure to distinguish between terrace types, resulting in an underestimation of terrace benefits.
According to our estimate, soil erosion of the Loess Plateau accounted for only 12.6 % of the total cropland erosion. Terraces in this region contributed to 17.4 % of the total reduction of cropland soil erosion, demonstrating the benefits of terraces to SWC. In Northeast China, terraces are sparse, and cropland is characterized by long slope lengths and gentle slope degrees, with erosion accounting for 27.6 % of the total cropland erosion. In Southwest China, erosion amount accounted for 23.4 % of total cropland erosion. Northeast and Southwest China should be the key areas for future soil erosion protection efforts. In Hebei, Henan, and Shandong Provinces, extensive cultivation and high crop planting intensity contributed 16.3 % of the total cropland erosion, which warrants attention. In this study, each terrace type was assigned a fixed E value to facilitate the estimation of large-scale soil erosion. However, this approach overlooks spatial heterogeneity in terrace structure, maintenance status, field management, climate, and topography. Future research should incorporate regional characteristics and adjust the E-value accordingly.
4.4 Limitations and prospects
The spatial heterogeneity of land types frequently leads to class imbalance in remote sensing classification, consequently diminishing classification accuracy for minority classes that occupy a smaller area (Xiao et al., 2024). The models tend to favor majority classes during training, reducing their ability to accurately identify minority classes (Chen et al., 2025). When the ratio of samples across different classes remains balanced, classification performance typically falls short of optimal accuracy thresholds (Deng et al., 2025). A common strategy to alleviate this negative effect is to divide the study area into multiple sub-regions for localized classification, thereby reducing the impact of sample imbalance on model accuracy (Zhang et al., 2020). In this study, we employed a partitioned two-stage RF approach to reduce the effects of sample imbalance on classification accuracy. The results demonstrated that classification for terrace and different terrace types achieved satisfactory accuracy in both the entire study area and individual subregions. However, the accuracy metrics of the majority class were still higher than those of the minority class. In future studies, sample optimization techniques and more advanced classification methods could be combined to further improve the accuracy of minority class classification.
The complex and diversity diverse landform types have resulted in differences in the spectral information and topographic features of terraces in different regions. In Southwest and Northwest China, terraces exhibit concentrated distributions with clearly defined characteristics, making them easily identifiable. However, South China, Central China, and East China have relatively low topographic relief. Some terraces have spectral and topographic features similar to those of sloping farmland and flatland. This similarity, combined with the presence of mixed pixels in medium-resolution imagery (Wang et al., 2021a), makes it challenging to detect the terrace patches. Although the classification used 30 m Landsat imagery in this study was generally robust, some fragmented and narrow terraces were omitted. Future research could employ high-resolution remote sensing images to effectively identify fragmented and narrow terraces. Previous small-scale studies have demonstrated that the use of high-resolution remote sensing imagery, combined with object-based classification methods and deep learning approaches, can significantly enhance classification accuracy and reduce the impact of spectral confusion and mixed pixels on terrace identification (Diaz-Varela et al., 2014; Wang et al., 2023; Kan et al., 2025). To improve classification accuracy and efficiency, cropland data were used as the basis for terrace identification. Inevitably, the accuracy of cropland data impacts the terrace mapping process, as errors in cropland data propagate into the terrace maps. In summary, future studies could utilize high-resolution remote sensing imagery and more accurate cropland datasets, and adopt sample optimization techniques and more advanced classification algorithms to improve the detection of subpixel terrace distributions.
The Landsat imagery and Copernicus DEM data were acquired from the Google Earth Engine. The GlobeLand30 data can be downloaded from the National Geomatics Center of China. The 1 km spatial resolution SWCTMD (calculated from the 30 m resolution SWCTMD) can be accessed at https://doi.org/10.11888/Terre.tpdc.302400 (Duan, 2025). The 30 m resolution SWCTMD is also available from https://doi.org/10.11888/Terre.tpdc.302400.
This study developed the first SWC terrace measures dataset for China with a fine classification system at a spatial resolution of 30 m. The dataset includes data for each decade from 2000 to 2020. The dataset was generated by combining the full archive of Landsat imagery, DEM, and nationally scaled samples obtained by manual visualization, using a two-stage random forest classification on the GEE platform. The average OA and average F1 scores for identifying terraces and non-terraces were 91.7 % and 88.9%, respectively. For different terrace types, the average OA and F1 scores were 89.4 % and 78.9 %, respectively.
Compared to existing terrace datasets, the newly developed dataset provides more comprehensive coverage, especially in identifying zig terraces in southwest China. The analysis revealed that terraces were primarily distributed in the Loess Plateau, Southwest China, and Southeast China. From 2000 to 2020, the total terrace areas expanded by 41 594.1 km2, with level terraces increasing by 5701.4 km2, slope terraces by 29 876.3 km2, slope-separated terraces by 129.9 km2, and zig terraces by 5886.5 km2. Terrace expansion was mainly concentrated in the Loess Plateau and the Southwest and Southeast regions of China, while the decreases in terraced area primarily occurred around urban areas.
Terraces in China are estimated to have reduced soil erosion on cropland by approximately 1390 million tons. Further analysis highlighted the benefits of SWC in the Yunnan-Guizhou Plateau and Loess Plateau areas. The terrace dataset, with its detailed classification system is expected to provide a cornerstone for national and regional soil erosion assessment and prediction, SWC planning, and evaluations of various ecosystem services related to terraces.
The supplement related to this article is available online at https://doi.org/10.5194/essd-17-6315-2025-supplement.
XD conceived and designed the study. EZ conducted the construction of the dataset and wrote the manuscript. EZ, HW, BD collected the data. CL provided the technical support. SW, HL, XY and YL provided assistance with the data analysis. YC and XD edited and revised the manuscript.
The contact author has declared that none of the authors has any competing interests.
Regarding the maps used in this paper, please note that Figs. 2, 3, 4, 5, 6, and 8 contain disputed territories.Publisher’s note: Copernicus Publications remains neutral with regard to jurisdictional claims made in the text, published maps, institutional affiliations, or any other geographical representation in this paper. While Copernicus Publications makes every effort to include appropriate place names, the final responsibility lies with the authors. Also, please note that this paper has not received English language copy-editing. Views expressed in the text are those of the authors and do not necessarily reflect the views of the publisher.
We express our great gratitude to the free access to the Landsat data provided by the USGS, Copernicus DEM provided under COPERNICUS by the European Union and European Space Agency (ESA), GlobeLand30 provided by the National Geomatics Center of China, and the cloud computing power provided by GEE.
This research was supported by the National Natural Science Foundation Project of China (grant nos. U24A20581 and 42271128), the National Key Research and Development Program of China (grant no. 2023YFD1901201), Distinguished Young Found Project of Yunnan Province (grant no. 202201AV070001), the Training Program of the Innovation Guidance and Scientific and Technological Enterprise of Yunnan Province (grant no. 202304BT090019), the Yuanjiang Dry-hot Valley Water and Soil Conservation Observation and Research Station of Yunnan Province.
This paper was edited by Yuanzhi Yao and reviewed by Weilin Liao and three anonymous referees.
Adgo, E., Teshome, A., and Mati, B.: Impacts of long-term soil and water conservation on agricultural productivity: The case of Anjenie watershed, Ethiopia, Agric. Water Manage., 117, 55–61, https://doi.org/10.1016/j.agwat.2012.10.026, 2013.
Arnáez, J., Lana-Renault, N., Lasanta, T., Ruiz-Flaño, P., and Castroviejo, J.: Effects of farming terraces on hydrological and geomorphological processes. A review, Catena, 128, 122–134, https://doi.org/10.1016/j.catena.2015.01.021, 2015.
Cao, B., Yu, L., Naipal, V., Ciais, P., Li, W., Zhao, Y., Wei, W., Chen, D., Liu, Z., and Gong, P.: A 30 m terrace mapping in China using Landsat 8 imagery and digital elevation model based on the Google Earth Engine, Earth Syst. Sci. Data, 13, 2437–2456, https://doi.org/10.5194/essd-13-2437-2021, 2021.
Chen, D., Wei, W., and Chen, L.: Effects of terracing practices on water erosion control in China: A meta-analysis, Earth Sci. Rev., 173, 109–121, https://doi.org/10.1016/j.earscirev.2017.08.007, 2017.
Chen, D., Wei, W., and Chen, L.: How can terracing impact on soil moisture variation in China? A meta-analysis, Agric. Water Manage., 227, 105849, https://doi.org/10.1016/j.agwat.2019.105849, 2020.
Chen, J., Chen, J., Liao, A., Cao, X., Chen, L., Chen, X., He, C., Han, G., Peng, S., Lu, M., Zhang, W., Tong, X., and Mills, J.: Global land cover mapping at 30 m resolution: A POK-based operational approach, ISPRS J. Photogramm. Remote Sens., 103, 7–27, https://doi.org/10.1016/j.isprsjprs.2014.09.002, 2015.
Chen, P., Ren, Y., Zhang, B., and Zhao, Y.: Class Imbalance in the Automatic Interpretation of Remote Sensing Images: A Review, IEEE J. Sel. Top. Appl. Earth Obs. Remote Sens., 18, 9483–9508, https://doi.org/10.1109/JSTARS.2025.3555567, 2025.
Chen, R., Yin, B., Yang, W., Li, J., Li, Z., Zhang, Y., and Chen, J.: Mapping the successional stages of biological soil crusts at 3-m resolution in the Gurbantunggut Desert, China through hydration-induced spectral response, Remote Sens. Environ., 310, 114230, https://doi.org/10.1016/j.rse.2024.114230, 2024.
Chen, S.-K., Chen, Y.-R., and Peng, Y.-H.: Experimental study on soil erosion characteristics in flooded terraced paddy fields, Paddy Water Environ., 11, 433–444, https://doi.org/10.1007/s10333-012-0334-2, 2013.
de Oliveira, J. R. S., Pruski, F. F., da Silva, J. M. A., and da Silva, D. P.: Comparative analysis of the performance of mixed terraces andevel and graded terraces, Acta Sci.-Agron., 34, 351–357, https://doi.org/10.4025/actasciagron.v34i4.14755, 2012.
Deng, C., Zhang, G., Liu, Y., Nie, X., Li, Z., Liu, J., and Zhu, D.: Advantages and disadvantages of terracing: A comprehensive review, Int. Soil Water Conserv. Res., 9, 344–359, https://doi.org/10.1016/j.iswcr.2021.03.002, 2021.
Deng, Y., Chen, G., Tang, B., Duan, X., Zuo, L., and Zhao, H.: Study on Class Imbalance in Land Use Classification for Soil Erosion in Dry–Hot Valley Regions, Remote Sens., 17, 1628, https://doi.org/10.3390/rs17091628, 2025.
Diaz-Varela, R. A., Zarco-Tejada, P. J., Angileri, V., and Loudjani, P.: Automatic identification of agricultural terraces through object-oriented analysis of very high resolution DSMs and multispectral imagery obtained from an unmanned aerial vehicle, J. Environ. Manage., 134, 117–126, https://doi.org/10.1016/j.jenvman.2014.01.006, 2014.
Duan, M., Song, X., Li, Z., Zhang, X., Ding, X., and Cui, D.: Identifying soil groups and selecting a high-accuracy classification method based on multi-textural features with optimal window sizes using remote sensing images, Ecol. Inf., 81, 102563, https://doi.org/10.1016/j.ecoinf.2024.102563, 2024.
Duan, X.: The soil and water conservation terrace measures in China (2000-2020), National Tibetan Plateau Data Center [data set], https://doi.org/10.11888/Terre.tpdc.302400, 2025.
Duan, X., Bai, Z., Rong, L., Li, Y., Ding, J., Tao, Y., Li, J., Li, J., and Wang, W.: Investigation method for regional soil erosion based on the Chinese Soil Loss Equation and high-resolution spatial data: Case study on the mountainous Yunnan Province, China, Catena, 184, 104237, https://doi.org/10.1016/j.catena.2019.104237, 2020.
Feng, W., Yang, Y., Zhao, Y., Di, B., and Ma, C.: The Implementation Effects of a Nationwide Sloping Farmland Soil Erosion Control Project in China, J. Resour. Ecol., 8, 341–351, https://doi.org/10.5814/j.issn.1674-764x.2017.04.005, 2017.
Fu, B., Wang, S., Liu, Y., Liu, J., Liang, W., and Miao, C.: Hydrogeomorphic Ecosystem Responses to Natural and Anthropogenic Changes in the Loess Plateau of China, Annu. Rev. Earth Planet. Sci., 45, 223–243, https://doi.org/10.1146/annurev-earth-063016-020552, 2017.
Gobin, A., Jones, R., Kirkby, M., Campling, P., Govers, G., Kosmas, C., and Gentile, A. R.: Indicators for pan-European assessment and monitoring of soil erosion by water, Environ. Sci. Policy, 7, 25–38, https://doi.org/10.1016/j.envsci.2003.09.004, 2004.
Gong, P., Liu, H., Zhang, M., Li, C., Wang, J., Huang, H., Clinton, N., Ji, L., Li, W., Bai, Y., Chen, B., Xu, B., Zhu, Z., Yuan, C., Ping Suen, H., Guo, J., Xu, N., Li, W., Zhao, Y., Yang, J., Yu, C., Wang, X., Fu, H., Yu, L., Dronova, I., Hui, F., Cheng, X., Shi, X., Xiao, F., Liu, Q., and Song, L.: Stable classification with limited sample: transferring a 30-m resolution sample set collected in 2015 to mapping 10-m resolution global land cover in 2017, Sci. Bull., 64, 370–373, https://doi.org/10.1016/j.scib.2019.03.002, 2019.
Gong, P., Chen, B., Li, X., Liu, H., Wang, J., Bai, Y., Chen, J., Chen, X., Fang, L., Feng, S., Feng, Y., Gong, Y., Gu, H., Huang, H., Huang, X., Jiao, H., Kang, Y., Lei, G., Li, A., Li, X., Li, X., Li, Y., Li, Z., Li, Z., Liu, C., Liu, C., Liu, M., Liu, S., Mao, W., Miao, C., Ni, H., Pan, Q., Qi, S., Ren, Z., Shan, Z., Shen, S., Shi, M., Song, Y., Su, M., Ping Suen, H., Sun, B., Sun, F., Sun, J., Sun, L., Sun, W., Tian, T., Tong, X., Tseng, Y., Tu, Y., Wang, H., Wang, L., Wang, X., Wang, Z., Wu, T., Xie, Y., Yang, J., Yang, J., Yuan, M., Yue, W., Zeng, H., Zhang, K., Zhang, N., Zhang, T., Zhang, Y., Zhao, F., Zheng, Y., Zhou, Q., Clinton, N., Zhu, Z., and Xu, B.: Mapping essential urban land use categories in China (EULUC-China): preliminary results for 2018, Sci. Bull., 65, 182–187, https://doi.org/10.1016/j.scib.2019.12.007, 2020.
Guth, P. L. and Geoffroy, T. M.: LiDAR point cloud and ICESat-2 evaluation of 1 second global digital elevation models: Copernicus wins, Trans. GIS, 25, 2245–2261, https://doi.org/10.1111/tgis.12825, 2021.
He, Y., Lee, E., and Warner, T. A.: A time series of annual land use and land cover maps of China from 1982 to 2013 generated using AVHRR GIMMS NDVI3g data, Remote Sens. Environ., 199, 201–217, https://doi.org/10.1016/j.rse.2017.07.010, 2017.
Hirayama, H., Sharma, R. C., Tomita, M., and Hara, K.: Evaluating multiple classifier system for the reduction of salt-and-pepper noise in the classification of very-high-resolution satellite images, Int. J. Remote Sens., 40, 2542–2557, https://doi.org/10.1080/01431161.2018.1528400, 2019.
Kan, G., Gong, J., Wang, B., Li, X., Shi, J., Ma, Y., Wei, W., and Zhang, J.: A Refined Terrace Extraction Method Based on a Local Optimization Model Using GF-2 Images, Remote Sens., 17, https://doi.org/10.3390/rs17010012, 2025.
Li, H., Zhao, J., Yan, B., Yue, L., and Wang, L.: Global DEMs vary from one to another: an evaluation of newly released Copernicus, NASA and AW3D30 DEM on selected terrains of China using ICESat-2 altimetry data, Int. J. Digital Earth, 15, 1149–1168, https://doi.org/10.1080/17538947.2022.2094002, 2022a.
Li, J., He, H., Zeng, Q., Chen, L., and Sun, R.: A Chinese soil conservation dataset preventing soil water erosion from 1992 to 2019, Sci. Data, 10, 319, https://doi.org/10.1038/s41597-023-02246-4, 2023.
Li, K., Yang, J., Wang, J., Wang, Z., Zeng, Y., Borrelli, P., Hubacek, K., Hu, Y., Xu, B., Fang, N., Zeng, C., Zhou, Z., and Shi, Z.: Human-altered soil loss dominates nearly half of water erosion in China but surges in agriculture-intensive areas, One Earth, https://doi.org/10.1016/j.oneear.2024.09.001, 2024.
Li, N., Zhang, Y., Wang, T., Li, J., Yang, J., and Luo, M.: Have anthropogenic factors mitigated or intensified soil erosion over the past three decades in South China?, J. Environ. Manage., 302, 114093, https://doi.org/10.1016/j.jenvman.2021.114093, 2022b.
Li, Z., Xu, X., Yu, B., Xu, C., Liu, M., and Wang, K.: Quantifying the impacts of climate and human activities on water and sediment discharge in a karst region of southwest China, J. Hydrol., 542, 836–849, https://doi.org/10.1016/j.jhydrol.2016.09.049, 2016.
Liang, W., Bai, D., Wang, F., Fu, B., Yan, J., Wang, S., Yang, Y., Long, D., and Feng, M.: Quantifying the impacts of climate change and ecological restoration on streamflow changes based on a Budyko hydrological model in China's Loess Plateau, Water Resour. Res., 51, 6500–6519, https://doi.org/10.1002/2014WR016589, 2015.
Liao, Z., Nobis, M. P., Xiong, Q., Tian, X., Wu, X., Pan, K., Zhang, A., Wang, Y., and Zhang, L.: Potential distributions of seven sympatric sclerophyllous oak species in Southwest China depend on climatic, non-climatic, and independent spatial drivers, Ann. For. Sci., 78, 5, https://doi.org/10.1007/s13595-020-01012-5, 2021.
Liu, B., Liu, Y., Zhang, K., and Xie, Y.: Classification for Soil Conservation Practices in China, J. Soil Water Conserv., 27, 80–84, https://doi.org/10.13870/j.cnki.stbcxb.2013.02.025, 2013a.
Liu, B., Xie, Y., Li, Z., Liang, Y., Zhang, W., Fu, S., Yin, S., Wei, X., Zhang, K., Wang, Z., Liu, Y., Zhao, Y., and Guo, Q.: The assessment of soil loss by water erosion in China, Int. Soil Water Conserv. Res., 8, 430–439, https://doi.org/10.1016/j.iswcr.2020.07.002, 2020.
Liu, J., Zhang, Z., Xu, X., Kuang, W., Zhou, W., Zhang, S., Li, R., Yan, C., Yu, D., Wu, S., and Jiang, N.: Spatial patterns and driving forces of land use change in China during the early 21st century, J. Geogr. Sci., 20, 483–494, https://doi.org/10.1007/s11442-010-0483-4, 2010.
Liu, M., Xu, X., Sun, A. Y., Wang, K., Liu, W., and Zhang, X.: Is southwestern China experiencing more frequent precipitation extremes?, Environ. Res. Lett., 9, 064002, https://doi.org/10.1088/1748-9326/9/6/064002, 2014.
Liu, S. L., Dong, Y. H., Li, D., Liu, Q., Wang, J., and Zhang, X. L.: Effects of different terrace protection measures in a sloping land consolidation project targeting soil erosion at the slope scale, Ecol. Eng., 53, 46–53, https://doi.org/10.1016/j.ecoleng.2012.12.001, 2013b.
Liu, X., Xin, L., and Lu, Y.: National scale assessment of the soil erosion and conservation function of terraces in China, Ecol. Indic., 129, 107940, https://doi.org/10.1016/j.ecolind.2021.107940, 2021.
Londero, A. L., Minella, J. P. G., Deuschle, D., Schneider, F. J. A., Boeni, M., and Merten, G. H.: Impact of broad-based terraces on water and sediment losses in no-till (paired zero-order) catchments in southern Brazil, J. Soils Sediments, 18, 1159–1175, https://doi.org/10.1007/s11368-017-1894-y, 2018.
Lu, M., Wu, W., Zhang, L., Liao, A., Peng, S., and Tang, H.: A comparative analysis of five global cropland datasets in China, Sci. China Earth Sci., 59, 2307–2317, https://doi.org/10.1007/s11430-016-5327-3, 2016.
Lu, Y., Li, X., Xin, L., Song, H., and Wang, X.: Mapping the terraces on the Loess Plateau based on a deep learning-based model at 1.89 m resolution, Sci. Data, 10, 115, https://doi.org/10.1038/s41597-023-02005-5, 2023.
Masek, J. G., Vermote, E. F., Saleous, N. E., Wolfe, R., Hall, F. G., Huemmrich, K. F., Feng, G., Kutler, J., and Teng-Kui, L.: A Landsat surface reflectance dataset for North America, 1990–2000, IEEE Geosci. Remote Sens. Lett., 3, 68–72, https://doi.org/10.1109/LGRS.2005.857030, 2006.
Ministry of Natural Resources of the People's Republic of China: Technical regulation of the third nationwide land survey, TD/T 1055-2019, https://www.ndls.org.cn/standard/detail/3cc17fba5de2a1c2b934cb38fac7c88b (last access: 18 September 2025), 2019.
Renard, K. G., Foster, G. A., Weesies, D. K. M., and Yoder, D. C.: Predicting soil erosion by water: a guide to conservation planning with the Revised Universal Soil Loss Equation (RUSLE), Agricultural Research Service, United States Department of Agriculture, Washington D. C., ISBN 9780160489389, 1997.
Rodriguez-Galiano, V. F., Ghimire, B., Rogan, J., Chica-Olmo, M., and Rigol-Sanchez, J. P.: An assessment of the effectiveness of a random forest classifier for land-cover classification, ISPRS J. Photogramm. Remote Sens., 67, 93–104, https://doi.org/10.1016/j.isprsjprs.2011.11.002, 2012.
Roy, D. P., Kovalskyy, V., Zhang, H. K., Vermote, E. F., Yan, L., Kumar, S. S., and Egorov, A.: Characterization of Landsat-7 to Landsat-8 reflective wavelength and normalized difference vegetation index continuity, Remote Sens. Environ., 185, 57–70, https://doi.org/10.1016/j.rse.2015.12.024, 2016.
Salhi, A., Benabdelouahab, S., and Heggy, E.: Soil erosion susceptibility maps and raster dataset for the hydrological basins of North Africa, Sci. Data, 12, 65, https://doi.org/10.1038/s41597-025-04406-0, 2025.
Tang, G., Li, F., and Liu, X.: Extraction of slope terrain factors, in: Course of digital elevation model, 3rd edn., Science Press, Beijing, China, 134–156, ISBN 9787030473981, 2016.
Tang, H., Yun, W., Liu, W., and Sang, L.: Structural changes in the development of China's farmland consolidation in 1998–2017: Changing ideas and future framework, Land Use Policy, 89, 104212, https://doi.org/10.1016/j.landusepol.2019.104212, 2019.
Teng, H., Viscarra Rossel, R. A., Shi, Z., Behrens, T., Chappell, A., and Bui, E.: Assimilating satellite imagery and visible–near infrared spectroscopy to model and map soil loss by water erosion in Australia, Environmental Modelling & Software, 77, 156–167, https://doi.org/10.1016/j.envsoft.2015.11.024, 2016.
Tu, Y., Wu, S., Chen, B., Weng, Q., Bai, Y., Yang, J., Yu, L., and Xu, B.: A 30 m annual cropland dataset of China from 1986 to 2021, Earth Syst. Sci. Data, 16, 2297–2316, https://doi.org/10.5194/essd-16-2297-2024, 2024.
Wang, J., Huang, B., and Luo, W.: Influence mechanism of reverse-slope terrace site preparation for afforestation on runoff formation of slope, Transactions of the Chinese Society of Agricultural Engineering, 20, 292–296, https://doi.org/10.3321/j.issn:1002-6819.2004.05.066, 2004.
Wang, Q., Ding, X., Tong, X., and Atkinson, P. M.: Spatio-temporal spectral unmixing of time-series images, Remote Sens. Environ., 259, 112407, https://doi.org/10.1016/j.rse.2021.112407, 2021a.
Wang, T., Wu, J., Kou, X., Oliver, C., Mou, P., and Ge, J.: Ecologically asynchronous agricultural practice erodes sustainability of the Loess Plateau of China, Ecol. Appl., 20, 1126–1135, https://doi.org/10.1890/09-0229.1, 2010.
Wang, Y. and Dai, E.: Spatial-temporal changes in ecosystem services and the trade-off relationship in mountain regions: A case study of Hengduan Mountain region in Southwest China, J. Cleaner Prod., 264, 121573, https://doi.org/10.1016/j.jclepro.2020.121573, 2020.
Wang, Y., Kong, X., Guo, K., Zhao, C., and Zhao, J.: Intelligent Extraction of Terracing Using the ASPP ArrU-Net Deep Learning Model for Soil and Water Conservation on the Loess Plateau, Agriculture, 13, https://doi.org/10.3390/agriculture13071283, 2023.
Wang, Z., Zeng, Y., Li, C., Yan, H., Yu, S., Wang, L., and Shi, Z.: Telecoupling cropland soil erosion with distant drivers within China, J. Environ. Manage., 288, 112395, https://doi.org/10.1016/j.jenvman.2021.112395, 2021b.
Wei, W., Chen, L., Yang, L., Samadani, F. F., and Sun, G.: Microtopography Recreation Benefits Ecosystem Restoration, Environ. Sci. Technol., 46, 10875–10876, https://doi.org/10.1021/es303294n, 2012.
Wei, W., Chen, D., Wang, L., Daryanto, S., Chen, L., Yu, Y., Lu, Y., Sun, G., and Feng, T.: Global synthesis of the classifications, distributions, benefits and issues of terracing, Earth Sci. Rev., 159, 388–403, https://doi.org/10.1016/j.earscirev.2016.06.010, 2016.
Wei, W., Pan, D., and Yang, Y.: Effects of terracing measures on water retention of pinus Tabulaeformis forest in the dryland loess hilly region of China, Agric. For. Meteorol., 308–309, 108544, https://doi.org/10.1016/j.agrformet.2021.108544, 2021.
Wei, Z., Han, Y., Li, M., Yang, K., Yang, Y., Luo, Y., and Ong, S.-H.: A Small UAV Based Multi-Temporal Image Registration for Dynamic Agricultural Terrace Monitoring, Remote Sens., 9, https://doi.org/10.3390/rs9090904, 2017.
Wickama, J., Okoba, B., and Sterk, G.: Effectiveness of sustainable land management measures in West Usambara highlands, Tanzania, Catena, 118, 91–102, https://doi.org/10.1016/j.catena.2014.01.013, 2014.
Wischmeier, W. H. and Smith, D. D.: Predicting rainfall erosion losses: a guide to conservation planning, Science and Education Administration, Washington D. C., https://books.google.com/books?id=rRAUAAAAYAAJ (last access: 7 November 2025), 1978.
Xiao, Y., Huang, J., Weng, W., Huang, R., Shao, Q., Zhou, C., and Li, S.: Class imbalance: A crucial factor affecting the performance of tea plantations mapping by machine learning, Int. J. Appl. Earth Obs. Geoinf., 129, 103849, https://doi.org/10.1016/j.jag.2024.103849, 2024.
Yang, J. and Huang, X.: The 30 m annual land cover dataset and its dynamics in China from 1990 to 2019, Earth Syst. Sci. Data, 13, 3907–3925, https://doi.org/10.5194/essd-13-3907-2021, 2021.
Yu, L., Wang, J., and Gong, P.: Improving 30 m global land-cover map FROM-GLC with time series MODIS and auxiliary data sets: a segmentation-based approach, Int. J. Remote Sens., 34, 5851–5867, https://doi.org/10.1080/01431161.2013.798055, 2013.
Zhan, G. and Jin, Z.: Hani Rice Terraces of Honghe – The Harmonious Landscape of Nature and Humans, Landscape Res., 40, 655–667, https://doi.org/10.1080/01426397.2015.1060299, 2015.
Zhang, J. H., Su, Z. A., and Liu, G. C.: Effects of terracing and agroforestry on soil and water loss in hilly areas of the Sichuan Basin, China, J. Mountain Sci., 5, 241–248, https://doi.org/10.1007/s11629-008-0189-6, 2008.
Zhang, M., Huang, H., Li, Z., Hackman, K. O., Liu, C., Andriamiarisoa, R. L., Ny Aina Nomenjanahary Raherivelo, T., Li, Y., and Gong, P.: Automatic High-Resolution Land Cover Production in Madagascar Using Sentinel-2 Time Series, Tile-Based Image Classification and Google Earth Engine, Remote Sens., 12, https://doi.org/10.3390/rs12213663, 2020.
Zhang, X., Liu, L., Chen, X., Gao, Y., Xie, S., and Mi, J.: GLC_FCS30: global land-cover product with fine classification system at 30 m using time-series Landsat imagery, Earth Syst. Sci. Data, 13, 2753–2776, https://doi.org/10.5194/essd-13-2753-2021, 2021.
Zhang, Y., Shi, M., Zhao, X., Wang, X., Luo, Z., and Zhao, y.: Methods for automatic identification and extraction of terraces from high spatial resolution satellite data (China-GF-1), Int. Soil Water Conserv. Res., 5, 17–25, https://doi.org/10.1016/j.iswcr.2017.02.002, 2017.
Zhang, Y., Tian, P., Yang, L., Zhao, G., Mu, X., Wang, B., Du, P., Gao, P., and Sun, W.: Relationship between sediment load and climate extremes in the major Chinese rivers, J. Hydrol., 617, 128962, https://doi.org/10.1016/j.jhydrol.2022.128962, 2023.
Zhang, Y., Zhang, A., and Ma, Y.: An integrated mechanism and challenges of mountainous sustainable development: A review of Hani Terraces, China, Sustainable Dev., 32, 101–118, https://doi.org/10.1002/sd.2651, 2024.
Zhu, Z. and Woodcock, C. E.: Object-based cloud and cloud shadow detection in Landsat imagery, Remote Sens. Environ., 118, 83–94, https://doi.org/10.1016/j.rse.2011.10.028, 2012.