the Creative Commons Attribution 4.0 License.
the Creative Commons Attribution 4.0 License.
 | 07 Nov 2025
Global source–receptor-relationship database for integrated tropospheric ozone observations from multiplatform datasets in western North America during 1994–2021
Yu Yan Cui
Ju-Mee Ryoo
Matthew S. Johnson
Kai-Lan Chang
Emma L. Yates
Owen R. Cooper
Long-term atmospheric ozone observations in Western North America (WNA) provide essential data for assessing tropospheric ozone trends. Backward atmospheric simulations based on these observations establish the source–receptor relationships (SRRs) to improve our understanding of the factors driving ozone trends across different regions, time periods, and atmospheric layers. In this study, we integrated 28 years of ozone observations (1994–2021) from ozonesondes, lidar, commercial aircraft, and aircraft campaigns across WNA, spanning the upper atmospheric boundary layer, free troposphere, and upper troposphere (i.e., 900 to 300 hPa). We integrated the multiplatform datasets using a data fusion framework to generate 553 608 gridded ozone receptors. For each receptor, we use the FLEXible PARTicle (FLEXPART) dispersion model, driven by ERA5 reanalysis data, to produce the SRRs calculations, providing global simulations at high temporal (hourly) and spatial (1°×1°) resolution from the surface up to 20 km a.g.l. (above ground level). This SRR database retains detailed information for each receptor, including the gridded ozone value product, which enables user to illustrate and identify source contributions to various subsets of ozone observations in the troposphere above WNA over nearly 3 decades at different vertical layers and temporal scales, such as diurnal, daily, seasonal, intra-annual, and decadal. More generally, the calculated SRRs are applicable to any study looking to evaluate origins of airmasses reaching WNA. As such, this database can support source contribution analyses for other atmospheric components observed over WNA, if other co-located observations have been made at the spatial and temporal scales defined for some or all of the gridded ozone receptors used here. The entire dataset is publicly available at https://doi.org/10.5067/ASDC/WNA-BackTraj (Cui et al., 2025).
- Article
(8555 KB) - Full-text XML
- BibTeX
- EndNote


The IPCC Sixth Assessment Report concluded that free tropospheric (FT) ozone generally increased in the Northern Hemisphere from the mid-1990s through 2016 (Gulev et al., 2021). From a global perspective, Gaudel et al. (2020) reported increasing median FT ozone trends ranging from 1.2 ppbv/decade over the Gulf of Guinea to 5.6 ppbv per decade over Southeast Asia. Building on this work, Chang et al. (2023) incorporated additional ozone data and identified a positive regional trend in median FT ozone over Western North America (WNA), with an increase rate of 0.7±0.3 ppbv per decade (1994–2019). These positive trends in FT ozone raise growing concerns about their radiative effects and their potential to increase surface ozone levels in WNA, where FT influence is significant (e.g. Jaffe et al., 2018). Therefore, it is critical to understand the processes driving changes in FT zone.
Previous studies have examined key factors influencing tropospheric ozone levels over WNA, including intercontinental transport of ozone from Asia (e.g., Jacob et al., 1999; Cooper et al., 2010), stratospheric intrusions (e.g., Lin et al., 2012, 2015), wildfires (e.g., Jaffe et al., 2008; Jaffe and Wigder, 2012), and transport from tropical marine environments (e.g., Grant et al., 2000; Cooper et al., 2011). While global-scale modeling studies suggest that increasing anthropogenic emissions contribute to rising FT ozone levels (e.g., Fiore et al., 2012), detailed analyses of atmospheric transport pathways and source attributions are limited. Such studies are essential to identify the drivers, such as source regions, most closely associated with observed ozone increases. This gap motivated the current study, which applies a Lagrangian Particle Dispersion Modeling framework in backward mode to quantify source–receptor relationships (SRRs) for 553 608 ozone receptors which span altitudes from 900 to 300 hPa across WNA over the period 1994–2021.
A similar SRR framework was used by Cooper et al. (2010) to explain increased FT ozone concentrations above WNA during April and May from 1995 to 2008. That study used an earlier version of the European Centre for Medium-Range Weather Forecasts (ECMWF) model with a 2°×2° spatial resolution, generating SRRs up to 16 km above ground level. However, Cooper et al. (2010) focused exclusively on springtime. Chang et al. (2023) demonstrated that positive FT ozone trends over WNA are also present in summer and winter. Therefore, this study extends the analysis of Cooper et al. (2010) by simulating SRRs across all seasons over nearly three decades (1994–2021) using an updated version of the ECMWF model. The complete set of backward simulations, described herein, are archived for future use. Our high-resolution Lagrangian-based product provides an efficient alternative to computationally expensive chemical transport models for quantifying SRRs in the FT ozone observation dataset.
In addition to supporting ozone research for WNA, the SRRs calculated in this study are applicable to investigations of air mass origins and source contribution analyses for other atmospheric components observed in the region. These SRRs can be used in studies with co-located observations that align with the spatial and temporal scales defined for some or all of the gridded ozone receptors used here. Further potential applications are discussed in this paper.
The paper is organized as follows: Sect. 2 describes the receptor locations used in this study, followed by Sect. 3 which details the settings for the SRR simulations. Section 4 provides illustrations and examples of the model products, and Sect. 5 discusses additional applications of the data. Conclusions are provided in Sect. 6, and data set availability and formats are described in Sect. 7.
To quantify trends and variability in free tropospheric ozone, a gridded ozone dataset was generated using a data fusion technique (Chang et al., 2022, 2023). We expand the previous fused dataset from Chang et al. (2023) to include observations from 900 to 300 hPa during 1994 to 2021 using the same statistical method. This extension, which incorporates additional tropospheric ozone data spanning the upper atmospheric boundary layer, free troposphere, and upper troposphere, offers a more comprehensive characterization of tropospheric ozone variability and further supports the validation of previous results. By identifying and adjusting for inconsistencies due to differing sampling frequencies and measurement uncertainties, this fused ozone observation product is expected to be regionally representative (Chang et al., 2022, 2024). Original ozone observations were obtained from various data platforms collected between 1994 and 2021, spanning altitudes from 900 to 300 hPa across WNA. These observations were integrated into 0.2°×0.2° grid cells with 10 hPa vertical intervals over the WNA region. The new gridded ozone dataset (N=553 608) includes time, latitude, longitude, altitude, and corresponding ozone values. Each grid cell from the data fusion product is treated as a receptor to generate SRRs.
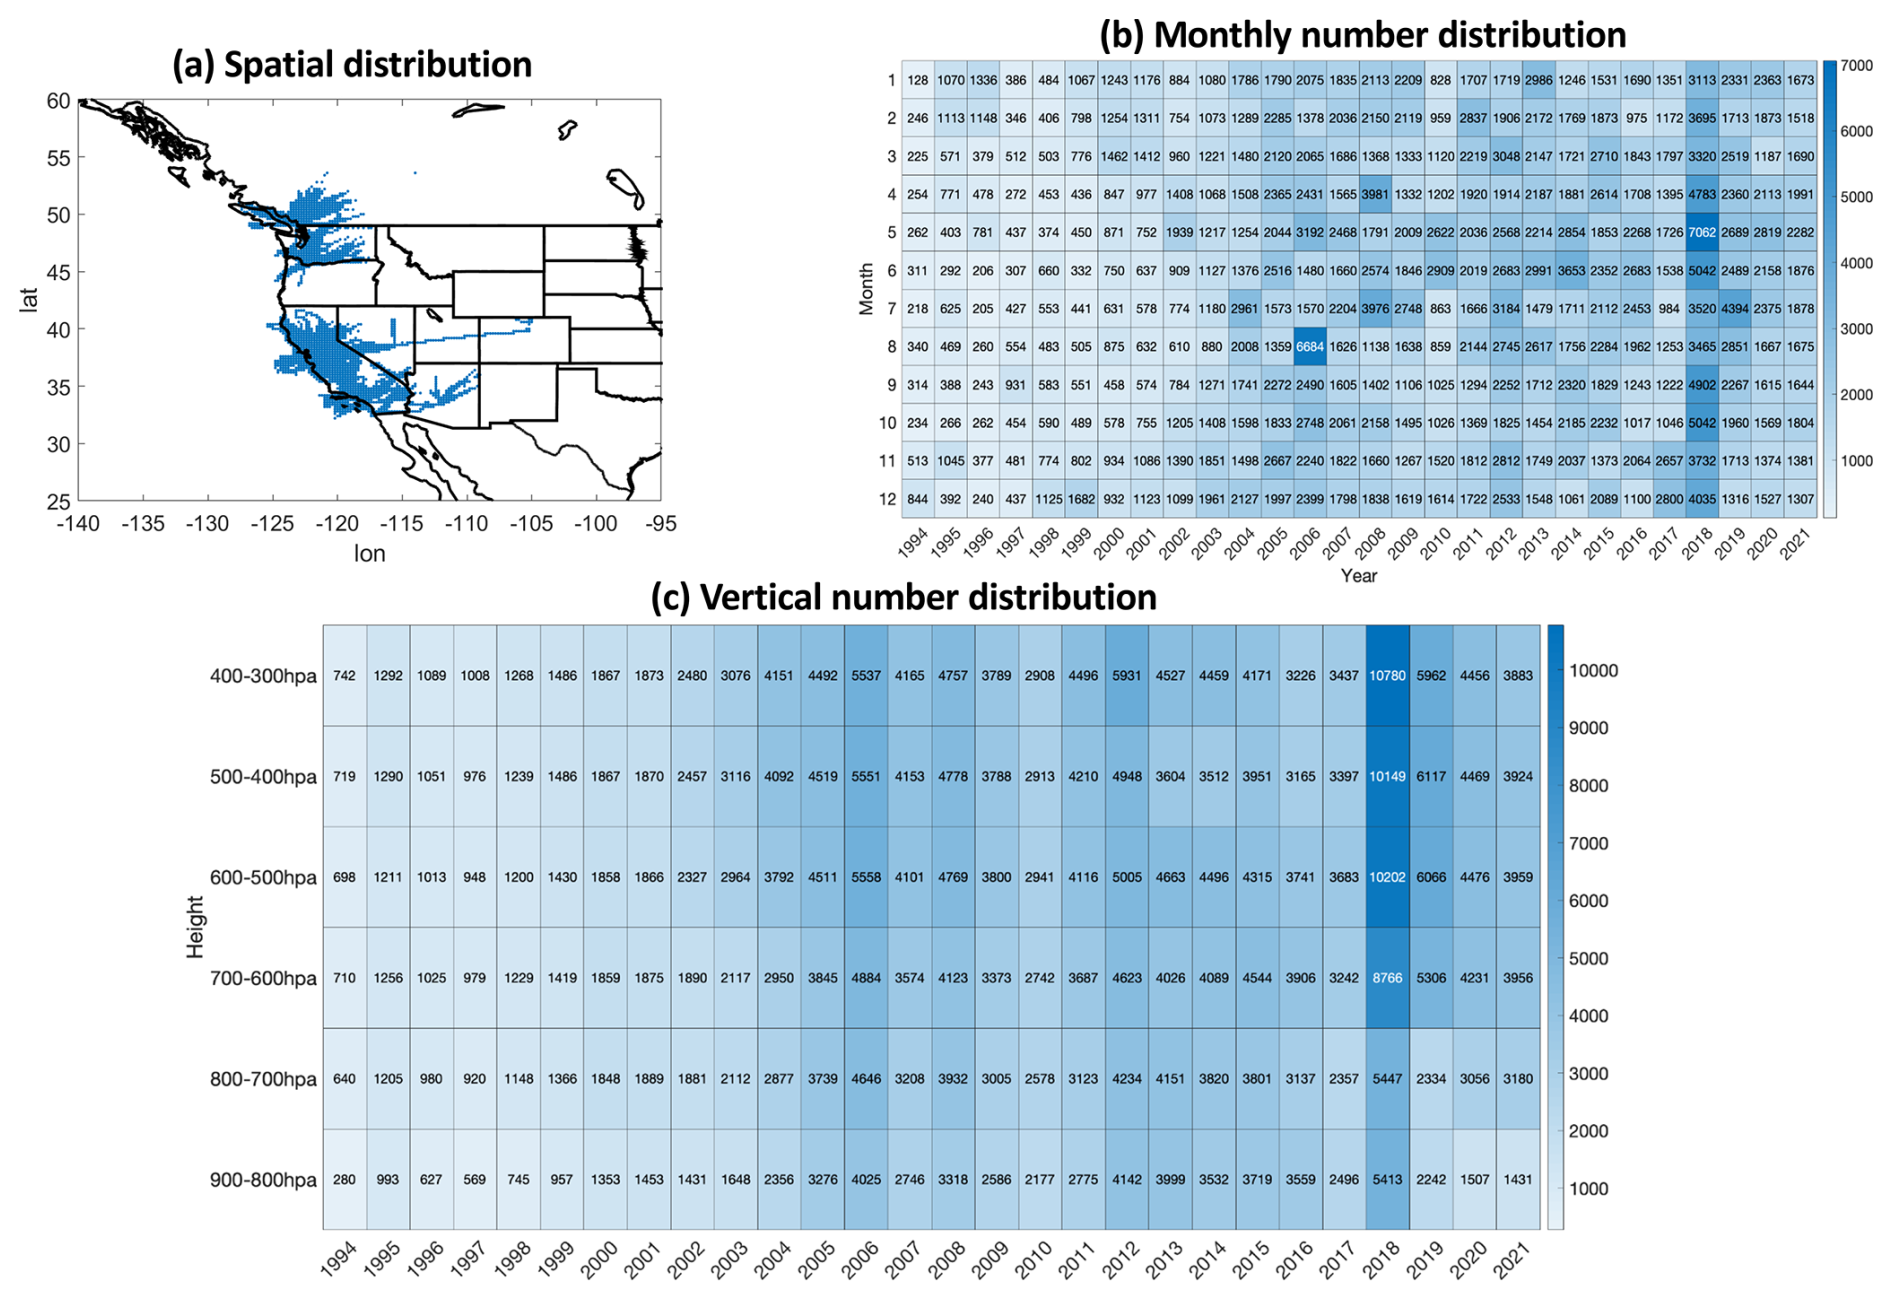
Figure 1The distribution of defined data receptors from the data fusion product: (a) spatial pattern over WNA, (b) number of receptors by month of year across 28 years, (c) number of receptors divided by vertical layers with 100 hPa intervals across 28 years.
Specifically, the tropospheric ozone observations over WNA used in this study include: (1) ozonesonde records above Edmonton (1970–2021), Kelowna (2003–2017) and Port Hardy (2018–2021) from the Canadian Ozonesonde Network (Environment and Climate Change Canada, 2022), and above Trinidad Head (California, 1997–2021) and Boulder (Colorado, 1967–2021) maintained by the NOAA Global Monitoring Laboratory (NOAA GML, 2022), with a roughly once-per-week sampling frequency; (2) lidar measurements above the Jet Propulsion Laboratory Table Mountain Facility (California, 2000–2021, NASA JPL, 2022), with 2–5 profiles per week; (3) commercial aircraft observations operated by the IAGOS (In-Service Aircraft for a Global Observing System) program since 1994 (Boulanger et al., 2022); and (4) approximately 200 flights from the NASA AJAX/SNAAX field campaigns (2011–2018, Iraci et al., 2021).
The observational methods that produced the ozone data set have varying levels of accuracy (Tarasick et al., 2019), however, according to the well-known concept of error analysis (Taylor, 1997), the random nature of the relatively small measurement errors is not expected to impact our ability to detect long-term ozone trends. For example, a sensitivity analysis of tropospheric ozone trends, accounting for varying levels of measurement uncertainty (e.g., adding 10 % or 20 % random uncertainty to each data point), was conducted by Gaudel et al. (2024). The results indicate that when the dataset time period is sufficiently long, the observed trends remain consistent. In other words, despite the fact that the greater data uncertainty resulted in higher trend uncertainty, trends can still be detectable under large random uncertainty (i.e., 20 %). It should be noted that the modern ozone instrumental measurement uncertainty is typically much lower than the imposed uncertainty used in the above sensitivity analysis (Tarasick et al., 2019). Similarly, Van Malderen et al. (2025) assessed the impact of measurement uncertainties on ozone observations in the free troposphere, assuming 2.5 % for lidar, 5.5 % for ozonesondes, and 5.5 % for IAGOS. The impacts were minor compared to analyses that assumed no measurement uncertainty. Therefore, we consider this data fusion product, which integrates large datasets from multiple platforms spanning nearly three decades, to be robust for ozone trend analysis over WNA.
Figure 1 shows the distribution of the data fusion product across WNA, along with monthly and vertical layer counts of receptors. For each receptor location, we conducted backward simulations of historical air mass dispersion and transport processes covering up to 15 d on a global scale. We retained all detailed simulation outputs for each receptor to allow users to select specific receptors as needed. Additional details are provided in the following sections.
In this study, we developed the model product using a commonly-used Lagrangian Particle Dispersion Model, FLEXPART (“FLEXible PARTicle dispersion model”, v10.4, Pisso et al., 2019), driven by ECMWF reanalysis v5 (ERA5) data (Hersbach et al., 2020). This product is another key component of our SRR database and provides crucial support for understanding source contributions to the overall representative tropospheric ozone trends observed over the WNA region.
Specifically, the ERA5 reanalysis data has high spatial and temporal resolutions on the global scale, that is 0.25°×0.25° spatial and hourly temporal resolution, and 137 vertical levels. The overall uncertainty estimates of ERA5 have been described by Hersbach et al. (2020) using ensemble spread and comparisons with observations. Their analysis, for example, showed that the global mean differences between the nine ensemble members and the control member for temperature, relative humidity, and the u-component of wind at the 500 hPa level were 0.006 K, 0.3 %, and 0.4 cm s−1, respectively for the year 2018. They showed that the magnitude of the ensemble spread is closely related to the quality of the observing system, and also demonstrated that ERA5 has a significant improvement over its previous generation (ERA-Interim). In an independent study, a cross-comparison among three widely used reanalysis datasets, including ERA5, was conducted by Wu et al. (2024). Their study indicated that, when compared to limited observations from field campaigns, the reanalysis datasets exhibited mean wind vector differences ranging from 2 to 4.5 m s−1, with ERA5 showing the closest agreement with observations. Many other studies have evaluated ERA5 from different perspectives, consistently highlighting its strong performance. These findings further reinforce the reliability of our source–receptor database.
FLEXPART is a Lagrangian particle dispersion model (LPDM) with the ability to study global transport in both forward and backward modes. In this study, we used the backward mode of FLEXPART to calculate SRRs describing the sensitivity of a receptor to a source (e.g. Seibert and Frank, 2004). We released 10 000 trajectory particles from each receptor and simulated their backward 4D SRR fields. Stohl et al. (1998) simulated the long-range dispersion of tracer gases using FLEXPART v2.0 based on three large-scale tracer experiments. They compared the model results with tracer gas measurements from various locations and found that the model performed very well under fair meteorological conditions but was less accurate in the presence of fronts. Additionally, they mentioned that the coarse resolution of the meteorological inputs at that time limited the implementation of vertical wind fields, restricting potential improvements in model performance. Forster et al. (2007) evaluated FLEXPART v6.2 in terms of its convective transport performance, finding good agreement at higher altitudes above the atmospheric boundary layer when convection was included in the model. At the time, they emphasized the need for tropospheric profile measurements. Furthermore, they compared forward and backward simulations and found only minor differences, which could be tolerated given the large overall uncertainties of convective parameterizations. Pisso et al. (2019) provided detailed descriptions of FLEXPART v10.4, including references to evaluations of several model components, such as the convection scheme and aerosol lifetime estimation. More recently, Bakels et al. (2024) evaluated and compared FLEXPART v11 and v10.4. While v11 introduces improvements, many key features of v10.4 and v11 exhibit comparable performance. Overall, in LPDMs, the meteorological driver plays a crucial role in determining the level LPDM performance, while differences among various LPDMs remain small (Hegarty et al., 2013). Based on the results from a wide range of studies, we consider FLEXPART-ERA5 to be one of the best current options for establishing our SRRs database.
In summary, we expect that the uncertainties associated with the multiplatform-fusion ozone product are primarily aleatoric (i.e. random), a concept well understood in statistical error analysis (Taylor, 1997). The uncertainties associated with the FLEXPART-ERA5-based SRRs, which are separate from the random errors associated with the multiplatform-fusion ozone products, are also aleatoric and not systematically biased. A scientific application for integrating our native SRR database (combining the multiplatform-fusion ozone product and FLEXPART-ERA5-based SRRs) at longer time scale (i.e. monthly and yearly) with a focus on different ozone level percentiles, which could further reduce errors, has been conducted by Ryoo et al. (2025).
Our SRR product spans a 28-year period from 1994 to 2021, with native hourly temporal resolution and 1°×1° spatial resolution globally. We output 5 layers of SRRs from the surface up to 20 km to support the investigation of the different source regions associated with different altitudes and to understand their source contributions. The 5 layers include surface to 300 m a.g.l., 300 m to 3 km a.g.l., 3 km to 8 km a.g.l., 8 km to 13 km a.g.l., and 13 km to 20 km a.g.l. We used the default FLEXPART schemes such as the Gaussian approximation of boundary layer turbulence and the Emanuel-based convection parameterization (Stohl et al., 2005). ERA5 provided meteorological variable inputs. We used Flex_extract v7.1.2 (Tipka et al., 2020) to extract ERA5 global products for the FLEXPART simulations. The output unit of the SRR field is s m3 kg−1, which represents the residence time weighted by the volume of air mass. FLEXPART offers several unit options. The primary consideration in selecting this specific unit is to facilitate users in quantifying source contributions by region or atmospheric layer when linking our SRRs with emission rates, in addition to conducting residence time analysis.
The implementation of FLEXPART and the resulting SRRs presented in this database are thus improvements over the previous methodology (Cooper et al., 2010) in three significant ways: (i) higher top altitude and vertical layers chosen to discriminate among potential sources aloft, (ii) updated meteorological input data at much finer spatial resolution (0.25°×0.25°), and (iii) expanded dataset of field observations, including all four seasons and considerably more ozone observations in the free troposphere. The resultant SRR dataset provides greater potential to conduct a more comprehensive and accurate investigation of ozone trends over a longer time period with enhanced spatiotemporal coverage.
This SRR database was implemented on NASA High End Computing (HEC) Pleiades Broadwell Nodes. The operational framework was set up on a monthly batch configuration, processing all receptors within a given month in one FLEXPART-ERA5 run using a single processor. Overall, the Langragian model framework used here is computationally efficient. Most individual runs required less than 100 h to complete. Excluding the time required for downloading ERA5 data, approximately one month was needed to generate this comprehensive set of products.
The output field structure of the SRR product is a five-dimensional matrix – SRR (receptor, lat, long, height, time). Details of the receptor information are stored into a separate file, as described in Sect. 2. Latitude and longitude are represented in 1°×1° grid cells, and heights denote the five vertical layers as previously described. The time dimension extends from the observational receptors back 15 d with hourly outputs. Retaining detailed information allows users to customize the five-dimensional data to select specific receptors, geographic regions, vertical layers, or backward time intervals up to 15 d. Examples are provided in the next two sections.
Figure 2 illustrates maps of SRRs summed up at a monthly scale for all ozone receptors. Pink dots mark receptor locations during this month, and the SRR fields represent the influence function values integrated across each vertical layer. Areas with higher values indicate greater source sensitivities to influencing the ozone values observed over WNA. Since ozone receptors are primarily located within the FT, high values are concentrated with the FT from 3–13 km a.g.l., with additional influences seen from the lowest 300 m layer and the highest layer (13–20 km). By preserving the FLEXPART outputs in these five vertical layers, studies addressing a wide variety of processes and emission sectors can be devised using this model product. For example, aviation influences are expected in the 8–13 km layer (Ryoo et al., 2025).

Figure 2Monthly influences can be studied with this dataset. Aggregated SRRs of FT ozone over WNA during July 2016 are shown for sources located in (a) the near-surface layer (0–300 m a.g.l.); (b) boundary layer (300–3000 m a.g.l.); (c) a middle tropospheric layer (3–8 km a.g.l.); (d) an upper tropospheric layer (8–13 km a.g.l.); and (e) a stratospheric layer (13–20 km a.g.l.). The pink dots represent the geospatial locations of all receptors available during July 2016.
The SRR datasets retain detailed high-resolution information, which, when integrated over multiple years or decades, enables more robust statistical analyses to understand transport patterns. For instance, we present an example of SRR patterns aggregated over a 28-year period across various altitudes from two distinct receptor subsets: those associated with the lowest (cleanest) ozone levels (left column) and those with higher ozone levels (right column) (Fig. 3). SRRs are aggregated monthly across various altitudes for cases when ozone values at the receptors are at their low and high percentiles, compared to those over the mid-year period (2004–2014). A more detailed statistical framework is outlined in Ryoo et al. (2025) to minimize the influence of varying numbers of receptors across months and years. All subsequent SRR illustrations given here are generated using the same algorithm applied in Fig. 3. These visualizations allow us to compare the SRR patterns across the Northern Hemisphere during winter over the time period. The results demonstrate that this SRR product provides a valuable tool for examining how atmospheric transport patterns vary by altitude and across different subsets of in situ ozone observations over WNA.
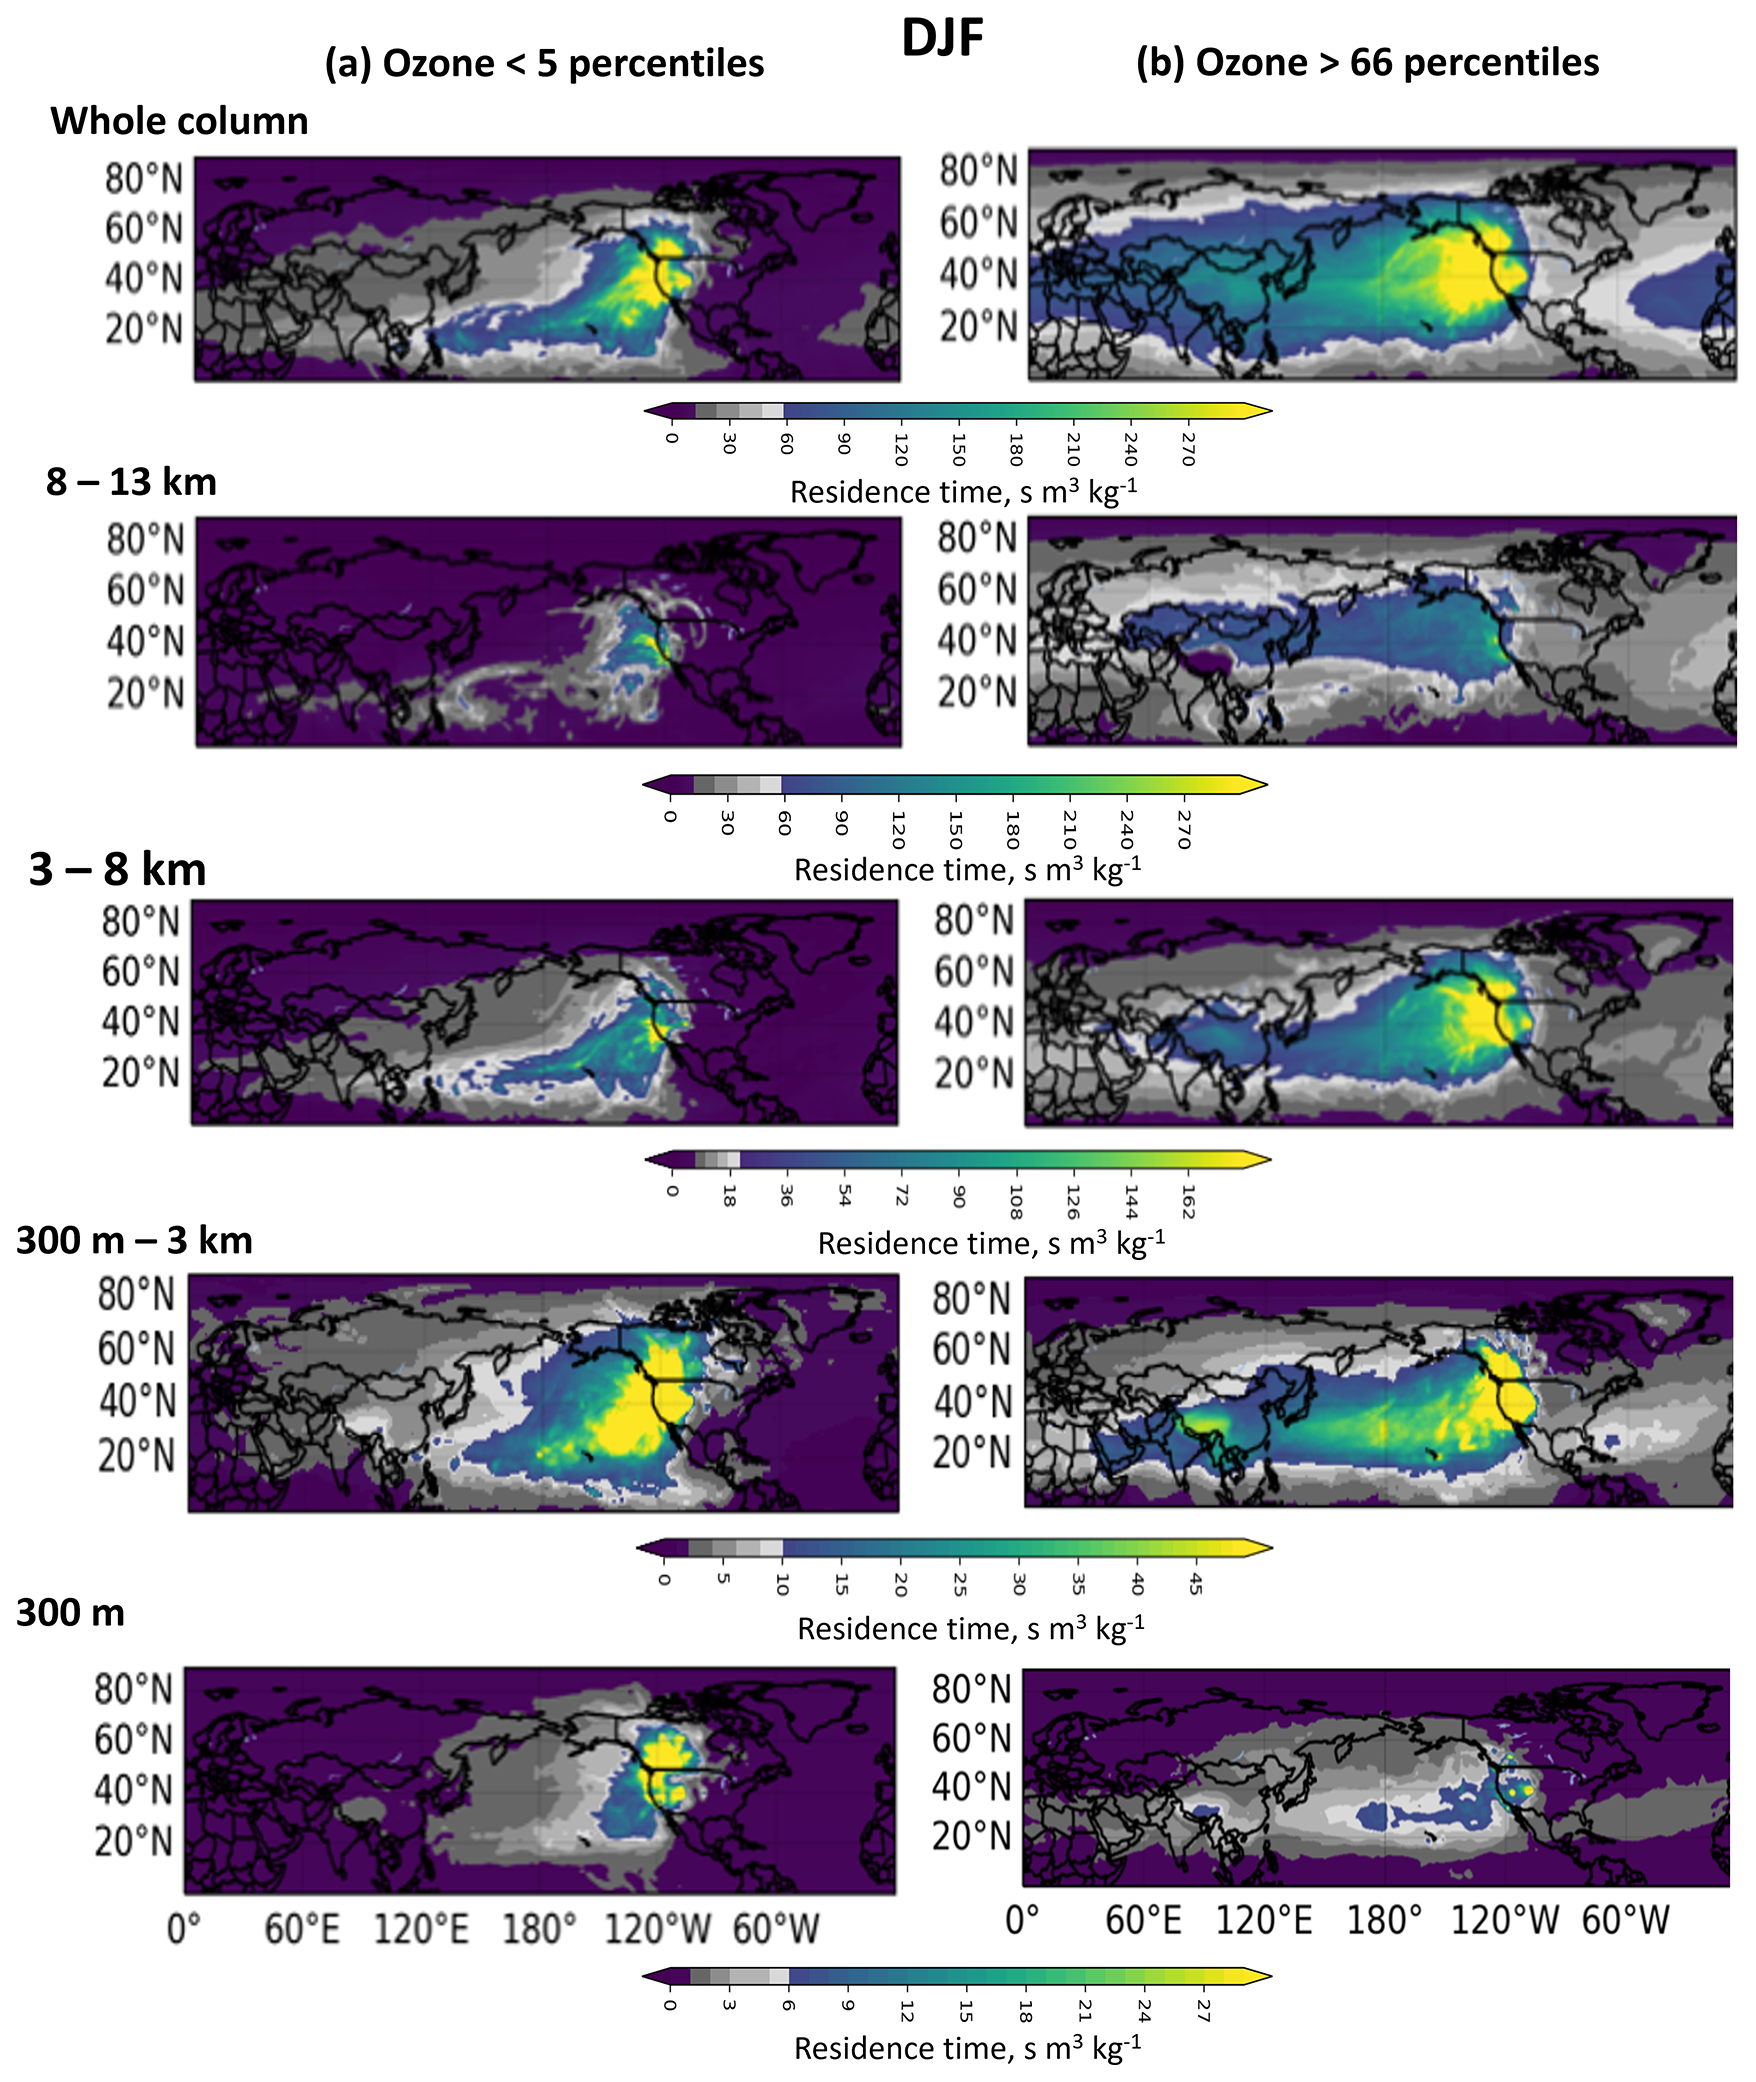
Figure 3Sensitivity of two FT ozone categories – < 5th percentile in panel (a) and > 66th percentile in panel (b) – are shown as a function of altitude during wintertime. Air parcels reaching WNA with very different amounts of ozone have origins in different regions of the Pacific and Asia.
Our dataset of backward simulations can also be used to illustrate atmospheric transport pathways as a function of season. Figure 4 shows an example of aggregated analysis of the seasonal patterns at all altitudes (from surface to 20 km) for the entire 28-year period. A consistent feature across all seasons is the significant influence from the western North Pacific Ocean. However, Fig. 4a shows that the latitudinal extent of source locations for the cleanest parcels (ozone < 5th percentile) varies with season. Transport from the tropical North Pacific Ocean dominates in winter, but the influence widens in spring and ultimately includes broader mid-latitude regions during summer. In contrast, Fig. 4b shows that the air parcels containing the largest amounts of ozone (> 95th percentile) show some modest seasonal variation in longitudinal extent but originate from a wide range of latitudes in all seasons.
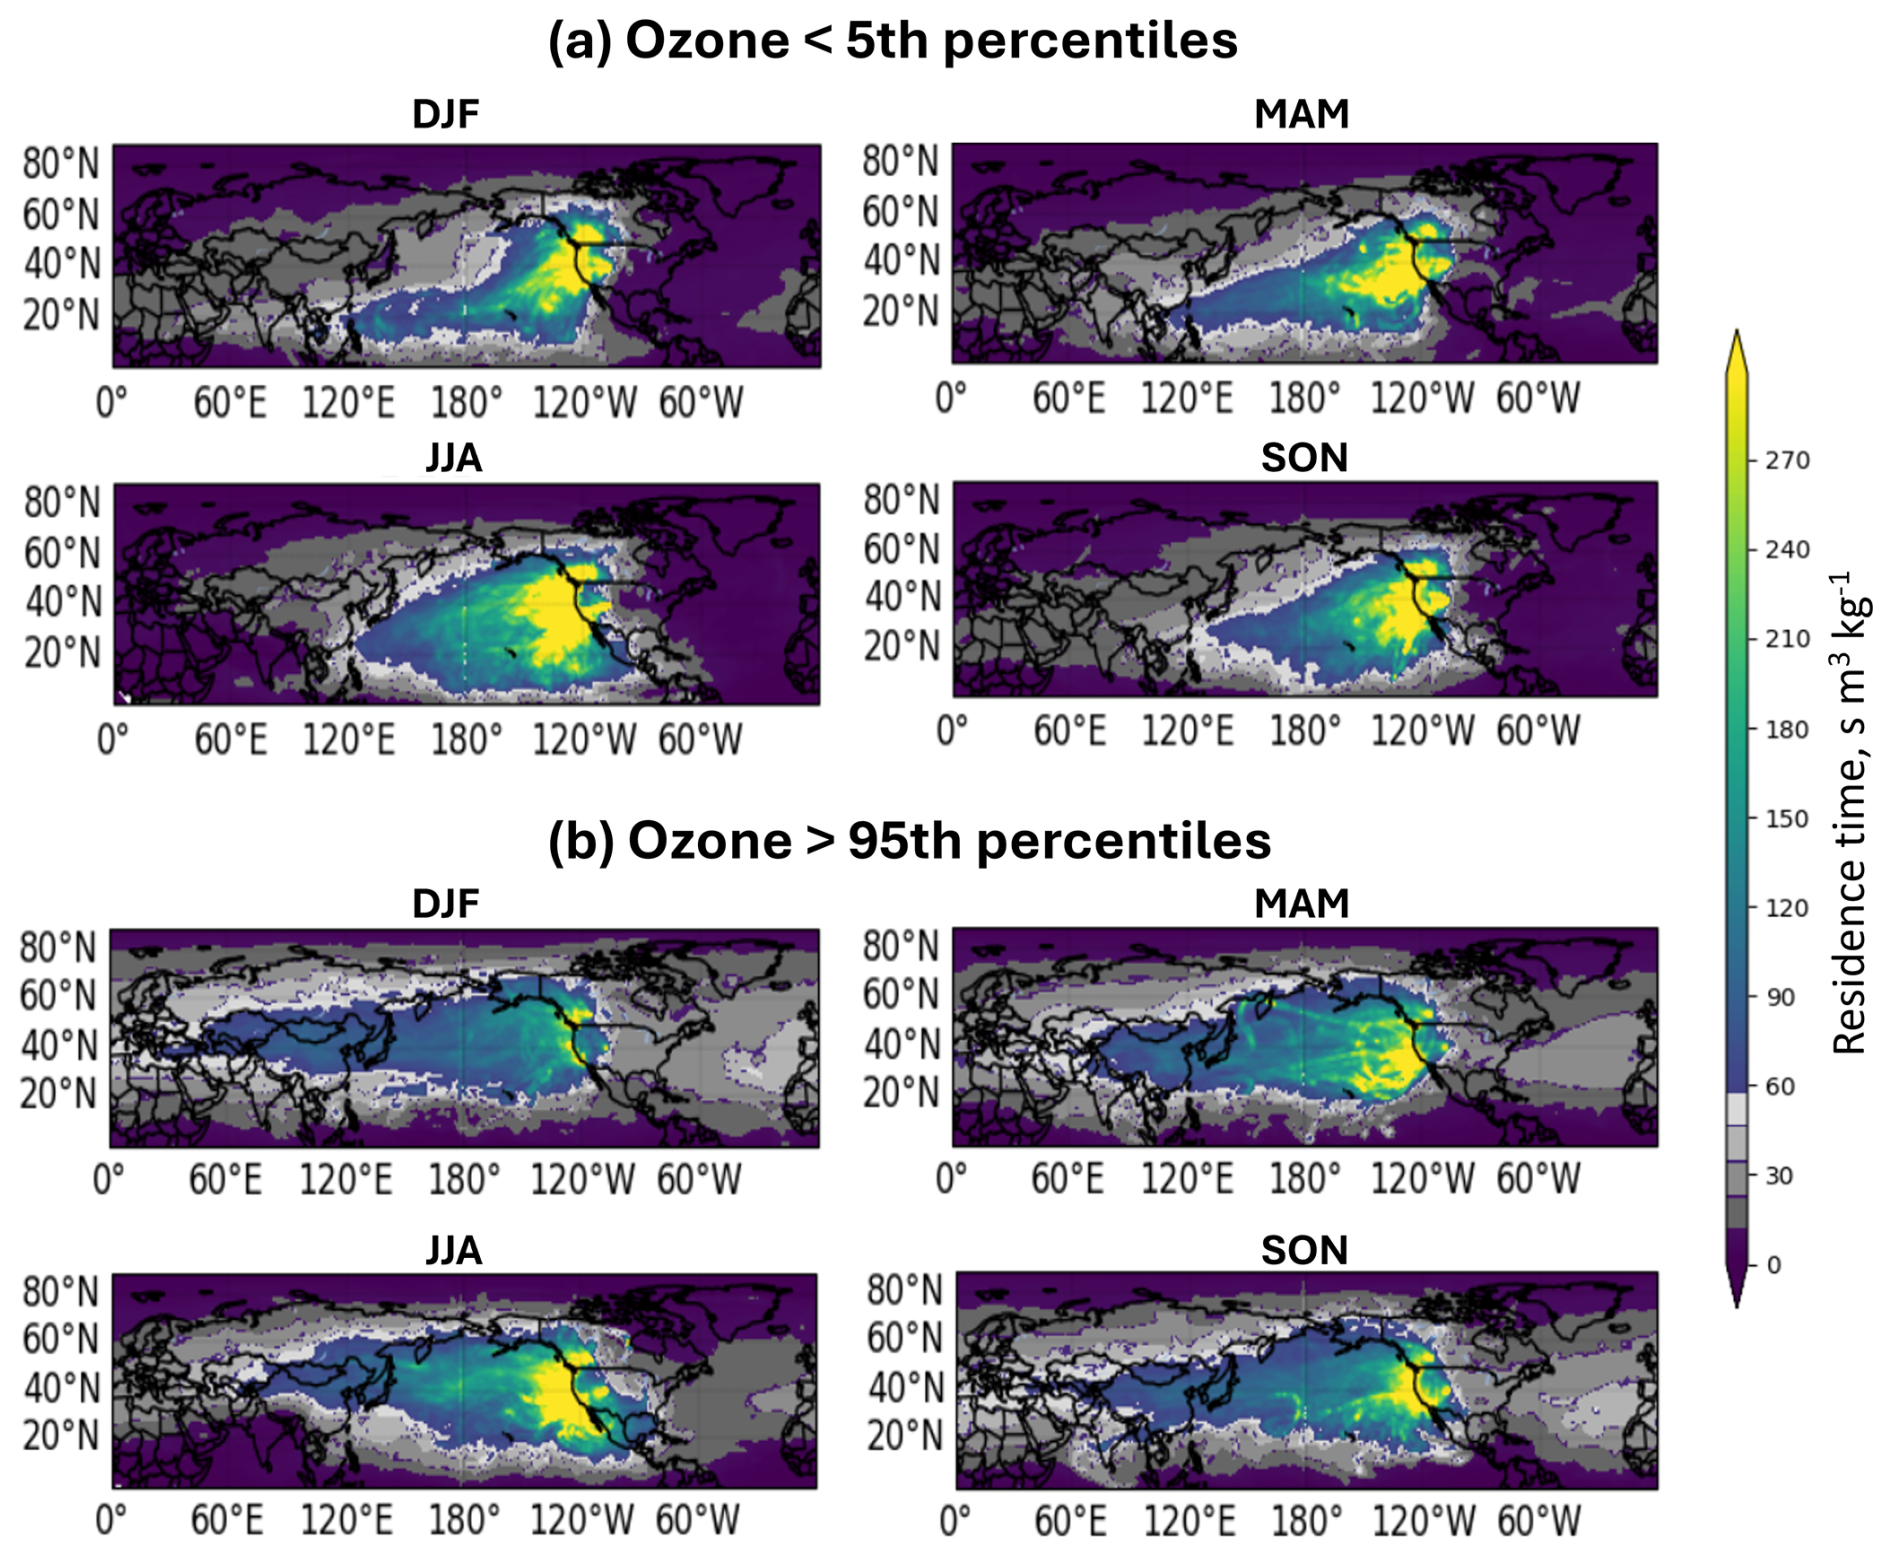
Figure 4Seasonal sensitivity of residence time of parcels containing (a) the cleanest FT ozone level (< 5th percentile) and (b) the highest FT ozone level (> 95th percentile) over WNA during the complete 28-year dataset, including winter (DJF), spring (MAM), summer (JJA), and fall (SON).
The SRR database supports atmospheric transport studies, such as examining airmass influences across seasons, altitudes, and ozone mixing ratios (Sect. 4). Additionally, the 28-year SRR dataset offers the potential for correlation analyses with climate indices, providing valuable insights into the impacts of climate change on atmospheric transport and, consequently, FT ozone levels over WNA (Ryoo et al., 2025).
SRRs can also be linearly convolved with gridded emission source fields to explore the contributions of both anthropogenic and natural sources to ozone formation. For example, lightning nitrogen oxides (NOx) are a natural source of ozone formation. By convolving the SRR fields with the lightning NOx source rate, we can identify specific lightning regions that contribute to FT ozone levels over WNA. Figure 5 illustrates a related analysis. An increasing trend of SRRs across altitudes from 3 to 13 km, associated with the 66th to 95th percentiles of WNA ozone receptor levels, is shown in Fig. 5a. The positive slope indicates that air parcels which contained ozone amounts in the 66–95th percentiles spent more time at 3–13 km in later years than did equivalent parcels in earlier years. To clarify whether lightning NOx sources align with the SRRs and whether the increased SRRs bring more lightning-related ozone formation to the downwind WNA FT ozone levels, we calculate the global lightning NO flux rate using the Global Modeling Initiative (GMI) model (e.g., Bey et al., 2001; Kinnison et al., 2001). We compare the SRR fields with the lightning NO flux rate fields over the Northern Hemisphere for the periods 1994–2006 and 2007–2019 (middle row of Fig. 5b and c). Additionally, we computed a field of SRR multiplied by the lightning NO flux rate to focus on the influence of source regions on the 66th to 95th percentiles of WNA ozone levels (bottom row of Fig. 5b and c). Changes in this field between the two periods are shown (Fig. 5d), with higher values indicating regions where lightning activity may contribute to WNA ozone levels in terms of both magnitude and variation. Further detailed scientific analysis is warranted.
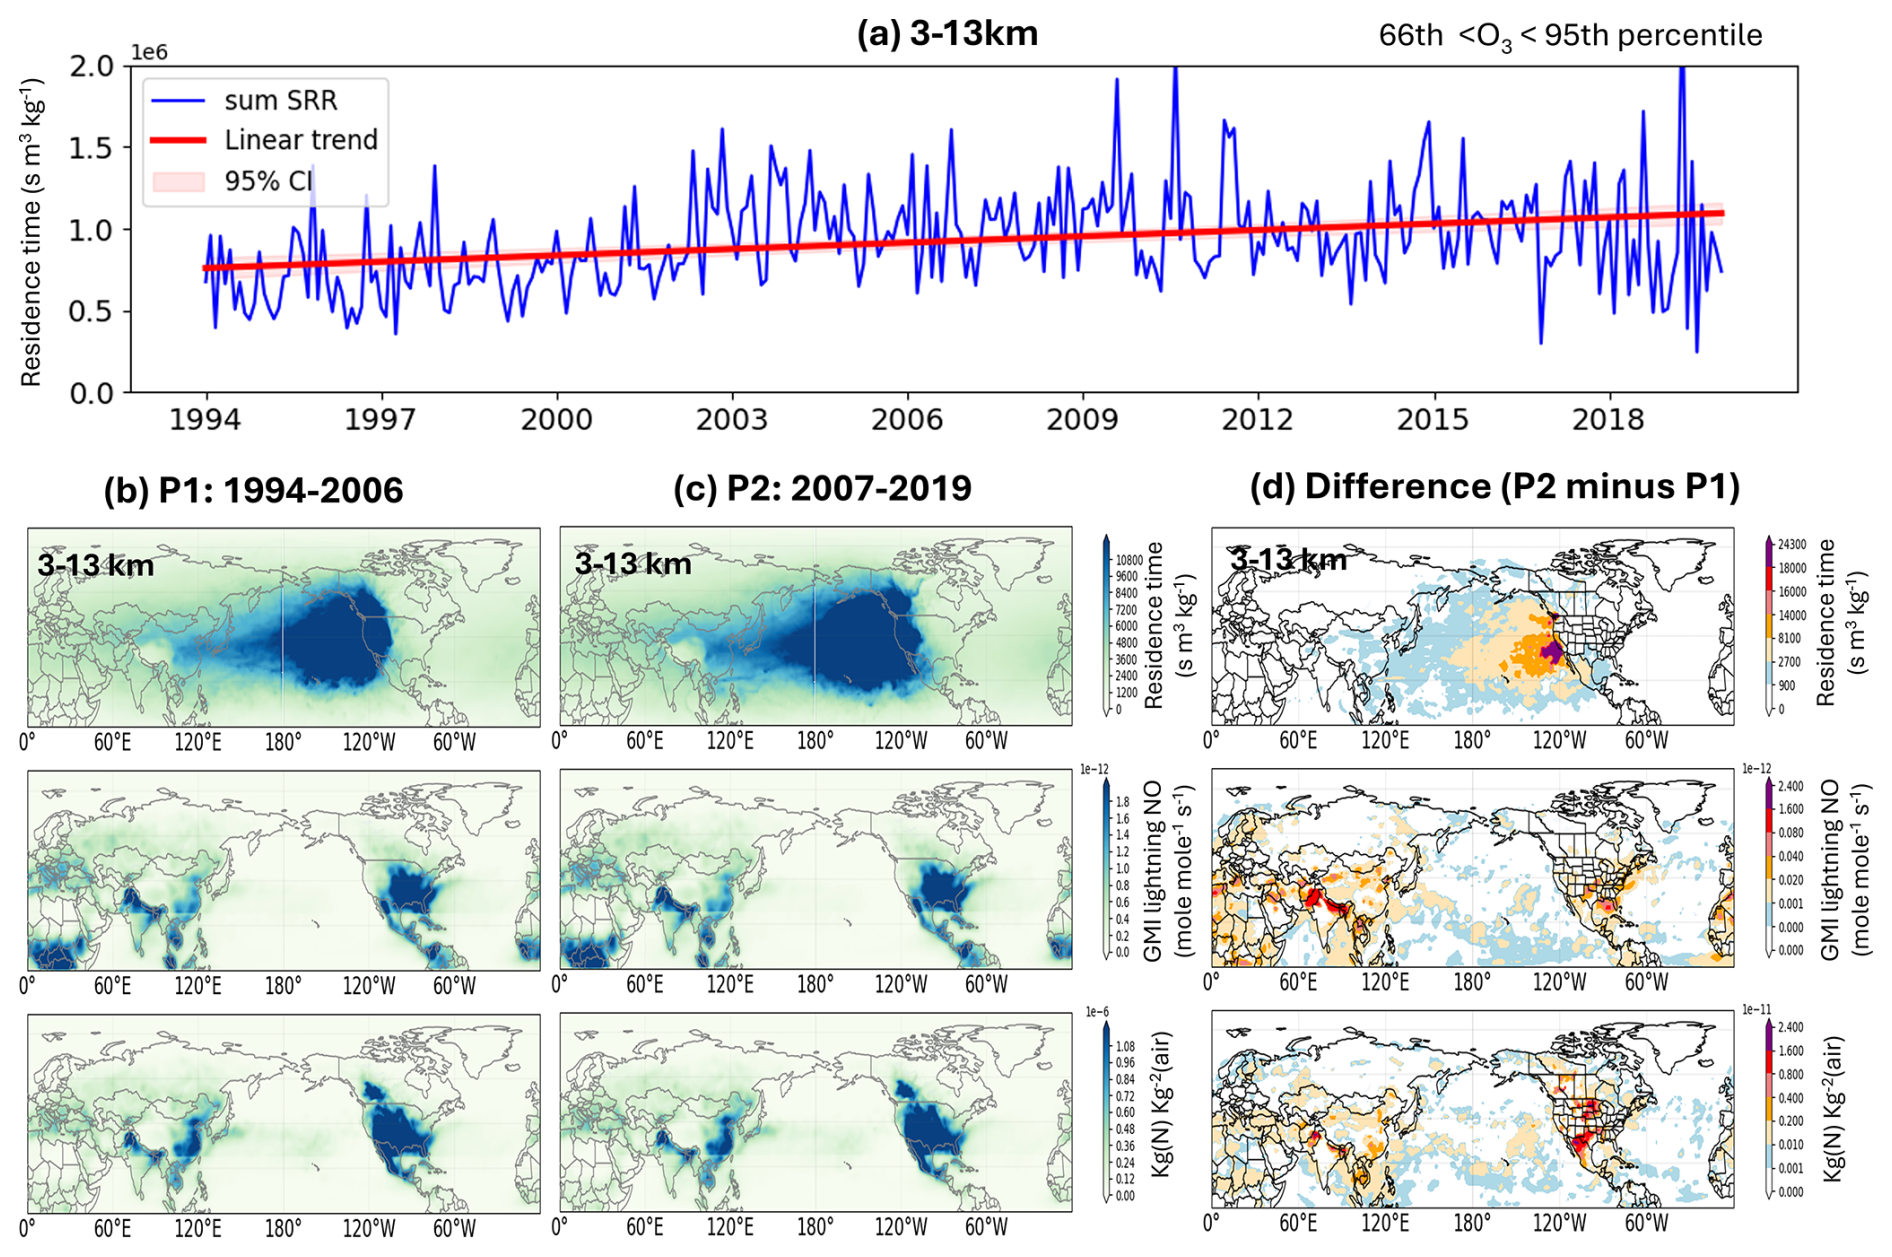
Figure 5(a) Mean SRRs within the 3–13 km layers averaged over Tropical Pacific (5–35° N, 180–130° W) as a function of time for receptors containing ozone amounts between the 66th and 95th percentile. (b, c) SRRs for two time periods (1994–2006 and 2007–2019) (top row panels); average lightning NO concentrations, weighted by area and time over the Northern Hemisphere, as estimated by the GMI system (middle row panels); multiplication of top and middle row highlights areas of greatest potential influence (bottom row panels). (d) Differences between panels (b) and (c).
By integrating gridded lightning NOx emissions with SRRs, users can better distinguish contributions from various geospatial locations. A similar approach, focusing on the impact of aircraft NOx emissions on FT ozone formation over WNA, is discussed in Ryoo et al. (2025). Another potential application involves linking fire-related trace gases (e.g., carbon monoxide – CO) with SRRs to assess the influence of the changes of fire events on FT ozone levels over WNA.
It is important to note that the analysis described above does not account for chemical reactions (e.g., formation or loss processes). Instead, these analyses simply provide an initial indication of regions likely contributing to ozone formation in WNA. Ozone formed locally in regions with high NOx levels or during transport could be delivered to our ozone receptor locations, and therefore, higher SRR-weighted NOx emissions are indicative of regions with a potentially significant impact on FT ozone over WNA. We acknowledge that CTMs remain more comprehensive tools for interpreting ozone changes driven by the complex interaction between dynamical and photochemical processes. While uncertainties remain, this approach provides a rapid and effective means to identify regions associated with FT ozone formation over WNA and to analyze how changes in source regions contribute to variations in downwind FT ozone levels.
In addition, our ozone receptors span from 900 up to 300 hPa, and the highest-altitude data (e.g., 400–300 hPa) shown in Fig. 1, together with the corresponding SRR values, may help elucidate how stratosphere–troposphere exchange (STE) contributes to ozone increases in the free troposphere. However, 300 hPa is generally still below the altitude of the most active STE; therefore, the current SRR dataset may be insufficient for fully capturing these processes.
The SRR product in our archived database extends beyond ozone research, supporting transport and source attribution analyses for other atmospheric components observed over WNA at the spatial and temporal scales defined by the ozone receptor grids. For instance, IAGOS profiles (Sect. 2) have included CO measurements since 2001, and AJAX missions (Section 2) have collocated methane (CH4) observations. Therefore, the SRR database can be applied to attribute sources contributing to FT CO and CH4 trends over WNA, as well as to assess the sensitivity of FT ozone over WNA to biomass burning (using CO as a tracer). Additionally, all ozone observations are paired with co-located water vapor measurements. For example, we can use the SRR database to understand decadal-scale changes in the source regions of moisture over western North America, such as variability in atmospheric rivers.
Moreover, measurements not directly linked to the ozone observation platforms used in this study (Sect. 2) but aligned with the spatial and temporal framework defined by the ozone receptors, such as dust-related aerosol measurements in the FT over WNA, can also leverage the SRR database to analyze the transport and origin of diverse atmospheric constituents.
The model outputs, associated receptor data, and post-processing scripts are available at NASA's DAAC/ASDC (https://doi.org/10.5067/ASDC/WNA-BackTraj, Cui et al., 2025). Specifically, the gridded receptor details are stored in a CSV file that includes columns for the year, month, day, hour, latitude, longitude, pressure, and corresponding ozone values. As outlined in Sect. 3, FLEXPART model outputs from each monthly batch run are stored in separate monthly folders in binary format. The 28 years of binary files occupy approximately 4 TB of storage. Post-processing scripts to read these binary files in various programming languages are available at https://www.flexpart.eu/processing.html (last access: 3 November 2025). Additionally, we have attached a MATLAB script with other archived files. For example, Ryoo et al. (2025) used this MATLAB script to convert binary files to NetCDF format and to reduce the domain from global to the Northern Hemisphere for further analysis. That 1°×1° monthly output for the Northern Hemisphere is also archived at the same location.
Using the statistical technique established by Chang et al. (2022), we integrated and reconciled a gridded ozone database from various ozone observing platforms, covering 900 to 300 hPa, primarily focused on the free-tropospheric and upper tropospheric layers, for nearly three decades (1994–2021). In conjunction with this fused dataset, we conducted backward simulations using the Lagrangian-based transport model FLEXPART to calculate source–receptor relationships (SRRs) for each gridded ozone data point. The FLEXPART model is an offline model driven by ERA-5 reanalysis data. FLEXPART-ERA5 is designed to deliver the SRR product at high temporal and spatial resolution on a global scale, with the available SRR information up to 15 days prior.
This SRR database, which combines the multiplatform-fusion ozone product and FLEXPART-ERA5-based SRRs, was developed specifically to support multi-decadal analyses of airmasses containing a range of ozone values to advance the understanding of ongoing changes in FT ozone, as most recently identified in Chang et al. (2023). It also supports the analysis of increased FT ozone trends across a range from synoptic dynamics to mesoscale processes in relation to various climate indicators (Ryoo et al., 2025).
Our archived product includes both the Western North America (WNA) fused ozone data and SRR modeling output, providing a powerful resource for understanding atmospheric transport and emission source contributions to FT ozone levels over WNA under various scenarios. This product also holds potential for investigating other aspects of atmospheric components which are relevant to the receptor grid chosen here.
Funding acquisition and project administration were carried out by LTI. Supervision was provided by LTI and ORC. Conceptualization and methodology were contributed by all co-authors. Investigation was performed by YYC, KLC, and ELY. Data curation and formal analysis were carried out by YYC, KLC, and JMR, while visualization was performed by JMR and YYC. The manuscript was prepared by YYC with contributions from all co-authors and interactive discussions with LTI, MSJ, JMR, ORC, and KLC. Resources were provided by LTI and MSJ.
The contact author has declared that none of the authors has any competing interests.
Publisher's note: Copernicus Publications remains neutral with regard to jurisdictional claims made in the text, published maps, institutional affiliations, or any other geographical representation in this paper. While Copernicus Publications makes every effort to include appropriate place names, the final responsibility lies with the authors. Views expressed in the text are those of the authors and do not necessarily reflect the views of the publisher.
The authors would like to acknowledge NASA's Atmospheric Composition Campaign Data Analysis and Modeling program (award 20-ACCDAM20-0083). The authors also would like to acknowledge the NASA High-End Computing (HEC) Program through the NASA Advanced Supercomputing (NAS) Division at Ames Research Center (award SMD-20-28429430). Development of this database was supported in part by NOAA cooperative agreement (no. NA22OAR4320151).
This research has been supported by the Ames Research Center (grant nos. 20-ACCDAM20-0083, SMD-20-28429430, and NA22OAR4320151).
This paper was edited by Graciela Raga and reviewed by two anonymous referees.
Bakels, L., Tatsii, D., Tipka, A., Thompson, R., Dütsch, M., Blaschek, M., Seibert, P., Baier, K., Bucci, S., Cassiani, M., Eckhardt, S., Groot Zwaaftink, C., Henne, S., Kaufmann, P., Lechner, V., Maurer, C., Mulder, M. D., Pisso, I., Plach, A., Subramanian, R., Vojta, M., and Stohl, A.: FLEXPART version 11: improved accuracy, efficiency, and flexibility, Geosci. Model Dev., 17, 7595–7627, https://doi.org/10.5194/gmd-17-7595-2024, 2024.
Bey, I., Jacob, D. J., Yantosca, R. M., Logan, J. A., Field, B. D., Fiore, A. M., Li, Q., Liu, H. Y., Mickley, L. J., and Schultz, M. G.: Global modeling of tropospheric chemistry with assimilated meteorology: Model description and evaluation, J. Geophys. Res., 106, 23073–23095, https://doi.org/10.1029/2001JD000807, 2001.
Boulanger, D., Thouret, V., and Petzold, A.: In-service Aircraft for a Global Observing System (IAGOS) Data Portal [Dataset], Aeris [data set], https://doi.org/10.25326/20, 2022.
Chang, K.-L., Cooper, O. R., Gaudel, A., Allaart, M., Ancellet, G., Clark, H., Godin-Beekmann, S., Leblanc, T., Van Malderen, R., Nédélec, P., Petropavlovskikh, I., Steinbrecht, W., Stübi, R., Tarasick, D. W., and Torres, C.: Impact of the COVID-19 economic downturn on tropospheric ozone trends: an uncertainty weighted data synthesis for quantifying regional anomalies above western North America and Europe, AGU Adv., 3, e2021AV000542, https://doi.org/10.1029/2021AV000542, 2022.
Chang, K.-L., Cooper, O. R., Rodriguez, G., Iraci, L. T., Yates, E. L., Johnson, M. S., Gaudel, A., Jaffe, D. A., Bernays, N., Clark, H., Effertz, P., Leblanc, T., Petropavlovskikh, I., Sauvage, B., and Tarasick, D. W.: Diverging ozone trends above western North America: Boundary layer decreases versus free tropospheric increases, J. Geophys. Res.-Atmos., 128, e2022JD038090, https://doi.org/10.1029/2022JD038090, 2023.
Chang, K.-L., Cooper, O. R., Gaudel, A., Petropavlovskikh, I., Effertz, P., Morris, G., and McDonald, B. C.: Technical note: Challenges in detecting free tropospheric ozone trends in a sparsely sampled environment, Atmos. Chem. Phys., 24, 6197–6218, https://doi.org/10.5194/acp-24-6197-2024, 2024.
Cooper, O. R., Parrish, D. D., Stohl, A., Trainer, M., Nédélec, P., Thouret, V., Cammas, J. P., Oltmans, S. J., Johnson, B. J., Tarasick, D., Leblanc, T., McDermid, I. S., Jaffe, D., Gao, R., Stith, J., Ryerson, T., Aikin, K., Campos, T., Weinheimer, A., and Avery, M. A.: Increasing springtime ozone mixing ratios in the free troposphere over western North America, Nature, 463, https://doi.org/10.1038/nature08708, 2010.
Cooper, O. R., Oltmans, S. J., Johnson, B. J., Brioude, J., Angevine, W., Trainer, M., Parrish, D. D., Ryerson, T. R., Pollack, I., Cullis, P. D., Ives, M. A., Tarasick, D. W., Al-Saadi, J., and Stajner, I.: Measurement of western U.S. baseline ozone from the surface to the tropopause and assessment of downwind impact regions, J. Geophys. Res., 116, D00V03, https://doi.org/10.1029/2011JD016095, 2011.
Cui, Y. Y., Ryoo, J.-M., Johnson, M. S., Chang, K.-L., Yates, E., Cooper, O. R., and Iraci, L. T.: NASA_ACCDAM_FLEXPART_ERA5_BackTrajectory_ 28yrOzone_WNA, NASA [code and data set], https://doi.org/10.5067/ASDC/WNA-BackTraj, 2025.
Environment and Climate Change Canada: Canadian ozonesonde network, World Ozone and Ultraviolet Radiation Data Centre [data set], https://hegiftom.meteo.be/datasets/ozonesondes (last access: 3 November 2025), 2022.
Fiore, A., Naik, V., Spracklen, D., Steiner, A., Unger, N., Prather, M., Bergmann, D., Cameron-Smith, P., Cionni, I., Collins, W., Dalsøren, S., Eyring, V., Folberth, G., Ginoux, P., Horowitz, L., Josse, B., Lamarque, J.-F., Mackenzie, I., Nagashima, T., and Zeng, G.: Global air quality and climate, Chem. Soc. Rev., 41, 6667–6685, https://doi.org/10.1039/C2CS35095E, 2012.
Forster, C., Stohl, A., and Seibert, P.: Parameterization of Convective Transport in a Lagrangian Particle Dispersion Model and Its Evaluation, J. Appl. Meteorol. Clim., 46, 403–422, https://doi.org/10.1175/JAM2470.1, 2007.
Gaudel, A., Cooper, R. O., Chang, K.-L., Bourgeois, I., Ziemke, J. R., Sarah, A. S., Oman, L. D., Sellitto, P., Nédélec, P., Blot, R., Thouret, V., and Granier, C.: Aircraft observations since the 1990s reveal increases of tropospheric ozone at multiple locations across the Northern Hemisphere, Sci. Adv., 6, eaba8272, https://doi.org/10.1126/sciadv.aba8272, 2020.
Gaudel, A., Bourgeois, I., Li, M., Chang, K.-L., Ziemke, J., Sauvage, B., Stauffer, R. M., Thompson, A. M., Kollonige, D. E., Smith, N., Hubert, D., Keppens, A., Cuesta, J., Heue, K.-P., Veefkind, P., Aikin, K., Peischl, J., Thompson, C. R., Ryerson, T. B., Frost, G. J., McDonald, B. C., and Cooper, O. R.: Tropical tropospheric ozone distribution and trends from in situ and satellite data, Atmos. Chem. Phys., 24, 9975–10000, https://doi.org/10.5194/acp-24-9975-2024, 2024.
Grant, W. B., Browell, E. V., Butler, C. F., Fenn, M. A., Clayton, M. B., Hannan, J. R., Fuelberg, H. E., Blake, D. R., Blake, N. J., Gregory, G. L., Heikes, B. G., Sachse, G. W., Singh, H. B., Snow, J., and Talbot, R. W.: A case study of transport of tropical marine boundary layer and lower tropospheric air masses to the northern midlatitude upper troposphere, J. Geophys. Res., 105, 3757–3769, https://doi.org/10.1029/1999JD901022, 2000.
Gulev, S. K., Thorne, P. W., Ahn, J., Dentener, F. J., Domingues, C. M., Gerland, S., Gong, D., Kaufman, D. S., Nnamchi, H. C., Quaas, J., Rivera, J. A., Sathyendranath, S., Smith, Trewin, S. L., B., von Schuckmann, K., Vose, R. S., Allan, R., Collins, B., Turner, A. and Hawkins, E.: Changing state of the climate system, in: Climate Change 2021: The Physical Science Basis, Contribution of Working Group I to the Sixth Assessment Report of the Intergovernmental Panel on Climate Change, edited by: MassonDelmotte, V., Zhai, P., Pirani, A., Connors, S. L., Péan, C., Berger, S., Caud, N., Chen, Y., Goldfarb, L., Gomis, M. I., Huang, M., Leitzell, K., Lonnoy, E., Matthews, J. B. R., Maycock, T. K., Waterfield, T., Yelekçi, O., Yu, R. and Zhou, B., Cambridge University Press, Cambridge, UK, 287–422, https://doi.org/10.1017/9781009157896.004, 2021.
Hegarty, J., Draxler, R. R., Stein, A. F., Brioude, J., Mountain, M., Eluszkiewicz, J., Nehrkorn, T., Ngan, F., and Andrews, A.: Evaluation of Lagrangian Particle Dispersion Models with Measurements from Controlled Tracer Releases, J. Appl. Meteorol. Clim., 52, 2623–2637, https://doi.org/10.1175/JAMC-D-13-0125.1, 2013.
Hersbach, H., Bell, B., Berrisford, P., Hirahara, S., Horányi, A., Muñoz-Sabater, J., Nicolas, J., Peubey, C., Radu, R., Schepers, D., Simmons, A., Soci, C., Abdalla, S., Abellan, X., Balsamo, G., Bechtold, P., Biavati, G., Bidlot, J., Bonavita, M., De Chiara, G., Dahlgren, P., Dee, D., Diamantakis, M., Dragani, R., Flemming, J., Forbes, R., Fuentes, M., Geer, A., Haimberger, L., Healy, S., Hogan, R. J., Hólm, E., Janisková, M., Keeley, S., Laloyaux, P., Lopez, P., Lupu, C., Radnoti, G., de Rosnay, P., Rozum, I., Vamborg, F., Villaume, S., and Thépaut, J.-N.: The ERA5 global reanalysis, Q. J. Roy. Meteorol. Soc., 146, 19992049, https://doi.org/10.1002/qj.3803, 2020.
Iraci, L. T., Yates, E. L., Marrero, J. E., Parworth, C. L., Ryoo, J.-M., and Tanaka, T.: Airborne Trace Gas Measurements Collected by the Alpha Jet Atmospheric eXperiment (AJAX) Project: 2011–2018 [data set], Atmospheric Science Data Center [data set], https://doi.org/10.5067/ASDC/AJAX_O3, 2021.
Jacob, D. J., Logan, J. A., and Murti, P. P.: Effect of rising Asian emissions on surface ozone in the United States, Geophys. Res. Lett., 26, 2175–2178, https://doi.org/10.1029/1999GL900450, 1999.
Jaffe, D., Chand, D., Hafner, W., Westerling, A., and Spracklen, D.: Influence of Fires on O3 Concentrations in the Western U.S., Environ. Sci. Technol., 42, 5885–5891, https://doi.org/10.1021/es800084k, 2008.
Jaffe, D. A. and Wigder, N. L.: Ozone production from wildfires: a critical review, Atmos. Environ., 51, 1–10, https://doi.org/10.1016/j.atmosenv.2011.11.063, 2012.
Jaffe, D. A., Cooper, O. R., Fiore, A. M., Henderson, B. H., Tonnesen, G., Russell, A. G., and Moore, T.: Scientific assessment of background ozone over the U.S.: implications for air quality management, Elem. Sci. Anth, 6, https://doi.org/10.1525/elementa.309, 2018.
Kinnison, D. E., Connell, P. S., Rodriguez, J. M., Rotman, D. A., Considine, D. B., Tannahill, J., Ramaroson, R., Rasch, P. J., Douglass, A. R., Baughcum, S. L., Coy, L., Waugh, D. W., Kawa, S. R., and Prather, M. J.: The Global Modeling Initiative Assessment Model: Application to High-Speed Civil Transport Perturbation, J. Geophys. Res., 106, 1693–1711, 2001.
Lin, M., Fiore, A. M., Cooper, O. R., Horowitz, L. W., Langford, A. O., Levy II, H., Johnson, B. J., Naik, V., Oltmans, S. J., and Senff, C.: Springtime high surface ozone events over the western United States: Quantifying the role of stratospheric intrusions, J. Geophys. Res., 117, D00V22, https://doi.org/10.1029/2012JD018151, 2012.
Lin, M., Fiore, A. M., Horowitz, L. W., Langford, A. O., Oltmans, S. J., Tarasick, D., and Reider, H. E.: Climate variability modulates western US ozone air quality in spring via deep stratospheric intrusions, Nat. Commun., 6, 7105, https://doi.org/10.1038/ncomms8105, 2015.
NASA JPL – Jet Propulsion Laboratory: Table Mountain atmospheric lidar data, Network for the Detection of Atmospheric Composition Change [data set], https://www-air.larc.nasa.gov/missions/ndacc/ (last access: 3 November 2025), 2022.
NOAA GML – Global Monitoring Laboratory: Homogenized ozonesonde data archive, https://gml.noaa.gov/aftp/data/ozwv/Ozonesonde/ (last access: 3 November 2025), 2022.
Pisso, I., Sollum, E., Grythe, H., Kristiansen, N. I., Cassiani, M., Eckhardt, S., Arnold, D., Morton, D., Thompson, R. L., Groot Zwaaftink, C. D., Evangeliou, N., Sodemann, H., Haimberger, L., Henne, S., Brunner, D., Burkhart, J. F., Fouilloux, A., Brioude, J., Philipp, A., Seibert, P., and Stohl, A.: The Lagrangian particle dispersion model FLEX-PART version 10.4, Geosci. Model Dev., 12, 4955–4997, https://doi.org/10.5194/gmd-12-4955-2019, 2019.
Ryoo, J.-M., Iraci, L. T., Cui, Y. Y., Johnson, M. S., Cooper, O. R., Chang, K.-L., and Yates, E.: Western North American FLEXPART Back Trajectory 1994–2021 Merge Data, NASA, [data set], https://doi.org/10.5067/WNA-BackTraj/1994-2021-Merge, 2025.
Seibert, P. and Frank, A.: Source-receptor matrix calculation with a Lagrangian particle dispersion model in backward mode, Atmos. Chem. Phys., 4, 51–63, https://doi.org/10.5194/acp-4-51-2004, 2004.
Stohl, A., Hittenberger, M., and Wotawa, G.: Validation of the Lagrangian particle dispersion model FLEXPART against large-scale tracer experiment data, Atmos. Environ., 32, 4245–4264, 1998.
Stohl, A., Forster, C., Frank, A., Seibert, P., and Wotawa, G.: Technical note: The Lagrangian particle dispersion model FLEXPART version 6.2, Atmos. Chem. Phys., 5, 2461–2474, https://doi.org/10.5194/acp-5-2461-2005, 2005.
Tarasick, D., Galbally, I. E., Cooper, O. R., Schultz, M. G., Ancellet, Gerard, Leblanc, T., Wallington, T. J., Ziemke, J., Liu, X., Steinbacher, M., Staehelin, J., Vigouroux, C., Hannigan, J. W., García, O., Foret, G., Zanis, P., Weatherhead, E., Petropavlovskikh, I., Worden, H., Osman, M., Liu, J., Chang, K.-L., Gaudel, A., Lin, M., Granados-Muñoz, M., Thompson, A. M., Oltmans, S. J., Cuesta, J., Dufour, G., Thouret, V., Hassler, B., Trickl, T., and Neu, J. L.: Tropospheric Ozone Assessment Report: Tropospheric ozone from 1877 to 2016, observed levels, trends and uncertainties, Elementa: Science of the Anthropocene 1 January 2019, 7, 39, https://doi.org/10.1525/elementa.376, 2019.
Taylor, J. R.: An Introduction to Error Analysis: The Study of Uncertainties in Physical Measurements, 2nd Edn., University Science Books, Sausalito, CA, USA, ISBN 978-0-935702-42-2, 1997.
Tipka, A., Haimberger, L., and Seibert, P.: Flex_extract v7.1.2 – a software package to retrieve and prepare ECMWF data for use in FLEXPART, Geosci. Model Dev., 13, 5277–5310, https://doi.org/10.5194/gmd-13-5277-2020, 2020.
Van Malderen, R., Zang, Z., Chang, K.-L., Björklund, R., Cooper, O. R., Liu, J., Maillard Barras, E., Vigouroux, C., Petropavlovskikh, I., Leblanc, T., Thouret, V., Wolff, P., Effertz, P., Gaudel, A., Tarasick, D. W., Smit, H. G. J., Thompson, A. M., Stauffer, R. M., Kollonige, D. E., Poyraz, D., Ancellet, G., De Backer, M.-R., Frey, M. M., Hannigan, J. W., Hernandez, J. L., Johnson, B. J., Jones, N., Kivi, R., Mahieu, E., Morino, I., McConville, G., Müller, K., Murata, I., Notholt, J., Piters, A., Prignon, M., Querel, R., Rizi, V., Smale, D., Steinbrecht, W., Strong, K., and Sussmann, R.: Ground-based Tropospheric Ozone Measurements: Regional tropospheric ozone column trends from the TOAR-II/HEGIFTOM homogenized datasets, EGUsphere [preprint], https://doi.org/10.5194/egusphere-2024-3745, 2025.
Wu, L., Su, H., Zeng, X, Posselt, D. J., Wong, S., Chen, S., and Stoffelen, A.: Uncertainty of Atmospheric Winds in Three Widely Used Global Reanalysis Datasets, J. Appl. Meteorol. Clim., 63, 165–180, https://doi.org/10.1175/JAMC-D-22-0198.1, 2024.
- Abstract
- Introduction
- Reconciliation of multiplatform ozone observations
- Configuration of the SRR product
- Product illustration
- Discussion and additional applications
- Code and data availability
- Summary
- Author contributions
- Competing interests
- Disclaimer
- Acknowledgements
- Financial support
- Review statement
- References