the Creative Commons Attribution 4.0 License.
the Creative Commons Attribution 4.0 License.
 | 05 Nov 2025
The flask monitoring program for high-precision atmospheric measurements of greenhouse gases, stable isotopes, and radiocarbon in the central Amazon region
Ingrid Chanca
Meinrat O. Andreae
Alessandro Carioca de Araújo
Hella van Asperen
Lars Borchardt
Santiago Botía
Luiz Antonio Candido
Caio S. C. Correa
Cléo Quaresma Dias-Junior
Markus Eritt
Annica Fröhlich
Luciana V. Gatti
Marcus Guderle
Samuel Hammer
Martin Heimann
Viviana Horna
Armin Jordan
Steffen Knabe
Richard Kneißl
Jost Valentin Lavric
Ingeborg Levin
Kita Macario
Juliana Menger
Heiko Moossen
Carlos Alberto Quesada
Michael Rothe
Christian Rödenbeck
Yago Santos
Axel Steinhof
Bruno Takeshi
Susan Trumbore
Sönke Zaehle
Long-term and high-precision measurements of the mole fraction of greenhouse gases (GHG), together with their isotopic composition, are of fundamental importance to understand land–atmosphere interactions. Current flask monitoring programs have important information gaps in large regions of the Earth, particularly in the southern hemisphere and in continental tropical regions. Here, we report on the initiation of a monitoring program and the resulting dataset of high-precision GHG measurements at the Amazon Tall Tower Observatory (ATTO), located in the central Amazon region of Brazil. In September 2021, we installed an automated flask sampler designed and built by the Integrated Carbon Observation System (ICOS) to collect air samples in 3 L flasks at a height of 324 m above ground level (). Samples are collected weekly, during a one-hour integration time between 13:00 and 14:00 h LT (17:00–18:00 UTC). The flasks are shipped to Jena, Germany, for analyses of CO2, CO, CH4, N2O, H2, SF6, δ13C−CO2, Δ14C−CO2, δ18O−CO2, δ13C−CH4, δ2H−CH4, , and at the laboratories of the Max Planck Institute for Biogeochemistry (MPI-BGC). Measurements from this monitoring program provide reference information for this site and act as an additional independent quality control for other measurements in the region. The record of SF6 and simulations based on a regional atmospheric transport model suggest that the footprint of the measurements is predominantly from the southeasterly and northeasterly directions. The time series of the different gas species measured in this monitoring program are being made publicly available through the ATTO data portal (https://doi.org/10.17871/ATTO.574.13.2365, Sierra et al., 2025).
- Article
(3705 KB) - Full-text XML
- BibTeX
- EndNote


The Amazon river basin is one of the largest forested regions on Earth and exchanges large amounts of energy, water, and greenhouse gases (GHGs) with the atmosphere. Given the large area of the Amazon forest, gas exchange between the forest and the atmosphere has a considerable impact on atmospheric concentrations of GHGs at regional and global levels (Artaxo et al., 2022; Gatti et al., 2021; Basso et al., 2023). Gas exchange between the forest and the atmosphere also carries a signal of metabolic activity and ecosystem functioning. For instance, Amazon forests release large quantities of carbon dioxide and methane to the atmosphere through the combined activity of autotrophic and heterotrophic organisms, which modify the isotopic signature of these gases through fractionation processes, providing a signature of their metabolism and the source of emissions (Ometto et al., 2002).
Previous studies based on atmospheric profiles of GHGs at the basin scale have shown signals not only on the carbon source/sink status of Amazon forests, but also on the signatures of fires and deforestation related to droughts (Andreae et al., 1988, 2012; Lloyd et al., 2007; Gatti et al., 2014, 2021; van der Laan-Luijkx et al., 2015; Alden et al., 2016; Basso et al., 2023). Measurements of methane from aircraft campaigns have also shown the importance of biogenic fluxes at the basin scale and how climate variability influence methane fluxes for different regions of the Amazon basin (Beck et al., 2012, 2013; Basso et al., 2021). High-precision measurements of GHG collected in flasks from aircraft campaigns have demonstrated the value of monitoring the temporal evolution of GHG concentrations for the Amazon forests, a region where very few continuous monitoring sites exist (cf. Molina et al., 2015; Botía et al., 2025).
Despite these previous efforts, the Amazon basin remains underrepresented in global observation networks of GHGs and contributes a large share of uncertainty in flux estimates from global atmospheric inversions. Furthermore, continuous records of isotopes in gases are practically inexistent for the Amazon and most parts of the tropics, which hinders our ability to disentangle the main processes that contribute to GHG emissions from these regions.
In particular, radiocarbon measurements in carbon dioxide (14C−CO2) provide key information to disentangle the contribution of fossil fuel burning from the contribution of biogenic fluxes to the atmospheric CO2 concentration record (Turnbull et al., 2009; Graven et al., 2020; Levin et al., 2022). Despite their importance, continuous high-precision measurements of 14C−CO2 are only available at a handful of stations (Levin et al., 2022), and direct atmospheric measurements for the Amazon basin have never been done before on a regular basis. One of the main limitations for these measurements is the collection of large volumes of air to extract enough carbon in CO2 for measurements by accelerator mass spectrometry, a technique that requires sophisticated laboratories, and therefore challenging logistics to frequently transport samples between remote field sites in the Amazon forest and laboratories in other countries or continents.
High-precision analysis of a comprehensive range of gas species and their isotopic signatures within the same sample, including radiocarbon, requires the collection of relatively large air volumes, with a minimum of 2 L for natural atmospheric concentrations. Sampling at regular frequencies is now facilitated by new instrumentation that allows one to automatically program sampling events for the collection of air samples in glass flasks following standardized protocols for the timing of sampling, the flow rate of air for sample collection, the drying of air before storage in flasks, and the pressure at which the air is stored (Levin et al., 2020). The Integrated Carbon Observation System (ICOS), an European research infrastructure for monitoring greenhouse gases (GHGs), has developed an automated sampling system that can be deployed to remote sites that have at least access to electrical power and internet. Infrastructure with these characteristics is available within the Amazon basin at the Amazon Tall Tower Observatory (ATTO) (Andreae et al., 2015), a research site situated in the central Amazon region that features a tall tower with a height of 325 This unique infrastructure provides a remarkable opportunity to collect gas samples at unprecedented heights for the region. In this article, we report on the initiation of a continuous monitoring program for gas sampling at the tall tower at the ATTO site for the continuous high-precision measurements of a set of GHGs and isotopes.
The flask monitoring program at ATTO has four main objectives: (i) to provide a record of weekly measurements of CO2, CO, CH4, N2O, H2, SF6, δ13C−CO2, 14C−CO2, δ18O−CO2, δ13C−CH4, δ2H−CH4, , and from samples taken at a height of 324 representative of background air for the study site; (ii) to provide additional independent quality control for other high-frequency measurements of CO2, CH4, CO, N2O, and δ13C−CO2 performed with other instruments at the site; (iii) to provide information on the background concentration of radiocarbon in CO2 and other isotopes necessary for source partitioning of atmospheric signals at the local level; (iv) to detect anthropogenic signals related to large-scale fires and fossil fuel burning using a combination of tracers such CO2, CO, and Δ14C−CO2.
This article introduces the set of sampling and laboratory methods used at the ATTO flask monitoring program as well as data processing workflows. The data produced in this monitoring program is made available through the ATTO data portal (https://www.attodata.org, last access: 1 November 2025). This article provides the main reference for the data and will be updated on a regular basis.
2.1 Study area and sample collection
The Amazon Tall Tower Observatory (ATTO) is a research infrastructure located in the central Amazon region of Brazil, and it is part of the Uatumã sustainable development reserve. The site is located 150 km from the city of Manaus in the northeast direction (02° 08.7520′ S, 59° 00.3350′ W) on top of a plateau at 130–140 m above sea level (). Vegetation in the region is characteristic of the tropical rain forest biome, and several ecosystems are found in the surroundings of the ATTO site, among them seasonally flooded black-water forests (igapós), white-sand forests (campinas and campinaranas), and non-flooded evergreen rainforest (terra-firme). Surrounding the tower, vegetation is a typical terra-firme forest with an average tree height of ∼30 m and aboveground biomass carbon of ∼170 Mg C ha−1 (Andreae et al., 2015). Mean annual precipitation is about 2382 mm, with a marked seasonal cycle of precipitation, including a rainy season between the months of February to May, and a dry season from June to October (Botía et al., 2022). Mean annual temperature is 26.3 °C, with a mean temperature of 27.5 °C for the dry season and a mean temperature for the rainy season months of 25.2 °C (Schmitt et al., 2023; Gonçalves et al., 2024). The site hosts three towers for the study of forest-atmosphere interactions, two towers of ∼80 m height with instrumentation for continuous measurements of GHG and aerosols, and the tall tower of 325 (331 m including the top lighting rod antenna). The flask monitoring system described in this article is installed on the tall tower.
The inlet air filter for sampling (Solberg F-15-050, Canada) is located on the top of the tall tower at a height of 324 At the time of installation, the estimated height of the inlet was 321 , and previous studies commonly report this height, but a recent reassessment provided an actual height of 324 The air inlet is attached to a fluoropolymer (PFA) tubing of 6.35 mm ( in.) outer diameter and ∼4 mm ( in.) inner diameter (TILM07B, SMC Corporation, Japan). The tubing enters a temperature-controlled container at the base of the tower, where the automated flask sampler is located.
2.2 Automated flask sampler
In September 2021, we installed an automated flask sampler, designed and built by the ICOS Flask and Calibration Laboratory (FCL) (Levin et al., 2020). The sampler is a system that consists of four trays with a total capacity for 24 flasks, and an air drying unit through which the air passes before entering the flasks (Fig. 1). The sampler has its own software for programming sampling events and can be controlled remotely. Similar samplers have been installed in all Class 1 stations of the ICOS network in Europe (∼19 sites as of January 2025) (Levin et al., 2020).
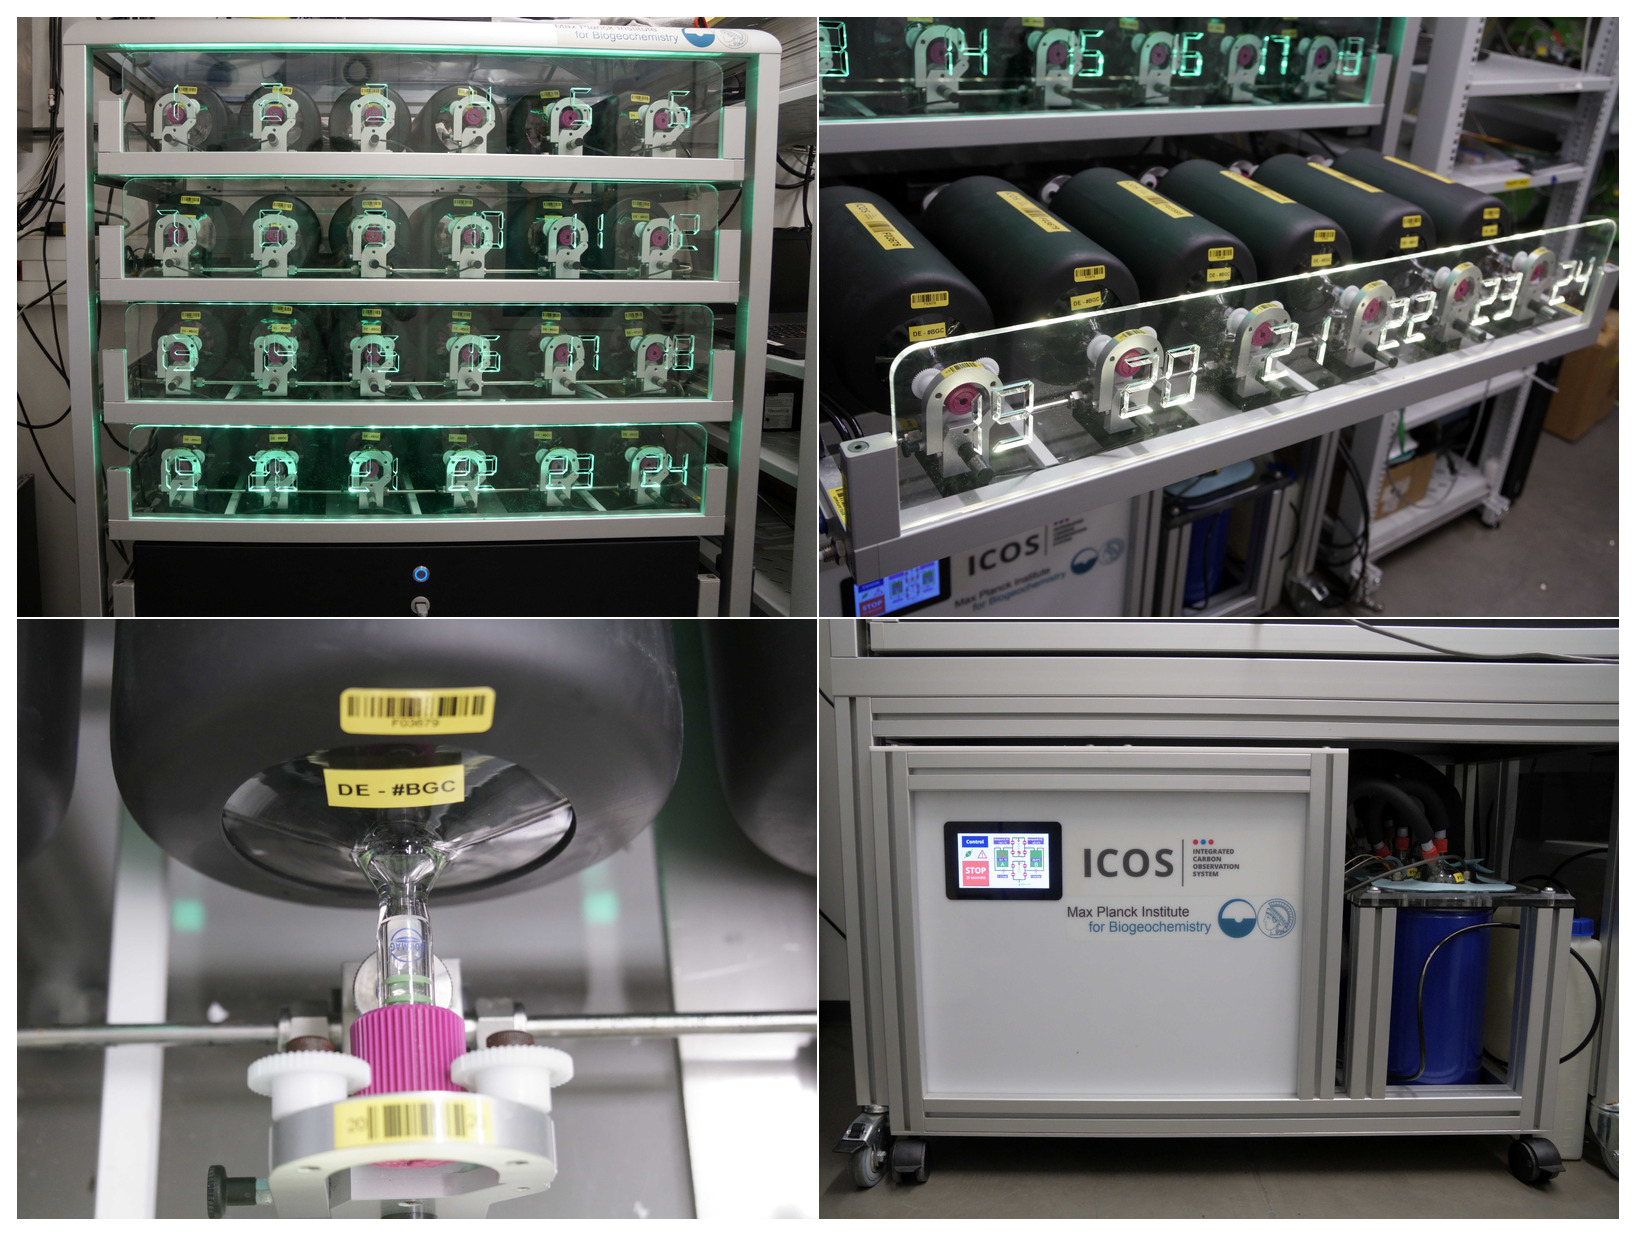
Figure 1Automated flask sampler installed at the ATTO site. The sampler consists of four trays, and each tray holds six flasks, for a total of 24 flasks available for sampling. A drawer below the last tray contains all the electronic components and the compressor pump. The flasks are of 3 L volume and samples are stored at an overpressure of ∼0.7 bar. A drying unit (bottom right) takes the air drawn in by the sampler and cools it to a dew point below −38 °C.
The glass flasks are of 3 L volume (ICOS-3000, Pfaudler Normag Systems GmbH, Germany) and are covered by a dark plastic material that serves for mechanical protection and to prevent photochemical changes to the air samples. To enable flushing of the flask before air sampling, each flask is equipped with a valve at both ends, which are connected to the sampler with a 12.6 mm clamp-ring connector. The valves at the ends of the flasks are made from polychlorotrifluoroethylene (PCTFE) sealing caps, which minimizes storage effects on trace gas composition in comparison to PFA seals (Rothe et al., 2005).
The air dryer contains two alternately operating water traps for permanent air drying down to a dew point of °C. Each trap consists of a Dewar vessel with two glass cylinders (50 and 70 mm in diameter), two temperature sensors, a heating cartridge and a cooling probe that is connected to an immersion cooler. The cooling medium in the Dewar vessels is silicon oil M5 (Carl Roth GmbH & Co. KG, Germany). Inside the device are two immersion coolers, a valve installation with humidity sensors, an over-pressure pump for water removal from the heated traps, and the control electronics.
2.3 Flask sampling and measurement cycle
2.3.1 Sample collection and transport
Flasks are first prepared at the ICOS FCL in Jena, Germany, where they are inspected and tested for leaks. Each flask is filled with dry ambient air of known composition at a pressure of 1.6 bar. Sets of 12 flasks are packed in boxes with protective material and sent by air freight to the National Institute for Amazon Research (INPA) in Manaus, Brazil (Fig. 2). From INPA, they are sent to the ATTO research station on a 4–6 h trip that involves transport by car until Porto Morena, near the Balbina hydroelectric dam, transport by boat along the Uatumã river, and transport by car from the river to the ATTO station.
The flasks are then loaded in the auto sampler, which is programmed to collect one sample every Thursday at mid-day local time. Sampling starts at 16:30 UTC (12:30 LT) with an initial 30 m in flush of the sampling line. The collection of gas in the flasks starts at 17:00 UTC and follows the so-called method, which is a dynamic filling method with a maximum flow rate of 2 L min−1 at the beginning of sampling and a minimum of 80 mL min−1 at the end of sampling. Filling of gas in the flask ends at 18:00 UTC. During a phase test that lasted about 4 months, we also collected samples at local midnight, between 05:30 and 07:00 UTC, to test the range in values obtained at the site.
Once two or more sets of 12 flask samples (12 flasks per shipping box) are collected, they start their return to Germany for laboratory analyses. They are transported back by boat and car to INPA in Manaus, and from there by air freight to Germany. When the samples arrive at the MPI-BGC in Jena, they are assigned a Unique Sample Number (USN) and follow standard protocols for gas measurements at the gas, stable isotope, and radiocarbon laboratories. After measurements, the flasks are sent back to ICOS FCL where they are inspected and prepared, and the cycle starts again (Fig. 2).
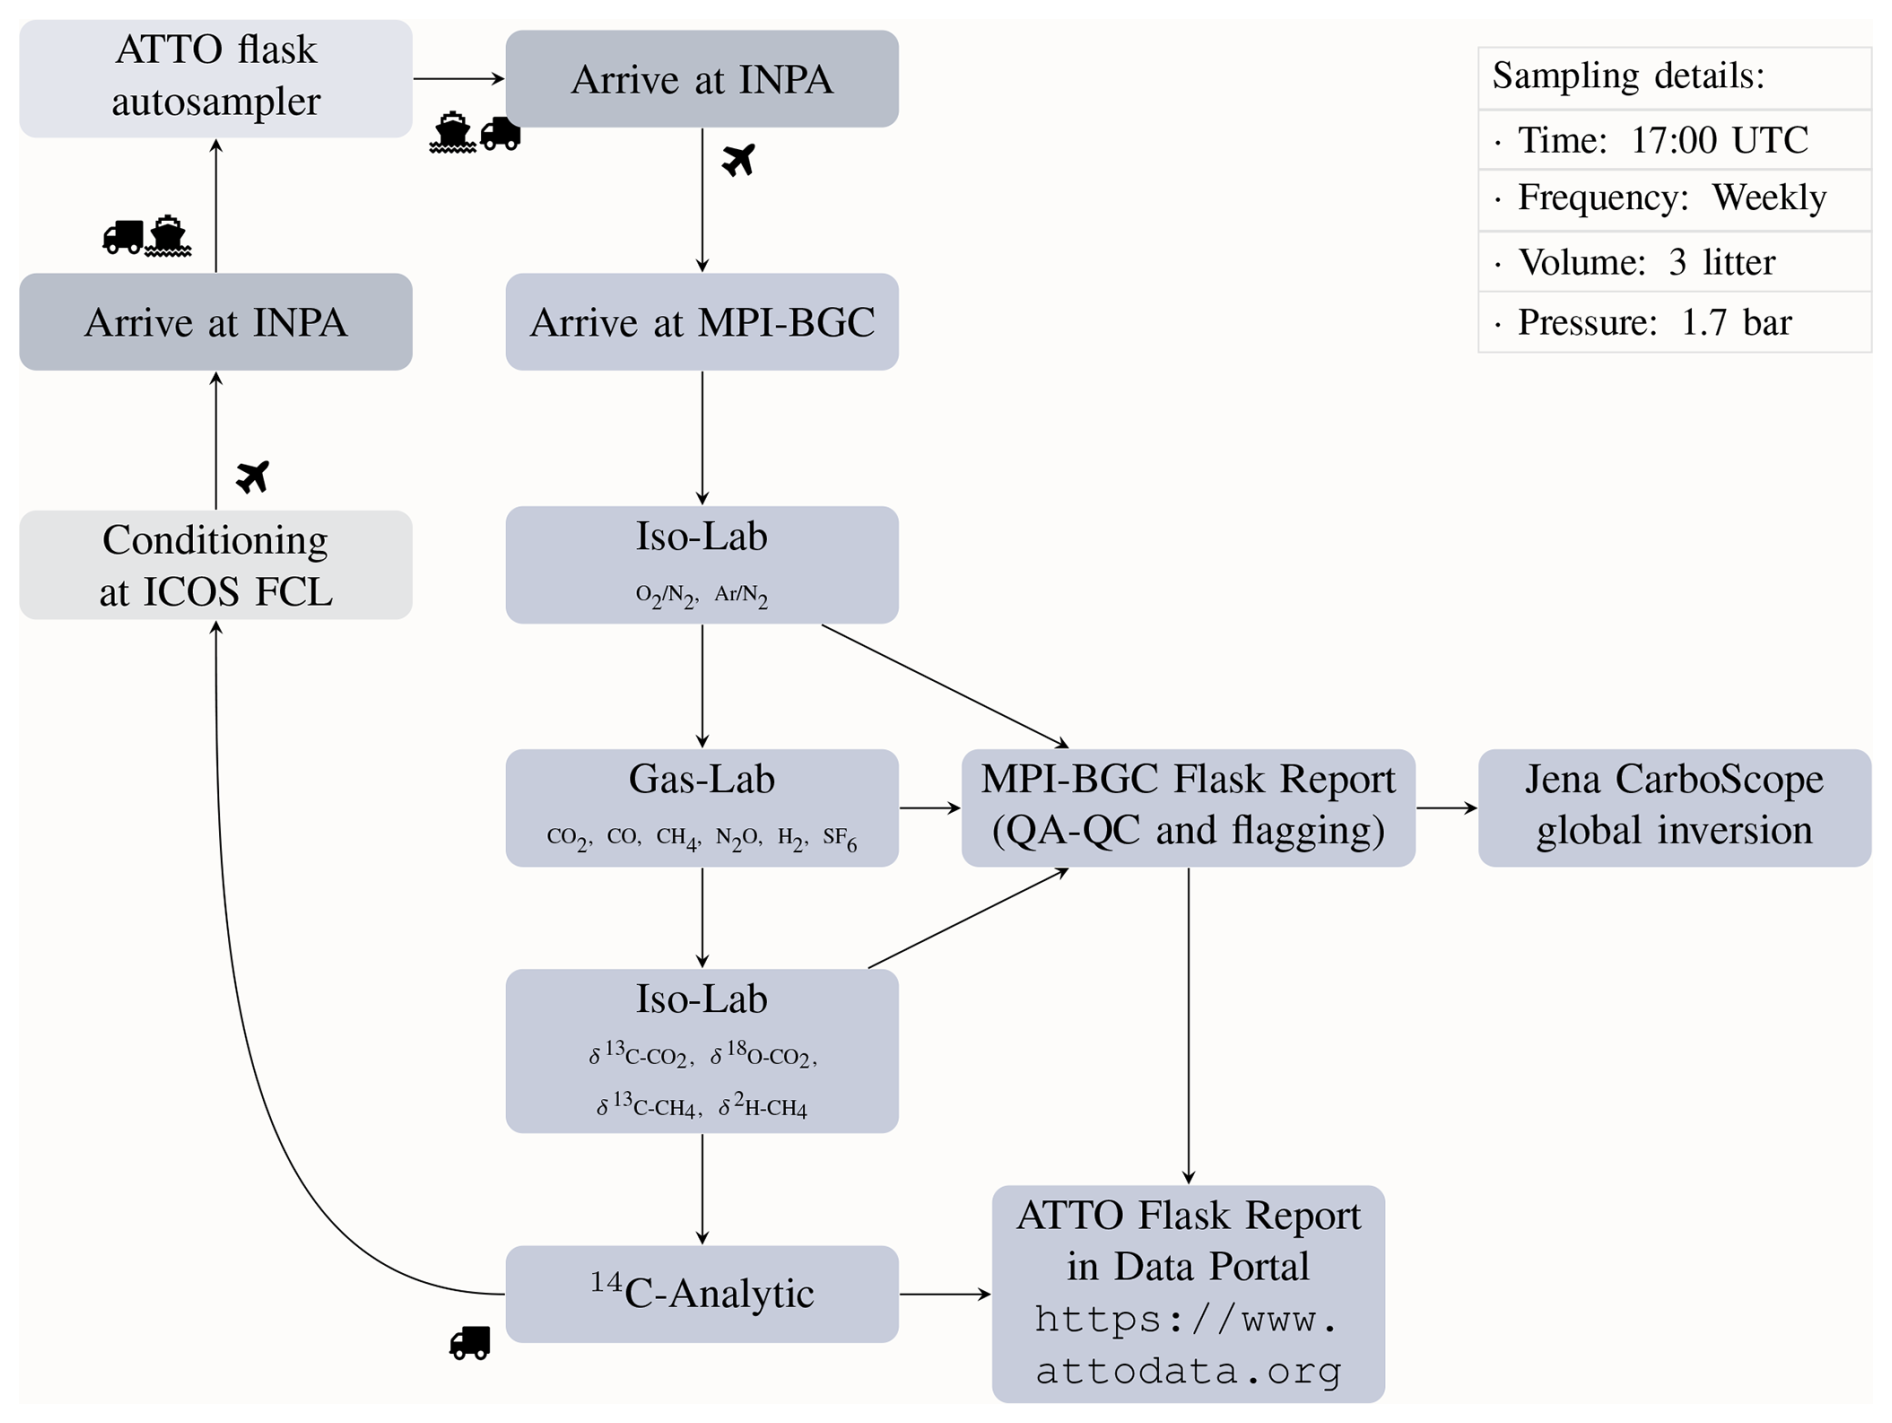
Figure 2Flask sampling and analysis cycle for the ATTO flask monitoring program. The cycle starts with the preparation and conditioning of flasks at the ICOS-FCL, which are then transported to Brazil for air sampling at the ATTO tower (upper left corner). After sampling, sets of 12 flasks are sent from ATTO to the National Institute for Amazonian Research (INPA) in Manaus. From there, flasks are sent to the Max Planck Institute for Biogeochemistry in Jena, Germany. After arrival, the flasks are analyzed at the Iso-Lab and the Gas-Lab. These labs produce a report that feeds to the global network of monitoring sites of MPI-BGC (Heimann et al., 2022). This data report is also used to update the Jena CarboScope atmospheric inversion system. The remaining gas in the flasks is transferred to the 14C-Analytic lab for analysis of 14C−CO2. Empty flasks are returned to the ICOS FCL for conditioning and the cycle starts again.
2.3.2 Description of laboratory analyses
After flasks arrive at the MPI-BGC, they pass through a sequence of analytical measurements by gas chromatography, mass spectrometry, and accelerator mass spectrometry. The flasks follow the same analytical methods as all other flasks from the MPI-BGC flask network (Heimann et al., 2022), with the main difference that for ATTO, we do not collect replicates due to the design of the ICOS autosampler (Levin et al., 2020), and we add the radiocarbon measurements.
In a first step, samples are analyzed for and ratios. Flasks are attached to a customized autosampler and the air is then analyzed using an isotope-ratio mass spectrometer (IRMS, Delta+XL, Thermo Finnigan) via a dual inlet setup. Measurements are made against reference air prepared in-house, which is periodically compared to reference air from the Scripps Oceanography Institution. Efforts are underway to bring measurements onto the new “SIO 2017 ” scale. Additional details about the measuring system can be found in Brand (2005).
In a second step, samples are analyzed for CO2, CO, CH4, N2O, H2, SF6 using gas chromatography. The gas chromatography (GC) system combines two Agilent 6890 gas chromatographs (Agilent Technologies Inc., USA), each equipped with combinations of sample loops, separation columns, and detection units. One of the GCs is suited for the detection of CO2, CH4 (applying flame ionization detection (FID), and N2O (using electron capture detection (ECD)). The second GC is equipped with detectors for H2 (pulse-discharge detector), CO (Reduction Gas Detector (RGD)), and SF6 (ECD). Calibration of the measurements is based on a set of WMO tertiary reference standards and the trace gas data are reported on the respective WMO mole fraction scales. Details on the chromatographic methods and data quality assessments are provided in Heimann et al. (2022) and Worthy et al. (2023).
In the third step, samples are measured for stable isotopes in CO2 and CH4. High-precision analyses of stable isotopes in these gases are performed routinely at the IsoLab of the MPI-BGC (Werner et al., 2001; Ghosh et al., 2005; Wendeberg et al., 2013; Brand et al., 2016). Flasks are mounted in a fully automated cryogenic extraction system (BGC-Air Trap) that extracts CO2 and CH4. Isotopes of atmospheric CO2 are analyzed on one of two MAT252 IRMSs, while CH4 isotopes are analyzed on a system that consists of two IRMSs (Delta-V Plus, Thermo Fisher, Bremen, Germany) coupled to an extraction setup. Isotopes of CO2 are reported on the JRAS-06 scale (Wendeberg et al., 2013). δ13C−CH4 data is reported on the VPDB-LSVEC scale while δ2H−CH4 isotopes are reported on the VSMOW/SLAP scales (Sperlich et al., 2016; Brand et al., 2016). The uncertainties reported contain the individual measurement uncertainty as well as the propagated calibration scale uncertainty.
In the last step of the measurement cycle, the samples are analyzed for 14C in CO2. This is done as the last step because it does not require a minimum gas pressure in the flasks, but only a minimum amount of carbon of 0.6 mg C. To analyze the 14C concentration, the CO2 is first extracted using the Air-CO2-Extraction System (ACES), which consists of a manifold for 20 flasks and a cryogenic water trap (Steinhof et al., 2004). After passing the water trap, the CO2 is separated from the other gases (nitrogen, oxygen, and argon) in the cryogenic trap of the Universal Gas Collection System (UGCS) (Steinhof et al., 2017). The CO2 is then injected into the reaction vessel together with hydrogen. The reaction vessel is heated to 550 °C so that the hydrogen reacts with the CO2 to form graphite using iron as a catalyst. The graphite is then pressed into aluminum targets and loaded into magazines for accelerator mass spectrometry (AMS) measurements, which are performed with a MICADAS AMS system (Ionplus AG, Switzerland).
Table 1Set of trace-gas species measured in the ATTO flask monitoring program. Measurement methods include gas chromatography (GC), mass spectrometry (MS), and accelerator mass spectrometry (AMS). Modified after Heimann et al. (2022).
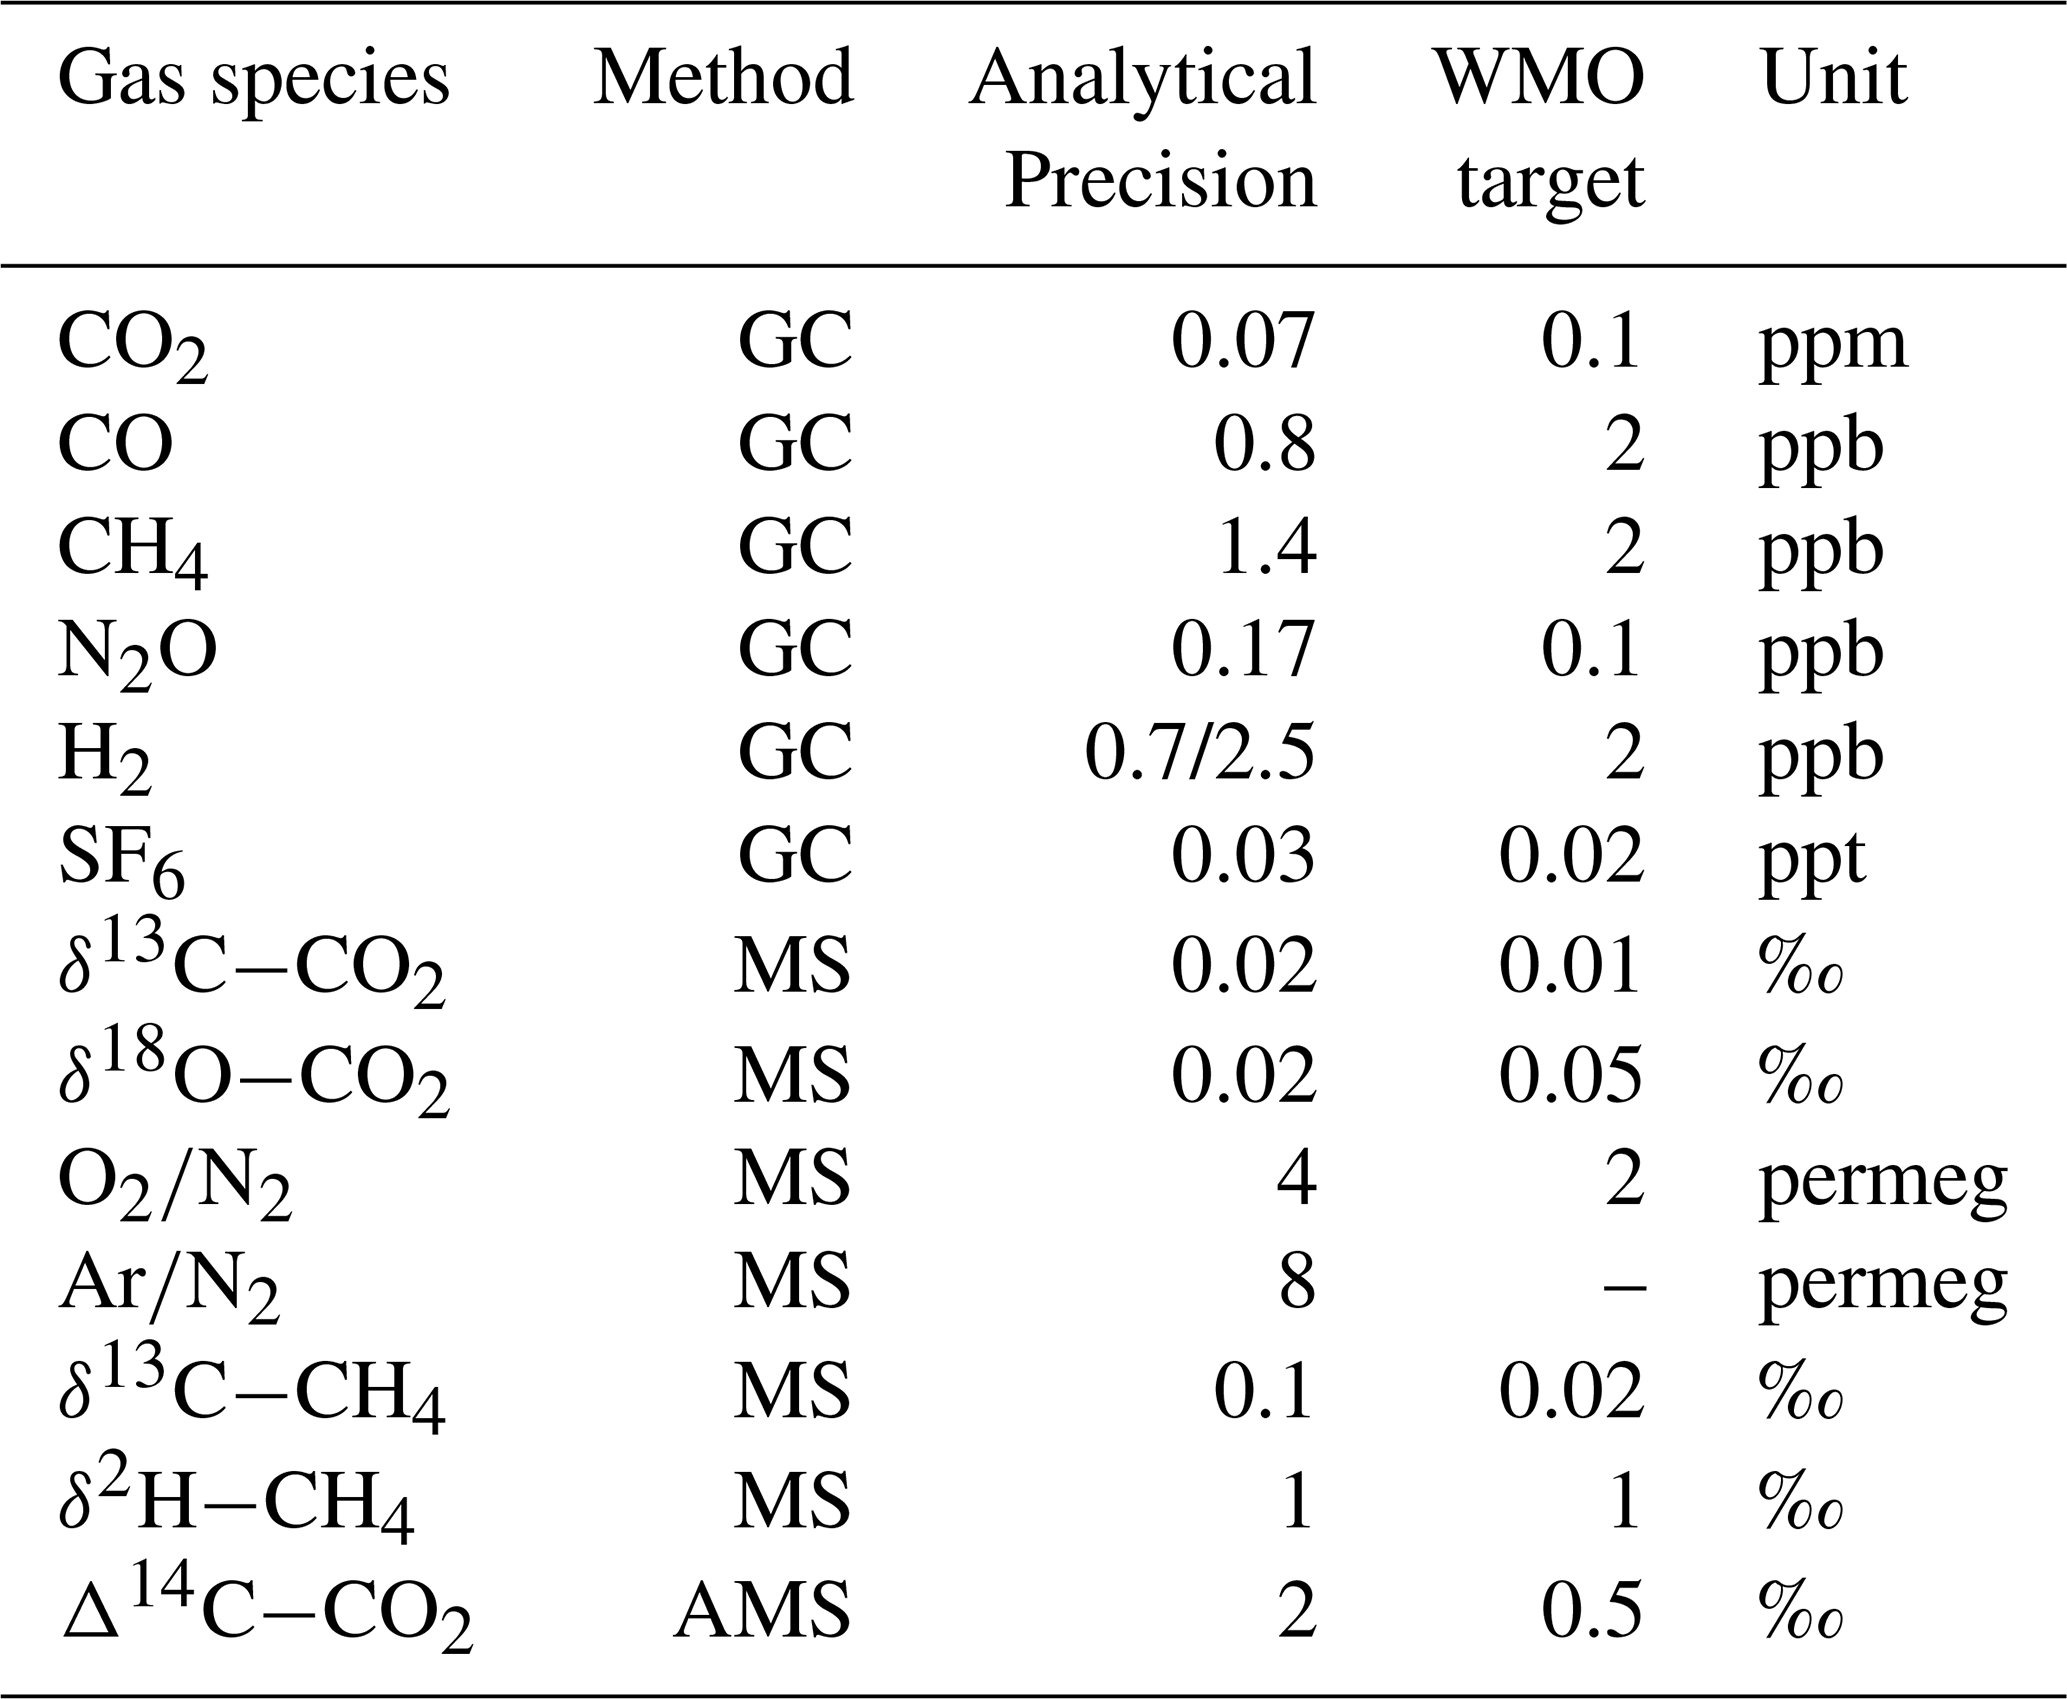
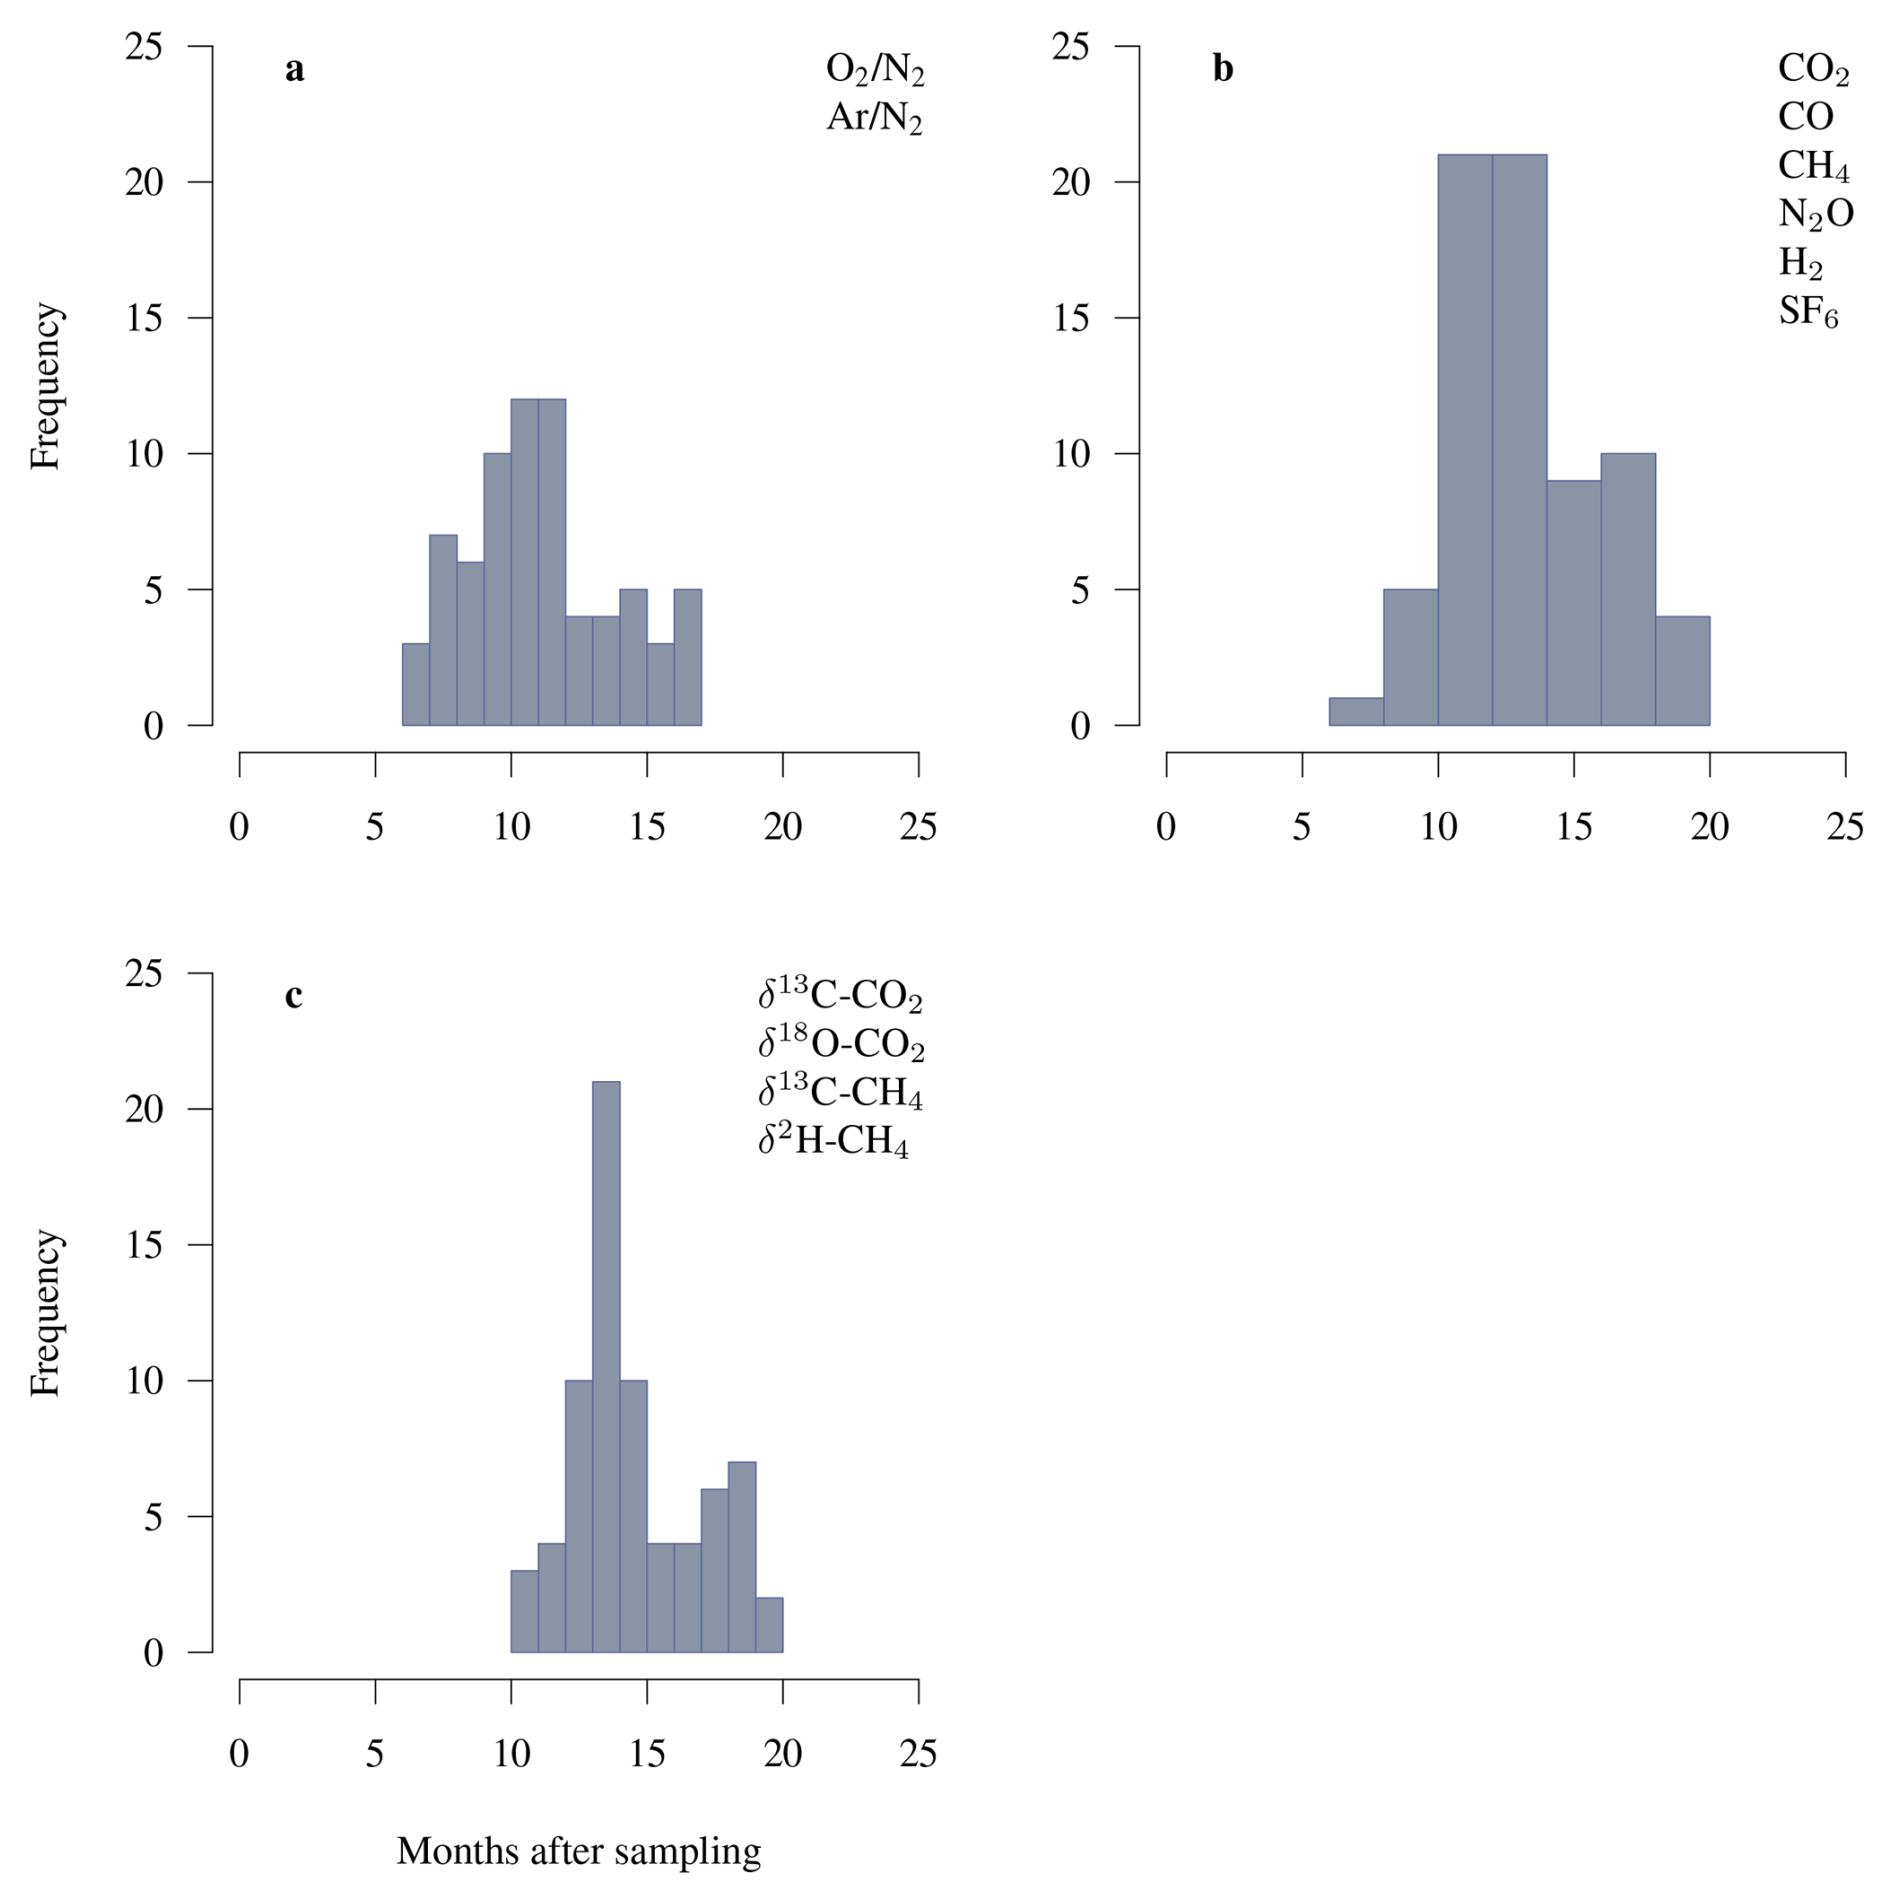
Figure 3Frequency distributions of storage times of flasks in months since sampling until laboratory analysis for (a) and ratios, (b) GC measurements of trace gases, (c) IRMS measurements of stable isotopes.
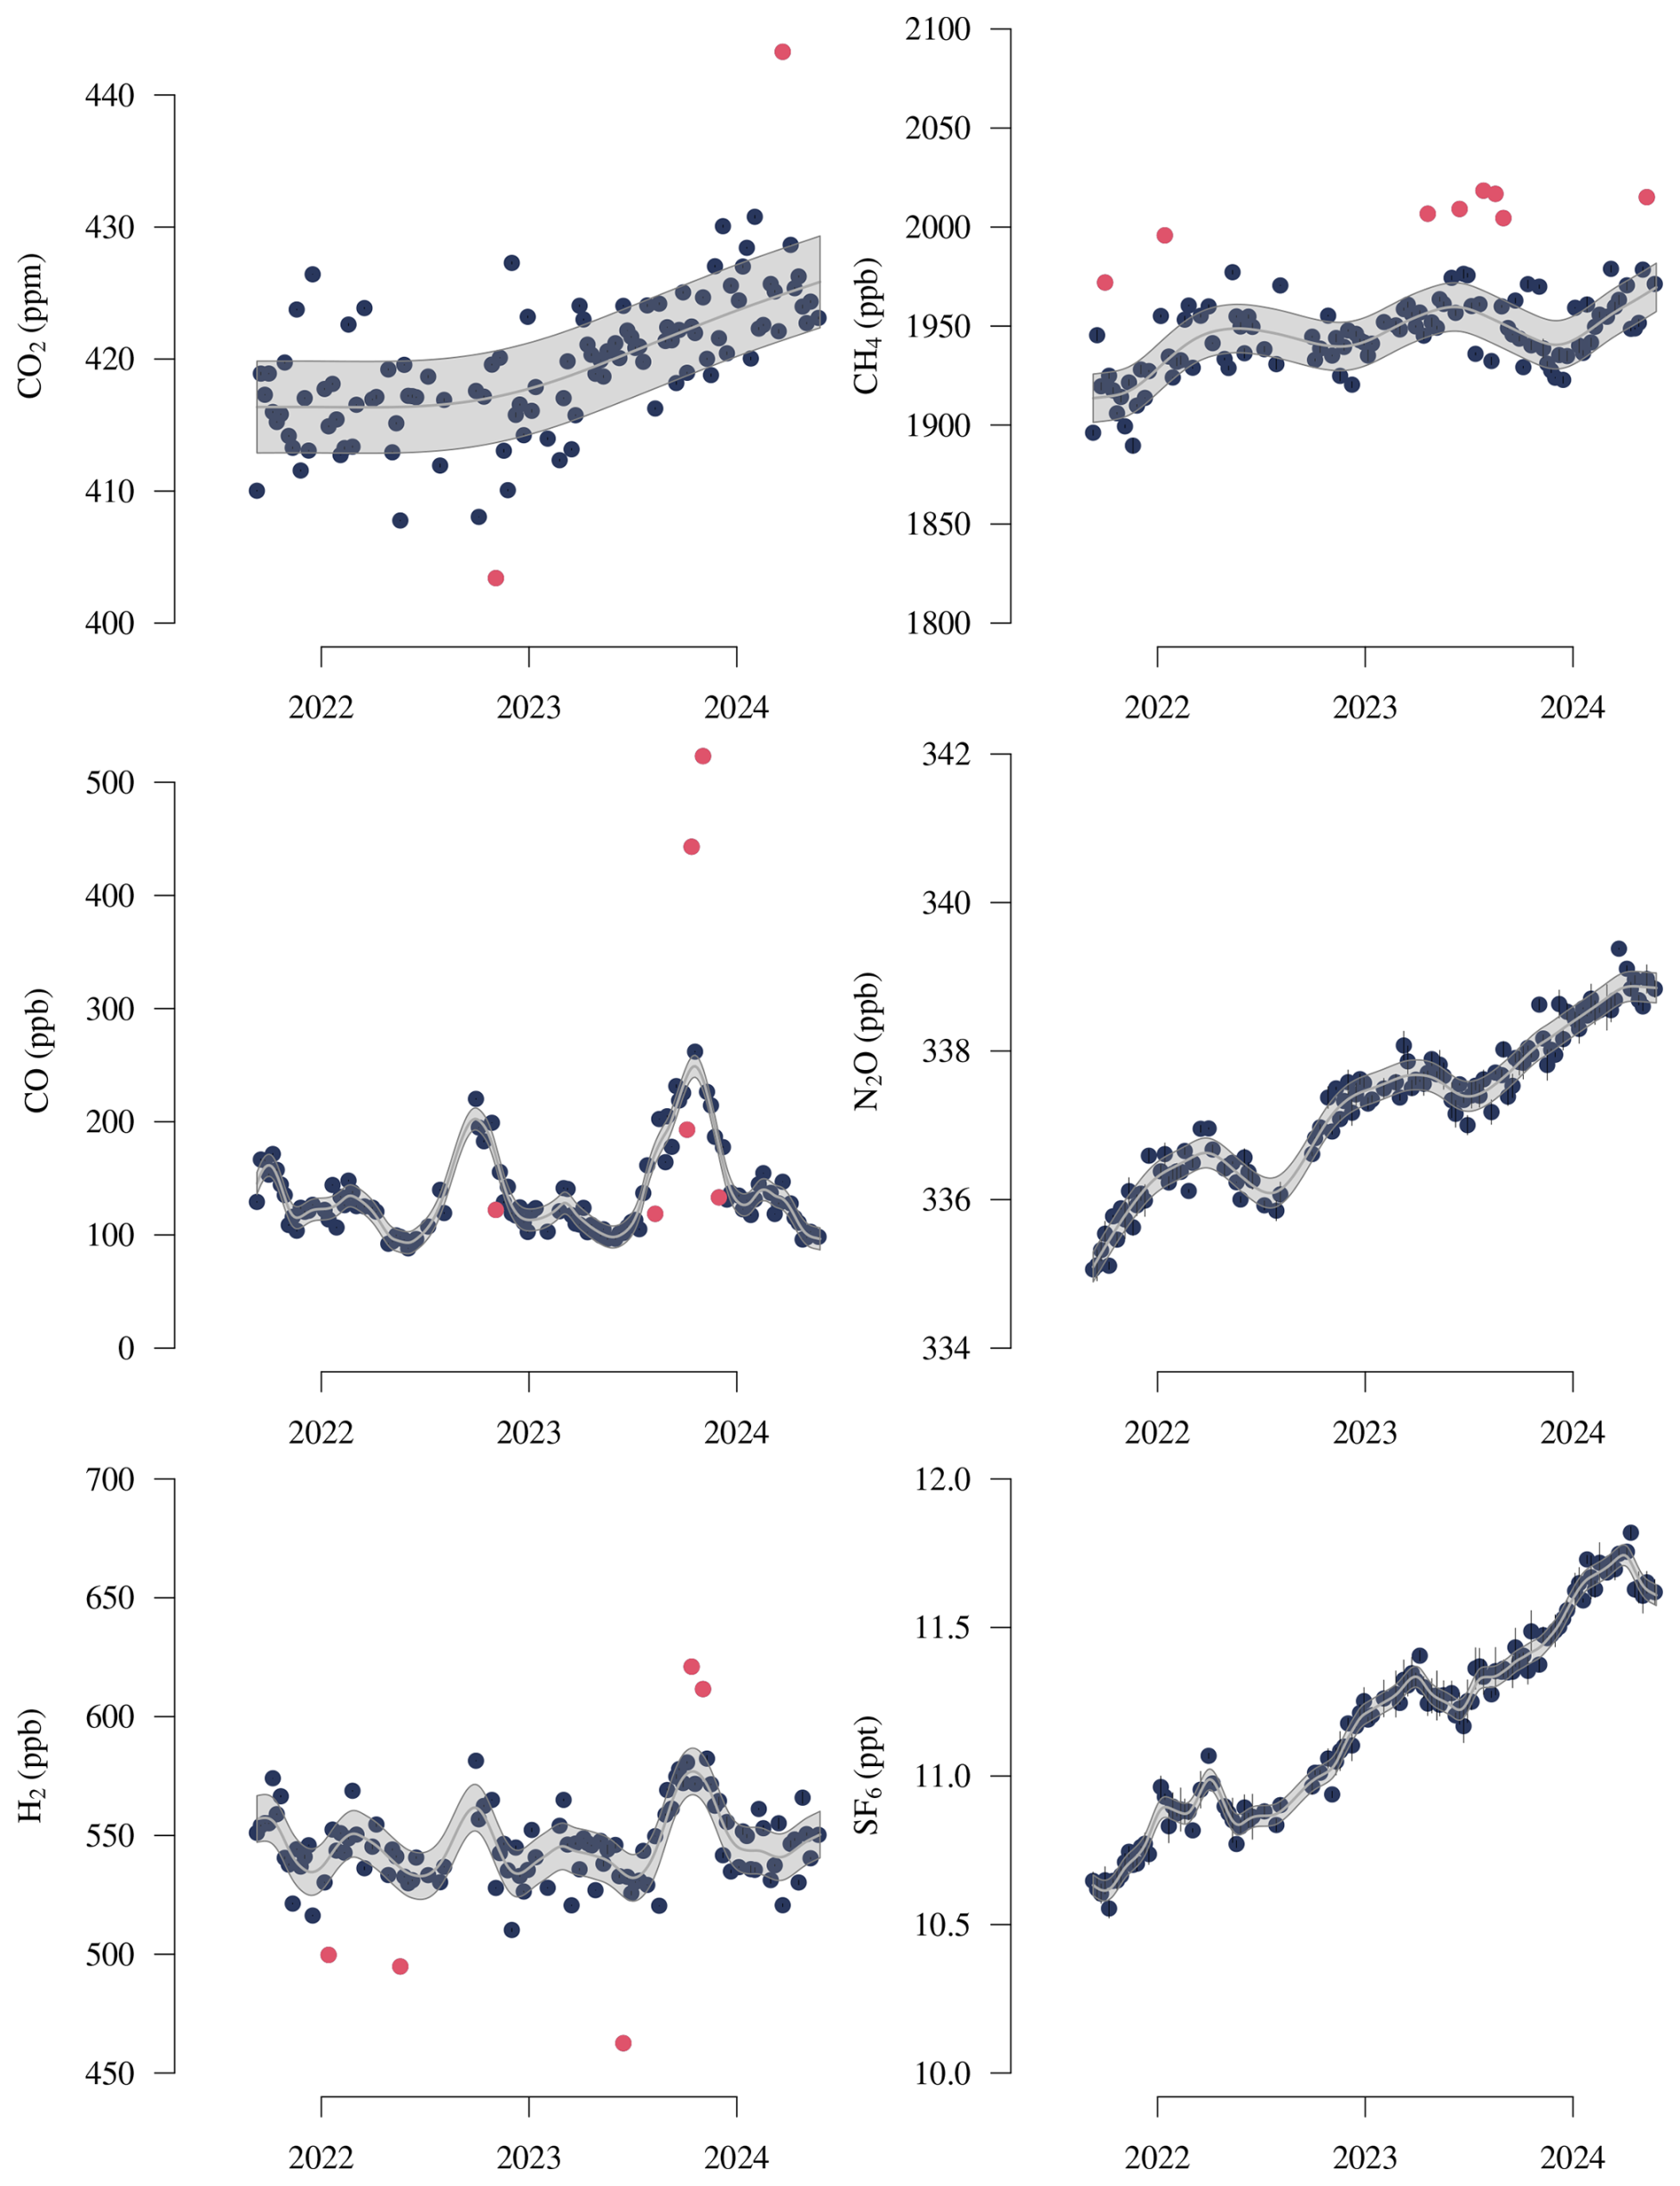
Figure 4Gas species measured by gas chromatography in flask samples from the Amazon Tall Tower Observatory. The line at the center of the gray area represents the smoothing cubic-splines fitted to all data points of individual species through an iterative process that removes outliers (red points) until all observations left are inside the range of three times the root mean squared deviation. The uncertainty range represented by the gray area represents the smoothing spline ± the root mean squared deviation of the fitting. Vertical error bars, when visible, represent measurement uncertainty.
2.3.3 Data processing and release
Data on mole fractions and stable isotope ratios are ingested into the data-processing system of the atmospheric flask sampling program of the MPI-BGC. This monitoring program includes 12 additional stations, in which the same gas species are measured and reported. All data from this program goes through a quality assurance and quality control process, in which flasks that do not meet a set of quality assurance criteria (see Heimann et al., 2022) are flagged by the laboratories and removed from the final released dataset. These internal QA/QC flags are not reported in the final released dataset. These internal tests include a test for the deviation of the ratio with respect to a nominal value of 140 permeg, a test for the plausibility of the measurements with respect to predefined ranges for all gas species, and manual flags for sample collection or retrieval problems (Heimann et al., 2022).
We combine all data reported by the three laboratories into one single report. This report includes uncertainty estimates for each measurement obtained from each laboratory's procedure for quantification of uncertainty based on each gas' set of standards and blanks. The final report is released on the ATTO Data Portal (https://www.attodata.org, last access: 1 November 2025), and each data release is assigned a digital object identifier (doi). We aim at producing at least one data release per year, assuming no major delays in the flask cycle.
To identify trends over time in the data and to identify statistical outliers, we fitted a smoothing spline function to each individual gas species (Heimann et al., 2022). Through an iterative process, a cubic smoothing-spline function (smooth.spline in base R, R Core Team, 2024) is fitted first to all data points, and observations are identified as outliers if they lie in an interval beyond three times the root mean square error of the residuals. These observations are removed from the fitting and the spline function is fitted again until there are no outliers left. These outliers are consistent with those reported in the atmospheric flask sampling program of the Max Planck Institute for Biogeochemistry (Heimann et al., 2022), and should not be interpreted as problematic observations, but rather as observations potentially within the natural range of variability but outside the observed variability of the time series.
We use the root mean squared deviation (RMSD) between observations and the smoothing spline as an estimate of the variability of the data, accounting for seasonal variability and trends. The RMSD is obtained as the squared root of the sum of squared residuals between observations and predictions by the spline function.
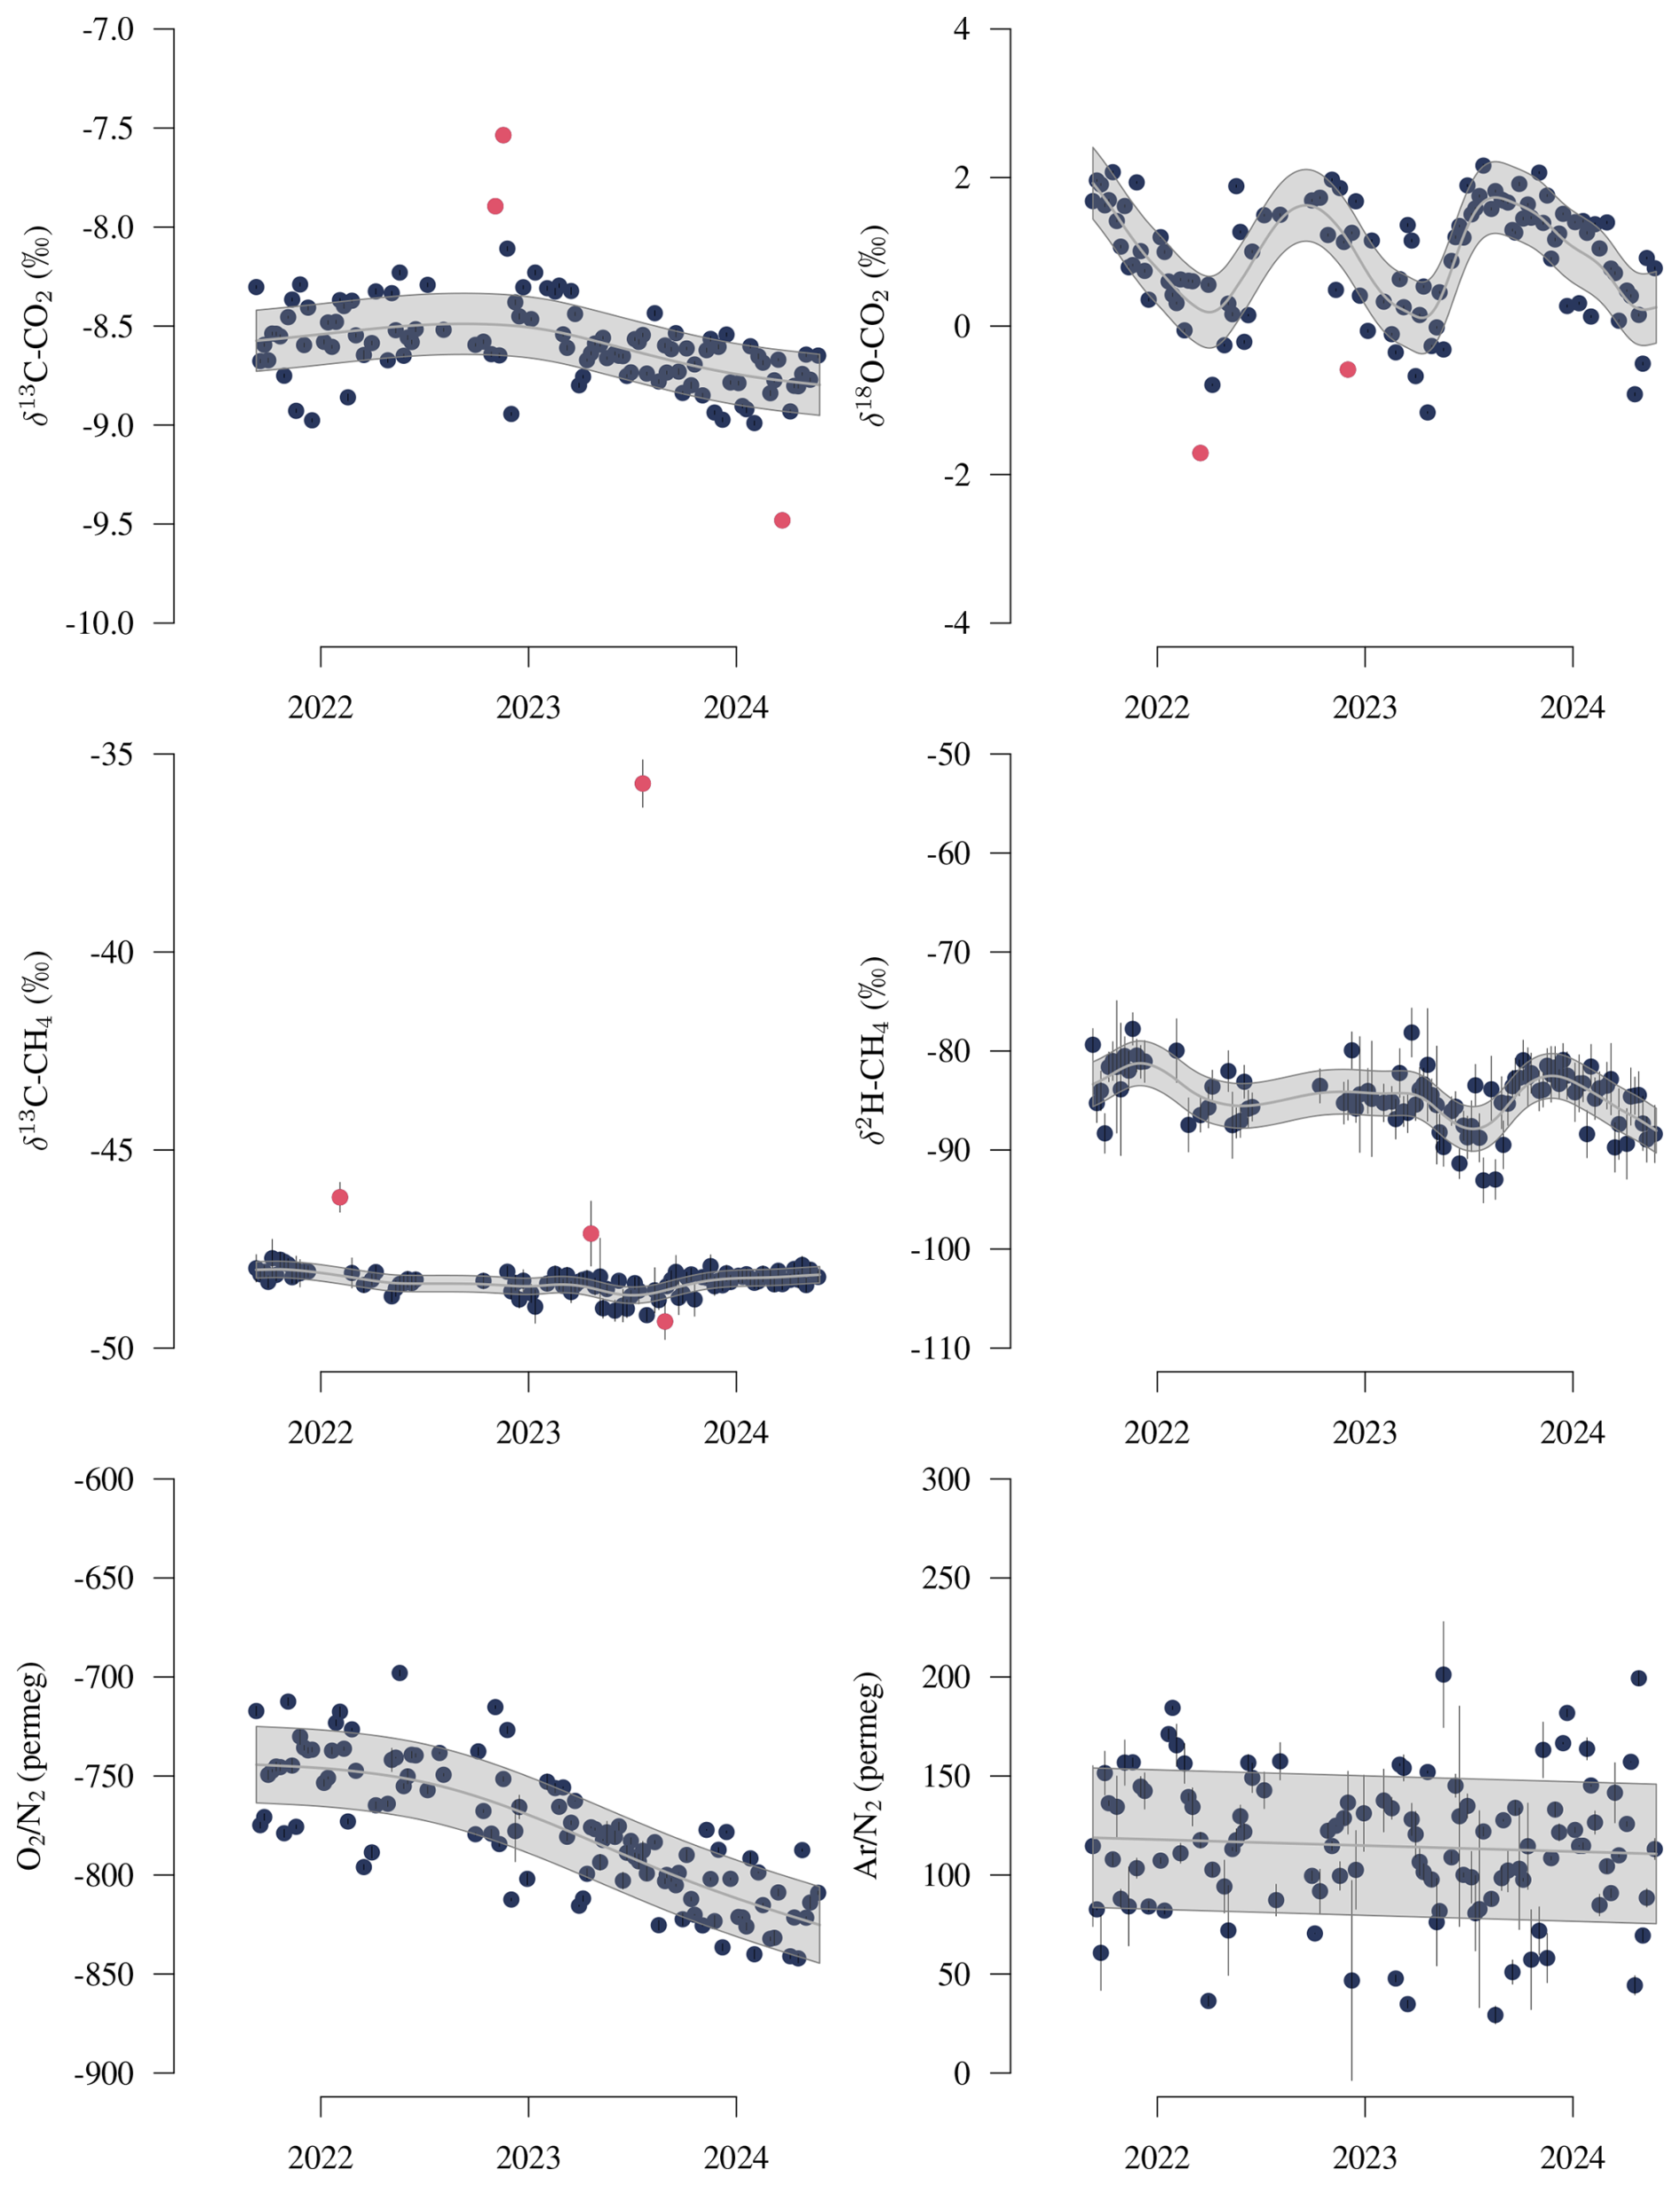
Figure 5Gas species measured by mass spectrometry in flask samples from the Amazon Tall Tower Observatory. The line at the center of the gray area represents the smoothing cubic-splines fitted to all data points of individual species through an iterative process that removes outliers (red points) until all observations left are inside the range of three times the root mean squared deviation. The uncertainty range represented by the gray area represents the smoothing spline ± the root mean squared deviation of the fitting. Vertical error bars, when visible, represent measurement uncertainty.
This article reports the release of version 2025.3 of the dataset (Sierra et al., 2025), which contains data between the sampling dates of 9 September 2021 and 23 May 2024. This data release contains a total of 141 flasks that have gone through the complete cycle of sample collection, analysis and data reporting. In this article, we report only observations taken at mid-day, but all observations, including those taken at night, are also provided in the released dataset.
Due to the remoteness of the field site, and the complexity of the logistics for sample transport between Brazil and Germany, the samples remain stored in the flasks for a minimum of three months and up to 20 months before analyses (Fig. 3). On average, the storage time until first measurements of and ratios is 333 d. For measurements of mole fractions by GC, the average storage time is 394 d; and for stable isotope measurements by IRMS the average storage time is 436 d. The last measurements of 14C−CO2 by AMS take even longer, with average storage times of about 500 d.
3.1 Gas chromatography measurements
Initial results obtained from measurements by GC in the flasks samples are shown in Fig. 4. The time series for CO2 mole fraction showed no clear seasonal cycle and a slight upward trend. Two observations from this series were identified as outliers by the statistical test as being 3 times beyond the root mean squared deviation (RMSD of 3.47 ppm) of the observations with respect to the smoothing spline.
The time series for CH4, N2O, and SF6 mole fractions also showed an upward trend and some degree of seasonality, with lower mole fractions during the dry season and higher values in the rainy season. The RMSD for CH4 was 12.21 ppb, with eight outliers above 3 times the RMSD. For N2O and SF6, the variability around the smoothing spline was much smaller, 0.20 and 0.03 ppt, respectively, and no outliers detected (Fig. 4).
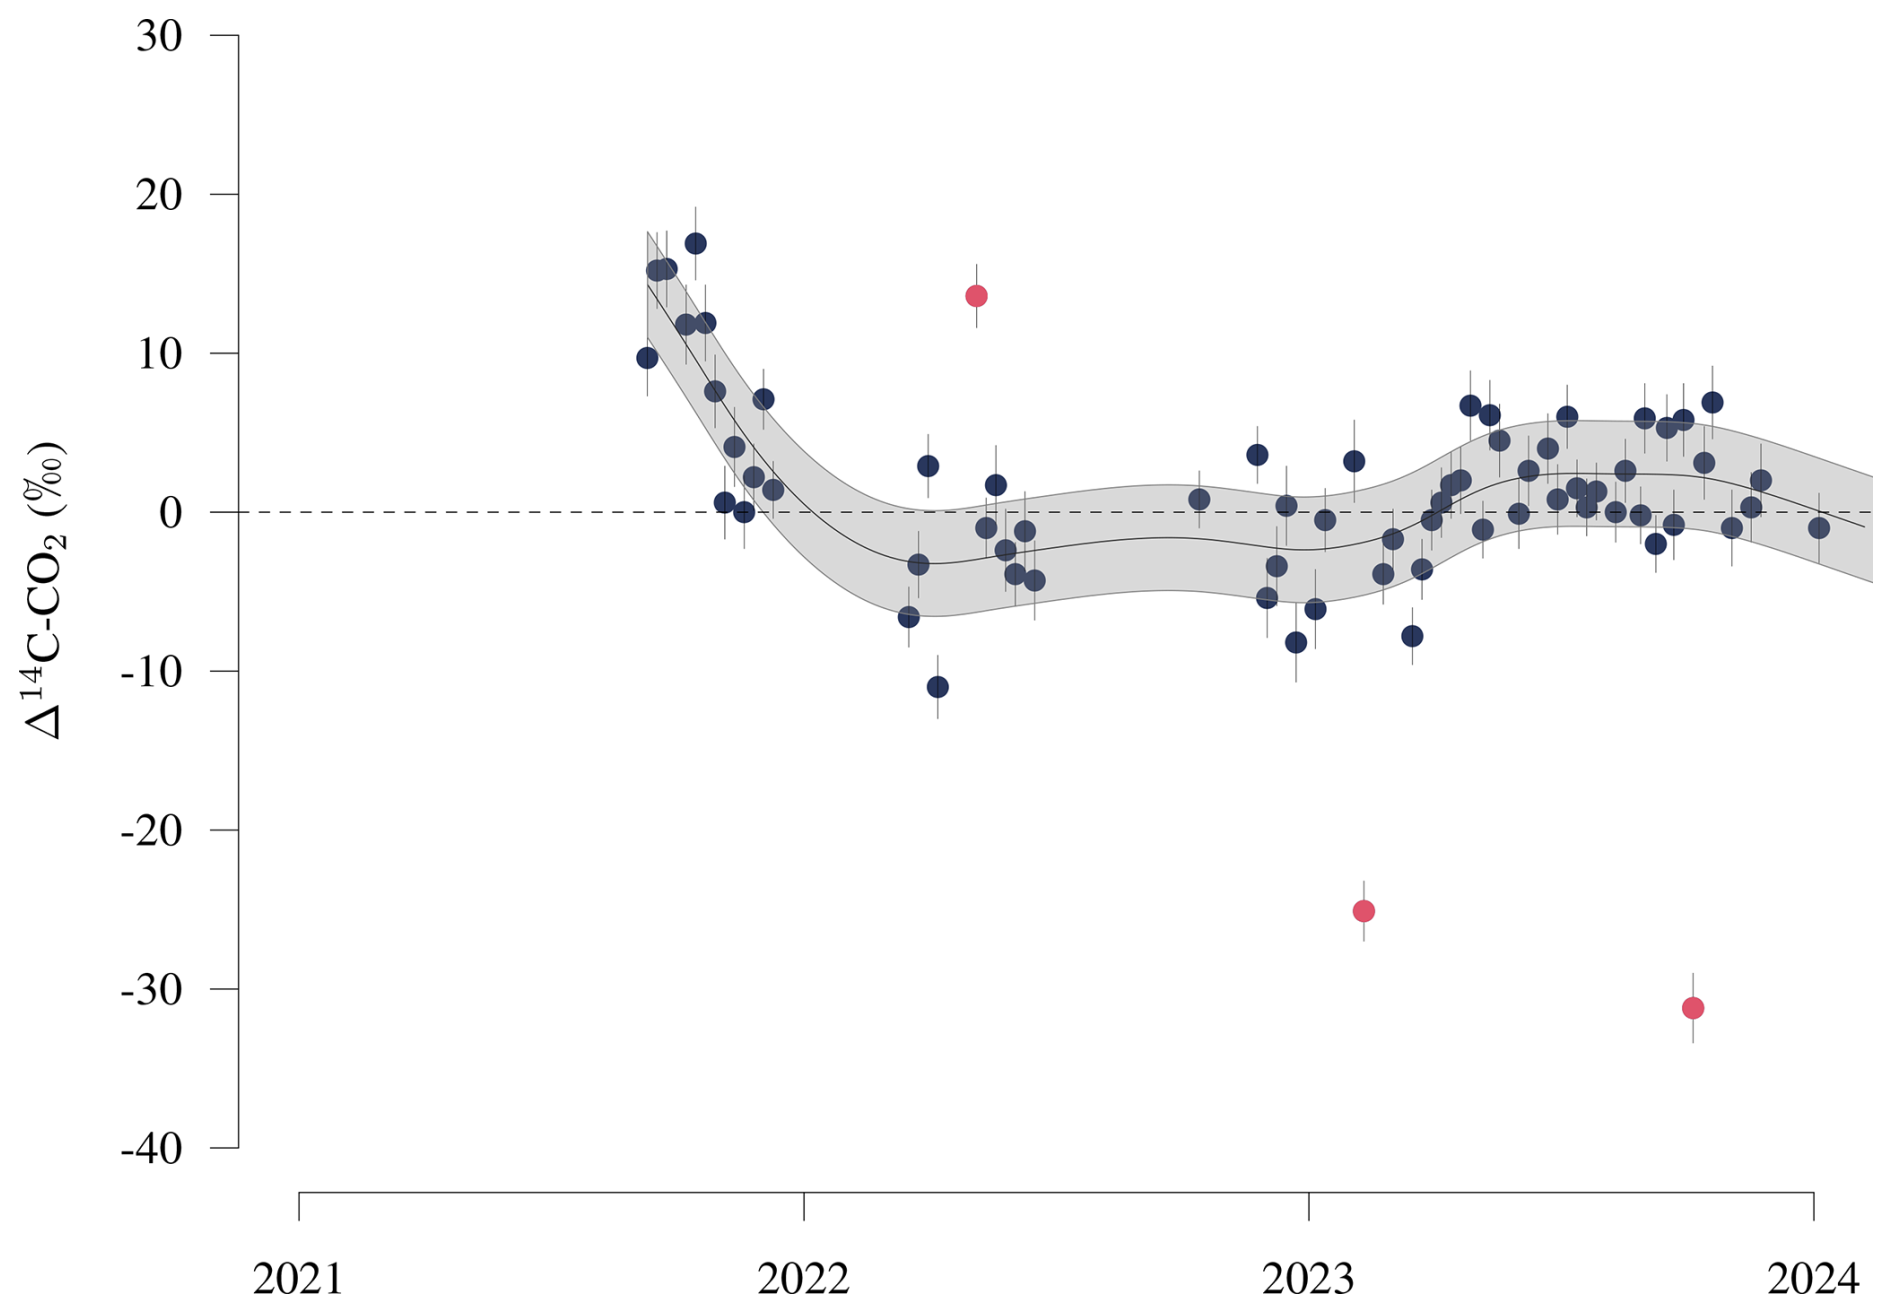
Figure 6Radiocarbon in atmospheric carbon dioxide (Δ14C−CO2) measured in flasks at a height of 324 at the Amazon Tall Tower Observatory. The line at the center of the gray area represents the smoothing cubic-splines fitted to all data points of individual species through an iterative process that removes outliers (red points) until all observations left are inside the range of three times the root mean squared deviation. The uncertainty range represented by the gray area represents the smoothing spline ± the root mean squared deviation of the fitting. Vertical error bars, when visible, represent measurement uncertainty.
For CO, strong peaks were observed in the dry season of the year 2023, likely related to local fires that are common during the dry and hot season (Andreae et al., 2012). The statistical test detected outliers both above and below the smoothing spline for CO, with a RMSD with respect to the smoothing spline as 9.72 ppb.
Observations of H2 showed relatively high variability in comparison to other gases, with a smoothing spline curve with double peaks within one year and five anomalous observations (Fig. 4). The RMSD for H2 with respect to the smoothing spline was 9.80 ppb.
3.2 Mass spectrometry measurements
Values of δ13C−CO2 showed a small declining trend over time since 2023 with no clear seasonal cycle (Fig. 5). Two observations with enriched 13C and one observation with depleted values were identified as outliers by the statistical test, and the RMSD with respect to the smoothing spline was 0.15 ‰. The values of δ18O−CO2 showed a marked level of seasonality, but no clear upward or downward trend. Enriched values of δ18O were observed at the end of the dry season, and depleted values in the rainy season. Two observations of δ18O−CO2 were identified as outliers and the RMSD was 0.48 ‰.
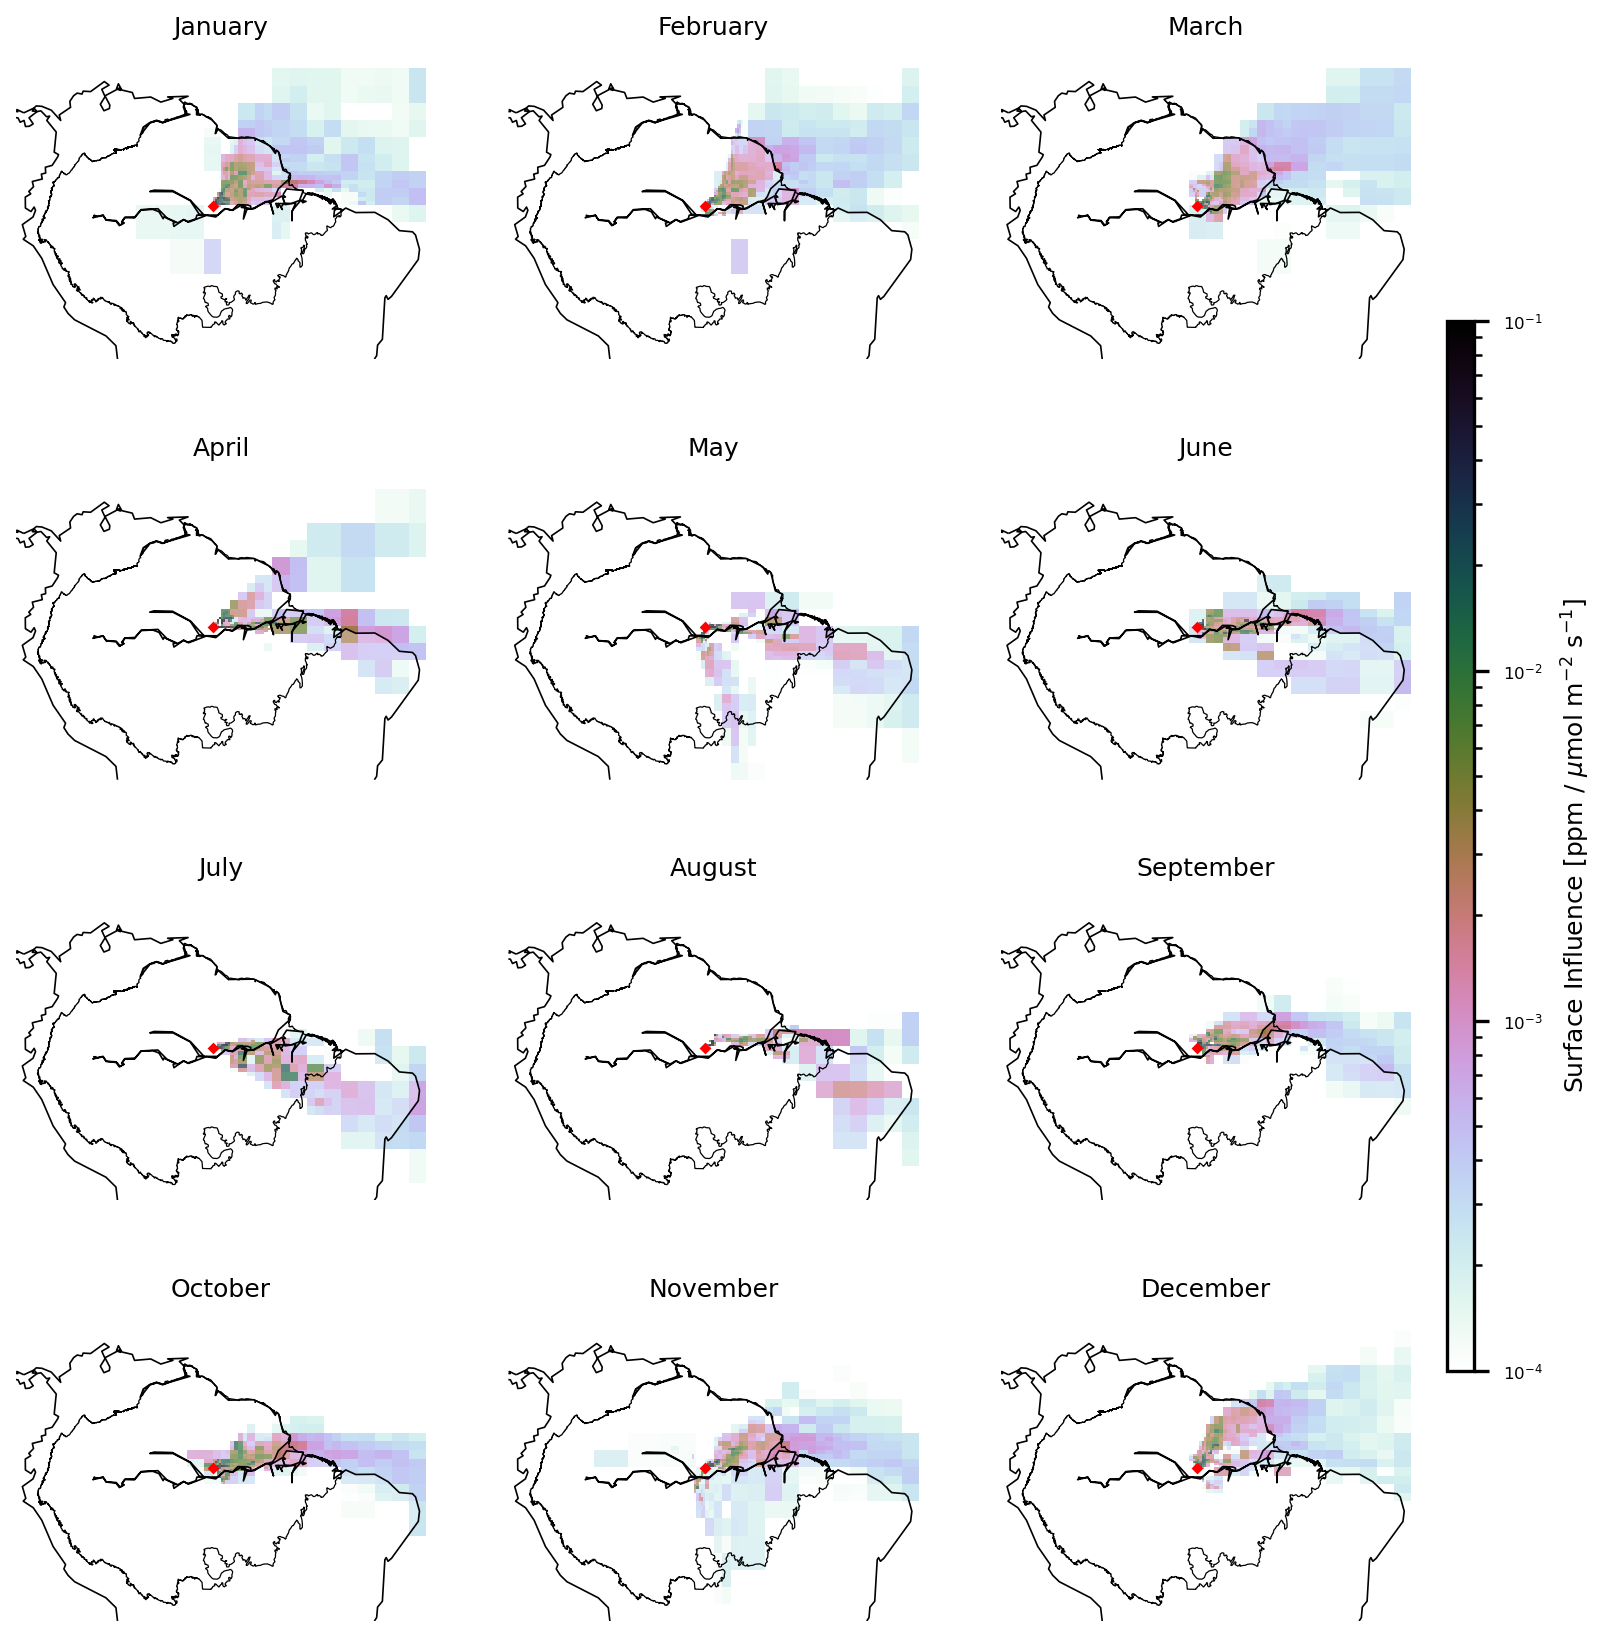
Figure 7Mean surface influence for each month and then averaged over years (September 2021 to February 2023). The surface influence was generated using the STILT model at the location of the Tall Tower at the ATTO site (−2.14, −58.99). The black contour indicates the biogeographic Amazon limits.
The stable isotopes of methane showed no clear trend over time and no strong seasonal cycles (Fig. 5). Four anomalous observations were identified for δ13C−CH4 while no outlier was identified for δ2H−CH4. The RMSD for δ13C−CH4 was 0.21 ‰, and for δ2H−CH4 2.26 ‰. Similarly for the ratios, which showed no clear trend over time and a weak seasonal cycle masked by relatively large variability around the smoothing spline (RMSD 35.22 permeg).
The values of showed a more consistent declining trend, accentuated in the year 2023 (Fig. 5). No observations were identified as outlier and the RMSD was 19.30 permeg.
3.3 Accelerator mass spectrometry
Values of Δ14C−CO2 also showed a significant level of variability with no clear seasonality or decreasing trend (Fig. 6). The values of Δ14C−CO2 were relatively high in the dry season of 2021 and varied at a value close to 0 ‰ after 2022. Two observations in 2023 showed a significant depletion in radiocarbon with respect to the entire series. Although global atmospheric radiocarbon reached a value close to 0 ‰ around the years 2020–2021 (Graven et al., 2022), more or less consistent with our observations, the dilution of Δ14C−CO2 by the combustion of fossil fuels is expected to consistently dilute these values over time (Graven, 2015). We do not see this continuous dilution effect in our data, but rather a convergence of Δ14C−CO2 to a stationary value close to 0 ‰.
3.4 Surface influence footprints
As reference for the interpretation of the data, we provide here mean surface influence trajectories obtained from the Stochastic Time-Inverted Lagrangian Transport model STILT (Lin et al., 2003) with a similar setup as in Botía et al. (2022), but here for an arrival altitude of 324 Trajectories backward in time, computed as monthly averages between September 2021 to February 2023, show that the footprint of the gases arriving at the ATTO tower are mostly from easterly directions (Fig. 7). During the dry-season months, from June to October, the footprint is mostly from the easterly to southeasterly directions. In the rainy season months, from November to March, the footprint is mostly from easterly to northeasterly directions.
These footprints are consistent with previous analyses presented by Pöhlker et al. (2019) and Botía et al. (2022), as well as the measurements of SF6 (Fig. 4) that show a decrease in mole fraction during the dry season and an increase in the rainy season. Because SF6 is mostly produced in the northern hemisphere, larger values indicate contributions from northern hemisphere air and lower values a larger contribution from southern hemisphere air. This implies that the flask measurements at ATTO have a stronger northern hemisphere influence during the rainy season, and that the dry season is more strongly affected by airmasses coming from the southern hemisphere, in agreement with the analysis of Andreae et al. (2012).
The new flask monitoring program established at the Amazon Tall Tower Observatory provides a comprehensive assessment of trace gases, stable isotopes, and radiocarbon in atmospheric CO2. This system is unique in South America and in the Amazon forest region, and it provides important information to support other studies that require information on background conditions for a number of gas species at the local level. Previous gas monitoring systems based on aircraft measurements have provided invaluable measurements of main GHGs such as CO2, CH4 and CO (Gatti et al., 2014, 2021). The new monitoring system at ATTO expands the number of gas species and isotopes being measured in this region considerably, and offers an opportunity for integrated assessments using both monitoring systems. Furthermore, together with other continuous in-situ measurements at ATTO (e.g. Botía et al., 2022) also provide new opportunities for comprehensive assessments of land–atmosphere interactions both at the site and at the regional levels.
Given the complexity of logistics for the transport and analysis of samples, the storage time of samples is currently higher than one year for many samples. This may potentially have some influence on the quality of the measurements (Sturm et al., 2004), particularly for CO, but effects of storage time are minimized in our case by the use of PCTFE sealing in flasks (Rothe et al., 2005). The large emission pulses of CO that have been observed during the dry seasons (Fig. 4), may diminish the negative effects of storage time on this gas given the large fluctuation signals observed relative to potential biases. The large majority of the measurements we have obtained until now pass all quality tests established by the MPI-BGC flask monitoring program. As our monitoring program at ATTO advances over time, we anticipate that logistical challenges will diminish, leading to shorter sample storage times. This applies in particular to the processing of import/export permits for samples, which in some cases have taken considerable time. This aspect has recently improved, and with a more routine procedure for obtaining transport permits, we expect the average storage time to decrease by approximately three months in the future.
For some gas species such as CO2, CH4, and their stable isotopes, we did not observe a strong seasonal cycle. Although we did observe an increasing trend for the mole fraction of these gases, the variability observed was relatively large, particularly for CO2. As opposed to other monitoring sites in relatively clean atmospheres such as Mauna Loa, South Pole, or Alert (Keeling and Graven, 2021; Heimann et al., 2022), the footprint at ATTO is strongly influenced by large biogenic sources from the Amazon forest on the east side of the tower (Fig. 7) (Pöhlker et al., 2019; Holanda et al., 2020; Botía et al., 2022). As opposed to high latitude regions, where seasonal growth of vegetation is very marked, the evergreen tropical forest vegetation has a much weaker seasonal growth cycle, only modulated by seasonal cycles in precipitation and fire activity. We observed a strong seasonal cycle in CO related to fire occurrences in the dry season. We also observed small seasonal cycle in N2O, with lower values in the dry season and higher values in the rainy season.
The observed seasonal cycle of SF6 is synchronous with the occurrence of the dry and rainy seasons. As SF6 has no biogenic sink or source, and it is mostly emitted by anthropogenic activities in the northern hemisphere, its seasonal cycle provides good support to the idea that dry and rainy seasons in the study region are mostly a consequence of large scale atmospheric dynamics, particularly the movement of the inter-tropical convergence zone (ITCZ) (Pöhlker et al., 2019; Andreae et al., 2012).
Radiocarbon in atmospheric CO2 does not show a clear trend or seasonal cycle. Although we did not expect to observe a strong seasonal cycle during the dry and rainy season because plant and microbial respiration are active most of the year, we did expect a more clear decrease of Δ14C−CO2 over time. Fossil fuel emissions are decreasing Δ14C−CO2 globally, and we expected a similar trend here. However, it seems that the combined effect of ecosystem respiration and fire emissions, which are enriched in radiocarbon (Chanca et al., 2025), is counteracting the fossil-fuel dilution trend.
The time series presented in this article are still relatively short, and it is difficult at this point to reach strong conclusions on trends, sources, and sinks of the gas species measured. However, this is an ongoing monitoring program and the time series will grow over time. All data produced in this monitoring program is being released openly after appropriate data curation and processing.
The data set described in this article is available in the ATTO data portal, https://doi.org/10.17871/ATTO.574.13.2365 (Sierra et al., 2025).
Code to reproduce data figures presented in this article is available at https://doi.org/10.5281/zenodo.17084742 (Sierra, 2025).
A new long-term monitoring program of greenhouse gases and isotopes has been established at the Amazon Tall Tower Observatory with a footprint that covers a significant part of the central and eastern part of the Amazon River basin. This program currently produces data on the mole fractions of major greenhouse gases (CO2, CH4, N2O, CO, SF6), stable isotopes of CO2 and CH4, radiocarbon in CO2, and other gases of interest, such as H2, as well as and ratios. The program started in September 2021, and until now data from 141 flasks have been released under an open access license.
The current set of measurements shows an increasing trend for many gas species such as CO2, CH4, N2O, and SF6. In general, there are no marked seasonal cycles for most gas species, as it is frequently observed at northern hemisphere stations. However, some observed seasonality is related to dry and rainy seasons. The seasonal dynamics of fire and the movement of the ITCZ also play an important role in the observed variability for many gas species.
We expect that the data produced by this program would be of interest for many other studies that rely on precise background data, particularly for isotopic studies. The ATTO project is committed to continue these measurements over time and make them openly available to the research community and the general public.
CRediT Taxonomy of author contributions as follows. Conceptualization: CAS, MOA, ACdA, LAC, ME, LVG, SH, MH, AJ, JVL, IL, CAQ, ST, SZ; Data curation: CAS, IC, HvA, SB, CQDJ, ME, LVG, MG, SH, AJ, IL, JM, HM, MR, CR, AS; Formal analysis: CAS, IC, HvA, SB; Funding acquisition: CAS, MA, ACdA, LAC, LVG, MH, JVL, IL, KM, CAQ, BT, ST; Investigation: CAS, IC, LB, SB, CSCC, ME, AF, LVG, SH, AJ, SK, RK, YS; Methodology: CAS, IC, LB, SB, CSCC, ME, AF, LVG, SH, MH, AJ, SK, RK, JVL, IL, HM, MR, CR, YS, AS; Project administration: VH, JVL, CAQ, BT, ST; Software: CAS, ME, MG, MH, JM, CR; Resources: ME, LVG, MH, AJ, RK, IL, KM, HM, CAQ, MR, AS, BT, ST, SZ; Supervision: CAS, LVG, MH, AJ, IL, KM, HM, CAQ, AS, BT, ST, SZ; Validation: IC, HvA, LB, SB, CSCC, CQDJ, AF, LVG, SH, AJ, SK, IL, HM, MR, CR, AS; Visualization: CAS, HvA, ME, CR; Writing – original draft: CAS; Writing – review and editing: CAS, IC, MA, HvA, SB, CSCC, CQDJ, HM, AS, SZ.
The contact author has declared that none of the authors has any competing interests.
Publisher's note: Copernicus Publications remains neutral with regard to jurisdictional claims made in the text, published maps, institutional affiliations, or any other geographical representation in this paper. While Copernicus Publications makes every effort to include appropriate place names, the final responsibility lies with the authors. Views expressed in the text are those of the authors and do not necessarily reflect the views of the publisher.
The Amazon Tall Tower Observatory (ATTO) is a research infrastructure funded by the governments of Brazil and Germany. Funding for the collection and processing of the data presented in this article was mostly provided by the German Federal Ministry of Education and Research (grant nos. 01 LK 1602 C and 01 LK 2101 A) and the Max Planck Society. We would like to thank and acknowledge the contributions of Willi A. Brand, who was instrumental in setting up the isotope and measurement systems. We also thank C. König and R. de Souza for valuable logistic support. Special thanks go to the personnel that maintains operations at the ATTO research station, which includes: A. H. Melo Nascimento, A. Rodrigues Pereira, N. A. de Castro Souza, S. Bulthuis, and V. Ferreira de Lima.
This research has been supported by the Bundesministerium für Bildung und Forschung (grant nos. 01 LK 1602 C and 01 LK 2101 A).
The article processing charges for this open-access publication were covered by the Max Planck Society.
This paper was edited by Tobias Gerken and reviewed by two anonymous referees.
Alden, C. B., Miller, J. B., Gatti, L. V., Gloor, M. M., Guan, K., Michalak, A. M., van der Laan-Luijkx, I. T., Touma, D., Andrews, A., Basso, L. S., Correia, C. S. C., Domingues, L. G., Joiner, J., Krol, M. C., Lyapustin, A. I., Peters, W., Shiga, Y. P., Thoning, K., van der Velde, I. R., van Leeuwen, T. T., Yadav, V., and Diffenbaugh, N. S.: Regional atmospheric CO2 inversion reveals seasonal and geographic differences in Amazon net biome exchange, Global Change Biology, 22, 3427–3443, https://doi.org/10.1111/gcb.13305, 2016. a
Andreae, M. O., Browell, E. V., Garstang, M., Gregory, G. L., Harriss, R. C., Hill, G. F., Jacob, D. J., Pereira, M. C., Sachse, G. W., Setzer, A. W., Dias, P. L. S., Talbot, R. W., Torres, A. L., and Wofsy, S. C.: Biomass-burning emissions and associated haze layers over Amazonia, Journal of Geophysical Research: Atmospheres, 93, 1509–1527, https://doi.org/10.1029/JD093iD02p01509, 1988. a
Andreae, M. O., Artaxo, P., Beck, V., Bela, M., Freitas, S., Gerbig, C., Longo, K., Munger, J. W., Wiedemann, K. T., and Wofsy, S. C.: Carbon monoxide and related trace gases and aerosols over the Amazon Basin during the wet and dry seasons, Atmos. Chem. Phys., 12, 6041–6065, https://doi.org/10.5194/acp-12-6041-2012, 2012. a, b, c, d
Andreae, M. O., Acevedo, O. C., Araùjo, A., Artaxo, P., Barbosa, C. G. G., Barbosa, H. M. J., Brito, J., Carbone, S., Chi, X., Cintra, B. B. L., da Silva, N. F., Dias, N. L., Dias-Júnior, C. Q., Ditas, F., Ditz, R., Godoi, A. F. L., Godoi, R. H. M., Heimann, M., Hoffmann, T., Kesselmeier, J., Könemann, T., Krüger, M. L., Lavric, J. V., Manzi, A. O., Lopes, A. P., Martins, D. L., Mikhailov, E. F., Moran-Zuloaga, D., Nelson, B. W., Nölscher, A. C., Santos Nogueira, D., Piedade, M. T. F., Pöhlker, C., Pöschl, U., Quesada, C. A., Rizzo, L. V., Ro, C.-U., Ruckteschler, N., Sá, L. D. A., de Oliveira Sá, M., Sales, C. B., dos Santos, R. M. N., Saturno, J., Schöngart, J., Sörgel, M., de Souza, C. M., de Souza, R. A. F., Su, H., Targhetta, N., Tóta, J., Trebs, I., Trumbore, S., van Eijck, A., Walter, D., Wang, Z., Weber, B., Williams, J., Winderlich, J., Wittmann, F., Wolff, S., and Yáñez-Serrano, A. M.: The Amazon Tall Tower Observatory (ATTO): overview of pilot measurements on ecosystem ecology, meteorology, trace gases, and aerosols, Atmos. Chem. Phys., 15, 10723–10776, https://doi.org/10.5194/acp-15-10723-2015, 2015. a, b
Artaxo, P., Hansson, H.-C., Andreae, M. O., Bäck, J., Alves, E. G., Barbosa, H. M. J., Bender, F., Bourtsoukidis, E., Carbone, S., Chi, J., Decesari, S., Després, V. R., Ditas, F., Ezhova, E., Fuzzi, S., Hasselquist, N. J., Heintzenberg, J., Holanda, B. A., Guenther, A., Hakola, H., Heikkinen, L., Kerminen, V.-M., Kontkanen, J., Krejci, R., Kulmala, M., Lavric, J. V., de Leeuw, G., Lehtipalo, K., Machado, L. A. T., McFiggans, G., Franco, M. A. M., Meller, B. B., Morais, F. G., Mohr, C., Morgan, W., Nilsson, M. B., Peichl, M., Petäjä, T., Praß, M., Pöhlker, C., Pöhlker, M. L., Pöschl, U., Von Randow, C., Riipinen, I., Rinne, J., Rizzo, L. V., Rosenfeld, D., Silva Dias, M. A. F., Sogacheva, L., Stier, P., Swietlicki, E., Sörgel, M., Tunved, P., Virkkula, A., Wang, J., Weber, B., Yáñez-Serrano, A. M., Zieger, P., Mikhailov, E., Smith, J. N., and Kesselmeier, J.: Tropical and Boreal Forest – Atmosphere Interactions: A Review, Tellus B: Chemical and Physical Meteorology, https://doi.org/10.16993/tellusb.34, 2022. a
Basso, L. S., Marani, L., Gatti, L. V., Miller, J. B., Gloor, M., Melack, J., Cassol, H. L. G., Tejada, G., Domingues, L. G., Arai, E., Sanchez, A. H., Corrêa, S. M., Anderson, L., Aragão, L. E. O. C., Correia, C. S. C., Crispim, S. P., and Neves, R. A. L.: Amazon methane budget derived from multi-year airborne observations highlights regional variations in emissions, Communications Earth & Environment, 2, 246, https://doi.org/10.1038/s43247-021-00314-4, 2021. a
Basso, L. S., Wilson, C., Chipperfield, M. P., Tejada, G., Cassol, H. L. G., Arai, E., Williams, M., Smallman, T. L., Peters, W., Naus, S., Miller, J. B., and Gloor, M.: Atmospheric CO2 inversion reveals the Amazon as a minor carbon source caused by fire emissions, with forest uptake offsetting about half of these emissions, Atmos. Chem. Phys., 23, 9685–9723, https://doi.org/10.5194/acp-23-9685-2023, 2023. a, b
Beck, V., Chen, H., Gerbig, C., Bergamaschi, P., Bruhwiler, L., Houweling, S., Röckmann, T., Kolle, O., Steinbach, J., Koch, T., Sapart, C. J., van der Veen, C., Frankenberg, C., Andreae, M. O., Artaxo, P., Longo, K. M., and Wofsy, S. C.: Methane airborne measurements and comparison to global models during BARCA, Journal of Geophysical Research: Atmospheres, 117, https://doi.org/10.1029/2011JD017345, 2012. a
Beck, V., Gerbig, C., Koch, T., Bela, M. M., Longo, K. M., Freitas, S. R., Kaplan, J. O., Prigent, C., Bergamaschi, P., and Heimann, M.: WRF-Chem simulations in the Amazon region during wet and dry season transitions: evaluation of methane models and wetland inundation maps, Atmos. Chem. Phys., 13, 7961–7982, https://doi.org/10.5194/acp-13-7961-2013, 2013. a
Botía, S., Komiya, S., Marshall, J., Koch, T., Gałkowski, M., Lavric, J., Gomes-Alves, E., Walter, D., Fisch, G., Pinho, D. M., Nelson, B. W., Martins, G., Luijkx, I. T., Koren, G., Florentie, L., Carioca de Araújo, A., Sá, M., Andreae, M. O., Heimann, M., Peters, W., and Gerbig, C.: The CO2 record at the Amazon Tall Tower Observatory: A new opportunity to study processes on seasonal and inter-annual scales, Global Change Biology, 28, 588–611, https://doi.org/10.1111/gcb.15905, 2022. a, b, c, d, e
Botía, S., Munassar, S., Koch, T., Custodio, D., Basso, L. S., Komiya, S., Lavric, J. V., Walter, D., Gloor, M., Martins, G., Naus, S., Koren, G., Luijkx, I. T., Hantson, S., Miller, J. B., Peters, W., Rödenbeck, C., and Gerbig, C.: Combined CO2 measurement record indicates Amazon forest carbon uptake is offset by savanna carbon release, Atmos. Chem. Phys., 25, 6219–6255, https://doi.org/10.5194/acp-25-6219-2025, 2025. a
Brand, W. A.: Storage Aspects and Open Split Mass Spectrometric Determination, in: Proceedings of the 12th IAEA/WMO meeting of CO2 experts, edited by: Worthy, D. and Huang, L., 146–151, https://doi.org/11858/00-001M-0000-000E-D291-6, 2005. a
Brand, W. A., Rothe, M., Sperlich, P., Strube, M., and Wendeberg, M.: Automated simultaneous measurement of the δ13C and δ2H values of methane and the δ13C and δ18O values of carbon dioxide in flask air samples using a new multi cryo-trap/gas chromatography/isotope ratio mass spectrometry system, Rapid Communications in Mass Spectrometry, 30, 1523–1539, https://doi.org/10.1002/rcm.7587, 2016. a, b
Chanca, I., Levin, I., Trumbore, S., Macario, K., Lavric, J., Quesada, C. A., Carioca de Araújo, A., Quaresma Dias Júnior, C., van Asperen, H., Hammer, S., and Sierra, C. A.: How long does carbon stay in a near-pristine central Amazon forest? An empirical estimate with radiocarbon, Biogeosciences, 22, 455–472, https://doi.org/10.5194/bg-22-455-2025, 2025. a
Gatti, L. V., Gloor, M., Miller, J. B., Doughty, C. E., Malhi, Y., Domingues, L. G., Basso, L. S., Martinewski, A., Correia, C. S. C., Borges, V. F., Freitas, S., Braz, R., Anderson, L. O., Rocha, H., Grace, J., Phillips, O. L., and Lloyd, J.: Drought sensitivity of Amazonian carbon balance revealed by atmospheric measurements, Nature, 506, 76–80, https://doi.org/10.1038/nature12957, 2014. a, b
Gatti, L. V., Basso, L. S., Miller, J. B., Gloor, M., Gatti Domingues, L., Cassol, H. L. G., Tejada, G., Aragão, L. E. O. C., Nobre, C., Peters, W., Marani, L., Arai, E., Sanches, A. H., Corrêa, S. M., Anderson, L., Von Randow, C., Correia, C. S. C., Crispim, S. P., and Neves, R. A. L.: Amazonia as a carbon source linked to deforestation and climate change, Nature, 595, 388–393, https://doi.org/10.1038/s41586-021-03629-6, 2021. a, b, c
Ghosh, P., Patecki, M., Rothe, M., and Brand, W. A.: Calcite-CO2 mixed into CO2-free air: a new CO2-in-air stable isotope reference material for the VPDB scale, Rapid Communications in Mass Spectrometry, 19, 1097–1119, https://doi.org/10.1002/rcm.1886, 2005. a
Gonçalves, M. B., Dias-Júnior, C. Q., D'Oliveira, F. A. F., Cely-Toro, I. M., Cohen, J. C. P., Martins, H. S., da Silva, G. H. S., de Araújo, A. C., and Mortarini, L.: Squall lines and turbulent exchange at the Amazon forest-atmosphere interface, Meteorology and Atmospheric Physics, 136, 41, https://doi.org/10.1007/s00703-024-01039-7, 2024. a
Graven, H., Keeling, R. F., and Rogelj, J.: Changes to Carbon Isotopes in Atmospheric CO2 Over the Industrial Era and Into the Future, Global Biogeochemical Cycles, 34, e2019GB006170, https://doi.org/10.1029/2019GB006170, 2020. a
Graven, H. D.: Impact of fossil fuel emissions on atmospheric radiocarbon and various applications of radiocarbon over this century, Proceedings of the National Academy of Sciences, 112, 9542–9545, https://doi.org/10.1073/pnas.1504467112, 2015. a
Graven, H. D., Keeling, R. F., and Xu, X.: Radiocarbon dating: going back in time, Nature, 607, 449, https://doi.org/10.1038/d41586-022-01954-y, 2022. a
Heimann, M., Jordan, A., Brand, W., Lavric, J., Moossen, H., and Rothe, M.: Atmospheric flask sampling program of MPI-BGC, version 13, January 2022, https://doi.org/10.17617/3.8r, 2022. a, b, c, d, e, f, g, h, i
Holanda, B. A., Pöhlker, M. L., Walter, D., Saturno, J., Sörgel, M., Ditas, J., Ditas, F., Schulz, C., Franco, M. A., Wang, Q., Donth, T., Artaxo, P., Barbosa, H. M. J., Borrmann, S., Braga, R., Brito, J., Cheng, Y., Dollner, M., Kaiser, J. W., Klimach, T., Knote, C., Krüger, O. O., Fütterer, D., Lavrič, J. V., Ma, N., Machado, L. A. T., Ming, J., Morais, F. G., Paulsen, H., Sauer, D., Schlager, H., Schneider, J., Su, H., Weinzierl, B., Walser, A., Wendisch, M., Ziereis, H., Zöger, M., Pöschl, U., Andreae, M. O., and Pöhlker, C.: Influx of African biomass burning aerosol during the Amazonian dry season through layered transatlantic transport of black carbon-rich smoke, Atmos. Chem. Phys., 20, 4757–4785, https://doi.org/10.5194/acp-20-4757-2020, 2020. a
Keeling, R. F. and Graven, H. D.: Insights from Time Series of Atmospheric Carbon Dioxide and Related Tracers, Annual Review of Environment and Resources, 46, 85–110, https://doi.org/10.1146/annurev-environ-012220-125406, 2021. a
Levin, I., Karstens, U., Eritt, M., Maier, F., Arnold, S., Rzesanke, D., Hammer, S., Ramonet, M., Vítková, G., Conil, S., Heliasz, M., Kubistin, D., and Lindauer, M.: A dedicated flask sampling strategy developed for Integrated Carbon Observation System (ICOS) stations based on CO2 and CO measurements and Stochastic Time-Inverted Lagrangian Transport (STILT) footprint modelling, Atmos. Chem. Phys., 20, 11161–11180, https://doi.org/10.5194/acp-20-11161-2020, 2020. a, b, c, d
Levin, I., Hammer, S., Kromer, B., Preunkert, S., Weller, R., and Worthy, D. E.: Radiocarbon in global tropospheric carbon dioxide, Radiocarbon, 64, 781–791, https://doi.org/10.1017/RDC.2021.102, 2022. a, b
Lin, J. C., Gerbig, C., Wofsy, S. C., Andrews, A. E., Daube, B. C., Davis, K. J., and Grainger, C. A.: A near-field tool for simulating the upstream influence of atmospheric observations: The Stochastic Time-Inverted Lagrangian Transport (STILT) model, Journal of Geophysical Research: Atmospheres, 108, https://doi.org/10.1029/2002JD003161, 2003. a
Lloyd, J., Kolle, O., Fritsch, H., de Freitas, S. R., Silva Dias, M. A. F., Artaxo, P., Nobre, A. D., de Araújo, A. C., Kruijt, B., Sogacheva, L., Fisch, G., Thielmann, A., Kuhn, U., and Andreae, M. O.: An airborne regional carbon balance for Central Amazonia, Biogeosciences, 4, 759–768, https://doi.org/10.5194/bg-4-759-2007, 2007. a
Molina, L., Broquet, G., Imbach, P., Chevallier, F., Poulter, B., Bonal, D., Burban, B., Ramonet, M., Gatti, L. V., Wofsy, S. C., Munger, J. W., Dlugokencky, E., and Ciais, P.: On the ability of a global atmospheric inversion to constrain variations of CO2 fluxes over Amazonia, Atmos. Chem. Phys., 15, 8423–8438, https://doi.org/10.5194/acp-15-8423-2015, 2015. a
Ometto, J. P. H. B., Flanagan, L. B., Martinelli, L. A., Moreira, M. Z., Higuchi, N., and Ehleringer, J. R.: Carbon isotope discrimination in forest and pasture ecosystems of the Amazon Basin, Brazil, Global Biogeochemical Cycles, 16, 56-1–56-10, https://doi.org/10.1029/2001GB001462, 2002. a
Pöhlker, C., Walter, D., Paulsen, H., Könemann, T., Rodríguez-Caballero, E., Moran-Zuloaga, D., Brito, J., Carbone, S., Degrendele, C., Després, V. R., Ditas, F., Holanda, B. A., Kaiser, J. W., Lammel, G., Lavrič, J. V., Ming, J., Pickersgill, D., Pöhlker, M. L., Praß, M., Löbs, N., Saturno, J., Sörgel, M., Wang, Q., Weber, B., Wolff, S., Artaxo, P., Pöschl, U., and Andreae, M. O.: Land cover and its transformation in the backward trajectory footprint region of the Amazon Tall Tower Observatory, Atmos. Chem. Phys., 19, 8425–8470, https://doi.org/10.5194/acp-19-8425-2019, 2019. a, b, c
R Core Team: R: A Language and Environment for Statistical Computing, R Foundation for Statistical Computing, Vienna, Austria, https://www.R-project.org/ (last access: 3 November 2025), 2024. a
Rothe, M. T., Jordan, A., and Brand, W. A.: Trace gases, δ13C and δ18O of CO2-in-air samples: Storage in glass flasks using PCTFE seals and other effects, in: Proceedings of the 12th IAEA/WMO meeting of CO2 experts, Toronto, September 2003, 64–70, https://hdl.handle.net/11858/00-001M-0000-000E-D36E-0 (last access: 3 November 2025), 2005. a, b
Schmitt, A. U., Ament, F., de Araújo, A. C., Sá, M., and Teixeira, P.: Modeling atmosphere–land interactions at a rainforest site – a case study using Amazon Tall Tower Observatory (ATTO) measurements and reanalysis data, Atmos. Chem. Phys., 23, 9323–9346, https://doi.org/10.5194/acp-23-9323-2023, 2023. a
Sierra, C. A.: The flask monitoring program for high-precision atmospheric measurements of greenhouse gases, stable isotopes, and radiocarbon in the central Amazon region, Zenodo [code], https://doi.org/10.5281/zenodo.17084742, 2025. a
Sierra, C. A., Chanca, I., Andreae, M. O., de Araujo, A. C., van Asperen, H., Borchardt, L., Botía, S., Candido, L. A., de Carvalho Correia, C. S., Dias Júnior, C. Q., Eritt, M., Fröhlich, A., Gatti, L. V., Guderle, M., Hammer, S., Heimann, M., Horna, V., Jordan, A., Knabe, S., Kneißl, R., Lavric, J. V., Levin, I., Macario, K., Menger, J., Moossen, H., Quesada, C. A., Rothe, M., Rödenbeck, C., Santos, Y., Steinhof, A., Takeshi, B., Trumbore, S., and Zaehle, S.: High-precision atmospheric measurements of greenhouse gases, stable isotopes, and radiocarbon in carbon dioxide in flask samples collected at the ATTO tall tower, Version 2025.3, Max Planck Institute for Biogeochemistry [data set], https://doi.org/10.17871/ATTO.574.13.2365, 2025. a, b
Sperlich, P., Uitslag, N. A. M., Richter, J. M., Rothe, M., Geilmann, H., van der Veen, C., Röckmann, T., Blunier, T., and Brand, W. A.: Development and evaluation of a suite of isotope reference gases for methane in air, Atmos. Meas. Tech., 9, 3717–3737, https://doi.org/10.5194/amt-9-3717-2016, 2016. a
Steinhof, A., Adamiec, G., Gleixner, G., Wagner, T., and van Klinken, G.: The new 14C analysis laboratory in Jena, Germany, Radiocarbon, 46, 51–58, https://doi.org/10.1017/S0033822200039345, 2004. a
Steinhof, A., Altenburg, M., and Machts, H.: Sample Preparation at the Jena 14C Laboratory, Radiocarbon, 59, 815–830, https://doi.org/10.1017/RDC.2017.50, 2017. a
Sturm, P., Leuenberger, M., Sirignano, C., Neubert, R. E. M., Meijer, H. A. J., Langenfelds, R., Brand, W. A., and Tohjima, Y.: Permeation of atmospheric gases through polymer O-rings used in flasks for air sampling, Journal of Geophysical Research: Atmospheres, 109, https://doi.org/10.1029/2003JD004073, 2004. a
Turnbull, J., Rayner, P., Miller, J., Naegler, T., Ciais, P., and Cozic, A.: On the use of 14CO2 as a tracer for fossil fuel CO2: Quantifying uncertainties using an atmospheric transport model, Journal of Geophysical Research: Atmospheres, 114, https://doi.org/10.1029/2009JD012308, 2009. a
van der Laan-Luijkx, I. T., van der Velde, I. R., Krol, M. C., Gatti, L. V., Domingues, L. G., Correia, C. S. C., Miller, J. B., Gloor, M., van Leeuwen, T. T., Kaiser, J. W., Wiedinmyer, C., Basu, S., Clerbaux, C., and Peters, W.: Response of the Amazon carbon balance to the 2010 drought derived with CarbonTracker South America, Global Biogeochemical Cycles, 29, 1092–1108, https://doi.org/10.1002/2014GB005082, 2015. a
Wendeberg, M., Richter, J. M., Rothe, M., and Brand, W. A.: Jena Reference Air Set (JRAS): a multi-point scale anchor for isotope measurements of CO2 in air, Atmos. Meas. Tech., 6, 817–822, https://doi.org/10.5194/amt-6-817-2013, 2013. a, b
Werner, R. A., Rothe, M., and Brand, W. A.: Extraction of CO2 from air samples for isotopic analysis and limits to ultra high precision δ18O determination in CO2 gas, Rapid Communications in Mass Spectrometry, 15, 2152–2167, https://doi.org/10.1002/rcm.487, 2001. a
Worthy, D. E. J., Rauh, M. K., Huang, L., Vogel, F. R., Chivulescu, A., Masarie, K. A., Langenfelds, R. L., Krummel, P. B., Allison, C. E., Crotwell, A. M., Madronich, M., Pétron, G., Levin, I., Hammer, S., Michel, S., Ramonet, M., Schmidt, M., Jordan, A., Moossen, H., Rothe, M., Keeling, R., and Morgan, E. J.: Results of a long-term international comparison of greenhouse gas and isotope measurements at the Global Atmosphere Watch (GAW) Observatory in Alert, Nunavut, Canada, Atmos. Meas. Tech., 16, 5909–5935, https://doi.org/10.5194/amt-16-5909-2023, 2023. a