the Creative Commons Attribution 4.0 License.
the Creative Commons Attribution 4.0 License.
 | 04 Nov 2025
Absolute gravity measurements at Brest (France) between 1998 and 2022
Marie-Françoise Lalancette
Sylvain Lucas
Roger Bayer
Jean-Daniel Bernard
Jean-Paul Boy
Nicolas Florsch
Jacques Hinderer
Nicolas Le Moigne
Muriel Llubes
Bernard Luck
Didier Rouxel
Repeated absolute gravity measurements, conducted once or twice per year, have proven valuable for quantifying slow vertical land motion with a precision better than 0.4 µGal yr−1 (1 µGal = 10−8 m s−2) after a decade or more. This precision is comparable to vertical velocity estimates derived from continuously operating space-based geodetic techniques such as the Global Navigation Satellite System (GNSS). Furthermore, absolute gravimeters are particularly well suited for long-term studies, as their measurements are based on fundamental length and time standards (laser and atomic clock) and remain independent of terrestrial reference frame realizations, unlike GNSS. Consequently, an absolute gravimeter can return years or even decades later and provide relevant measurements, provided the initial gravity data are well documented and the ground gravity marker remains undisturbed. Following this line of thinking, we have compiled and consistently reprocessed absolute gravity measurements collected between 1998 and 2022 in Brest, on the French Atlantic coast, near its century-long tide gauge station. The entire dataset has been reanalyzed in accordance with international recognized standards for instrumental and modelling corrections. This effort has yielded a 25-year time series of absolute gravity values, which we present and document for future studies, along with details on our reprocessing methodology. We assess the quality of this dataset and evaluate the extent to which the observed linear gravity trend agrees with vertical velocity estimates from the nearby GNSS station co-located with the tide gauge. The gravity data and metadata are made available via the French hydrographic agency Shom portal (https://doi.org/10.17183/DATASET_GRAVI_BREST; Lalancette et al., 2024).
- Article
(3619 KB) - Full-text XML
-
Supplement
(342 KB) - BibTeX
- EndNote


Before the advent of precise satellite radar altimetry in the 1990s, tide gauges were the primary source of sea level observations for scientific research. They still remain invaluable to investigate climate-related changes over multi-decadal to century timescales (Pugh and Woodworth, 2014). The oldest sea level records available date back to the 17th century, of which Brest is the longest instrumental series in France (Wöppelmann et al., 2006). A distinctive feature of tide gauges is that they measure sea level with respect to the land upon which they are grounded and thus record land level changes as well as sea level changes, which raises the issue of separating solid Earth geophysical processes from ocean and climate-driven processes in their records. A wide range of geophysical processes can result in land level changes (Emery and Aubrey, 1991), but few have readily available models to correct the global tide gauge data set with a sub-millimetre per year uncertainty level (e.g., Glacial Isostatic Adjustment or GIA; Tamisiea, 2011). An alternative approach to modelling is to measure the total land motion at a tide gauge, irrespective of the underlying geophysical processes that affect land level.
The use of geodetic techniques to separate vertical land motion and changes in sea level at tide gauges was first reviewed by the International Association for the Physical Sciences of the Oceans (IAPSO) within its Commission on Mean Sea Level and Tides (Carter et al., 1989), and later on revisited as techniques and data analysis methods progressed (Carter, 1994; Neilan et al., 1998; Blewitt et al., 2010; Wöppelmann and Marcos, 2016; Hamlington et al., 2020). Following recommendations from such international groups, absolute gravity measurements and Global Positioning System (GPS) – the first operational Global Navigation Satellite System (GNSS) – started to be recorded at important tide gauges around the world in the early 1990s (e.g., Baker, 1993; Zerbini et al., 1996). That is, shortly after transportable absolute gravimeters were available and able to address the challenging demand of 1–2 µGal (1 µGal = 10−8 m s−2) precision (Niebauer et al., 1995), henceforth enabling to implement a systematic approach of repeated observation campaigns at stations of interest (Faller, 2002).
Note that the above two types of instruments (absolute gravimeters and GNSS) provide independent and complementary data: absolute gravity changes inform on mass variations and vertical land motion, whereas GNSS can provide estimates of vertical land motion only (Lambert et al., 2006). In particular, the role of GNSS has become dominant and the primary method of choice due to its advantages in terms of cost, equipment installation and operating ease, as well as positioning performances at the subcentimer precision level, ultimately yielding a substantial development of permanent GNSS stations (Blewitt et al., 2018). Nonetheless, repeated absolute gravity measurements at tide gauges have proved worthwhile too, either as a standalone technique (Williams et al., 2001) or in combination with GNSS, in particular to overcome GNSS data analysis artifacts and potential systematic errors, such as those associated with the alignment of GNSS positions and velocities with an international terrestrial reference frame (Mazzotti et al., 2007; Teferle et al., 2009).
In France, the primary tide gauge for conducting absolute gravity measurements has been the Brest one, having the longest sea level time series available in the Permanent Service for Mean Sea Level (PSMSL) databank (Holgate et al., 2013). In addition, Brest station contributes to the core network of tide gauges of the global sea level observing programme under the auspices of the Intergovernmental Oceanographic Commission of UNESCO (IOC, 2012). The first absolute gravity campaigns at Brest were focused on investigating the ocean tide loading in Brittany and understanding the environmental effects of proximity to the ocean (Llubes et al., 2001). These initial objectives then shifted to the long-term monitoring of vertical land motion at the Brest tide gauge.
With this paper, our goal is to describe the Brest absolute gravity station (Sect. 2), how the measurements were carried out (Sect. 3), what instruments and corrections were implemented, and how the measurements were reduced to a common reference (Sect. 4), ultimately yielding a consistent absolute gravity time series spanning circa 25 years, whose trend is estimated and compared to independent estimates of vertical land motion (Sect. 5), and whose data are hereby made available open and freely for future research (Sect. 6).
A number of technical issues were carefully considered in the mid-1990s when planning the site for absolute gravity measurements at Brest. The vicinity of the coastline to a gravity site was known to be critical, impacting the quality of the gravity measurements and increasing the variance of the data due to the microseismic noise from the nearby ocean waves (Baker, 1993). Fortunately, the problem can be greatly alleviated by locating the site a few kilometres inland from the coast. Carter et al. (1989) recommended establishing the absolute gravity sites between 1 and 10 km inland from the tide gauges. Accordingly, the Brest absolute gravity site was established inland at 3.1 km from the tide gauge (Fig. 1), similar to the Aberdeen absolute gravity site in UK, which is 3.2 km from the tide gauge (Williams et al., 2001).
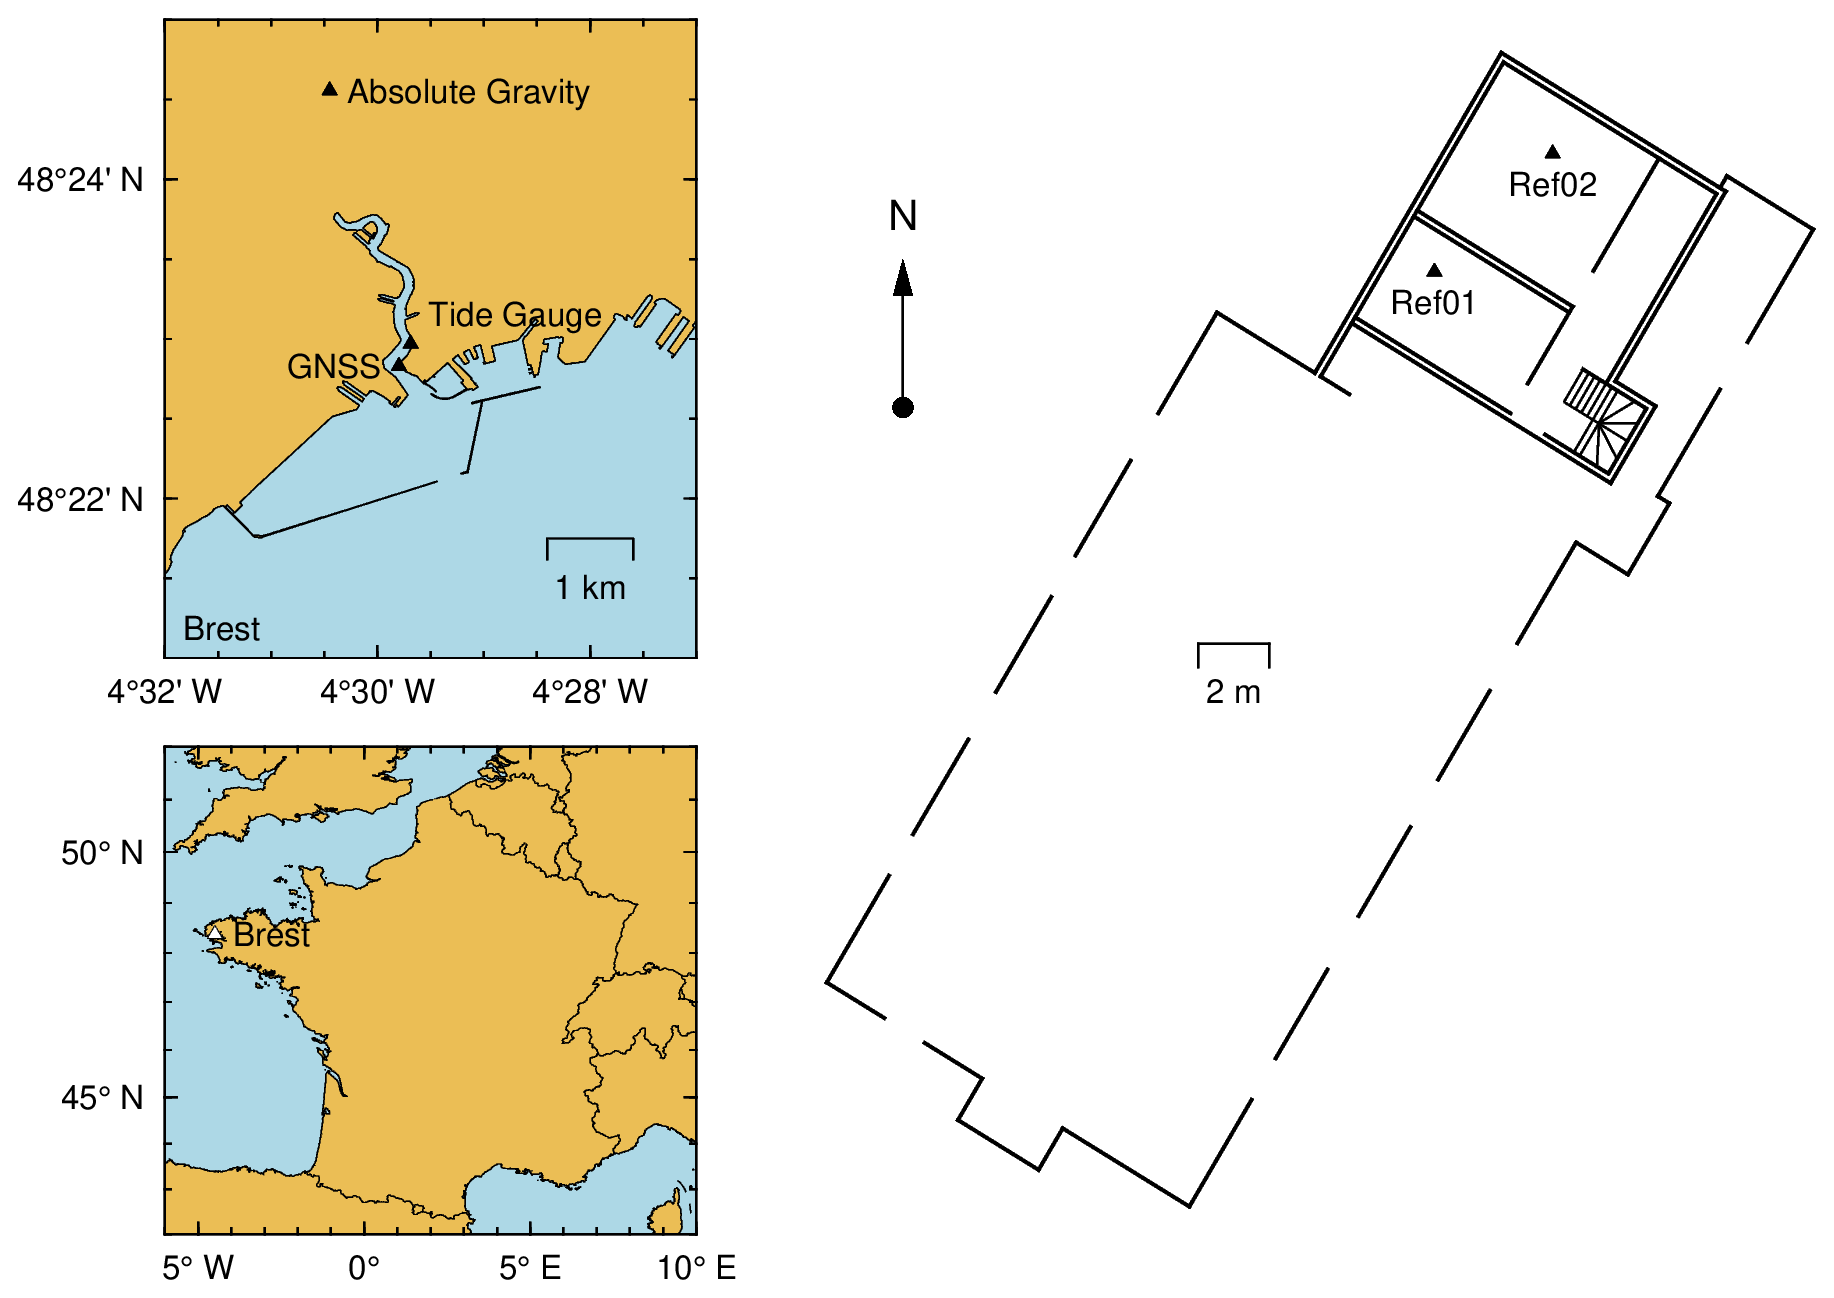
Figure 1Location of the main geodetic stations (triangles) in Brest, France. The ground floor markers (Ref01 and Ref02) are underground in the building basement at Shom.
The Brest absolute gravity measurements have been carried out above two ground floor markers named Ref01 and Ref02 (Fig. 1), located 10 m apart from each other in the basement of the building at the entrance of Shom, the French hydrographic agency. The original marker (Ref01) was used until 2016, after which the measurement set up was relocated to Ref02, in the adjacent room. This relocation was necessary because the original room had become increasingly untsuitable for high-precision measurements. It was subject to recurring maintenance interventions related to a heating system, and the expansion of the heating network reduced the available space. In constrat, the new room (Ref02) offers improved conditions for gravimetric operations (Fig. 2, right): it is more spacious, better ventilated, and exhibits lower and more stable temperatures.
The height of Ref01 is 47.700 m above the national levelling datum known as NGF-IGN69 (Lucas, 2024). In addition, the Ref01 marker was determined to be 0.009±0.001 m below Ref02 using precise levelling (Lucas, 2024). Interestingly, Wöppelmann et al. (2008) found six first-order levelling surveys in the national mapping agency archives, which were carried out at regular intervals between 1889 and 1996. Their findings indicated local stability of the area up to 20 km eastwards of Brest. Noteworthy, the height differences between the tide gauge benchmark and a benchmark nearby the Shom absolute gravity site (designated as NO-1 and NO-5 in their Table 1, respectively) did not exceed one millimetre over 73 years. That is, the Brest area appears stable well within the spirit levelling uncertainty level. Poitevin et al. (2019) further confirmed the geodetic local stability of the Brest area using InSAR (Interferometry Synthetic Aperture Radar) data over the recent decades (between 1992 and 2000 with ERS-1/2 satellite data, and between 2002 and 2008 with ENVISAT satellite data).
The observed geodetic stability of the Brest area is consistent with the geological setting of a basement mainly composed of metamorphic crystalline rocks (Gneiss of Brest), which were emplaced during the Cadomian (650–550 Myr) and Variscan (420–290 Myr) orogenesis according to Cagnard (2008). Furthermore, Brest is located on a passive margin far from any active zone of the European plate boundary. Interestingly, Brest may be part of the peripheral crustal bulge developed during the last glaciation (Emery and Aubrey, 1991). The bulge area was once rising due to ice load of the British-Irish Ice Sheet (BIIS) and, after the deglaciation, sinking. Presently, the central sector of the BIIS, broadly located on the deglaciated mountains of Scotland, is undergoing an uplift (postglacial rebound) at a rate of about 1.6 mm yr−1, whereas the surrounding areas (peripheral bulge) are subsiding at rates up to about 1.2 mm yr−1 in southwest England (Shennan and Horton, 2002). However, Lenôtre et al. (1999) noted that a slight error in the BIIS modelling (e.g., extent of glaciated area, history of deglaciation) can result in a different position of Brest with respect to the peripheral bulge area.
3.1 Absolute & relative gravimeters
Two absolute gravimeters of FG5 systems (Faller, 2002) were used to produce the time series presented in Sect. 5. These were manufactured by Micro-g Solutions (Niebauer et al., 1995) and numbered 206 and 228 (hereafter designated as FG5#206 and FG5#228). Briefly, the FG5 absolute gravimeter measures the acceleration of a test mass (corner cube) in free fall in a vacuum chamber by interferometry using a laser wavelength standard and an atomic frequency standard. The FG5 gravimeters are relatively cumbersome to operate in the field. One FG5 gravimeter, packaged in its transport crates, weighed about 250 kg. Henceforth, they can effectively be transported between stations in six boxes and have been successfully operated at remote sites as far as Antarctica (Amalvict et al., 2009). Figure 2 shows the FG5#228 operating above Ref01 ground floor marker in August 2007 and later above Ref02 marker in July 2022.
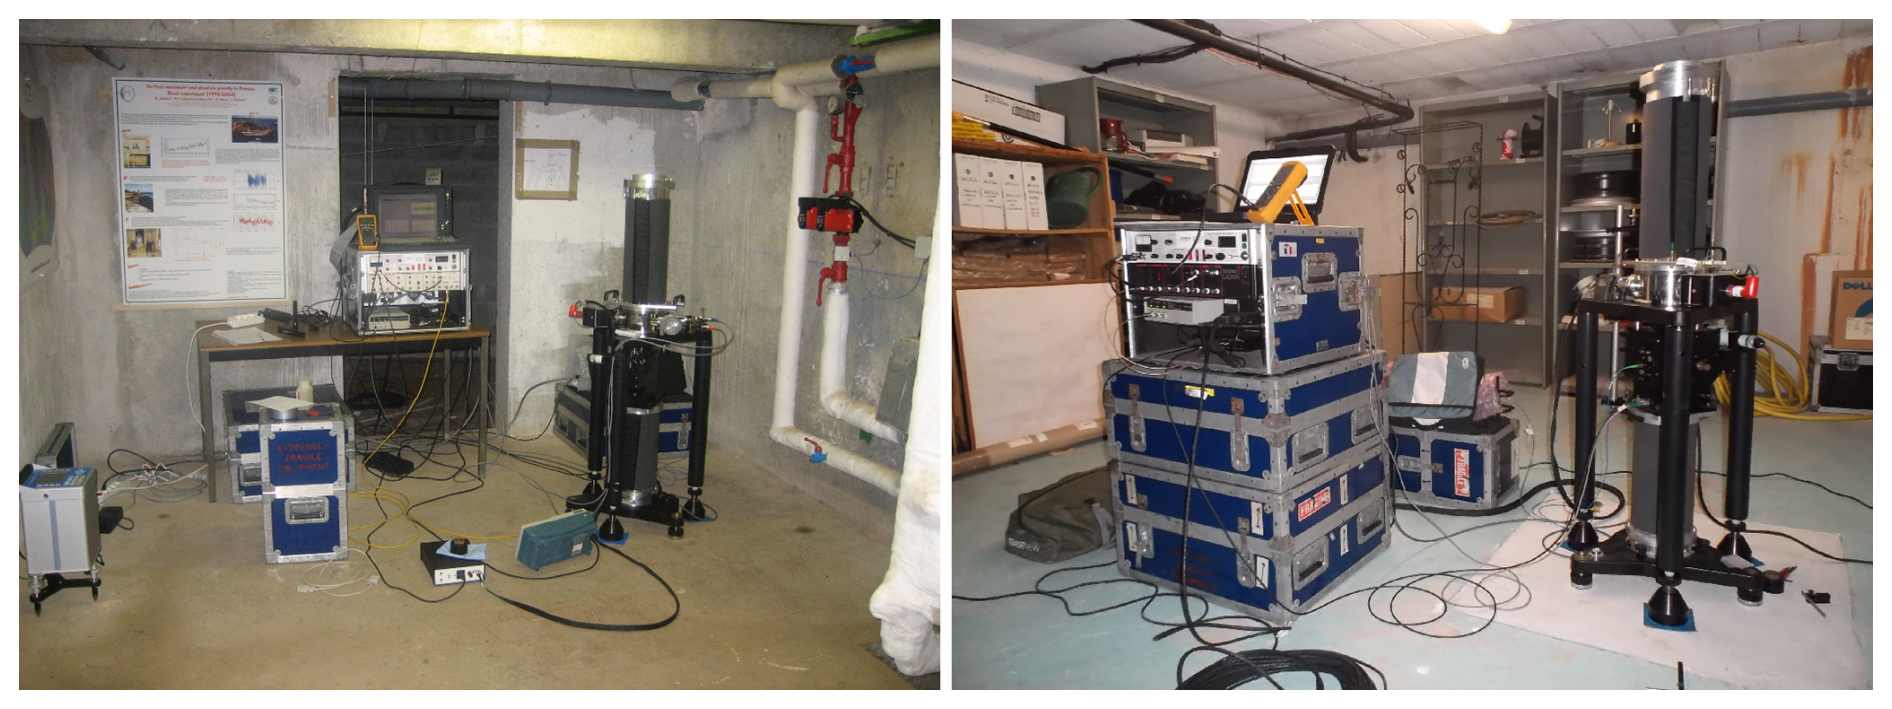
Figure 2FG5#228 absolute gravimeter observing at Shom in Brest (France) above Ref01 ground floor maker in August 2007 (left) and above Ref02 marker in July 2022 (right).
To transfer the FG5 absolute gravity measurements from the effective instrumental height to the common reference height (Sect. 4) and to determine the gravity tie between the locations of Ref01 and the Ref02 ground floor markers (Sect. 5), spring gravimeters Scintrex CG3M and CG5 were employed following procedures implemented by Shom (2016, 2018) from the user manuals (https://scintrexltd.com/support/product-manuals/, last access: April 2025). The measurement of these type of gravimeters is based on the lengthening of a spring in an unpressurized, thermostatically controlled chamber (details in Niebauer, 2015).
3.2 Sampling strategy & editing
Typically, the gravity value from an FG5 observation campaign is obtained by making repeat drops of its test mass during 1–2 d at a given site (Baker, 1993). At Brest, the observation campaigns have followed a uniform sampling strategy since 2001, consisting of hourly sets of 100 drops each (Table 1). The previous campaigns in 1998 and 1999 were experimental to validate the site selection and the measurement protocol, as well as to investigate the ocean tide loading in Brittany (Llubes et al., 2001). Table 1 shows a total number of several thousand drops per campaign with a number of sets depending on the duration of the campaign. The gravity value of each observation campaign is also provided in Table 1 (col. 6) in microgal or µGal at the top-of-the-drop height above the floor marker (g0 in Fig. 3). In the FG5, this height corresponds to the resting position of the test mass (Fig. 1 in Wziontek et al., 2021). Each gravity value in Table 1 (col. 6) is the average of the set gravity values over the given day (col. 1), with each set value itself being the average of the individual drops within that set. The last column gives the set-to-set scatter (standard deviation).
Table 1Absolute gravity measurement campaigns in Brest with their associated central date of measurements, FG5 serial number, number of sets and drops per set, top-of-the-drop height above floor marker (Ref01 till 2016, Ref02 since 2018), gravity value (average of set values) and set to set scatter (standard deviation).
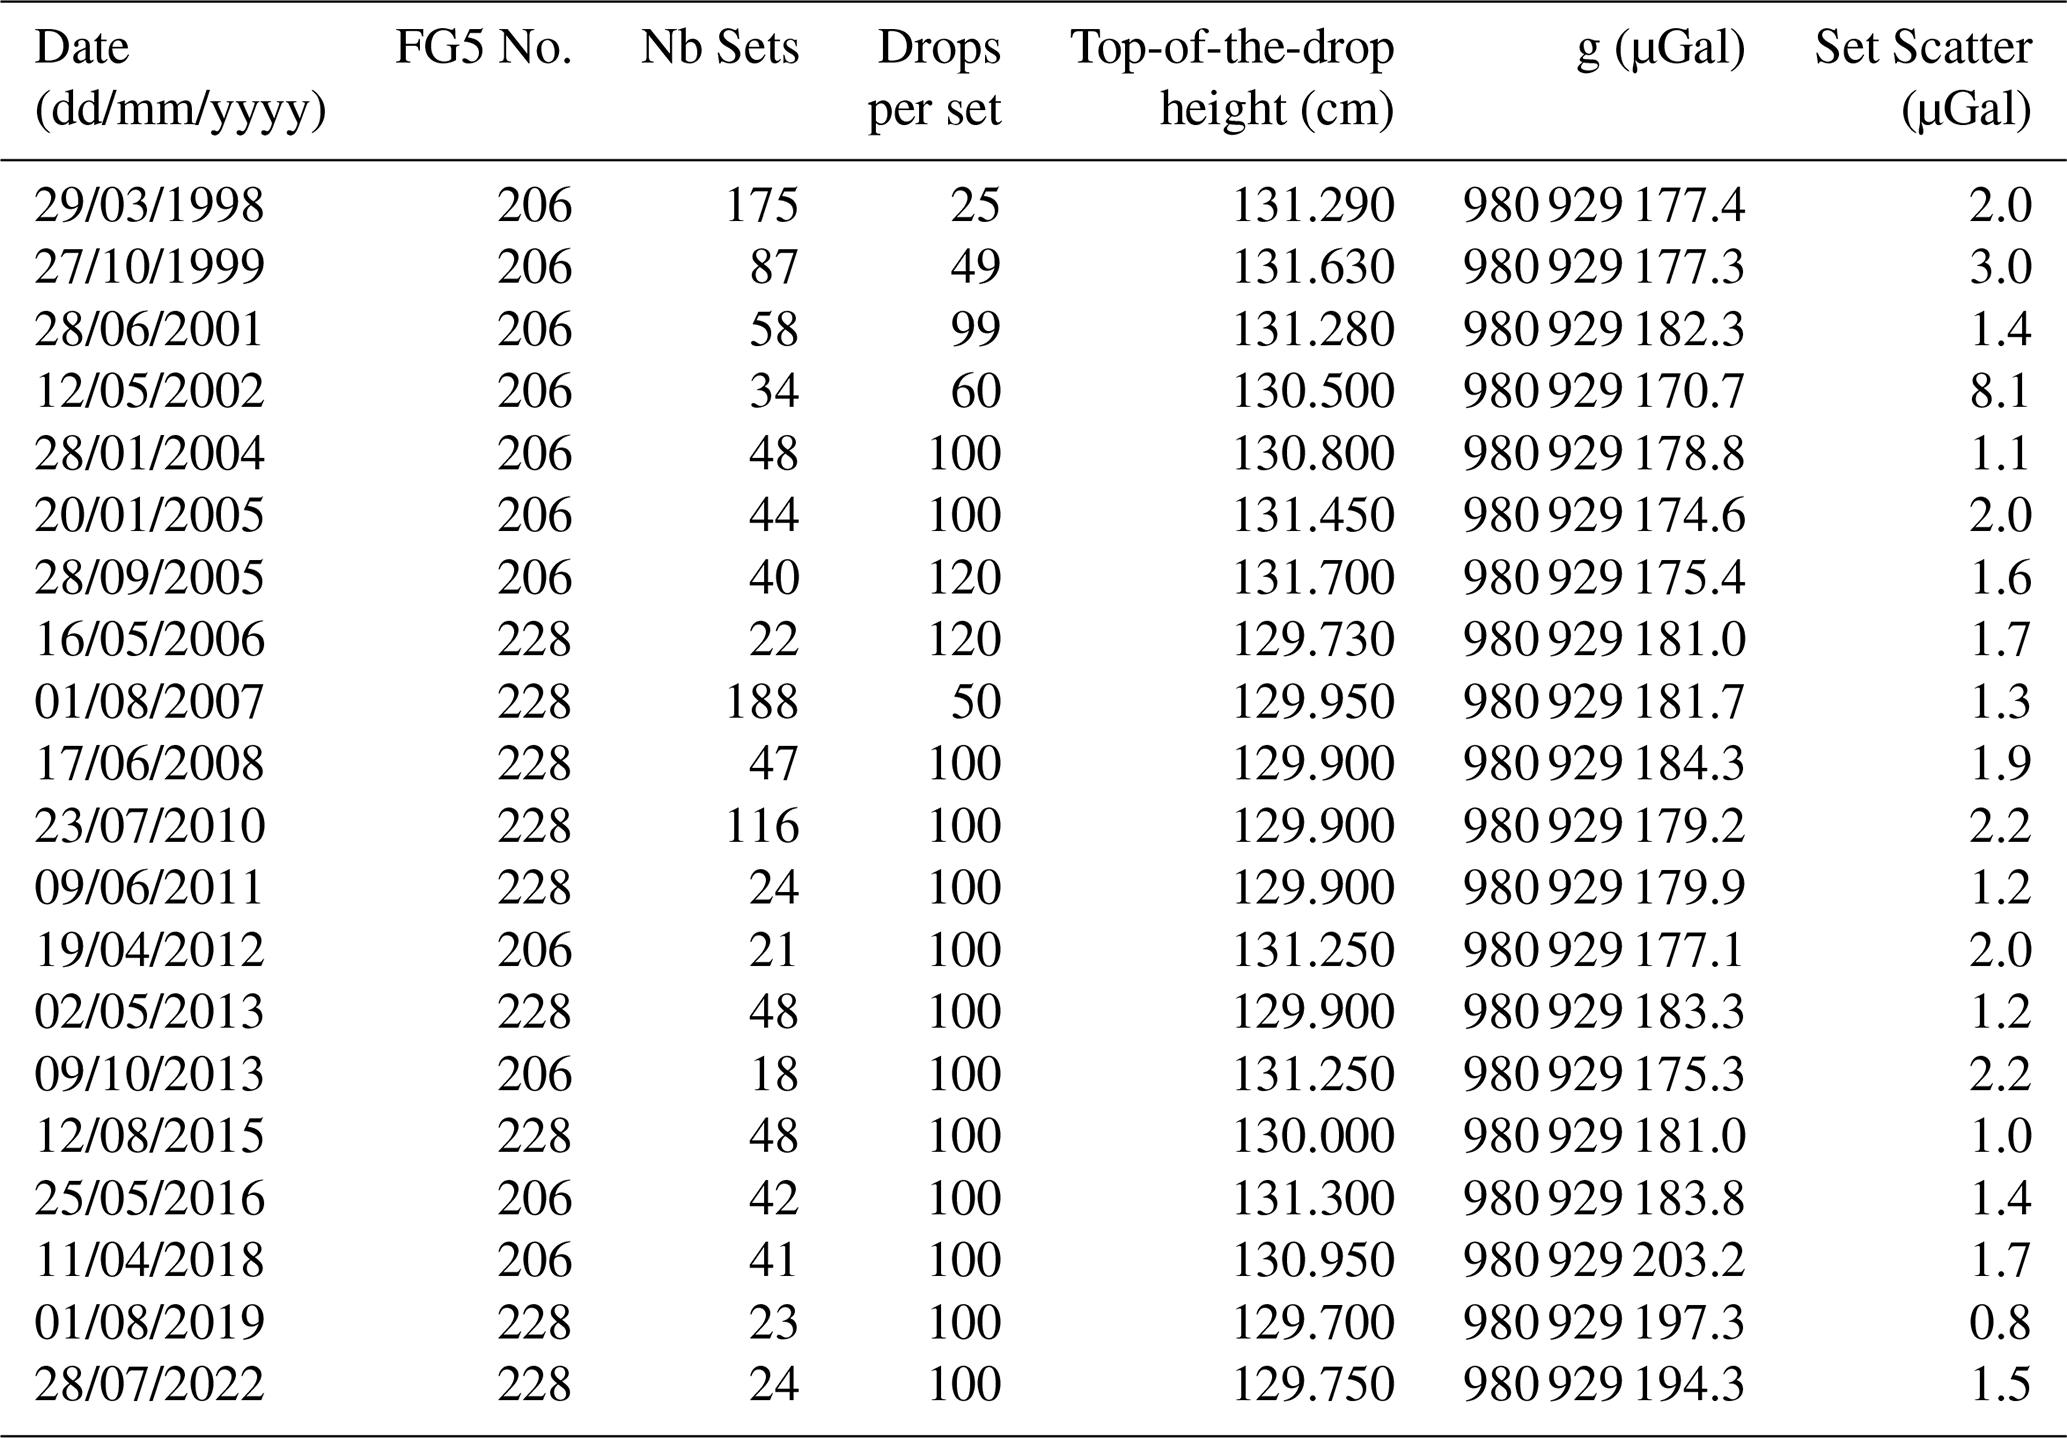
Unfortunately, the absolute gravity campaigns at Brest were not conducted at regular intervals with a yearly frequency following international recommendations (e.g., Carter, 1994; Pálinkáš et al., 2010) to determine vertical land motion with a precision better than 1 mm yr−1. Indeed, several years were missed primarily due to the tight workload imposed by the many research groups entitled to use the two FG5 systems available in France. By contrast, two observation campaigns were conducted in 2005 and in 2013, eight and five months apart, respectively. The two campaigns in 2005 show a raw difference of 0.8 µGal (Table 1) and a difference of 1.4 µGal after reduction to a common reference, considering the local gravity gradient and the height of the top-of-the-drop position in the dropping chamber above the floor marker (Sect. 4). These differences are well within the precision observed at good sites from repeat visits (Baker, 1993). The two campaigns in 2013 yield larger differences of 8 and 4 µGal, respectively (before and after reduction), suggesting a potential influence of the seasonal cycle, although the use of a different FG5 (#228 and #206) could also contribute to these differences. The issue of using two FG5 instruments is further discussed in Sect. 5.
The last column in Table 1 shows the scatter of the gravity values obtained per set. The median of the set scatters is 1.7 µGal (average is 2.0 µGal) indicating the overall good quality of the site (Baker, 1993). The set scatter is also a measure of the environmental and weather conditions during the campaign. For instance, in January 2005 the wind was blowing at 110 km h−1 and the FG5 operators (Hinderer and Luck, 2005) noted that the Brest roadstead was closed on 18 January and morning of 19 January (a rare maritime safety measure). Fortunately, the weather improved substantially from 19 January afternoon onwards and the last day of the campaign resulted in a 2.0 µGal scatter set (Table 1). From our 25 years of experience, we conclude that reliable results at the targeted precision level of 2.0 µGal can be achieved in one day of measurements. Accordingly, and for the sake of consistency, we carefully reviewed the gravity data acquired during each campaign and, when measurements spanned multiple days, retained the highest-quality single full day of observations (Table 1). In addition to the 2005 campaign, another exceptional case with multi-day measurements was in 1999, which was also affected by strong weather conditions. Obviously, having campaigns with several days of measurements plays in favour of this editing and, henceforth, increases confidence in the resulting gravity value. We thus recommend conducting these campaigns over several days. The risk is illustrated with the campaign carried out in 2002, whose short duration did not provide the chance for good weather conditions, and the associated measurement point is considered an outlier (discarded in the following) based on its set scatter being four times above average (Table 1).
4.1 Geophysical corrections
To ensure consistency, the raw gravity observations from all campaigns were reprocessed using a uniform data analysis strategy (modeling, corrections and setup parameters) across the entire data sets available for Brest. Indeed, a uniform processing scheme is crucial to minimize computational errors and yield a highly consistent time series. This is particularly important as the set of conventional gravity corrections for time-dependent components have progressed since the first measurements in 1998 (e.g. ocean loading, Llubes et al., 2001).
The reprocessing was carried out with the “g9” software developed by Micro-g LaCoste (2012). With this software, the same set of conventional models were applied in accordance with the international standards (e.g., Wziontek et al., 2021) to reduce the observations (each drop) from all campaigns. This set included the correction of temporal gravity changes due to the solid Earth tides (Earth tide parameters from ETGTAB; Wenzel, 1996), atmospheric mass variations, polar motion and ocean tidal loading. The atmospheric gravity effects (mass attraction and loading) were removed empirically with a constant admittance between local air pressure and gravity (−0.3 µGal hPa−1). Changes in centrifugal acceleration due to the variation of the distance of the Earth rotation axis from the gravity station (polar motion) were computed using the final pole coordinates from the International Earth Rotation and Reference Systems Service (IERS/EOPC04). Regarding ocean loading, Llubes et al. (2001) showed that Brest is strongly influenced by this phenomenon, with gravity variations reaching approximately 30 µGal peak to peak, as visually estimated from their Fig. 2. Furthermore, the observed gravity variations at Brest exceeded theoretical predictions by 16 %, likely due to a coarse spatial resolution of the global ocean tide models used at the time. To refine this, a relative gravimeter (Scintrex CG3M #0202518) was installed above the Ref01 floor marker (Fig. 1) and operated between 28 July 2003 and 27 October 2004. After filtering the data to hourly samples, a tidal analysis was conducted using the ETERNA package (Wenzel, 1996), with gravimetric factors adjusted to account for both solid Earth tides and ocean tidal loading (Dehant et al., 1999). A local ocean loading model was derived from this CG3M record (Boy, 2006) and is provided as Supplement in the project files (Lalancette et al. 2024) to support future applications and comparison with other models. Note that, in addition to using the same set of conventional models, a consistent local (observed) vertical gravity gradient was applied in the reprocessing of all original gravity data (Sect. 4.2).
4.2 Common reference height & local vertical gravity gradient
Applying the evaluation software from the FG5 manufacturer, the gravity value from an FG5 is determined inside the dropping chamber of the instrument at the top of the drop (g0 in Fig. 3). Depending on the FG5 setup, the top of the drop height can change from setup to setup and from instrument to instrument. In our case study of Brest, this height was around 1.30 m above the ground floor marker level (Column 5 in Table 1 and hinstr in Fig. 3). Therefore, to build a consistent time series, we adopted the common reference height of 1.22 m above the Ref01 floor marker (href in Fig. 3), that approximately corresponds to one-third of the falling distance (about 25 cm) below the first measured position of the free-fall trajectory. This common reference height is close to the position where the influence of an uncertainty in the vertical gravity gradient becomes negligible (Timmen, 2003; Pálinkáš et al., 2012).
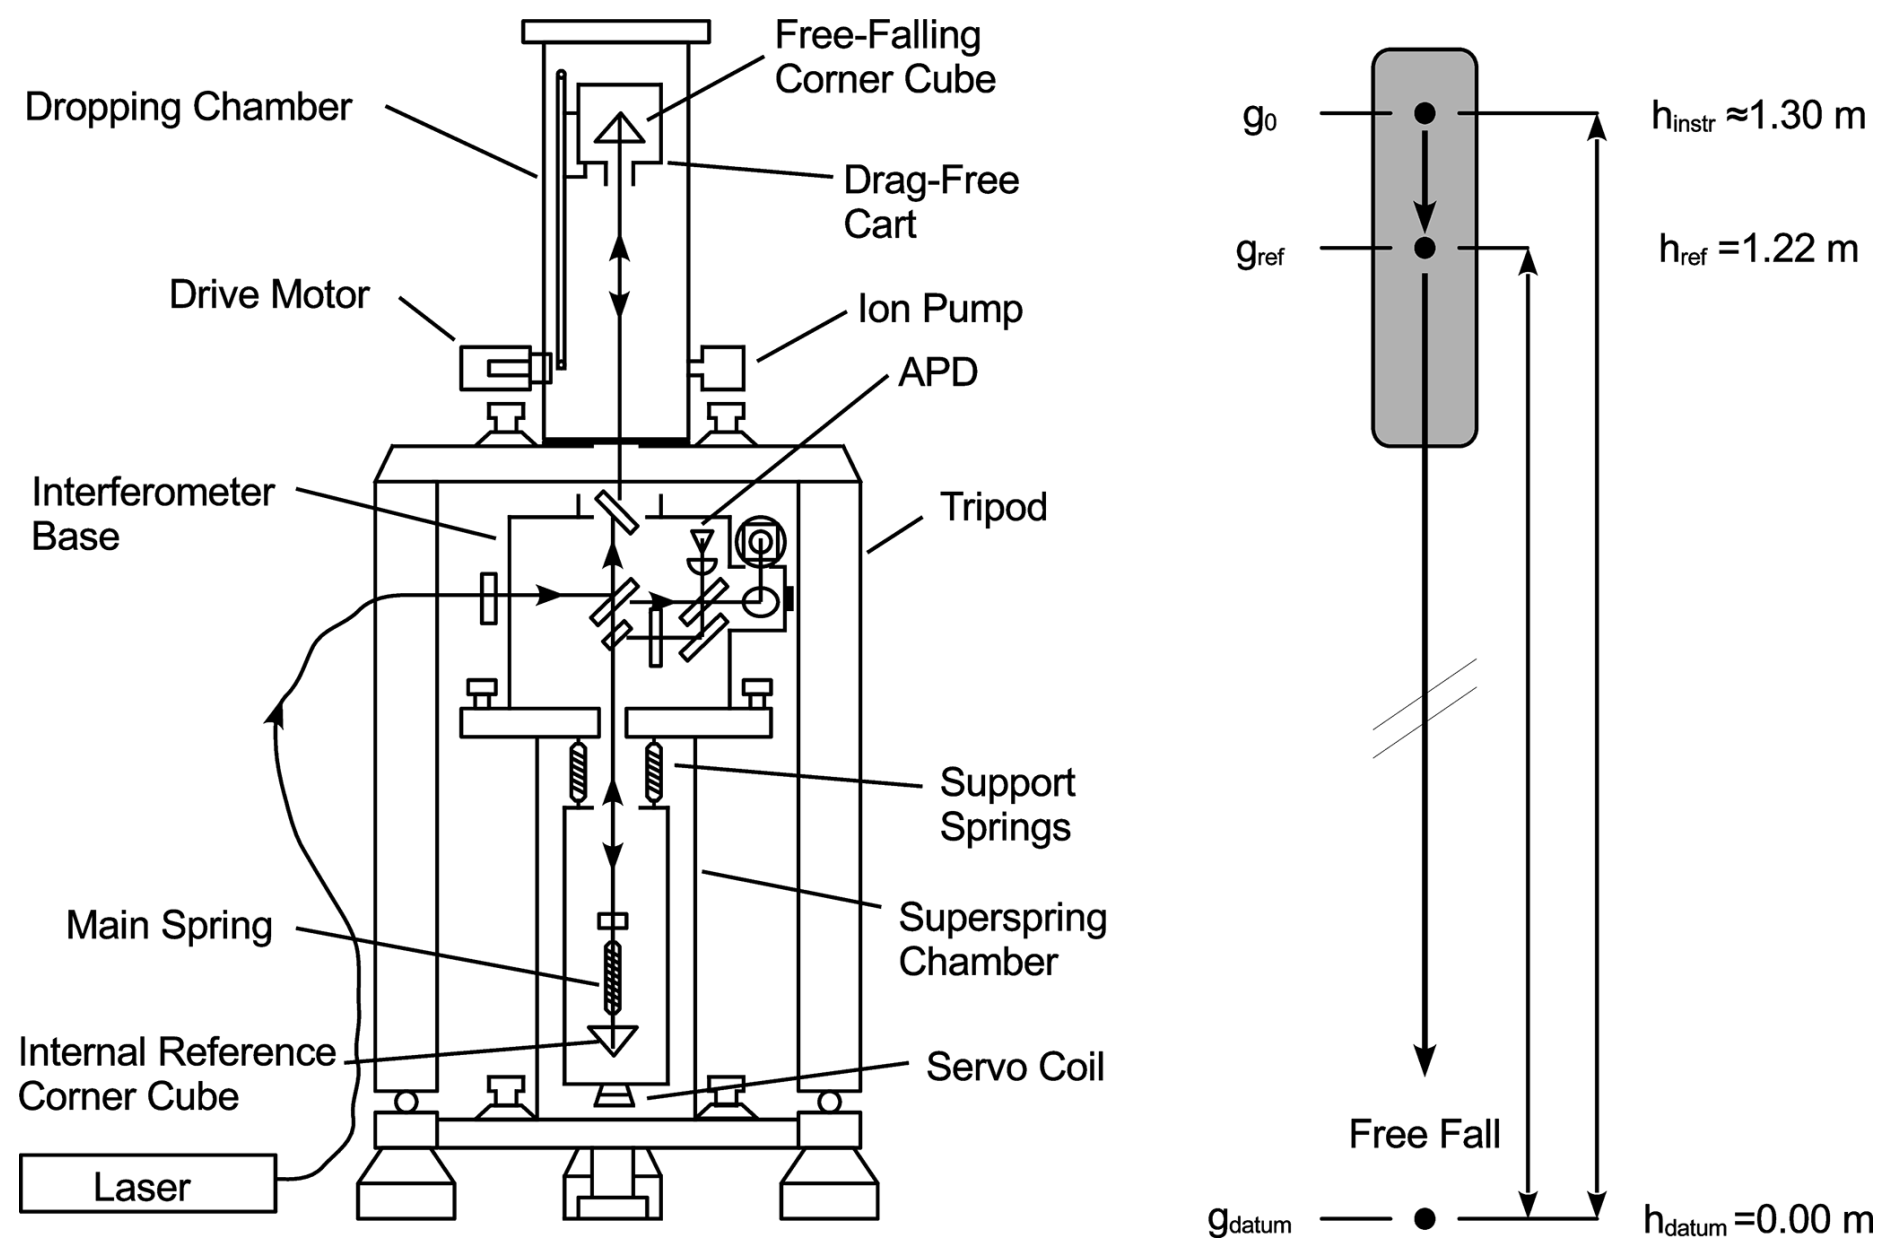
Figure 3FG5 sketch adapted from Micro-g Solutions Inc. (1999) showing the height of the top of the drop position (e.g., hinstr=1.30 m) in the dropping chamber above the ground floor marker (hdatum=0.00 m) and height adopted as common reference (href=1.22 m) for the time series of gravity values at Brest (see text).
The transfer of each absolute gravity value from the top-of-the-drop height (hinstr in Fig. 3) to the common reference height (href in Fig. 3) was achieved using the actual vertical gravity gradients determined from measurements of relative gravity using a Scintrex CG3M or CG5. Figure 4 illustrates how these measurements were performed using a dedicated, stable tripod with three predefined mounting levels (0, 60, and 120 cm above the floor), referring to the elevation of the instrument base. This measurement procedure was carried out ten times between 2003 and 2013 above the Ref01 ground floor marker, and four times between 2017 and 2022 above the Ref02 marker, each operation taking place on a different date, yielding an independent gravity gradient. The scatter of the individual gradient measurements was 0.06 µGal cm−1 at Ref01 and 0.04 µGal cm−1 at Ref02. No statistically significant temporal changes were detected, with estimated trends of µGal cm−1 yr−1 at Ref01 and µGal cm−1 yr−1 at Ref02. The vertical gravity gradients used in this study result from the weighted average of the independent determinations above each marker. That is, µGal cm−1 above the Ref01 floor marker and µGal cm−1 above the Ref02 marker.
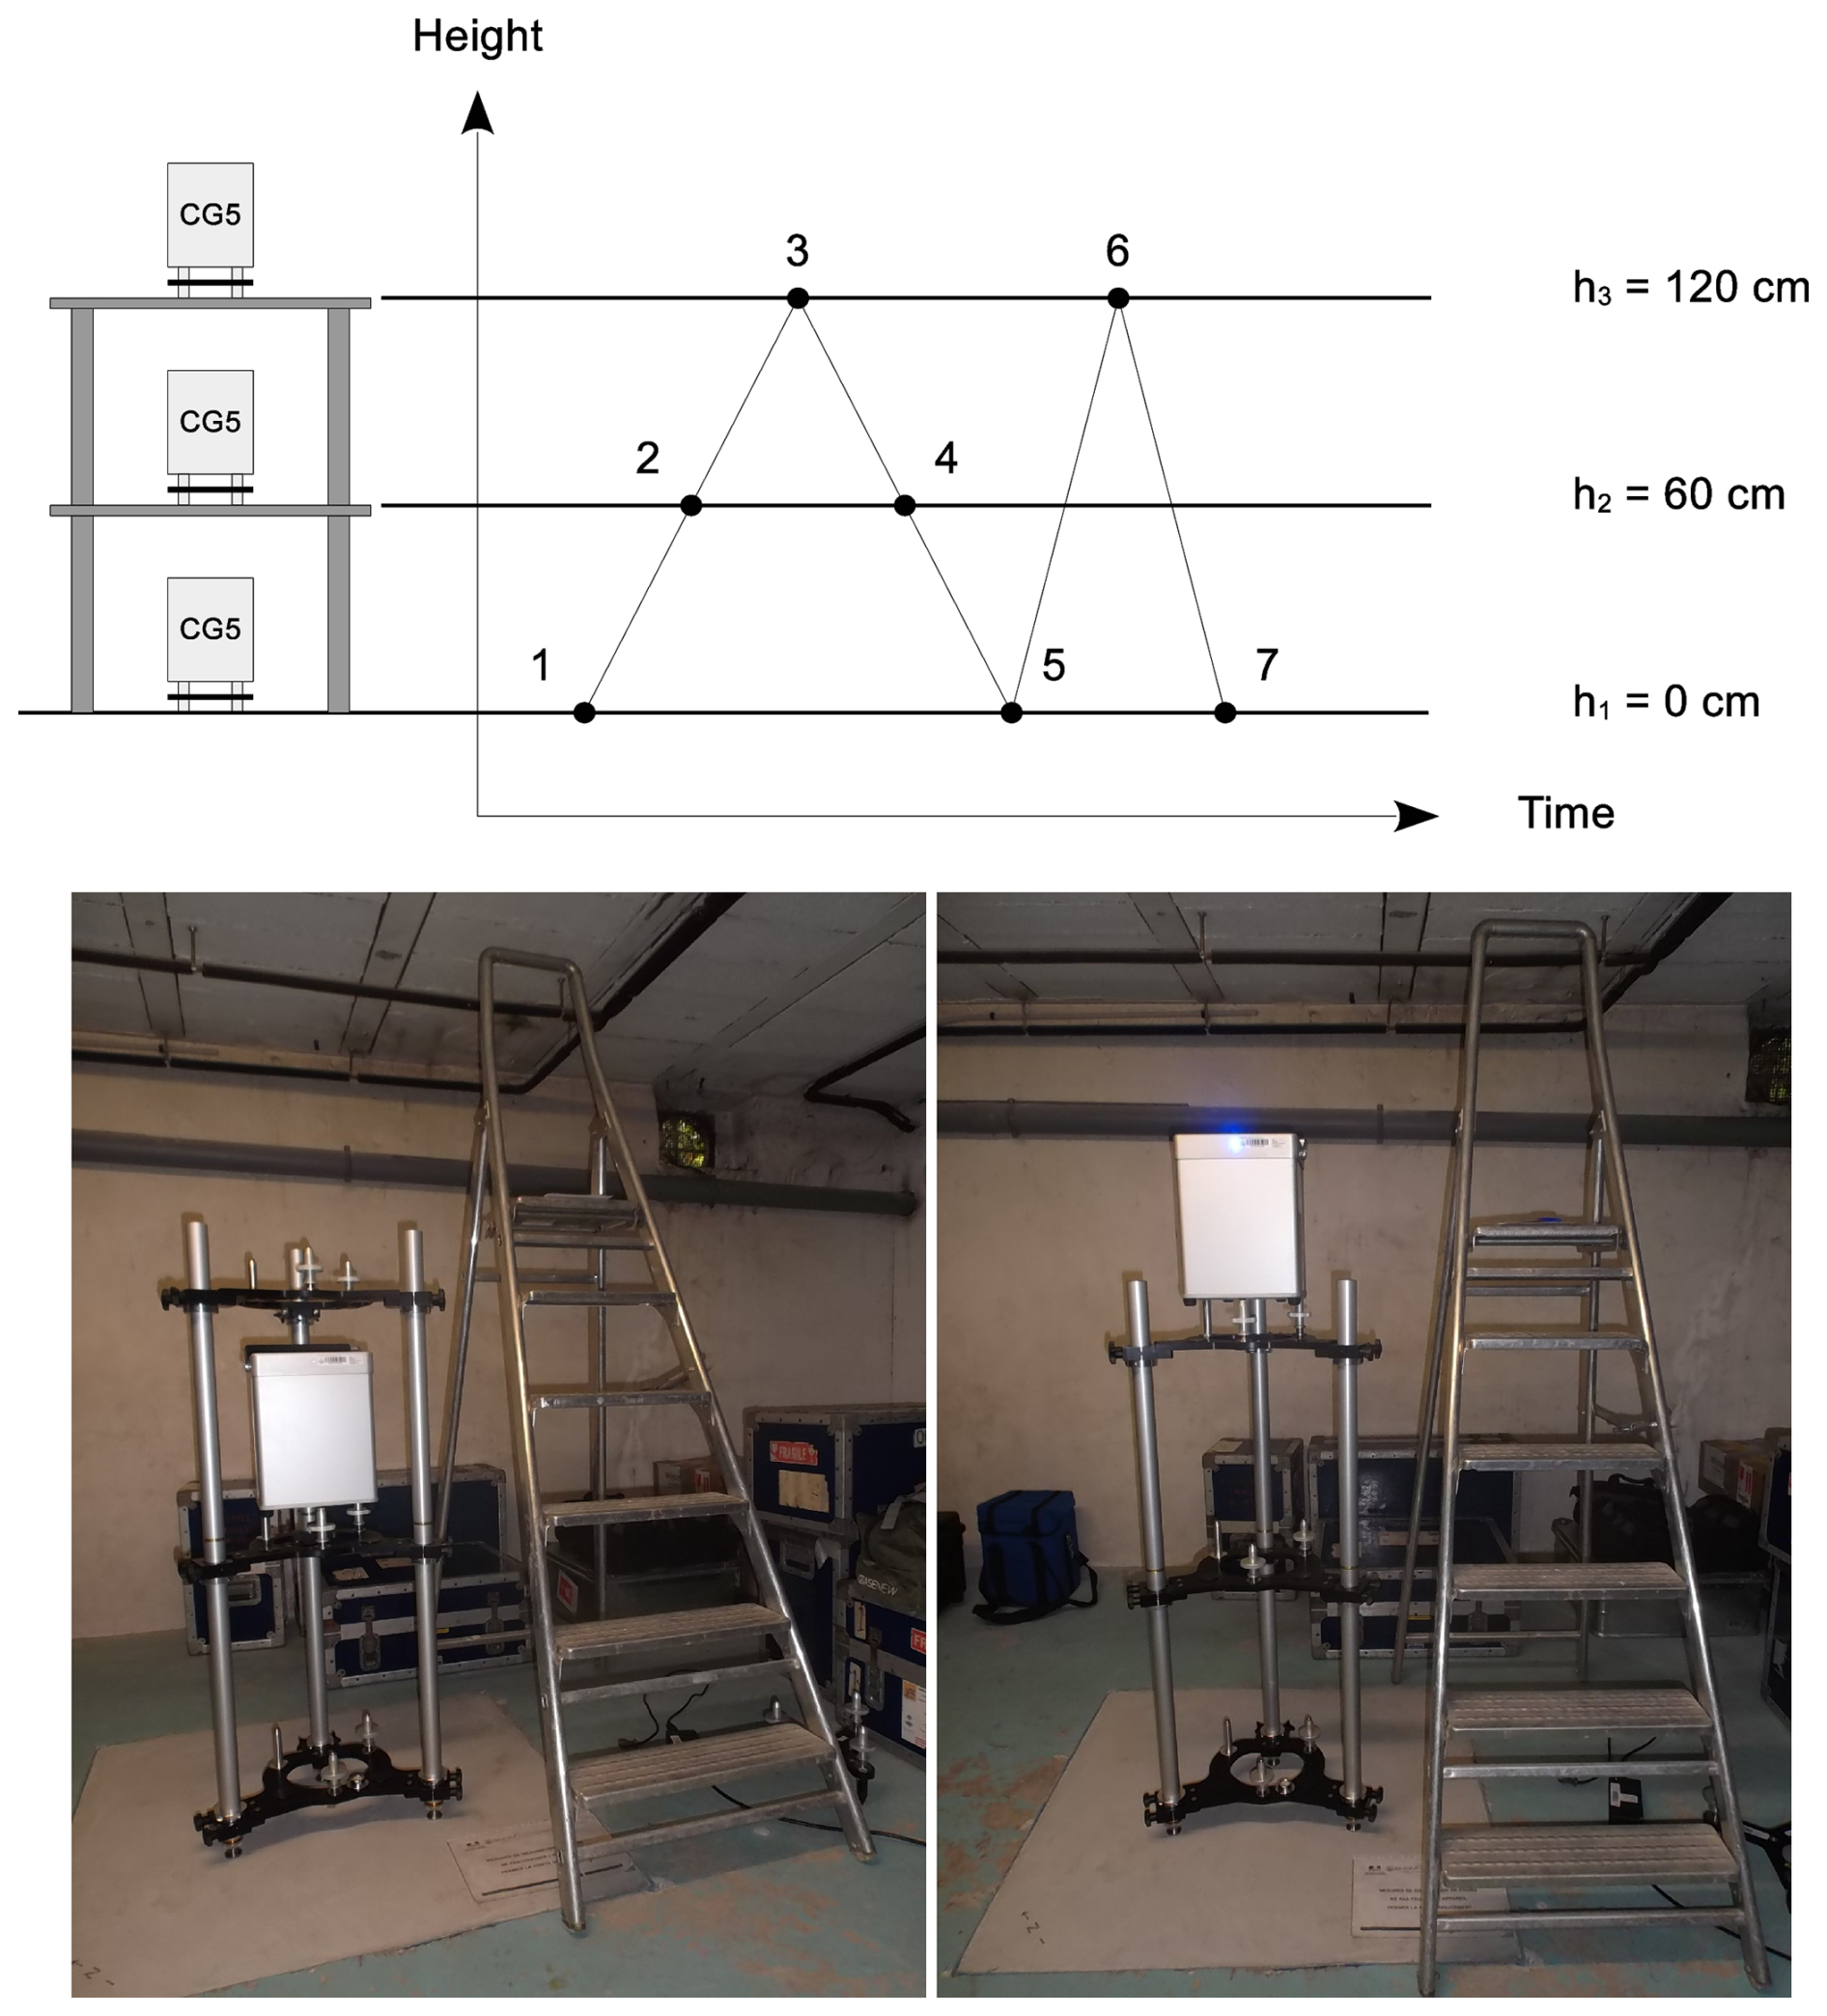
Figure 4Procedure adopted at Brest for determining the local gravity gradient (top). Illustration of the procedure at mid and top locations using a CG5 relative gravimeter above Ref02 floor mark in 2022 (bottom).
5.1 Absolute gravity time series
Absolute gravity values in Brest were determined at two different locations less than ten metres apart on the same floor (Fig. 1). To build a combined time series, the gravity tie between Ref01 and Ref02 floor markers was determined from measurements of fifteen independent operations using a CG3M or a CG5 relative gravimeter beween June 2017 and August 2022. The weighted average of the individual determinations resulted in a relative gravity tie of 6.61±2.01 µGal, which should be subtracted from the absolute gravity values obtained at Ref02 marker to build a time series referred to the Ref01 marker.
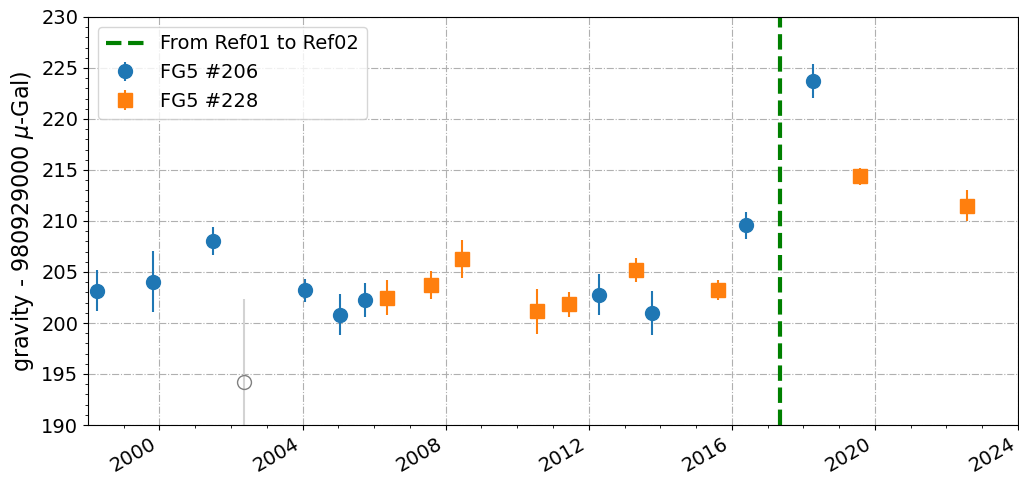
Figure 5Absolute gravity time series at Brest reduced to the reference height of 1.22 m above Ref01 floor marker employing either the absolute gravimeter FG5 #206 (blue circles) or FG5 #228 (orange squares). The error bars correspond to the set scatter of each observation campaign (See Table 1). The vertical dashed line indicates the change in measurement location (See text and Fig. 1).
Figure 5 shows the absolute gravity time series reduced to Ref01 floor marker in Brest over the 1998–2022 observation period with geophysical corrections applied (Sect. 4). The error bars correspond to the “set scatter” (Table 1), that is, the standard deviation of the set values obtained within each observation campaign. Except for 2002 (considered as an outlier, Sect. 3.2), the set scatters range between 0.8 and 3.0 µGal, likely due to different weather conditions from one campaign to another, still in agreement with values reported in the literature (Francis, 2023; Van Camp et al., 2017). Interestingly, the absolute gravity values obtained within a relatively short time interval (September 2005 and May 2006 or June 2011 and April 2012) from one or the other FG5 instrument (#206 and #228) show no evidence of systematic errors. The differences of 0.20 µGal (2005–2006) or 0.95 µGal (2011–2012) are well within the 2 µGal precision reported by the manufactuer of the FG5 (Niebauer et al., 1995).
The detection and evaluation of systematic errors in absolute gravimeters is known to be a difficult task that can be achieved by comparison with other absolute gravimeters (Francis and van Dam, 2003; Van Camp et al., 2017). Fortunately, the two French FG5 participated in several international comparisons aiming at determining systematic errors (offsets or biases) between absolute gravimeters. De Viron et al. (2011) revisited the data comparison method and the results from two of these international comparisons conducted in 2005 and 2007, that included the French gravimeters. The authors report an offset dispersion of 4.4 and 3.8 µGal across the 19–20 instruments participating, that is, systematic errors were around 4 µGal. Regarding the French instruments, the comparisons showed systematic errors of the order of 2 µGal. The discrepancy of FG5#206 to the median of all gravimeters was 1.3 µGal in 2005 and −1.5 µGal in 2007, whereas the median offsets of FG5#228 were −2.3 and −0.5 µGal, respectively (Tables 4 and 5 in De Viron et al., 2011). Pálinkáš et al. (2021) futher extended the analysis to international comparisons held between 2009 to 2018. Their results suggest that FG5 biases can be described by a normal distribution with a standard deviation of 2.1 µGal. For our two FG5, the estimated biases fall within the 95 % confidence interval (see their Appendix Tables), i.e., they are not statistically significant. Notably, both instruments participated in the 2013 comparison (Pálinkáš et al., 2021, Table 5), where the difference in bias between FG5#206 and FG5#228 was only 0.9 µGal.
In light of the above inter-instrument differences over short time intervals (Fig. 5) and the results of the international comparisons, systematic errors in FG5#206 and FG5#228 data are likely within or close to the 2 µGal precision level reported by the manufacturer, supporting the idea of combining the measurements from both instruments to build a unique gravity time series similar to the one presented in Francis (2023) using three FG5 gravimeters.
5.2 Vertical land motion estimates
5.2.1 From absolute gravity data
The combined FG5 gravity measurements are now displayed in Fig. 6 as a unique time series from which the slope of a linear trend was fitted using weighted least squares to estimate the rate of gravity change, and later on the vertical land motion. As the gravity value of 2018 appeared more than three standard deviations from the linear trend, it was considered an outlier and discarded. The error bars in Fig. 6 (used in the weighted least squares) correspond to the total uncertainty of an observed gravity value, which is composed of the four terms described in Niebauer et al. (1995). These are the gravity measurement precision σg, the vertical transfer (gradient) error , the system errors σSYS, and the setup error σSETUP. Two additional terms are considered specific to the Brest case study, that is, σFG5S to account for the use of different instruments and σTIE to transfer the values from Ref02 to Ref01 floor marker (Sect. 4.2). Assuming the error terms are independent, the total uncertainty σTOT can be computed using formal (quadratic) error propagation using:
The error bars in Fig. 6 represent our best estimates of the σTOT and are based on the observed scatter in the data. The measurement precision σg is the set scatter (last column in Table 1) divided by the square root of the number of sets (third column in Table 1). The values for at Ref01 and Ref02 locations are reported in Sect. 4.2 and its multiplication factor ΔH is the difference between the actual measurement height (fifth column in Table 1) and the common reference height of 1.22 m above Ref01 marker. The system error σSYS includes instrumental sources (e.g., clock, laser stability) and unmodelled environmental effects (e.g., ocean loading, barometer, polar motion), whereas the setup error σSETUP accounts for variations in the instrumental configuration during installation (e.g., vertical alignment) or different floor couplings. We adopted the default values given in the “g9” software for σSYS and σSETUP. Regarding σFG5S for the use of different gravimeters, we followed Van Camp et al. (2016) and added 1.6 µGal to the error budget. The last term σTIE was determined in Sect. 5.1. As a result, our estimates of σTOT appear somewhat conservative (median of nearly 2.5 µGal), that is, slightly larger than the 2 µGal reported by the FG5 manufacturer.
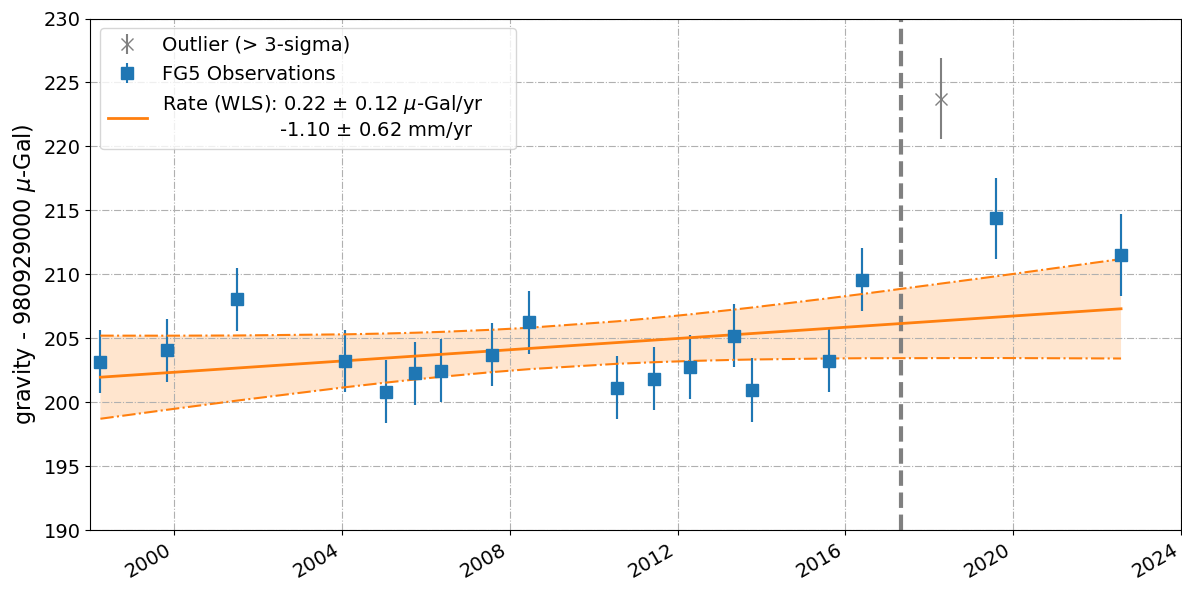
Figure 6Absolute gravity time series for Brest reduced to the common reference height of 1.22 m above Ref01 floor marker. Error bars are 1σ (68 % C.I.). Also shown are the weighted least-squares (WLS) fit to the data with a shaded orange area indicating the 95 % confidence area for the fitted values.
According to Van Camp et al. (2005), it takes around 25 years of annual observation campaigns to estimate a long-term trend in absolute gravity with an accuracy of 0.1 µGal yr−1. Our estimate of 0.22±0.12 µGal yr−1 over 1998–2022 is thus consistent with the literature. The trend was computed using a weighted least-squares fit, with weights based on the variances of the individual data points, under the assumption that the measurement errors are normally distributed and statistically independent from one another (i.e., a white noise process). To convert the gravity rate of change into vertical velocity, we applied the ratio of −0.2 µGal mm−1 adopted by Williams et al. (2001) or Teferle et al. (2009), where the physical process of deformation remains unknown. Depending on the deformation process, ratios between −0.1 and −0.26 µGal mm−1 have been reported (e.g., Wahr et al., 1995; Vey et al., 2002; De Linage et al., 2007). Using −0.2 µGal mm−1 results in a vertical velocity of −1.10 ± 0.62 mm yr−1 indicating subsidence at the Brest station.
5.2.2 Comparison with GNSS estimates
Figure 7 shows how our gravity estimate of vertical velocity compares with independent estimates from GNSS measurements at Brest obtained by groups using a data reanalysis strategy in agreement with the lastest standards of the International GNSS service (IGS, http://acc.igs.org/repro3/repro3.html, last access: April 2025). Namely, Fig. 7 displays the vertical velocities from the GNSS solutions designated as JPL (Heflin et al., 2020), NGL (Blewitt et al., 2018), ULR (Gravelle et al., 2023) and EOST (Michel et al., 2021). All these GNSS vertical velocities are expressed in the ITRF2014 reference frame (Altamimi et al., 2016) over nearly the same period as the absolute gravity data starting in October 1998.
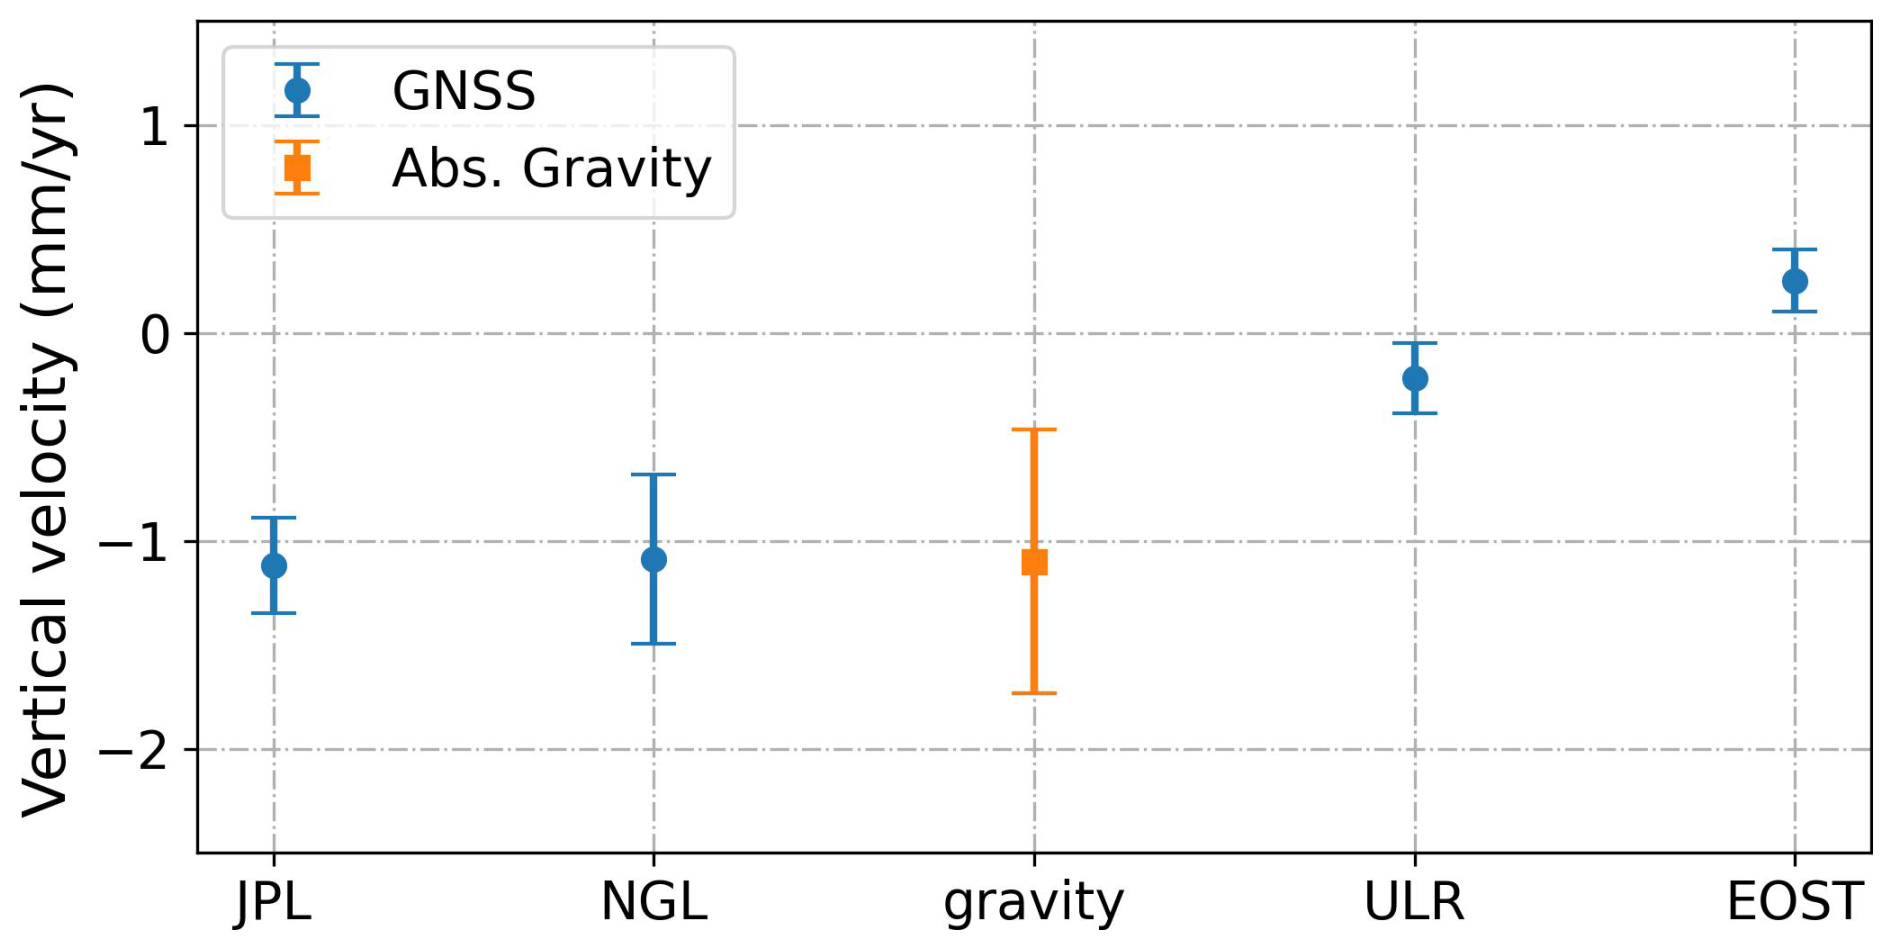
Figure 7Estimates of vertical land motion (VLM) at Brest using different data sets: gravity (this study) or GNSS (solutions from various groups, see text). Error-bars are 1σ (68 % C.I.).
Table 2Estimates of vertical land motion (VLM) at Brest using different data sets: gravity (this study) or GNSS (solutions from various groups, see text). Error-bars are 1σ (68 % C.I.). Unit is mm yr−1.
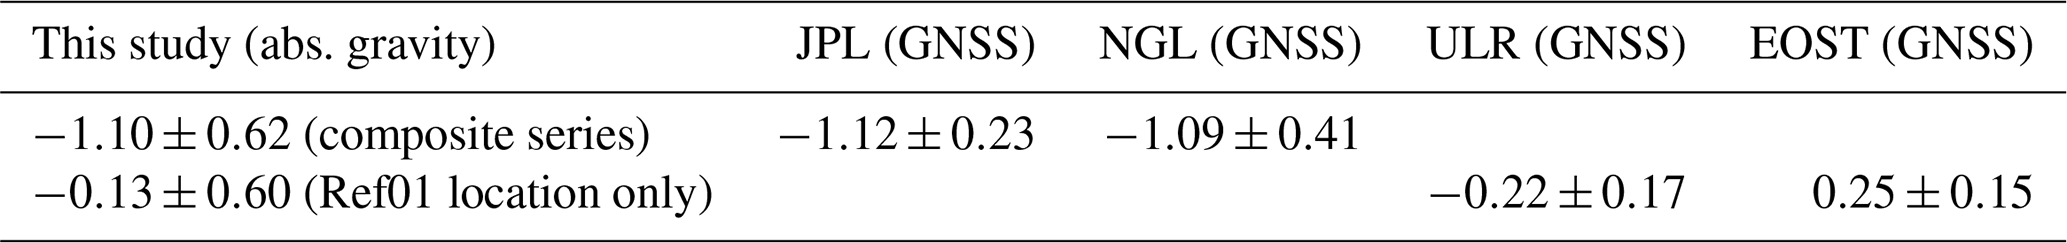
It is worth noting the relatively large scatter (beyond the 1σ error bars) of the GNSS velocity estimates displayed in Fig. 7. Ballu et al. (2019) also noted a similar situation from as many as ten high-quality GNSS reanalyses complying with the latest IGS standards. The authors discussed possible origins to be found in the major GNSS processing steps. Nonetheless, our “best” gravity estimate of vertical velocity is in excellent agreement with the GNSS velocities from JPL and NGL, and still in agreement with EOST and ULR, if a 95 % confidence interval (C.I.) is considered. Note, however, that this conclusion reverts if the trend analysis is restricted to the data measured at the Ref01 location (Table 2). Table 2 explicitly illustrates the impact of the relocation: the first row (composite series including Ref01 and Ref02 gravity values) yields a statistically significant subsidence, whereas the second row (Ref01 only) does not. This highlights that the trend estimate is sensitive to the treatment of the “jump”, and justifies making the full dataset available so users may apply their own selection criteria and analysis approaches.
Even though we have done our best in the gravity data processing, data analyst choices within the state-of-the-art that can yield statistically different results. These could be of interest to advance in the data processing strategies, gravity or GNSS (e.g., identify which solutions are the closest to accurately estimate the true vertical land motion at Brest, and what data analysis aspects cause the differences). Such issues motivated the writing of this data paper and sharing the Brest gravity data, in addition to recommend the time series extension with annual field campaigns of absolute gravity measurements (best if no year is missed and same season is chosen, e.g. Francis, 2023).
The research data of absolute gravity values presented in this work and related metadata can be accessed from the public data repository of the French hydrographic agency Shom as “Absolute gravity measurements at Brest (France) between 1998 and 2022” (https://doi.org/10.17183/DATASET_GRAVI_BREST; Lalancette et al., 2024).
The software code “g9” used in this work is available from the manufacturer Micro-g LaCoste (2012), whereas the ETERNA software (Wenzel, 1996) can be accessed from https://publikationen.bibliothek.kit.edu/1000151532 (last access: September 2025, https://doi.org/10.35097/746, Wenzel, 2022). Some of the Figures in this manuscript were produced using the Generic Mapping Tools that can be obtained from http://www.soest.hawaii.edu/gmt (last access: April 2025; Wessel et al., 2013).
Significant experience has been gained since the first absolute gravity measurement campaign in 1998, accompanied by substantial efforts to eliminate or mitigate sources of systematic error. As a result, an exceptionally long time series of 20 absolute gravity measurements spanning 25 years has been established in Brest, France. This dataset likely meets the precision required to detect vertical land motion at the level of one-tenth of a microgal per year, as outlined in the reviews by Carter et al. (1989) and Baker (1993). However, several questions remain to be addressed to fully establish the role of absolute gravity in determining local sea level at the Brest site and its contribution to global sea level monitoring programmes (IOC, 2012).
Extending the observation time series will be decisive for reducing the uncertainty in the rate estimate, as well as for the continued monitoring of vertical land motion, especially in the context of the site relocation that occurred in 2018 (Sect. 2). Future gravity measurement programmes should ensure the absence of unexpected systematic errors. Additionally, the inability of effectively correct for local hydrological effects highlights the need for an investigation of the local hydrogeological context, as well as the deployment of in situ instrumentation for groundwater monitoring, which could provide novel and valuable insights.
A final remark follows from Van Camp et al. (2005), who emphasized that absolute gravity data are inherently absolute and, unlike GNSS and other space geodetic techniques, are independent of any reference frame. Consequently, these measurements remain usable over long timescales and serve as a crucial, entirely independent validation of vertical land motion estimates derived from GNSS. Such estimates may be subject to systematic errors, for instance, those arising from alignment and realization of the International Terrestrial Reference Frame.
The supplement related to this article is available online at https://doi.org/10.5194/essd-17-5859-2025-supplement.
The study was devised by MFL and GW, SL processed the absolute gravity data. GW analysed the GNSS results and carried out the comparisons. GW and SL produced the illustrations. All authors contributed to the discussion of the results and/or actively participated in the field campaigns. The first draft was written by GW interacting with MFL and SL; the remainder authors contributed to the final version of the manuscript.
The contact author has declared that none of the authors has any competing interests.
Publisher's note: Copernicus Publications remains neutral with regard to jurisdictional claims made in the text, published maps, institutional affiliations, or any other geographical representation in this paper. While Copernicus Publications makes every effort to include appropriate place names, the final responsibility lies with the authors. Views expressed in the text are those of the authors and do not necessarily reflect the views of the publisher.
The gravity measurements were carried out with instruments (FG5#206 and FG5#228) of the Parc d'Instruments National PGravi of CNRS-INSU with the support of the Action Spécifique Gravimétrie of Epos-Fr within the framework of the Service National d'Observation Gravimétrie of CNRS-INSU (Merlet et al., 2024; https://doi.org/10.1109/MIM.2024.10654723). Maps were generated using the Generic Mapping Tools version 5.4.1 (Wessel et al., 2013) obtained from http://www.soest.hawaii.edu/gmt (last access: April 2025). Earth and ocean tidal corrections were computed with ETERNA (Wenzel, 1996). Ludger Timmen and Hartmut Wziontek provided helpful review comments, which are gratefully acknowledged.
This research has been supported by the ANR project ROYMAGE (grant no. ANR-20-CE47-0006), as well as the GRGS (CNES) and the SONEL scientific observation service of the Research Infrastructure for coastal ocean observation (IR-ILICO).
This paper was edited by Benjamin Männel and reviewed by Ludger Timmen and Hartmut Wziontek.
Altamimi, Z., Rebischung, P., Métivier, L., and Collilieux, X.: ITRF2014: A new release of the Inernational Terrestrial Reference Frame modelling nonlinear station motions, J. Geophys. Res.: Solid Earth, 121, 6109–6131, 2016.
Amalvict, M., Willis, P., Wöppelmann, G., Ivins, E. R., Bouin, M.-N., Testut, L., and Hinderer, J.: Isostatic stability of the East Antartic station Dumont d'Urville from long-term geodetic observations and geophysical models, Polar Research, 28, 193–202, 2009.
Baker, T. F.: Absolute sea level measurements, climate change and vertical crustal movements, Global Planet. Change, 8, 149–159, 1993.
Ballu, V., Gravelle, M., Wöppelmann, G., de Viron, O., Rebischung, P., Becker, M., and Sakic, P.: Vertical land motion in the Southwest and Central Pacific from available GNSS solutions and implications for relative sea levels, Geophys. J. Int., 218, 1537–1551, https://doi.org/10.1093/gji/ggz247, 2019.
Blewitt, G., Altamimi, Z., Davis, J., Gross, R., Kuo, C.-Y., Lemoine, F. G., Moore, A. W., Neilan, R. E., Plag, H.-P., Rothacher, M., Shum, C. K., Sideris, M. G., Schöne, T., Tregoning, P., and Zerbini, S.: Geodetic observations and global reference frame contributions to understanding sea-level rise and variability, in: Understanding sea-level rise and variability, edited by: Church, J. A., Woodworth, P. L., Aarup, T., and Wilson, W. S., 256–284, London, Wiley-Blackwell, https://doi.org/10.1002/9781444323276.ch9, 2010.
Blewitt, G., Hammond, W. C., and Kreemer, C.: Harnessing the GPS data explosion for interdisciplinary science, Eos, 99, 1–2, https://doi.org/10.1029/2018EO104623, 2018.
Boy, J.-P.: Analyse de marées des series CG3M à l'EPSHOM (20030728–20041027), Shom, Internal Report, 16 Januay 2006, 2 pp., 2006.
Cagnard, F.: Carte géologique harmonisée du département du Finistère, BRGM: RP-56273 – FR, 435 pp., 12 fig., 2 tab. 3 pl. hors-texte, 2008.
Carter, W. E. (Ed.): Report of the surrey workshop of the IAPSO tide gauge benchmark fixing committee, Report of a meeting held 13–15 December 1993 at the Inst. of Oceanog. Sci., Deacon Lab., NOAA Tech. Rep., NOSOES0006, 1994.
Carter, W. E., Aubrey, D. G., Baker, T., Boucher, C., Le Provost, C., Pugh, D., Peltier, W. R., Zumberge, M., Rapp, R. H., Schutz, R. E., Emery, K. O., and Enfield, D. B.: Geodetic fixing of tide gauge bench marks, Whoods Hole Oceanographic Institution Technical Report, WHO-89-31, 1989.
Dehant, V., Defraigne, P., and Wahr, J. M.: Tides for a convective Earth, J. Geophys. Res., 104, 1035–1058, https://doi.org/10.1029/1998JB900051, 1999.
De Linage, C., Hinderer, J., and Rogister, Y.: A search for the ratio between gravity variation and vertical displacement due to a surface load, Geophys. J. Int., 171, 986–994, https://doi.org/10.1111/j.1365-246X.2007.03613.x, 2007.
De Viron, O., Van Camp, M., and Francis, O.: Revisiting absolute gravimeter intercomparisons, Metrologia, 48, 290–298, 2011.
Emery, K. O. and Aubrey, D. G.: Sea Levels, Land Levels, and Tide Gauges, New York, Springer, https://doi.org/10.1007/978-1-4613-9101-2, 1991.
Faller, J. E.: Thirty years of progress in absolute gravimetry: a scientific capability implemented by technological advances, Metrologia, 39, 425–428, 2002.
Francis, O.: Long time series of absolute gravity measurements in Kulusuk, southeast Greenland, Geoscience Data Journal, 10, 485–488, https://doi.org/10.1002/gdj3.183, 2023.
Francis, O. and van Dam, T. M.: Processing of the Absolute data of the ICAG01, Cahiers du Centre Européen de Géodynamique et de Séismologie, 22, 45–48, 2003.
Gravelle, M., Wöppelmann, G., Gobron, K., Altamimi, Z., Guichard, M., Herring, T., and Rebischung, P.: The ULR-repro3 GPS data reanalysis and its estimates of vertical land motion at tide gauges for sea level science, Earth Syst. Sci. Data, 15, 497–509, https://doi.org/10.5194/essd-15-497-2023, 2023.
Hamlington, B. D., Gardner, A. S., Ivins, E., Lenaerts, J. T. M., Reager, J. T., Trossman, D. S., Zaron, E. D., Adhikari, S., Arendt, A., Aschwanden, A., Beckley, B. D., Bekaert, D. P. S., Blewitt, G., Caron, L., Chambers, D. P., Chandanpurkar, H. A., Christianson, K., Csatho, B., Cullather, R. I., DeConto, R. M., Fasullo, J. T., Frederikse, T., Freymueller, J. T., Gilford, D. M., Girotto, M., Hammond, W. C., Hock, R., Holschuh, N., Kopp, R. E., Landerer, F., Larour, E., Menemenlis, D., Merrifield, M., Mitrovica, J. X., Nerem, R. S., Nias, I. J., Nieves, V., Nowicki, S., Pangaluru, K., Piecuch, C. G., Ray, R. D., Rounce, D. R., Schlegel, N.‐J., Seroussi, H., Shirzaei, M., Sweet, W. V., Velicogna, I., Vinogradova, N., Wahl, T., Wiese, D. N., and Willis, M. J.: Understanding of contemporary regional sea-level change and the implications for the future, Rev. Geophys., 58, e2019RG000672, https://doi.org/10.1029/2019RG000672, 2020.
Heflin, M., Donnellan, A., Parker, J., Lyzenga, G., Moore, A., Ludwig, L. G., Rundle, J., Wang, J., and Pierce M.: Automated estimation and tools to extract positions, velocities, breaks, and seasonal terms from daily GNSS measurements: illuminating nonlinear Salton Trough deformation, Earth and Space Science, 7, e2019EA000644, https://doi.org/10.1029/2019EA000644, 2020.
Hinderer, J. and Luck, B.: Mesures absolues de pesanteur à l'EPSHOM du 17 au 21 janvier 2005, Rapport de mesures EOST, EPSHOM, 9 pp., 2005.
Holgate, S. J., Matthews, A., Woodworth, P. L., Rickards, L. J., Tamisiea, M. E., Bradshaw, E., Foden, P. R., Gordon, K. M., Jevrejeva, S., and Pugh, J.: New data systems and products at the permanent service formean sea level, Journal of Coastal Research, 29, 493–504, 2013.
IOC: Global Sea-Level Observing System (GLOSS) Implementation Plan, IOC Tech. Ser., 100, 2012.
Lalancette, M.-F., Lucas, S., and Wöppelmann, G.: Absolute gravity measurements at Brest (France) between 1998 and 2022, Shom [data set], https://doi.org/10.17183/DATASET_GRAVI_BREST, 2024.
Lambert, A., Courtier, N., and James, T. S.: Long-term monitoring by absolute gravimetry:tides to postglacial rebound, Journal of Geodynamics, 41, 307–317, 2006.
Lenôtre, N., Thierry, P., Blanchin, R., and Brochard, G.: Current vertical movement demonstrated by comparative levelling in Brittany (northwestern France), Tetonophysics, 301, 333–344, 1999.
Llubes, M., Florsch, N., Amalvict, M., Hinderer, J., Lalancette, M.-F., Orseau, D., and Simon B.: Gravimetric ocean loading observations: first experiment in Brittany, C.R. Acad. Sci. Paris, Ser. IIa 332, 77–82, 2001.
Lucas, S.: Note concernant la détermination des altitudes des repères gravimétriques au Shom, Note technique Shom, No. 17/2024/Shom/DOPS/STM/GEOPHY/NP, 4 pp., 2024.
Mazzotti, S., Lambert, A., Courtier, N., Nykolaishen, L., and Dragert, H.: Crustal uplift and sea level rise in northern Cascadia from GPS, absolute gravity, and tide gauge data, Geophys. Res. Lett., 34, L15306, https://doi.org/10.1029/2007GL030283, 2007.
Merlet, S., Le Moigne, N., Métivier, G. P., Bernard, J.-D., Little, F., Boy, J.-P., Rosat, S., Gabalda, G., Seoane, L., Bonvalot, S., Champollion, C., Mémin, A., Maia, M., and Charade, O.: French Gravimetry Organization and its Instrumental Park, IEEE Instrumentation & Measurement Magazine, 27, 24–31, https://doi.org/10.1109/MIM.2024.10654723, 2024.
Michel, A., Santamaria-Gomez, A., Boy, J.-P., Perosanz, F., and Loyer, S.: Analysis of GNSS displacements in Europe and their comparison with hydrological loading models, Remote Sensing, 13, 4523, https://doi.org/10.3390/rs13224523, 2021.
Micro-g Solutions Inc.: Operator's manual, FG5 absolute gravimeter, Erie, USA, 1999.
Micro-g LaCoste: g9 User's Manual, April 2012 version, Lafayette, Colorado, USA, 2012.
Neilan, R., Van Scoy, P. A., and Woodworth, P. L. (Eds.): Proceedings of the Workshop on Methods for Monitoring Sea Level: GPS and Tide Gauge Benchmark Monitoring and GPS Altimeter Calibration, Workshop organised by the IGS and PSMSL, Jet Propul. Lab., Pasadena, Calif., 1998.
Niebauer, T. M.: Gravimetric methods – Absolute and relative gravity meter: Instruments concepts and implementation, in: Treatise on Geophysics, 37–57, Amsterdam, Elsevier, https://doi.org/10.1016/B978-0-444-53802-4.00057-9, 2015.
Niebauer, T. M., Sasegawa, G. S., Faller, J. E., Hilt, R., and Klopping, F.: A new generation of absolute gravimeters, Metrologia, 32, 159–180, 1995.
Poitevin, C., Wöppelmann, G., Raucoules, D., Le Cozannet, G., Marcos, M., and Testut, L.: Vertical land motion and relative sea level changes along the coastline of Brest (France) from combined space-borne geodetic methods, Remote Sens. Environ., 222, 275–285, https://doi.org/10.1016/j.rse.2018.12.035, 2019.
Pálinkáš, V., Kostelecky, J., and Simek, J.: A feasability of absolute gravity measurements in geodynamics, Acta Geodyn. Geomater., 7, 61–69, 2010.
Pálinkáš, V., Liard, J., and Jiang, Z.: On the effective position of the free-fall solution and the self-attraction effect of the FG5 gravimeters, Metrologia, 49, 552–559, 2012.
Pálinkáš, V., Wziontek, H., and Val'ko, M.: Evaluation of comparisons of absolute gravimeters using correlated quantities: reprocessing and analyses of recent comparisons, J. Geod., 95, 21, https://doi.org/10.1007/s00190-020-01435-y, 2021.
Pugh, D. T. and Woodworth, P. L.: Sea-level science: Understanding tides, tsunamis, and mean sea-level changes, Cambridge, Cambridge University Press, ISBN 978-1-107-02819-7, 2014.
Shennan, I. and Horton, B.: Holocene land- and sea-level changes in Great Britain, J. Quaternary Sci., 17, 511–526, 2002.
Shom: Réalisation et calcul d'un rattachement gravimétrique, Note technique Shom du 14/06/2016, DOPS/HOM/CFuD, Shom, 32 pp., 2016.
Shom: Réalisation et calcul d'un gradient vertical de pesanteur, Note technique Shom du 18/01/2018, DOPS/HOM/GEOPHY, Shom, 45 pp., 2018.
Tamisiea, M. E.: Ongoing glacial isostatic contributions to observations of sea level change, Geophysical Journal International, 186, 1036–1044, 2011.
Teferle, F. N., Bingley, R. M., Orliac, E. J., Williams, S. D. P., Woodworth, P. L., McLaughlin, D., Baker, T. F., Shennan, I., Milne, G. A., Bradley, S. L., and Hansen, D. N.: Crustal motions in Great Britain: evidence from continuous GPS, absolute gravity and Holocene sea level data, Geophy. J. Int., 178, 23–46, https://doi.org/10.1111/j.1365-246X.2009.04185.x, 2009.
Timmen, L.: Precise definition of the effective measurement height of free-fall absolute gravimeters. Metrologia, 40, 62–65, 2003.
Van Camp, M., Williams, S. D. P., and Francis, O.: Uncertainty of absolute gravity measurements, J. Geophys. Res., 110, B05406, https://doi.org/10.1029/2004JB003497, 2005.
Van Camp, M., de Viron, O., and Avouac, J.-P.: Separating climate-induced mass transfers and instrumental effects from tectonic signal in repeated absolute gravity measurements: Uncertainty of absolute gravity data, Geophys. Res. Lett., 43, 4313–4320, https://doi.org/10.1002/2016GL068648, 2016.
Van Camp, M., de Viron, O., Watlet, A., Meurers, B., Francis, O., and Caudron, C.: Geophysics from terrestrial time-variable gravity measurements, Rev. Geophys., 55, 938–992, https://doi.org/10.1002/2017RG000566, 2017.
Vey, S., Calais, E., Llubes, M., Florsch, N., Woppelmann, G. Hinderer, J., Amalvict, M., Lalancette, M. F., Simon, B., Duquenne, F., and Haase, J. S.: GPS measurements of ocean loading and its impact on zenith tropospheric delay estimates: a case study in Brittany, France, J. Geodesy, 76, 419–427, 2002.
Wahr, J., Dazhong, H., and Turpin, A.: Predictions of vertical uplift caused by changing Polar ice volumes on a viscoelastic earth, Geophys. Res. Lett., 22, 977–980, 1995.
Wenzel, H. G.: The nanogal software: Earth tide data processing package ETERNA 3.30, Bull. Inf. Marges Terrestres, 124, 9425–9439, 1996.
Wenzel, H.-G.: Eterna – Programs for tidal analysis and prediction, Karlsruhe Institute of Technology [code], https://doi.org/10.35097/746, 2022.
Wessel, P., Smith, W. H. F., Scharroo, R., Luis, J., and Wobbe, F.: Generic Mapping Tools: Improved version released, Eos, Transactions American Geophysical Union, 94, 409–410, https://doi.org/10.1002/2013EO450001, 2013.
Williams, S. D. P., Baker, T. F., and Jeffries, G.: Absolute gravity measurements at UK tide gauges, Geophys. Res. Lett., 28, 2317–2320, https://doi.org/10.1029/2000GL012438, 2001.
Wöppelmann, G. and Marcos, M.: Vertical land motion as a key to understanding sea level change and variability, Rev. Geophys., 54, 64–92, 2016.
Wöppelmann, G., Pouvreau, N., and Simon, B.: Brest sea level record: a time series construction back to the early eighteenth century, Ocean Dynamics, 56, 487–497, 2006.
Wöppelmann, G., Pouvreau, N., Coulomb, A., Simon, B., and Woodworth, P. L.: Tide gauge datum continuity at Brest since 1711: France's longest sea-level record, Geophys. Res. Lett., 35, L22605, https://doi.org/10.1029/2008GL035783, 2008.
Wziontek, H., Bonvalot, S., Falk, R., Gabalda, G., Mäkinen, J., Palinkas, V., Rülke, A., and Vitushkin, L.: Status of the International Gravity Reference System and Frame, J. Geodesy, 95, 7, https://doi.org/10.1007/s00190-020-01438-9, 2021.
Zerbini, S., Plag, H.-P., Baker, T., Becker, M., Billiris, H., Bürki, B., Kahle, H.-G., Marson, I., Pezzoli, L., Richter, B., Romagnoli, C., Sztobryn, M., Tomasi, P., Tsimplis, M., Veis, G., and Verrone, G.: Sea level in the Mediterranean: A first step towards separating crustal movements and absolute sea-level variations, Global Planet. Change, 14, 1–48, 1996.