the Creative Commons Attribution 4.0 License.
the Creative Commons Attribution 4.0 License.
 | 04 Nov 2025
Countrywide digital surface models and vegetation height models from historical aerial images
Livia Piermattei
Lars T. Waser
Christian Ginzler
Historical aerial images, captured by film cameras in the previous century, are valuable resources for quantifying Earth's surface and landscape changes over time. In the post-war period, these images were often acquired to create topographic maps, resulting in the acquisition of large-scale aerial photographs with stereo coverage. Photogrammetric techniques applied to these stereo images enable the extraction of 3D information to reconstruct digital surface models (DSMs) and orthoimages.
Here, we present a highly automated photogrammetric approach for generating countrywide DSMs of Switzerland, at a 1 m resolution, from approximately 32 000 scanned aerial stereo images acquired between 1979 and 2006, with known exterior and interior orientation. We derived four countrywide DSMs for the epochs 1979–1985, 1985–1991, 1991–1998, and 1998–2006. From the DSMs, we generated corresponding countrywide vegetation height models (VHMs). We assessed the quality of the historical DSMs at the country scale and within six representative study sites, evaluating the vertical accuracy and the completeness of image matching across different land cover types.
Mean completeness ranged from 64 % for “glacial and perpetual snow” to 98 % for “sealed surfaces”, with a value of 93 % for the “closed forest” class. Across Switzerland, the median elevation accuracy of the historical DSMs compared with a reference digital terrain model (DTM) on sealed surface points ranged from 0.08 to 0.16 m, with a normalized median absolute deviation (NMAD) of around 0.8 m and a maximum root mean square error (RMSE) of 1.20 m. Similar accuracies are obtained when comparing historical DSMs with measured geodetic points.
The VHMs generated in this study enabled the detection of major changes in forest areas due to windstorm damage, forest dynamics, and growth. This work demonstrates the feasibility of generating accurate, very-high-resolution DSM time series (spanning three decades) and VHMs from historical aerial images of the entire surface of Switzerland in a highly automated manner. The VHMs are already being used to estimate countrywide biomass changes. The countrywide DSMs and VHMs for the four epochs, along with auxiliary data, are available online at https://doi.org/10.16904/envidat.528 (Marty et al., 2024) and can be used to quantify long-term elevation changes and related processes across different surfaces.
- Article
(18108 KB) - Full-text XML
- BibTeX
- EndNote


Photographs taken by film cameras on aeroplanes throughout the last century represent a unique and invaluable information source for quantifying past changes in the Earth's surface and landscape. Various institutions and mapping agencies have recognized this value by preserving and scanning these photographs and making them publicly available.
After the Second World War, large-scale aerial photographs were frequently taken to create topographic maps. To ensure stereoscopic coverage and enable the extraction of three-dimensional (3D) information, image blocks were acquired in parallel strips, with each photograph overlapping the next along the same flight line (forming a stereo pair). Due to the stereoscopic acquisition and very high resolution of these images, digital surface models (DSMs) and orthoimages at a metric or sub-metric resolution can be generated using digital photogrammetry and computer vision techniques. This capability has led to the use of historical aerial images to assess long-term surface elevation changes across various geoscience fields.
Multi-temporal DSMs derived from historical aerial images have frequently been used in cryospheric research for assessments of changes in glacier elevation (e.g. Magnússon et al., 2016; Belart et al., 2020; Denzinger et al., 2021), in periglacial studies (e.g. Cusicanqui et al., 2021; Fleischer et al., 2021), in geomorphology (e.g. Micheletti et al., 2015; Piermattei et al., 2023; Schwat et al., 2023), in volcanology (e.g. Gomez et al., 2015), in analyses of land use change (e.g. Nebiker et al., 2014; Bolles and Forman, 2018), and in archaeology (e.g. Risbøl et al., 2015; Peppa et al., 2018). Most studies have been focused on local scales and have involved processing a small set of scanned aerial images, with a few considering larger scales (Geyman et al., 2022; Muhammed et al., 2023) or even regional scales such as Greenland (Korsgaard et al., 2016).
In this study, we generated countrywide DSMs of Switzerland using historical aerial images acquired from the 1980s to the early 2000s. Additionally, as we carried out the study within the framework of the Swiss National Forest Inventory (NFI), we produced corresponding countrywide vegetation height models (VHMs). The Swiss NFI aims to collect objective information on forests at the national level for scientific, political, social, and economic purposes (Abegg et al., 2023). Data collection within the context of the NFI is mainly based on a systematic terrestrial sample inventory, which is intended to provide results for Switzerland as a whole, as well as for larger regions and individual cantons. Since the early days of the NFI, aerial image interpretation and remote sensing data have been used. Over the decades, the image data have evolved from analogue black-and-white images to digital RGB true-colour aerial images and finally to the digital colour infrared (CIR) sensor data used today. In addition to the application of stereo-image-based analysis on various sample grids, comprehensive datasets have been developed and produced.
The use of historical aerial images for 3D forest reconstruction is limited, with most studies focused on 2D changes in tree and canopy cover at local scales using orthoimages (e.g. Kadmon and Harari-Kremer, 1999; Morgan and Gergel, 2010; Kulha et al., 2018) and texture analysis (Hudak and Wessman, 1998; Kupidura et al., 2019). In central Switzerland, Waser et al. (2008a, b) used scanned colour infrared aerial images to generate DSMs and quantify tree/shrub cover changes between 1997 and 2002. Recent research has focused on methods based on artificial intelligence (AI) to extract information on woody vegetation along alpine treeline ecotones, tree cover (Wang et al., 2022), and forest cover (Hufkens et al., 2020) from historical aerial orthoimages. The study by Véga and St-Onge (2008) was among the first where forest canopy growth was quantified using DSM time series from historical aerial images. As changes in the height of forest canopies over time represent a key aspect of forest dynamics, further studies have been conducted to explore the use of historical images for tracking long-term changes in canopy height (Nurminen et al., 2015; Bożek et al., 2019; Hufkens et al., 2020) and forest stand age (Vastaranta et al., 2016) and for describing the evolution of forest successional stages in tropical forests (Berveglieri et al., 2016, 2018).
Here, we present a highly automated approach to process scanned aerial images (hereafter referred to as “historical aerial images”) for generating countrywide DSMs and VHMs in Switzerland. Expanding on the work by Heisig and Simmen (2021), who generated a single countrywide orthoimage of Switzerland from images taken between 1985 and 1991, we processed all scanned images available from swisstopo, the Swiss Federal Office of Topography (swisstopo, 2024a), acquired over Switzerland between 1979 and 2006. Countrywide coverage was obtained using image acquisition intervals of approximately 7 years, leading to four countrywide DSM products for the epochs 1979–1985, 1985–1991, 1991–1998, and 1998–2006. To derive VHMs, we normalized the elevation values from the historical DSMs by subtracting the available countrywide digital terrain model (DTM; swissALTI3D version 2017, swisstopo, 2017). We assessed the quality of the generated DSMs by evaluating the completeness of the image-matching process across different land cover types and the vertical accuracy of the historical DSMs by comparing elevation values with (i) the reference DTM on sealed surface points, (ii) geodetic elevation points on a national scale, and (iii) manual stereoscopic elevation measurements from six representative study sites in Switzerland. We close the article by highlighting the potential applications of these datasets in research on forest dynamics and management.
2.1 Historical aerial stereo imagery of Switzerland and study site selection
DSMs and VHMs were generated from approximately 32 000 historical images acquired with an RC10 panchromatic aerial camera manufactured by Wild Heerbrugg (currently owned by Leica Geosystems, Heerbrugg, Switzerland). Multiple airborne campaigns were conducted from 1979 to 2006 covering the entire 41 285 km2 of Switzerland, with an elevation range between 197 and 4634 m a.s.l. Figure 1 shows the image footprints of the stereo pairs used to generate the DSMs, along with the corresponding year of acquisition and the total number of images per epoch. Each campaign spans approximately 7 years to cover the entire country. Image acquisition was guided by the 1:25 000 map sheet units (12×17.5 km) representing the topographic maps of Switzerland (swisstopo, 2024b). The first countrywide coverage was obtained from the acquisition campaign that took place between 1979 and 1985 (epoch 1), followed by subsequent campaigns from 1985 to 1991 (epoch 2), 1991 to 1998 (epoch 3), and 1998 to 2006 (epoch 4) (Fig. 1).
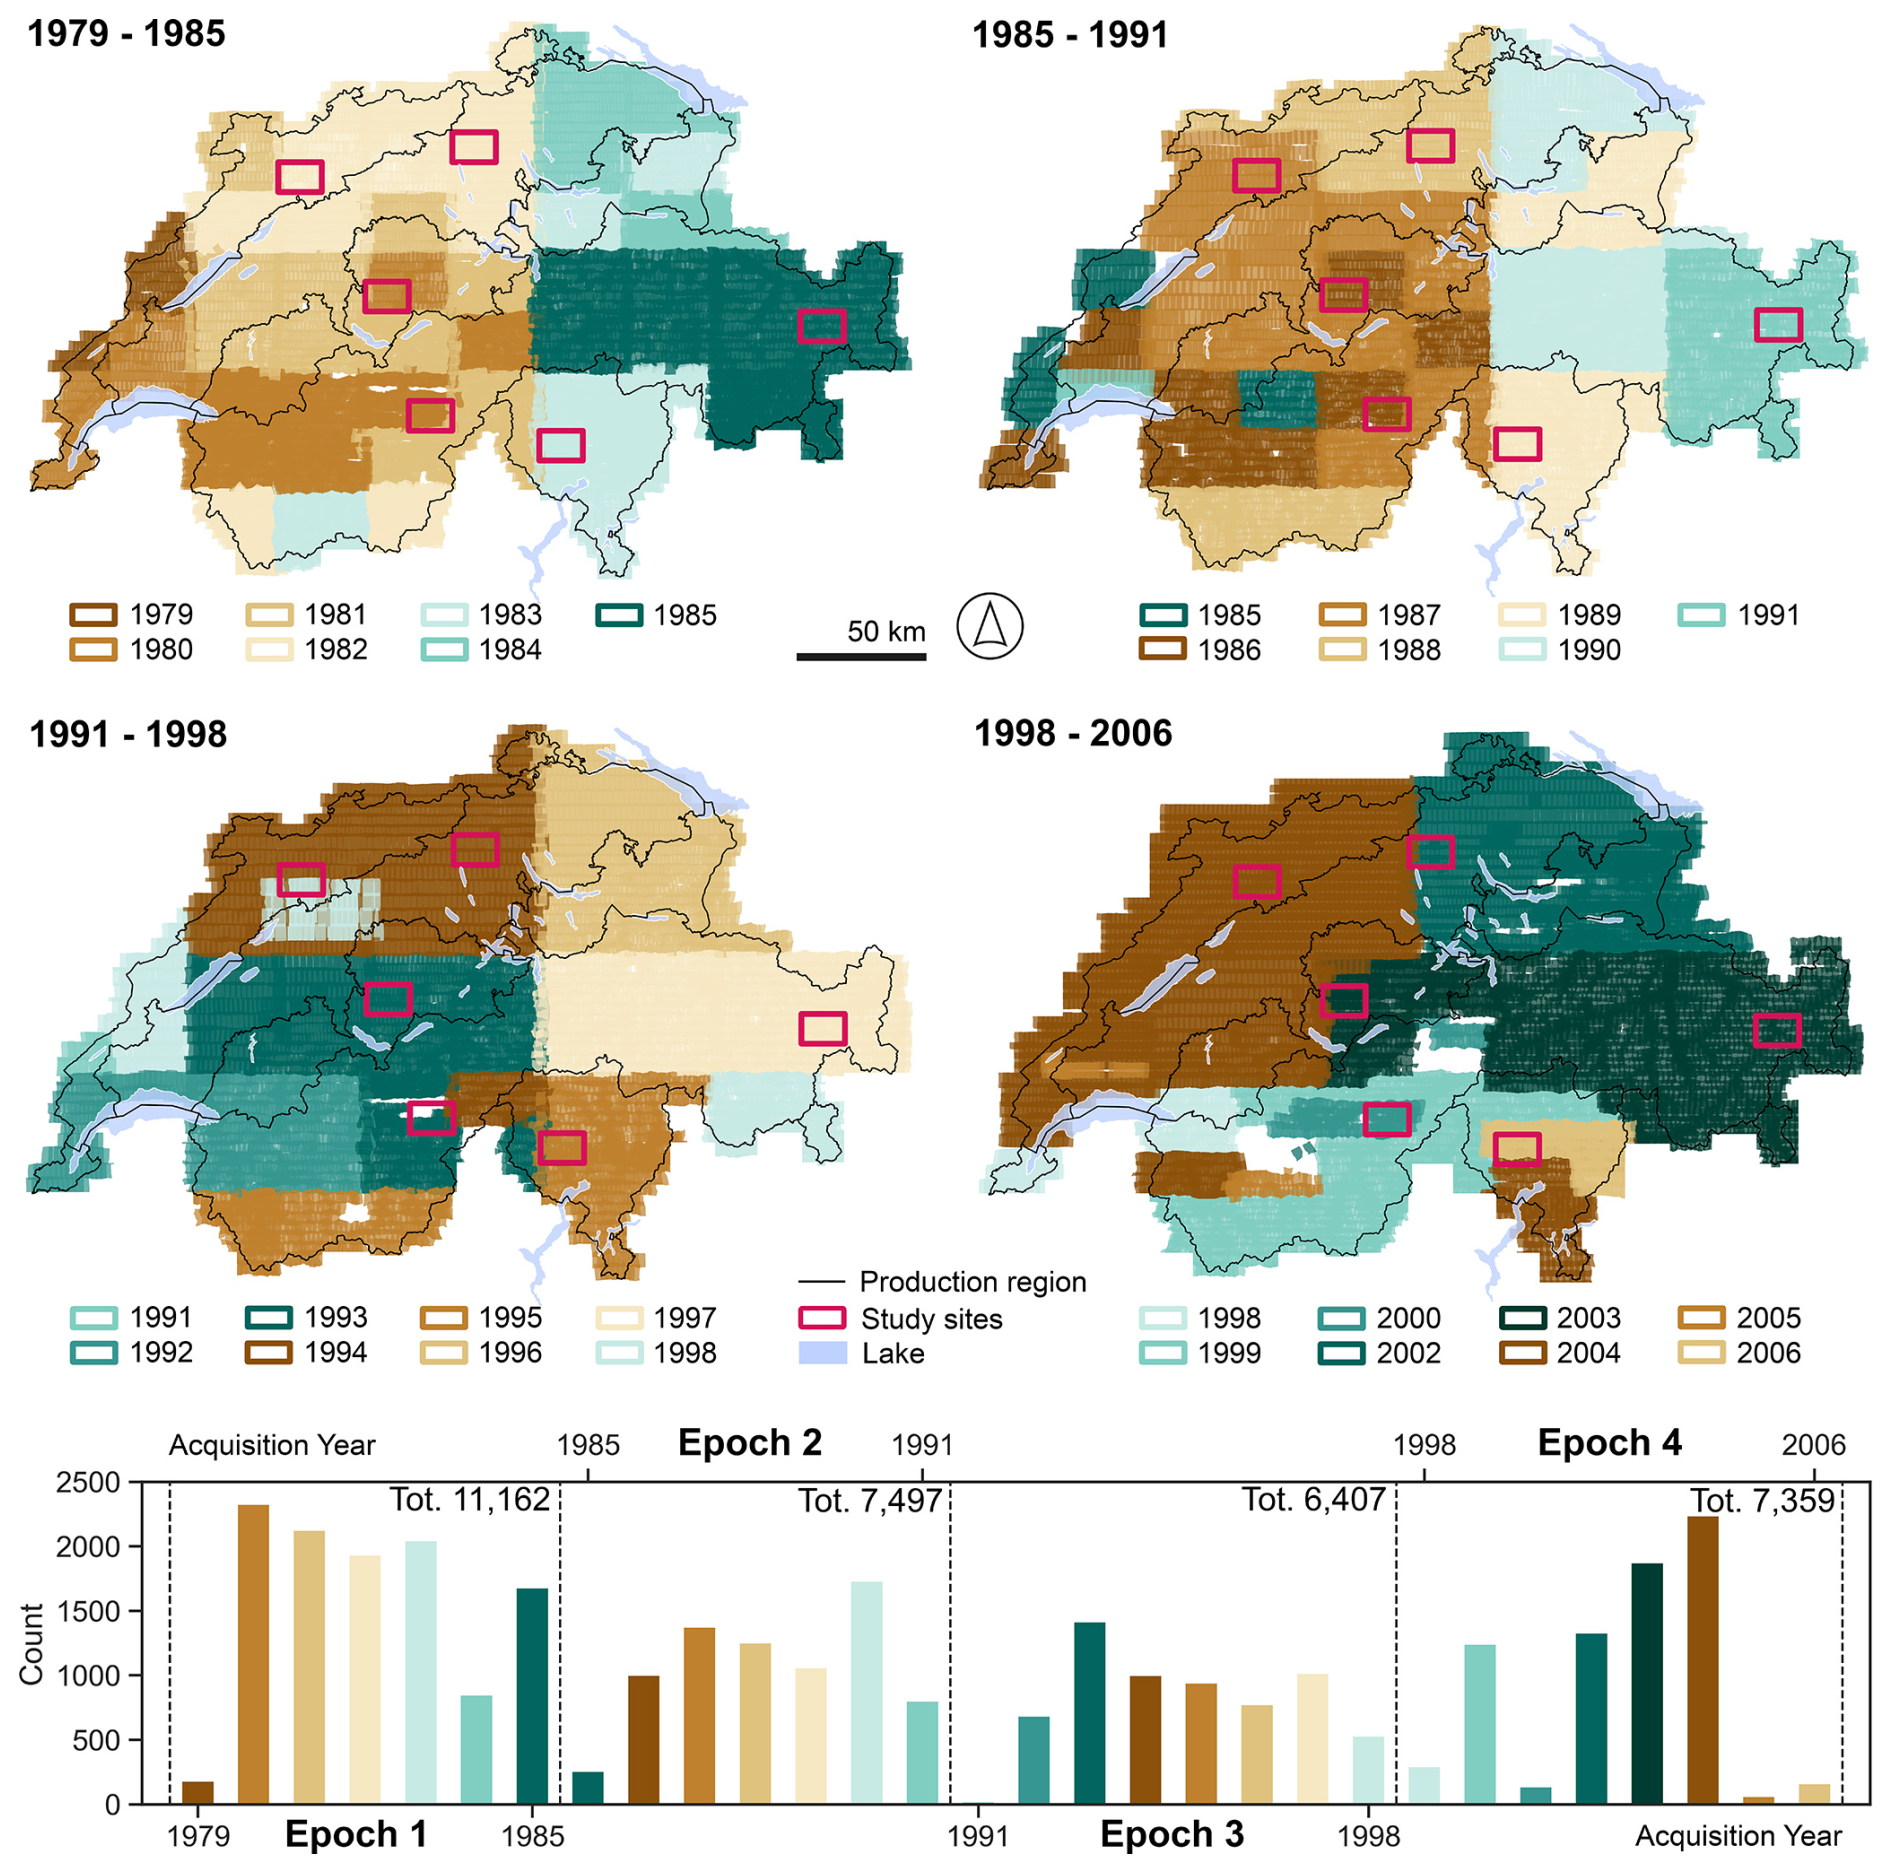
Figure 1Stereo footprint coverage over Switzerland for the four epochs and the number of images used for the respective digital surface model (DSM) generation (bar plot, bottom). There is an overlap of acquisition years between adjacent epochs, but images from the same year cover different forest production regions in each epoch.
The primary purpose of these photograph acquisitions was to update the topographic maps produced by swisstopo. The photographs were acquired with approximately 70 %–80 % front overlap and 30 %–40 % side overlap. The average flight height for all datasets was approximately 4000 m above the ground, with an image scale of about 1:25 000. The photographs were scanned with a resolution of 14 µm using a Leica DSW700 scanner (swisstopo). This resulted in an average ground sample distance (GSD) of around 0.35 m in the scanned images, with larger variations in high-elevation areas. Historical aerial images are freely available on swisstopo's website (swisstopo, 2024a) and are provided with exterior orientation parameters, as well as camera calibration protocols containing interior orientation parameters such as focal length and fiducial mark values.
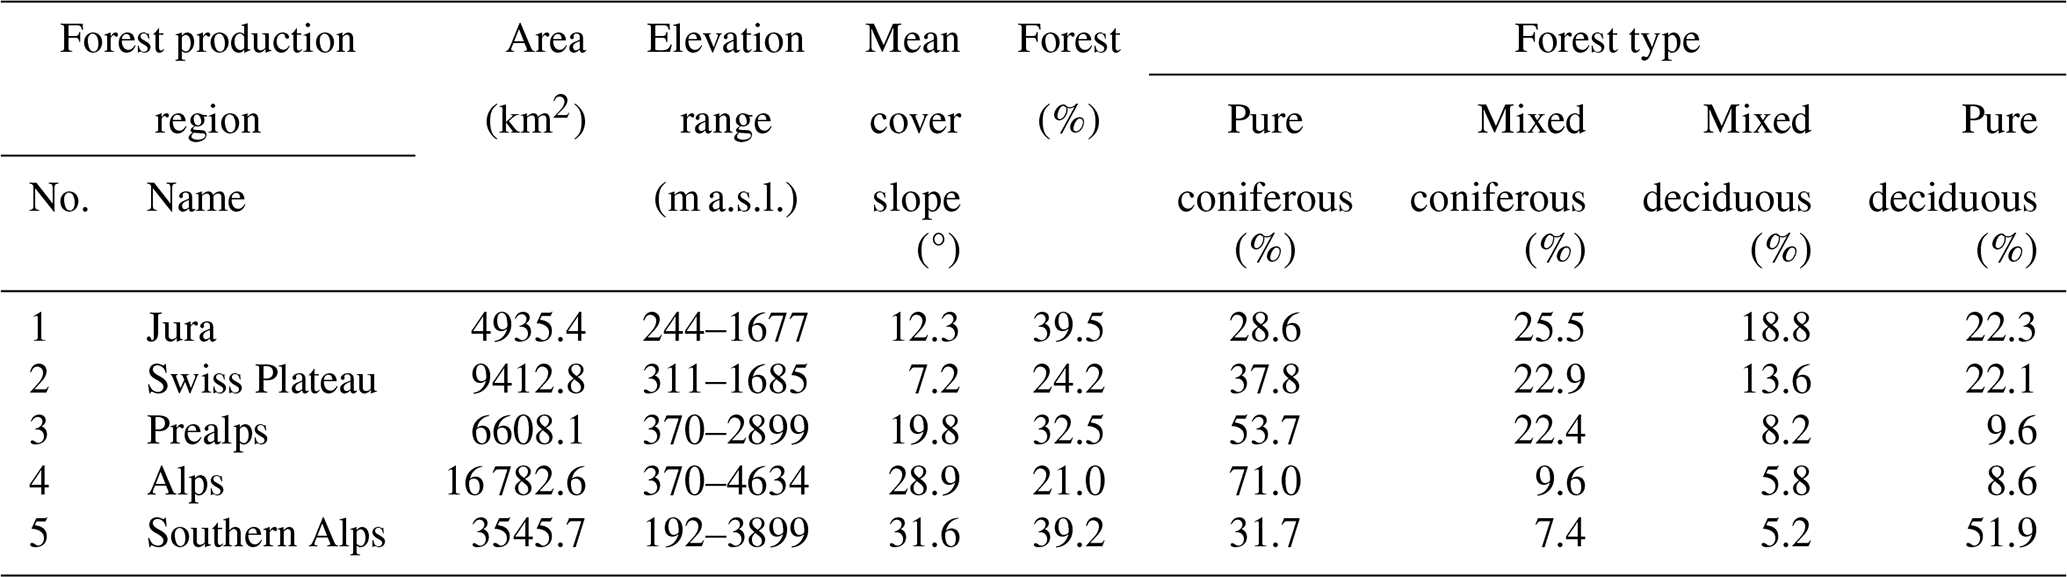
In the Swiss NFI, Switzerland is characterized by different types of landscapes and is divided into five main forest production regions: the Jura in the northwest (1), the Swiss Plateau (2), the Prealps (3) between the Swiss Plateau and the Alps, the Alps (4/4a), and the Southern Alps (5) (Fig. 2). These regions exhibit different climatic and topographic characteristics, such as land cover classes, elevation ranges, tree species, and forest structures (Table 1). Six representative study sites of approximately 210 km2 each (i.e. one map sheet) were selected within these regions (Fig. 2). In the Alps region, an additional study site encompassing the tongue of the Grosser Aletsch Glacier was included.
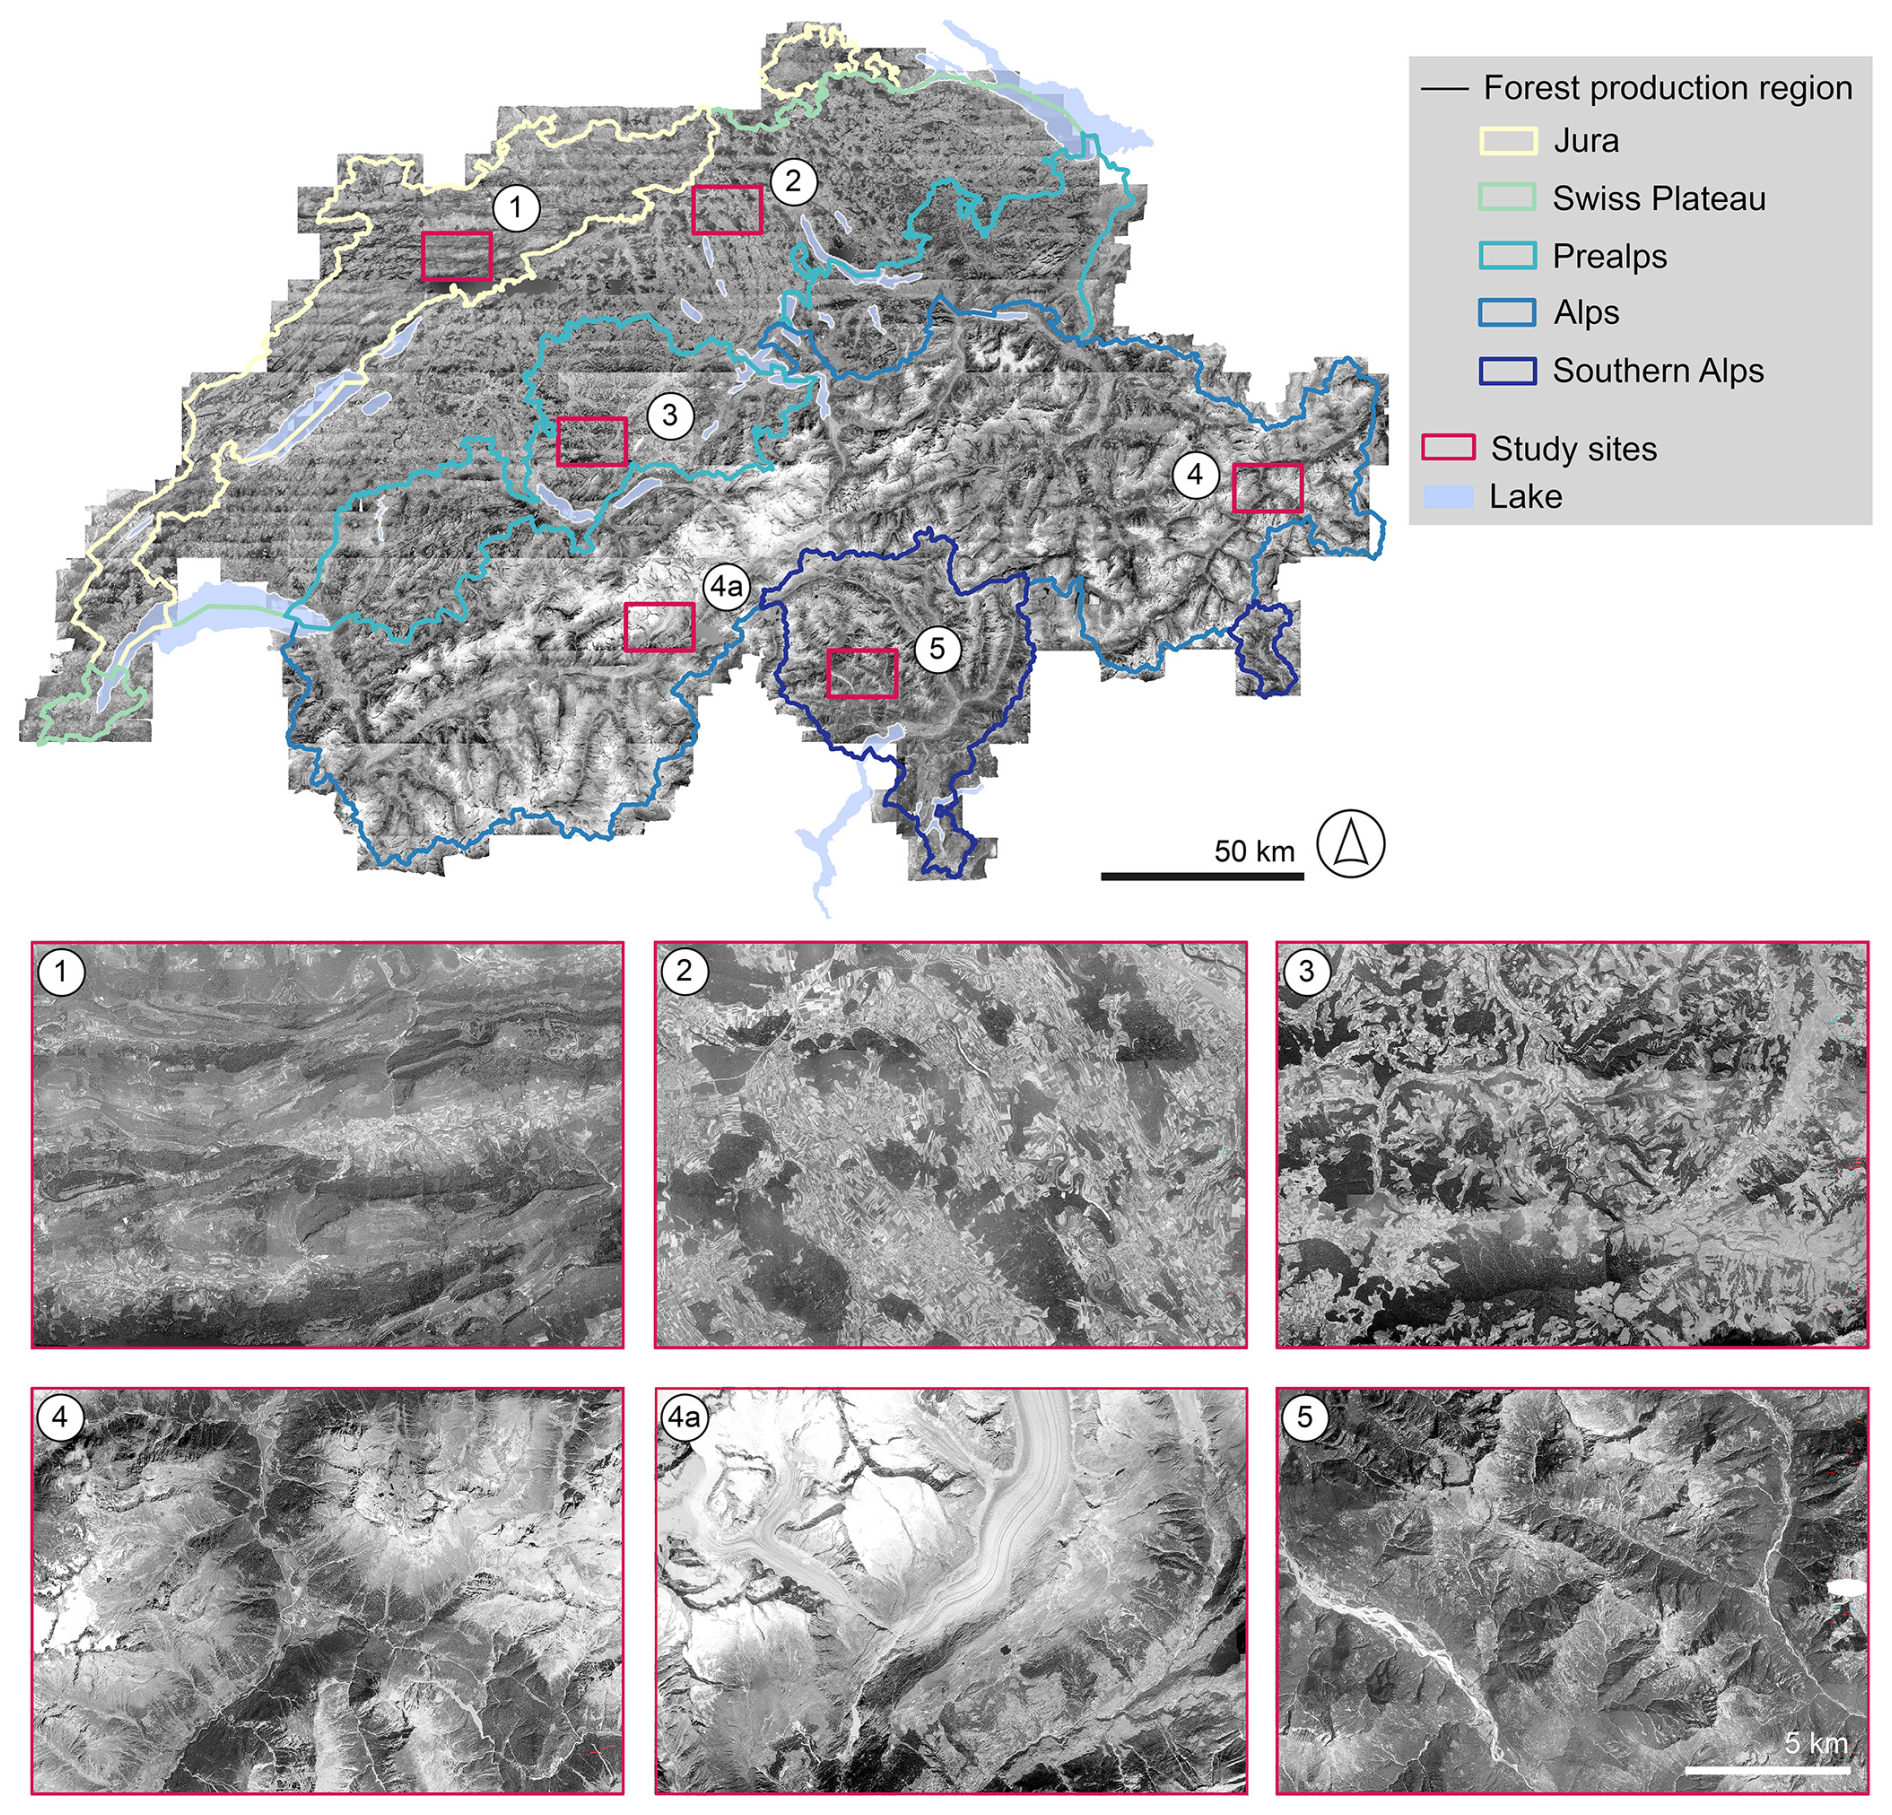
Figure 2The Swiss NFI forest production regions (1 = Jura, 2 = Swiss Plateau, 3 = Pre-Alps, 4 = Alps, 5 = Southern Alps) in Switzerland and the respective location of the study site for each region, along with the generated orthoimage for epoch 1 (1979–1985). An additional study site (4a) was selected for the Alps forest production region.
Table 1Forest production region characteristics. Topographic parameters are based on the swissALTI3D digital terrain model (DTM) version 2017. Forest parameters are based on the Swiss National Forest Inventory (NFI).
2.2 DSM and VHM generation
The scanned input images, auxiliary data, and steps used to generate the DSMs and the VHMs are illustrated in Fig. 3. The countrywide DSMs and VHMs are provided at 1 m spatial resolution in the Swiss projected coordinate system CH1903+/LV95 (EPSG code 2056), and height information is supplied in LN02 (EPSG code 5728) where applicable.
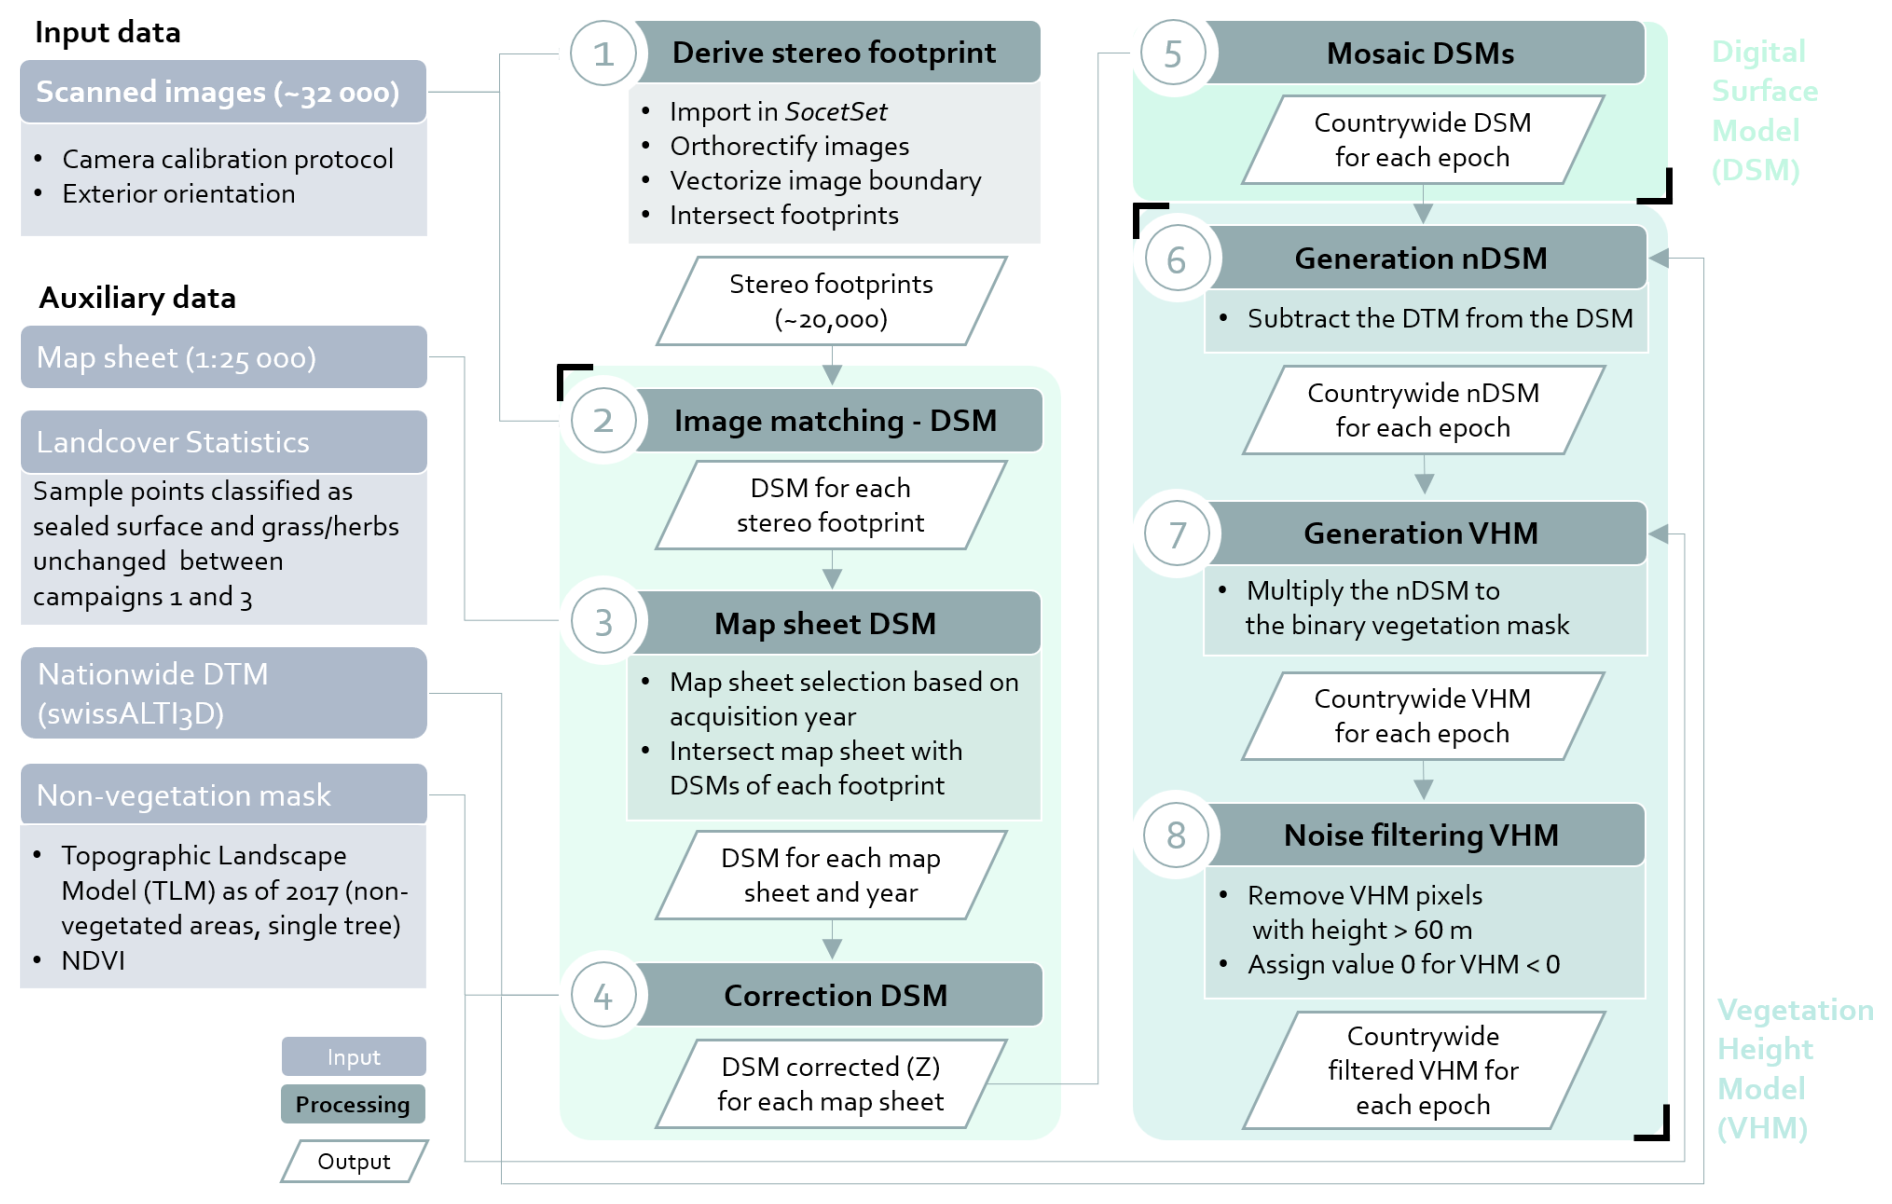
Figure 3Workflow of historical image processing and countrywide digital surface model (DSM) and vegetation height model (VHM) generation.
The scanned historical images were processed using the commercial photogrammetric software SocetSet (v5.6.0) by BAE Systems (Falls Church, USA). With known interior and exterior orientation parameters, the historical images were imported to the software through the “frame import dialogue”. The import process was separately done for all images originating from the same camera. During the frame import process, camera calibration values were entered, and fiducial marks were primarily detected using automatic fiducial detection, implemented in the frame import workflow. Where this automatic approach failed, manual measurement of fiducial marks was conducted. Subsequently, the DSMs can be generated using the Next-Generation Automatic Terrain Extraction (NGATE) package implemented in SocetSet (DeVenecia et al., 2007). The exterior orientation information for the images from epochs 1, 3, and 4 was derived by swisstopo within the framework of the Swiss Land Use/Cover Statistics programme around 2004. This image orientation was performed using ground control points (GCPs), visible in the historical imagery, and in more recent already-oriented digital stereo images available from swisstopo. The elevation of the GCPs was stereoscopically extracted from the digital images. This image orientation resulted in accurate horizontal positioning but biases in the Z direction, ranging from 1 to 5 m, randomly distributed across Switzerland. Therefore, the DSMs from these epochs were vertically corrected, as described in Sect. 2.2.2. In contrast, the images for epoch 2 were recently oriented using a highly automated workflow, as described by Heisig and Simmen (2021). Their study reported planimetric residuals of the GCPs for the different triangulation blocks, which ranged from 2 to 3 pixels (0.6–0.9 m RMSE). Additionally, a comparison between the derived historical orthomosaic and a reference orthomosaic at sample points evenly distributed over Switzerland revealed a median difference of 1 m, with no systematic bias across Switzerland (Heisig and Simmen, 2021). Although there are no documented values for the planimetric accuracies for the images from epochs 1, 3, and 4, comparisons of the orthomosaics from those epochs to one derived from epoch 2 show similar results.
2.2.1 Image matching and DSMs
The DSM generation process using the NGATE package followed a highly automated workflow. To handle the DSM reconstruction process, image matching was performed on distributed machines for single stereo footprints (i.e. stereo pairs). In the initial step, the footprint for each image was calculated, and the footprints of adjacent images along the same flight line (belonging to the same acquisition year) were intersected to create stereo footprints. In total, 20 346 stereo footprints were processed. All stereo footprints were stored in a table on a PostGIS database, which was used to control the image-matching process running on distributed virtual machines. Since stereo pairs were formed only from the neighbouring images along the same flight line, multi-image matching was not involved in this process.
NGATE provides several predefined correlation/matching strategies for different types of image content, such as urban, flat, and low-contrast areas. To ensure the extraction of accurate and complete elevation information across different land cover types, two strategies were adopted, namely urban and low-contrast. The urban strategy utilizes internal correlation parameters that account for strong elevation discontinuities, which represents the most prominent characteristics of forest canopies. In contrast, the low-contrast strategy aims to identify congruent points on highly homogeneous surfaces, such as meadows or bare land. While image matching in NGATE is conducted on every pixel of the input imagery, the resulting output file represents a regular grid of three-dimensional (XYZ) coordinates. Optionally, this grid can include information about successful image matching or interpolation for the given pixel, as indicated by the figure of merit value, a product derived by the software. The spatial resolution of the output DSM is user-defined and, in our case, was set to 1 m, approximately 3 times the GSD of the scanned images.
The image matching using the two strategies resulted in two separate DSMs for each stereo footprint. These two DSMs were combined into one DSM by including all successfully matched points from the urban strategy and filling remaining gaps with correlated points from the low-contrast strategy, where available.
2.2.2 DSM merging and vertical correction
The 20 346 DSMs resulting from image matching of the single stereo footprints were merged to the level of the 1:25 000 map sheets, which were already used to guide the image acquisition campaigns (see Sect. 2.1). For each map sheet geometry, all DSMs from the same epoch that corresponded to individual stereo footprints were selected based on spatial intersection. They were then merged and cropped to fit the extent of the map sheet, which typically included around 50 stereo footprints in flat areas and up to 150 in high-alpine regions. Since adjacent stereo footprints spatially overlapped, the pixels in these overlapping areas often included multiple elevation values. To address this, the elevation values were merged using the median height. Grid cells without any successfully matched elevation information were interpolated using a triangular irregular network (TIN) surface.
The exterior orientation of the images from epochs 1, 3, and 4 resulted in a vertical offset of up to 5 m between the DSMs and the reference DTM on stable terrain (i.e. sealed surfaces and grass/herb points; see Sect. 2.3.1). Therefore, the DSMs from these epochs were vertically corrected. For consistency, this correction was also applied to the DSM from epoch 2, resulting in neglectable changes due to the already precise horizontal and vertical orientation.
The vertical correction was performed on the merged map sheet DSMs as illustrated in Fig. 4.
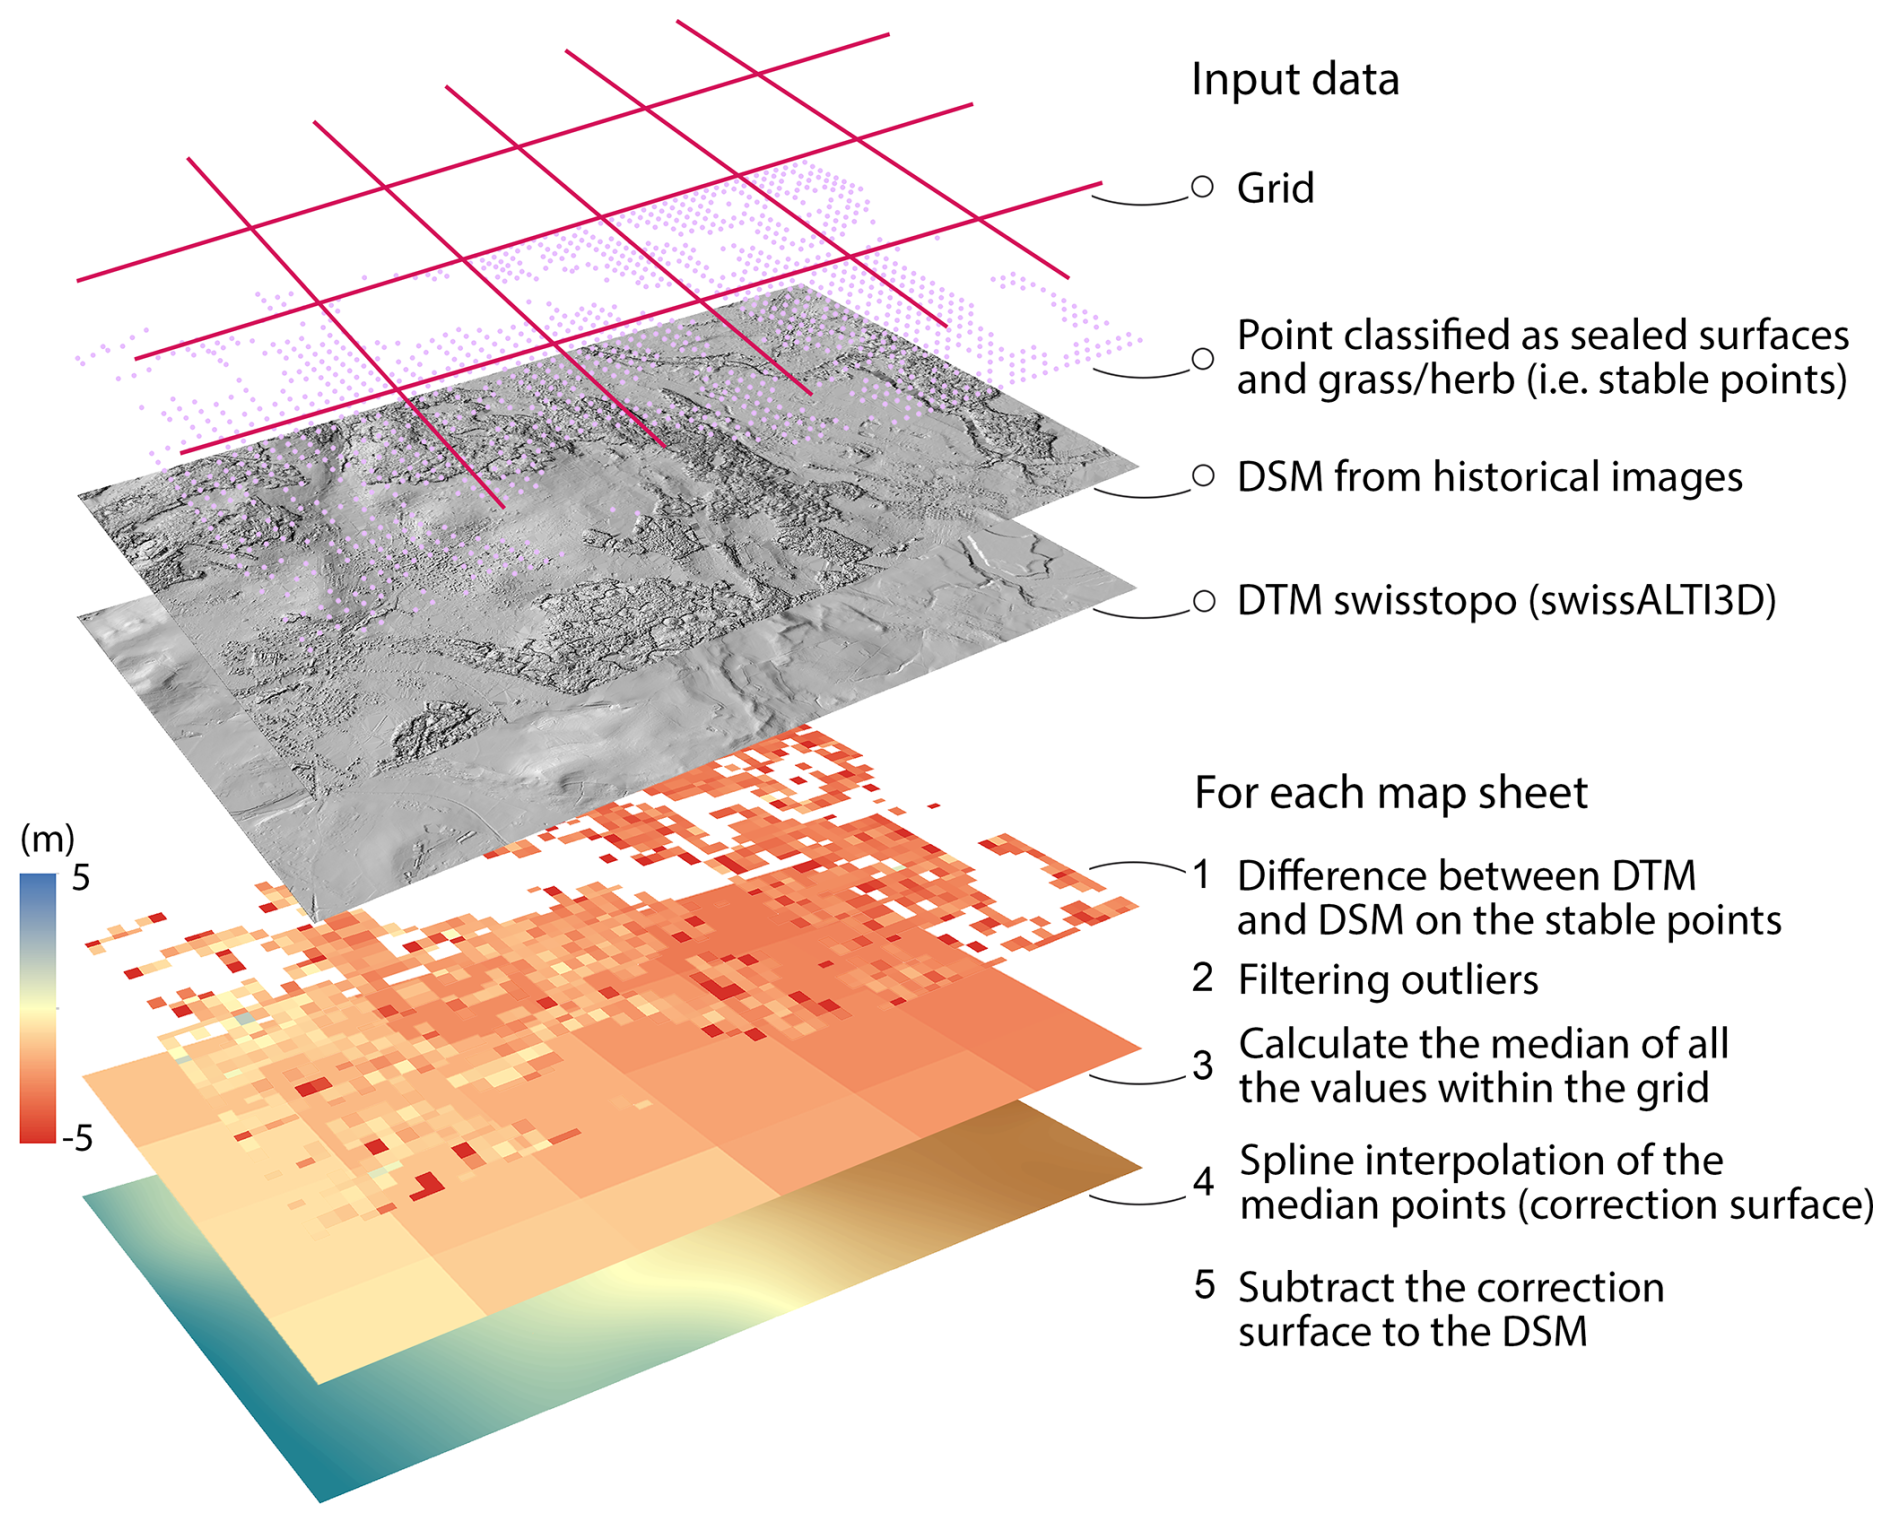
Figure 4Illustration of the workflow to correct the elevation bias in the historical digital surface models (DSMs) for each map sheet. A correction surface is derived by a spline interpolation of the median height difference values (reference DTM – historical DSM at sample points “sealed surface” and “grass/herbs”) within regular grid cells (418 m).
The workflow consisted of calculating the difference between the reference DTM (swissALTI3D version 2017; see Sect. 2.2.3) and the generated DSM at points corresponding to the classes “sealed surface” and “grass/herb” in the first and third campaigns of the Swiss Land Use/Cover Statistics programme (1979–1985 and 2004–2009, respectively; see Sect. 2.3.1). With this approach, only points with an unchanged land cover classification were used. The approach to handle outliers was as follows: in a first step, the height differences were filtered based on mean ± 1 SD (standard deviation), calculated within a moving window of 50×50 pixels. In a second step the median of the remaining elevation differences was calculated for each of the 1200 regular grid cells per map sheet. The cell size of this regular grid (418 m) was determined through an empirical approach, ensuring that each grid cell contained enough difference values to yield a valid median and that there were sufficient grid cells per map sheet to enable the interpolation of a continuous correction surface using spline interpolation. This correction surface was subsequently applied to the resulting DSMs at the map sheet unit level to correct elevation bias.
2.2.3 Countrywide DSMs and VHMs
After correcting for randomly distributed elevation biases in each map sheet DSM and epoch (as described in Sect. 2.2.2), all the corrected map sheet DSMs from the same epoch were mosaicked to a single DSM as a GeoTIFF file, covering the whole of Switzerland.
The four countrywide VHMs were derived by calculating the difference between the historical DSMs and the reference DTM (swissALTI3D version 2017, swisstopo, 2017; see workflow in Fig. 3). This process resulted in a normalized DSM (nDSM), representing the heights of all objects above ground. Note that the reference DTM was resampled from the default resolution of 2 to 1 m to match the resolution of the generated DSMs. The swissALTI3D DTM is based on airborne laser scanning data for elevations up to 2000 m a.s.l., with an overall point density of 0.5 points per m2 and a vertical accuracy of ±0.5 m (standard deviation). Above 2000 m a.s.l., elevation information is derived by image matching and manual editing, yielding a documented vertical accuracy of 1–3 m on average (swisstopo, 2024c).
nDSM raster cells with values > 60 m were considered outliers due to erroneous image matching and were thus replaced by “no data”. Next, the VHM (i.e. the nDSM of vegetated areas) was generated by assigning a height above ground of 0 m to all non-vegetated objects. To achieve this, a binary non-vegetation mask (0 = non-vegetation and 1 = vegetation) was created by combining information from the topographic landscape model (TLM; swisstopo, 2024d) and a normalized difference vegetation index (NDVI) map obtained from aerial orthoimages of the years 2009–2015. All areas classified in the TLM as building, street, and water surface, as well as pixels with an NDVI < 0.1, were set to 0. To retain vegetation close to buildings and streets in the VHMs, single trees and hedges from the TLM were buffered by 15 m and set to 1. This non-vegetation mask was multiplied by the nDSMs. The resulting VHMs have a spatial resolution of 1 m, consistent with the historical DSMs.
2.3 Quality assessment of the DSMs
The quality of the generated DSMs was assessed by analysing (1) the completeness achieved through the image-matching process over different land cover types and (2) the elevation accuracy based on elevation differences to reference datasets (see Sect. 2.3.1). The elevation differences were calculated consistently as the historical DSMs minus the reference data. Therefore, positive differences indicate that historical DSMs had positive biases, i.e. that the reference data were lower than the historical DSM. Quality assessment was performed and reported for the six selected areas and the countrywide DSMs.
2.3.1 Reference data
The reference dataset used to assess the completeness of the image-matching process over different land cover classes consisted of sample point interpretation on a regular 100 m grid across Switzerland. These sample points were collected by the Swiss Federal Statistical Office in the framework of the Swiss Land Cover/Use Statistics programme (BFS, 2024) (Fig. A1). These countrywide land cover statistics campaigns took place in 1979–1985, 1992–1997, 2004–2009, and 2013–2018. The completeness for epoch 1 was assessed, and the reference data from the 1979–1985 campaign were used. This dataset comprised 121 896 points for the six selected areas. The 27 specific land cover classes were grouped into six categories: (1) sealed surface, (2) bare land, (3) grass/herb, (4) shrub, (5) closed forest, and (6) glacial and perpetual snow.
The vertical accuracy of the DSMs was assessed by comparing the elevation with three reference datasets (i.e. DSM minus reference data). First, the sealed surface points that remained unchanged between the 1979–1985 and 2004–2009 campaigns were used. At these points, the elevation differences between the DSMs and the reference DTM were calculated. The reference DTM was the same as the one used for generating the VHM (see Sect. 2.2.3).
The second reference dataset comprised 565 selected geodetic control points (i.e. measured with GNSS or triangulation) distributed throughout Switzerland. This dataset is monitored and maintained by swisstopo; the documented vertical accuracy ranges from 0.003 to 0.1 m, with 42 % of the points showing accuracies of 0.05 m or better. For the remaining ones, an accuracy of 0.1 m is documented (swisstopo, 2023). These geodetic points enabled a completely independent estimation of the vertical accuracy of the derived DSMs.
As a third reference dataset, 16 650 stereoscopic elevation measurements conducted by a stereo-image interpreter at the Swiss Federal Institute for Forest, Snow and Landscape Research (WSL) were used. The data collection scheme was the same as in the NFI (Ginzler, 2019). These measurements were derived only for epoch 1 and within the 666 forest plots of 50×50 m area intersecting the six study sites (Fig. 1). For each forest plot, 25 elevation measurements were extracted on one of the overlapping stereo pairs used to create the historical DSM (Fig. A1). In addition, the six land cover classes used to assess completeness were assigned to each stereo measurement. The “closed forest” land cover class was further divided into coniferous or deciduous trees. It is worth noting that these reference data were used to evaluate agreement rather than serving as a measure of accuracy, since the stereoscopic measurements have some inherent inaccuracies, and the measurement was done on one stereo pair only.
2.3.2 DSM completeness
Completeness is an essential quality measure for photogrammetric DSM generation. Here, it was computed as the percentage of successfully matched points out of the potential total number of matched points within a defined spatial unit. Completeness was calculated within circles with a radius of 5 m centred around points of the land cover statistics dataset. Then, the mean completeness was calculated for the six land cover classes (i.e. sealed surface, bare land, grass/herb, shrub, closed forest, and glacial and perpetual snow). Completeness values were calculated for all four epochs from the DSMs of the six study sites before cropping to the actual map sheet extent (see Sect. 2.2.2).
2.3.3 Vertical accuracy
Vertical accuracy was calculated as the difference between the DSMs and the reference dataset (see Sect. 2.3.1). First, the elevation differences between the DSMs and the reference DTM were calculated at points classified as sealed surfaces. Sealed surface points closer than 10 m to historical and current houses and the forest boundary were removed. In addition, points classified as grass/herb and bare land were used to quantify the elevation bias of the DSMs to terrain slope, aspect, and elevation. Sealed surface points were not used in this investigation because they were mainly located in flat areas. In a second analysis, the elevation values of the DSMs were compared with approximately 500 independent geodetic points. Finally, >16 000 stereoscopic elevation measurements were used to assess the performance of the image-matching workflow on deciduous and coniferous trees, the primary target objects.
To calculate the statistical measures, differences greater than ±50 m between the DSMs and the reference measurements were excluded because such values indicated a failure in image matching due to cloud cover or saturated images, yielding unrealistic elevation values. From the remaining differences, robust statistics, such as the median and the normalized median absolute deviation (NMAD), were calculated (Höhle and Höhle, 2009). The NMAD is defined as 1.4826 × MAD (median absolute deviation). Root mean square error (RMSE) values were additionally calculated as a standard quality metric to facilitate the comparison of our results with those from other studies. RMSE values were determined after applying a robust outlier removal (median ± 5 NMAD).
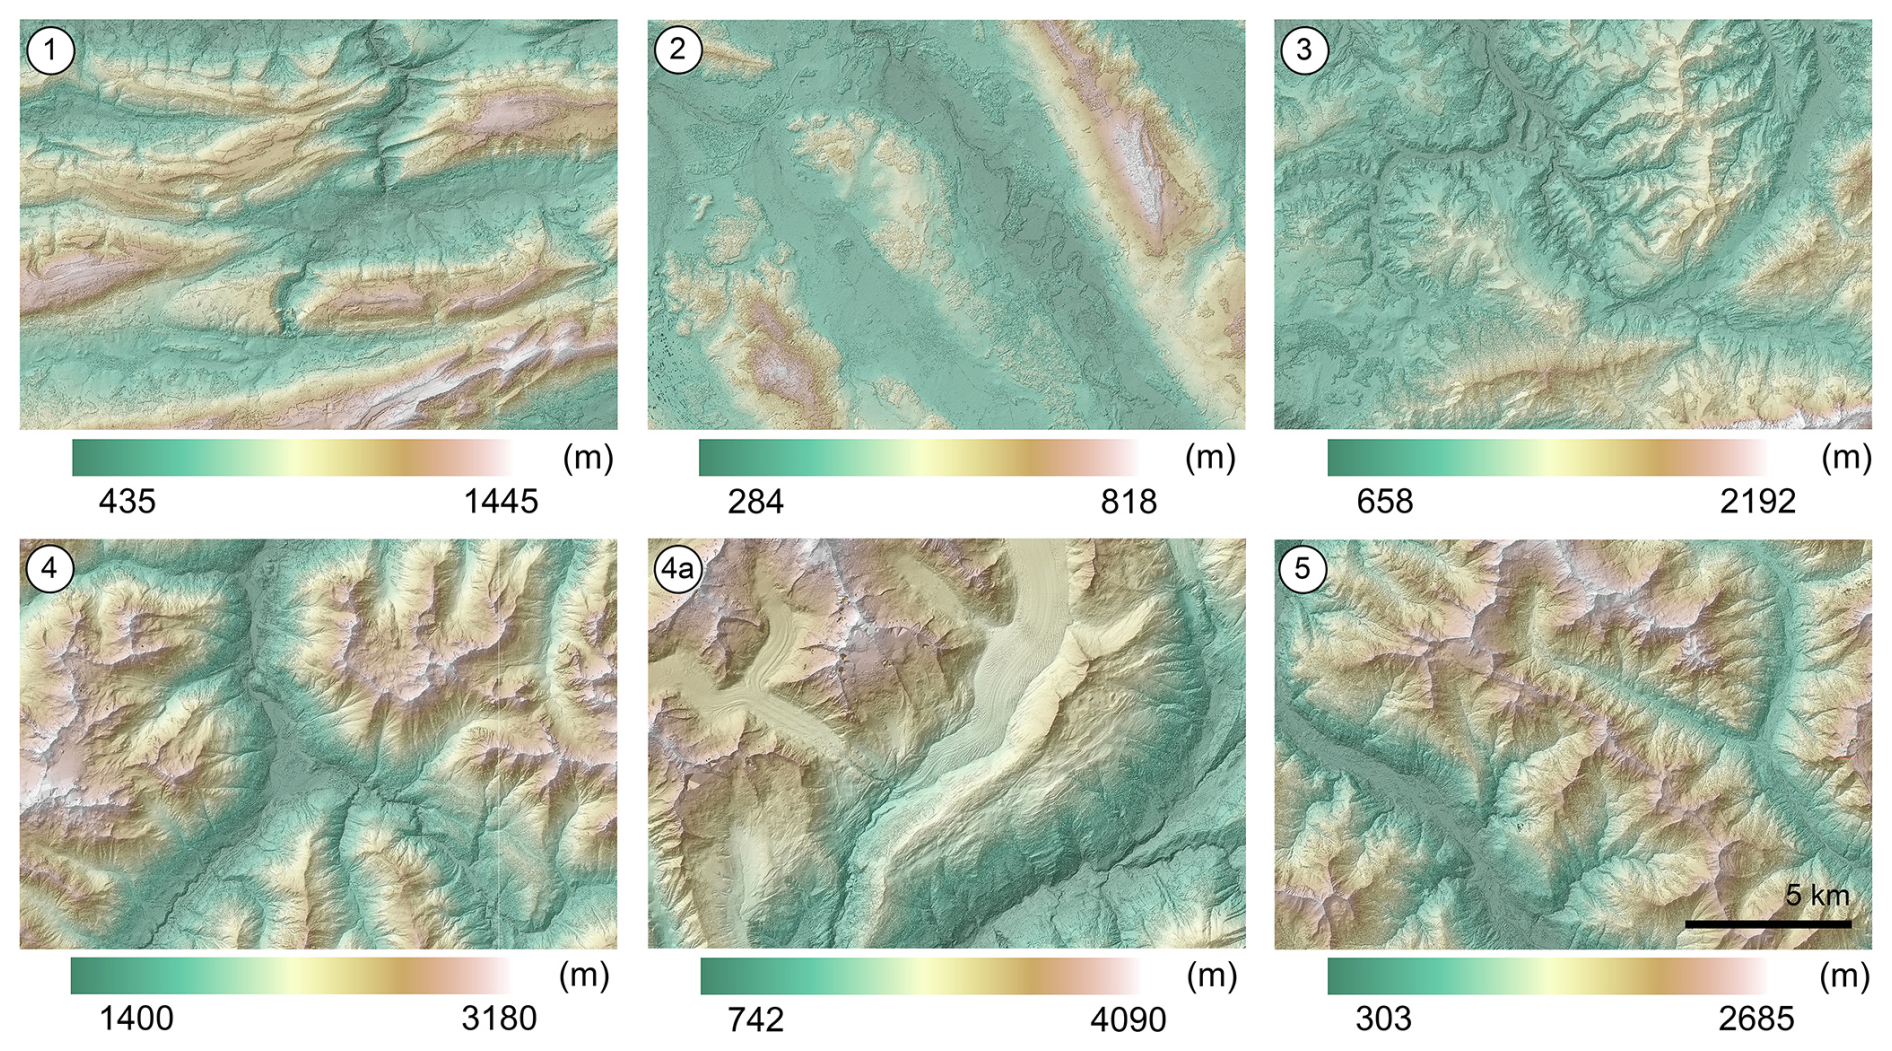
Figure 5Hillshaded digital surface models (DSMs) for the six selected study sites and epoch 1 (1979–1985). The year of the DSM is 1982 for sites 1 and 2, 1980 for site 3, 1985 for sites 4 and 4a, and 1983 for site 5.
3.1 Generation of DSMs
Four countrywide DSMs were generated successfully with the NGATE package of SocetSet. Data voids are related to the lack of stereo images (Fig. 2) or to unsuccessful image matching in saturated or cloudy areas. Figure 5 shows the hillshaded DSM for the epoch 1979–1985 for the six study sites.
3.2 DSM completeness
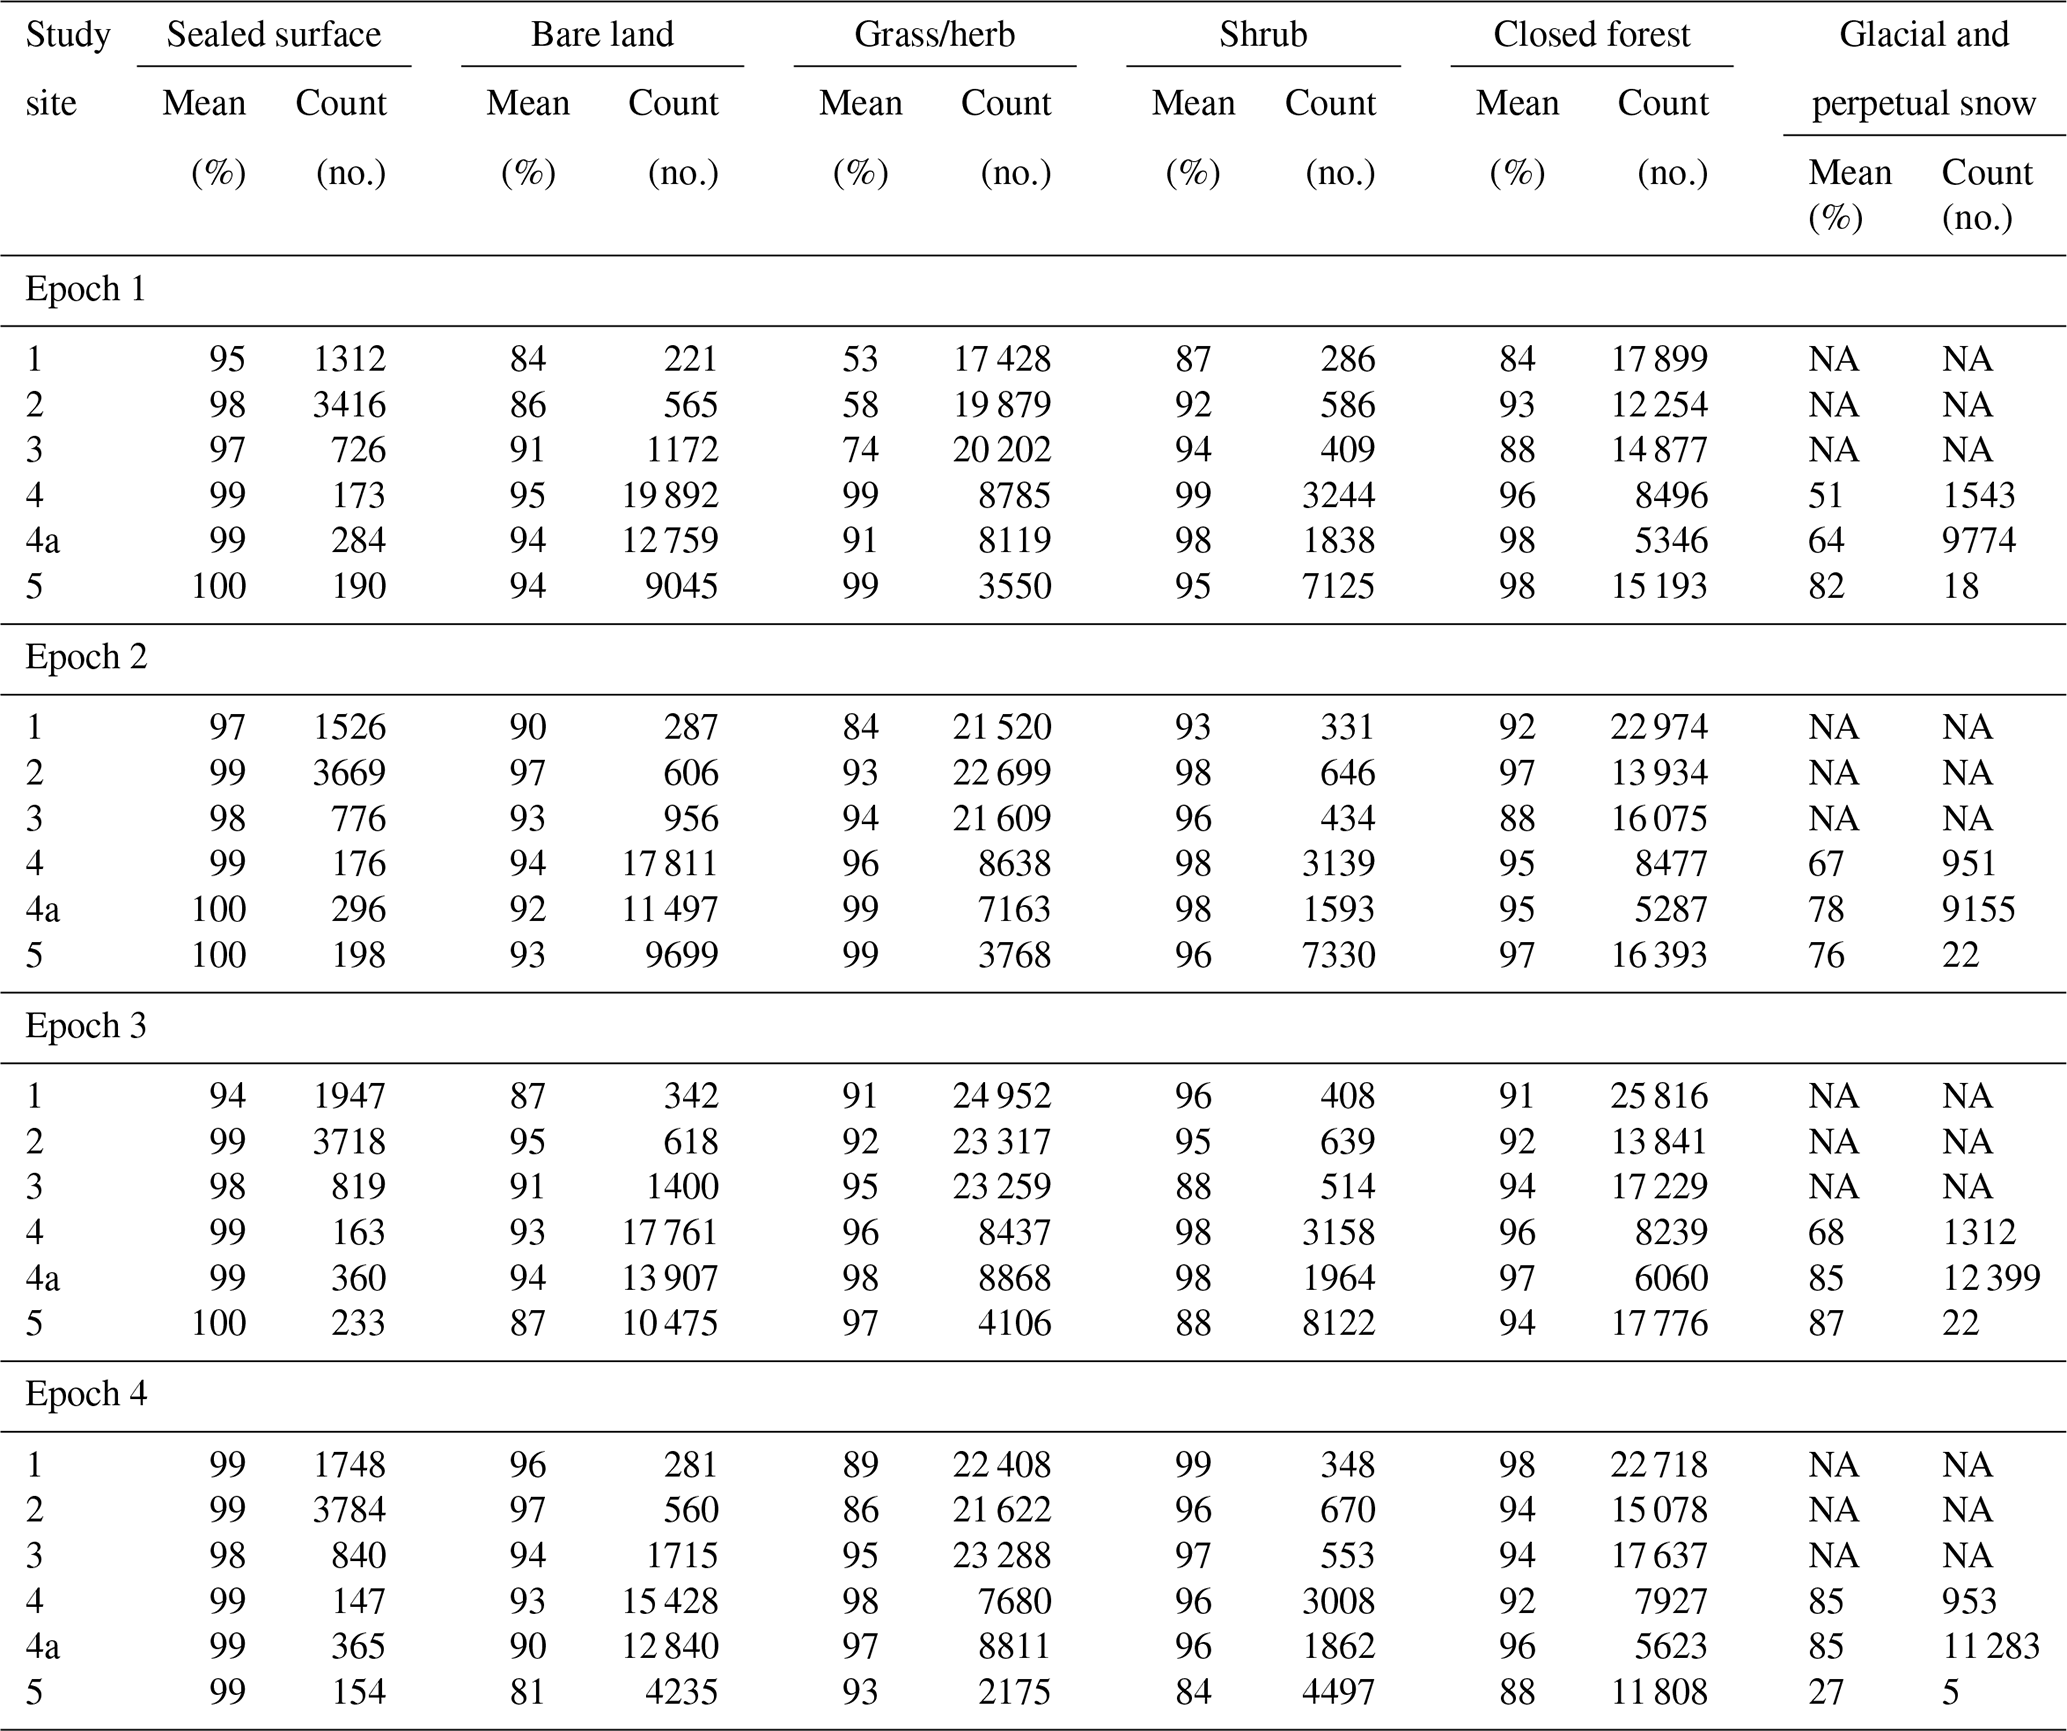
Figure 6 shows the DSM completeness percentages for epoch 1 and the six land cover classes: sealed surface, bare land, grass/herb, shrub, closed forest, and glacial and perpetual snow. The number of sample points for each class is also provided in the figure. Completeness results for epochs 2, 3, and 4 are provided in Appendix A (Fig. A2), and Table A1 shows the corresponding mean values. The lowest completeness occurred in areas classified as glacial and perpetual snow, with a mean completeness of 65 % across the four epochs. This result was expected due to the textureless black-and-white images of these surfaces, which resulted in poor image-matching performance. The highest completeness was achieved for sealed surfaces, with a mean of 98 %. For the classes bare land, shrub, and closed forest, the mean completeness was approximately 90 %, whereas the grass/herb class had a mean of 79 %. However, the completeness for the grass/herb class was higher for epochs 2, 3, and 4 (Fig. A2), with a minimum value of 84 %.
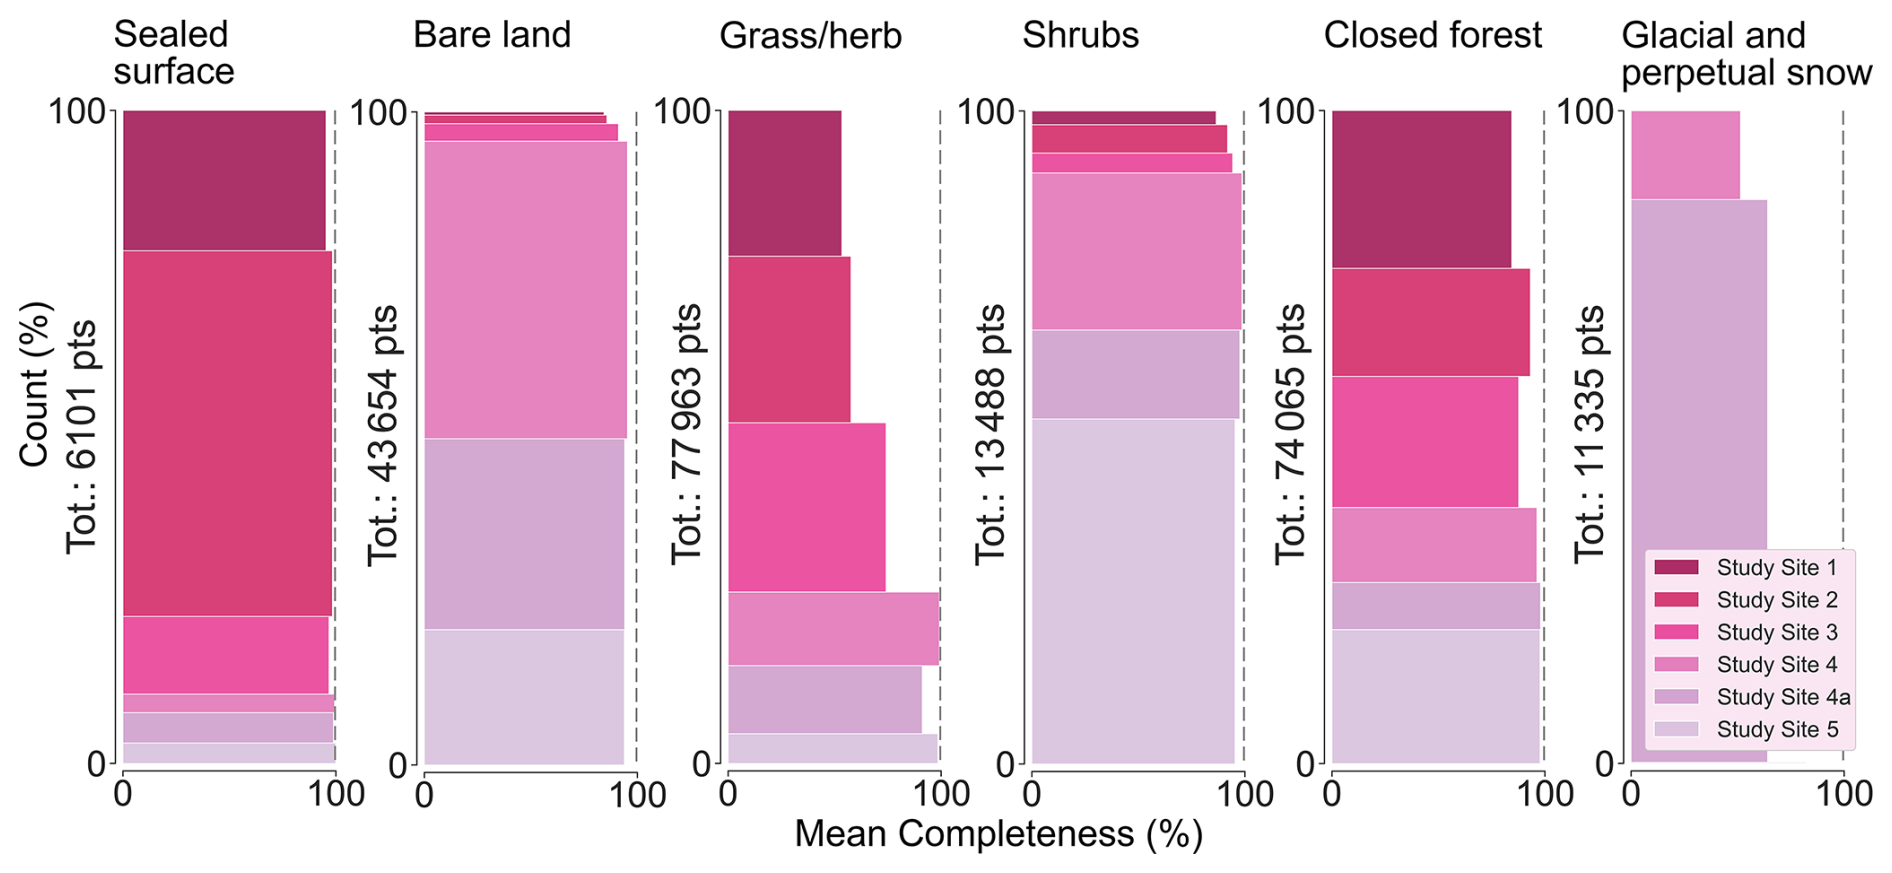
Figure 6Distribution of the mean completeness values (as percentages) for epoch 1 across the six study sites and the six land cover classes – sealed surface, bare land, grass/herb, shrub, closed forest, and glacial and perpetual snow. The snow class is only present in study sites 4, 4a, and 5. Note that for some classes and study sites, the number of points is minimal. For example, there are only 18 points in study site 5, which is equivalent to 0.15 % for the class “glacial and perpetual snow”, and therefore the horizontal bar is not visible.
3.3 DSM vertical accuracy assessment
The vertical accuracy of the DSMs for each epoch was assessed by comparing them with three reference elevation datasets (see Sect. 2.3.1). Figure 7a shows the spatial distributions of the sealed surface points and the reference geodetic points, while Table 2 summarizes the statistical measures. Sealed surface points exhibit a clustered distribution in low-elevation areas (i.e. regions 1, 2, and 3) and a sparser distribution in the Alps and Southern Alps (regions 4 and 5, respectively). No clear systematic difference is observed when visualizing the positive and negative elevation differences at sealed surface points between the DSM from the first epoch and the DTM. However, plotting the frequency distribution of elevation differences across the entire country reveals a positively skewed distribution for all epochs (Fig. 7b). Points on the sealed surface that were suboptimally located, such as those near urban areas and the forest edge, were removed. However, several values still exceed 10 m. The positive skew is also reflected in the median values of the elevation differences (Table 2), with values between 0.08 and 0.16 m and a maximum NMAD of 0.86 m.
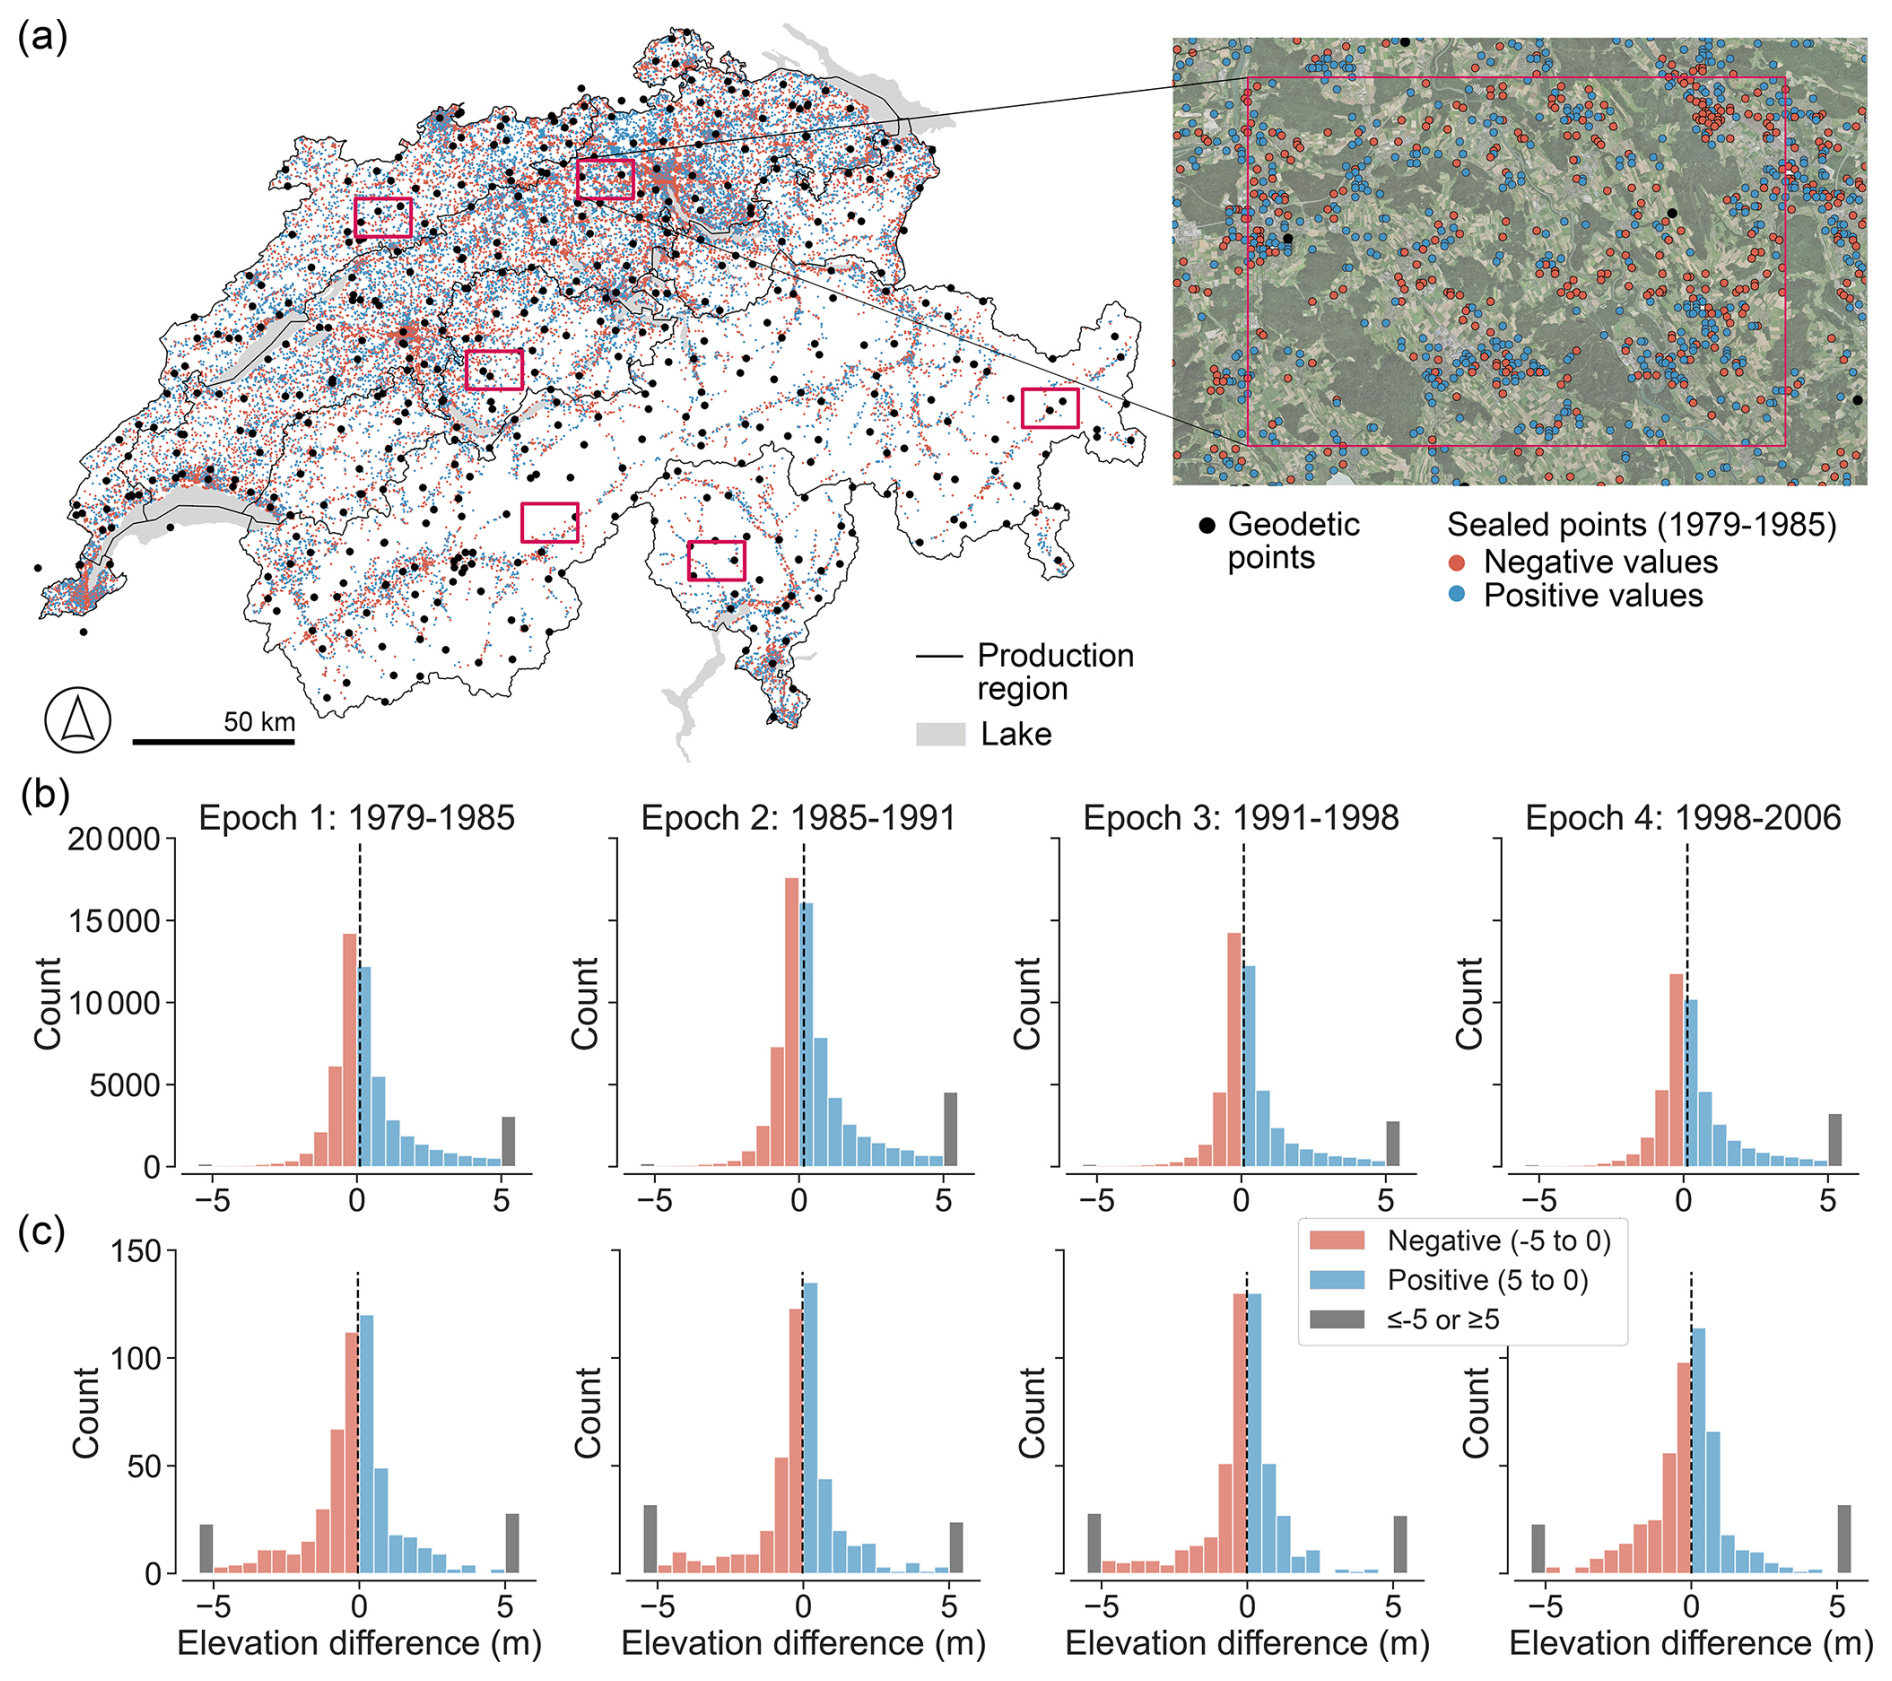
Figure 7(a) Spatial distribution of the sealed surface points and the geodetic points used for the vertical accuracy assessment of the historical digital surface models (DSMs). Sealed surface points are depicted in blue and red, representing the positive and negative differences, respectively, between the DSM for epoch 1 and the reference digital terrain model (DTM, swissALTI3D). The inset shows the distribution of the sealed surface points and the geodetic points for study site 2, overlaid on the orthophoto for the year 2021 (swisstopo, 2023). Frequency distributions of the elevation difference in metres between the DSM and the DTM (b) on sealed surface points and (c) between the DSM and the geodetic points for the whole of Switzerland for the four epochs. The vertical dashed line indicates the median value. The bin size is 0.5 m. The histogram shows the distribution before the filtering used for the root mean square error (RMSE) calculation.
Table 2Elevation difference between the historical digital surface models (DSMs) and the digital terrain model (DTM) over the sealed surface points and the geodetic points over Switzerland for the four epochs. The number of points before and after outlier filtering is reported; the latter number was used for the root mean square error (RMSE) calculation.
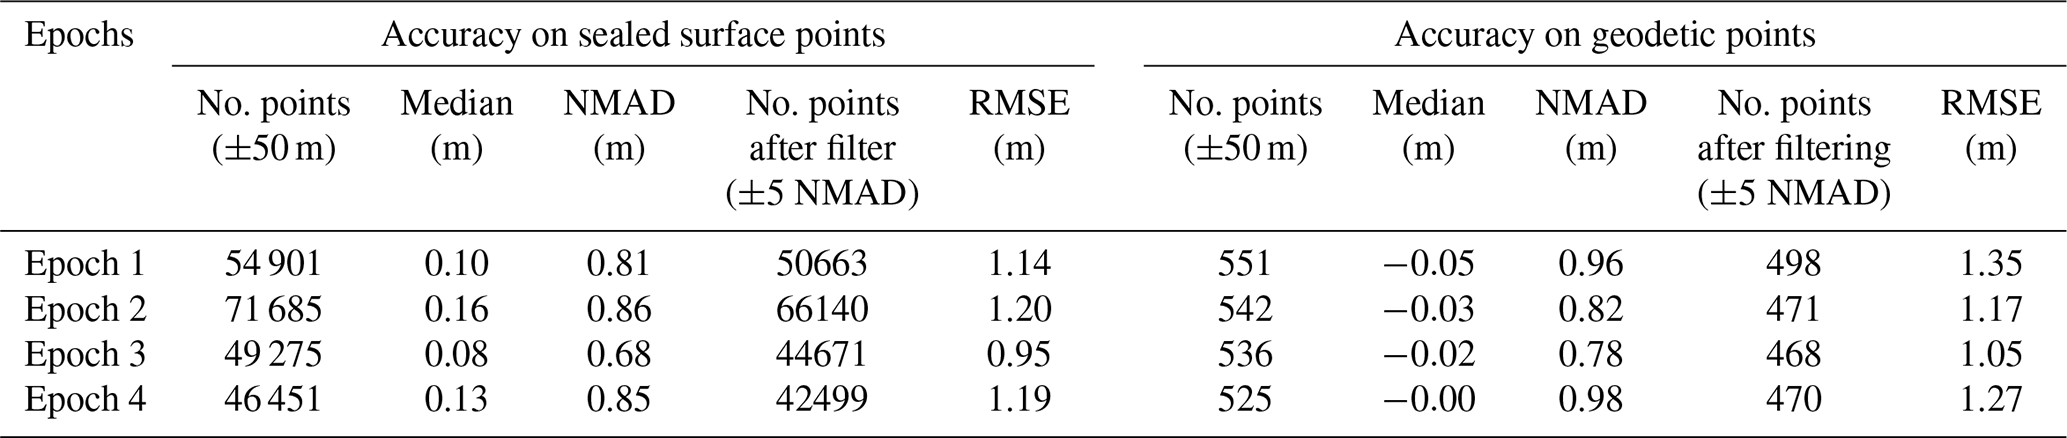
In the analysis of the vertical accuracy of the DSMs in comparison to independent geodetic points, the median is around zero, with an NMAD of <1 m (Table 2). Note that the number of geodetic points is 2 orders of magnitude smaller than the sealed surface points and more evenly distributed over the country. Additionally, the number of geodetic points varies slightly across the different epochs due to the spatial coverage of the image-matching results (e.g. cloud cover and image saturation). The differences between the DSMs and geodetic points have a more symmetric distribution for all four epochs, with few positive differences > 10 m (Fig. 7c).
The elevation difference between the historical DSMs and the DTM over grass/herb and bare land points shows no significant bias with slope, aspect, or elevation, as shown in Fig. 8. However, for elevations above 3000 m a.s.l. and slopes greater than 45°, the NMAD increases drastically, exceeding 2 m for all four countrywide DSMs. However, points within these intervals represent only approximately 5 % (slope) and 1 % (elevation), as shown in the histograms in Fig. 8. The elevation bias dependence on aspect shows a potential shift, with median values below 0.5 m and a constant NMAD of ±0.8 m for all datasets and aspect intervals.
The agreement between the stereoscopic measurement (see Sect. 2.3.3) taken within the NFI plots and the historical DSM of epoch 1 is reported in Table 3 for the different land cover classes, including a division of the closed forest class into deciduous and coniferous trees. Figure 9 shows one NFI plot with the stereo measurement location and elevation values compared with the DSM profile. As shown in Table 3, the closest agreement is observed for the sealed surface class, with a median difference of −0.19 m and an NMAD of 0.63 m, comparable to the results obtained when analysing the difference between the DSM and DTM for this land cover class (see Table 2). For the grass/herb class, the differences to the stereo measurements exhibit a similar offset but with a larger spread, with a median of 0.15 m and an NMAD of about 1 m. Sample points from the shrub and bare land classes show a wider spread, with NMAD values of 1.62 and 1 m, respectively, and larger systematic biases, with median values greater than 0.4 m. The weakest agreement is found for the closed forest class, where deciduous and coniferous trees yield comparable results, with median values of about 1.8 m and NMAD values of up to 3.77 m.
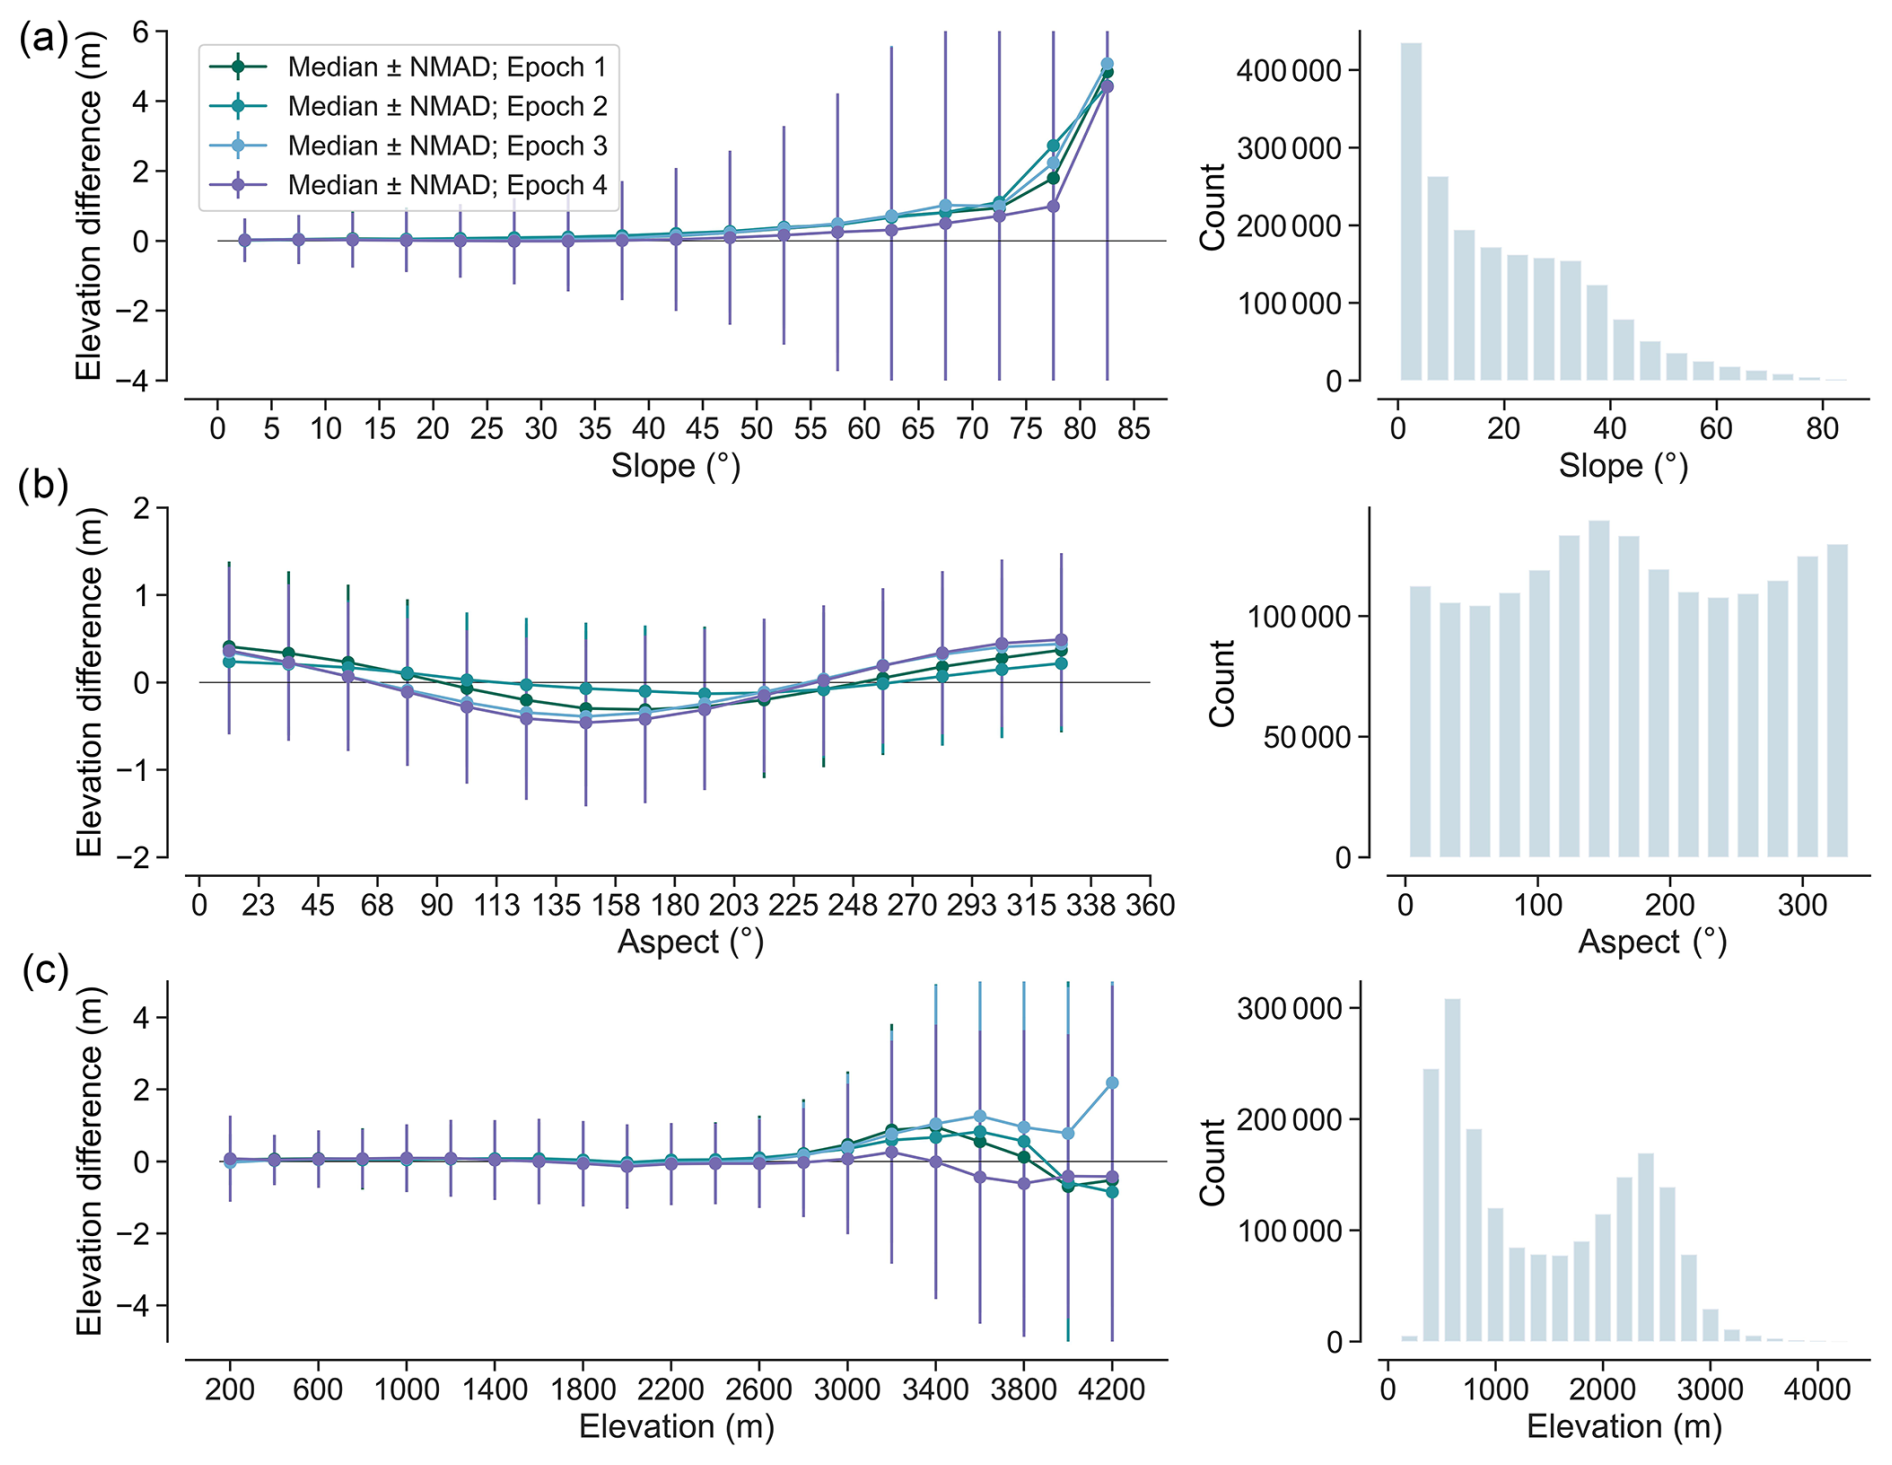
Figure 8Elevation differences in grass/herb and bare land points as a function of slope (a), aspect (b), and elevation (c). The histogram on the right shows the number of points for each interval. Elevation differences are calculated as the historical digital surface models (DSMs) minus the reference digital terrain model (DTM). Slope, aspect, and elevations were derived from the reference DTM.
Table 3Elevation differences over different land cover classes between the historical digital surface model (DSM) and the stereo measurements and from epoch 1.
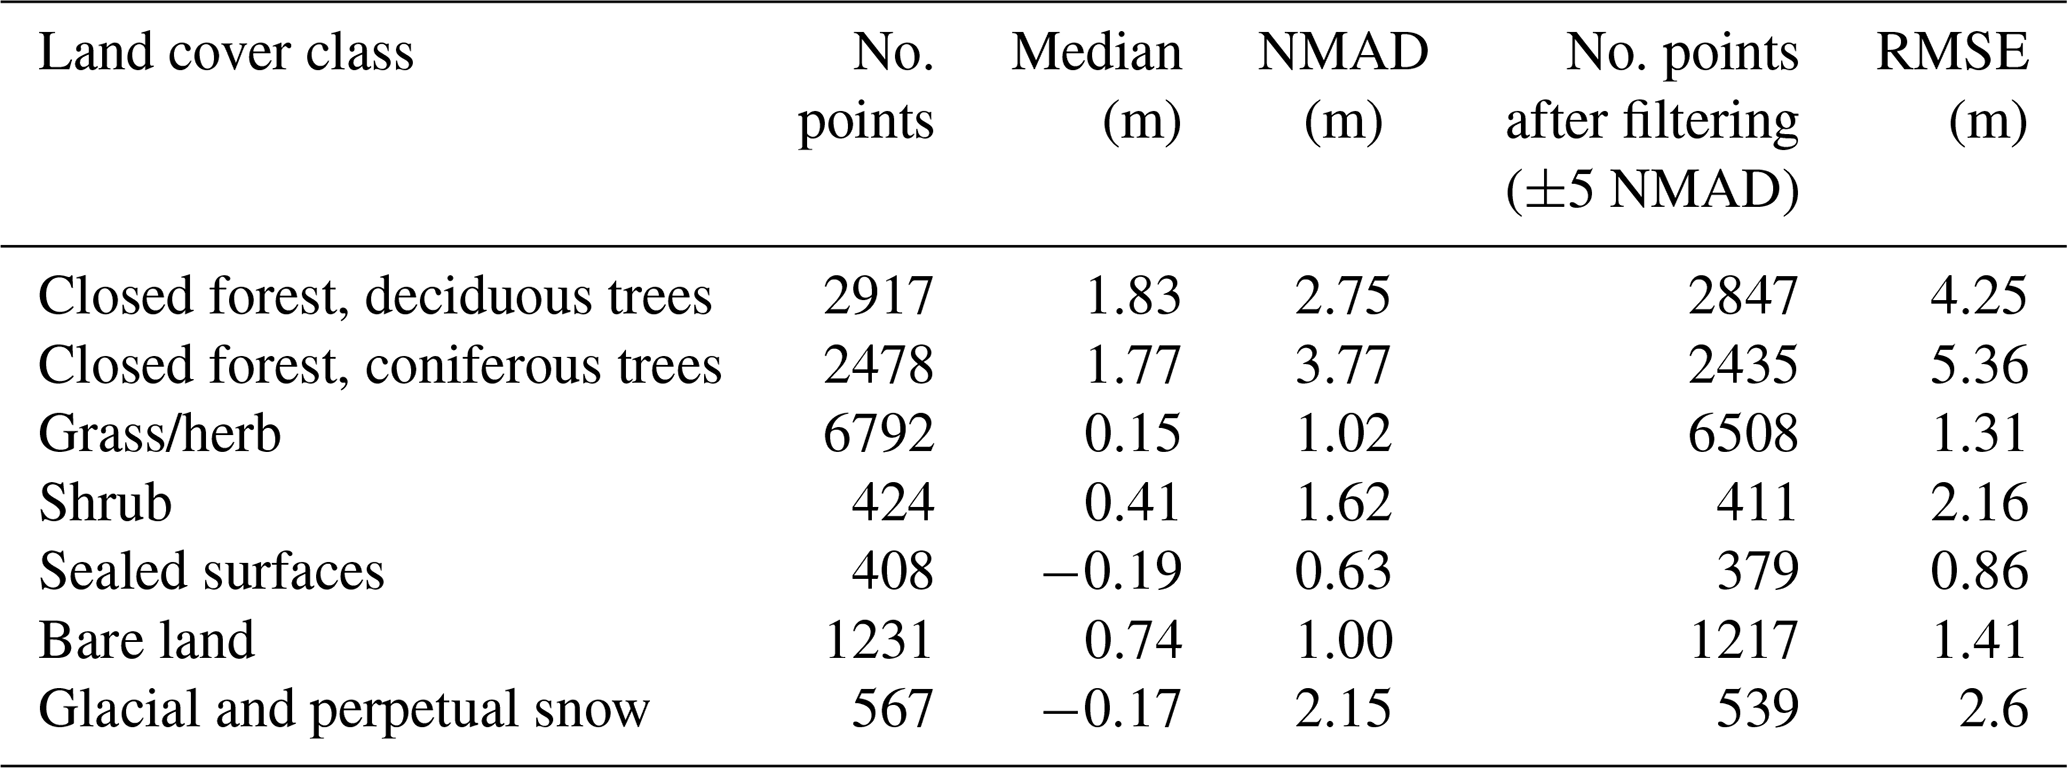
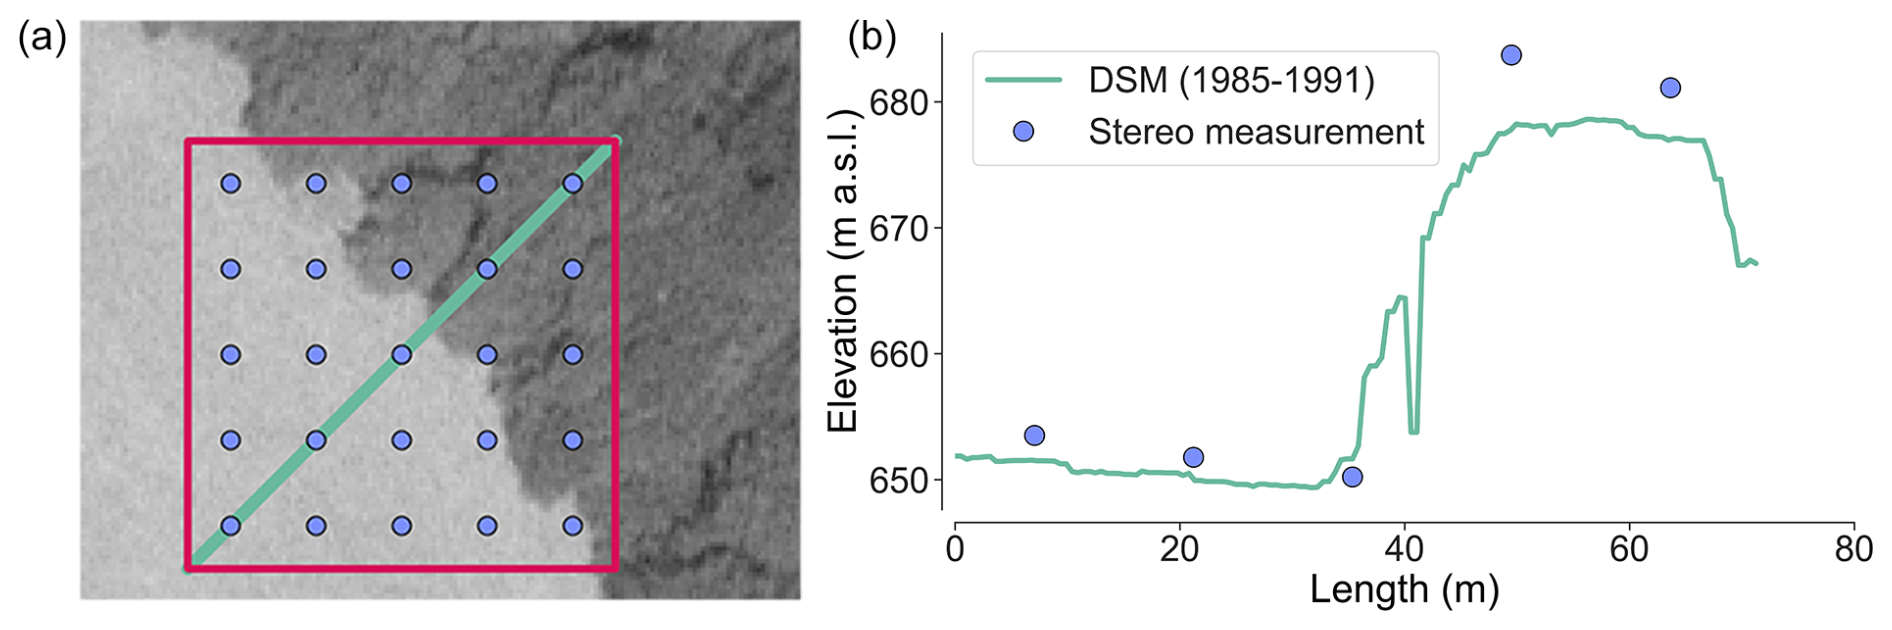
Figure 9Stereo measurements within a Swiss National Forest Inventory (NFI) forest plot on the historical orthophoto of epoch 1 (a). In (b), a comparison is depicted between the digital surface model (DSM) profile (green line, interval of 1 m) and the elevation values of the stereo measurements.
3.4 VHMs and forest change
Based on the four countrywide historical DSMs for Switzerland, four VHMs were generated by subtracting a countrywide DTM and applying a non-vegetation mask (see Sect. 2.2.3). Figure 10 shows the VHMs and the forest structure for the six study sites for epoch 2. Since the VHMs are direct derivatives of the DSMs, the statement above about the quality remains valid.
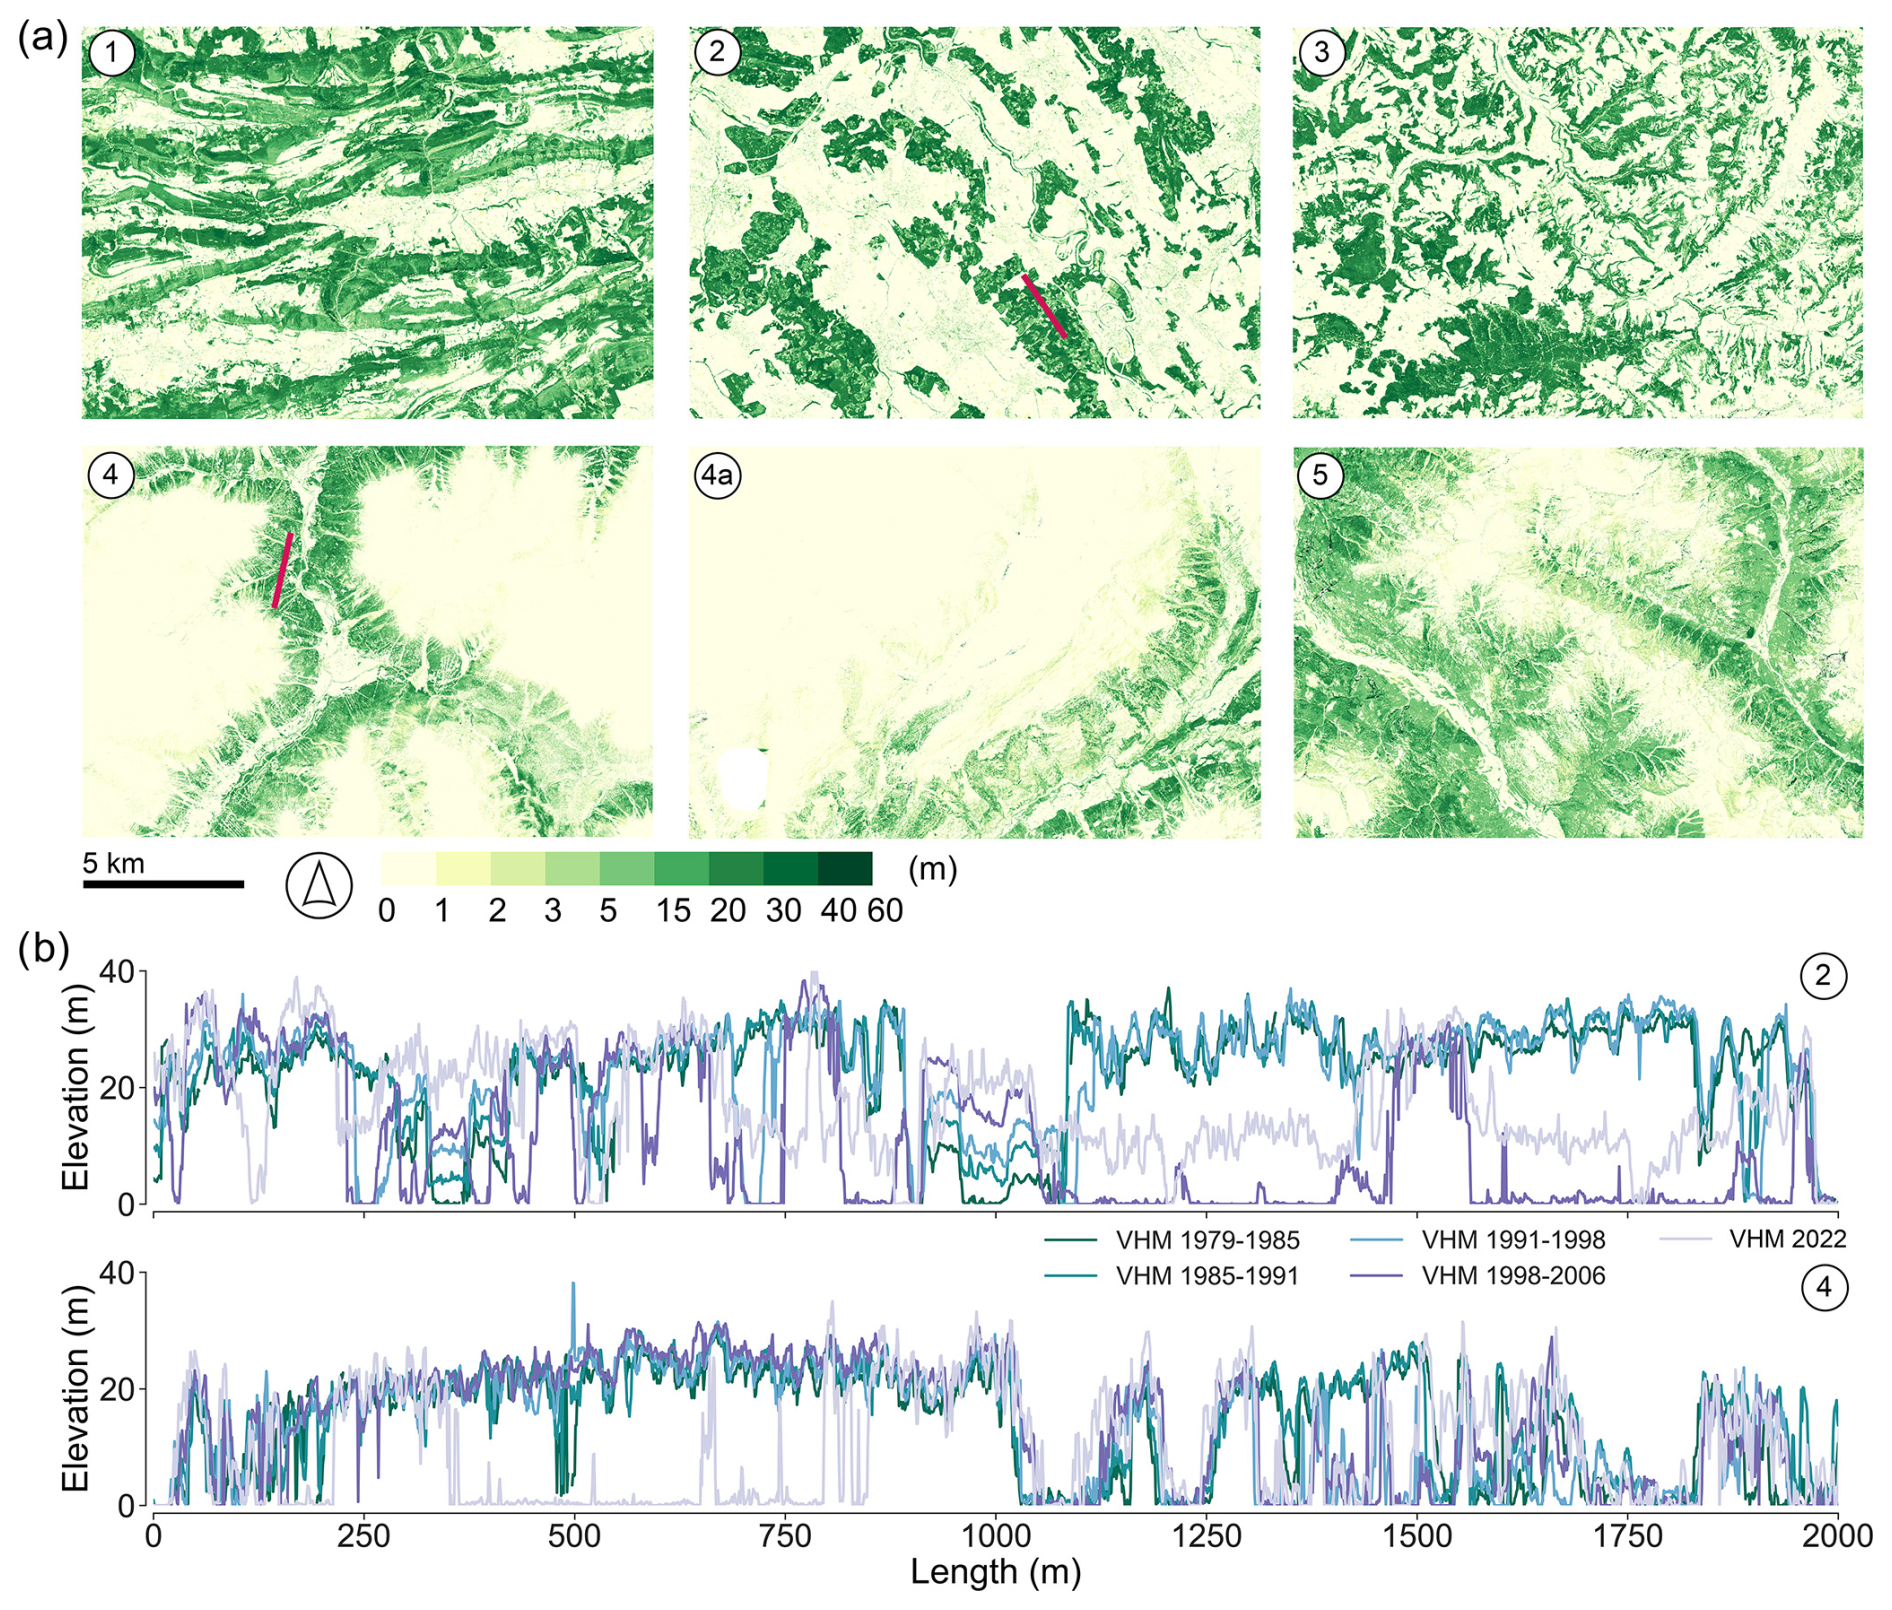
Figure 10Illustration of (a) the vegetation height models (VHMs) of epoch 2 (1985–1991) for the six selected study sites. The VHMs correspond to the years 1987 for site 1, 1988 for site 2, 1986 for sites 3 and 4a, 1991 for sites 4, and 1989 for site 5. (b) The profile of the VHMs from historical aerial images for the four epochs and from a modern airborne survey (2022) for study sites 2 and 4. The 2 km profile line is shown in red in (a).
Forest dynamics, such as growth, cutting, and regrowth between observation epochs, are evident over the six study sites, as shown by the height differences of the VHMs between consecutive epochs (Fig. A3). A detailed look at the VHM profiles of study sites 2 and 4 (Fig. 10b) shows minimal change in forest height in mature forest stands (VHM > 20 m), indicating consistency among the VHMs. However, forest growth, cuts, or damage followed by regrowth can be detected, for example, between epochs 3 and 4 (cut or damage) and in 2022 (regrowth) (Fig. 10b, profile 2, 1250–1500 m). The Swiss Plateau forest production region, where study site 2 is located, was heavily affected by storm damage. Figure 11 shows a small area of the VHM in region 2 for epochs 1, 3, and 4, overlaid by polygons indicating areas damaged by the two largest storm events recorded in Switzerland: Vivian (25–27 February 1990) and Lothar (26 December 1999). The VHMs effectively capture the storm-affected areas. The VHM of 1982 depicts forest cover in all storm-affected areas, while the 1994 VHM clearly shows the damage caused by storm Vivian. The areas impacted by storm Lothar show mature forest stands in the 1994 VHM, while the heavily damaged areas are visible in the 2002 VHM.
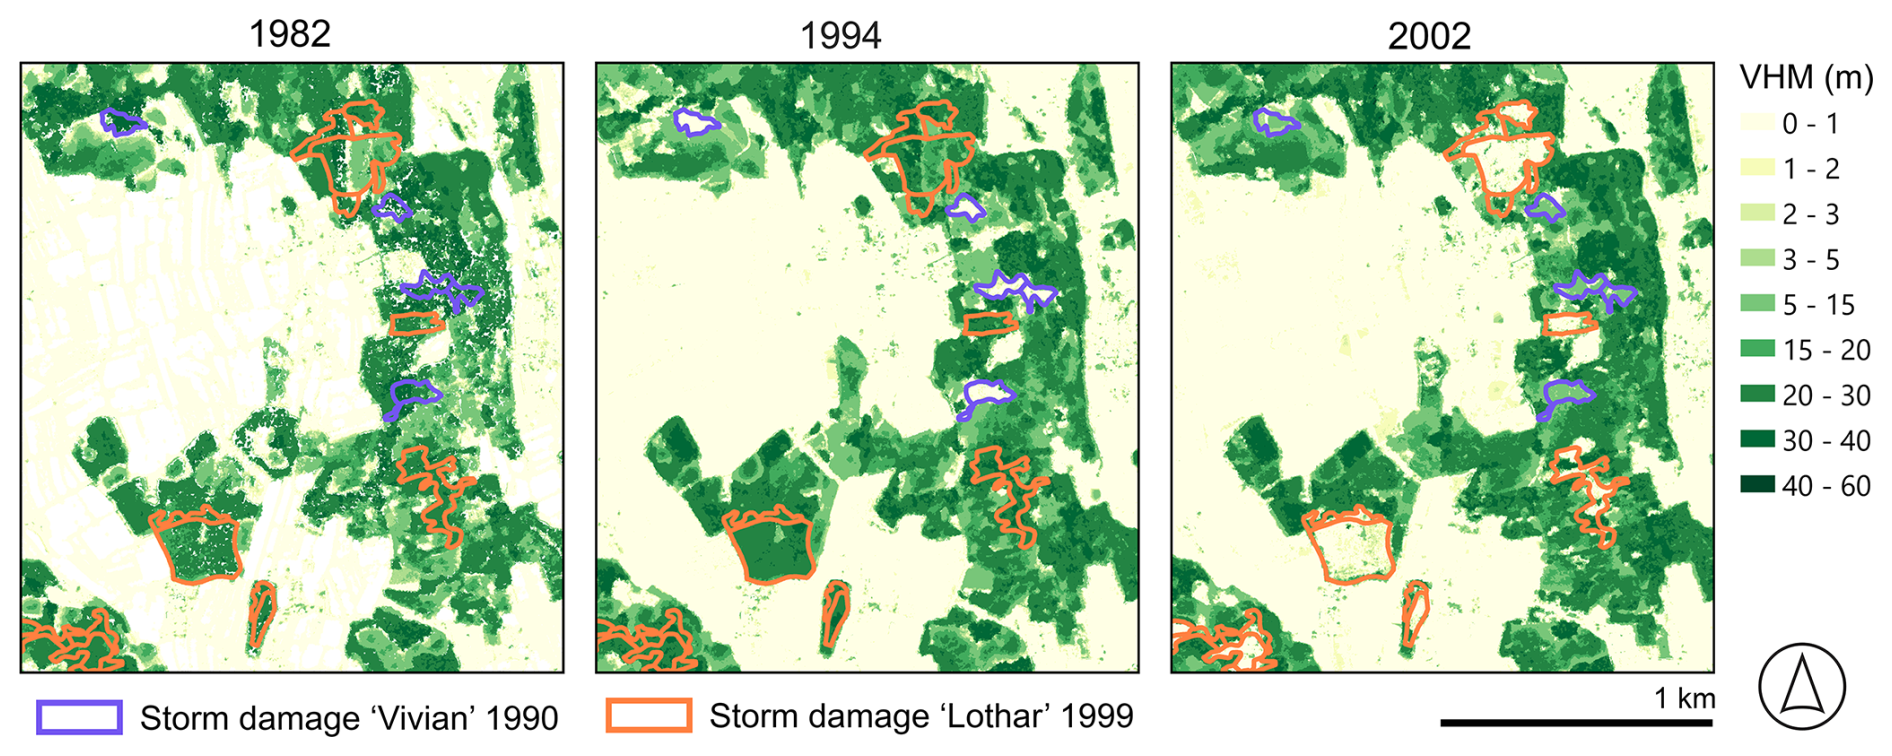
Figure 11Small extent of region 2 (Swiss Plateau), showing the vegetation height models (VHMs) of epochs 1, 3, and 4, overlaid by polygons indicating areas heavily affected by two major storm events in Switzerland (Vivian: 25 to 27 February 1990, Lothar: 26 December 1999).
Besides these qualitative results, these historical VHMs have been used in various studies (Price et al., 2020; Ginzler et al., 2021). Ginzler et al. (2021) investigated forest dynamics in Switzerland between 1980 and 2010. Their analysis was based on aggregated average vegetation heights for 100×100 m cells derived from the VHMs. They quantified forest dynamics by retrieving the absolute height change over the entire period (sum of absolute differences) and the classified height change between periods (height gain or loss). The results showed high forest dynamics in the Swiss Plateau and some pre-alpine areas in the northern Alps, while significant parts of the Jura and southern Switzerland showed little change during these 30 years. Price et al. (2020) used the historical VHMs to map and monitor woody aboveground biomass (AGB) dynamics across Switzerland over 35 years (1983–2017). They found a consistent relationship between vegetation height derived from the VHMs and NFI measures of woody AGB across four inventory periods.
4.1 Potential of countrywide historical DSMs and VHMs of Switzerland
This study underscores the great value of historical aerial images for reconstructing accurate and high-resolution DSMs over approximately three decades. For the epochs 1979–1985, 1985–1991, 1991–1998, and 1998–2006, we successfully processed four countrywide DSMs and VHMs at a resolution of 1 m. The quality of the generated models is sufficient for various geoscience applications, such as the quantification of natural hazards, mass movements, and sediment erosion, as well as the monitoring of human interference (e.g. deforestation) and urban development. For urban analysis, we recommend using the DSM and normalizing it again if needed, as pixel heights larger than 60 m in the VHM were removed. Our historical VHM products show a high level of consistency, suggesting that changes in forest height are real and significant and are thus valuable tools for understanding forest dynamics in Switzerland. This includes the tracking of forest growth and changes in forest cover over time, the differentiation between disturbed (due to management practices or storm events) and undisturbed forests, and the detection of regrowth after disturbance. The clear delineation of storm-damaged areas (e.g. from storms Vivian and Lothar) in our VHM data demonstrates the capability of the models to identify disturbances accurately. By analysing the temporal changes in these areas, we can differentiate between disturbances caused by natural events and those resulting from forest management activities. Therefore, insight can be gained into post-storm regrowth and forest management activities across the forest production regions, and their effectiveness can be quantified, for example in terms of protection forest function. This dataset offers great added value to the Swiss NFI forest management data and supports future management strategies.
4.2 Quality of the DSMs
The completeness of the image matching across epochs remains nearly constant (Fig. A2). However, an improvement in completeness is observed for grass and herbs, as well as glacial and perennial snow classes, in relation to epoch 1, although this may vary depending on the study area. In areas with successful image matching, countrywide accuracy analysis comparing derived DSM elevations to swissALTI3D DTM elevations at sealed surface points shows sub-metre values with a maximum NMAD of 0.86 m. This value is roughly 2.5 times the GSD, although the DSMs were generated at 1 m resolution. A comparison with an independent dataset such as the geodetic points distributed across Switzerland shows comparable accuracy.
The positive bias, where reference data were lower than the historical DSMs, may have resulted from changes in the sealed surface points in urban areas, which could explain the presence of several values more positive than −10 m (Fig. 7b). The comparison with geodetic points also shows outliers with values above 10 m (Fig. 7c), likely related to the suboptimal location of reference geodetic points on objects such as rooftops and statues, which cannot be precisely reconstructed from historical DSM (Fig. 12).
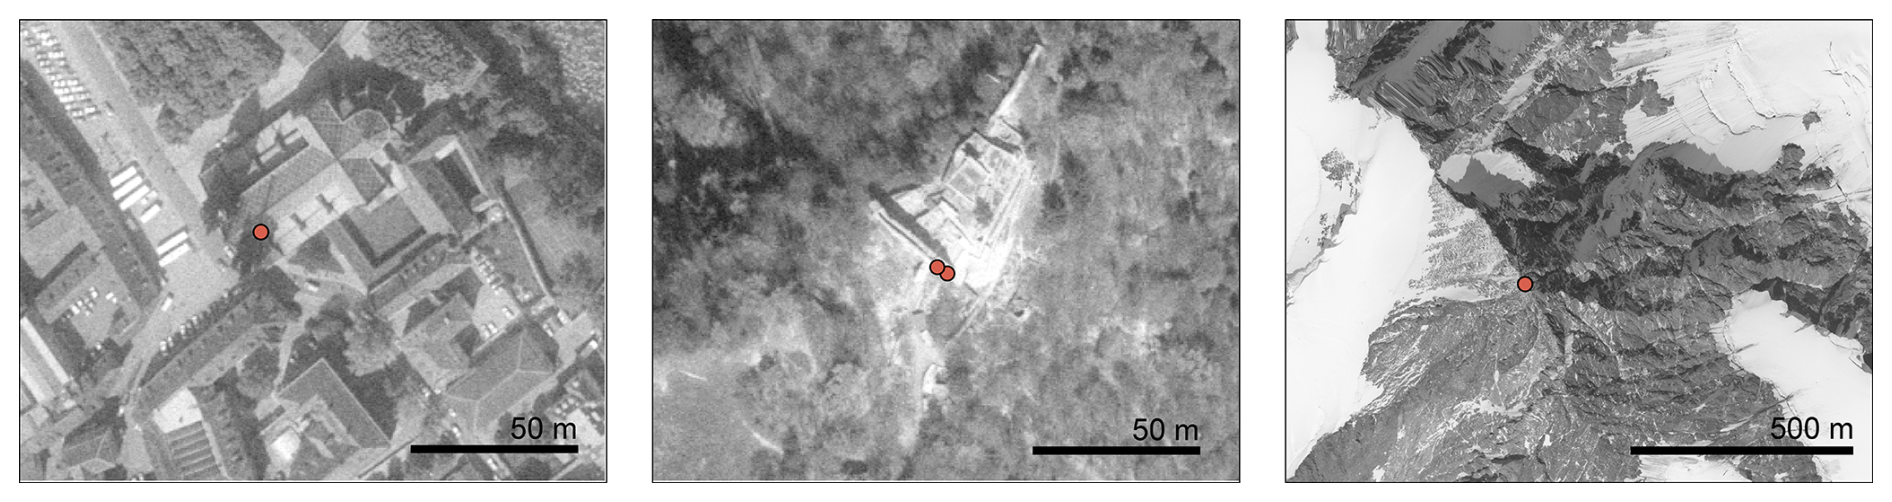
Figure 12Example of suboptimal locations of geodetic points used for the accuracy assessment. Negative biases over these points are shown in red.
An elevation bias in areas with slopes greater than 45° and elevations above 3000 m a.s.l. (Fig. 8a and c) is present in many photogrammetric products from airborne and satellite sources (e.g. Piermattei et al., 2019) and is more pronounced in historical images with 8-bit radiometric resolution and lower accuracy in exterior orientation. Steep slopes and mountainous areas often experience strong shadows, overexposed photographs on snow-covered surfaces, and clouds over mountain tops, all affecting image-matching results and vertical accuracy and increasing noise in the DSMs.
Comparing the agreement between manual stereo measurements and the historical DSM of epoch 1, the closed forest land cover class shows the largest bias among all classes. However, similar patterns are visible when comparing manual stereo measurements with a DSM from images acquired by a modern near-infrared Leica ADS sensor with a GSD of 0.5 m (Ginzler and Hobi, 2015). Ginzler and Hobi (2015) achieved median values of −0.34 m (coniferous) and −0.79 m (deciduous), with NMAD values in the same range as in this study. Compared to this study, the greater bias in the historical data could be due to the more challenging visual capture of canopy objects in manual stereo measurements on 8-bit panchromatic images. Also, the measurement was only performed on one stereo model, while the DSM in this study was created from the fusion of several overlapping pairs. All other land cover classes show median values between ∼0.1 and 0.7 m and NMAD values between ∼1 and 1.5 m in both studies.
4.3 Challenges of image processing and limitations of our dataset
Challenges in working with airborne historical aerial images can include difficulties accessing the archive, the high cost of images, deteriorated film negatives, and the poor availability of metadata such as exterior and interior orientation. In Switzerland, swisstopo provides free access to a comprehensive archive of scanned historical aerial images covering the entire country, along with calibration protocols and exterior orientation parameters for each image, essential for photogrammetric processing. However, the orientation accuracy of historical images varies between epochs, requiring a vertical correction of the DSMs due to offsets of several metres. Often, historical images lack calibration protocols and exterior orientation information, requiring ground control points to calculate the camera location. This has led the scientific community to adopt “structure from motion” photogrammetric approaches for processing historical aerial images (e.g. Muhammed et al., 2023), as these approaches do not require approximated values, such as camera calibration information. Additionally, pipelines have been developed to minimize the effort of collecting GCPs (e.g. Knuth et al., 2023).
To handle countrywide datasets acquired over three decades, the processing of approximately 32 000 images, as well as the post-processing, including the vertical correction of about 20 000 stereo footprint DSMs, was done at the map sheet level. Vertical correction was required to minimize offsets caused by an inaccurate exterior orientation of the images (see Sect. 2.2.2). Each corrected map sheet DSM was merged without further consideration of the edges of adjacent map sheets, potentially creating small jumps at the edges. These jumps are negligible at the country scale, but further co-registration should be considered for local and catchment studies involving more than one map sheet.
Another challenge of historical black-and-white imagery with 8-bit radiometric resolution is oversaturation in snow-covered or heavily illuminated areas, leading to no or erroneous image-matching results, particularly in mountainous regions. This is evident in the completeness results for points classified as glacial and perpetual snow (see Sect. 3.2). Therefore, for studies related to glaciers and snow, the noise and the voids in the generated DSMs must be addressed with proper void filling and filtering. We used a simple TIN interpolation to fill the voids, providing a binary mask indicating interpolated areas, which can be used to remove these areas for further analysis. For glaciological studies or applications requiring precise dates, we do not have the exact information on the dates of each DSM/pixel, but we provide the year of the survey campaign per map sheet.
Datasets can be accessed from EnviDat (https://doi.org/10.16904/envidat.528, Marty et al., 2024). The following files are available for the four epochs: countrywide digital surface model (DSM), hillshaded DSM, and vegetation height models (VHMs). A metadata shapefile is provided with information about the acquisition year of the photographs used here; the geometry corresponds to the 1:25 000 map sheets used during this study. In addition, a binary raster is provided indicating successfully matched pixels (1) and interpolated pixels (0), and a non-vegetation mask raster “TLM_Vegetation_mask” is provided, indicating vegetated areas (1) and non-vegetated areas (0). All the raster files are provided as GeoTIFF files.
Millions of aerial photographs dating from the First World War to the early 2000s represent an enormous, yet largely untapped, resource for geoscientists, with significant potential for documenting and quantifying surface changes over the last century. In this study, we used freely available historical stereo images covering the whole of Switzerland, processed using photogrammetric software. These images were provided with both exterior and interior orientation, allowing us to derive four countrywide DSMs at a 1 m spatial resolution across four epochs, with survey campaigns spanning approximately 7 years. Our developed workflow achieved metre to sub-metre accuracy and high completeness of the DSMs in nearly all regions of Switzerland, demonstrating the feasibility of capturing continuous surface change patterns at a high spatial resolution over different land cover classes. The vertical accuracy (NMAD) in areas below 2000 m a.s.l. and with a slope of less than 20° ranges from 1.57 to 2.06 times the GSD (on average 0.35 m). However, lower completeness and increased noise were present in snow-covered areas due to image saturation and reduced performance of the image-matching algorithm in these areas. As our study was conducted as part of the Swiss NFI, we also generated four countrywide VHMs using an available countrywide DTM. These VHMs have been used to quantify forest changes (Ginzler et al., 2021) and monitor aboveground biomass (Price et al., 2020). The high consistency of the VHMs indicates their potential for future research into forest ecosystem dynamics, services, and management.
Future work can build upon these datasets by integrating modern data to extend the observation period, thereby enhancing the detection of climate signals. Additionally, refining time series methods for very-high-resolution datasets will further improve our understanding of surface changes and related processes.
Finally, this study highlights the importance of recognizing the value of historical aerial imagery datasets. We urge mapping agencies, governmental authorities, and military services to unlock these archives and make them freely accessible online. The creation of countrywide historical aerial image DSMs is feasible only when such data are readily available, as demonstrated by the open access provided by swisstopo in Switzerland.
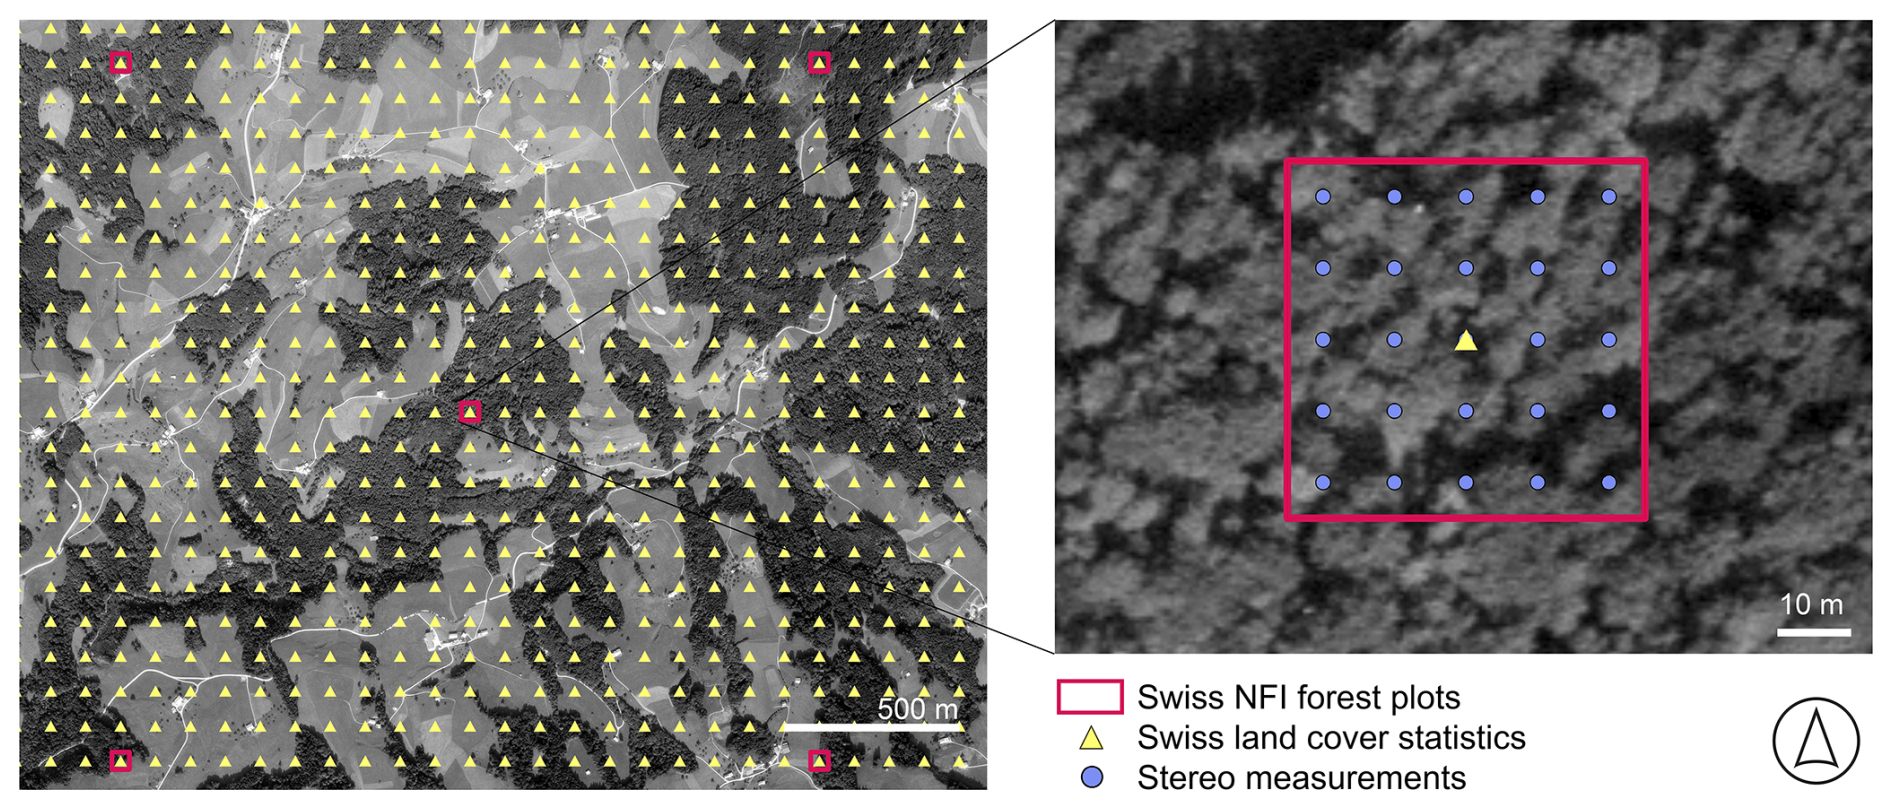
Figure A1Illustration of the distribution of the Swiss land cover statistic points and the Swiss National Forest Inventory (NFI) forest plots with the stereo measurements. The background is the generated orthophoto from the first epoch (1979–1985).
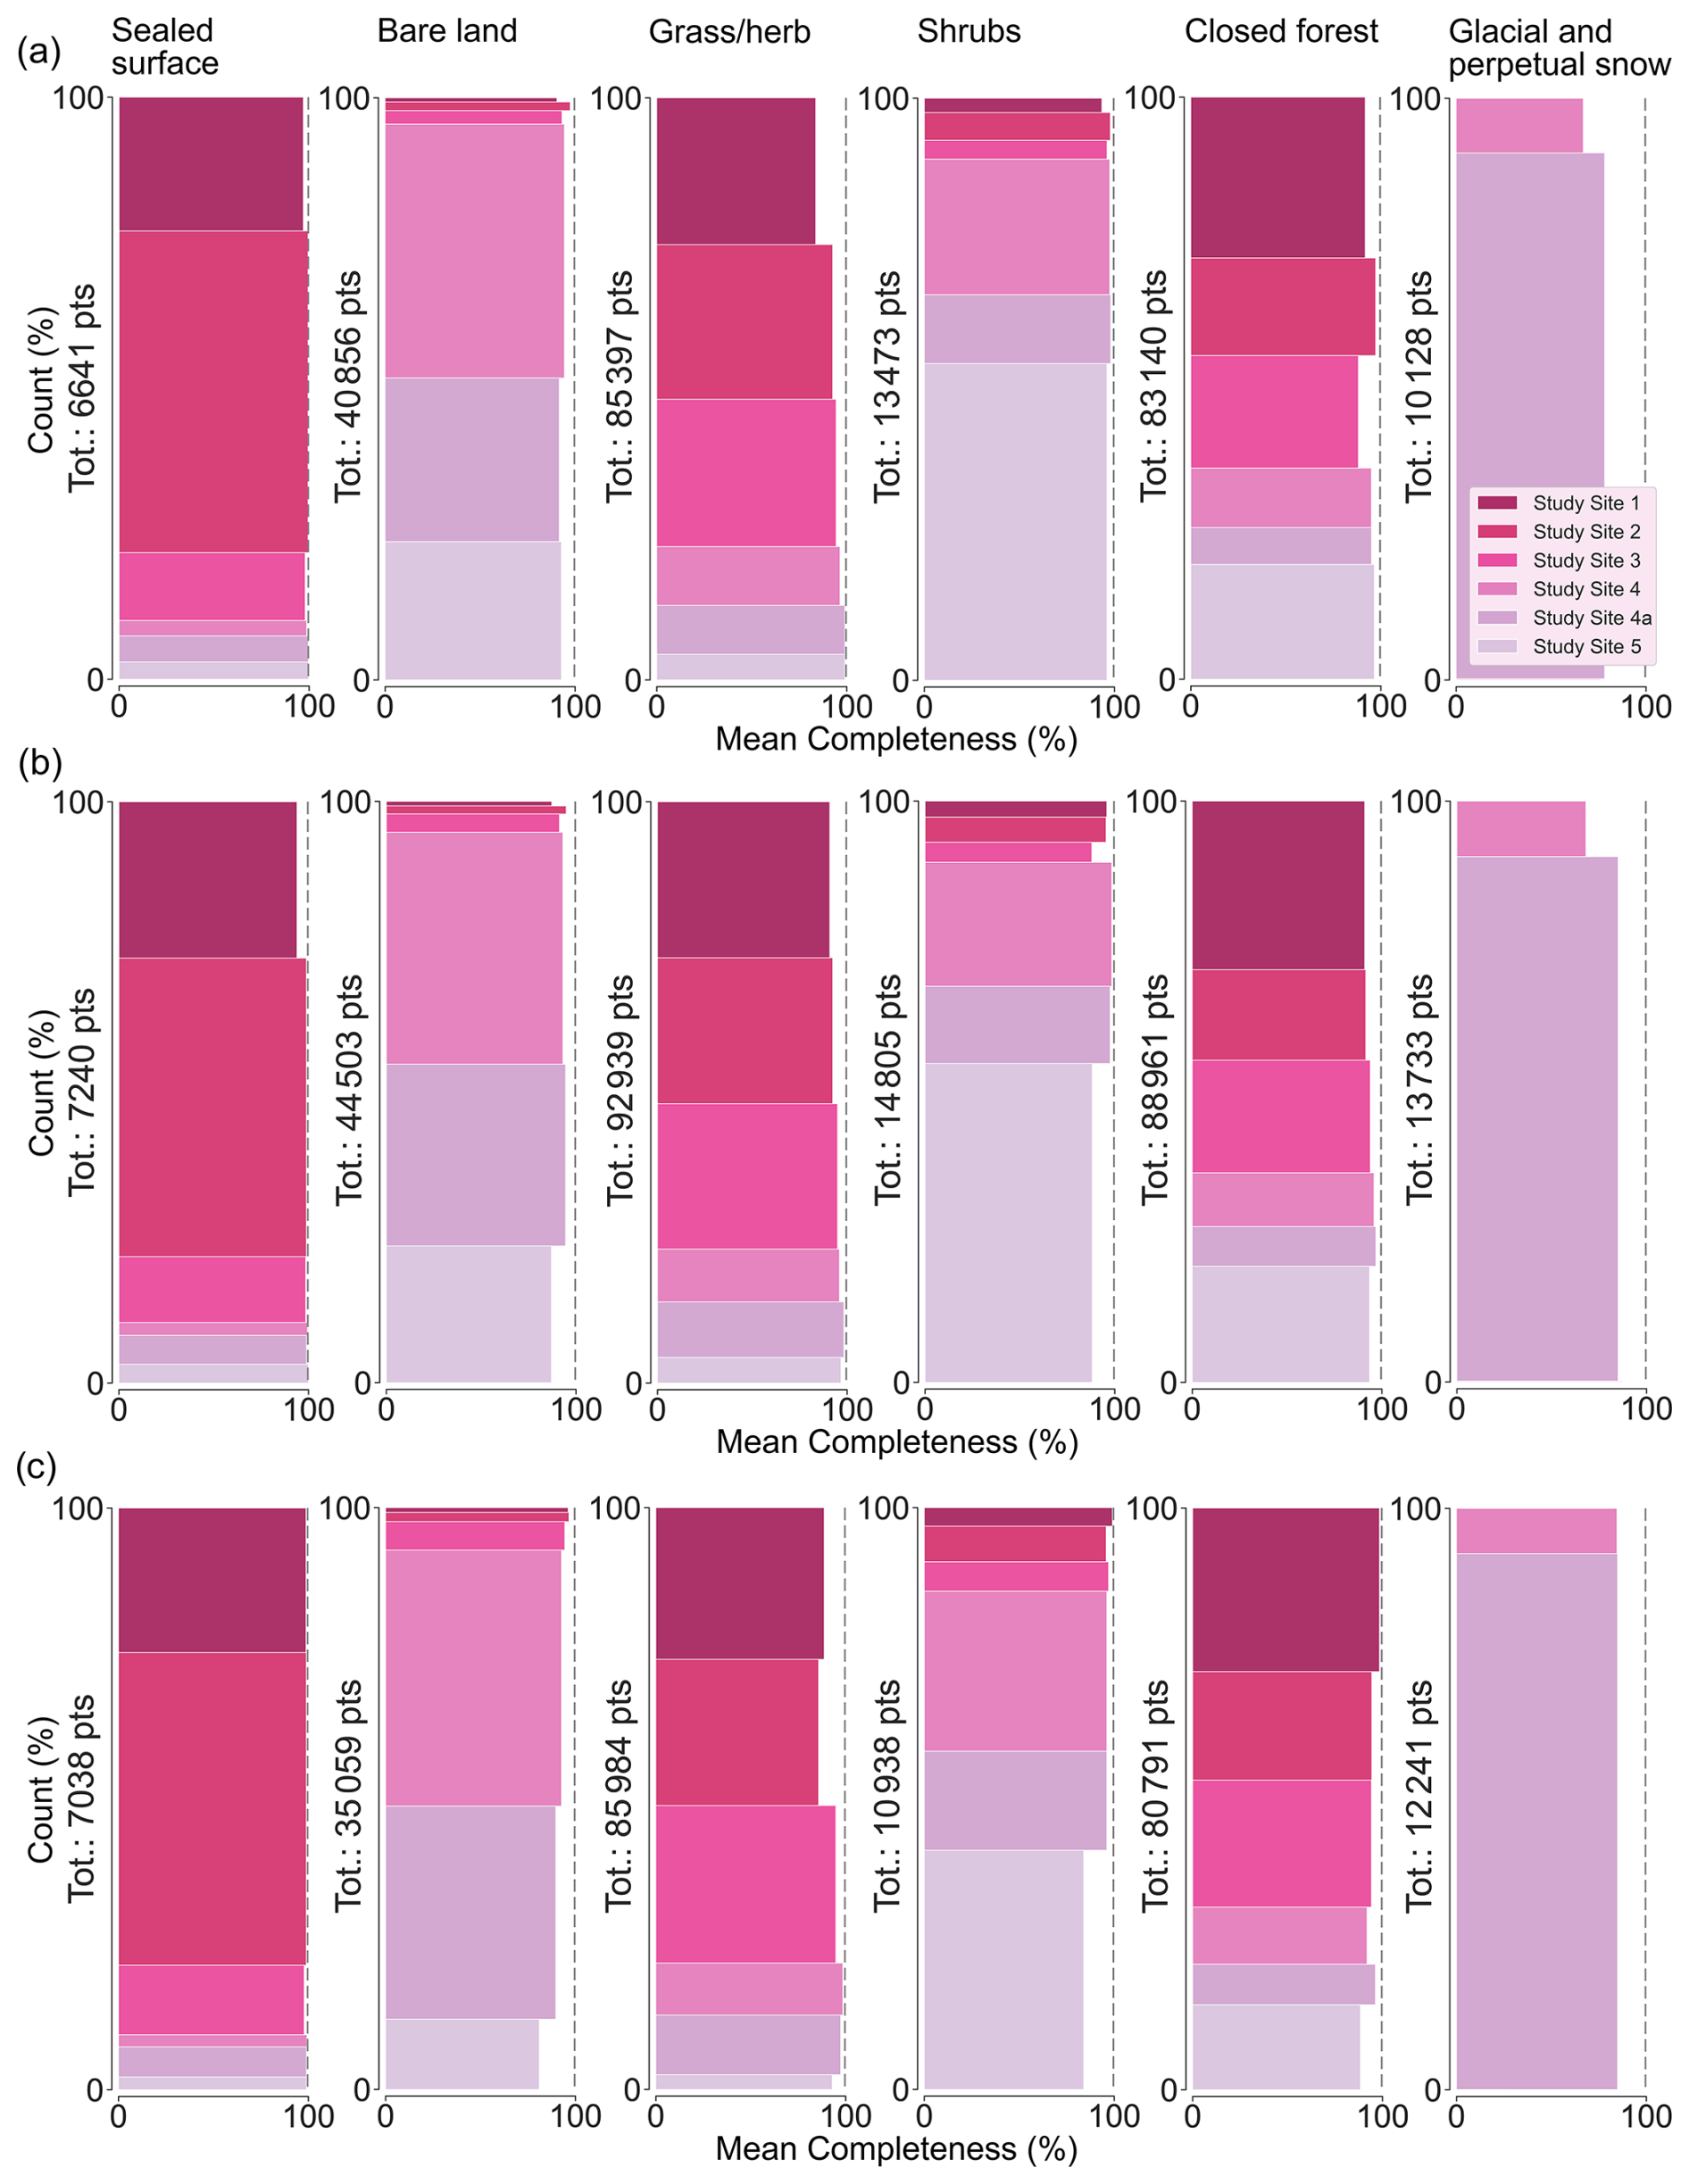
Figure A2Distribution of the mean completeness values, as percentages, for (a) epoch 2, (b) epoch 3, and (c) epoch 4, across the six study sites and the six land cover classes – sealed surface, bare land, grass/herb, shrub, closed forest, and glacial and perpetual snow. The last class is only present in study sites 4, 4a, and 5.
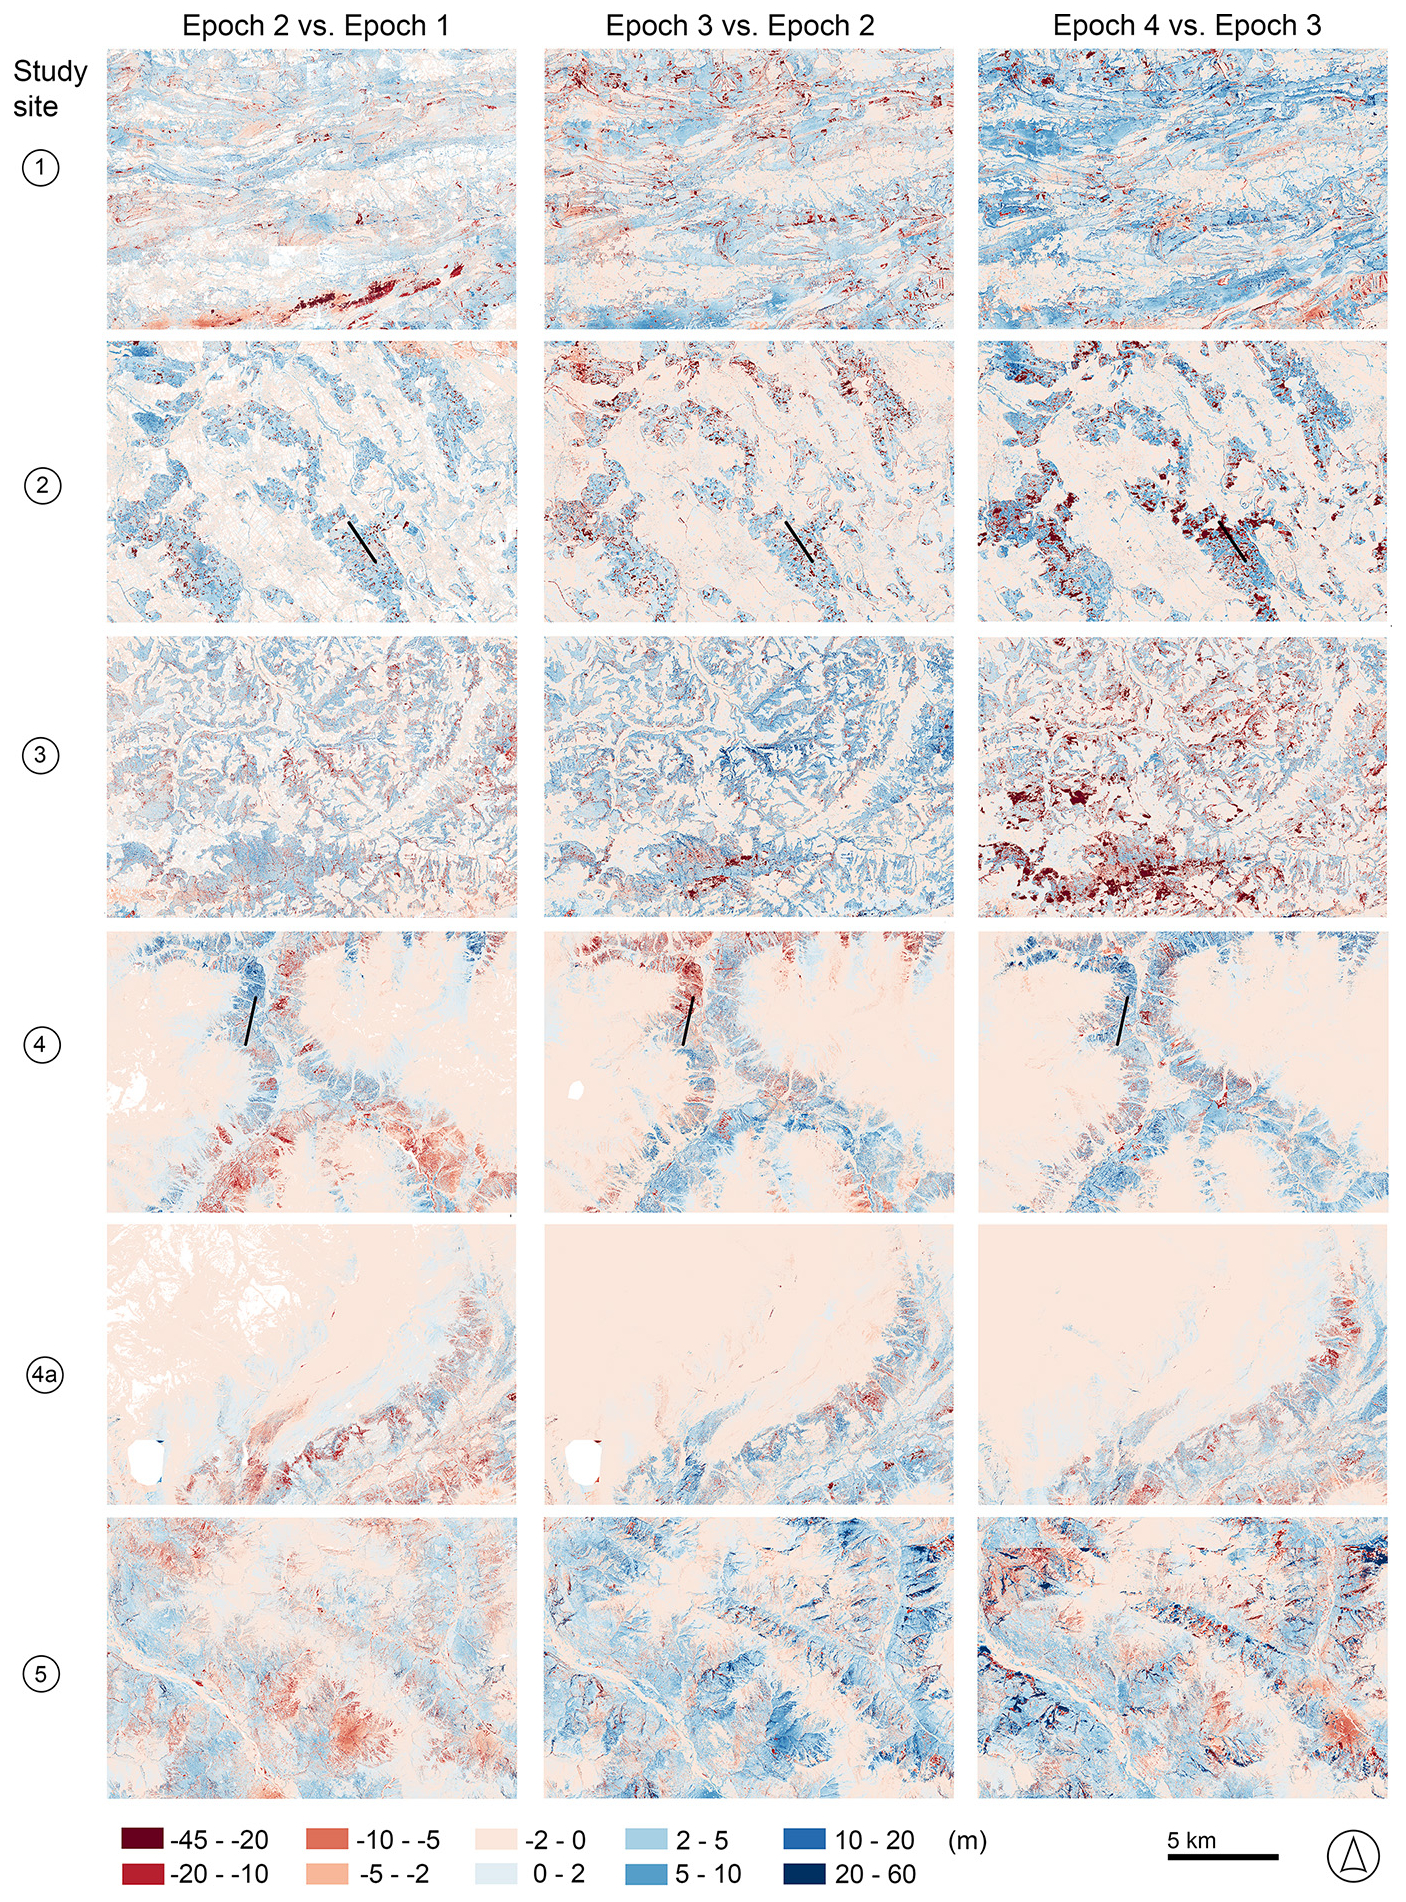
Figure A3The height difference between the vegetation height models (VHMs) of consecutive epochs for each study site (1–5). The black line in study sites 2 and 4 indicates the location of the profile shown in Fig. 10.
Table A1Mean completeness values (as percentages) for each epoch over the six study sites and for the six land cover classes. For each class, the number of points used to assess the accuracy is provided. NA indicates not available.
MM and CG designed the study. MM processed and generated all the data. LP and MM analysed the dataset. LP prepared all the figures and tables. LP and MM wrote the manuscript. All authors contributed to the discussion and editing of the text.
The contact author has declared that none of the authors has any competing interests.
Publisher's note: Copernicus Publications remains neutral with regard to jurisdictional claims made in the text, published maps, institutional affiliations, or any other geographical representation in this paper. While Copernicus Publications makes every effort to include appropriate place names, the final responsibility lies with the authors. Views expressed in the text are those of the authors and do not necessarily reflect the views of the publisher.
This study was supported by the Swiss National Forest Inventory (NFI). We thank the Federal Statistical Office (FSO) and the Federal Office of Topography, swisstopo, for providing access to the historical photographs. We are grateful to Holger Heisig (swisstopo) for the successful semiautomatic orientation of thousands of historical images and fruitful and interesting discussions about this source of data and to Melissa Dawes for professional language editing on an earlier version of the paper.
This study was carried out in the framework of the Swiss National Forest Inventory (NFI), a cooperative effort between the Swiss Federal Institute for Forest, Snow and Landscape Research (WSL) and the Swiss Federal Office for the Environment (FOEN).
This paper was edited by Alexander Gruber and reviewed by two anonymous referees.
Abegg, M., Bösch, R., Kükenbrink, D., and Morsdorf, F.: Tree volume estimation with terrestrial laser scanning – testing for bias in a 3D virtual environment, Agr. Fores. Meteorol., 331, 109348, https://doi.org/10.1016/j.agrformet.2023.109348, 2023.
Belart, J. M., Magnússon, E., Berthier, E., Gunnlaugsson, Á. Þ., Pálsson, F., Aðalgeirsdóttir, G., Jóhannesson, T., Thorsteinsson, T., and Björnsson, H.: Mass balance of 14 Icelandic glaciers, 1945–2017: spatial variations and links with climate, Front. Earth Sci., 8, 163, https://doi.org/10.3389/feart.2020.00163, 2020.
Berveglieri, A., Tommaselli, A. M. G., Imai, N. N., Ribeiro, E. A. W., Guimaraes, R. B., and Honkavaara, E.: Identification of successional stages and cover changes of tropical forest based on digital surface model analysis, IEEE J. Select. Top. Appl. Earth Obs. Remote Sens., 9, 5385–5397, https://doi.org/10.1109/JSTARS.2016.2606320, 2016.
Berveglieri, A., Imai, N. N., Tommaselli, A. M., Casagrande, B., and Honkavaara, E.: Successional stages and their evolution in tropical forests using multi-temporal photogrammetric surface models and superpixels, ISPRS J. Photogram. Remote Sens., 146, 548–558, https://doi.org/10.1016/j.isprsjprs.2018.11.002, 2018.
BFS – Bundesamt für Statistik: Arealstatistik Schweiz – Nomenklatur 2004, https://www.bfs.admin.ch/bfs/de/home/statistiken/raum-umwelt/nomenklaturen/arealstatistik.html (last access: 29 August 2024), 2024.
Bolles, K. C. and Forman, S. L.: Evaluating landscape degradation along climatic gradients during the 1930s dust bowl drought from panchromatic historical aerial photographs, United States Great Plains, Front. Earth Sci., 6, 153, https://doi.org/10.3389/feart.2018.00153, 2018.
Bożek, P., Janus, J., and Mitka, B.: Analysis of changes in forest structure using point clouds from historical aerial photographs, Remote Sens., 11, 2259, https://doi.org/10.3390/rs11192259, 2019.
Cusicanqui, D., Rabatel, A., Vincent, C., Bodin, X., Thibert, E., and Francou, B.: Interpretation of volume and flux changes of the Laurichard rock glacier between 1952 and 2019, French Alps, J. Geophys. Res.-Earth, 126, e2021JF006161, https://doi.org/10.1029/2021JF006161, 2021.
Denzinger, F., Machguth, H., Barandun, M., Berthier, E., Girod, L., Kronenberg, M., Usubaliev, R., and Hoelzle, M.: Geodetic mass balance of Abramov Glacier from 1975 to 2015, J. Glaciol., 67, 331–342, https://doi.org/10.1017/jog.2020.108, 2021.
DeVenecia, K., Walker, S., and Bingcai, Z.: New Approaches to Generating and Processing High Resolution Elevation Data with Imagery, PhotogrammetricWeek '07, Wichmann Verlag, Heidelberg, 297–308 pp., https://phowo.ifp.uni-stuttgart.de/publications/phowo07/330DeVenecia.pdf (last access: 19 October 2025), 2007.
Fleischer, F., Haas, F., Piermattei, L., Pfeiffer, M., Heckmann, T., Altmann, M., Rom, J., Stark, M., Wimmer, M. H., Pfeifer, N., and Becht, M.: Multi-decadal (1953–2017) rock glacier kinematics analysed by high-resolution topographic data in the upper Kaunertal, Austria, The Cryosphere, 15, 5345–5369, https://doi.org/10.5194/tc-15-5345-2021, 2021.
Geyman, E. C., van Pelt, W. J. J., Maloof, A. C., Faste Aas, H., and Kohler, J.: Historical glacier change on Svalbard predicts doubling of mass loss by 2100, Nature, 601, 374–379, https://doi.org/10.1038/s41586-021-04314-4, 2022.
Ginzler, C. and Hobi, M. L.: Countrywide stereo-image matching for updating digital surface models in the framework of the Swiss National Forest Inventory, Remote Sens., 7, 4343–4370, https://doi.org/10.3390/rs70404343, 2015.
Ginzler, C.: Variables on the sample plot captured by the stereo GIS application, in: Managing forest ecosystems, edited by: Fischer, C. and Traub, B., Vol. 35, Swiss National Forest Inventory – Methods and models of the fourth assessment, 111-124 pp., https://doi.org/10.1007/978-3-030-19293-8_6, 2019.
Ginzler, C., Price, B., Weber, D., Hobi, M., and Marty, M.: Dynamik der Vegetationshöhen im Schweizer Wald, Swiss Forest. J., 172, 310–317, https://doi.org/10.3188/szf.2021.0310, 2021.
Gomez, C., Hayakawa, Y., and Obanawa, H.: A study of Japanese landscapes using structure from motion derived DSMs and DEMs based on historical aerial photographs: New opportunities for vegetation monitoring and diachronic geomorphology, Geomorphology, 242, 11–20, https://doi.org/10.1016/j.geomorph.2015.02.021, 2015.
Heisig, H. and Simmen, J. L.: Re-engineering the past: countrywide geo-referencing of archival aerial imagery, J. Photogram. Remote Sens. Geoinf. Sci., 89, 487–503, https://doi.org/10.1007/s41064-021-00162-z, 2021.
Höhle, J. and Höhle, M.: Accuracy assessment of digital elevation models by means of robust statistical methods, ISPRS J. Photogram. Remote Sens., 64, 398–406, https://doi.org/10.1016/j.isprsjprs.2009.02.003, 2009.
Hufkens, K., de Haulleville, T., Kearsley, E., Jacobsen, K., Beeckman, H., Stoffelen, P., Vandelook, F., Meeus, S., Amara, M., Van Hirtum, L., and Van den Bulcke, J.: Historical aerial surveys map long-term changes of forest cover and structure in the Central Congo Basin, Remote Sens., 12, 638, https://doi.org/10.3390/rs12040638, 2020.
Hudak, A. T. and Wessman, C. A.: Textural analysis of historical aerial photography to characterise woody plant encroachment in South African Savanna, Remote Sens. Environ., 66, 317–330, https://doi.org/10.1016/S0034-4257(98)00078-9, 1998.
Kadmon, R. and Harari-Kremer, R.: Studying long-term vegetation dynamics using digital processing of historical aerial photographs, Remote Sens. Environ., 68, 164–176, https://doi.org/10.1016/S0034-4257(98)00109-6, 1999.
Knuth, F., Shean, D., Bhushan, S., Schwat, E., Alexandrov, O., McNeil, C., Dehecq, A., Florentine, C., and O'Neel, S.: Historical Structure from Motion (HSfM): Automated processing of historical aerial photographs for long-term topographic change analysis, Remote Sens. Environ. 285, 113379, https://doi.org/10.1016/j.rse.2022.113379, 2023.
Korsgaard, N. J., Nuth, C., Khan, S. A., Kjeldsen, K. K., Bjørk, A. A., Schomacker, A., and Kjær, K. H.: Digital elevation model and orthophotographs of Greenland based on aerial photographs from 1978–1987, Sci. Data, 3, 160032, https://doi.org/10.1038/sdata.2016.32, 2016.
Kulha, N., Pasanen, L., and Aakala, T.: How to calibrate historical aerial photographs: a change analysis of naturally dynamic boreal forest landscapes, Forests, 9, 631, https://doi.org/10.3390/f9100631, 2018.
Kupidura, P., Osińska-Skotak, K., Lesisz, K., and Podkowa, A.: The efficacy analysis of determining the wooded and shrubbed area based on archival aerial imagery using texture analysis, ISPRS Int. J. Geo-Inf., 8, 450, https://doi.org/10.3390/ijgi8100450, 2019.
Magnússon, E., Muñoz-Cobo Belart, J., Pálsson, F., Ágústsson, H., and Crochet, P.: Geodetic mass balance record with rigorous uncertainty estimates deduced from aerial photographs and lidar data – case study from Drangajökull ice cap, NW Iceland, The Cryosphere, 10, 159–177, https://doi.org/10.5194/tc-10-159-2016, 2016.
Marty, M., Piermattei, L., Ginzler, C., and Waser, L. T.: Countrywide DSM and VHM from historical aerial images, Envidat [data set], https://doi.org/10.16904/envidat.528, 2024.
Micheletti, N., Lane, S. N., and Chandler, J. H.: Application of archival aerial photogrammetry to quantify climate forcing of alpine landscapes, Photogram. Rec., 30, 143–165, https://doi.org/10.1111/phor.12099, 2015.
Morgan, J. L. and Gergel, S. E.: Quantifying historic landscape heterogeneity from aerial photographs using object-based analysis, Landscape Ecol., 25, 985–998, https://doi.org/10.1007/s10980-010-9474-1, 2010.
Muhammed, M. A., Hailu, B. T., Miehe, G., Wraase, L., Nauss, T., and Zeuss, D.: High-resolution digital elevation models and orthomosaics generated from historical aerial photographs (since the 1960s) of the Bale Mountains in Ethiopia, Earth Syst. Sci. Data, 15, 5535–5552, https://doi.org/10.5194/essd-15-5535-2023, 2023.
Nebiker, S., Lack, N., and Deuber, M.: Building change detection from historical aerial photographs using dense image matching and object-based image analysis, Remote Sens., 6, 8310–8336, https://doi.org/10.3390/rs6098310, 2014.
Nurminen, K., Litkey, P., Honkavaara, E., Vastaranta, M., Holopainen, M., Lyytikäinen-Saarenmaa, P., Kantola, T., and Lyytikäinen, M.: Automation aspects for the georeferencing of photogrammetric aerial image archives in forested scenes, Remote Sens., 7, 1565–1593, https://doi.org/10.3390/rs70201565, 2015.
Peppa, M. V., Mills, J. P., Fieber, K. D., Haynes, I., Turner, S., Turner, A., Douglas, M., and Bryan, P. G.: Archaeological feature detection from archive aerial photography with a SfM-MVS and image enhancement pipeline, Int. arch. Photogramm. Remote Sens. Spat. Inf. Sci., 42, 869–875, https://doi.org/10.5194/isprs-archives-XLII-2-869-2018, 2018.
Piermattei, L., Marty, M., Ginzler, C., Pöchtrager, M., Karel, W., Ressl, C., Pfeifer, N., and Hollaus, M.: Pléiades satellite images for deriving forest metrics in the Alpine region, Int. J. Appl. Earth Obs. Geoinf., 80, 240–256, https://doi.org/10.1016/j.jag.2019.04.008, 2019.
Piermattei, L., Heckmann, T., Betz-Nutz, S., Altmann, M., Rom, J., Fleischer, F., Stark, M., Haas, F., Ressl, C., Wimmer, M. H., and Pfeifer, N.: Evolution of an Alpine proglacial river during 7 decades of deglaciation, Earth Surf. Dynam., 11, 383–403, https://doi.org/10.5194/esurf-11-383-2023, 2023.
Price, B., Waser, L. T., Wang, Z., Marty, M., Ginzler, C., and Zellweger, F.: Predicting biomass dynamics at the national extent from digital aerial photogrammetry, Int. J. Appl. Earth Obs. Geoinf., 90, 102116, https://doi.org/10.1016/j.jag.2020.102116, 2020.
Risbøl, O., Briese, C., Doneus, M., and Nesbakken, A.: Monitoring cultural heritage by comparing DEMs derived from historical aerial photographs and airborne laser scanning, J. Cult. Herit., 16, 202–209, https://doi.org/10.1016/j.culher.2014.04.002, 2015.
Schwat, E., Istanbulluoglu, E., Horner-Devine, A., Anderson, S., Knuth, F., and Shean, D.: Multi-decadal erosion rates from glacierized watersheds on Mount Baker, Washington, USA, reveal topographic, climatic, and lithologic controls on sediment yields, Geomorphology, 438, 108805, https://doi.org/10.1016/j.geomorph.2023.108805, 2023.
swisstopo: swissALTI3D version 2017, https://backend.swisstopo.admin.ch/fileservice/sdweb-docs-prod-swisstopoch-files/files/2023/11/14/cf4990a1-6bfb-4331-b990-a894d686266e.pdf (last access: 29 August 2024), 2017.
swisstopo: Geodetic points, https://opendata.swiss/en/dataset/lagefixpunkte-lfp1-landesvermessung (last access: 29 August 2024), 2023.
swisstopo: Aerial photographs, https://www.swisstopo.admin.ch/en/analogue-aerial-photographs (last access: 29 August 2024), 2024a.
swisstopo: National Map , https://www.swisstopo.admin.ch/en/national-map-1-25000 (last access: 29 August 2024), 2024b.
swisstopo: swissALTI3D technical information, https://www.swisstopo.admin.ch/en/height-model-swissalti3d (last access: 29 August 2024), 2024c.
swisstopo: The topographic Landscape Model TLM, https://www.swisstopo.admin.ch/en/information-topographic-landscape-model (last access: 29 August 2024), 2024d.
Vastaranta, M., Niemi, M., Wulder, M. A., White, J. C., Nurminen, K., Litkey, P., Honkavaara, E., Holopainen, M., and Hyyppä, J.: Forest stand age classification using time series of photogrammetrically derived digital surface models, Scand. J. Forest Res., 31, 194–205, https://doi.org/10.1080/02827581.2015.1060256, 2016.
Véga, C. and St-Onge, B.: Height growth reconstruction of a boreal forest canopy over a period of 58 years using a combination of photogrammetric and lidar models, Remote Sens. Environ., 112, 1784–1794, https://doi.org/10.1016/j.rse.2007.09.002, 2008.
Wang, Z., Ginzler, C., Eben, B., Rehush, N., and Waser, L. T.: Assessing changes in mountain treeline ecotones over 30 years using CNNs and historical aerial images, Remote Sens., 14, 2135, https://doi.org/10.3390/rs14092135, 2022.
Waser, L. T., Baltsavias, E., Ecker, K., Eisenbeiss, H., Ginzler, C., Küchler, M., Thee, P., and Zhang, L.: High-resolution digital surface models (DSMs) for modelling fractional shrub/tree cover in a mire environment, Int. J. Remote Sens., 29, 1261–1276, https://doi.org/10.1080/01431160701736422, 2008a.
Waser, L. T., Baltsavias, E., Ecker, K., Eisenbeiss, H., Feldmeyer-Christe, E., Ginzler, C., and Zhang, L.: Assessing changes of forest area and shrub encroachment in a mire ecosystem using digital surface models and CIR aerial images, Remote Sens. Environ., 112, 1956–1968, https://doi.org/10.1016/j.rse.2007.09.015, 2008b.