the Creative Commons Attribution 4.0 License.
the Creative Commons Attribution 4.0 License.
 | 07 Feb 2025
HOLSEA-NL: a Holocene water level and sea level indicator dataset for the Netherlands
Kim M. Cohen
Roderik S. W. van de Wal
Deltas and coastal plains worldwide developed under the influence of relative sea level rise (RSLR) during the Holocene. In the Netherlands, Holocene RSLR results from both regional sea level rise and regional subsidence patterns, mainly caused by glacial isostatic adjustment (GIA: Scandinavian forebulge collapse) and longer-term North Sea Basin tectono-sedimentary subsidence. Past coastal and inland water levels are preserved in geological indicators marking the gradual drowning of an area, for example, basal peats. Such geological water level indicators have been used in the Netherlands for varying types of research. However, uniform overviews of these data exist only for smaller local subsets, rather than for the entire Netherlands. In this paper, we present a dataset of 712 Holocene water level indicators from the Dutch coastal plain that are relevant for studying RSLR and regional subsidence, compiled in HOLSEA workbook format (https://doi.org/10.5281/zenodo.11098446, De Wit and Cohen, 2024). This format was expanded to allow for the registration of basal-peat-type geological indicators, the documentation of Dutch-setting-specific parameters and their accompanying uncertainties, the assessment of the indicative meaning, and the appropriate correction of the raw vertical positions of the indicators. Overall, our new, internally consistent, expanded documentation provided for the water level indicators encourages users to choose the information relevant to their research and report RSLR uncertainties transparently. With respect to the indicators, 59 % were collected in 1950–2000, mainly in academic studies and survey mapping campaigns; 37 % were collected in 2000–2020 in academic studies and archaeological surveying projects; and 4 % were collected in this study, with the latter mainly being collected in previously undersampled central and northern regions of the Netherlands. Prominent regional differences exist in the vertical position and abundance of the indicators. Older indicators in our dataset are primarily located in the deeper seaward area of the Netherlands. These indicators correspond well with previous transgression reconstructions partly based on the same data. The younger, landward set of indicators in the Rhine–Meuse delta inland and Flevoland regions corresponds to the transgression phase reaching further inland, from 8000 cal BP onwards. Northern indicators of Middle Holocene age (8–5 ka cal BP) generally lie 2–3 m lower than those in the south. This difference is less for younger data, showing spatial and temporal variation in RSLR throughout the Netherlands.
- Article
(8216 KB) - Full-text XML
- BibTeX
- EndNote


Holocene water level indicators have been the subject of research in the Netherlands for decades. Previous studies have collected geological water level indicators for relative sea level reconstructions (Jelgersma, 1961; Van de Plassche, 1982; Hijma and Cohen, 2019), geological mapping of the Dutch coastal deltaic plain (e.g. Berendsen and Stouthamer, 2002), wetland palaeoenvironmental reconstructions (e.g. Vos, 2015b), and archaeological excavation and dating (e.g. Verbruggen, 1992). These activities have resulted in the accumulation of an extensive number of primary water level indicator data (e.g. Jelgersma, 1961; Van de Plassche, 1982; Meijles et al., 2018; Hijma and Cohen, 2019; Quik et al., 2022). Geological water level indicators also carry information for studying various types of subsidence, namely, their depth positions with increasing age as well as the local and regional variabilities therein (Kiden et al., 2002; Cohen, 2005; Van Asselen, 2011; Koster et al., 2017). The total reconstructed relative water level rise signal can be separated into a Holocene water level rise and a land subsidence history. This is possible by evaluating geological records in combination with (1) independent sea level and subsidence reconstructions and (2) geophysical modelling simulation output. As such, subsets of water level indicators are used to verify location-specific relative sea level rise (RSLR) output of glacial isostatic adjustment (GIA) modelling, which incorporates ice sheet deglaciation history and Earth rheology models to resolve RSLR globally (Lambeck, 1995; Kiden et al., 2002; Shennan and Horton, 2002; Vink et al., 2007; Bradley et al., 2011).
The abundance of geological palaeo-water-level observations in the Netherlands creates a unique opportunity to study Holocene differential subsidence across the entire coastal plain. Currently, an integrated overview of the geological indicator data with consistent documentation is lacking, mainly due to the above-mentioned diversity in data usage purposes. To bridge this gap, we created a systematic overview of the current vertical position of geological indicators; applied a uniform set of consecutive vertical corrections, such as for water depth and compaction; and constructed a consistent error propagation workflow. The aim of this paper is to present this newly compiled dataset of water level indicator points, serving the study of regional relative sea level and groundwater level rise in the Netherlands over the Holocene and generically disclosing and arranging these rich data for inclusion in European and global-scale Holocene RSLR and coastal plain accommodation studies.
Building on previous work, the geological data compilation includes a focused review of the usability of legacy data for relative water level reconstructions. The documentation follows the HOLSEA workbook format for Holocene relative sea level data (Hijma et al., 2015; Khan et al., 2019). The HOLSEA workbook is a versatile data-reporting format that includes correction specifications and metadata (e.g. Hijma and Cohen, 2019; Bungenstock et al., 2021; Creel et al., 2022). It categorises relative sea level data entries as “sea level index points” (SLIPs), “upper limiting data” (ULD), or “lower limiting data” (LLD).
From our study area, a subset of 104 basal-peat dates from the Rhine's lower delta have previously been compiled and published in HOLSEA format (Hijma and Cohen, 2019 – their “Rotterdam” dataset). Hundreds of similar dates containing potential SLIP, ULD, and LLD information, which have not yet been compiled, assessed, and disclosed in HOLSEA format, exist in publications from the 1950s to the 2010s, institutional databases, contextual reports, and unpublished data. To fill this gap, this paper expands the HOLSEA-format-covered data from the Netherlands to a total of 712 samples, further referred to as the HOLSEA-NL dataset.
While compiling the HOLSEA-NL dataset, attention was given to enhancing data usability. First, various vertical correction components are specified that users are recommended to apply, such as fen/swamp water depths and peat decompaction. Additional correction components, such as palaeo-tidal range and long-term background land motion, are optional and can be applied depending on the specific application. Next, the indicative meaning of the water level indicators was reviewed to assess which samples qualify as SLIPs, ULD points, and LLD points. Of these, the ULD category was expanded to allow for characterisation of various groundwater level data points, which are relevant for reconstructing delta plains and inner-lagoon peatland fringe regions as well as identifying regional trends in subsidence (e.g. Cohen, 2005). The indicative meaning of water level indicators differs with respect to the type of deposit and past geographical setting. It is determined based on the sedimentary and biotic facies, the succession criteria on individual geological sampling locations, the spatial position of the sample and criteria on ensembles of samples (e.g. outlier analysis and prioritising seaward locations over inland locations). Lastly, the depth of a past groundwater level (GWL) is calculated from the sample depth and offsetting this based on the sample indicative meaning. For SLIPs and tidally linked ULD and LLD, the past GWL can be upgraded to a past mean sea level (MSL), which is referred to as a relative sea level (RSL) with respect to the present-day MSL. To account for the different reference water levels (RWLs), we documented both the GWL and the RSL in our dataset.
The paper proceeds further as follows: Sect. 2 provides an overview of the study area and its geological setting; Sects. 3–6 outlines the set-up of the dataset; Sect. 3 describes the data inventory, including data requirements and a description of different indicator types; Sect. 4 provides details on the age–depth positions, the systematic vertical corrections, and additional optional adjustments; Sect. 5 presents an overview of the data, with regional and categorical breakdowns; and the final section (Sect. 6) discusses potential applications and limitations of the data.
The Netherlands is located in the southern part of the North Sea Basin. During the Holocene, this area was strongly influenced by RSLR resulting from the deglaciation of land ice and regional subsidence caused by sinking of the North Sea sedimentary basin (Kooi et al., 1998) and glacial isostatic adjustment (GIA) remaining from the last glacial period (Lambeck, 1995; Kiden et al., 2002; Vink et al., 2007; Bradley et al., 2011). The relatively shallow depth of the southern North Sea and the variation in sediment fluxes throughout the Holocene played an important role in the development of the coastal area of the Netherlands. This setting and sedimentation history also determined how and when different water level indicators could form and, therefore, provides relevant context for understanding the variability in the indicative meaning of geological water level indicators (Sects. 3–5). Whenever a peat layer has formed on top of consolidated sediments under favourable landscape conditions (see Sect. 3) and has been preserved and sampled (Sect. 1), it is suitable as a water level rise indicator (SLIP, ULD primary (tidal), ULD river gradient, and ULD local GWL in Fig. 2) and, in some cases, even as sea level indicator (LLD, SLIP, and ULD primary in Fig. 2). The geological development of the Netherlands is based on hundreds of thousands of borehole observations, thousands of radiocarbon dates, further dating, and palaeoenvironmental evidence collected in parallel regional and national campaigns by multiple surveying agencies (Pons and Wiggers, 1960; Zagwijn, 1986; Berendsen and Stouthamer, 2001; Van der Meulen et al., 2013; Vos, 2015b; Cohen et al., 2017a, b; Pierik and Cohen, 2020). An important aspect of these studies was to provide insight into the timing and the rates of water level rise by dating coastal peats (basal and intercalated; transgressive and regressive). As a result, a detailed reconstruction of peat formation and further Holocene development on the Dutch coastal plain is possible.
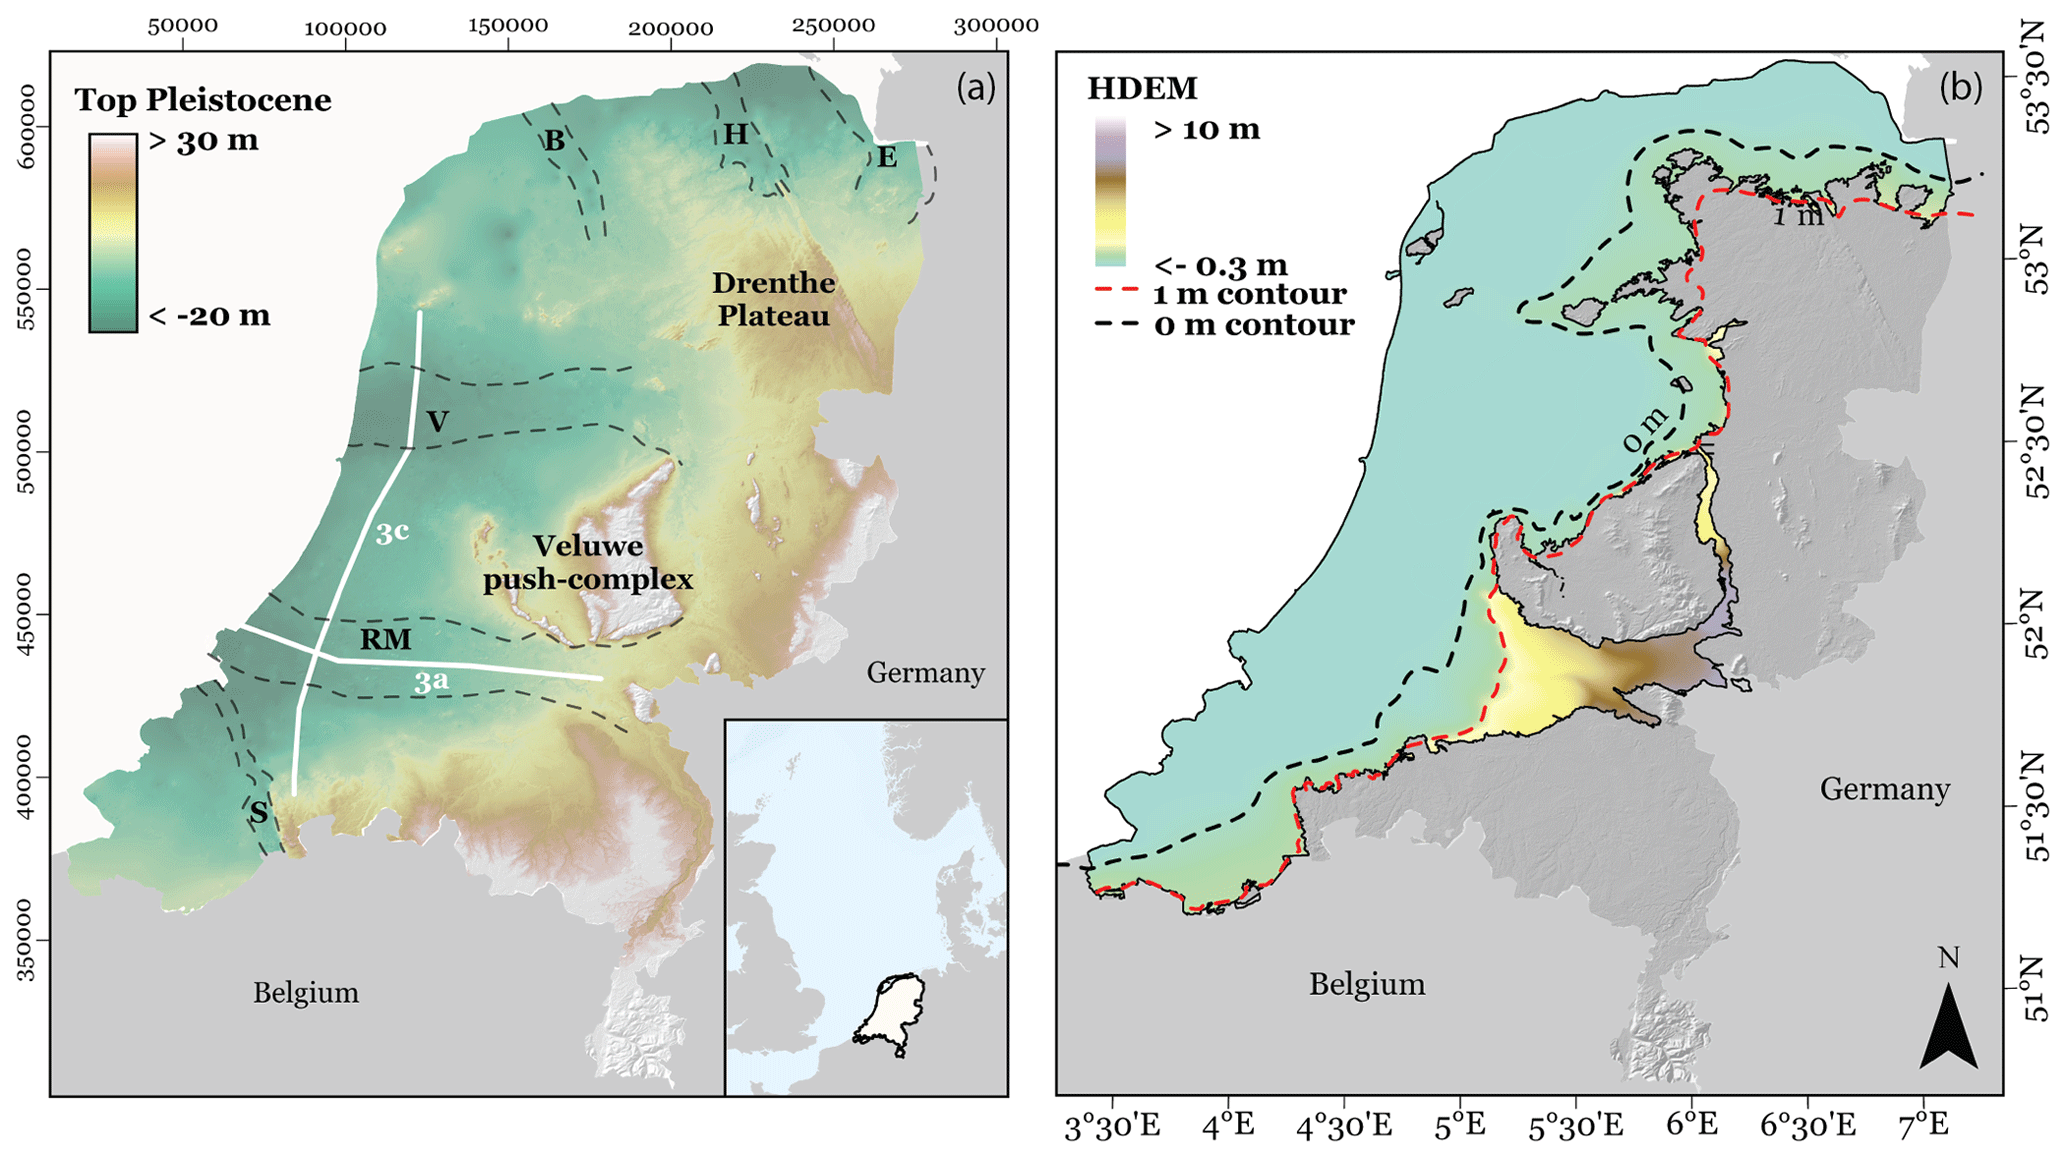
Figure 1(a) Digital elevation model of the top of Pleistocene deposits, corrected for Holocene erosion (Stafleu et al., 2012; Cohen et al., 2017a, b; Koster et al., 2017). The labels and dashed outlines show the location of the main palaeovalleys: B – Boorne; H – Hunze; E – Ems; V – Vecht; RM – Rhine–Meuse; S – Scheldt. The white lines show the orientation of the example cross-sections from Fig. 3. (b) High-stand digital elevation model (HDEM) regional groundwater table surface reconstructed for 1000 cal yr BP (Cohen, 2005; Cohen et al., 2017a, b; locally modified). The 0 m MSL (dashed black) contour and +1 m MSL (dashed red) contour are shown. The study area contour is adopted from the Pleistocene landform outline in national geomorphological and archaeological landscape mapping (as in Cohen et al., 2017a, b) and roughly coincides with the + 1 m elevation contour line outside the Rhine–Meuse Delta. Projection: RD (EPSG:28992)
At the onset of the Holocene (11 650 cal BP), the water level in the North Sea was still low, with the shallow southern seafloor largely exposed. Pleistocene depositional landforms constituted the Netherlands in the form of periglacial aeolian dune fields, cover sands, and river valleys dissecting older terraced plateaus and hills (Figs. 1a and 2a). Below the Holocene coastal plain of the western Netherlands, two east–west-running Late Pleistocene valleys (palaeovalleys) are of relevance (Busschers et al., 2007; Vos, 2015b; Peeters et al., 2016; Koster et al., 2017). As they are the lowest-elevation areas, they were the first to be affected by marine transgression and, thus, developed the thickest Holocene records: the southern one hosted the Rhine–Meuse system of the time, which was joined by the Scheldt in the nearshore region; the northern one was drained by the Overijsselse Vecht underfit system (Fig. 1a). Locally, inland dunes formed along river channels of each of these systems (Bennema and Pons, 1952; Wiggers, 1955; Gotjé, 1993; Berendsen and Stouthamer, 2001; Wolfert and Maas, 2007; Kasse and Aalbersberg, 2019), features that Holocene water level rise studies have specifically targeted (see below). Below the northern coastal plain, smaller palaeovalley systems of the Boorne, Hunze, and Ems system are featured (e.g. Vos, 2015b; Meijles et al., 2018). Interfluvial relief in the centre and north of the country shows push complexes and a main till sheet that are remnants of glaciation and deglaciation in the Saalian (the penultimate ice age; ca. 150 000 years ago, within Marine Isotope Stage 6). The latter till sheet, called the “Drenthe Plateau” (Fig. 1a), forms a shallow aquitard, affecting pre-transgression groundwater tables (Van den Berg and Beets, 1987; Quik et al., 2021). Present-day relief expression of the till sheet in the north, the central ice-pushed ridge complex, and southwest Pleistocene fluvial terraces determined the inland boundary of the area of interest in this paper (Fig. 1b).
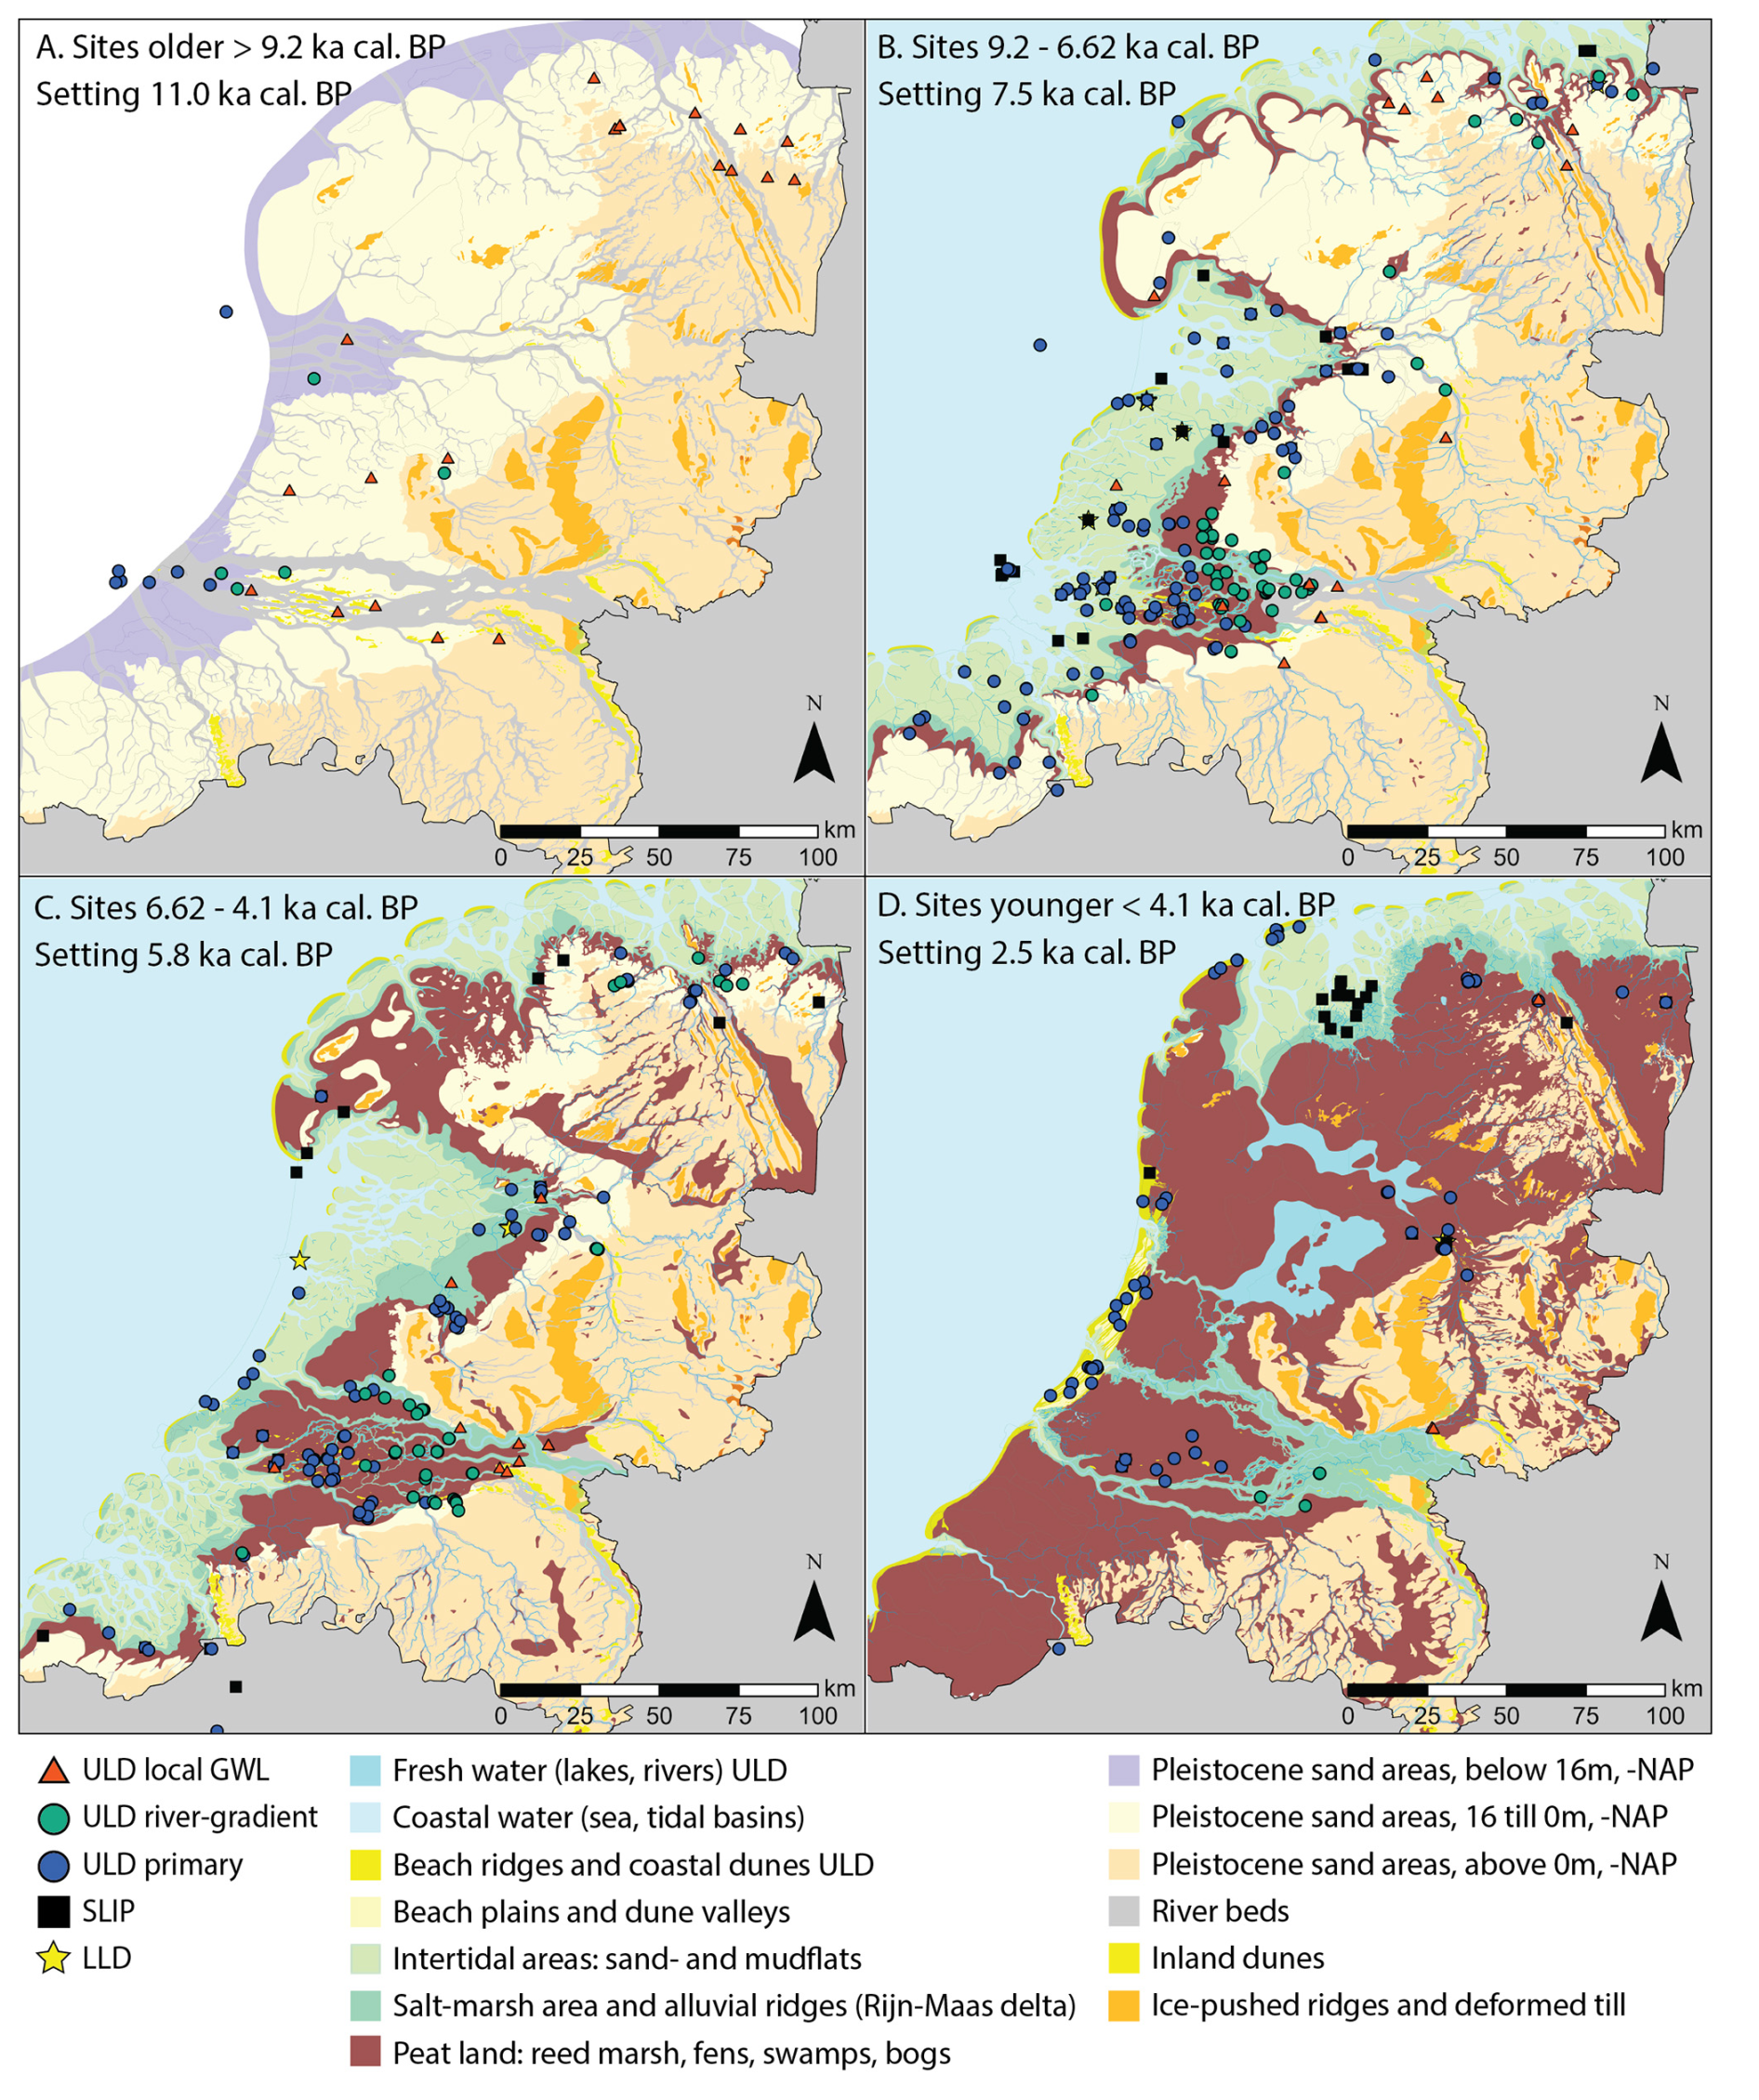
Figure 2Geological water level indicator site locations (this paper and dataset; split into four time slices) plotted over a national palaeogeographical map series (Vos et al., 2020). The indicators shown have an age surrounding the date stamp of each selected map.
During the Early Holocene (11.6–8.3 ka cal BP), the sea level increased from 60–50 m to approximately 25–20 m below the current MSL, which steadily inundated the southern North Sea, eventually establishing coastlines in the vicinity of the modern one. River waters and inland flood basin groundwater tables were affected by the downstream rise, resulting in a decrease in the river gradient and concurrent rise in the inland groundwater levels. This initiated the growth of peat in swamps and fens on former floodplains and along the drowning valley edges. From dating such transgressive peats (“basal peats”), overlain by later marine deposition, the earliest water level indicators are obtained in the nearshore region (Fig. 2a) and, eventually, across the study area, following the palaeovalleys as gateways for the transgressive peats (Fig. 2b).
As the Middle Holocene (8.3–4.2 ka cal BP) commenced, the decelerating sea level rise pushed the transgression further landward, as is evident from basal peats buried by tidal muds. Simultaneously, a beach barrier system and back-barrier Rhine–Meuse Delta were established (Fig. 2b and c) (Berendsen and Stouthamer, 2002; Vos, 2015b). The former valleys became tidally dominated embayments, with intertidal shoals and fringing supratidal marshlands on the landward side (Fig. 2b and c). This changed when the beach ridge complex matured during the Middle Holocene. The decreasing rate of sea level rise and the supply of sediments caused most inlets on the coastline of the western Netherlands to close around 5.8 ka cal BP (Fig. 2c) (Beets and Spek, 2000; Hijma and Cohen, 2011). These developments and the water supply from the Rhine–Meuse Delta helped turn the back-barrier area into a freshening lagoon in which widespread peat formation began. Areas just north remained tidally dominated for some 1500 years longer. The flood basin of the so-called Bergen tidal inlet transformed into a lagoon, gradually developing an expanding freshwater peat rim (Fig. 2c) as the inlet decreased in size from 5 ka cal BP onwards (Beets and Van der Spek, 2000). Around 3.5 ka cal BP, the tidal inlet of Bergen also finally closed, promoting the further spread of peatland on the coastal plain (Fig. 2d). In the very north, a series of tidal inlets remained functional because of the relatively stronger subsidence and relative lack of sediment supply in this area. Such features still persist today as the several inlets separating the Frisian Islands. The adjacent tidal basins form the Wadden Sea, its supratidal salt marshes, and coastal peatlands currently bordering the mainland of the northern Netherlands (Fig. 2d). Although peat formation continued, it is difficult to find young peat layers (<2.5 ka cal BP). This is because many of the young peat layers disappeared, partly due to erosion by rivers or the sea but predominantly due to large-scale peat excavations that have occurred since the Middle Ages when peat was mined extensively (Pierik et al., 2017). Human activity also caused large-scale soft-soil subsidence. This is still ongoing, mainly caused by the lowering of the groundwater level, resulting in the compaction of clay and peat, and peat oxidation (Van Asselen, 2011; Erkens et al., 2016). To minimise the influence of natural and human-induced soft-soil subsidence on the elevation of the water level indicators for GWL and RSL study, mainly basal samples were considered (see Sect. 3).
In summary, during the Holocene, peat formed in abundance throughout most of our study area, at basal positions in the Holocene wedge and at shallower positions. From 9.2 until 5 ka cal BP, this occurred under transgressive influences, lasting the longest in the north, and from 5.5 ka cal BP onwards, it occurred under regressive circumstances, starting from the south and moving northwards. Much of the peat from the younger period disappeared, mainly due to human activity in the past 1000 years, leaving a gap in the record for the most recent period.
The water level indicators collected in the Netherlands for different purposes over the past decades (Sect. 1) are of different types, but the great majority (640 out of 712 entries in the database) consists of sampled and dated basal peat layers from a range of settings (Figs. 2 and 3). In coastal areas, the dated contact of basal peat layers burying older substrate has long been used as an indicator in sea level research, notably where basal peat could be collected along the flanks of inland dunes (Sect. 2) (e.g. Jelgersma, 1961; Van de Plassche, 1982; Hijma and Cohen, 2019). Just as well, dating of the contact of the basal-peat top with transgressive muds has been used as such (Hijma and Cohen, 2010, 2019). In archaeological studies, the ages of basal peat layers have helped to constrain the ages of archaeological findings, again notably on inland dunes (Verbruggen, 1992). In addition, basal and intercalated peat layers have been collected to determine the timing of branch avulsions in the Rhine Delta and compare channel sedimentation levels with contemporary flood basin water levels (Stouthamer and Berendsen, 2000; Berendsen and Stouthamer, 2001). Intercomparison of dates from basal and intercalated positions has been used for studying auto-compaction in unconsolidated sediments (Van de Plassche, 1980; Van Asselen et al., 2009; Van Asselen, 2011). This section describes the requirements applied to select the legacy data to ensure a uniform input relevant for relative water level reconstruction research. The second part of this section describes the main types of water level indicators included in the dataset.
3.1 Data requirements
Basal peat beds and contacts have been the preferred geological water level indicators because of the combination of their radiocarbon-dating potential (see below) and the fact that the projected vertical position of the indicator is minimally influenced by post-depositional compaction processes, especially those resting on a palaeosurface in sandy Pleistocene substrate. This Pleistocene surface was exposed before the onset of peat formation, and it had experienced initial compaction and pedogenic consolidation since deposition. Residual compaction of the Pleistocene deposits and those below (see Kooi et al., 1998) is considered a part of the separately specified tectono-sedimentary background subsidence component (see Sect. 4.1.3). Provided that the basal peat bed is up to a few decimetres thick, the minimal effect of post-depositional compaction applies to indicator levels sampled from the base, middle, and top of the peat bed (e.g. Hijma and Cohen, 2019). Vertical decompaction correction and the associated uncertainty are smallest for the base of the basal-peat dates (decompaction uncertainty ∼10 cm; Berendsen et al., 2007). Given the wealth of basal-peat data available (research cited in Sect. 1), samples from intercalated peat layers from shallower positions than the basal peats have been excluded here because of the larger decompaction uncertainty associated with these samples (for more peat data, see compilations such as Berendsen and Stouthamer, 2001). In some areas, relatively inland, peaty beds overlying the Pleistocene subsurface can reach a considerable thickness. From such peats, only levels sampled within 1 m from the Pleistocene substrate were included.
The inland boundary of the study area (Fig. 1b) further constrains whether data are included. Studies sampling peat at inland locations above +1 m MSL have generally been excluded from the inventory, as peat formation there is often linked to locally perched groundwater levels and fluctuations therein (e.g. Hoek, 1997; Quik et al., 2021), particularly for areas in the north of the Netherlands with glacial till in the subsurface. Similarly, samples from pingos were excluded as well (e.g. those included in Quik et al., 2021). In contrast, the coastal plain water levels are graded to the regionally increasing water level, resulting in suitable regional water level indicators (Van de Plassche, 1995a). In the Rhine–Meuse valley, samples up to the 10 m contour line have been included. Previous studies have reported that these types of samples show a regional trend in groundwater level as well, which can be linked to the sea level and subsidence history and the evolution of the area from flood basins to tidal inlets, closed lagoons, and large-scale peatlands (Van Dijk et al., 1991; Cohen, 2005).
The study area is further bounded in the offshore direction (e.g. Fig. 2a and b), where the inventory cut-off has been arbitrary. The dataset contains some basal peat sampled off the Holland coast and in the Wadden Sea – as did recent regional compilation studies for these sectors (see Meijles et al., 2018, and Hijma and Cohen, 2019, respectively). Moreover, the study area is bounded by national borders at critical locations in the southwest (Flanders, Belgium) and northeast (Lower Saxony, Germany). Where the Holocene fill of palaeovalleys extended across borders (Fig. 2), legacy data were included to allow cross-verification with data from within the study area. This is the case for a few data points from the Scheldt (following Kiden et al., 2002) and Ems palaeovalleys (following Behre, 2007).
A last physical boundary is the upper limit where basal peat layers can be found, which is not a prescribed boundary but, rather, a consequence of the reclamation history of the study area (see Sect. 2): extensive peat excavation for the last 1000 years has degraded Late Holocene peats from the top down, and this imposes a soft (i.e. spatially variable) upper temporal boundary, making basal peat samples younger than 3500 year rare and those younger than 2500 year very rare (Van de Plassche, 1982; Cohen, 2005). To overcome this limitation, some non-basal-peat sea level index points (13 dated shells sampled from below the soles of raised mounts; Frisian terp archaeological sites) were included in the dataset (Vos and Nieuwhof, 2021).
To conclude, the availability of metadata played an important role in including data in the database. An effort was made to trace any missing information; when this effort was successful, these data points were added. Retracing age–depth data and metadata included information on originally applied vertical offsets and corrections, to compare this with the uniformly applied and recalculated corrections in the HOLSEA workbook. Further information was retraced to specify and calculate the uncertainty in the different components for each data point. Points with insufficient information on location, depth and age determination, and associated uncertainties were left out.
3.2 Reported sampling methods and depth accuracy
The primary depth information in the dataset includes measurements of the surface elevation, the sample depth along the core, and the thickness of the subsampled layer. This is stored in standard fields of the HOLSEA workbook, together with uncertainties and meta-information on the type of coring and the type of surface elevation measurement (e.g. levelled to a benchmark or national lidar-derived datasets). The vertical datum to which depth is expressed is the Amsterdam Ordnance Datum (NAP), which is approximately equal to 20th century MSL (e.g. Vermeersen et al., 2018).
Basal peats have been sampled using a variety of methods, such as hand coring, mechanical coring, or excavation. The sampling method and elevation determination method affect the specification of the sample depth below surface elevation, and different uncertainties are associated with different methods. The uncertainties related to determining the absolute elevation of a core or section were assigned based on the acquisition method when not previously reported (e.g. levelling: ±0.02; and, since the 21st century, DGPS: ±0.01). The HOLSEA workbook provides a detailed breakdown of uncertainties related to sample acquisition. Often, sampling (e.g. levelling and benchmark) uncertainty is combined in a single value, resulting in seemingly different uncertainty values. However, the total vertical uncertainties related to sample acquisition add up to similar values, as previously reported.
The uncertainties for determining the depth of a sample in a core or section are assigned separately. The overall error related to measuring the sample depth in the core (sample-position accuracy) is set at 0.02 m, following the estimated error found by Berendsen et al. (2007) when sampling from a core. For hand-cored samples, non-vertical drilling offsets are accounted for by adding an additional unidirectional uncertainty of coring depth (Törnqvist et al., 2004; Hijma and Cohen, 2019), increasing only the upward component of the total vertical error. Depth uncertainty due to core shortening/stretching during sampling and initial storage is separately considered. This is set to ±0.05 m for hand-cored and mechanically collected cores alike, following Hijma and Cohen (2019).
In general, the depth uncertainty terms combined are smaller than the offsets and uncertainties depending on the assigned indicative meaning (Sects. 3.3 and 4.2), decompaction (Sect. 4.1), and further vertical position corrections (Sect. 4.3 and 4.4). The exceptions are the samples taken offshore, for which the depth uncertainty terms are higher due to the additional water depth uncertainty. For basal peat samples ultimately classified as SLIPs, the depth uncertainty terms account for about 20 % of the total RSL depth uncertainty, whereas for basal peat samples ultimately classified as ULD, this accounts for about 25 % of the GWL depth uncertainty.
3.3 Indicative meanings
Indicative meaning refers to the relation between the depth of deposition of the indicator and the water level at the time of deposition (Shennan, 1982; Van de Plassche, 1986; Hijma et al., 2015). Where it regards the indicative meaning of sampled basal peat, the type of peat collected (the botanical composition, sedimentology, and clastic admixture) as well as aspects of the geological setting (the location in palaeolandscape and associated hydrological regime) contribute to specifying the indicative meaning of that sample. Bos et al. (2012) provided a classification key for organics and an overview of the distribution of basal peats underlying the Rhine–Meuse Delta. They mapped the different facies (peat types) and distinguished between tidally dominated (reed or clayey), river-flooding-dominated (woody), and seepage- or precipitation-dominated (fens or bogs) hydrological regimes in the downstream, inland, and rim sectors of the Rhine–Meuse palaeovalley, respectively. Van de Plassche (1982, 1986), Kiden (1995), Kiden et al. (2002), Makaske et al. (2003), and Van de Plassche et al. (2005, 2010) developed generic indicative meaning attribution schemes for Dutch settings, which were further developed for the Rhine–Meuse basal peats by Cohen (2005), Berendsen et al. (2007), and Hijma and Cohen (2019). In HOLSEA terms, any basal peat sample can be attributed a GWL-related indicative meaning forming an upper limit to MSL – a so-called ULD. In specific cases, these can be upgraded to a sea-level-related indicative meaning, allowing the user to define a SLIP.
3.3.1 GWL vs. MSL indicative meaning
The diverse peat types that make up basal peat beds formed under different hydrological regimes with varying year-round water depths (e.g. woody swamps, reed marshes, sedge fens, and mossy blanket bogs). For this reason, each sample is assigned an indicative meaning and indicative range according to Table 1 (Törnqvist et al., 1998; Makaske et al., 2003; Cohen, 2005; Berendsen et al., 2007; Bos et al., 2012; Hijma and Cohen, 2019). Based on that indicative meaning, the reference water level (RWL) is calculated, which represents the height of the water level at the time that the water level indicator was formed. The RWL is the midpoint of the indicative range (IR). This classification is the first step for relating the sample to a former GWL. A second step is determining if the GWL is linked to a marine-relatable RWL such as Mean High Water (MHW), e.g. for sites fringing a contemporary lagoon or estuary. If this is the case, the sample is also relatable to a past MSL (RSL) based on palaeo-tidal conditions (Sect. 4.1.2), and it may define a SLIP.
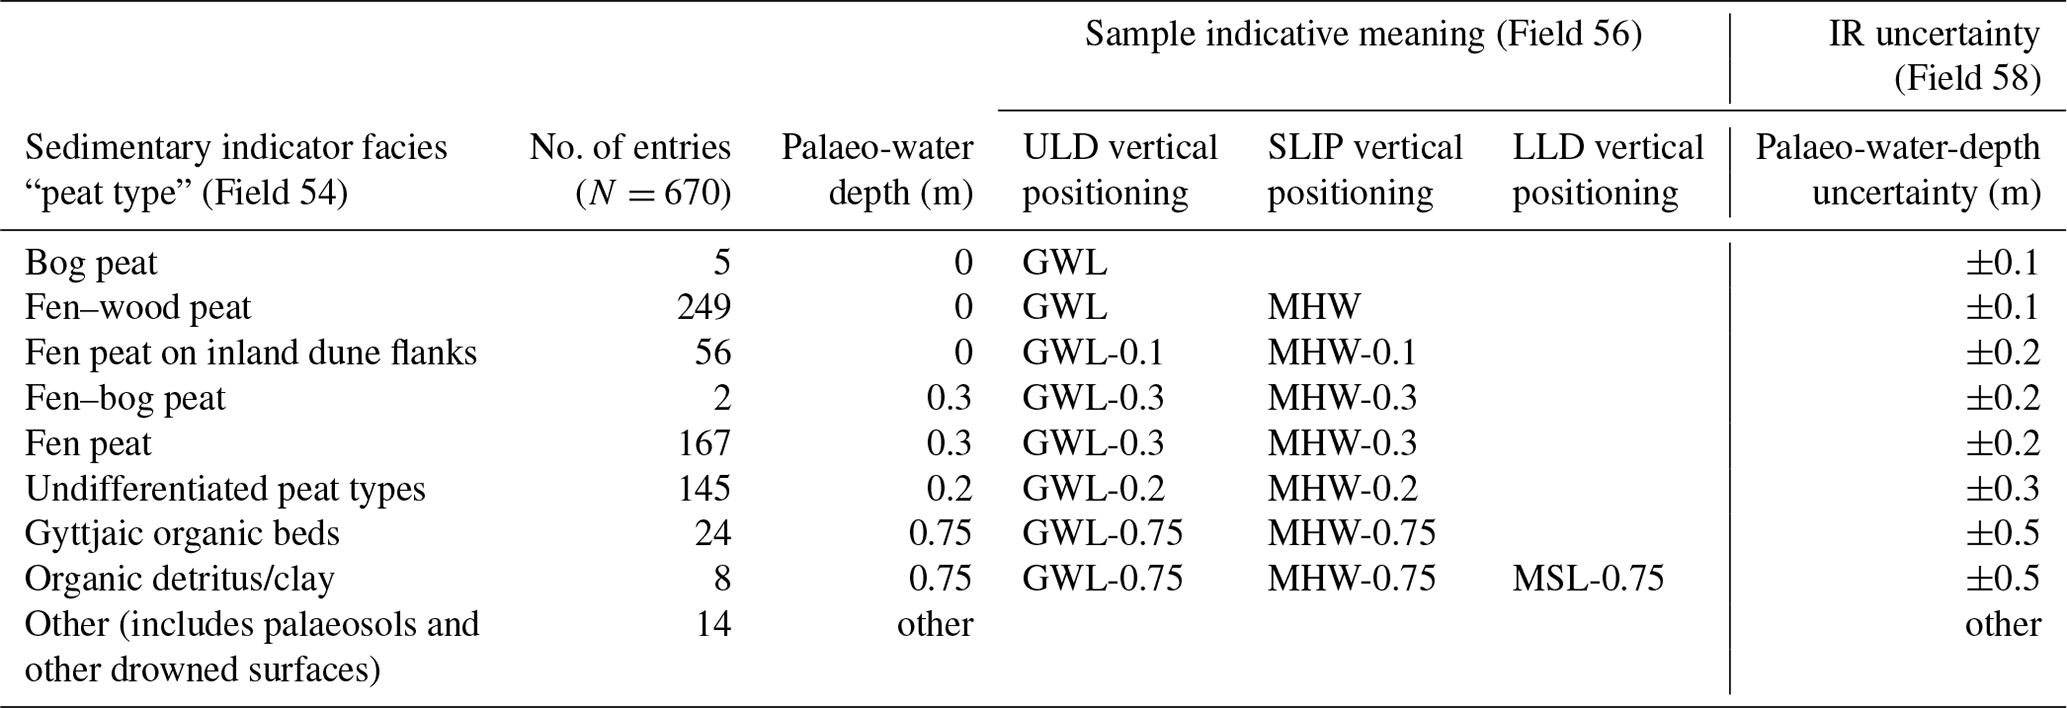
The indicative water depth specifications of each peat type propagate into the eventual age–depth values as one of several vertical correction terms. The palaeo-water-depth specification and uncertainty (Table 1) are based on the range of multiannual variation in the seasonally fluctuating water levels. For example, bog peats are ombrogenic, mossy, primarily rain-fed peat bodies formed around a local water table (palaeo-water depth of 0±0.1 m) perched just above regional water levels. Fen–wood and fen peats are formed in varying hydrological settings: rain, river, and/or seepage-fed environments. Their palaeo-water depth corresponds to a regional water level, graded to inland past water levels from rivers and seepage zones and to lagoonal and deltaic flood basin water levels in the coastal zones. Fen–wood peats in the Netherlands are typically alder-wood-dominated environments, although they also contain moss, sedges, and reeds, reflecting the vegetation of former swamps, particularly common in river-flooded areas. In these environments, dead plant material accumulated on the peat's surface layer (the acrotelm), where the groundwater table remained at or near the surface for most of the year (palaeo-water depth of 0±0.1 m). Fen peats are often sedge- and reed-dominated, with dead plant material accumulating just underwater and with an estimated acrotelm palaeo-water depth of 0.3±0.2 m. This water depth varies depending on composition and site type; for example, for “Fen peat on inland dune flanks”, the palaeo-water depth is 0±0.2 m. For undetermined peat types, an intermediate estimated palaeo-water depth is assumed with a slightly larger uncertainty (0.2±0.3 m). Table 1 also includes organic, sub-aquatic, accumulated gyttjaic deposits, which are LLD and potential SLIP data points, when encountered topping basal peats (3 out of 32 gyttjaic samples in the dataset). For brackish Mollusca and charcoal beds traced along a dune flank, the indicative meaning is determined separately per case in line with their source publications, and they are excluded from this table. The uncertainties mentioned with the palaeo-water-depth offsets are used as the IR uncertainty.
Table 1 lists standard values for water depth and associated uncertainty per peat type as well as how this relates to the ULD, SLIP, or LLD classification. The latter classification is determined by evaluating peat bed thickness, sample position (Sect. 3.3.1), bed lithology, botanical composition (Table 1), and further considerations of the stratigraphic and geographic position of the sample (setting) – usually with some iterative cross-checks (Hijma and Cohen, 2019). First, all basal peat samples are regarded as groundwater index points (RWL=GWL). Second, the group is divided into (1) a seaward and shallower/younger subset and (2) an inland and deeper/older subset, based on geographic location and age–depth information as a starting assumption, further improved by iterative comparison with surrounding age–depth data. For the seaward, younger/shallower subset, the GWL can be regarded as controlled by tidal waters and, therefore, relatable to sea level (; Van de Plassche, 1995a; Shennan et al., 2000). For the inland, deeper/older subset, GWL is considered otherwise controlled and to have been positioned well above contemporary MHW levels (Van Dijk et al., 1991; Van de Plassche, 1995a; Cohen, 2005; Vis et al., 2015; Hijma and Cohen, 2019).
Table 1Indicative meanings for various peat and organic facies for ULD, SLIP and LLD entries (after Hijma and Cohen, 2019).
3.3.2 Base basal peat and top basal peat
As introduced in Sect. 2, sea level rise during the Middle Holocene caused a concurrent rise in the coastal groundwater levels up to tens of kilometres landward (Jelgersma, 1961; Van de Plassche, 1982; Van Dijk et al., 1991; Cohen, 2005; Koster et al., 2017). This caused zonal paludification (i.e. extensive peat growth) of the Pleistocene subsurface underlying the eventual Dutch coastal plain. The so-called basal peats that formed this way are of variable botanical composition (Bennema, 1954; Van de Plassche, 1982; Cohen, 2005; Bos et al., 2012). The very base of the peat bed overlying the Pleistocene substrate (Fig. 3b) is regarded to mark the beginning of peat formation: the organic facies reflect that year-round swampy to marshy conditions have established at that location, and radiocarbon dating of these facies reflects when this occurred. Together, the age–depth data thus pin a past GWL position that, in river mouth and lagoon rim situations, provides an upper limit to the sea level position of that time (Berendsen et al., 2007; Hijma and Cohen, 2010, 2019; Van de Plassche et al., 2010; Koster et al., 2017; Meijles et al., 2018; Quik et al., 2022). This base basal peat sample context and index point use concept apply to 622 of the 640 basal peat data points (including 105 SLIPs and 337 tidal ULD), dated at the base or in the middle of the peat bed.
A variant is to date samples from the very top of a basal peat bed where it is overlain by tidal clays (Fig. 3b), preferably in addition to dating the base of the peat bed. This then provides a second age–depth water level index point, more directly marking the marine inundation of a young peatland surface just above the older subsurface. This sampling context and index point concept applies to ∼20 of the 640 basal-peat data points. Decompaction offsets and uncertainties (see Sect. 4) are larger for these top basal-peat data points, which propagates into the vertical accuracy of the water level index point (e.g. Makaske et al., 2003; Berendsen et al., 2007; Hijma and Cohen, 2019). The indicative meaning based on peat composition (Table 1) is assigned indifferently to base, middle, and top sampling.
3.3.3 Data points from peat beds on inland dune flanks
Section 2 introduced inland dunes as part of the Rhine–Meuse and Overijsselse Vecht palaeovalley substrate (Fig. 1a). These dunes formed in the Late Glacial and at the start of the Holocene (15–10 ka cal BP) and, after an interlude marked by the formation of a palaeosol, were gradually covered owing to Holocene water level rise, peat growth, and coastal deltaic sedimentation. Along the swamp- and fen-rimmed dune flanks, local peat formation could often keep up with the water level rise. This has created particularly favourable sites to collect age–depth data series that span several metres of elevation difference at a single location, while still meeting the condition that the sampled peat bed is on a relatively compaction-free substrate (Fig. 3b). For this reason, many inland dunes have been sampled to reconstruct past water levels (Jelgersma, 1961; Van de Plassche, 1982; Törnqvist et al., 1998; Berendsen et al., 2007; Van de Plassche et al., 2010). Especially the outer flanks of the highest dunes in inland dune complexes are suitable for sampling. In lagoon and lower deltaic settings, a subset of these dune flank samples can be upgraded from a GWL-related to an MSL-related indicative meaning (Van de Plassche, 1982; Van de Plassche et al., 2005, 2010; Hijma and Cohen, 2019). Sampling bases of basal peat from near the base of the dunes, where the flanks are less steep and base topography becomes uneven, results in age–depth data points less suitable to relate back to MSL. Such locations provide ULD that, with further analysis, often prove to be perched above the contemporary basal peat GWL of the surrounding floodplain.
Apart from dated peat samples from inland dune flanks, the HOLSEA-NL dataset contains 22 non-basal-peat 14C-dated charcoal ULD entries that also come from dune flanks. They are from swamp rim archaeological beds at the location where these beds intersected elevation contours of inland dunes (Van der Woude, 1983; Verbruggen, 1992). The archaeological bed surface is overlain by peat, marking the paludification of the area. The charcoal dates from just underneath constrain the timing of this, thus providing a GWL age–depth point.
3.3.4 Data points from peat beds on palaeovalley floodplain surfaces
Section 2 introduced palaeovalleys as low-elevation corridor areas with relative early and extensive basal peat growth and as gateways to further transgression (Figs. 1a and 3a). Their substrate consists of terraced fluvial sands, topped by a consolidated sandy-clay floodplain unit that bears a developed palaeosol (widespread in the Rhine–Meuse palaeovalley, Wijchen Member; cf. Törnqvist et al., 1994, and Autin, 2008; more locally occurring in the Overijsselse Vecht palaeovalley, Singraven Member). Basal peat overlying the floodplain surface is associated with a river-flooding hydrological regime, characterised by eutrophic conditions and abundant reed, wood, and fen–wood peat types (Bos et al., 2012). The pre-consolidated state of the underlying floodplain deposits at the time that the peat formed, as marked by the palaeosol features, makes it a relatively compaction-free substrate, giving it a similar vertical accuracy to the basal peat index points from inland dunes and cover sand (Cohen, 2005; Koster et al., 2017). Basal peat formed most extensively in relatively distal parts of the palaeovalley, i.e. in areas flooding regularly but receiving relatively little flood sediment. Peat started forming when downstream sea level rise caused floodplain groundwater tables to rise to just above the palaeosol surface, transforming floodplains into year-round moist flood basins, with the groundwater tables and their gradient coinciding with mean-annual river water levels (Van Dijk et al., 1991; Kiden et al., 2002; Cohen, 2005; Koster et al., 2017). Along the rims of the palaeovalleys, GWLs indicated by basal peats can be more perched due to local seepage hydrological conditions (Cohen, 2005; Bos et al., 2012). The river gradient and seepage overprints mean that those base basal-peat data points cannot be related to MSL and provide for inland GWL age–depth points only, in some cases plotting metres above the contemporary sea level (Cohen, 2005; Koster et al., 2017; Hijma and Cohen, 2019). Data points evidently affected by these overprints are classified as secondary ULD types (ULD river gradient; Fig. 2), based on age–depth position comparisons with contemporary index points from downstream sites.
Top basal peat age–depth points from palaeovalley settings do not suffer from these river gradient effects and have stronger relevance for sea level reconstruction. Where the peat is non-erosively overlain by fluvial–tidal (Rhine–Meuse palaeovalley) or fully tidal deposits (Overijsselse Vecht palaeovalley), the age of the top of the peat indicates the time of flooding by the sea and, thus, yields a SLIP (Hijma and Cohen, 2019). This is the case in the seaward parts of the palaeovalleys, where the river valley turned into an estuary. Here, transgression commenced relatively early, and rapid and eventual inundation was many metres deep under brackish tidal open-water regimes (Figs. 1 and 3a).
3.3.5 Data points from peat beds on cover-sand relief
Outside the palaeovalleys, basal peat is predominantly encountered overlying cover-sand relief (Fig. 3c). This buried surface often contains a developed podzolic palaeosol in the aeolian sand, indicating regionally low groundwater table positions during and after aeolian deposition (up to 12 ka cal BP) and prior to basal peat formation (gradually after 9.2 ka cal BP; Fig. 2b). Basal peat on cover sand often features a transitional contact from palaeosol organics (peaty sand) to the actual peat bed, regarded to be a result of relatively gradual drowning (Van de Plassche, 1982; Cohen, 2005), similar to the signal in floodplains and along inland dune bases in the palaeovalleys. Base basal peat samples from cover-sand terrain contain ULD, especially when obtained from along the flanks of subdued dune relief (Sect. 3.3.3). Again, top basal peat samples form potential SLIPs, provided that the top is non-erosively overlain by tidal sediments and that the thickness of the peat layer is limited.
In contrast to the eutrophic swampy basal peat on floodplain deposits and inland dunes in palaeovalleys, where the vicinity of flooding rivers brings nutrients, the peat overlying cover sand often has a mesotrophic composition (sedge peat types). This is indicative of seepage-dominated hydrological regimes and explains the relatively perched positions of cover-sand basal-peat data points, compared with nearby contemporary palaeovalley datasets (Van de Plassche, 1982; Cohen, 2005). The degree of seepage evidence strongly echoes local cover-sand topography (Bos et al., 2012). Base basal-peat dates from relative lows in the cover-sand terrain tend to return relatively old dates, in which case they are regarded to be influenced by local hydrological conditions. In the database, these samples are categorised accordingly as ULD local GWL. Mesotrophic peat over cover sand also dominates the lagoonal and tidal marsh fringing peatland formed since 5.0 ka cal BP (Fig. 2d) north of the Rhine–Meuse Delta in the eastern central Netherlands along the edges of the ice-pushed ridges and the Drenthe plateau, both source areas for regional seepage.
Overall, basal peats formed under freshwater conditions. Towards the top of these peat beds, reed-dominated layers often show evidence of brackish storm surges, identifiable by clayey deposits rather than shifts to salt-tolerant vegetation. The mud layers overlying the top of the basal peat usually indicate the change to permanent brackish conditions. Reeds comprise plant species tolerant to a broader range of conditions and may grow under slightly brackish and mud-accumulating conditions (Bos et al., 2012). However, where reed formed basal peats in the transgressive setting of the Netherlands during the Middle Holocene, it is not considered a brackish peat. Bos et al. (2012) found some sites with marine shells in gyttja deposits in the westernmost part of their study area, indicating that some organic layers formed under brackish conditions. During the Middle and Late Holocene, reed stands along river mouths expanding into lagoons may have accelerated the transition from brackish, shallow water to fully terrestrial conditions. This process explains succession patterns within intercalated peat layers, as showcased for the Old Rhine River mouth by Pierik et al. (2023), using, amongst others, diatom analysis. Such settings, however, do not apply to the shorter-lived basal peats in our database, in which brackish peats are not distinguished.
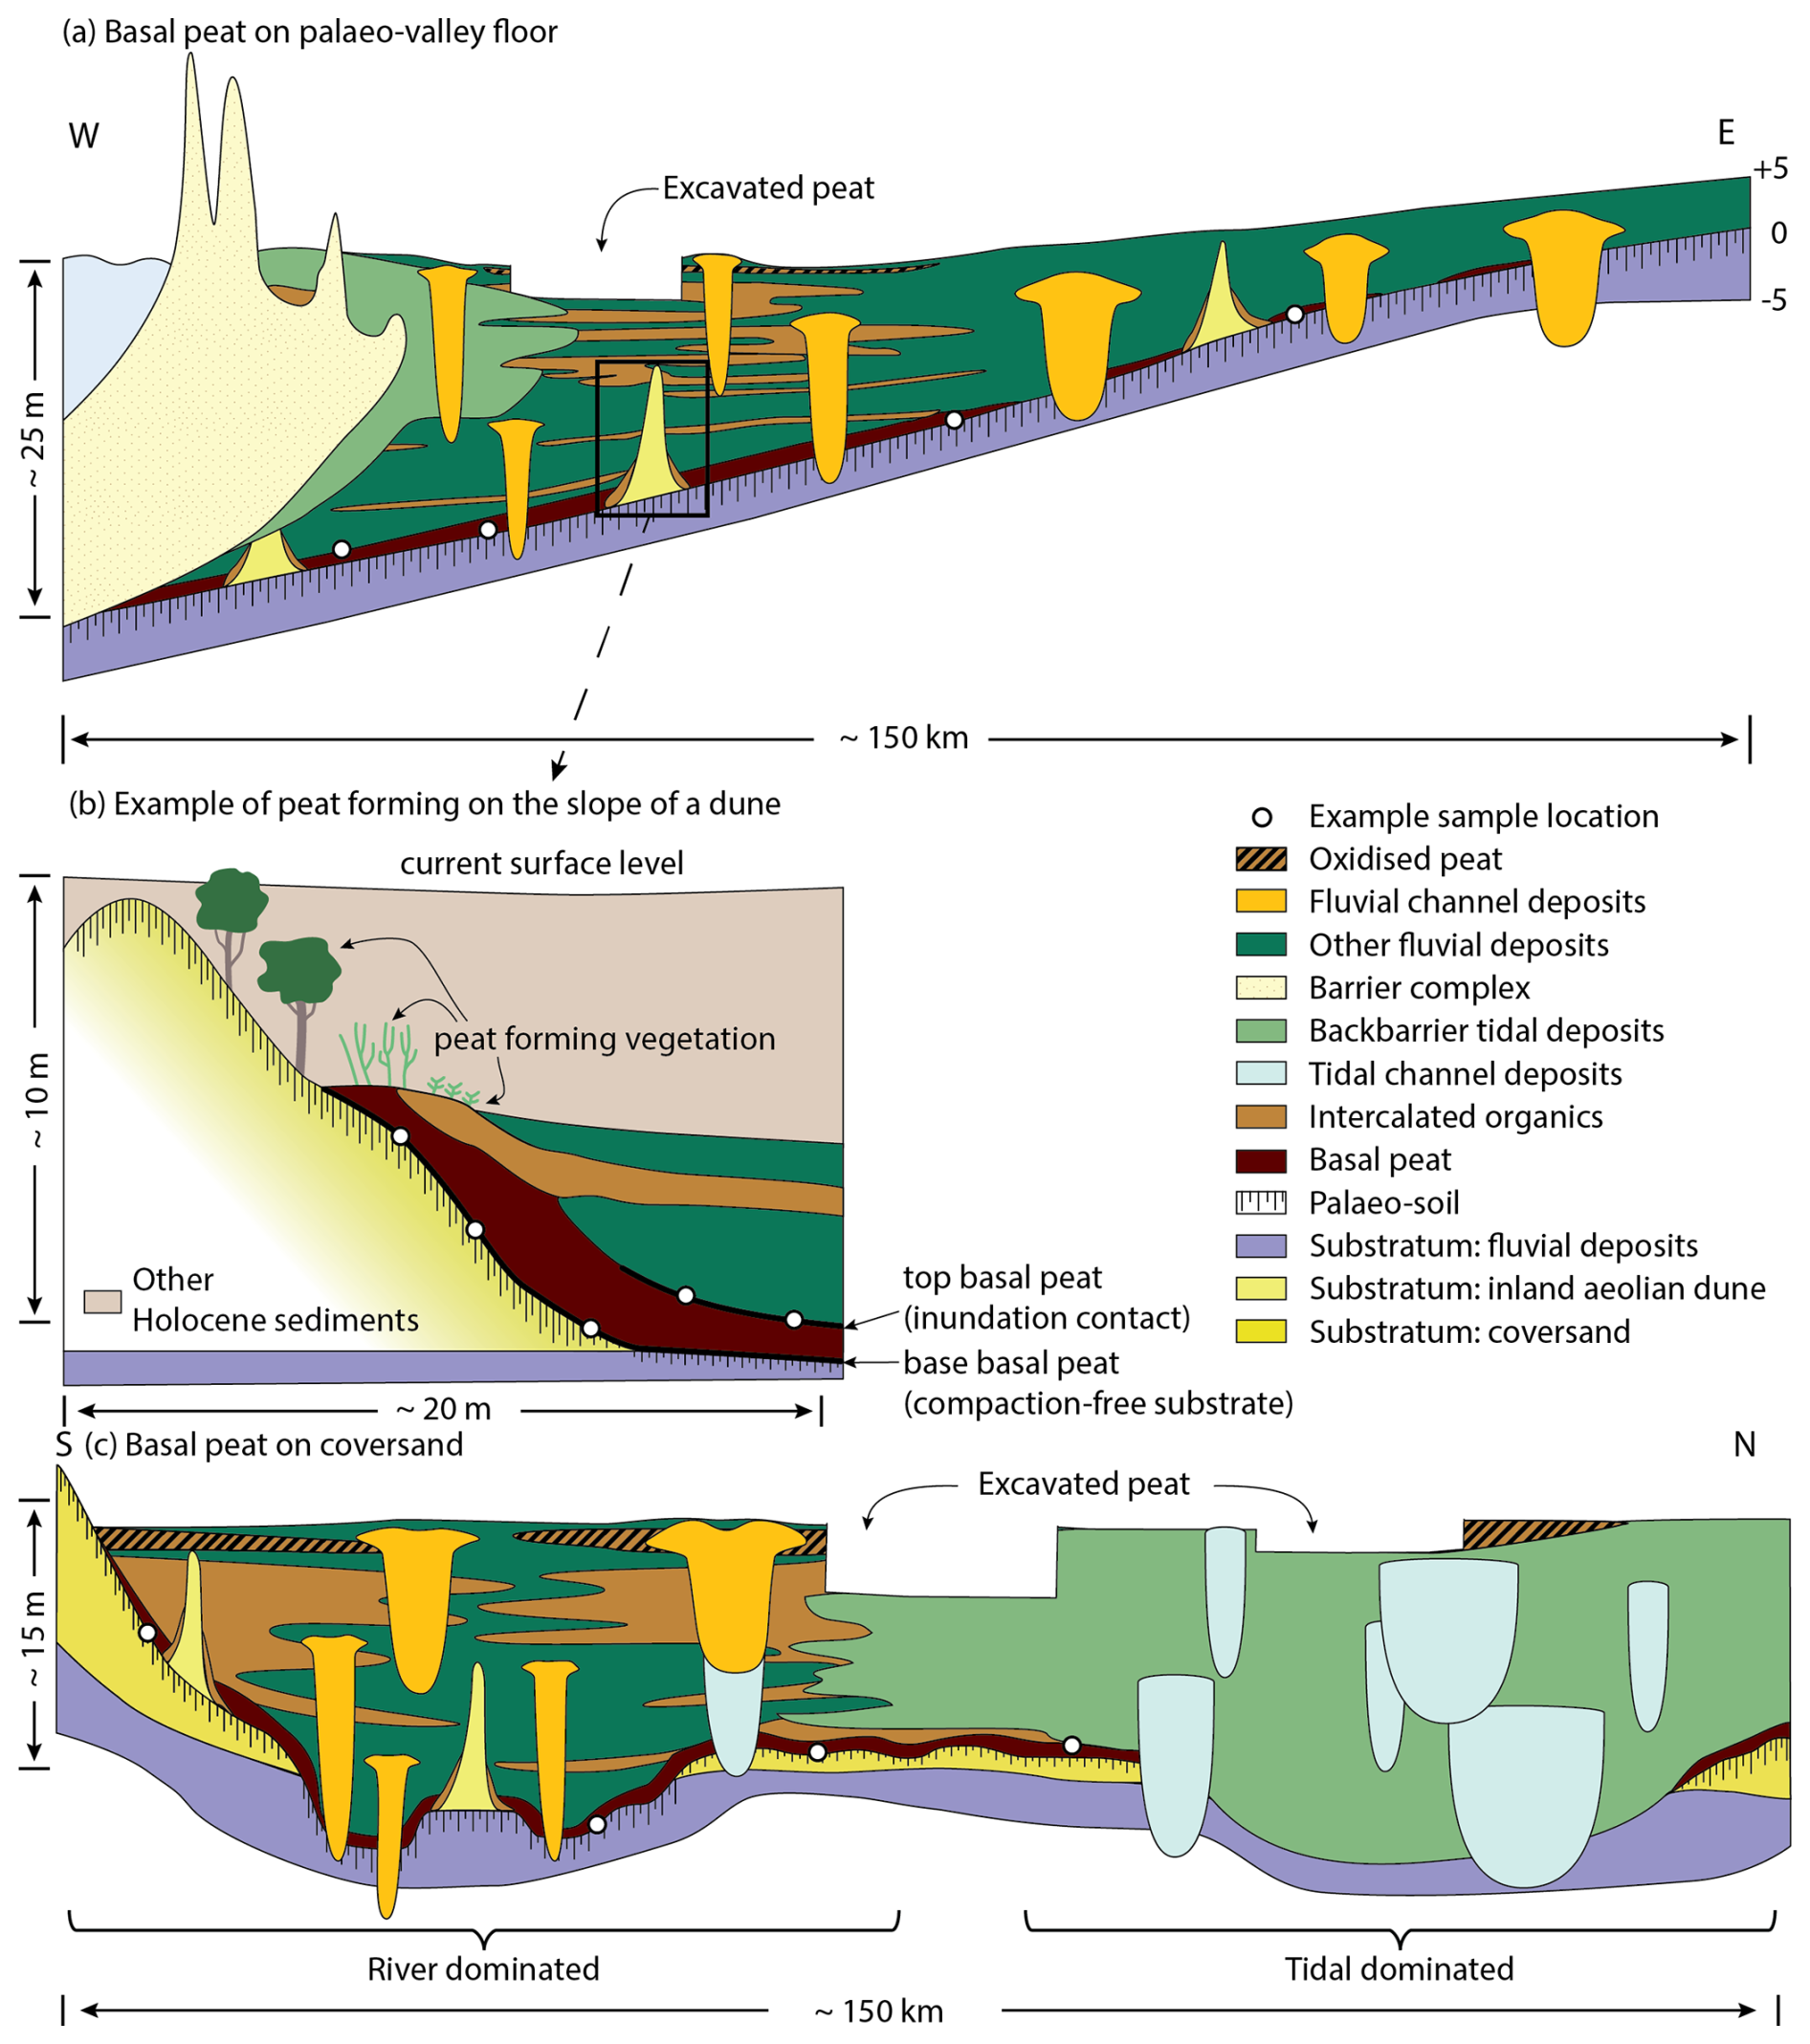
Figure 3Examples of different sedimentary locations of basal peat layers: (a) on the floor of a palaeovalley, (b) along the flank of a river dune, and (c) on top of cover sand (adapted from Kiden et al., 2008, and Bos et al., 2012).
3.3.6 Non-basal-peat geological sea level data
Some additional geological sea level markers are reported in the HOLSEA-NL dataset, including a set of brackish molluscs (Cerastoderma) obtained at great depth at Velsen (Van Straaten, 1954) and a set of index points obtained from 14C dates of in viva (undisturbed since death) shells (Scrobicularia plana and Cerastoderma edule) found in the top of tidal flat deposits underneath artificial dwelling mounds, or terps, in the northwest of the Netherlands (Vos and Nieuwhof, 2021). The older set from Velsen is used mainly as additional dating control to peat radiocarbon dates collected from the same excavation, which provide base basal-peat and top basal-peat data.
The younger set from the northwestern Netherlands is included because they supplement and cross-validate basal-peat data in the younger period (3–1.8 ka cal BP) for which basal-peat data are sparser (Sect. 2). The levels with the Scrobicularia plana shells are located just below the transition between tidal flat and salt marsh deposits. The vertical position of this transition is regarded to mark the past MHW, giving the shells an indicative meaning of MHW – 0.33 m (Scrobicularia plana) or MHW – 0.4 m (Cerastoderma) (Vos and Gerrets, 2005; Vis et al., 2015; Vos and Nieuwhof, 2021). Calibrated ages for these samples are obtained using a marine calibration curve (Marine20; Heaton et al., 2020), and they are corroborated by archeological dates from the overlying mounds. Because a regional offset for the reservoir age (delta R) is not established for the study area (the western to northwestern Netherlands), Marine20 was used without an additional delta R, as in Vos and Nieuwhof (2021). We note that this applies to the 12 Late Holocene shell dates regarded as SLIPs from the Wadden Sea (Vos and Nieuwhof, 2021) and to the 6 LLD shell dates and 1 tidal ULD from a North Sea incursion into the Overijsselse Vecht palaeovalley, away from direct exchange with Rhine waters (Middle Holocene, Van Straaten, 1954). Including other shell dates from incursions into the Rhine–Meuse palaeovalley was not attempted because of unresolved delta R issues for the Rhine–Meuse mouth.
While Sects. 2 and 3 are restricted to data intake, setting diversity (local and regional), and overall classification goals (ULD vs. SLIP), Sect. 4 describes further processing of the data in the HOLSEA-NL workbook. This comprises a series of adjustments regarding the vertical position of an indicator, starting from the originally reported sample elevation and indicative meaning and incorporating further compiled information. This step essentially reproduces earlier similar applications on subsets of the dataset (Kiden et al., 2002; Berendsen et al., 2007; Hijma and Cohen, 2010, 2019; Van de Plassche et al., 2010; Hijma et al., 2015), more uniformly and over the entire HOLSEA-NL dataset. HOLSEA-standard fields were used to transparently register this and expanded where needed, as well as to allow for the omission or substitution of specific corrections in future usage. Addressing the vertical corrections on a component-by-component basis serves this purpose. In many cases, the applied adjustments reproduce those from previous studies within a few centimetres, with the difference owing to unification. This extends to acceptance/rejection and ULD/SLIP usage decisions per data point, based on the age–depth data, indicative meanings, and reliability judgements (e.g. Fig. 4 of Van de Plassche, 1982).
Importantly, the HOLSEA-NL dataset also includes all adjustment specifications for originally demoted/rejected samples so that each decision can be re-evaluated per sample. Additional annotations on this are given in the note fields. This extension of the HOLSEA workbook improves the usability of the workbook and dataset, and it is of particular relevance when evaluating the type of indicator that a sample represents. For example, the RSL values of SLIP and ULD samples include the vertical adjustment for tidal amplitude to plot the palaeo-MSL value, and the palaeo-MHW value is provided for all samples that are graded to the palaeo-MHW level. Otherwise, only the standard palaeo-GWL value is documented. Documenting the palaeo-GWL value enables the use of the dataset for relative water level rise reconstructions throughout the Holocene coastal plain and its sectors as well as for spatial–temporal analysis thereof (e.g. sea level history, subsidence regime, accommodation attribution, and coastal prism architecture).
4.1 Vertical corrections
Vertical positions are specified and accounted for via (i) measurements of the original sample depth + uncertainty; (ii) offset calculations to get from sample depth to palaeo-water-level depth, typically expressing the GWL (Sect. 3); (iii) further offset calculations to correct for compaction (upgrading depths), include palaeo-tides (upgrading to MSL expression), and correct for two types of subsidence (upgrading depths); and (iv) error propagations associated with all of this. Figure 4 shows the full set of components considered as well as the order in which vertical offset corrections are applied and evaluated. For all data points, several concurrent palaeo-water-level elevations can be calculated, as shown in Figs. 4 and 5. The systematic processing chain facilitates iterative evaluation and switching between ULD- and SLIP-indicator-type status (former GWL/MHW and MSL expression, respectively).
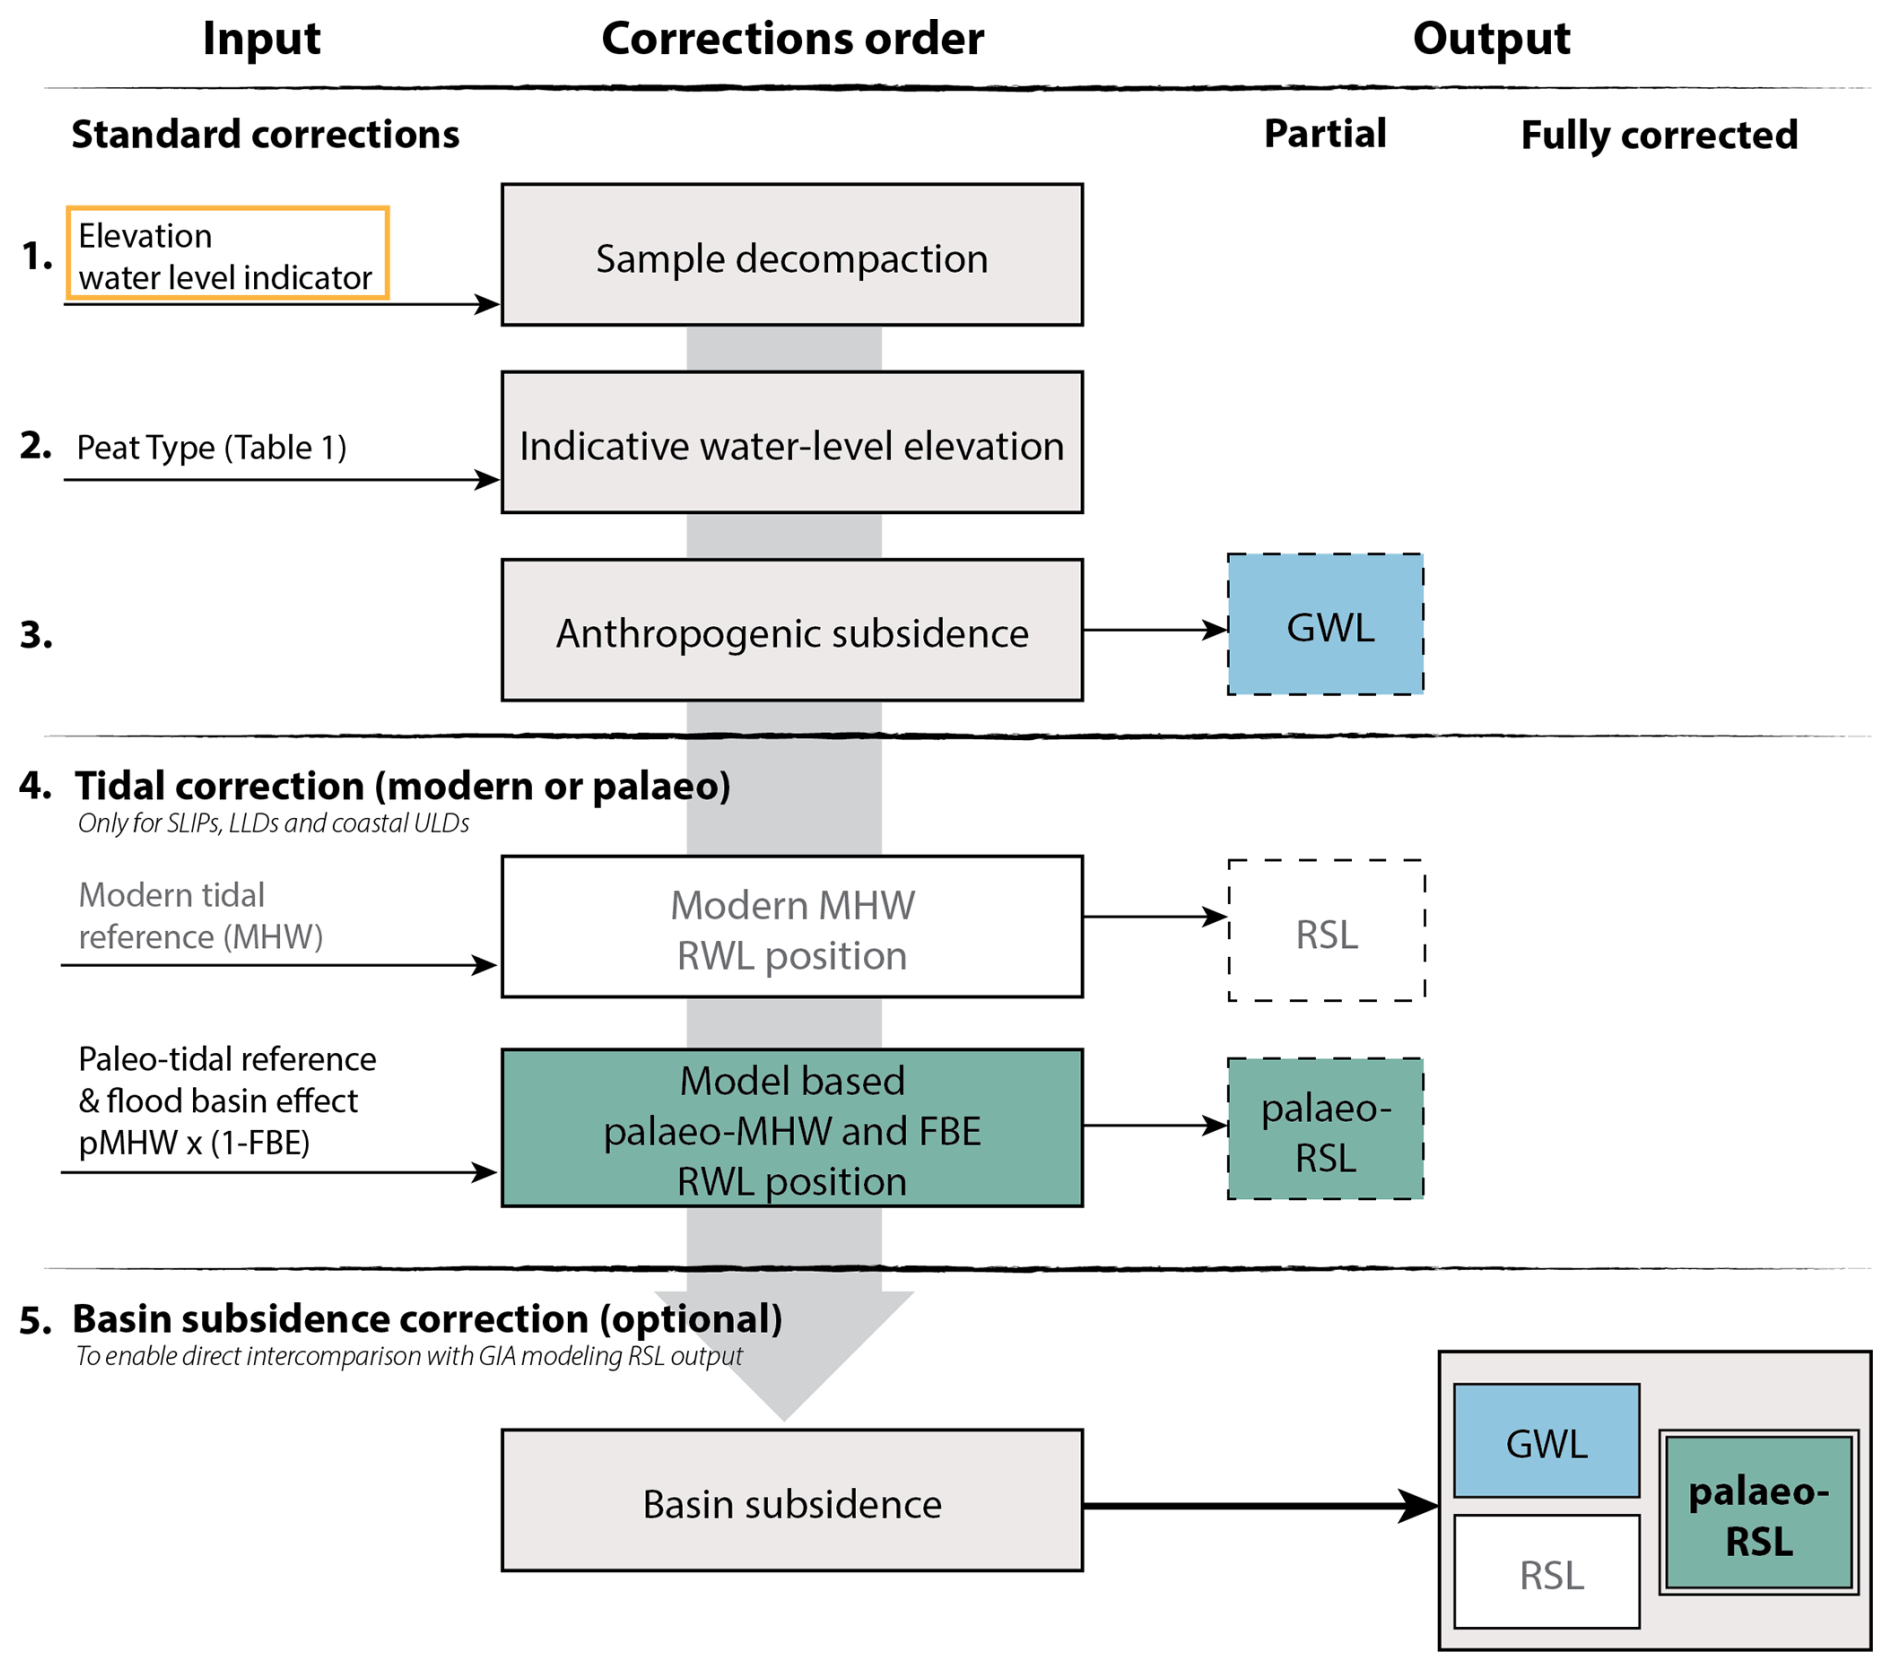
Figure 4Flowchart of the water level indicator sample-processing chain. The final fully corrected output is a basin-subsidence-corrected palaeo-RSL value.
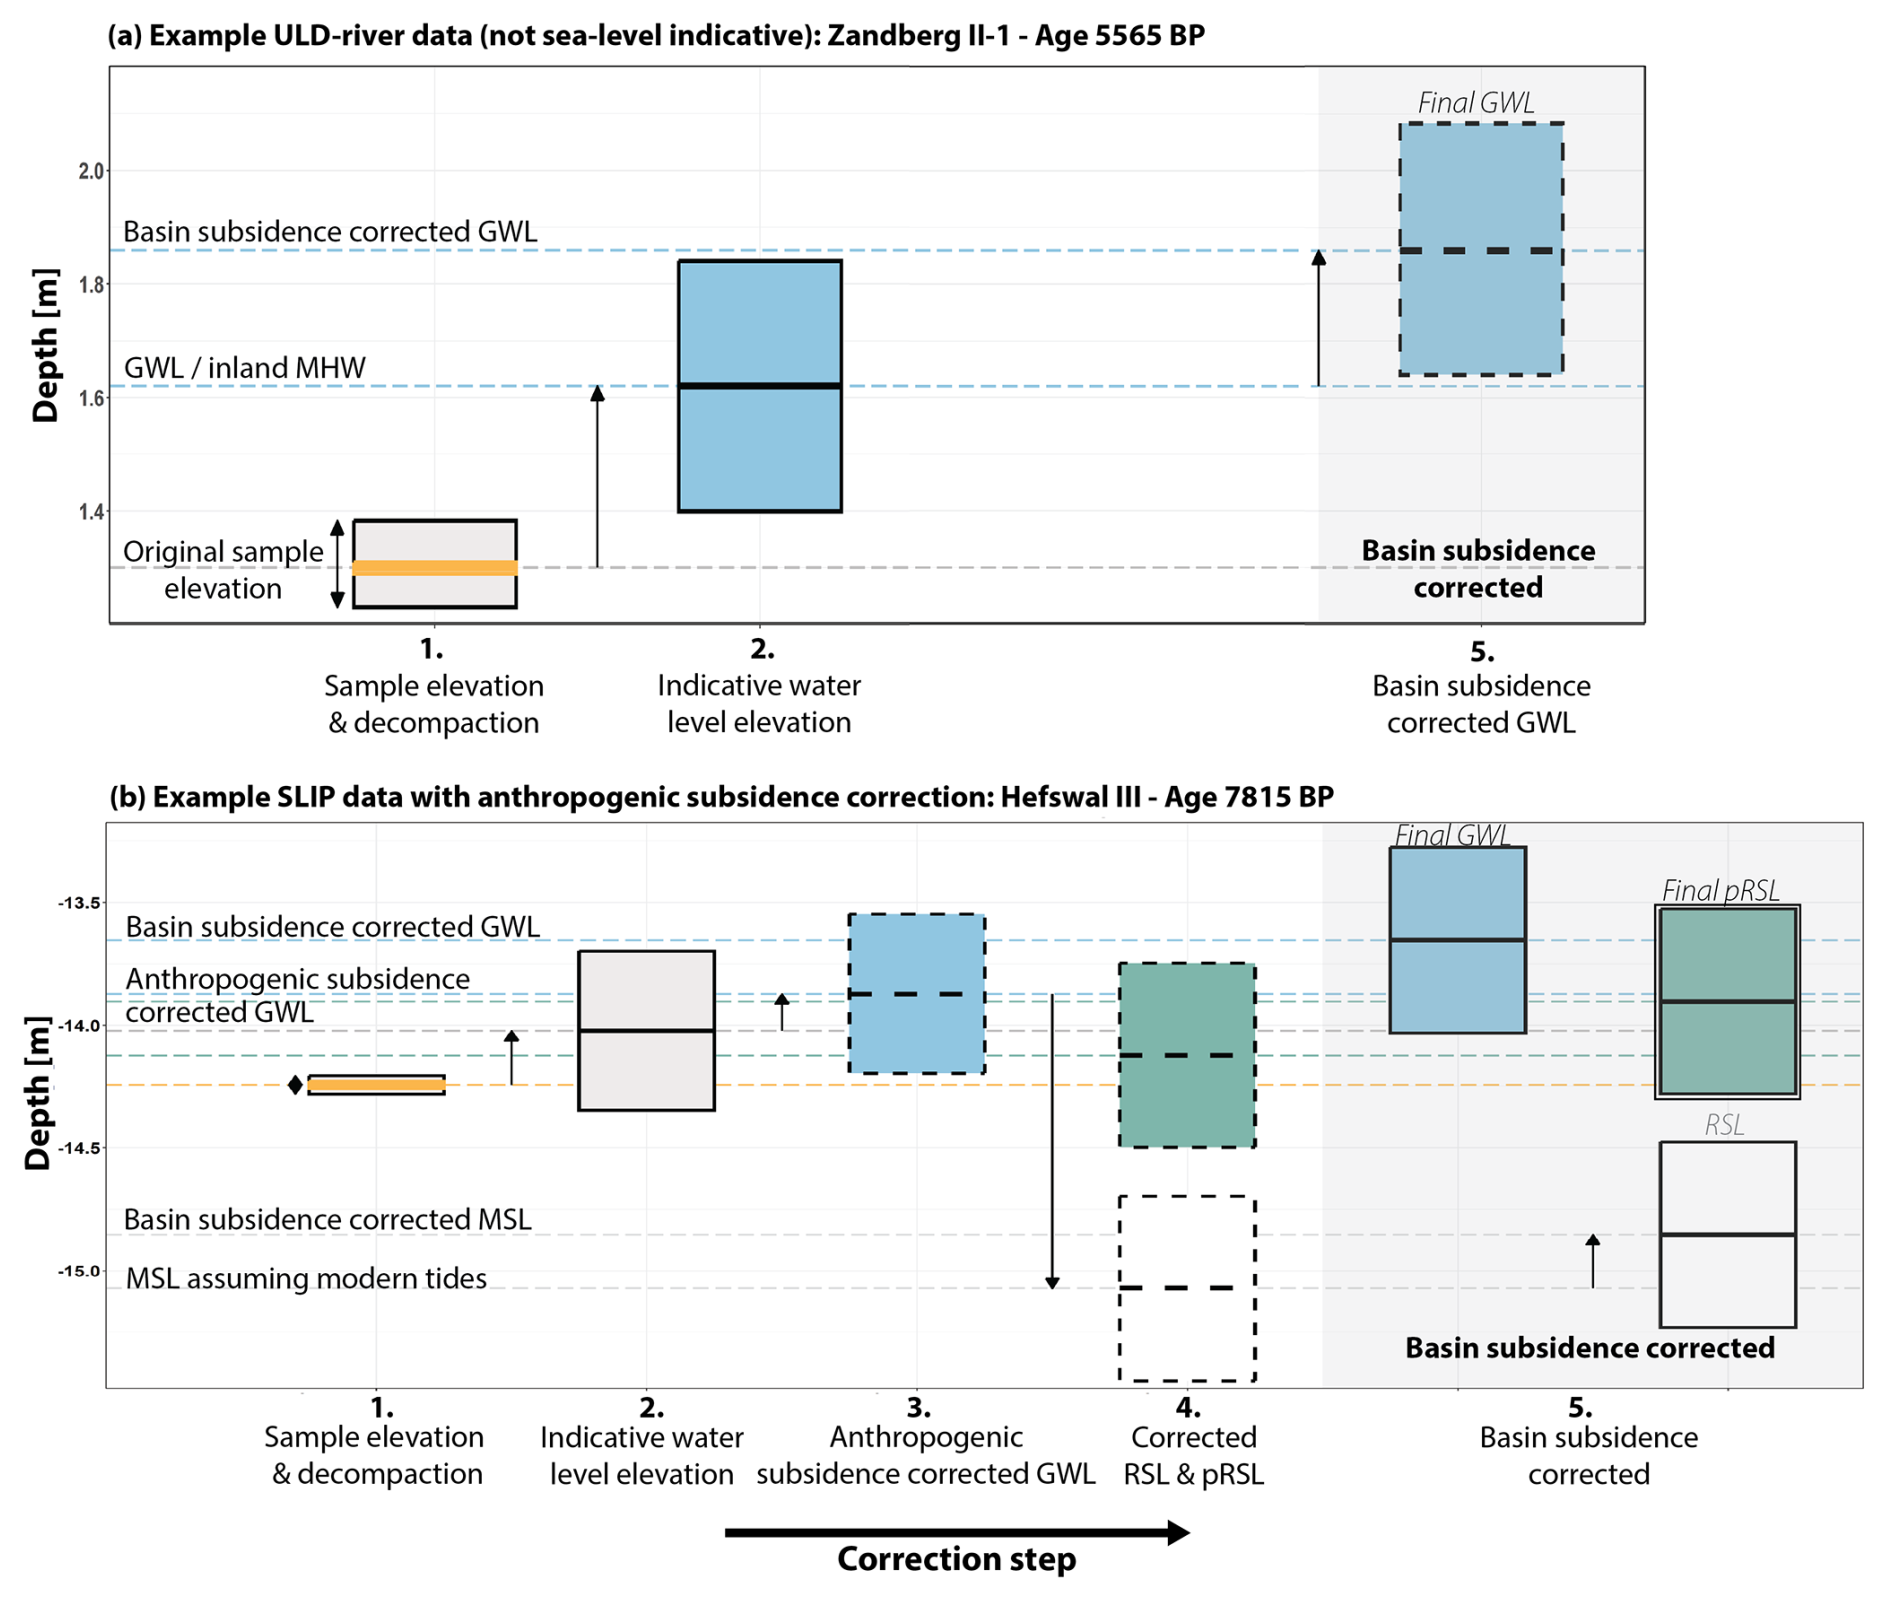
Figure 5Dashboard of sample elevations of two example samples for visual inspection of vertical positioning owing to vertical correction steps: (a) inland GWL/upper limiting sample without anthropogenic subsidence; (b) fen peat SLIP sample from the northeast of the Netherlands, affected by deep anthropogenic subsidence
Decompaction (a vertical offset + uncertainty) is a correction that is always considered. Palaeo-tidal considerations are relevant to all data points that are classified as SLIPs and ULD, and the user may either use the provided values (expansion of standard HOLSEA protocol; Hijma and Cohen, 2010, 2019) or fall back to using the modern tidal range in the region. The inclusion of the correction for background basin subsidence is considered to be optional in this work. It is typically required (e.g. Kiden et al., 2002; Vink et al., 2007) if a comparison with GIA models is sought, although it is usually skipped (Hijma and Cohen, 2010, 2019; e.g. Van de Plassche et al., 2010) in traditional relative sea level curve construction plotting. The correction for so-called deep anthropogenic subsidence applies to specific subareas in the northeastern Netherlands that have been subject to 20th–21st century gas extraction and can be regarded as a sample depth correction (up to 0.4 m) to apply in most use cases. Further details on these critical corrections are given in Sect. 4.1.1 to 4.1.4.
The application of the vertical corrections generally results in an upward shift in the final GWL or final RSL (pRSL in Fig. 5) elevation with respect to the original sample elevation (Fig. 5). On average, the final RSL elevation of basal SLIPs (n=117) is 0.4 m higher than the original sample elevation. For intercalated SLIPs (n=4), the difference is much higher (∼1.5 m) due to the larger upward correction. The tidal correction strongly influences the elevation of the sample. Figure 5 shows that assuming modern tides instead of using a palaeo-tidal model results in much lower RSL elevations, ∼0.2 m below the original sample elevation. For Middle Holocene SLIPs, using a palaeo-tidal model causes an average upward shift of ∼0.7 m because of the gradually increasing tidal range and tidal dampening. This shift is also present in Late Holocene SLIPs from areas with presumed strong tidal damping (Flevoland region), whilst the Late Holocene MHW is equivalent to modern MHW in areas without tidal damping (Waddenzee regions).
4.1.1 Decompaction
Decompaction corrections can refer to the correction of two processes: (i) post-depositional compaction of the beds directly underlying the sample, which is mostly relevant for top-of-basal-peat samples and can be up to 5 m, and (ii) the self-compaction of the sampled material, which is a smaller component but applies to all peat samples, with the correction averaging 0.06 m. The post-depositional compaction is corrected for using the depth to the consolidated substrate (m) (Field 18 in the supplementary HOLSEA workbook, De Wit and Cohen, 2024) and a decompaction factor. The decompaction factor depends on the overburden thickness (Field 17), with peat beds deeper below the surface experiencing more compaction than the shallower peat beds. For samples taken deeper than 20 m below the surface (n=21), a decompaction factor of 3 is used. A decompaction factor of 2 is used for samples shallower than 2 m below the surface (n=119). For all other samples, between 2 and 20 m, a decompaction factor of 2.5 m is used. This is documented as the compaction correction (m) (Field 64) in the HOLSEA workbook. We present an example from the first category to demonstrate how the decompaction factor affects the compaction correction, expressed as an offset to the sample depth. A decompaction factor of 3 implies that, at the time of inundation, the peaty layer between the sample and the Pleistocene substrate was 3 times thicker than its current thickness (T), recorded as “Depth-to-consolidated-surface” in Field 18. Therefore, the upward offset stored in Field 64 should be 3 times the current elevation above the consolidated surface, which equals 2 times the thickness from Field 18 (; thus, ). For decompaction factors of 2 and 2.5, the multiplier used in Field 64 is 1 and 1.5, respectively.
In specific cases, when land was reclaimed and the current land surface is below modern MSL, e.g. “deep polders”, the decompaction could be underestimated because the current overburden thickness is lower than before reclamation, which is currently not accounted for. The associated uncertainty is compaction correction dependent (Field 65). The compaction correction uncertainty considers an error margin of 0.02 m for the depth to the consolidated surface and assumes an uncertainty of 0.5 in the decompaction factor:
Thus, for a sample with a midpoint 0.10 m above the consolidated substrate and taken 8 m below the surface, the decompacted midpoint is 0.25±0.07 m above this substrate (with ).
For the sample thickness (Field 21), a decompaction factor of 2.5 is applied around the sample midpoint, consistent with investigations in Van Asselen (2011) and past usage in Hijma and Cohen (2019). The sample decompaction uncertainty (Field 24; “Sample thickness uncertainty (m)”) is set to half the decompacted sample thickness. This is a modification of earlier decompaction approaches by Berendsen et al. (2007) and Van de Plassche et al. (2010), who used a decompaction factor of 2.5 for the bases of their sampled beds and 3.5 for their tops, accounting for both the compaction of the underlying unconsolidated sediment and the compaction of the sample itself. In the HOLSEA format, these two components are split into separate steps, which is why a single decompaction factor was used to correct the sample thickness relative to the mid-point and a separate decompaction factor was employed to decompact the underlying unconsolidated sediments. This also allows us to account for the larger variations in sample depths encountered in the HOLSEA-NL data, compared with the smaller variations in depths in the studies by Berendsen et al. (2007) and Van de Plassche et al. (2010), who focused on specific sites.
4.1.2 Past tidal amplitude and flood basin effect
A tidal amplitude is required to calculate the vertical positions of SLIPs that express MSL. This counts for data points that have a assigned indicative meaning (Sect. 3.3.2). The tidal amplitude (half the tidal range) is the offset between MHW and MSL and, unlike all other vertical corrections, considers a downward vertical correction (Figs. 4 and 5). Modern tidal ranges along the Dutch coastline are controlled by the North Sea bathymetry and its connection to the ocean's global tides. Recent variability in these tidal ranges is known from centuries of observations, and the ranges are regarded to be relatively stable. The modern tidal circulation is considered to have been established when global sea levels reached their high stand and the North Sea approached its modern depths, from around 6800 years ago (Van der Molen and De Swart, 2001). Over the entire Holocene, however, the tidal ranges are considered to be time-variant, especially for the period from 9000 to 6800 years ago, when the southern North Sea started to fill with water and was consequently inundated, shallow bathymetries deepened, and coastline positions shifted. To allow for this in the HOLSEA-NL set, rather than using modern tidal amplitudes (HOLSEA standard), we implemented a lookup scheme for palaeo-tidal amplitudes (available from earlier model reconstruction work; Van der Molen and De Swart, 2001; Uehara et al., 2006; Ward et al., 2016) and then used those amplitudes to specify the tidal corrections per sample. Herein, we geographically expanded an earlier palaeo-tidal-correction application by Hijma and Cohen (2010, 2019). As in Hijma and Cohen (2019), we specified the palaeo-tidal amplitudes (pMHW) as meta-information in the note fields in the HOLSEA workbook. This considers MHW (pMHW) in the nearshore area, just seaward of the modern coastline.
Nearshore tidal amplitudes propagate inland and are deformed into estuarine, fluvial–tidal, and lagoonal waters inshore, to which the peat-forming hydrological systems originally graded. In the wide, underfilled, estuarine back-barrier lagoonal–deltaic and lagoonal situations of 9000–5000 years ago (Fig. 1), inland tidal dampening is regarded to have occurred in SLIP-producing areas (Hijma and Cohen, 2019). This inland lowering of water tables to a level in between seaward MHW and MSL is called the flood basin effect (FBE) and occurs especially where the semidiurnal tidal wave travels through a narrow bottleneck in and out of broader flood basins inland (Van Veen, 1950; Zonneveld, 1960; Van Veen et al., 2005). To implement this additional tidal correction, used as a modifier of the values provided by the pMHW geographic lookup scheme, the dataset specifies an FBE factor per sample.
Various studies have assessed the past FBE in RSL reconstructions, in particular in the lower Rhine–Meuse area and the Flevo lagoon region (Van de Plassche, 1982, 1995a; Berendsen et al., 2007; Van de Plassche et al., 2010; Vis et al., 2015; Hijma and Cohen, 2019), by cross-comparison of age–depth plots for relative seaward, central, and inland subsites. This way, the sites where GWL age–depth data plots the youngest–deepest can be identified; from this, it is inferred that the FBE must have been largest at these sites. These youngest–deepest points are promoted to SLIP status (more directly related to past MSL positions), while leaving surrounding contemporary sites as ULD points. Assessment of whether the FBE was intermediate (some dampening) or maximally developed (full dampening) requires cross-checks with palaeogeographical reconstructions. Hijma and Cohen (2019) did the latter for the lower Rhine–Meuse Delta, leading to a prescription of the past FBE as intermediate (50 % dampened, FBE=0.5) in the relative open situation before 7.5 ka cal BP, FBE=0.75 between 7.5 and 6.5 ka cal BP, and FBE=1 (full dampening established) for 6.5–3.0 ka cal BP. For the other regions, FBE corrections for data points classified as SLIP were newly assessed, based on the HOLSEA-NL data coverage, with cross-checks against available palaeogeographical reconstructions including the background maps in Fig. 2 and additional maps from Vos et al. (2020), especially in the Flevo lagoon and northern regions. For the western coastline, North Holland to Zeeland, we prescribe the same tidal dampening regime as that used by Hijma and Cohen (2019) for the lower Rhine–Meuse Delta. For the Waddenzee regions, tidal dampening is assumed to have been less prominent. The indicators from the Waddenzee West region are assigned no FBE, as no large flood basins formed around the SLIP-producing samples. The Waddenzee East region is expected to have had some tidal dampening during the Middle Holocene, but this effect decreased towards the Late Holocene. Therefore, the tide is 50 % dampened (FBE=0.5) before 7 ka cal BP; this decreases to 25 % dampening (FBE=0.25) between 7 and 5 ka cal BP, and we assume no dampening after 5 ka cal BP.
We note that the prescription of the FBE applies to the SLIP-producing and primary ULD locations. The GWL at ULD locations surrounding SLIP locations is assumed to be more strongly controlled by pMHW towards the sea and more strongly controlled by the river gradient or terrestrial hydrology inland, but the database does not quantify how strongly. The FBE correction factor is registered together with the pMHW value in the note field.
4.1.3 Long-term background basin subsidence
Because the coastal plain of the Netherlands overlies the North Sea sedimentary basin, which has been undergoing long-term subsidence, it should be considered that part of the relative water level rise documented by the dataset is due to tectonic and sedimentary loading subsidence. Therefore, optionally, depending on the application (see above), the effect of this background term is removed by applying a vertical correction. As input to this correction, a map product specifying a background rate was used, following the approach of Cohen et al. (2022; their Sect. 3.3, “Vertical Land Motion”) in their Last Interglacial sea level database. This map considers estimates of long-term mean subsidence rates calculated over the 1.8 Myr, derived from onshore and offshore Quaternary basin-fill mapping, along with an associated uncertainty specification. For more details, readers are referred to Cohen et al. (2022), including their Sect. 6.6 on preferring 1.8 Myr averaged rates, which are 80 %–70 % of 2.6 Myr rate values. The spatial patterns and values are consistent with earlier tectono-sedimentary back-stripping analyses for this region (Kooi et al., 1998; producing rates calculated over the last 2.6 Myr) and applications thereof in relative sea level data analysis in Kiden et al. (2002), Vink et al. (2007), and Simon and Riva (2020).
For each sample location, values were read from the vertical-land-motion map product and multiplied by the sample's age, with the uncertainty on age plus rate propagated accordingly. The HOLSEA data workbook stores this under “Tectonic correction (m)” (Field 66) and “Tectonic correction uncertainty (m)” (Field 67). The upward corrections range from 0 to 1 m in the study area, with uncertainties of between 0.01 and 0.18 m. Within the study area, rates are highest in the northwest. The averaged values for offsets considered for SLIPs plotted in Fig. 2b (9.2–6.6 ka cal BP) serve as an example: 0.5 m for the Rhine–Meuse palaeovalley; 0.8 m for the Vecht palaeovalley; 0.6 m for the inland Flevo lagoon; and 0.3 m for the northeastern Wadden Sea.
4.1.4 Anthropogenic deep subsidence
The extraction of resources such as gas, water, and salt from a range of depths well below the basal peats has caused significant recent subsidence in specific areas of the Netherlands (e.g. NAM, 2017, 2020). This subsidence has influenced the depth of Holocene water level indicators, and an upward vertical correction is required to remove unwanted lowering of palaeo-water-level indicators and to ensure correct joint plotting of samples collected in the 1950s–1960s, in the 1990s, and in the 2010s in these areas affected by human-induced subsidence. This upward correction is dependent on the year of coring: it is larger for more recent years and is specified in the subsidence history maps by NAM (2017, 2020). In the most affected areas, this correction is up to 0.36±0.10 m. The HOLSEA workbook records this separately as “Human-induced subsidence (m)” (Field 68) and “Human-induced subsidence uncertainty (m)” (Field 69).
4.2 Dating information, including calibration
Radiocarbon dating has been used to determine the age of all of the samples. Because many data points have previously been published and have been assigned various “unique sample IDs”, we decided to use the lab code provided for dating as “Unique sample ID” (Field 1) to avoid confusion with respect to the numbering system. Conforming to the HOLSEA workbook format, the sample ID (lab number) and dating result (age + uncertainty, in 14C years BP) comprise the primary dating information. Where available, the δ13C value (in ‰) and the source reference of the date are provided as meta-information (see also Hijma et al., 2015; Hijma and Cohen, 2019). For very early radiocarbon dates measured before 1962 (original Gro-numbers from the Groningen lab), a later published correction for the Suess effect has been applied, following Vogel and Waterbolk (1963). These samples are documented in the HOLSEA-NL workbook using their converted GrN-numbers, with the original 14C-age document in the notes. Additionally, a bulk error is provided for samples dated using conventional dating (e.g. GrN-numbers), except when explicitly stated that it was not a bulk sample (e.g. piece of wood). The bulk error is provided in the radiocarbon tab of the workbook.
The 14C-dating results from terrestrial material, such as basal-peat macrofossils and charcoal, have been calibrated using the IntCal20 atmospheric calibration curve (Reimer et al., 2020). We recalibrated dates from older studies. Note that dating results calibrated earlier with IntCal04 and IntCal13 (in source literature) hardly differ from the IntCal20 recalibration (in HOLSEA-NL), as all of our data are from within the Holocene part of the calibration curves.
4.2.1 Bayesian calibration
Besides individual date calibrations (“unmodelled” calibrated ages), the workbook provides a second set of fields to allow for storing Bayesian calibration results for a vertical series of samples from the same site, as advocated by Cohen (2005) and Hijma and Cohen (2019). The “modelled” calibrated ages were generated by running Chronological Query Language (CQL) scripts, which were partly reused from Cohen (2003) and Hijma and Cohen (2019), in the OxCal 4.4 software (Bronk Ramsey, 2008, 2009). The sequential calibration model further narrows down the calibrated age of some samples, decreasing the age range by 10 to 500 years. The decrease in the age range is generally larger for older samples that used conventional dating (mostly dated before 2000) compared with those dated using accelerator mass spectrometry (AMS).
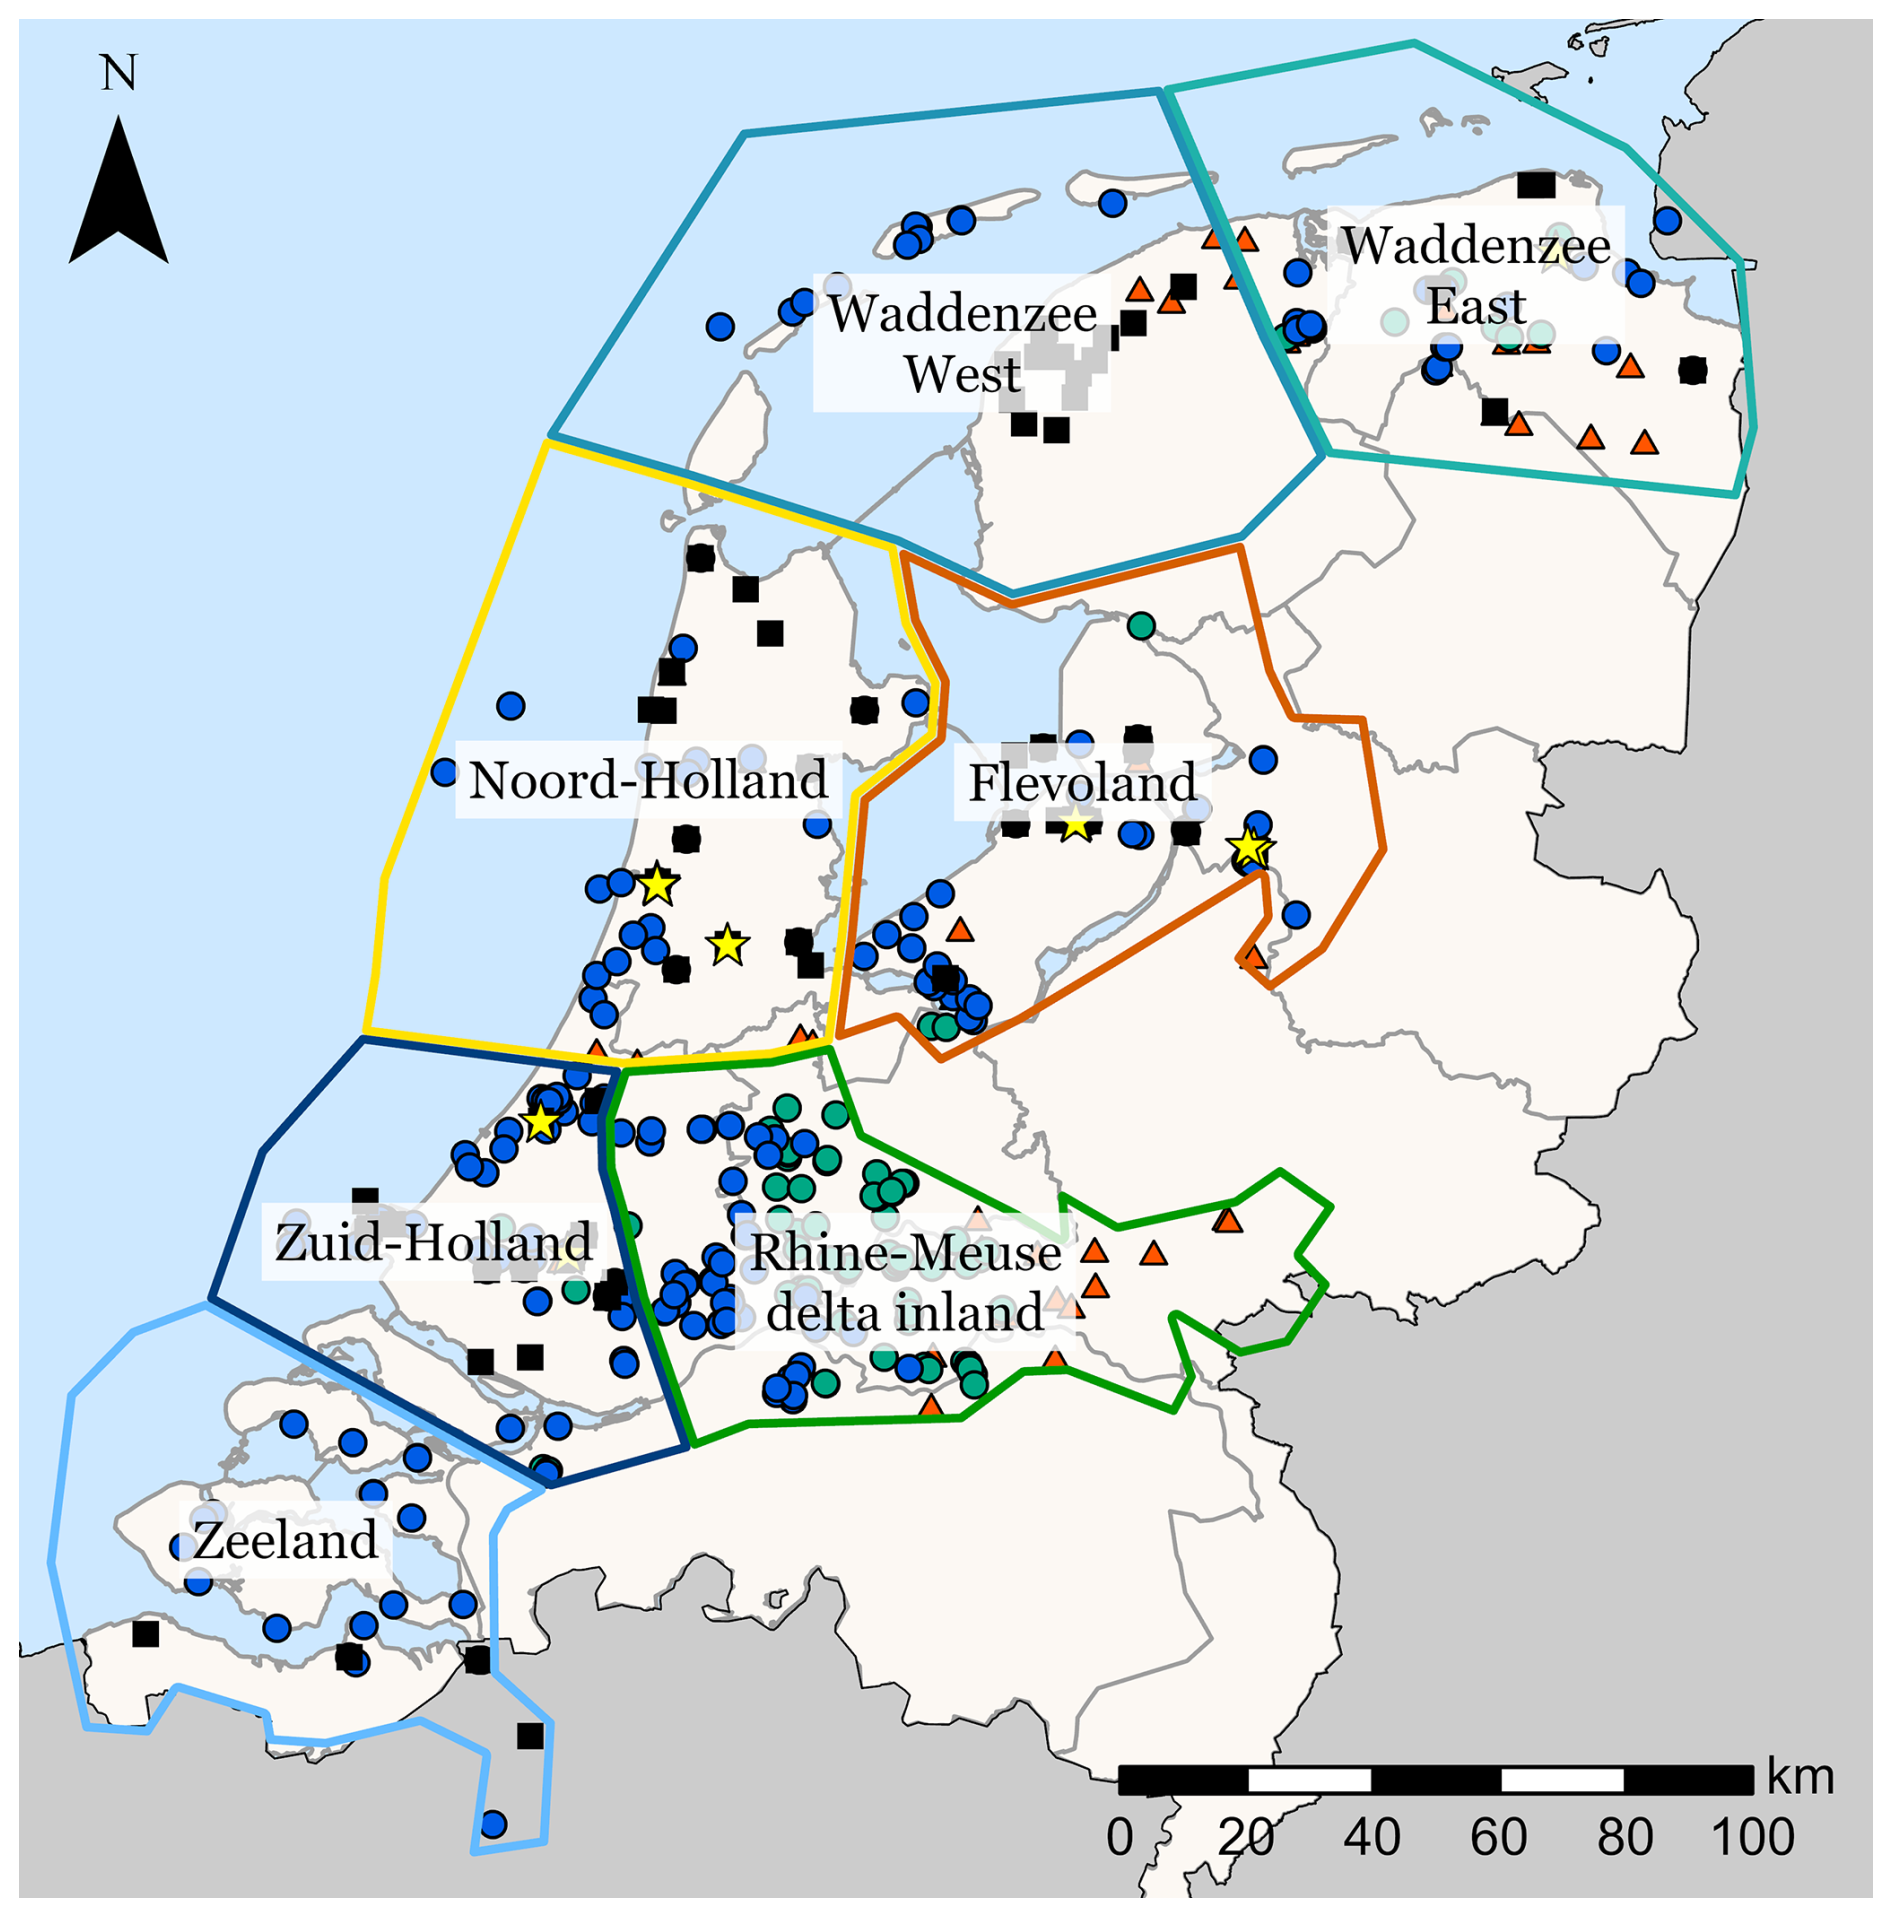
Figure 6Overview map of water level indicators and regional divisions. Multiple indicator points from the same location are plotted on top of each other.
This section summarises the dataset contents in their fully processed form, highlighting the newly achieved uniform coverage. The focus is on describing systematic spatial differences and showing the quantitative effects of including regarded optional vertical corrections. To do so, the data are grouped into seven regions (Fig. 6) that are also geologically different with respect to the Holocene. The boundaries between coastal subregions follow Pleistocene drainage divides (Vos et al., 2011, 2018; Cohen et al., 2017b). The Rhine–Meuse and Vecht transgressed palaeovalleys are both subdivided in an west–east direction based on the dominance of coastal and/or tidal (seaward) vs. fluvial and/or peaty Holocene depositional circumstances (landward) (Fig. 2).
5.1 Spatial distribution
The HOLSEA-NL dataset contains 682 water level indicators; of these, 121 are SLIPs, 14 are LLD points, 368 are primary ULD points, 129 are river-gradient-affected ULD points, and 50 are local GWL secondary inland ULD data points. For three main reasons, most of the collected data are from the Middle Holocene (between 8.2 and 4.2 ka cal BP; Fig. 7a). First, this period corresponds to the inundation of the Pleistocene surface in large parts of the Netherlands during the Middle Holocene, due to which large-scale peat growth was possible throughout the coastal areas of the Netherlands (Vos, 2015b). In this period, most of the basal peat layers were formed (Fig. 2b and c). In Fig. 7a, it can be seen that the ULD local GWL indicators are (relatively) the oldest. In Early Holocene times, long before eventual coastal transgression, peat formed only locally because the sea level was not high enough to reach above the Pleistocene surface (majority of the data are older than 9.2 ka cal BP). Older basal peats related to RSLR are found offshore, mostly outside the study area, where the Pleistocene topography had a lower elevation, resulting in an earlier inundation. Conversely, the many younger basal peat samples (9.2–3.0 ka cal BP data) are found further inland or on top of Pleistocene cover sand and inland dunes. Second, erosion has caused the basal peat to disappear in areas, both along the coast and inland, resulting in the disappearance of many younger peat layers, causing the drop in the general number of peat layers after 5 ka cal BP. Third, in addition to natural erosion, human activity has resulted in the removal of large amounts of peat from the subsurface (Vos, 2015b). Large-scale peat excavations have occurred since the Middle Ages, when peat was mined extensively (Pierik et al., 2017). Additionally, embankments of rivers and artificial drainage led to the oxidation of peaty top soils. The result is that large parts of the shallower peat layers in the Netherlands have disappeared, including some of the younger and shallower basal peat layers. Therefore, water level reconstructions of the Late Holocene require supplementary methods and indicator types in addition to basal peat samples.
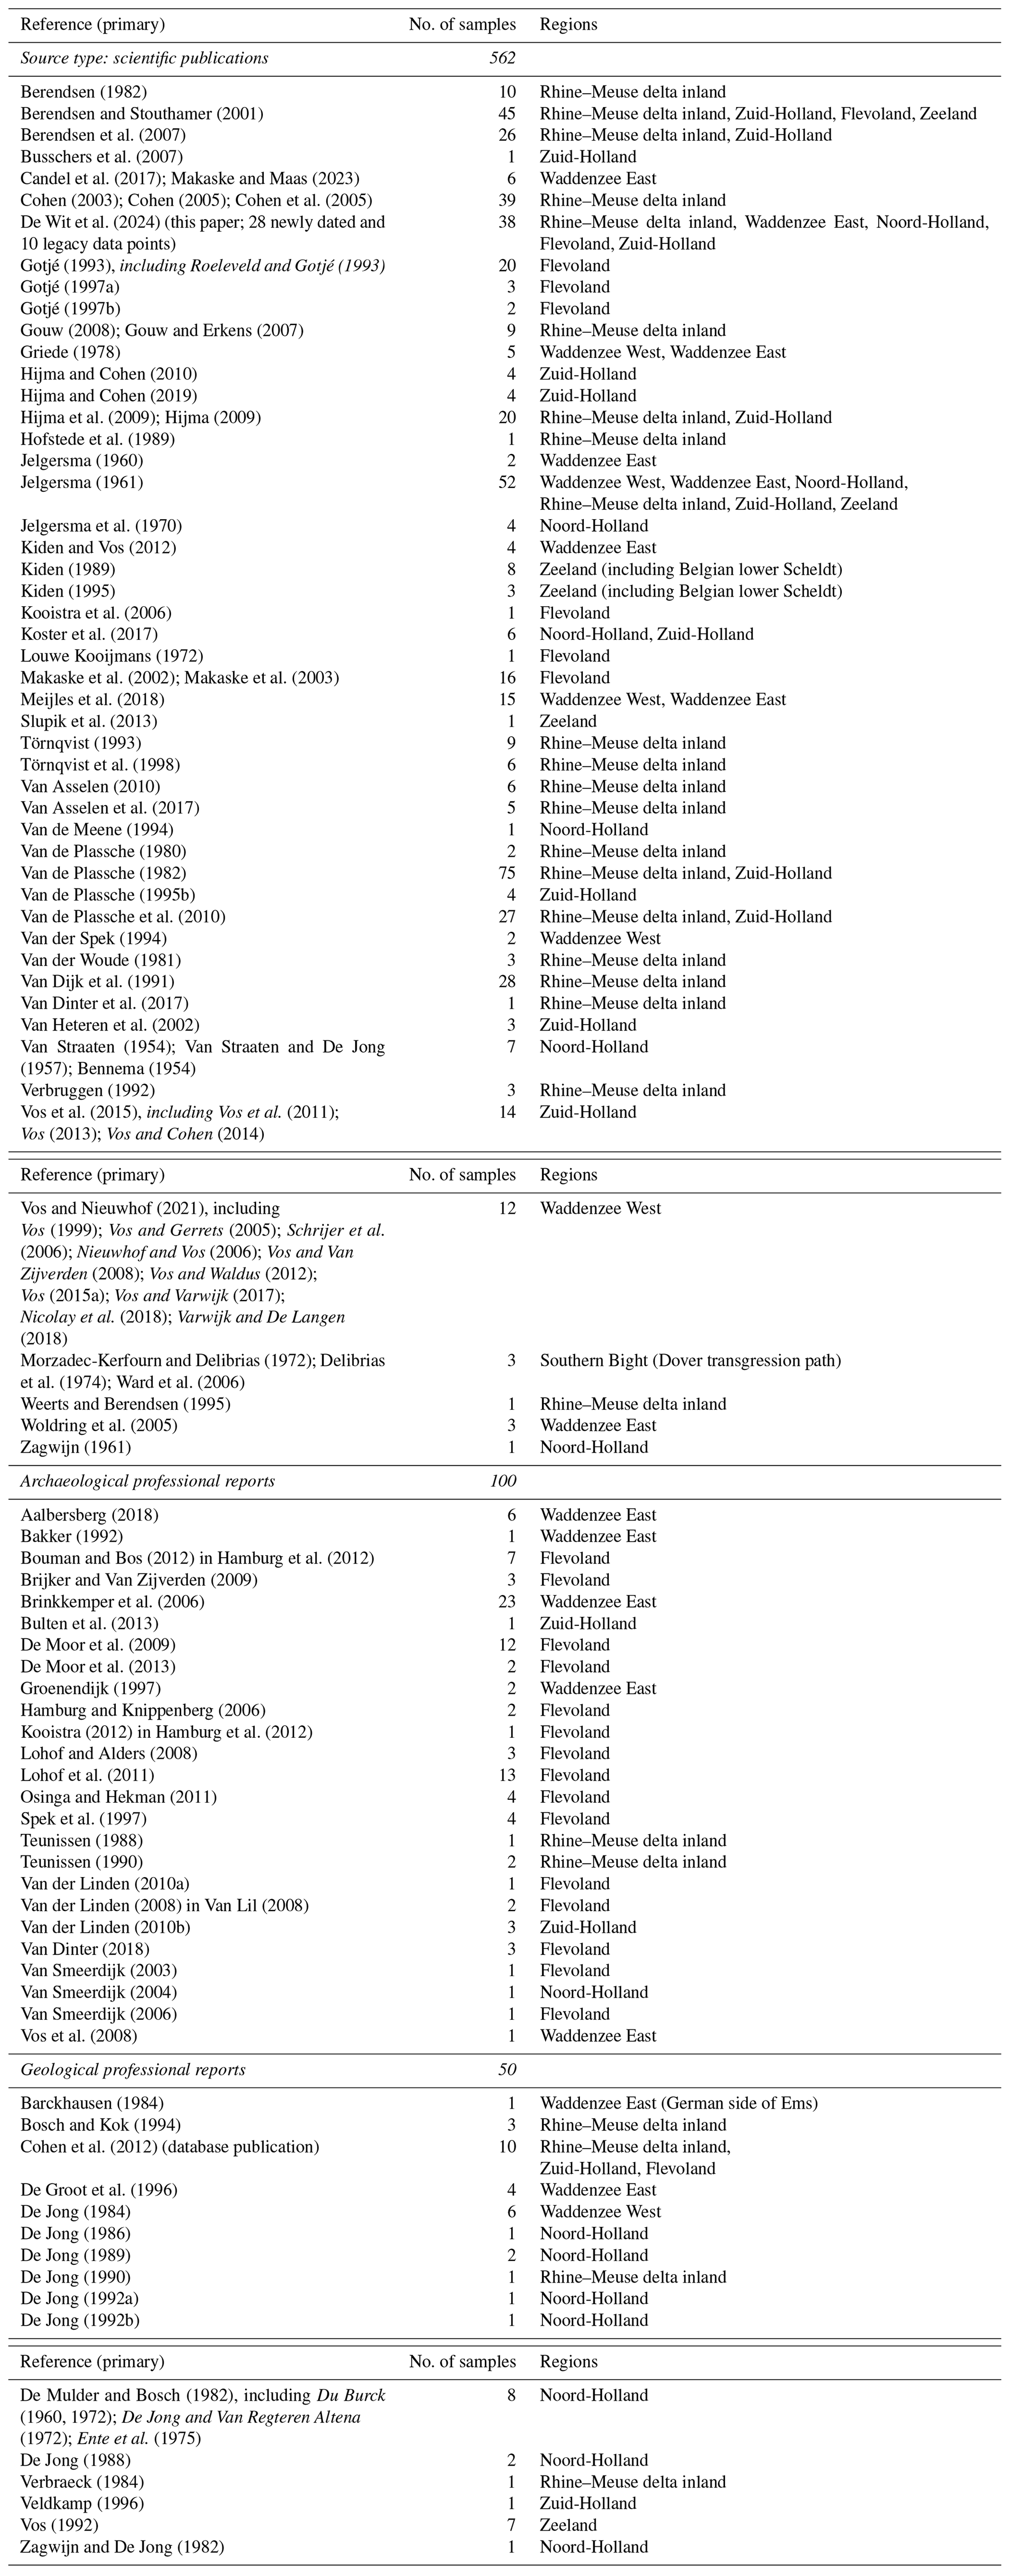
Figure 7b shows when the indicators were dated and serves as an illustration of the diverse, stepped (not all samples were collected at the same time) research history behind the database. Many of the samples were collected and dated in large campaigns, some of which are noted in Fig. 7b. From the 1980s onwards, smaller sets (single sites) were collected, and the nature of the studies producing data became more diverse. Since 2000, routine sampling as part of archaeological prospection attached to infrastructural projects (e.g. the Hanzelijn railroad through Flevoland) has become an important data supplier. The 2022–2023 spike includes newly obtained dates from the North Holland–Flevoland fringe region collected as part of the present research while compiling the database (highlighted in Sect. 5.2; HOLSEA-NL primary reference: “this paper”; De Wit and Cohen, 2024). An overview of all primary source references is given in Table 2.
Table 2Primary data references, including the number of samples per reference and regions covered, split by source type.
When dividing the data over the regions, some distinction in the year of dating is visible between the different regions. This variation shows the shifts in focus for water level and sea level research in the Netherlands. For example, most samples from the Noord-Holland region had already been dated by Van Straaten (1954) and Jelgersma (1961) between 1955 and 1960, with very few additional samples thereafter. We tried to fill this gap with new submissions in 2022–2023. On the other hand, most of the samples from Flevoland have been collected from 1989 onwards, starting with the samples collected by Roeleveld and Gotjé (1993) (published in Gotjé, 1993). Figure 8 reveals the spatially uneven distribution of the water level indicator collection, with the large majority of indicators collected in the central part of the Netherlands (Zuid-Holland, Flevoland, and Rhine–Meuse delta inland regions). This is again strongly linked to the research focus of past studies. For the northern areas, the number of indicators has gradually increased over the past 2 decades, showing an increasing interest in GWL and RSL reconstruction in this area (Meijles et al., 2018; Quik et al., 2021; Makaske and Maas, 2023). Especially for Zeeland in the southwest, the collection of new data has been very limited.
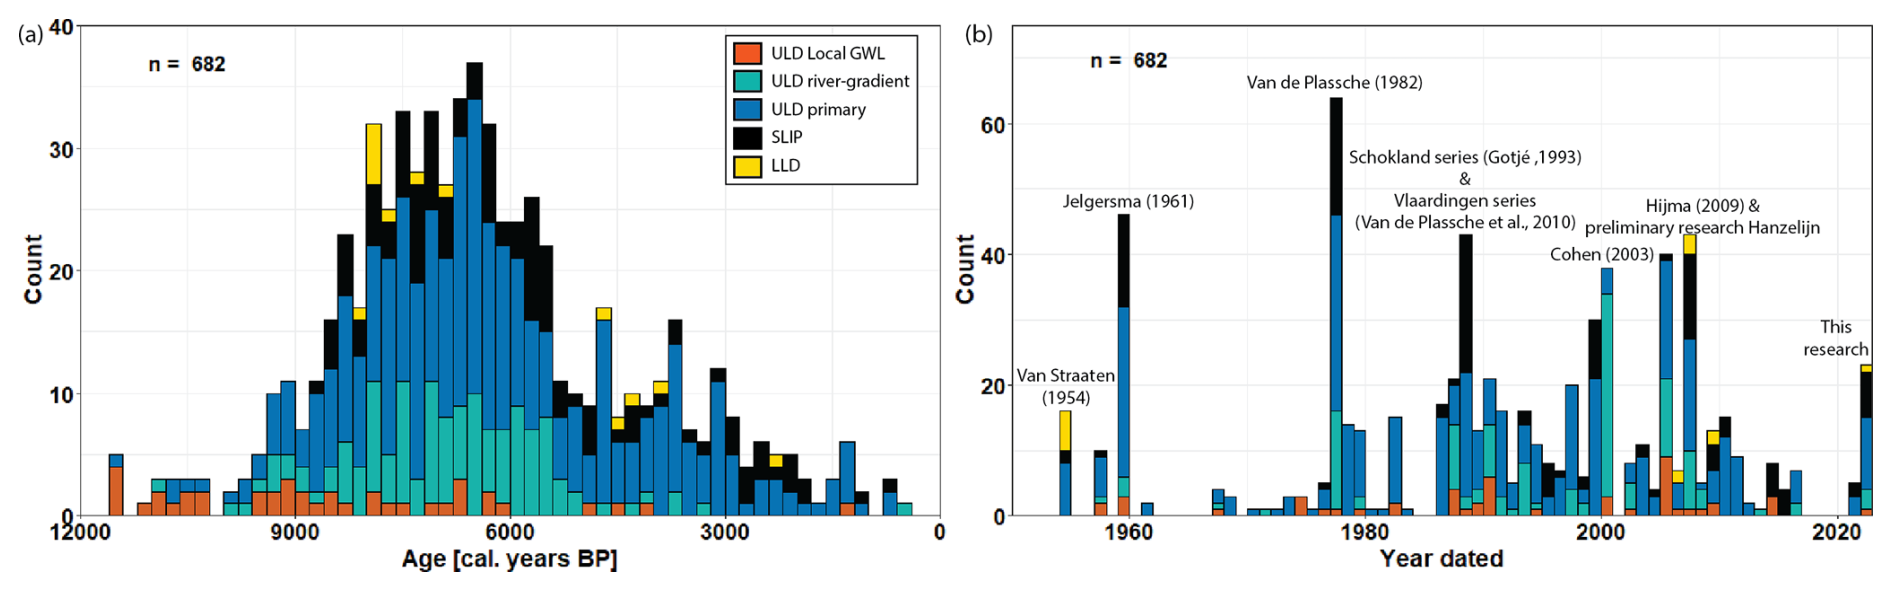
Figure 7(a) Distribution of the number of water level indicators by age from 12 to 0 ka cal BP. (b) Distribution of water level indicators sorted by the year that the samples were dated. Some large sampling campaigns are indicated. Rejected data are omitted.
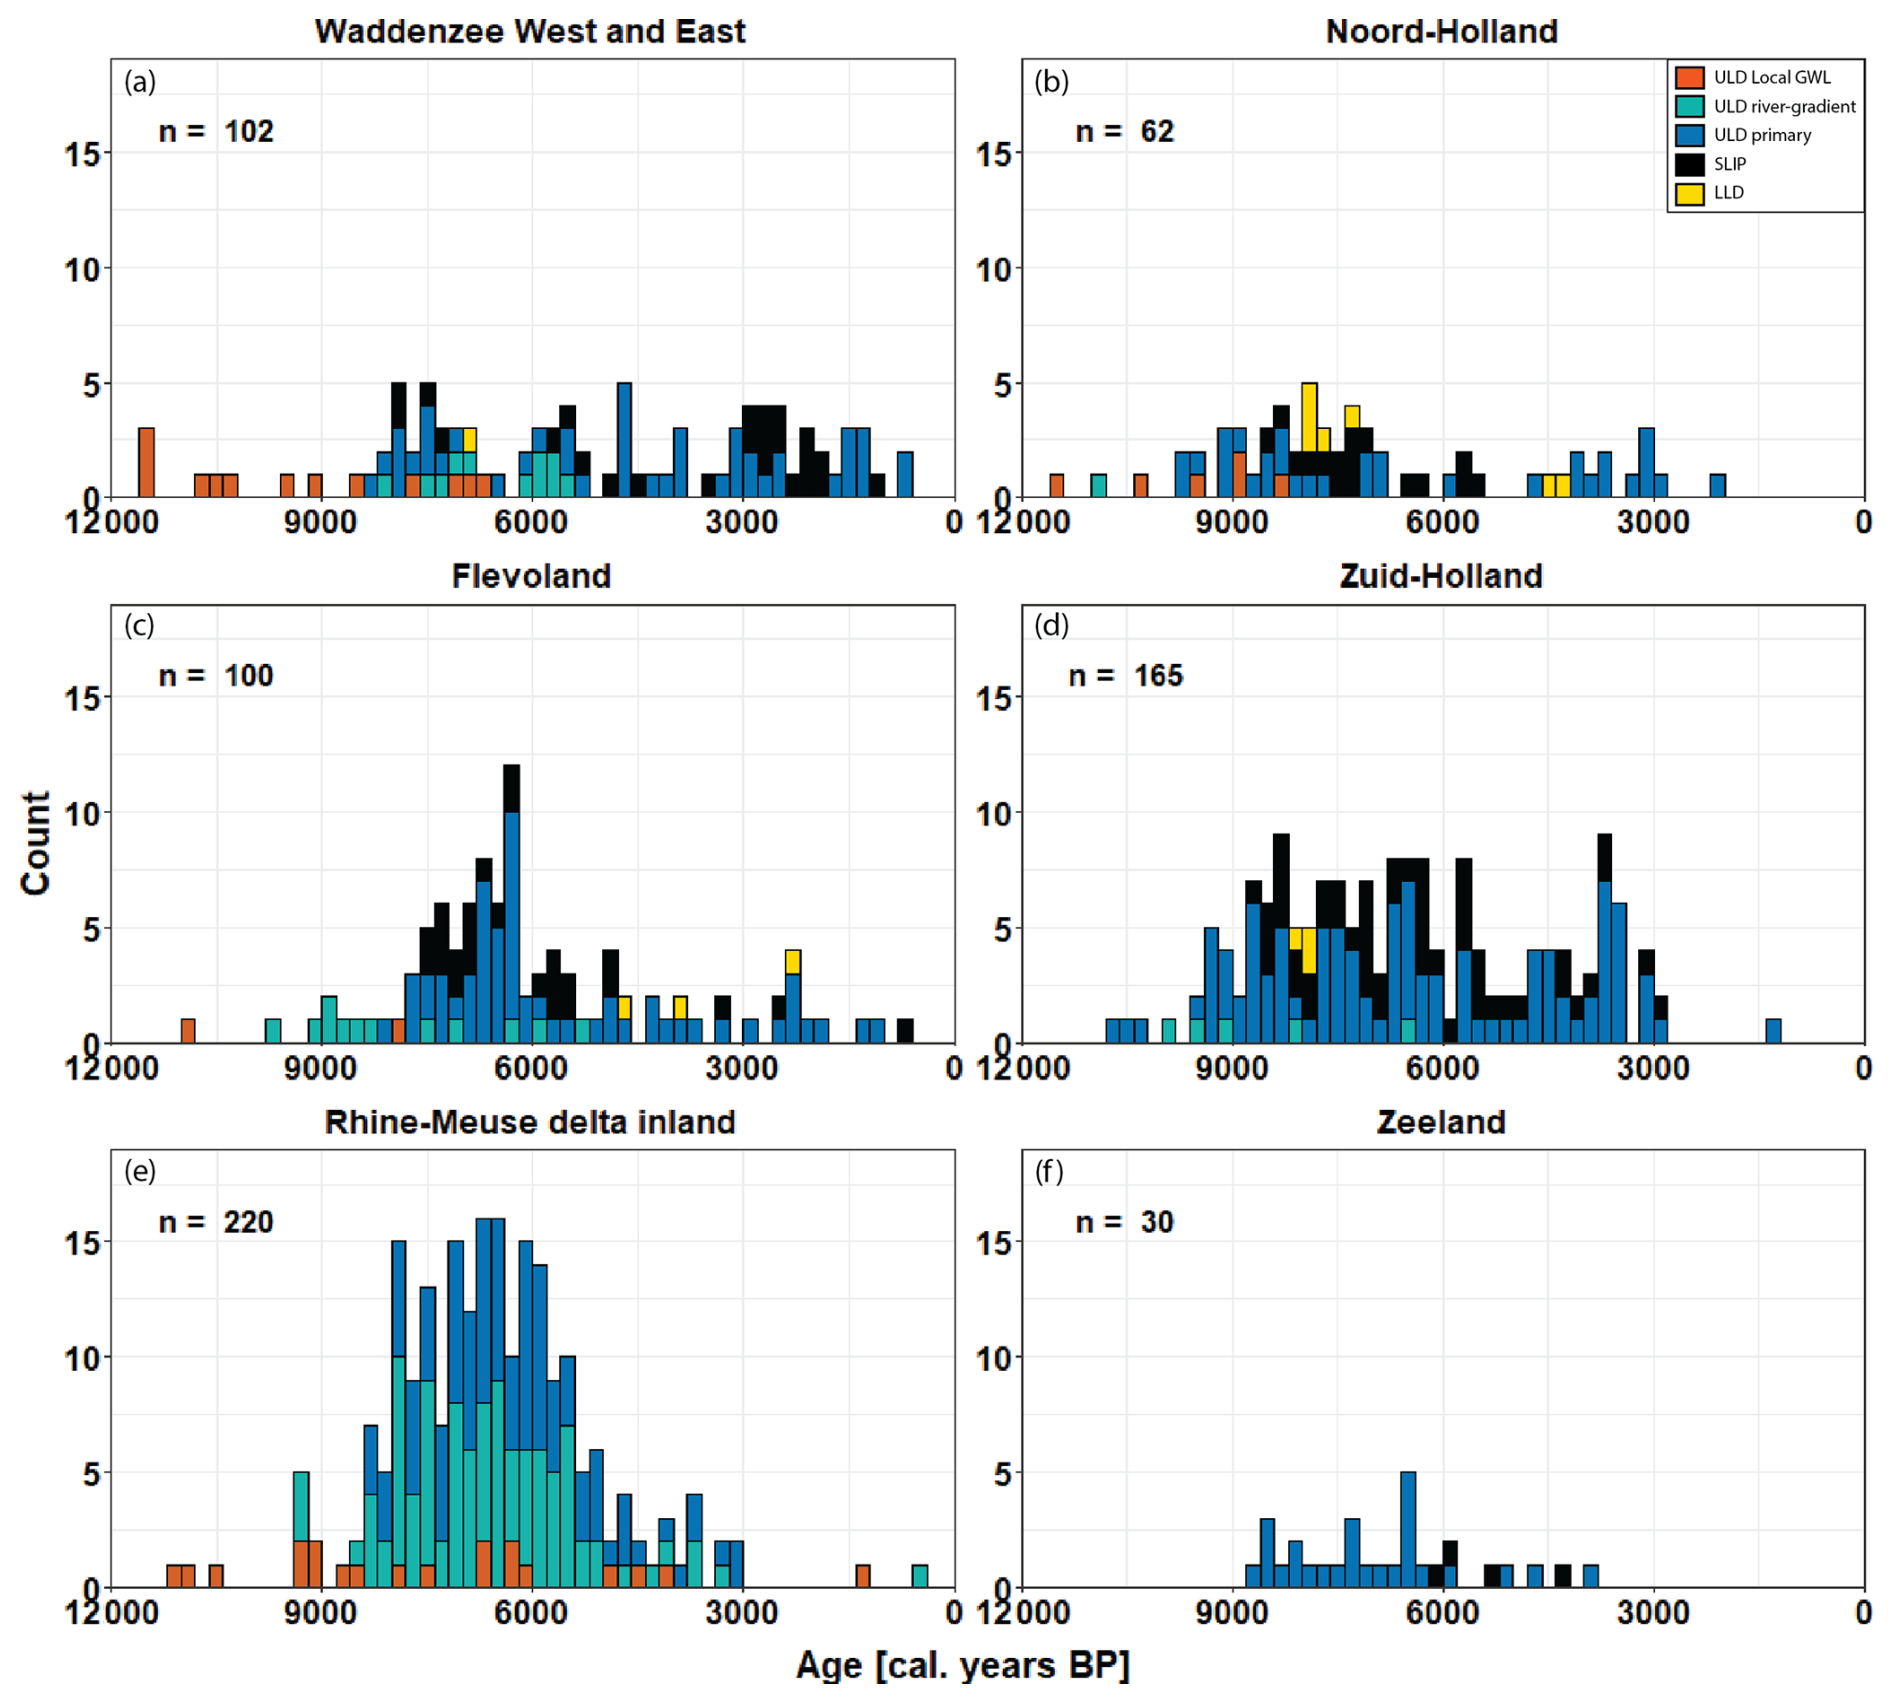
Figure 8Distributions of water level indicators sorted per subregion by age from 12 to 0 ka cal BP. Rejected data are omitted.
5.2 Age–depth plots
Separating the age–depth plots of the corrected water level data (GWL, without palaeo-tidal correction) per region shows the spatial variability in the data (Fig. 9). A consistent water level rise trend is visible in the more densely sampled regions of Zuid-Holland, Rhine–Meuse delta inland, Flevoland, and Waddenzee. In contrast, the plots from Noord-Holland and Zeeland show a patchier pattern, due to the lower number of indicators in these regions. Regarding temporal coverage, the coastal regions of Zuid-Holland, Noord-Holland, and Waddenzee host relatively older ULD tidal and SLIP data, starting ca. 9–8.5 ka cal BP, whereas this commences ca. 8–7.5 ka cal BP in the more inland regions of Flevoland and the Rhine–Meuse delta inland. This reproduces and confirms earlier investigations of the transgression rate (e.g. Vos, 2015b; Koster et al., 2017).
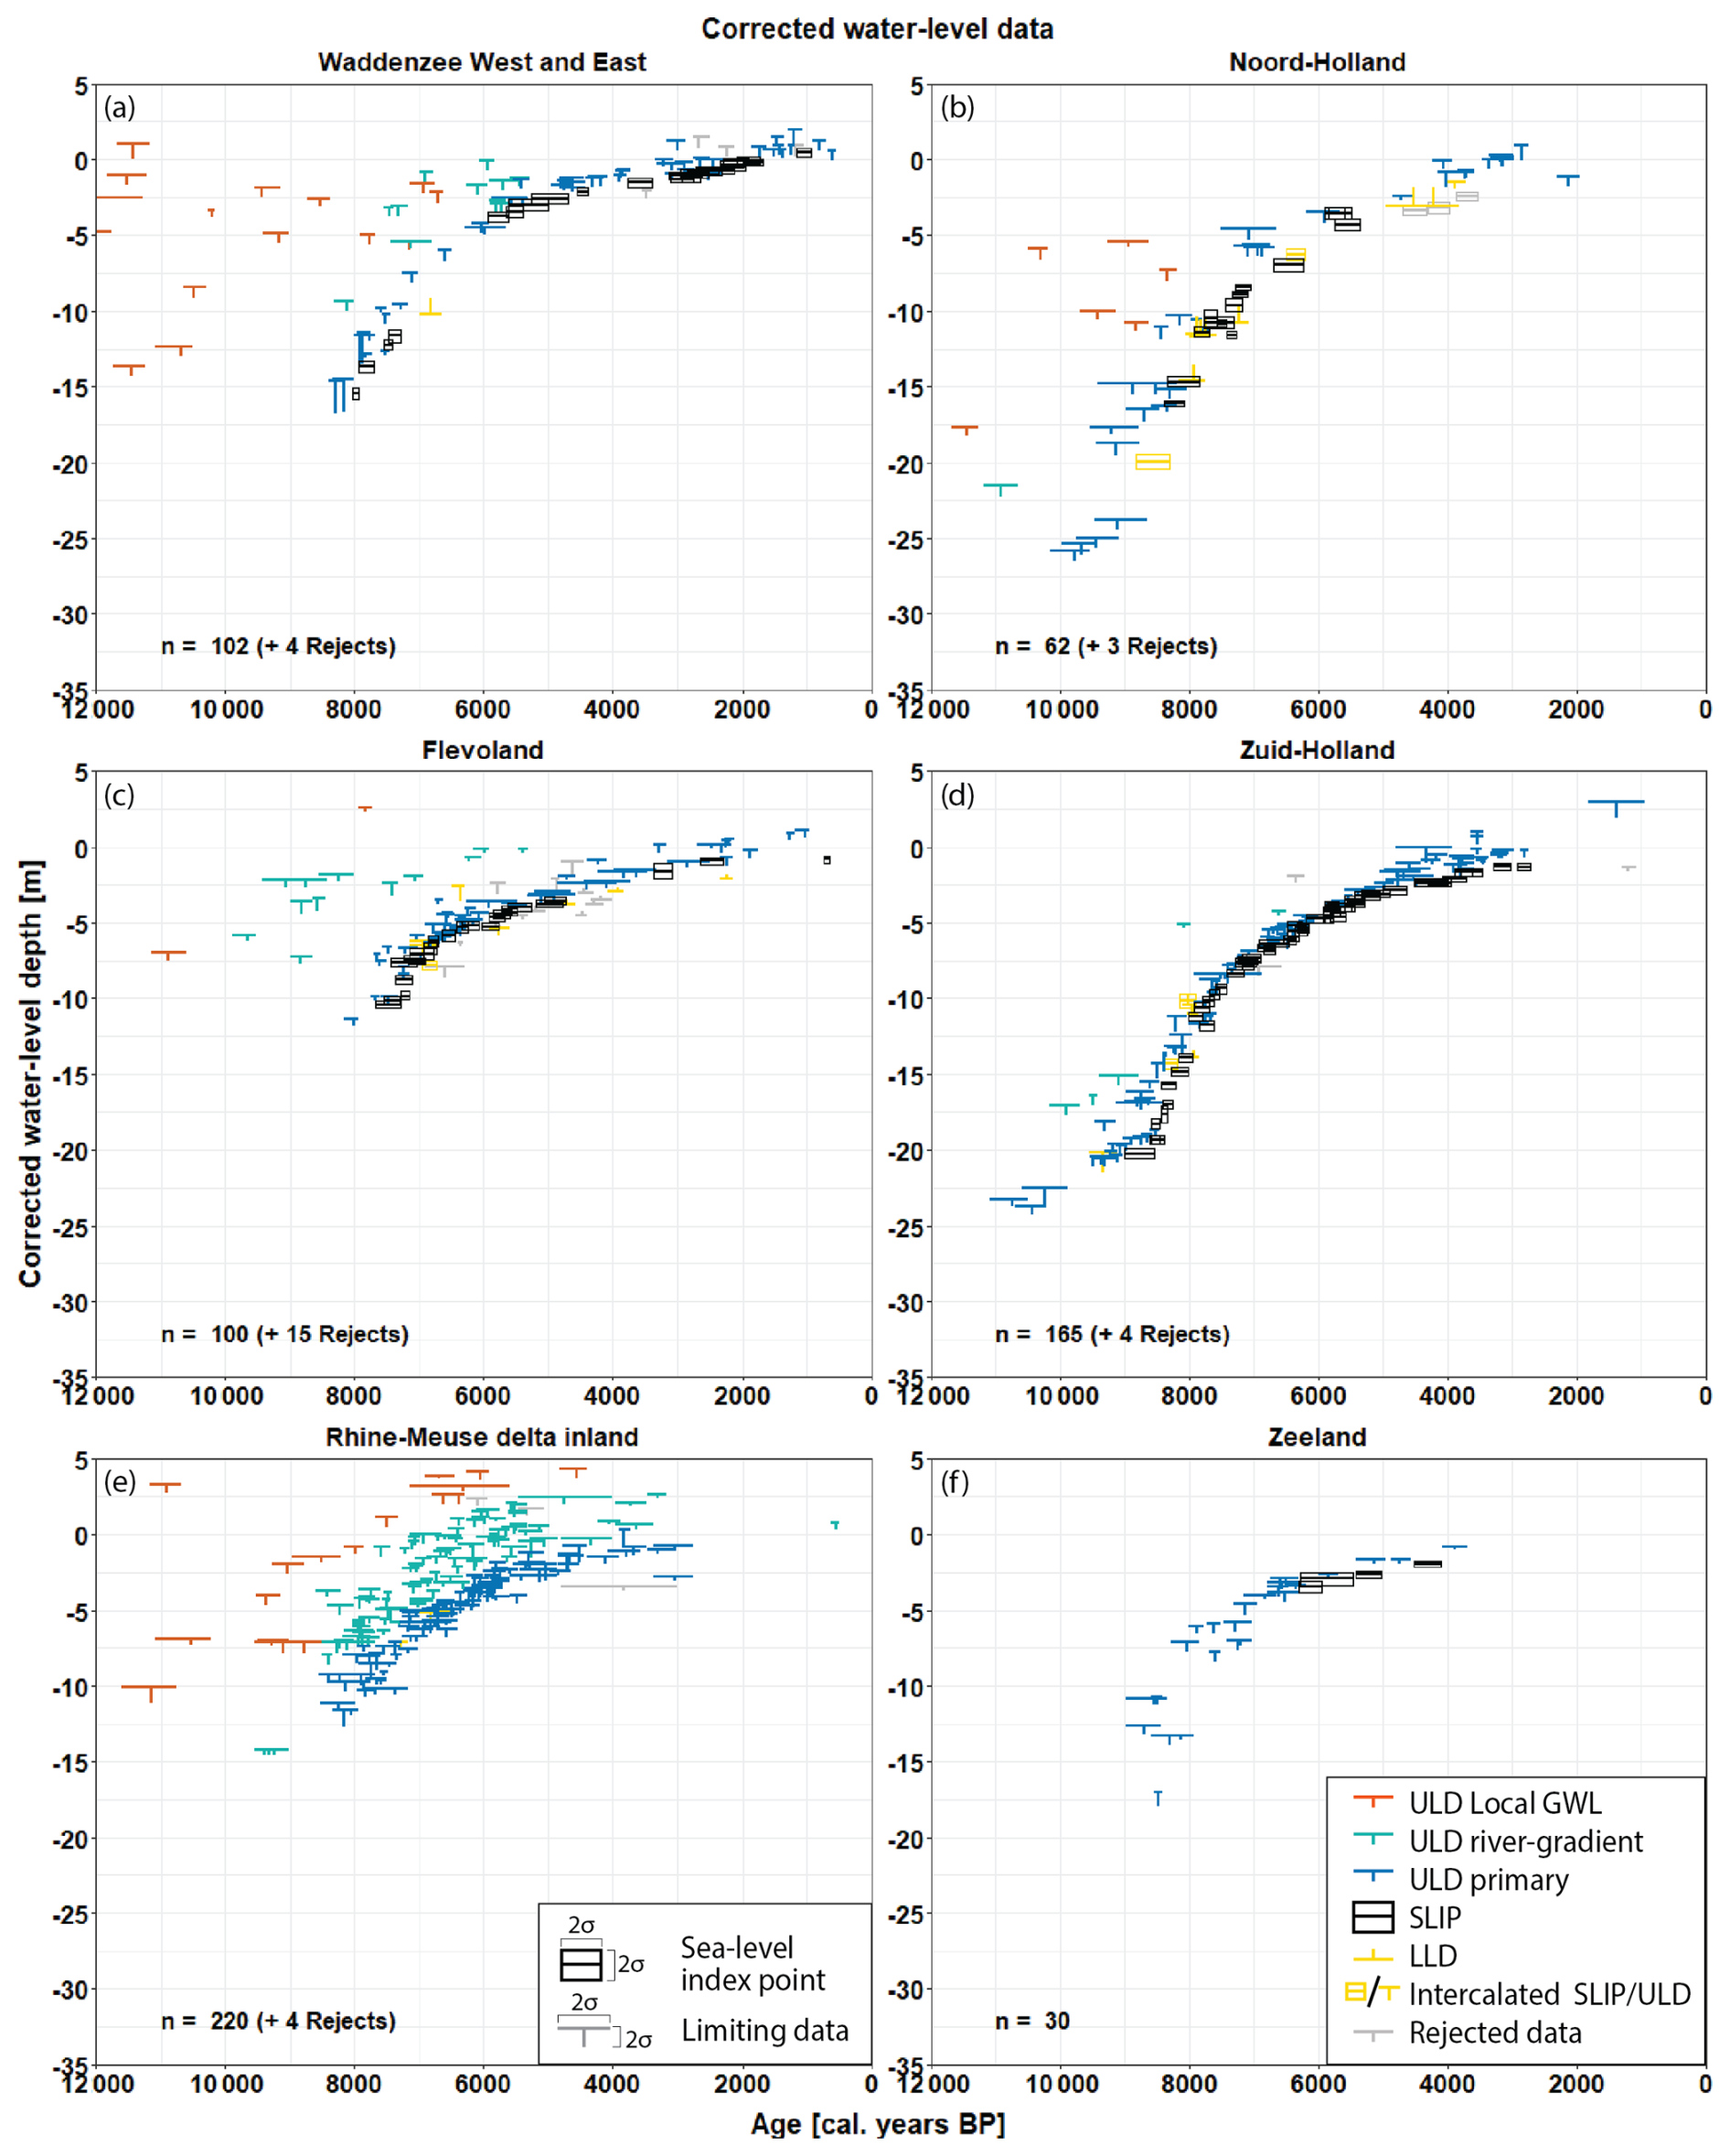
Figure 9Age–depth plots of the corrected water level (GWL) for geological indicators per subregion from 12 to 0 ka cal BP.
The set-up of the HOLSEA-NL workbook allows for several variants of age–depth plotting, useful at different stages of evaluation and iterative classification (SLIP, ULD, etc.) and for different derived dataset use (see also Sect. 4.1). The dataset can be used to make customised age–depth plots employing, for instance, original depth, inferred GWL position, further inferred MSL positions, or further background-subsidence-corrected MSL positions (Figs. 4 and 5). Figure 10a–c provide three variants of indicator depth plotting against age that can be zoomed into to evaluate clusters of apparent outlying data for possible under- or overcorrection. To prevent misinterpretation of the different age–depth data, we recommend using explicit labelling and clear caption details.
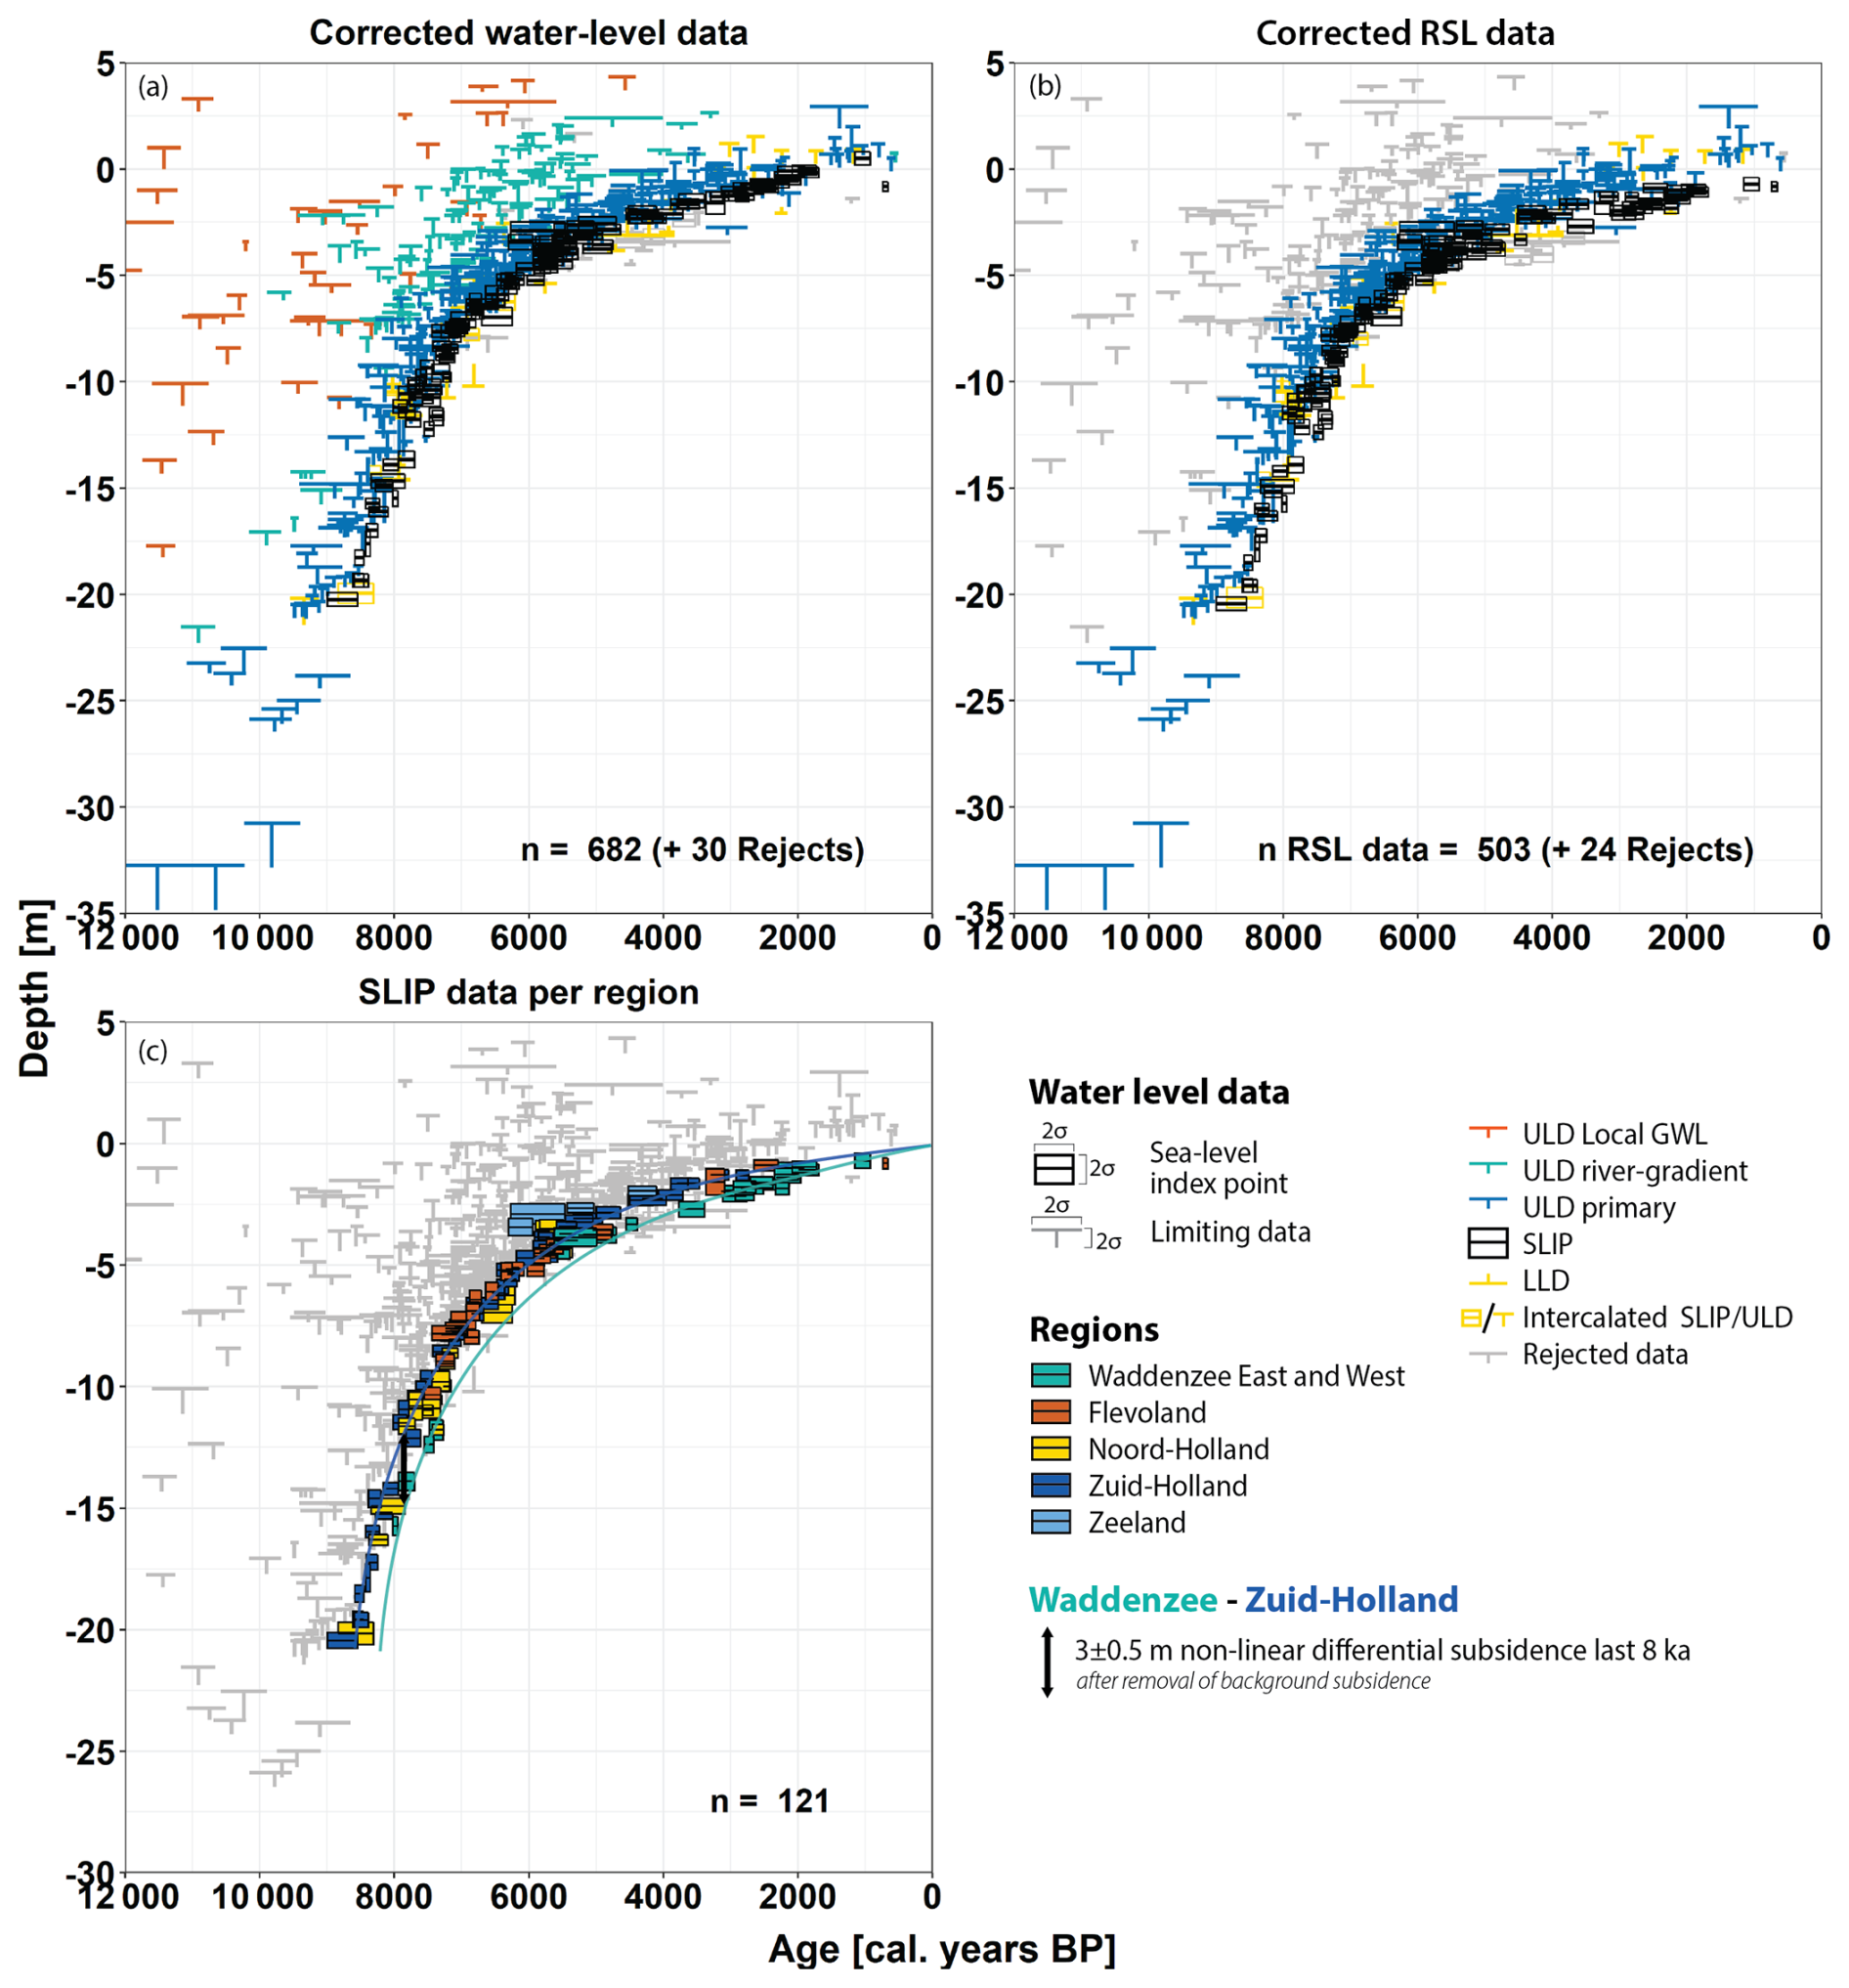
Figure 10Age of indicator data plotted against various sample elevations based on different vertical adjustments applied: (a) using the indicative water level and corrected for decompaction, background basin subsidence, and anthropogenic deep subsidence. Panel (b) is the same as panel (a) but incorporating a palaeo-tidal correction for SLIPs and removing secondary ULD and rejected samples (both in grey). Panel (c) presents fully processed SLIP data (all vertical corrections considered), coloured by region, with tentative curves for the Waddenzee (light blue) and Zuid-Holland SLIP data (dark blue) to illustrate deviation back in time.
Overall, SLIP, ULD, and LLD subsets each show relatively rapid water level rise during the Middle Holocene (from ca. 9 ka cal BP onwards), which slows down towards the Late Holocene (semi-linear after 4 ka cal BP). The river gradient ULD points echo this trend, although at higher positions, lifted up by the river gradient. It is also clear that the local GWL ULD does not follow the general curve but, rather, shows a more diverse pattern (Fig. 10a). Figure 10a shows the elevation of all of the water level data through time with corrections for compaction, background basin subsidence, and anthropogenic deep subsidence (corrected GWL), although without tidal corrections. Figure 10b shows the corrected water level data (in grey) and the RSL data that have been fully corrected with respect to tides. The corrected water level data show a slight upward shift compared with the uncorrected data. Moreover, the propagated uncertainty to the depth positions increases, especially for the older data points.
To illustrate what the databasing activity has added to the inventory as well as how the zoomed-in age–depth plot evaluations worked out, we highlight the newly added and assembled data for North Holland and Flevoland. Historically, North Holland has been a region in which basal-peat data have been relatively scarce (e.g. Van de Plassche, 1982; Koster et al., 2017), while Flevoland has been a region in which basal-peat data have been of diverse origin (Schokland research efforts: Gotjé, 1993; Van de Plassche, 1995a; Almere research efforts: Makaske et al., 2003; various archaeological investigations from 2000 to the 2020s). To add to Middle Holocene data coverage, a cluster of sites were dated from southeastern North Holland (Durgerdam, Slotermeer, and Diemen, N=12: this research) and from within IJsselmeer (Van den Brenk et al., 2023; this research, N=5). To add to Late Holocene data coverage, dates from central Flevoland (Hanzelijn, N=16: Hamburg and Knippenberg, 2006; De Moor et al., 2009; Kampen–Cellemuiden, N=5: this research) were added to the existing data. The following points highlight some findings and actions:
-
Inspection of the Flevoland data after initial entry revealed 5000- to 4000-year-old outlier clusters plotting “too young, too deep”, which (in databases) were registered as “basal peat” dates but had actually been identified in detailed reports (Van Lil, 2008; De Moor et al., 2009) as peat detritus: sediment from peat-lake bottoms, calved from fringing peat bodies, and redeposited at lower elevations. These data points were demoted to LLD data points, and they were partly rejected as sea level indicators (see Fig. 9c).
-
Inspection of the remaining (non-lake bottom) Hanzelijn and Kampen–Cellemuiden data allowed the identification of the lowest–youngest ULD data points in the series and, in three cases, an upgrade of these points to SLIP status for ca. 3000, ca. 2500, and ca. 900 cal yr BP (Fig. 9c); these points supplement and confirm the non-basal-peat terps SLIP set (see Sect. 3.3.5). The eastern fringe of the Flevoland coastal plain is identified as a region holding MSL-reconstruction-relevant peat resources at a relatively shallow position (within 1 m below the ordnance datum), more strongly and explicitly than in earlier national compilations.
-
Inspection of data from southeastern North Holland for the Slotermeer location at 7500 cal yr BP identified it as a “too young, too deep” outlier cluster: presumably a Middle Holocene lake situation, similar to the Late Holocene “Hanzelijn” example mentioned above. These data points were demoted to LLD data points (see Fig. 9b).
-
Inspection of potential onset Late Holocene SLIPs from the Schoorl locality in northwestern North Holland (4500–3500 cal yr BP; Ente et al., 1975) suggests that these plot relatively low (Fig. 9b), and there are competing explanations for this: tectonic correction (∼0.45 m over 4000 years) may be locally underestimated, tidal correction (0.8 m) may be overdone, or compaction correction (0.15 m) may be underestimated. Because of the uncertainty in the vertical corrections and the low elevation of the samples, these potential SLIPs were rejected. Additional sampling in this area and more detailed research on the vertical corrections at this site will improve the age–depth reconstruction and help identify why these Schoorl points plot lower than surrounding points.
A selection of the SLIPs per region from the parent database can be used to fit relative sea level curves per region. Such curves will deviate back in time because of differential subsidence – the northern Netherlands curves being positioned below the southwestern Netherlands curve for the period between 8.5 and 5 ka cal BP. For sea level markers from ca. 8000 ka cal BP, the data (with tectonic correction applied) and tentative curves in Fig. 10c suggest that 2–4 m more subsidence occurred in the northern Netherlands compared with the southwest. This is a similar finding to those of earlier publications – partly corroborating, partly reproducing, and partly detailing it – by Kiden et al. (2002) and Vink et al. (2007), who attribute the regional differences in the Netherlands to GIA-related differential subsidence.
A more extensive comparison of the trends from different regions is recommended, for example, using Bayesian modelling for the SLIP data, like in Cahill et al. (2015). Narrower quantification of the GIA contribution and its decay from the Middle Holocene (8–4 ka cal BP) to Late Holocene (last 4000 years) using the HOLSEA-NL database is part of ongoing research. This type of research extends from geological data to incorporating modern tide gauge, Global Navigation Satellite System (GNSS), and satellite sea level monitoring era data (e.g. Vermeersen et al., 2018; Steffelbauer et al., 2022) – beyond the scope of this dataset and paper that is restricted to geological water level data. Nevertheless, evaluating the sea level rise and subsidence rates from both realms, geological and modern, and integrated usage of the two resources is relevant when reconstructing the Late Holocene and recent RSLR (Simon and Riva, 2020), and the HOLSEA-NL database contributes to iterating that.
Bringing together water level indicator data shows the prospect of reconstructing relative water level rise on a larger spatial scale. Previously, water level or sea level reconstructions were constrained locally to areas where there was a straightforward sampling opportunity (i.e. Zuid-Holland: “Rotterdam” and “Lower RM-delta”); as these areas were revisited several times, this resulted in a high data density (e.g. Jelgersma, 1961; Berendsen et al., 2007; Van de Plassche et al., 2010; Hijma and Cohen, 2019). Compilations for other regions have been more incidentally executed (Jelgersma, 1961; Kiden et al., 2002; Makaske et al., 2003; Meijles et al., 2018). The newly compiled dataset and explicit vertical correction bookkeeping create an opportunity to cross-validate the quality and accuracy of the dataset (Sect. 6.1). Furthermore, this allows for superregional water level reconstructions in previously data-sparse regions.
6.1 Uncertainties and Limitations
In this paper and in the accompanying HOLSEA-NL dataset, we attempted to document all Holocene (coastal) water level indicators for the Netherlands that are relevant for reconstructing relative groundwater rise, sea level rise, and regional subsidence. Given the long history of water level and sea level research in the Netherlands, a broad range of documentation on suitable data existed, although it was not always easily accessible, from which new details may emerge in the future that could lead to the updating/reprocessing individual entries. Furthermore, ongoing and future research is expected to generate further new water level indicator data and gradually increase the HOLSEA-NL data density. Therefore, the compiled dataset of water level indicators and their accompanying metadata should be viewed as a living one, deserving of updates once every other year or so.
Underlying the dataset, a broad range of documentation on water level data exists, on account of the large diversity of studies for which these data were collected. For some fields in the workbook, the documentation is consistent for all samples, such as information on the geographic location of the sample, the sample age, and information on the stratigraphical position of the sample (HOLSEA data sheet Sect. C. “Fields related to horizontal position of RSL” and Sect. D.1). For many other fields, it is much harder to be fully consistent, for example, where uncertainties in the depth and absolute elevation of the sample were considered. In some original studies, this information was thoroughly documented, whereas it was not included in others. Therefore, the uncertainties in sample depth have been recalculated using the standard calculations provided by the HOLSEA workbook format. The fields related to the depth-related uncertainties (Sects. D.2 and D.3 in the HOLSEA workbook) and uncertainties in absolute elevation have partially been added.
The second part of the HOLSEA data sheet almost exclusively contains columns marked as interpretation columns (Sects. D.4 to D.7 in the HOLSEA workbook). This is the section in which the additions of the dataset reported in this paper are documented. To align the documentation of these data, the metadata were iteratively reviewed. Specifically, with regard to the interpretation of the samples as either GWL, ULD, or SLIP, an effort was made to expand the dataset. The quality of the data depends strongly on the sampling method, sampling depth, and what material was used for dating (e.g. bulk or macrofossils). A question arises regarding whether sampled material always represents the actual drowning surface. To prevent such ambiguity, where possible, we recommend using a systematic approach for future sampling and dating of basal peat layers, in line with what is proposed by Quik et al. (2022; developed for relatively inland peats).
In a few original publications, information on the tidal regime near the sampling site is included. It is understandable that this has not been standard practice, as not all samples were originally collected for water level and sea level reconstruction purposes. The HOLSEA-NL database is set up to facilitate the incorporation of tidal information, and this information is now provided for all SLIP and primary ULD samples. In addition to the current MHW level, an effort was made to provide the palaeo-tidal MHW level for these samples as well (as described in Sect. 4.1.2). Especially the FBE note fields may be used in future expansions of the database with, for example, Late Holocene archaeological data along former tidal inlets, where appropriate specification is required (e.g. Behre, 2007; Baeteman et al., 2011). Similarly, the database accommodates the specification of basin subsidence and human-induced subsidence corrections – with respective values taken in from external data products for this (as described in Sect. 4.1.3–4.1.4). This provides transparent documentation on vertical corrections, their uncertainties, and the optionality of using them, enabling users to assess vertical corrections individually – which was one of the aims of this paper. Additionally, the transparent documentation of the different steps helps interpret the data and their uncertainties.
6.2 Data usage
Providing an overview of water level data in the Netherlands with transparent documentation on the variety of adjustments needed and the option to transform raw data into sea level indicators was the main aim of the paper, fulfilled by publishing (De Wit and Cohen, 2024) and documenting (this paper) the HOLSEA-NL database. In this final section, some foreseen usage of the database will be briefly discussed.
First, the dataset is intended to be used for relative sea level reconstruction. For this, the SLIPs, ULD points, and LLD points are relevant input, as well as the different tidal corrections (palaeo-tidal or using current MHW). Moreover, the increase in the spatiotemporal coverage of the sea level data makes it possible to study patterns in sea level rise, such as tidal dampening (FBE) (Van de Plassche, 1995a) and the river gradient effect (Louwe Kooijmans, 1972). Especially in the northern parts of the study area, there are now more regional data, from which a start can be made to constrain the timing and extent of FBE subregionally (as advocated for in Vis et al., 2015).
A second main application is to use the relative water level rise documented through the dataset to reconstruct regional-scale subsidence patterns. The fields related to the background subsidence correction help remove the effect of the sinking of the North Sea Basin from the RSLR signal. This allows for the production of age–depth plots that are directly comparable to regional GIA modelling output. As mentioned and illustrated in Sect. 5.2, spatial intercomparison of rising trends in the data has revealed overprints of differential subsidence (Figs. 9 and 10). Over the Holocene, these are mainly attributed to GIA (2–4 m difference; Sect. 5.2), with basin subsidence being an additional minor component, especially in the west and northwest sectors of the study area (0.4–1 m extra offset; Sect. 4.1.3). Many earlier studies combining sea level data and GIA modelling serve as examples of the importance of comparing geological data with numerical GIA modelling output in order to verify and constrain modelling insights (e.g. Shennan and Horton, 2002; Vink et al., 2007; Bradley et al., 2011). In contrast, modelling forecasts the depths of sea level indicators of a given age in data-scarce regions.
With both the data coverage and the spatiotemporal resolution of GIA modelling increasing, geological-data- and model-derived insights should be expected to slowly converge. The increase in sea level data density demonstrated by the HOLSEA-NL dataset (this paper) and, specifically, the better coverage and more uniform assessment of data from the northern half of the Netherlands will provide more input to spatially constrain GIA modelling output. Conversely, a better understanding of the GIA signal in the Netherlands will aid with untangling the Holocene relative sea level rise signal into constituent components.
Apart from regional-scale sea level and subsidence reconstructions, the dataset can also be used to reconstruct groundwater levels at the subregional scale: in inland areas of the coastal plain, in the Rhine–Meuse Delta sector, and throughout the coastal plain. In that case, all indicator types provide input, and the GWL (i.e. without tidal correction) is used (rather than the RSL). Reconstructing local groundwater levels is the more direct approach when 3D mapping of the build-up of the Holocene wedge is the intended application, as well as for studying spatial patterns in the relative water level rise (similar to Cohen, 2005; Koster et al., 2017). This is particularly true for the Rhine–Meuse Delta, where previous work on water level indicator data has shown that water level isochrones display a downstream gradient (Louwe Kooijmans, 1972; Van Dijk et al., 1991). As a first step, we have explicitly labelled the data points to which this applies (river gradient ULD points). In Sect. 5, this was presented with a focus on the deselection of such data points when exploring the dataset for spatial patterns and differences in MHW and MSL. Applications that explicitly include these data and that investigate and analyse variability in groundwater table elevations in space and time in the delta flood basins may also be envisaged (e.g. Van Asselen et al., 2017). In future investigations, it might be possible to further analyse the river gradient effect and potentially correct inland water level indicators for this process, for instance, to extend differential subsidence analysis inland. Even without explicit correction, groundwater level isochrones of Rhine–Meuse Delta flood basin peats have been used to analyse the local vertical displacement of deposits. For example, to quantify fault offsets across the Peel Boundary Fault zone (Cohen, 2005) and to quantify the degree of compaction lowering of intercalated peats at shorter and longer burial distances along deltaic river branches (Van Asselen, 2011). Furthermore, these water level isochrones based on basal-peat data have provided context for many archaeological excavation studies on the Mesolithic and Neolithic for the Rhine–Meuse Delta (e.g. Louwe Kooijmans, 1972; Van der Woude, 1983; Verbruggen, 1992) as well as in the further coastal plain (e.g. Peeters, 2007; Van den Biggelaar et al., 2015).
The HOLSEA-NL database (https://doi.org/10.5281/zenodo.11098446, De Wit and Cohen, 2024), as a scientific product, is openly accessible (CC-BY). The dataset was compiled by the authors and contains abundant referencing to a great variety of source publications (part scientific publications and part applied regional reports and/or information from institutional databases, the citation of which is not repeated in this paper when considering secondary references). The HOLSEA-NL database format is compliant with field descriptions in https://www.holsea.org/archive-your-data (Khan et al., 2024). The reader is referred to Sect. 4 for added fields specific to our compilation and the Dutch geological setting.
This paper presents a compilation of Holocene coastal water level indicator data from the Netherlands, brought together in a consistent format using the HOLSEA workbook template. The workbook was expanded and complemented, and processing protocols were adapted to accommodate information on more inland water level data as well as to make the compilation suitable for the reconstruction of relative groundwater rise, sea level rise, and regional subsidence. The compilation processed legacy data as well as more recently produced data, with the majority (>600 out of 712 points) of the data not having been previously processed using the HOLSEA protocols (with 104 data points from Zuid Holland being the exception).
The careful and systematic incorporation of sample properties from extensive scattered documentation on individual samples from more than 110 source papers, reports, and a considerable amount of specialised literature (Table 2) on the GWL and MSL indicative meaning of peat data from the Dutch setting allowed for the consistent treatment and specification of different depth adjustment possibilities for each sample. The classification of the data into SLIPs, ULD points, and LLD points, especially when combined with the locational information and subregion labelling, should help guide data users in making the right subselections for their intended application.
In conclusion, this paper and the versatile structure of the new HOLSEA-NL dataset make the water level data suitable for multiple usages. Moreover, the dataset's open accessibility and documentation make future expansion possible. In the northeastern, northwestern, and southwestern parts of the Netherlands, there are still considerable gaps that would welcome improved coverage with Holocene water level markers, as well as for cross-validation of the current data. Overall, this open-access dataset can provide input and context for future Holocene water level and sea level research, bridging the gap between the large number of legacy data and newly collected indicator data and unifying these data in a consistent format.
KdW and KMC reviewed literature related to the data inventory and curated the dataset. KW prepared the figures, tables, and original draft of the paper. All authors edited the manuscript and contributed to the conceptualisation of the manuscript and designing figures.
The contact author has declared that none of the authors has any competing interests.
Publisher's note: Copernicus Publications remains neutral with regard to jurisdictional claims made in the text, published maps, institutional affiliations, or any other geographical representation in this paper. While Copernicus Publications makes every effort to include appropriate place names, the final responsibility lies with the authors.
The research presented in this paper is part of the “Living on Soft Soils: Subsidence and Society” project (grant no. NWA.1160.18.259).
This project is funded by the Dutch Research Council (NWO-NWA-ORC), Utrecht University, Wageningen University, Delft University of Technology, the Ministry of Infrastructure and Water Management, the Ministry of the Interior and Kingdom Relations, Deltares, Wageningen Environmental Research, TNO, the Geological Survey of the Netherlands, STOWA, the Hoogheemraadschap de Stichtse Rijnlanden water authority, the Drents Overijsselse Delta water authority, the province of Utrecht, the province of Zuid-Holland, the municipality of Gouda, Platform Soft Soil, Sweco, Tauw BV, NAM and the Nederlandse Organisatie voor Wetenschappelijk Onderzoek (grant no. NWA.1160.18.259).
This paper was edited by Sebastiaan van de Velde and reviewed by two anonymous referees.
Aalbersberg, G.: Het Natuurlijke Landschap van de Polder Matsloot-Roderwolde, Huisplaatsen in De Onlanden: De geschiedenis van een Drents veenweidegebied, 26–63, ISBN 9789492444721, 2018.
Autin, W. J.: Stratigraphic analysis and paleoenvironmental implications of the Wijchen Member in the lower Rhine-Meuse Valley of the Netherlands, Neth. J. Geosci., 87, 291–307, https://doi.org/10.1017/S0016774600023362, 2008.
Baeteman, C., Waller, M., and Kiden, P.: Reconstructing middle to late Holocene sea-level change: A methodological review with particular reference to “A new Holocene sea-level curve for the southern North Sea” presented by K.-E. Behre: Reconstructing middle to late Holocene sea-level change, Boreas, 40, 557–572, https://doi.org/10.1111/j.1502-3885.2011.00207.x, 2011.
Bakker, J. A.: The Dutch hunebedden: megalithic tombs of the Funnel Beaker Culture, Berghahn Books, ISBN 3-7749-3198-4, 1992.
Barckhausen, J.: Geologische Karte von Niedersachsen 1 : 25 000, Blatt Nr. 2609 Emden NLfB Hannover, Niedersächsisches Landesamt für Bodenforschung, 1984.
Beets, D. J. and Van der Spek, A. J. F.: The Holocene evolution of the barrier and the back-barrier basins of Belgium and the Netherlands as a function of late Weichselian morphology, relative sea-level rise and sediment supply, Neth. J. Geosci., 79, 3–16, https://doi.org/10.1017/S0016774600021533, 2000.
Behre, K.-E.: A new Holocene sea-level curve for the southern North Sea, BOREAS, 36, 82–102, https://doi.org/10.1111/j.1502-3885.2007.tb01183.x, 2007.
Bennema, J.: Bodem-en zeespiegelbewegingen in het Nederlandse kustgebied, PhD thesis, Wageningen University and Research, 1954.
Bennema, J. and Pons, L.: Donken, fluviatiel Laagterras en Eemzee-afzettingen in het westelijk gebied van de grote rivieren, Boor en Spade, 5, 126–137, 1952.
Berendsen, H. J. A.: De genese van het landschap in het Zuiden van de provincie Utrecht: een fysisch-geografische studie = The genesis of the Southern part of the province of Utrecht, the Netherlands, a study of physical geography, PhD thesis, Utrechtse Geografische Studies 25, Universiteit Utrecht, Utrecht, 256 pp., 1982.
Berendsen, H. J. A. and Stouthamer, E.: Palaeogeographic development of the Rhine-Meuse delta, the Netherlands, Koninklijke Van Gorcum, Assen, xi + 268 pp., ISBN 90-2323695-5, 2001.
Berendsen, H. J. A. and Stouthamer, E.: Paleogeographic evolution and avulsion history of the Holocene Rhine-Meuse delta, the Netherlands, Neth. J. Geosci., 81, 97–112, https://doi.org/10.1017/S0016774600020606, 2002.
Berendsen, H. J. A., Makaske, B., Van de Plassche, O., Van Ree, M. H. M., Das, S., Van Dongen, M., Ploumen, S., and Schoenmakers, W.: New groundwater-level rise data from the Rhine-Meuse delta – implications for the reconstruction of Holocene relative mean sea-level rise and differential land-level movements, Neth. J. Geosci., 86, 333–354, https://doi.org/10.1017/S0016774600023568, 2007.
Bos, I. J., Busschers, F. S., and Hoek, W. Z.: Organic-facies determination: a key for understanding facies distribution in the basal peat layer of the Holocene Rhine-Meuse delta, the Netherlands, Sedimentology, 59, 676–703, https://doi.org/10.1111/j.1365-3091.2011.01271.x, 2012.
Bosch, J. and Kok, H.: Toelichting bij de geologische kaart van Nederland 1 : 50.000, Blad Gorinchem west (38 W), 1994.
Bouman, M. J. I. T. and Bos, J. A. A.: Chapter 10 Paleoecologie, in: Dronten Swifterbant N23 vindplaats 5 Opgraving, edited by: Hamburg, T. (Archol BV), Müller, A. (ADC ArcheoProjecten BV), and Quadflieg, B. (Vestigia BV), DANS Data Station Archaeology, 2012.
Bradley, S. L., Milne, G. A., Shennan, I., and Edwards, R.: An improved glacial isostatic adjustment model for the British Isles, J. Quaternary Sci., 26, 541–552, https://doi.org/10.1002/jqs.1481, 2011.
Brijker, J. M. and Zijverden, W. K.: Zwolle, Westenholte dijkverlegging: een bureauonderzoek en inventariserend veldonderzoek in de vorm van een verkennend booronderzoek, ADC ArcheoProjecten, https://doi.org/10.17026/dans-zjm-6e5b, 2009.
Brinkkemper, O., Bijkerk, W., Brongers, M., Jager, S., Kosian, M., Spek, T., and Van der Vaart, J.: Cultuur, Mens en Natuur in de Mieden, I. Biografie van de Mieden – Landschapsgeschiedenis van de miedengebieden bij Buitenpost, Surhuizum en Zwaagwesteinde (Noordoost-Friesland), Rijksdienst voor Archeologie, Cultuurlandschap en Monumenten, Fryske Akademy, Altenburg and Wymenga ecologisch onderzoek, Amersfoort, Leeuwarden, Veenwouden, 2006.
Bronk Ramsey, C.: Deposition models for chronological records, Quaternary Sci. Rev., 27, 42–60, https://doi.org/10.1016/j.quascirev.2007.01.019, 2008.
Bronk Ramsey, C.: Bayesian analysis of radiocarbon dates, Radiocarbon, 51, 337–360, https://doi.org/10.1017/S0033822200033865, 2009.
Bulten, E. E. B., Boonstra, Y. M., and Arnoldussen, S.: Bronovo, een Hilversumvindplaats aan zee: Gemeente Den Haag: bronstijd-en ijzertijdbewoning in de Haagse duinen, Gemeente Den Haag, Dienst Stadsbeheer, Afdeling Archeologie, https://doi.org/10.17026/dans-x32-ygvr, ISBN 978-94-6067-134-0, 2013.
Bungenstock, F., Freund, H., and Bartholomä, A.: Holocene relative sea-level data for the East Frisian barrier coast, NW Germany, southern North Sea, Neth. J. Geosci., 100, e16, https://doi.org/10.1017/njg.2021.11, 2021.
Busschers, F. S., Kasse, C., van Balen, R. T., Vandenberghe, J., Cohen, K. M., Weerts, H. J. T., Wallinga, J., Johns, C., Cleveringa, P., and Bunnik, F. P. M.: Late Pleistocene evolution of the Rhine-Meuse system in the southern North Sea basin: imprints of climate change, sea-level oscillation and glacio-isostacy, Quaternary Sci. Rev., 26, 3216–3248, https://doi.org/10.1016/j.quascirev.2007.07.013, 2007.
Cahill, N., Kemp, A. C., Horton, B. P., and Parnell, A. C.: Modeling sea-level change using errors-in-variables integrated Gaussian processes, Ann. Appl. Stat., 9, 547–571, https://doi.org/10.1214/15-AOAS824, 2015.
Candel, J. H. J., Makaske, B., Storms, J. E. A., and Wallinga, J.: Oblique aggradation: a novel explanation for sinuosity of low-energy streams in peat-filled valley systems, Earth Surf. Proc. Land., 42, 2679–2696, https://doi.org/10.1002/esp.4100, 2017.
Cohen, K. M.: Differential subsidence within a coastal prism: late-glacial-Holocene tectonics in the Rhine-Meuse delta, the Netherlands, Koninklijk Nederlands Aardrijkskundig Genootschap, Faculteit Ruimtelijke Wetenschappen, PhD thesis, Nederlandse geografische studies 316, Universiteit Utrecht, Amsterdam, Utrecht, 172 pp., 2003.
Cohen, K. M.: 3D Geostatistical Interpolation and Geological Interpretation of Paleo-Groundwater Rise in the Holocene Coastal Prism in the Netherlands, in: River Deltas–Concepts, Models, and Examples, vol. 83, edited by: Giosan, L. and Bhattacharya, J. P., SEPM Society for Sediment. Geol., https://doi.org/10.2110/pec.05.83.0341, 2005.
Cohen, K. M., Gouw, M. J. P., and Holten, J. P.: Fluvio-Deltaic Floodbasin Deposits Recording Differential Subsidence within a Coastal Prism (Central Rhine–Meuse Delta, the Netherlands), in: Fluvial Sedimentology VII, John Wiley & Sons, Ltd, 295–320, https://doi.org/10.1002/9781444304350.ch17, 2005.
Cohen, K. M., Stouthamer, E., Pierik, H. J., and Geurts, A. H.: Vernieuwd Digitaal Basisbestand Paleogeografie van de Rijn-Maas Delta: Beknopte toelichting bij het Digitaal Basisbestand Paleogeografie van de Rijn-Maas Delta, https://doi.org/10.17026/dans-x7g-sjtw, 2012.
Cohen, K. M., Dambrink, R., de Bruijn, R., Marges, V. C., Erkens, G., Pierik, H. J., Koster, K., Stafleu, J., Schokker, J., and Hijma, M. P.: Mapping buried Holocene landscapes: past lowland environments, palaeoDEMs and preservation in GIS, in: Knowledge for Informed Choices: Tools for more effective and efficient selection of valuable archaeology in the Netherlands, edited by: Lauwerier, R. C. G. M., Eerden, M. C., Groenewoudt, B. J., Lascaris, M. A., Rensink, E., Smit, B. I., Speleers, B. P., and van Doesburg, J., 73–95, Netherlands Archeological Reports; Vol. 55, RCE, ISBN 9789057992773, 2017a.
Cohen, K. M., Schokker, J., Hijma, M. P., Koster, K., Pierik, H. J., Vos, P. C., Erkens, G., and Stafleu, J.: Landschapskaarten en hoogtemodellen naar periode en diepte voor archeologisch gebruik in Holoceen-afgedekte delen van Nederland, DANS Data Station Archaeology [data set], V1 https://doi.org/10.17026/dans-zck-y7ww, 2017b.
Cohen, K. M., Cartelle, V., Barnett, R., Busschers, F. S., and Barlow, N. L. M.: Last Interglacial sea-level data points from Northwest Europe, Earth Syst. Sci. Data, 14, 2895–2937, https://doi.org/10.5194/essd-14-2895-2022, 2022.
Creel, R. C., Austermann, J., Khan, N. S., D'Andrea, W. J., Balascio, N., Dyer, B., Ashe, E., and Menke, W.: Postglacial relative sea level change in Norway, Quaternary Sci. Rev., 282, 107422, https://doi.org/10.1016/j.quascirev.2022.107422, 2022.
De Groot, T. A., Westerhoff, W., and Bosch, J.: Sea-level rise during the last 2000 yr as recorded on the Frisian Islands (the Netherlands), Mededelingen Rijks Geologische Dienst, 57, 69–78, 1996.
De Jong, J.: Age and vegetational history of the coastal dunes in the Frisian islands, the Netherlands, Geol. Mijnbouw, 63, 269–275, 1984.
De Jong, J.: RGD Pal. Lab. Rap. 1009 – Veldgegevens van ontsluitingen bij Heiloo en daarmee samenhangende resultaten van C14-ouderdomsbepalingen, Rijks Geologische Dienst, Haarlem, 1986.
De Jong, J.: RGD Pal. Lab. Rap. 895, 895ab – Gegevens inzake te verrichten C14-ouderdomsbepaingen i.v.m. de genese van de Utrechtse Vecht en de Kromme Amstel, Rijks Geologische Dienst, Haarlem, 1988.
De Jong, J.: RGD Pal. Lab. Rap. 1067 – Pollenanalytisch en C14-onderzoek aan strandvlakteveen uit het stadsdeel Schalkwijk onder Haarlem, Rijks Geologische Dienst, Haarlem, 1989.
De Jong, J.: RGD Pal. Lab. Rap. 974a – Uitkomst van een C14-bepaling aan veen afkomstig uit een bouwput aan de Hambakenweg te Den Bosch, Rijks Geologische Dienst, Haarlem, 1990.
De Jong, J.: RGD Pal. Lab. Rap. 1161 – Schoorl Strand, veldwaarnemingen en resultaten van pollenanalytisch- en C14-onderzoek, Rijks Geologische Dienst, Haarlem, 1992a.
De Jong, J.: RGD Pal. Lab. Rap. 1178 – Pollenanalytisch – en C14-onderzoek van een boring uit de strandvlakte te Ruigenhoek, Rijks Geologische Dienst, Haarlem, 1992b.
De Jong, J. and van Regteren Altena, J.: Enkele geologische en archeologische waarnemingen in Alkmaars oude stad – Alkmaar, van boederij tot middeleeuwse stad, Alkmaarse Studieën 1, 1972.
De Moor, J. J. W., Bos, J. A. A., Bouman, M., Moolhuizen, C., Exaltus, R. P., Maartense, F. P. A., and Van der Linden, T. J. M.: Definitief Archeologisch Onderzoek in het tracé van de Hanzelijn in het Nieuwe Land, Een interdisciplinaire geo-archeologische waardering van het begraven landschap van Oostelijk Flevoland, Deltares 1001311-000-GEO-0005, 2009.
De Moor, J. J. W., Maurer, A. M., Houchin, R., and Fritzsch, D.: Almere Poort, Godendreef Verstoringsonderzoek 4J4K_I De Distel, https://doi.org/10.17026/dans-zpt-4yfk, 2013.
De Mulder, E. F. J. and Bosch, J. H. A.: Holocene stratigraphy, radiocarbon datings and paleogeography of central and northern North-Holland (the Netherlands), Mededelingen – Rijks Geologische Dienst, 36, 111–160, 1982.
De Wit, K. and Cohen, K. M.: HOLSEA-NL: Holocene water level and sea-level indicator dataset for the Netherlands (v1.0), Zenodo [data set], https://doi.org/10.5281/zenodo.11098447, 2024.
Delibrias, G., Guillier, M. T., and Labeyrie, J.: Gif Natural Radiocarbon Measurements VIII, Radiocarbon, 16, 15–94, https://doi.org/10.1017/S0033822200001417, 1974.
Du Burck, P.: Enige beschouwingen over het ontstaan van de oudere zeeklei-afzettingen en het oppervlakte-veen in het noordelijk deel van Noord-Holland: uitgaande van stratigrafische gegevens en met behulp van enkele 14C bepalingen en palynologische analysen, STIBOKA, Voorl. Wet. Med. 10, 1960.
Du Burck, P.: De bodemgesteldheid van de Anna Paulownapolder en van de polder Het Koegras, STIBOKA, no. 927, 1972.
Ente, P. J., Zagwijn, W. H., and Mook, W. G.: The Calais deposits in the vicinity of wieringen and the geogenisis of Northern North Holland, Geol. Mijnbouw, 54, 1–14, 1975.
Erkens, G., Van der Meulen, M. J., and Middelkoop, H.: Double trouble: subsidence and CO2 respiration due to 1000 yr of Dutch coastal peatlands cultivation, Hydrogeol. J., 24, 551–568, https://doi.org/10.1007/s10040-016-1380-4, 2016.
Gotjé, W.: De Holocene laagveenontwikkeling in de randzone van de Nederlandse kustvlakte (Noordoostpolder), PhD thesis, Vrije Universiteit, Amsterdam, https://hdl.handle.net/1871/12715 (last access: 30 January 2025), 1993.
Gotjé, W.: BIAXiaal 40 Het landschap in Zuidelijk Flevoland tussen 9500 en 4300 BP. Een landschapsreconstructie in het gebied Wet Bodembescherming, BIAX, 1997a.
Gotjé, W.: De vegetatie op en rond een Mesolithische en Vroeg Neolithische vindplaats, Een ecologisch onderzoek aan drie kernen op de vindplaats Hoge Vaart, BIAXiaal, 36, 1997b.
Gouw, M. J. P.: Alluvial architecture of the Holocene Rhine–Meuse delta (the Netherlands), Sedimentology, 55, 1487–1516, https://doi.org/10.1111/j.1365-3091.2008.00954.x, 2008.
Gouw, M. J. P. and Erkens, G.: Architecture of the Holocene Rhine-Meuse delta (the Netherlands) – A result of changing external controls, Neth. J. Geosci., 86, 23–54, https://doi.org/10.1017/S0016774600021302, 2007.
Griede, J. W.: Het ontstaan van Frieslands Noordhoek, PhD thesis, Universiteit Amsterdam, 186 pp., ISBN 978-90-6203-390-4, 1978.
Groenendijk, H., Mook-Kamps, E., and Elerie, J. N. H.: Op zoek naar de horizon: het landschap van Oost-Groningen en zijn bewoners tussen 8000 voor Chr. en 1000 na Chr., REGIO-PRojekt Uitgevers Groningen, ISBN 9050280838, 1997.
Hamburg, T. and Knippenberg, S.: Proefsleuven op drie locaties binnen het tracé van de Hanzelijn “Oude Land”, Archol, Leiden, 2006.
Hamburg, T., Müller, A., and Quadflieg, B.: Dronten Swifterbant N23 vindplaats 5 Opgraving (V1), Archol BV, ADC ArcheoProjecten, Haveka bv, Alblasserdam, https://doi.org/10.17026/dans-zeh-g9g8, 2012.
Heaton, T. J., Köhler, P., Butzin, M., Bard, E., Reimer, R. W., Austin, W. E. N., Ramsey, C. B., Grootes, P. M., Hughen, K. A., Kromer, B., Reimer, P. J., Adkins, J., Burke, A., Cook, M. S., Olsen, J., and Skinner, L. C.: Marine20 – The Marine Radiocarbon Age Calibration Curve (0–55,000 cal BP), Radiocarbon, 62, 779–820, https://doi.org/10.1017/RDC.2020.68, 2020.
Hijma, M. P.: From river valley to estuary: the early-mid Holocene transgression of the Rhine-Meuse valley, the Netherlands, Dissertation, Utrecht University, Royal Dutch Geographical Society, ISBN 978-90-6809-432-9, 2009.
Hijma, M. P. and Cohen, K. M.: Timing and magnitude of the sea-level jump preluding the 8200 yr event, Geology, 38, 275–278, https://doi.org/10.1130/G30439.1, 2010.
Hijma, M. P. and Cohen, K. M.: Holocene transgression of the Rhine river mouth area, The Netherlands/Southern North Sea: palaeogeography and sequence stratigraphy, Sedimentology, 58, 1453–1485, https://doi.org/10.1111/j.1365-3091.2010.01222.x, 2011.
Hijma, M. P. and Cohen, K. M.: Holocene sea-level database for the Rhine-Meuse Delta, the Netherlands: Implications for the pre-8.2 ka sea-level jump, Quaternary Sci. Rev., 214, 68–86, https://doi.org/10.1016/j.quascirev.2019.05.001, 2019.
Hijma, M. P., Cohen, K. M., Hoffmann, G., Spek, A. J. F. V. der, and Stouthamer, E.: From river valley to estuary: the evolution of the Rhine mouth in the early to middle Holocene (western Netherlands, Rhine-Meuse delta), Neth. J. Geosci., 88, 13–53, https://doi.org/10.1017/S0016774600000986, 2009.
Hijma, M. P., Engelhart, S. E., Törnqvist, T. E., Horton, B. P., Hu, P., and Hill, D. F.: A protocol for a geological sea-level database, in: Handbook of Sea-Level Research, John Wiley & Sons, Ltd, 536–553, https://doi.org/10.1002/9781118452547.ch34, 2015.
Hoek, W. Z.: Late-glacial and early Holocene climatic events and chronology of vegetation development in the Netherlands, Veg. Hist. Archaebot., 6, 197–213, https://doi.org/10.1007/BF01370442, 1997.
Hofstede, J., Berendsen, H., and Janssen, C.: Holocene palaeogeography and palaeoecology of the fluvial area near Maurik (Neder-Betuwe, the Netherlands), Geol. Mijnbouw, 68, 409–419, 1989.
Jelgersma, S.: Die Palynologische und C14-Untersuchung einiger Torfprofile aus dem NS-Profil Meedhuizen-Farmsum, Das Ems-Estuarium (Nordsee). Verh. K. Ned. Geol.-Mijnb. k. Gen. Geol. Ser, 19, 25–32, 1960.
Jelgersma, S.: Holocene sea-level changes in the Netherlands, PhD dissertation, Leiden University, Leiden, 1961.
Jelgersma, S., de Jong, S., Zagwijn, W., and van Regteren Altena, J.: The coastal dunes of the western Netherlands: geology, vegetational history and archeology, Mededelingen Rijks Geologische Dienst 21, 93–167, 1970.
Kasse, C. and Aalbersberg, G.: A complete Late Weichselian and Holocene record of aeolian coversands, drift sands and soils forced by climate change and human impact, Ossendrecht, the Netherlands, Neth. J. Geosci., 98, e4, https://doi.org/10.1017/njg.2019.3, 2019.
Khan, N. S., Horton, B. P., Engelhart, S., Rovere, A., Vacchi, M., Ashe, E. L., Törnqvist, T. E., Dutton, A., Hijma, M. P., and Shennan, I.: Inception of a global atlas of sea levels since the Last Glacial Maximum, Quaternary Sci. Rev., 220, 359–371, https://doi.org/10.1016/j.quascirev.2019.07.016, 2019.
Khan, N., Ashe, E., Kopp, R., and Horton, B.: HOLSEA Archive Your Data, https://www.holsea.org/archive-your-data, last access: 2 July 2024.
Kiden, P.: The Late Holocene evolution of the perimarine part of the River Scheldt, The Quaternary and Tertiary Geology of the Southern Bight, North Sea. Belgische Geologische Dienst, Brussel, 173–184, 1989.
Kiden, P.: Holocene relative sea-level change and crustal movement in the southwestern Netherlands, Mar. Geol., 124, 21–41, https://doi.org/10.1016/0025-3227(95)00030-3, 1995.
Kiden, P. and Vos, P. C.: Holocene relative sea-level change and land movements in the northern Netherlands – a first assessment, in: 3rd IGCP588-Conference “Preparing for Coastal Change” Conference Program – Book of Abstracts. Christian-Albrechts-Universität zu Kiel (Kiel), 2012.
Kiden, P., Denys, L., and Johnston, P.: Late Quaternary sea-level change and isostatic and tectonic land movements along the Belgian-Dutch North Sea coast: geological data and model results, J. Quaternary Sci., 17, 535–546, https://doi.org/10.1002/jqs.709, 2002.
Kiden, P., Makaske, B., and Van de Plassche, O.: Waarom verschillen de zeespiegelreconstructies voor Nederland?, Grondboor Hamer, 62, 54–61, 2008.
Kooi, H., Johnston, P., Lambeck, K., Smither, C., and Ronald Molendijk: Geological causes of recent (∼100 yr) vertical land movement in the Netherlands, Tectonophysics, 299, 297–316, https://doi.org/10.1016/S0040-1951(98)00209-1, 1998.
Kooistra, M. J., Kooistra, L. I., Van Rijn, P., and Sass-Klaassen, U.: Woodlands of the past – The excavation of wetland woods at Zwolle-Stadshagen (the Netherlands): Reconstruction of the wetland wood in its environmental context, Neth. J. Geosci., 85, 37–60, 2006.
Koster, K., Stafleu, J., and Cohen, K. M.: Generic 3D interpolation of Holocene base-level rise and provision of accommodation space, developed for the Netherlands coastal plain and infilled palaeovalleys, Basin Res., 29, 775–797, https://doi.org/10.1111/bre.12202, 2017.
Lambeck, K.: Late Devensian and Holocene shorelines of the British Isles and North Sea from models of glacio-hydro-isostatic rebound, J. Geol. Soc. London, 152, 437–448, https://doi.org/10.1144/gsjgs.152.3.0437, 1995.
Lohof, E. and Alders, P. G.: Hattemerbroek Bedrijventerrein Noord (2), DANS Data Station Archaeology [data set], V2, https://doi.org/10.17026/dans-zyt-zzer, 2008.
Lohof, E., Hamburg, T., and Flamman, J.: Steentijd opgespoord. Archeologisch onderzoek in het tracé van de Hanzelijn-Oude Land, Archol & ADC-Archeoprojecten, Leiden, Amersfoort (Archol report 138 & ADC report 2576), 2011.
Louwe Kooijmans, L.: The Rhine/Meuse Delta. Four studies on its prehistoric occupation and Holocene geology, Leiden University, Leiden, https://hdl.handle.net/1887/28137 (last access: 30 January 2025), 1972.
Makaske, B. and Maas, G. J.: Different hydrological controls causing variable rates of Holocene peat growth in a lowland valley system, north-eastern Netherlands, implications for valley peatland restoration, Holocene, 33, 960–974, https://doi.org/10.1177/09596836231169985, 2023.
Makaske, B., Smeerdijk, D. G. van, Mulder, J. R., and Spek, T.: De stijging van de waterspiegel nabij Almere in de periode 5300–2300 v. Chr, Alterra, Wageningen, 2002.
Makaske, B., Smeerdijk, D. G. V., Peeters, H., Mulder, J. R., and Spek, T.: Relative water-level rise in the Flevo lagoon (the Netherlands), 5300–2000 cal yr BC: an evaluation of new and existing basal peat time-depth data, Neth. J. Geosci., 82, 115–131, https://doi.org/10.1017/S0016774600020680, 2003.
Meijles, E. W., Kiden, P., Streurman, H.-J., Van der Plicht, J., Vos, P. C., Gehrels, W. R., and Kopp, R. E.: Holocene relative mean sea-level changes in the Wadden Sea area, northern Netherlands, J. Quaternary Sci., 33, 905–923, https://doi.org/10.1002/jqs.3068, 2018.
Morzadec-Kerfourn, M. T. and Delibrias, G.: Analyses polliniques et datations radiocarbone des sediments quaternaires preleves en Manche centrale et orientale, Memoir. Bur. Rech. Geol. Min., 79, 160–165, 1972.
NAM: Aanvraag Instemming Winningsplan Gaag-Monster, Nederlandse Aardolie Maatschappij B.V., Assen, the Netherlands, 2017.
NAM: Statusrapport 2020 en Prognose tot het jaar 2080, Nederlandse Aardolie Maatschappij B.V., Assen, the Netherlands, EP Document No.: EP201511213444, 2020.
Nicolay, J., Schepers, M., Postma, D., and Kaspers, A.: Firdgum: pioniers, boeren en terpbewoners, in: De geschiedenis van terpen-en wierdenland: Een verhaal in ontwikkeling, Vereniging voor Terpenonderzoek, 133–148, ISBN 978-90-829691-0-8, 2018.
Nieuwhof, A. and Vos, P. C.: Landschap en bewoningsgeschiedenis, in: De wierde Wierum (provincie Groningen). Een archeologisch steilkantonderzoek (= Groningen Archaeological Studies 3), edited by: Nieuwhof, A., Barkhuis Publishing and Groningen University Library (Groningen), ISBN 9077922172, 2006.
Osinga, M. and Hekman, J. J.: Archeologisch onderzoek Hanzelijn deelgebieden XIV en XV, Grontmij, Assen, 2011.
Peeters, J., Busschers, F. S., Stouthamer, E., Bosch, J. H. A., Van den Berg, M. W., Wallinga, J., Versendaal, A. J., Bunnik, F. P. M., and Middelkoop, H.: Sedimentary architecture and chronostratigraphy of a late Quaternary incised-valley fill: A case study of the late Middle and Late Pleistocene Rhine system in the Netherlands, Quaternary Sci. Rev., 131, 211–236, https://doi.org/10.1016/j.quascirev.2015.10.015, 2016.
Peeters, J. H. M.: Hoge Vaart-A27 in context: towards a model of mesolithic – neolithic land use dynamics as a framework for archaeological heritage management, PhD thesis, Amsersfoort Rijksdienst voor Archeologie, Cultuurlandschap en Monumenten, https://hdl.handle.net/11245/1.262008 (last access: 30 January 2025), 2007.
Pierik, H. J. and Cohen, K. M.: The use of geological, geomorphological and soil mapping products in palaeolandscape reconstructions for the Netherlands, Neth. J. Geosci., 99, e9, https://doi.org/10.1017/njg.2020.8, 2020.
Pierik, H. J., Cohen, K. M., Vos, P. C., Van der Spek, A. J. F., and Stouthamer, E.: Late Holocene coastal-plain evolution of the Netherlands: the role of natural preconditions in human-induced sea ingressions, P. Geologist. Assoc., 128, 180–197, https://doi.org/10.1016/j.pgeola.2016.12.002, 2017.
Pierik, H. J., Moree, J. I. M., van der Werf, K. M., Roelofs, L., Albernaz, M. B., Wilbers, A., van der Valk, B., van Dinter, M., Hoek, W. Z., de Haas, T., and Kleinhans, M. G.: Vegetation and peat accumulation steer Holocene tidal–fluvial basin filling and overbank sedimentation along the Old Rhine River, the Netherlands, Sedimentology, 70, 179–213, https://doi.org/10.1111/sed.13038, 2023.
Pons, L. J. and Wiggers, A. J.: The holocene wordingsgeschiedenis van Noord-Holland en het Zuiderzeegebied = The holocene genesis of the province of North-Holland and the Zuyder Sea region, STIBOKA, https://edepot.wur.nl/251518 (last access: 30 January 2025), 1960.
Quik, C., Van der Velde, Y., Harkema, T., Van der Plicht, H., Quik, J., Van Beek, R., and Wallinga, J.: Using legacy data to reconstruct the past? Rescue, rigour and reuse in peatland geochronology, Earth Surf. Proc. Land., 46, 2607–2631, https://doi.org/10.1002/esp.5196, 2021.
Quik, C., Palstra, S. W. L., Van Beek, R., Van der Velde, Y., Candel, J. H. J., Van der Linden, M., Kubiak-Martens, L., Swindles, G. T., Makaske, B., and Wallinga, J.: Dating basal peat: The geochronology of peat initiation revisited, Quat. Geochronol., 72, 101278, https://doi.org/10.1016/j.quageo.2022.101278, 2022.
Reimer, P. J., Austin, W. E. N., Bard, E., Bayliss, A., Blackwell, P. G., Ramsey, C. B., Butzin, M., Cheng, H., Edwards, R. L., Friedrich, M., Grootes, P. M., Guilderson, T. P., Hajdas, I., Heaton, T. J., Hogg, A. G., Hughen, K. A., Kromer, B., Manning, S. W., Muscheler, R., Palmer, J. G., Pearson, C., Plicht, J. van der, Reimer, R. W., Richards, D. A., Scott, E. M., Southon, J. R., Turney, C. S. M., Wacker, L., Adolphi, F., Büntgen, U., Capano, M., Fahrni, S. M., Fogtmann-Schulz, A., Friedrich, R., Köhler, P., Kudsk, S., Miyake, F., Olsen, J., Reinig, F., Sakamoto, M., Sookdeo, A., and Talamo, S.: The IntCal20 Northern Hemisphere Radiocarbon Age Calibration Curve (0–55 cal kBP), Radiocarbon, 62, 725–757, https://doi.org/10.1017/RDC.2020.41, 2020.
Schrijer, E., Lohof, E., and Waldus, W. B.: Tzummarum, rotonde (gem. Franekeradeel). Een archeologische opgraving en een begeleiding, ADC ArcheoProjecten, Amersfoort, ISBN 90-5874-62-24, 2006.
Shennan, I.: Interpretation of Flandrian sea-level data from the Fenland, England, Proc. Geologist. Assoc., 93, 53–63, https://doi.org/10.1016/S0016-7878(82)80032-1, 1982.
Shennan, I. and Horton, B.: Holocene land- and sea-level changes in Great Britain, J. Quaternary Sci., 17, 511–526, https://doi.org/10.1002/jqs.710, 2002.
Shennan, I., Lambeck, K., Flather, R., Horton, B., McArthur, J., Innes, J., Lloyd, J., Rutherford, M., and Wingfield, R.: Modelling western North Sea palaeogeographies and tidal changes during the Holocene, Geol. Soc. Spec. Publ., 166, 299–319, https://doi.org/10.1144/GSL.SP.2000.166.01.15, 2000.
Simon, K. M. and Riva, R. E. M.: Uncertainty Estimation in Regional Models of Long-Term GIA Uplift and Sea Level Change: An Overview, J. Geophys. Res.-Sol. Ea., 125, e2019JB018983, https://doi.org/10.1029/2019JB018983, 2020.
Slupik, A. A., Wesselingh, F. P., Mayhew, D. F., Janse, A. C., Dieleman, F. E., Strydonck, M. van, Kiden, P., Burger, A. W., and Reumer, J. W. F.: The role of a proto-Schelde River in the genesis of the southwestern Netherlands, inferred from the Quaternary successions and fossils in Moriaanshoofd Borehole (Zeeland, the Netherlands), Neth. J. Geosci., 92, 69–86, https://doi.org/10.1017/S0016774600000299, 2013.
Spek, T., Bisdom, E. B. A., and van Smeerdijk, D. G.: Verdronken dekzandgronden in Zuidelijk Flevoland (archeologische opgraving “A27-Hoge Vaart”), een interdisciplinaire studie naar de veranderingen van bodem en landschap in het Mesolithicum en Vroeg-Neolithicum, Staring Centrum, Netherlands, 1997.
Stafleu, J., Maljers, D., Busschers, F., Gunnink, J., Schokker, J., Dambrink, R. M., Hummelman, H. J., and Schijf, M. L.: GeoTop modellering, TNO, 2012.
Steffelbauer, D. B., Riva, R. E. M., Timmermans, J. S., Kwakkel, J. H., and Bakker, M.: Evidence of regional sea-level rise acceleration for the North Sea, Environ. Res. Lett., 17, 074002, https://doi.org/10.1088/1748-9326/ac753a, 2022.
Stouthamer, E. and Berendsen, H. J. A.: Factors Controlling the Holocene Avulsion History of the Rhine-Meuse Delta (the Netherlands), J. Sediment. Res., 70, 1051–1064, https://doi.org/10.1306/033000701051, 2000.
Teunissen, D.: De bewoningsgeschiedenis van Nijmegen en omgeving, haar relatie tot de landschapsbouw en haar weerspiegeling in palynologische gegevens, Mededelingen van de Afdeling Biogeologie van de Sectie Biologie van de Katholieke Universiteit van Nijmegen, 108 pp., 1988.
Teunissen, D.: Palynologisch onderzoek in het oostelijk rivierengebied: een overzicht, Mededelingen van de Afdeling Biogeologie van de Sectie Biologie van de Katholieke Universiteit van Nijmegen 16, 163 pp., 1990.
Törnqvist, T., Weerts, H. J. T., and Berendsen, H.: Definition of two new members in the upper Kreftenheye and Twente Formations (Quaternary, the Netherlands): a final solution to persistent confusion?, Geol. Mijnbouw, 72, 251–264, 1994.
Törnqvist, T. E.: Holocene alternation of meandering and anastomosing fluvial systems in the Rhine-Meuse delta (central Netherlands) controlled by sea-level rise and subsoil erodibility, J. Sediment. Res., 63, 683–693, 1993.
Törnqvist, T. E., Van Ree, M. H. M., Van 'T Veer, R., and Van Geel, B.: Improving Methodology for High-Resolution Reconstruction of Sea-Level Rise and Neotectonics by Paleoecological Analysis and AMS 14C Dating of Basal Peats, Quaternary Res., 49, 72–85, https://doi.org/10.1006/qres.1997.1938, 1998.
Törnqvist, T. E., González, J. L., Newsom, L. A., Van der Borg, K., De Jong, A. F. M., and Kurnik, C. W.: Deciphering Holocene sea-level history on the U. S. Gulf Coast: A high-resolution record from the Mississippi Delta, GSA Bull., 116, 1026–1039, https://doi.org/10.1130/B2525478.1, 2004.
Uehara, K., Scourse, J. D., Horsburgh, K. J., Lambeck, K., and Purcell, A. P.: Tidal evolution of the northwest European shelf seas from the Last Glacial Maximum to the present, J. Geophys. Res.-Oceans, 111, https://doi.org/10.1029/2006JC003531, 2006.
Van Asselen, S.: Peat compaction in deltas: implications for Holocene delta evolution, Dissertation, Koninklijk Nederlands Aardrijkskundig Genootschap, ISBN 978-90-6809-438-1, 2010.
Van Asselen, S.: The contribution of peat compaction to total basin subsidence: implications for the provision of accommodation space in organic-rich deltas: The contribution of peat compaction to basin subsidence, Basin Res., 23, 239–255, https://doi.org/10.1111/j.1365-2117.2010.00482.x, 2011.
Van Asselen, S., Stouthamer, E., and Van Asch, Th. W. J.: Effects of peat compaction on delta evolution: A review on processes, responses, measuring and modeling, Earth-Sci. Rev., 92, 35–51, https://doi.org/10.1016/j.earscirev.2008.11.001, 2009.
Van Asselen, S., Cohen, K. M., and Stouthamer, E.: The impact of avulsion on groundwater level and peat formation in delta floodbasins during the middle-Holocene transgression in the Rhine-Meuse delta, the Netherlands, Holocene, 27, 1694–1706, https://doi.org/10.1177/0959683617702224, 2017.
Van de Meene, J. W.: The shoreface-connected ridges along the central Dutch coast, Utrecht, Koninklijk Nederlands Aardrijkskundig Genootschap, ISBN 9062661122, 1994.
Van de Plassche, O.: Compaction and Other Sources of Error in Obtaining Sea-Level Data: Some Results and Consequences, E&G Quaternary Sci. J., 30, 171–182, https://doi.org/10.3285/eg.30.1.14, 1980.
Van de Plassche, O.: Sea-level change and water-level movements in the Netherlands during the Holocene, Mededelingen Rijks Geologische Dienst, 36, 1–93, 1982.
Van de Plassche, O.: Sea-level research: a manual for the collection and evaluation of data, Geo Books, Norwich, 1986.
Van de Plassche, O.: Evolution of the intra-coastal tidal range in the Rhine-Meuse delta and Flevo Lagoon, 5700–3000 yrs cal B. C., Mar. Geol., 124, 113–128, https://doi.org/10.1016/0025-3227(95)00035-W, 1995a.
Van de Plassche, O.: Periodic clay deposition in a fringing peat swamp in the lower Rhine-Meuse river area, 5400–3400 cal BC, J. Coastal Res., 95–102, 1995b.
Van de Plassche, O., Bohncke, S. J. P., Makaske, B., and Van der Plicht, J.: Water-level changes in the Flevo area, central Netherlands (5300–1500 BC): implications for relative mean sea-level rise in the Western Netherlands, Quatern. Int., 133–134, 77–93, https://doi.org/10.1016/j.quaint.2004.10.009, 2005.
Van de Plassche, O., Makaske, B., Hoek, W. Z., Konert, M., and Van Der Plicht, J.: Mid-Holocene water-level changes in the lower Rhine-Meuse delta (western Netherlands): implications for the reconstruction of relative mean sea-level rise, palaeoriver-gradients and coastal evolution, Neth. J. Geosci., 89, 3–20, https://doi.org/10.1017/S0016774600000780, 2010.
Van den Berg, M. and Beets, D.: Saalian glacial deposits and morphology in the Netherlands, Tills and Glaciotectonics. Balkema, Rotterdam, 235–251, 1987.
Van den Biggelaar, D. F. A. M., Kluiving, S. J., Bohncke, S. J. P., Van Balen, R. T., Kasse, C., Prins, M. A., and Kolen, J.: Landscape potential for the adoption of crop cultivation: Role of local soil properties and groundwater table rise during 6000–5400 BP in Flevoland (central Netherlands), Quatern. Int., 367, 77–95, https://doi.org/10.1016/j.quaint.2014.09.063, 2015.
Van den Brenk, S., Huisman, H., Willemse, N. W., Smit, B., and Van Os, B. J. H.: Magnetometer mapping of drowned prehistoric landscapes for Archaeological Heritage Management in the Netherlands, Archaeol. Prospect., 1–16, https://doi.org/10.1002/arp.1925, 2023.
Van der Linden, M.: Palynologisch onderzoek aan een veen- en kleipakket uit het Laat-Mesolithicum bij Almere-De Vaart, BIAXiaal 493, BIAX, Zaandam, 2010a.
Van der Linden, M.: Verlaten donken onder het veen? Paleoecologisch onderzoek aan een veenpakket bij Dinteloord, BIAXiaal 501, BIAX, Zaandam, 2010b.
Van der Meulen, M. J., Doornenbal, J. C., Gunnink, J. L., Stafleu, J., Schokker, J., Vernes, R. W., Geer, F. C. van, Gessel, S. F. van, Heteren, S. van, Leeuwen, R. J. W. van, Bakker, M. a. J., Bogaard, P. J. F., Busschers, F. S., Griffioen, J., Gruijters, S. H. L. L., Kiden, P., Schroot, B. M., Simmelink, H. J., Berkel, W. O. van, Krogt, R. A. A. van der, Westerhoff, W. E., and Daalen, T. M. van: 3D geology in a 2D country: perspectives for geological surveying in the Netherlands, Neth. J. Geosci., 92, 217–241, https://doi.org/10.1017/S0016774600000184, 2013.
Van der Molen, J. and De Swart, H. E.: Holocene tidal conditions and tide-induced sand transport in the southern North Sea, J. Geophys. Res.-Oceans, 106, 9339–9362, https://doi.org/10.1029/2000JC000488, 2001.
Van der Spek, A. J. F.: Large-scale evolution of Holocene tidal basins in the Netherlands, PhD thesis, Universiteit Utrecht Faculteit Aardwetenschappen, ISBN 90-393-0664-8, 1994.
Van der Woude, J. D.: Holocene paleoenvironmental evolution of a perimarine fluviatile area, PhD dissertation, Vrije Universiteit Amsterdam, 1981.
Van der Woude, J. D.: Holocene paleoenvironmental evolution of a perimarine fluviatile area: geology and paleobotany of the area surrounding the archeological excavation at the Hazendonk river dune (western Netherlands), Leiden U. P. Modderman Stichting, Leiden, 124 pp., ISBN 90 0407 166 0, 1983.
Van Dijk, G. J.: Holocene water level development in the Netherlands' river area, implications for sea-level reconstruction, Geol. Mijnbouw, 70, 311–326, 1991.
Van Dijk, G. J., Berendsen, H. J. A., and Roeleveld, W.: Holocene water level development in the Netherlands' river area, implications for sea-level reconstruction, Geol. Mijnbouw, 70, 311–326, 1991.
Van Dinter, M.: Hoofdstuk 10 Fysische Geografie, in: De opgraving en lichting van de 15e eeuwse IJsselkogge, ADC monografie 24, edited by: Waldus, W. B., ADC ArcheoProjecten, 119–133, ISBN 978-94-6064-413-9, 2018.
Van Dinter, M., Cohen, K. M., Hoek, W. Z., Stouthamer, E., Jansma, E., and Middelkoop, H.: Late Holocene lowland fluvial archives and geoarchaeology: Utrecht's case study of Rhine river abandonment under Roman and Medieval settlement, Quaternary Sci. Rev., 166, 227–265, https://doi.org/10.1016/j.quascirev.2016.12.003, 2017.
Van Heteren, S., Van der Spek, A., and De Groot, T.: Architecture of a preserved Holocene tidal complex offshore the Rhine-Meuse river mouth, the Netherlands, Netherlands Institute of Applied Geoscience TNO – National Geological Survey, TNO report NITG 01-027-A, 2002.
Van Lil, R.: Aanleg N23 tussen Lelystad en Dronten, ADC ArcheoProjecten, ISBN 978-90-6836-567-2, 2008.
Van Smeerdijk, D. G.: Pollenonderzoek aan materiaal uit de top van een Pleistocene dekzandrug in Almere Hout ten behoeve van de Cursus Archeologie, BIAXiaal report 197, BIAX, Zaandam, 2003.
Van Smeerdijk, D. G.: Palynologisch onderzoek en 14C AMS datering van een venige laag uit de locatie Ripperda-complex in Haarlem, BIAXiaal report 204, BIAX, Zaandam, 2004.
Van Smeerdijk, D. G.: Palynologisch onderzoek en datering van de overgang van het pleistocene zand naar het afdekkende veen bij de Noorderplassen-West in Almere, BIAXiaal 283, BIAX, Zaandam, 2006.
Van Straaten, L. M. J. U.: Radiocarbon datings and changes of sea level at Velzen (Netherlands), Geol. Mijnbouw (N W. SE R.), 16, 247–253, 1954.
Van Straaten, L. M. J. U. and De Jong, J.: The excavation at Velsen. A Detailed Study of Upper-Pleistocene and Holocene Stratigraphy, Verh. Kon. Ned. Geol.-Mijnbouwk. Gen., Geol. Ser., Deel XVII, Tweede Stuk, 93–99, 1957.
Van Veen, J.: Eb-en vloedschaar systemen in de Nederlandse getijwateren, Tijdschrift Koninklijk Nederlands Aardrijkskundig Genootschap, 67, 303–325, 1950.
Van Veen, J., Van der Spek, A. J. F., Stive, M. J. F., and Zitman, T.: Ebb and Flood Channel Systems in the Netherlands Tidal Waters, J. Coastal Res., 21, 1107–1120, https://doi.org/10.2112/04-0394.1, 2005.
Varwijk, T. and de Langen, G.: Terpzoolopgraving Wommels-Stapert 2014 (GIA 138). Terug na 20 jaar: Nieuw archeologisch onderzoek aan de commercieel afgegraven terp Stapert bij Wommels in het hart van Westergo (Friesland), Groninger Instituut voor Archeologie, Rijksuniversiteit Groningen, 2018.
Veldkamp, M. A.: Pollenanalytische en C14-dateringen van de boring Maassluis 37B/226. Palaeobotanie Kenozoïcum 1255A, Rijks Geologische Dienst, Haarlem, 1996.
Verbraeck, A.: Toelichtingen bij de Geologische kaart van Nederland 1: 50.000, Blad Tiel West (39 W) en Blad Tiel Oost (39 O). Rijks Geologische Dienst (Haarlem), 1984.
Verbruggen, M.: Geoarchaeological prospection of the Rommertsdonk, Analecta Praehistorica Leidensia 25: The end of our third decade: Papers written on the occasion of the 30th anniversary of the Institutte of prehistory, vol. I, 25, 119–128, https://hdl.handle.net/1887/28096 (last access: 31 January 2025), 1992.
Vermeersen, B. L. A., Slangen, A. B. A., Gerkema, T., Baart, F., Cohen, K. M., Dangendorf, S., Duran-Matute, M., Frederikse, T., Grinsted, A., Hijma, M. P., Jevrejeva, S., Kiden, P., Kleinherenbrink, M., Meijles, E. W., Palmer, M. D., Rietbroek, R., Riva, R. E. M., Schulz, E., Slobbe, D. C., Simpson, M. J. R., Sterlini, P., Stocchi, P., Van de Wal, R. S. W., and Van der Wegen, M.: Sea-level change in the Dutch Wadden Sea, Neth. J. Geosci., 97, 79–127, https://doi.org/10.1017/njg.2018.7, 2018.
Vink, A., Steffen, H., Reinhardt, L., and Kaufmann, G.: Holocene relative sea-level change, isostatic subsidence and the radial viscosity structure of the mantle of northwest Europe (Belgium, the Netherlands, Germany, southern North Sea), Quaternary Sci. Rev., 26, 3249–3275, https://doi.org/10.1016/j.quascirev.2007.07.014, 2007.
Vis, G.-J., Cohen, K. M., Westerhoff, W. E., Veen, J. H. T., Hijma, M. P., van der Spek, A. J. F., and Vos, P. C.: Paleogeography, in: Handbook of Sea-Level Research, John Wiley & Sons, Ltd, 514–535, https://doi.org/10.1002/9781118452547.ch33, 2015.
Vogel, J. C. and Waterbolk, H. T.: Groningen Radiocarbon Dates IV, Radiocarbon, 5, 163–202, https://doi.org/10.1017/S0033822200036857, 1963.
Vos, P. C.: Toelichting kaartblad 43/49 West en 49 Oost: concept toelichting 43/49 West, Holocene deel, Rijks Geologische Dienst, Distrikt Noord, Haarlem, 41 pp., 1992.
Vos, P. C.: The Subatlantic evolution of the coastal area around the Wijnaldum-Tjitsma terp. With a contribution by B. A. M. Baardman. in: The Excavations at Wijnaldum. Reports on Frisia in Roman and Medieval times, vol. I, edited by: Besteman, J. C., Bos, J. M., Gerrets, D. A., Heidinga, H. A., and De Koning, J., Balkema (Rotterdam/Brookfield), 33–72, ISBN 978-9054104889, 1999.
Vos, P. C.: Geologisch en paleolandschappelijk onderzoek Yangtzehaven (Maasvlakte, Rotterdam). Deltares report 1206788-000-BGS-000187, Deltares, 2013.
Vos, P. C.: Op veilige afstand van de Marne: geologische en paleolandschappelijke waarnemingen in Achlum. in: Graven aan de voet van de Achlumer dorpsterp. Archeologische sporen rondom een terpnederzetting (= Jaarverslagen van de Vereniging voor Terpenonderzoek 97), edited by: Nicolay, J. A. W. and de Langen, G., Vereniging voor Terpenonderzoek, Groningen, 31–47, ISBN 978-90-811714-7-2, 2015a.
Vos, P. C.: Origin of the Dutch coastal landscape: Long-term landscape evolution of the Netherlands during the Holocene, described and visualized in national, regional and local palaeogeographical map series, Barkhuis, 373 pp., ISBN 978-94-92444-42-4, 2015b.
Vos, P. C. and Cohen, K. M.: Landscape genesis and palaeogeography. in: Interdisciplinary Archaeological Research Programme Maasvlakte 2, edited by: Moree, J. M., Sier, M. M., vol. 566, BOOR Rotterdam, 2014.
Vos, P. C. and Gerrets, D. A.: Archaeology: a major tool in the reconstruction of the coastal evolution of Westergo (northern Netherlands), Quatern. Int., 133, 61–75, 2005.
Vos, P. C. and Nieuwhof, A.: Late-Holocene sea-level reconstruction (1200 BC–AD 100) in the Westergo terp region of the northern Netherlands, Neth. J. Geosci., 100, e3, https://doi.org/10.1017/njg.2021.1, 2021.
Vos, P. C. and Van Zijverden, W. K.: Landschappelijke ligging, in: ADC Monografie. Een terp op de schop, edited by: Dijkstra, J. and Nicolay, J. A. W., Archeologisch onderzoek op het Oldehoofsterkerkhof te Leeuwarden, vol. 3, 25–42, 2008.
Vos, P. C. and Varwijk, T.: Paleolandschappelijke opname Saksenoord (GIA 133), DANS Data Station Archaeology, 2017.
Vos, P. C. and Waldus, W. B.: Landschap en bewoning: over terpen, kwelderwallen en de bedijkingsgeschiedenis, Middeleeuwse bewoningssporen bij Beetgumermolen (= ADC-rapport 3213). ADC-ArcheoProjecten (Amersfoort), 62–65, 2012.
Vos, P. C., Meijer, T., and Van Os, B.: Bodem en geologie. Paleolandschappelijk onderzoek op en rond De Bloemert, in: Opgravingen bij Midlaren: 5000 jaar wonen tussen Hondsrug en Hunzedal (Deel I), edited by: Nicolay, J. A. W., Barkhuis Publishing and Groningen University Library, Groningen, 17–39, ISBN 9789077922439, 2008.
Vos, P. C., Bazelmans, J., Weerts, H. J. T., and Van de Meulen, M. J.: Atlas Van Nederland in Het Holoceen, RCE, TNO en Deltares, 94 pp., ISBN 9789-03-513-639-7, 2011.
Vos, P. C., Bunnik, F. P. M., Cohen, K. M., and Cremer, H.: A staged geogenetic approach to underwater archaeological prospection in the Port of Rotterdam (Yangtzehaven, Maasvlakte, The Netherlands): A geological and palaeoenvironmental case study for local mapping of Mesolithic lowland landscapes, Quatern. Int., 367, 4–31, https://doi.org/10.1016/j.quaint.2014.11.056, 2015.
Vos, P. C., Van der Meulen, M., Weerts, H., and Bazelmans, J.: Atlas of the Holocene Netherlands, landscape and habitation since the last ice age, Amsterdam University Press, Amsterdam, 96 pp., ISBN 978-94-6372-443-2, 2020.
Ward, I., Larcombe, P., and Lillie, M.: The dating of Doggerland–post-glacial geochronology of the southern North Sea, Environ. Archaeol., 11, 207–218, 2006.
Ward, S. L., Neill, S. P., Scourse, J. D., Bradley, S. L., and Uehara, K.: Sensitivity of palaeotidal models of the northwest European shelf seas to glacial isostatic adjustment since the Last Glacial Maximum, Quaternary Sci. Rev., 151, 198–211, https://doi.org/10.1016/j.quascirev.2016.08.034, 2016.
Weerts, H. and Berendsen, H.: Late Weichselian and Holocene fluvial palaeogeography of the southern Rhine-Meuse delta (the Netherlands), Geol. Mijnbouw.-N. J. G., 74, 199–212, 1995.
Wiggers, A. J.: De wording van het Noordoostpoldergebied: een onderzoek naar de physisch-geografische ontwikkeling van een sedimentair gebied, Tjeenk Willink, PhD thesis, 1955.
Woldring, H., de Boer, P., Gillavry, J. N. B.-M., and Cappers, R. T. J.: De palaeoecologie van Duurswold (Gr.): vroeg-Holocene landschapsontwikkeling, Paleo-aktueel, 36–44, 2005.
Wolfert, H. P. and Maas, G. J.: Downstream changes of meandering styles in the lower reaches of the River Vecht, the Netherlands, Neth. J. Geosci., 86, 257–271, https://doi.org/10.1017/S0016774600077842, 2007.
Zagwijn, W.: Vegetation, climate and radiocarbon datings in the Netherlands. Part I: Eemian and Early Weichselian, Meded. Geol. Sticht., NS, 14, 15, 1961.
Zagwijn, W. H.: The pleistocene of the Netherlands with special reference to glaciation and terrace formation, Quaternary Sci. Rev., 5, 341–345, https://doi.org/10.1016/0277-3791(86)90195-2, 1986.
Zagwijn, W. H. and De Jong, J.: RGD Pal. Lab. Rap. 814 and 814a – Pollenanalytisch onderzoek en C14-ouderdomsbepalingen + Aanvullende C14-ouderdomsbepaling aan boring Zwaagdijk Oost 19F/70, Rijks Geologische Dienst, Haarlem, 1982.
Zonneveld, I. S.: De Brabantse Biesbosch: een studie van bodem en vegetatie van een zoetwatergetijdendelta, PhD thesis, Wageningen University and Research, https://doi.org/10.18174/203159, 1960.