the Creative Commons Attribution 4.0 License.
the Creative Commons Attribution 4.0 License.
 | 26 Sep 2025
CHN-CH4: a gridded (0.1° × 0.1°) anthropogenic methane emission inventory of China from 1990 to 2020
Fengxiang Guo
Fan Dai
Peng Gong
Yuyu Zhou
China is the largest emitter of global methane emissions, contributing about 10 % to anthropogenic climate change based on existing methane inventories. However, significant uncertainties in these statistics limit the accuracy at both national and sub-national scales. The lack of continuous gridded emissions inventories also constrains the inverse analysis of atmospheric observations. To address these, we present CHN-CH4, a spatially aggregated 0.1°×0.1° anthropogenic methane emission inventory for mainland China from 1990 to 2020 annually. CHN-CH4 offers the country with new temporal coverage and details, by means of national statistical yearbooks and remote sensing products. Over the three decades, mainland China emitted 37.3 [28.1-46.4 Tg of methane annually, with the highest emission occurred in the last decade. But this decade also marked the beginning of a decreasing trend, from 45.0 [32.8–56.5] Tg in 2010 to 43.4 [31.6–53.4] Tg in 2020. As important priors, CHN-CH4 enables robust comparisons between estimated emissions and atmospheric observations, thereby improving the accuracy of inverse modelling, which is crucial for effective tracking of methane emissions. By providing a reliable and detailed emissions inventory, CHN-CH4 would be a valuable tool in accelerating the global effort to achieve equitable methane emission reduction goals, as well as supporting China's climate policy. The dataset of methane emissions in China and its eight major sectors is publicly available at https://doi.org/10.5281/zenodo.15107383 (Guo et al., 2025).
- Article
(12280 KB) - Full-text XML
-
Supplement
(769 KB) - BibTeX
- EndNote


Methane is a potent greenhouse gas, possessing a global warming potential 28 times greater than carbon dioxide over a 100-year period (IPCC, 2013; Peng et al., 2016; Qu et al., 2021). Since 1750, anthropogenic methane emissions have contributed approximately 0.97 W m−2 to radiative forcing, accounting for 32 % of the total radiative forcing from long-lived greenhouse gases and about 20 % of anthropogenic climate change (IPCC, 2013; Saunois et al., 2020). China, as the largest global emitter, contributed an estimated 16 % of global emissions in the 2000s, primarily driven by coal mining, rice cultivation, and livestock production (Kirschke et al., 2013; IEA, 2019). Aligned with the Paris Agreement goals and Global Methane Pledge (European Commission and United States of America, 2021), China has set forth policies to significantly reduce methane emission in its 14th Five-Year-Plan (State Council of China, 2021) and the recent released National Methane Action Plan (Ministry of Ecology and Environment of China, 2023). The rapid and sustained reduction of methane emissions is crucial for achieving collective climate mitigation goals and carbon neutrality, and it offers significant co-benefits for the economy and public health (IPCC, 2006, 2019; Maasakkers et al., 2023; Saunois et al., 2025). Methane emission inventories are essential for identifying priority regions and sectors, thereby supporting the development of effective reduction strategies both regionally and globally.
Inverse analysis of atmospheric observations can enhance the robustness of methane emission estimates, but it requires a gridded emissions inventory as prior knowledge (IPCC, 2019; Maasakkers et al., 2023; Sheng et al., 2019). This inventory serves as the basis for interpreting inverse results at specific locations and across various sectors. However, the emissions inventories submitted by each nation to the United Nations Framework Convention on Climate Change (UNFCCC, 2020) often lack accurate spatial information. This lack of detailed spatial data creates knowledge gaps in regulating methane emission sources, formulating reduction policies, and fostering international cooperation. Meanwhile, the quality of the inventory significantly affects the final methane estimates (Maasakkers et al., 2023). For China, most of previous studies related to inverse modelling have used the global gridded inventory from the Emissions Database for Global Atmospheric Research (EDGAR) (Lin et al., 2021; Chen et al., 2022; Shen et al., 2023). While EDGAR enables spatial comparisons with observations, aggregated national inventories exhibit inconsistent trends and estimates at the local scale (Sheng et al., 2017; Behrendt et al., 2025). A 30 %–40 % overestimation for the period 1980–2008 was identified by the work from Peng et al. (2016). Lin et al. (2021) systematically compared anthropogenic methane emissions based on bottom-up inventories. They found an over 11 Tg yr−1 overestimation of EDGAR for period 1990–2010 in China, by comparison to PKU-CH4, another widely applied methane emission inventory. Another weakness in the literature is the lack of downloadable continuous emission inventories at the grid level, limited by proxy data collection, particularly after 1990 (Zhang and Chen, 2014; Peng et al., 2016; Lin et al., 2021; Gong and Shi, 2021), which is the baseline year used by the UNFCCC and the Kyoto Protocol. Releasing national gridded methane emission inventories for the period afte 1990 is necessary to maintain consistency and comparability with international emission reduction commitments. The recent development of satellite remote sensing technology makes this possible, as it provides high-resolution proxy data for estimating methane emissions over the years.
In this study, we present a spatially aggregated 0.1°×0.1° anthropogenic methane emission inventory for mainland China (CHN-CH4) annually, utilizing satellite products, national statistical databases and existing other proxy datasets. This inventory allows for the evaluation of annual trends over the period 1990–2020 across three dominant sectors: agriculture, energy, and waste. It further delineates emissions into eight major source sectors: (1) rice cultivation, (2) livestock, (3) biomass and biofuel burning, (4) coal exploitation, (5) oil and natural gas (NG) systems, (6) fossil fuel consumption, (7) landfills, and (8) wastewater. To ensure maximum comparability, we incorporated recent proxy data, preferably long-term remote sensing data. We also considered emission factors based on measured statistical data specifically tailored for mainland China. Note that this inventory includes only annual anthropogenic methane emissions and excludes the emissions from natural sources.
The methane emissions from three dominant sectors – agriculture (including livestock, rice cultivation, biomass and biofuel burning), energy (including coal exploitation, oil and NG systems, and fossil fuel combustion), and waste management (including landfills and wastewater management) – are considered in this dataset. Figure 1 illustrates the key steps for estimating the gridded methane emissions based on satellite observation products, multiple statistical yearbooks, and existing emissions datasets from other sources.
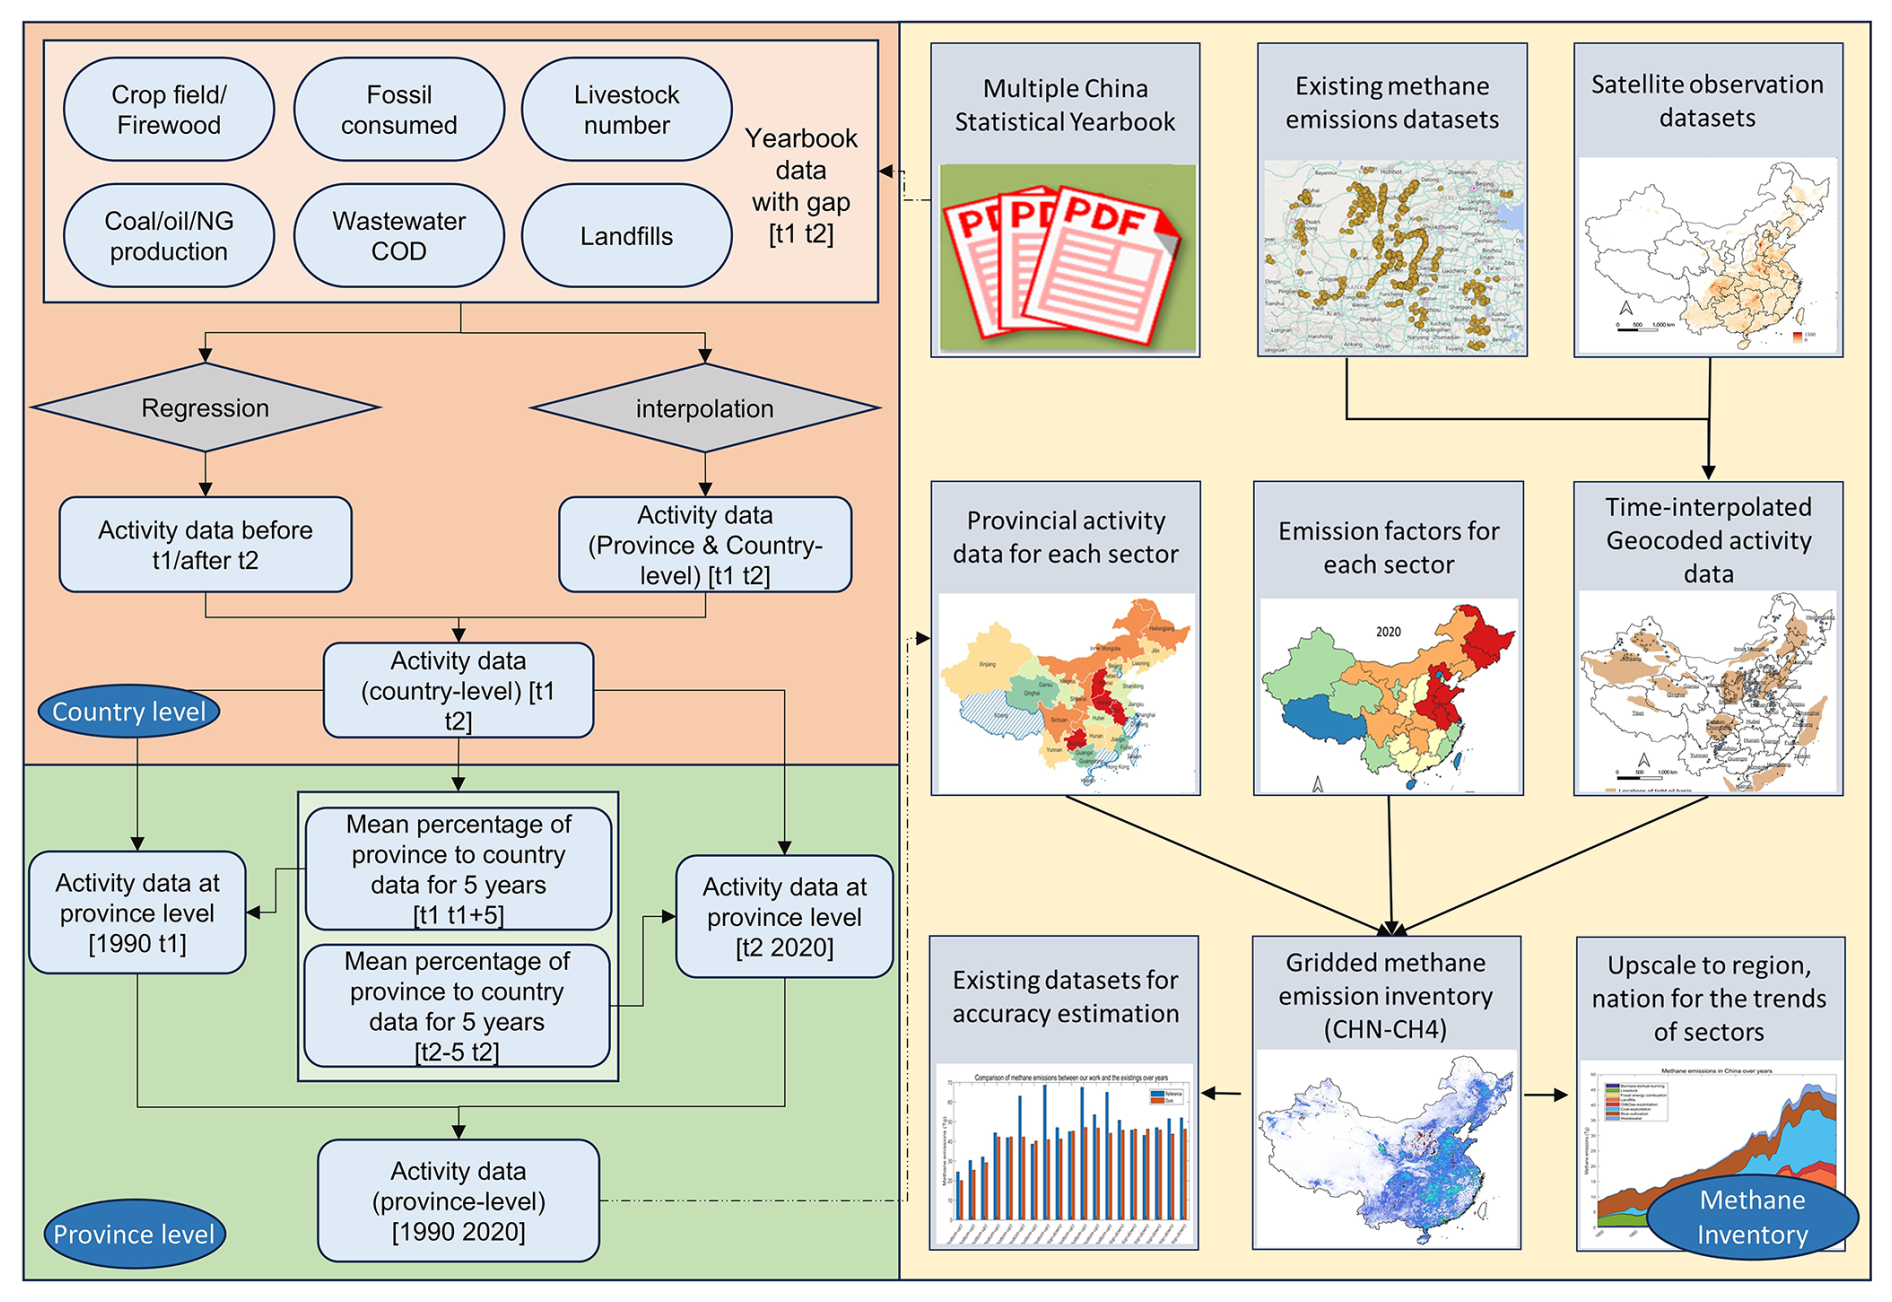
Figure 1Flowchart for mapping anthropogenic methane emissions in China during period 1990–2020. The left subfigure displayed how to handle with the missing data from the statistical yearbooks at nation and province level. t1 and t2 represents the earliest and most recent available year that we can get the data from statistical yearbooks. The right subfigure displayed the steps for the methane estimates and comparison with existing inventories.
The methods outlined in the 2006 IPCC Guidelines for National Greenhouse Gas (IPCC, 2006) and the 2019 Refinement to the 2006 IPCC Guidelines for National Greenhouse Gas Inventories (IPCC, 2019) are used to estimate methane emissions for these eight sectors. The annual methane emissions are calculated by
where E(S,t) represents the total methane emissions from sector S in the inventory year t. The parameter AD refer to the activity data in the year t for sector S, grid G belonging to provinces R and condition C. Table 1 provided detailed information about the activity data for each sector. EF is the emissions factor and we used provincial emission factors to calculate the gridded emissions corresponding to each province. CF is the correction factor, which indicates the fraction of methane utilized or oxidized without being released to atmosphere.
Table 1Data information used for CHN-CH4.
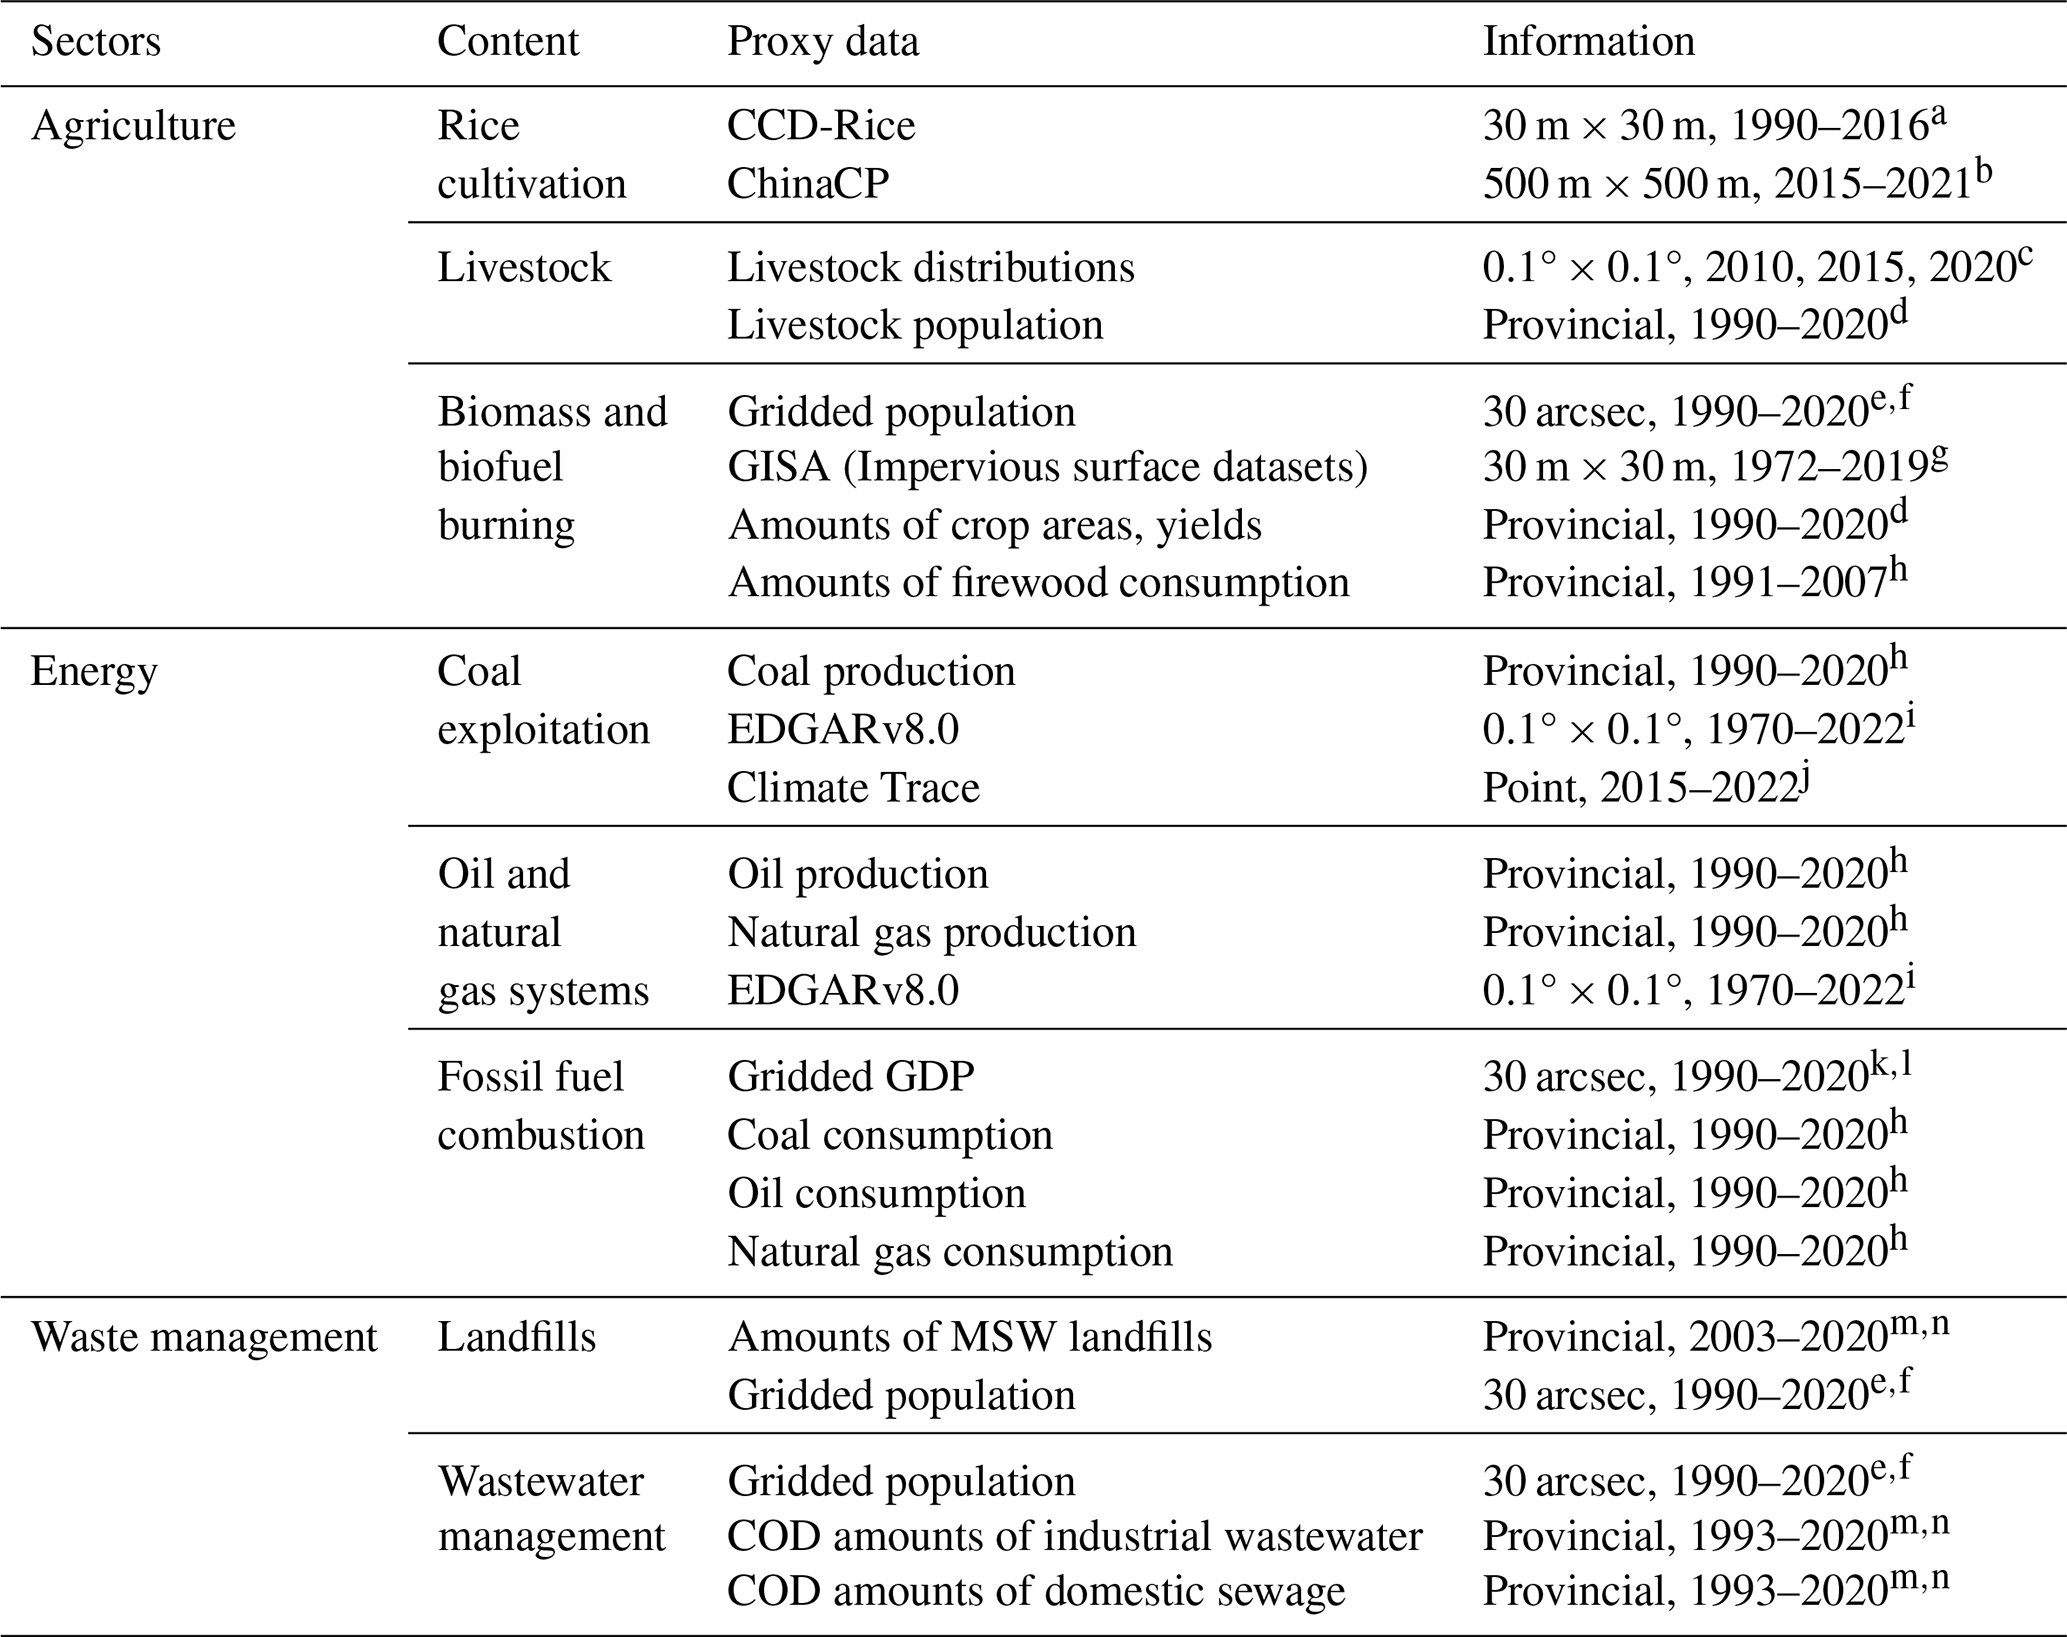
Notes: a Shen et al. (2025); b Qiu et al. (2022); c FAO (http://www.fao.org/livestock-systems/en/, last access: 25 September 2024); d China Agricultural Statistical Yearbook; e Wang and Wang (2022a); f WorldPop (https://www.worldpop.org/, last access: 24 September 2024); g Huang et al. (2021); h China Energy Statistical Yearbook; i EDGAR v8.0 (https://edgar.jrc.ec.europa.eu/, last access: 24 September 2024); j Climate Trace (https://climatetrace.org/, last access: 10 November 2024); k Wang and Wang (2022b); l Zhao et al. (2017); m China Statistical Yearbook; n China Environmental Statistical Yearbook. Date in the information column represents the start and end time of province-level that we can collect from various national statistical yearbooks. And the data missing phenomenon exists between them.
2.1 Methods for agriculture sector
2.1.1 Rice cultivation
The methane emissions from rice cultivation sector are estimated following the methodology of Fu and Yu (2010) using the following equation:
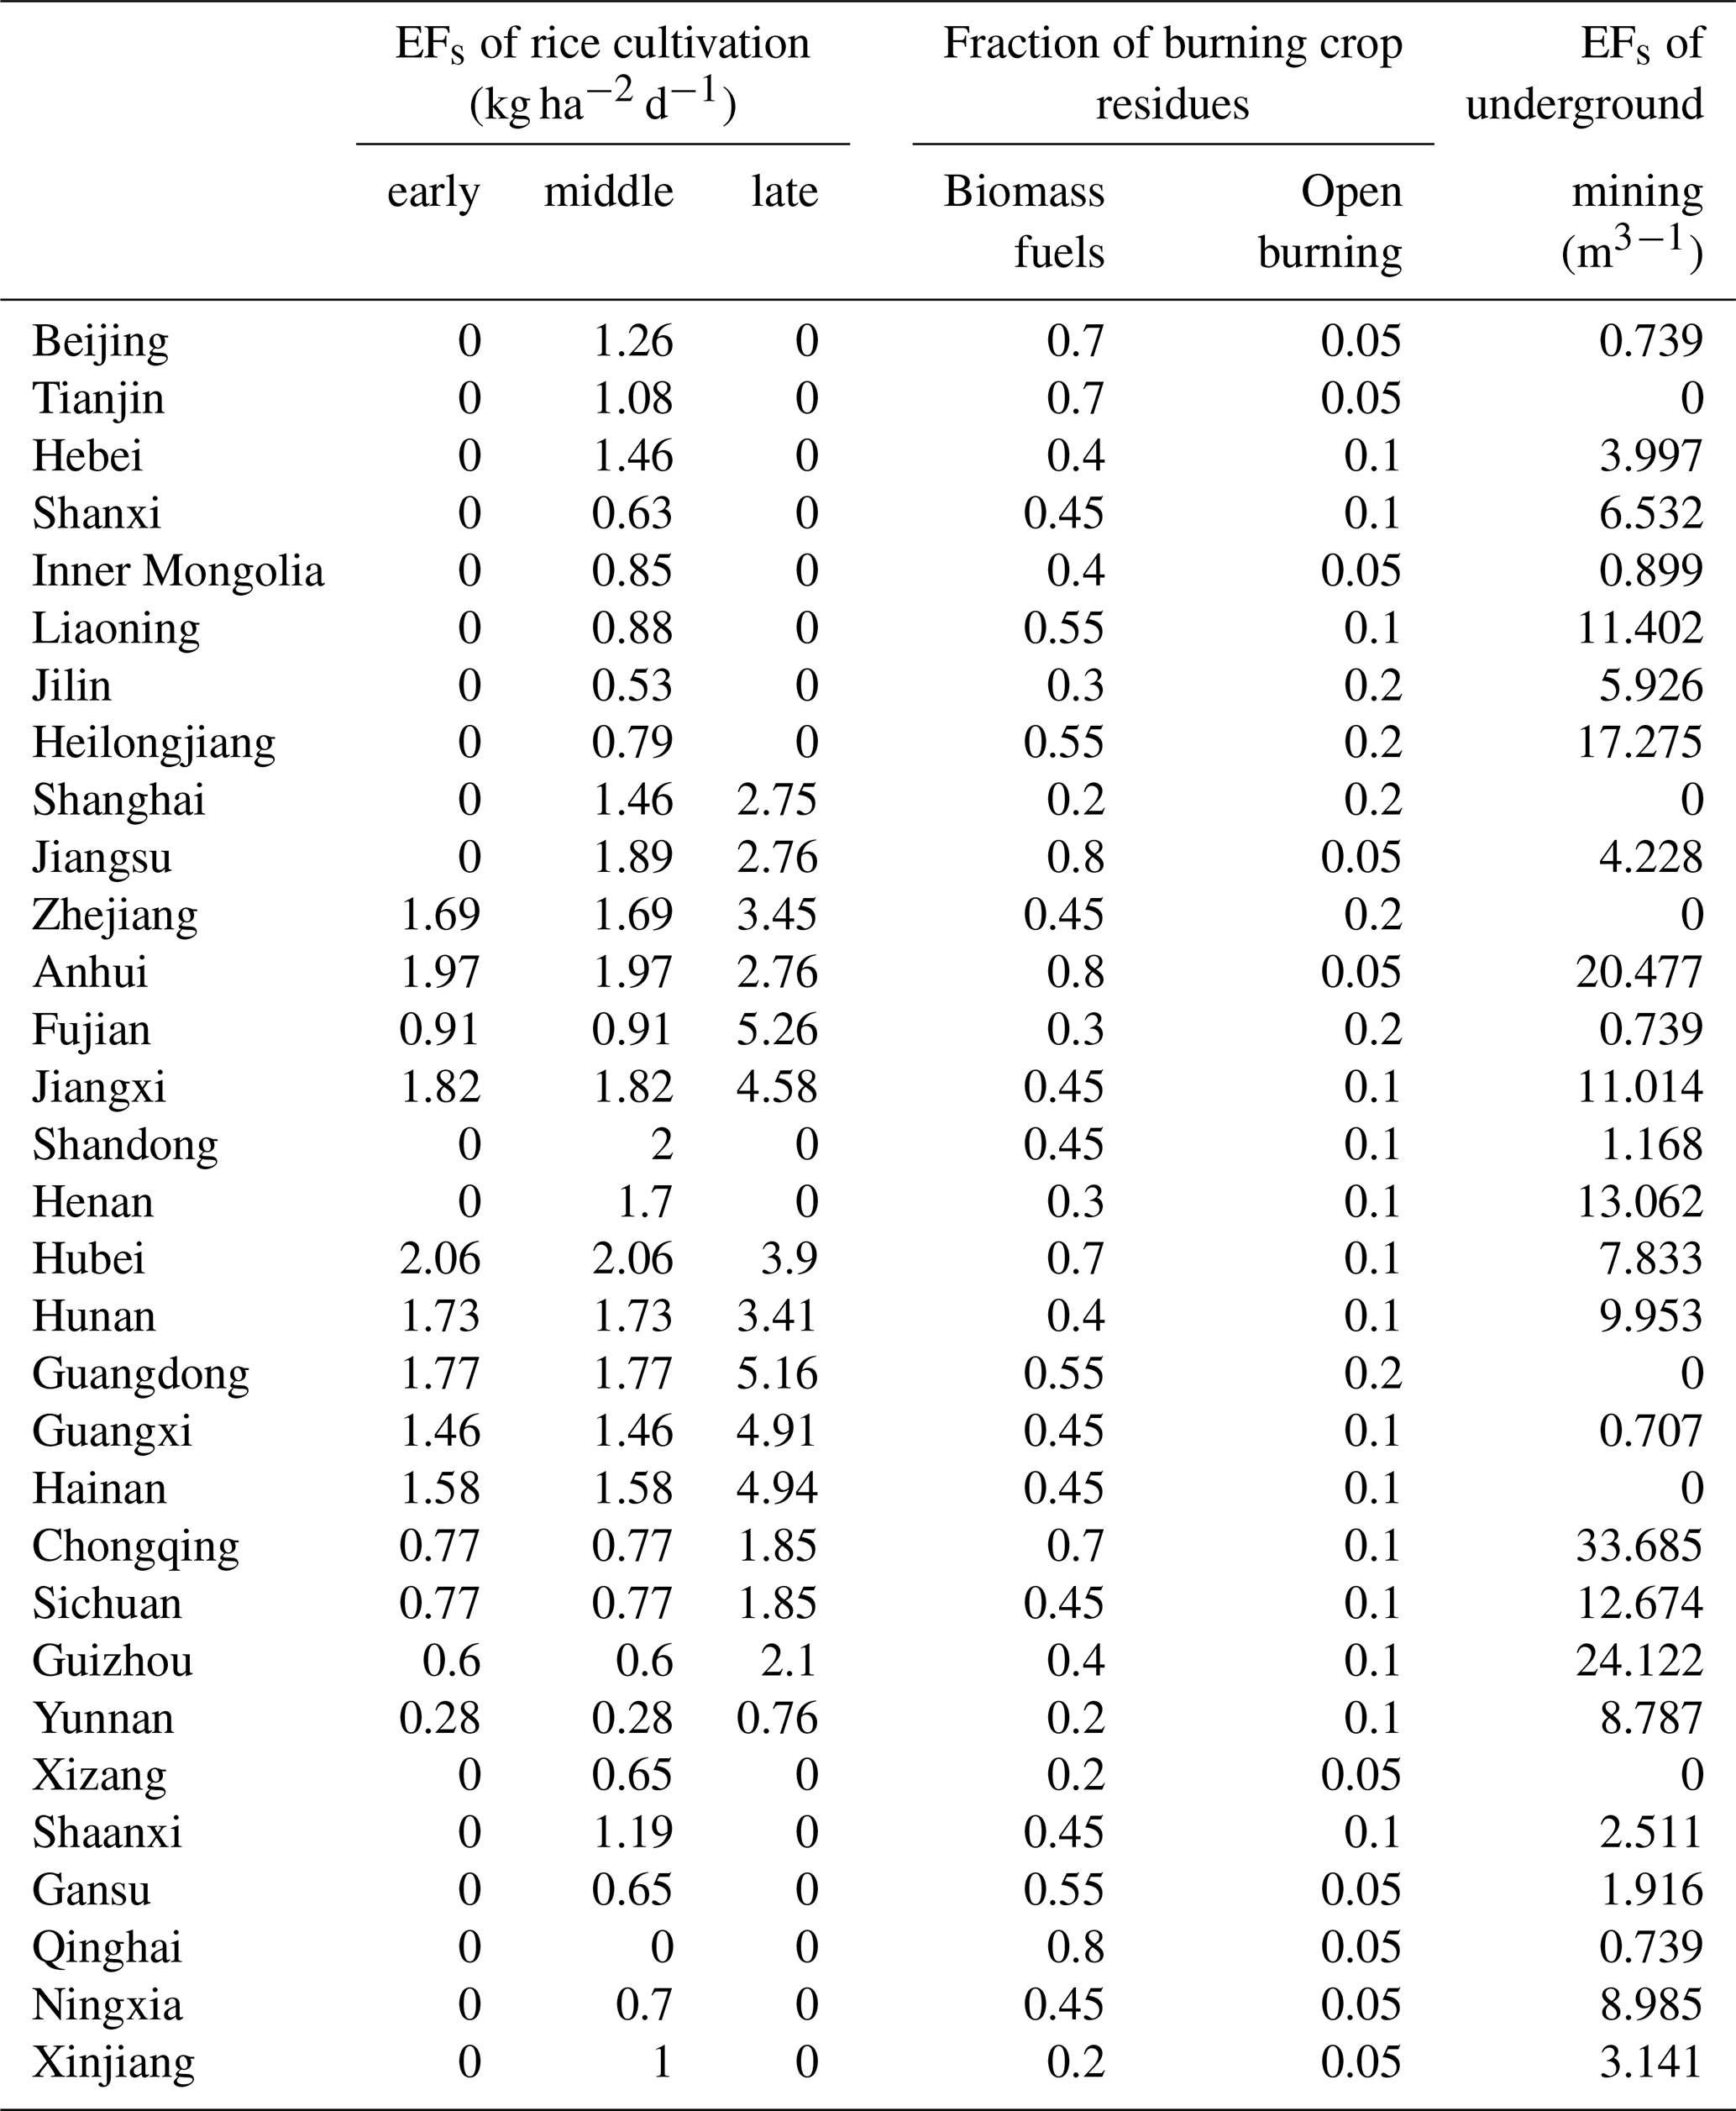
where A is the cultivated rice area, i is the rice season division (early, middle and late) and p is the rice growing period. In Northern China, only single-harvest rice is cultivated, while in Southern China, double-harvest early rice, single-harvest rice, and double-harvest late rice are grown. In this project, we define single-harvest rice as middle rice. The early and late rice are assumed to be planted in the same area. The growing periods for early, middle, and late rice are 77, 110–130, and 93 d, respectively (Peng et al., 2016; Yan et al., 2003). Table 2 lists the emission factors (EFs) for each rice season by region, tailored to the Chinese context. These EFs are based on 204 season-treatment measurements across 23 different sites. Due to the limitations of existing satellite products, which do not cover the entire period from 1990 to 2020, we used two datasets for gridded rice cultivation areas annually: CCD-Rice for the period 1990–2016 (Shen et al., 2025) and ChinaCP for the period 2017–2020 (Qiu et al., 2022). The CCD-Rice dataset was derived from Landsat Collection 2 Level-2 Science Products at 30 m spatial resolution, with provincial-level distribution maps showing an average overall accuracy of 89.61 % and strong coefficients of determination (R2=0.85 for single-season rice and 0.78 for double-season rice). The ChinaCP dataset was developed from MODIS imagery at 500 m resolution using phenology-based mapping algorithms. The validation against ground truth data revealed an overall accuracy of 89 %, with excellent agreement to statistical data (R2≥0.89). The accuracy is further applied to evaluate the uncertainty caused by rice paddy area. These datasets were then resampled into 0.1° by 0.1° gridded maps. The uncertainty of methane emissions from rice cultivation is derived from the range of EFs (Peng et al., 2016; Yan et al., 2003).
Table 2EFs of rice cultivation, underground mining and the fraction of burning as biofuels or in the open fields.
2.1.2 Livestock
The methane emissions from livestock sector include the activities of enteric fermentation and manure management. Enteric fermentation is the process by which microbes in the digestive system of ruminant animals produce methane. Methane is also emitted from the collection, storage, treatment, and disposal of animal manure. The emissions from these activities are calculated using the following formula:
where i is the category, and N is the number of ruminant and non-ruminant animals at grid G. Table 3 lists the considered animals and the widely applied values of emission factors for two sources: enteric fermentation and manure management. We selected the emission factors from Zhou et al. (2007), which have been widely used to calculate methane emissions from livestock in China (Zhou et al., 2007; Fu and Yu, 2010; Zhang and Chen, 2010, 2014). For manure management from swine, we used the value of 3.05 kg per head per year following the work of China Climate Change Group (2000) and Zhang and Chen (2014). For the uncertainty analysis, we used the maximum and minimum values of the emission factors for each category listed in Table 3 as the range.
Table 3EFs of enteric fermentation and manure management for livestock.
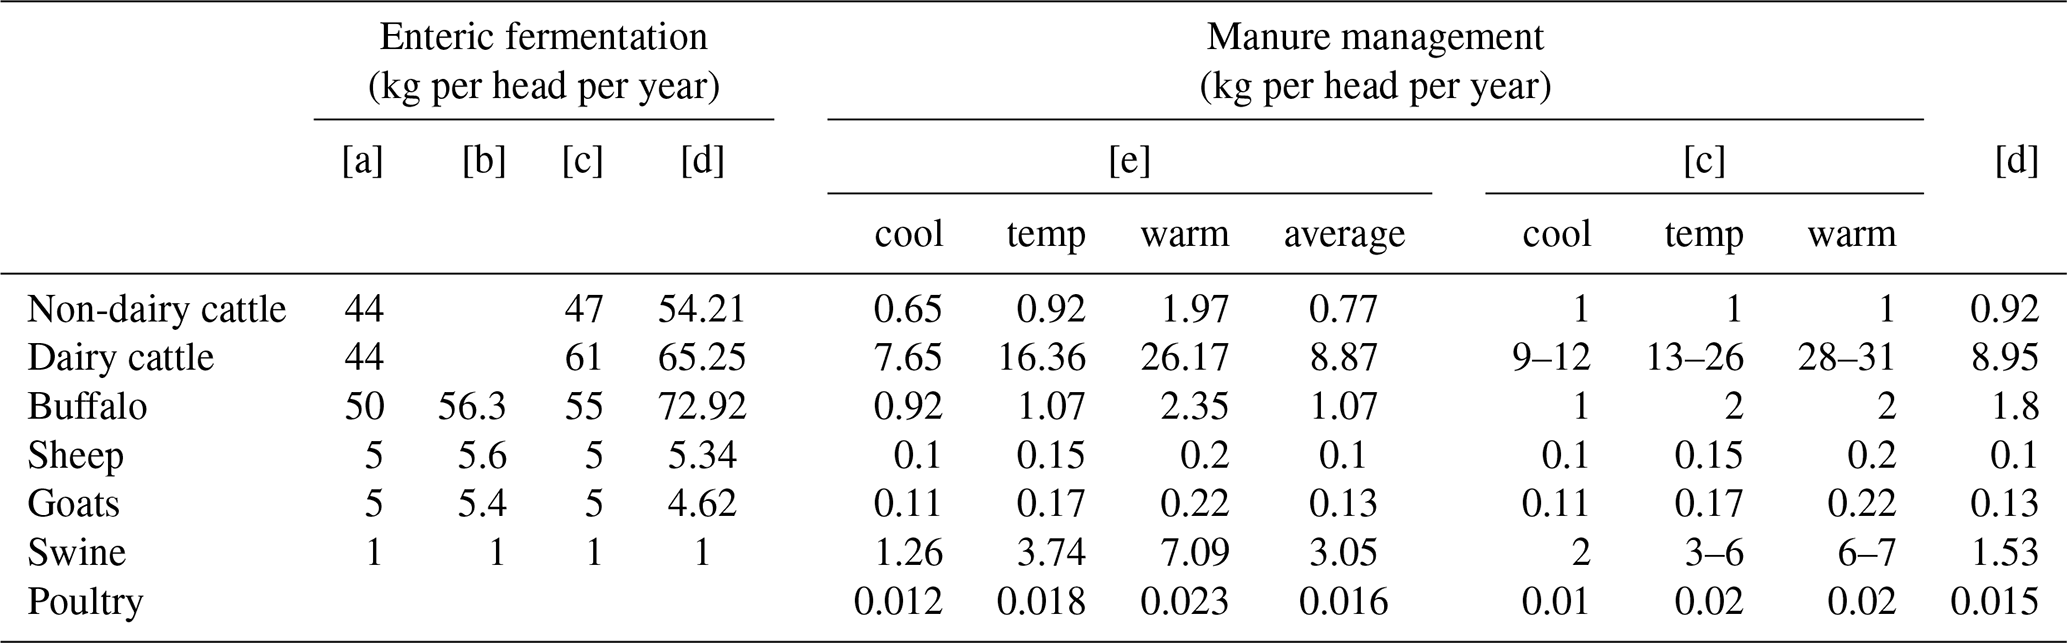
Notes: a Khalil et al. (1993); b Yamaji et al. (2003); c IPCC (2006); d Zhou et al. (2007); e China Climate Change Group (2000).
For the activity data, we used the gridded map from the Food and Agriculture Organization of the United Nations (FAO) that provides the global livestock density (GLW) dataset based on the work of Gilbert et al. (2018, 2022). However, the official website only released data for the years 2010, 2015, and 2020, which do not cover the entire target period of 1990–2020. For the other years without gridded data, we attributed the province-level data to each grid based on the spatial proportion belonging to the same province in the year 2010. We collected the province-level annual census data of domestic livestock for each livestock category from China Agricultural Statistical Yearbook. The comparable results show good consistency with the reference grid data for 2015 and 2020 from FAO (Fig. S1 in the Supplement). Notably, since seasonal births and slaughters change the population of livestock, we combined the slaughtered population and live population together as the Net Annual Population Average (NAPA) at the end of the year. We then calculated the number of each livestock category, following the Guidelines of IPCC (2006):
The average life spans in one year are 12 months for dairy cattle, 10 months for non-dairy cattle and buffalo, 7 months for sheep and goats, 6 months for swine and 2 months for poultry.
2.1.3 Biomass and biofuel burning
The emissions from this sector come from the straw in rural households and the burning of firewood. The former mainly refers to crop residues used as biofuels in houses and those burnt in open fields, based on the work of (Fu and Yu (2010) and Tian et al. (2010)), which is calculated by
where Ri is the straw grain ratio for the crop i: rice (0.623), wheat (1.366), corn (2), other grains (1), bean (1.5), tuber (0.5), cotton (3), fiber crop (1.7), sugar crop (0.1), and oil-bearing crop (2) (Fu and Yu, 2010). F is the fraction of crop residues used as biofuels in houses or burnt in open fields (Table 2), while θ is the corresponding burning efficiency: 100 % for biofuels and 88.9 % for fires in open fields (Peng et al., 2016; Tian et al., 2010; Zhang et al., 2008). NG,i represents the annual yields at grid G for the crop i. Since straw is mainly used by rural residents, we generated the proxy data at the grid level by attributing the province-level data to the spatial distribution of rural populations. Province-level data comes from the China Agricultural Statistical Yearbook, while the rural populations are mapped by masking the grid dataset of China's historical population (Wang and Wang, 2022a; WorldPop) with the impervious surface datasets GISA (Huang et al., 2021).
For the estimation of methane emissions from firewood burning, we collected the province-level data on firewood consumed as biofuels from the China Energy Statistical Yearbook and then attributed this data to the gridded rural population data. Since no firewood data are available after 2007, we performed a linear regression with the rural population to fill in the missing data. The EFs of methane emissions from biomass and biofuel burning come from the existing literature (Zhang et al., 2000, 2008; Fu and Yu, 2010; Peng et al., 2016). We used the EFs of crop residues for biomass fuel 3.62±2.20 kg CH4 t−1 and fire in open fields 3.89±2.20 kg CH4 t−1, respectively. For the firewood consumption as biofuels, the EFs 2.77±1.80 kg CH4 t−1 was adopted.
2.2 Methods for energy sector
2.2.1 Coal exploitation
Methane emissions from coal exploitation include fugitive methane from underground, surface, and post-mining activities (IPCC, 2006). To estimate the emissions from this sector, it is crucial to determine the gridded distribution of coal exploitation amounts. We combined the methane emission map for the period 1990–2020 from the EDGAR v8.0 Fuel Exploitation datasets (European Commission and Joint Research Centre, 2023) with province-level coal production data from the China Energy Statistical Yearbook (1990–2020) and the China Statistical Yearbook (1990–2020). First, we separated the locations of coal exploitation from oil and natural gas systems in the Fuel Exploitation sector of EDGAR v8.0 using the following criteria:
-
Point-source and line-source methane emissions were distinguished by setting a threshold of 50.
-
Point-source methane emission locations outside the tight oil basins in China were classified as coal mining locations (Fig. 2).
-
For point-source methane emission locations within the tight oil basins, we used the Climate TRACE (CT) oil and gas dataset to identify and distinguish coal mining locations (Fig. 2).
-
The remaining point-source locations were classified as oil and natural gas locations.
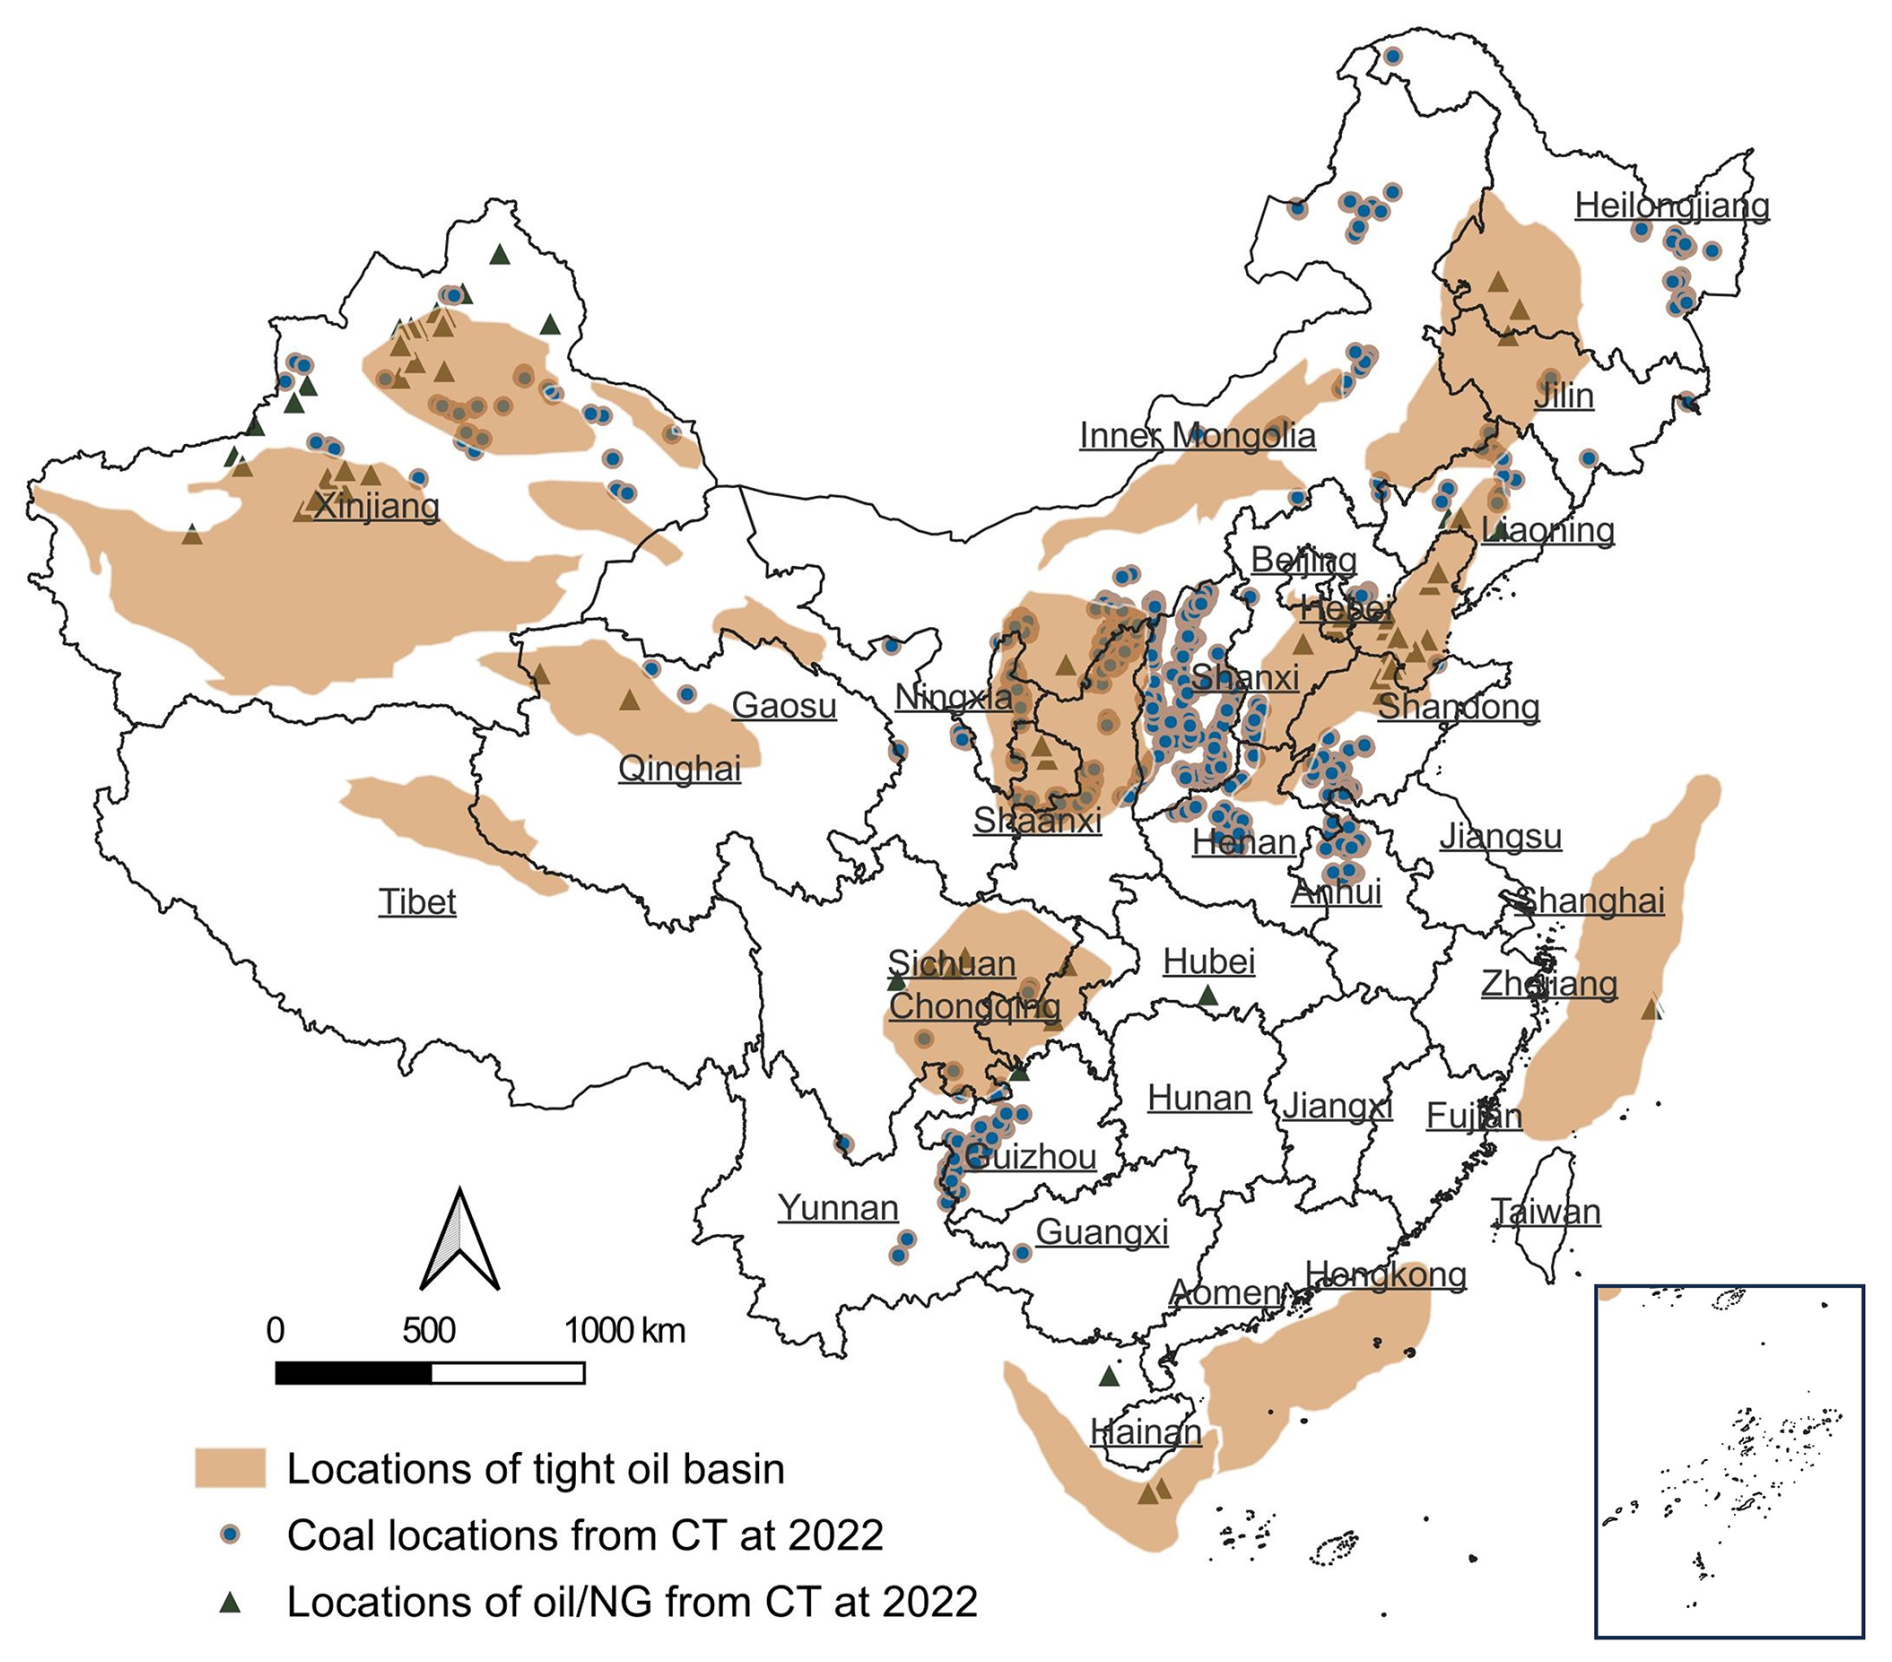
Figure 2Spatial distributions of tight oil basin, coal mines, and oil/NG from Climate Trace at 2022.
Next, we calculated the spatial proportion of methane emissions for each coal mining location relative to the total methane emissions for the corresponding province, based on the Fuel Exploitation methane emission map from EDGAR v8.0. Finally, we attributed the province-level coal production volumes to each corresponding coal mining location based on the above proportion.
For methane emissions from underground mines, Zhu et al. (2017) developed province-level methane emission factors (EFs) for coal mining in China for the period 2005–2010. These EFs were derived from data analysis of coal production and corresponding methane emissions from 787 coal mines across 25 provinces with diverse geological and operational conditions. We used the mean values to estimate methane emissions from underground mining, while the minimum and maximum values were applied to analyze uncertainties (Table 2).
Methane emissions from surface mining are generally much lower than those from underground mining. On average, only about 5 % of coal was mined from surface mines at the national scale (Peng et al., 2016; Zhu et al., 2017). Due to the limited availability of methane emission measurements for surface mining, we adopted the default EF of 2.5 m−3 t−1 of coal mined, as recommended by IPCC (2006).
Currently, there are no direct measurements available for methane emissions from post-mining activities. Following Zheng et al. (2005) and Zhu et al. (2017), we assumed that 12 % of the total methane emissions from coal mining are associated with emissions during the subsequent handling, processing, and transportation of coal. In China, the fraction of methane collected and utilized from coal mining operations (CF) has increased with economic growth and improvements in coal safety (NDRC, 2014; Peng et al., 2016). Based on the findings of Peng et al. (2016) and Zhu et al. (2017), the recovery fraction increased linearly from 3.59 % in 1994 to 9.4 % in 2010. For our study, we used a recovery fraction of 3.59% for the period before 1994 and 9.4 % after 2010. To account for uncertainty, we adopted a range of recovery fractions (3.59 %–5.21 %) based on the studies by Zheng et al. (2005) and Peng et al. (2016).
2.2.2 Oil and natural gas systems
This sector encompasses methane emissions from venting, flaring, exploration, production, upgrading, transport, refining/processing, transmission, storage, and distribution networks. In IPCC subcategory 1B2 (Fugitive Emissions from Oil and Gas), these emissions are processed as an aggregated source, following the methodologies from Schwietzke et al. (2014) and Peng et al. (2016). For the gridded emissions, province-level annual crude oil and natural gas production data from the China Statistical Yearbook was distributed to each potential oil and natural gas location identified in Sect. 2.2.1. For methane emissions from oil systems, we applied the EFs of 0.077 kt CH4 PJ−1, with an uncertainty range of 0.058–0.190 kt CH4 PJ−1. For the fugitive CH4 from natural gas systems, we used the fugitive emission rates (FERs) provided by Peng et al. (2016) and Schwietzke et al. (2014). These rates assume a linear decrease in FER from 4.6 % (equivalent to 0.81 kt CH4 PJ−1) in 1980 to 2.0 % (0.35 kt CH4 PJ−1) in 2010, which aligns with a FER of 1.9 % reported for OECD countries. Uncertainty was assessed using two scenarios: (1) a lower FER scenario, where the FER in China decreased from 3.2 % in 1990 to 1.4 % in 2020; and (2) a higher FER scenario, where the FER decreased from 5.4 % in 1990 to 4.6 % in 2020. Finally, we combined these emissions with methane emissions from line-source emissions in the Fuel Exploitation sector of EDGAR to obtain the final gridded emissions.
2.2.3 Fossil fuel consumed
For gridded emissions in this sector, we collected province-level fossil fuel combustion data from the China Energy Statistical Yearbook for the period 1990–2020. This data was spatially distributed using annual gridded GDP with a 10 km resolution (Wang and Wang, 2022b; Zhao et al., 2017). We adopted the EFs from IPCC for methane estimation, 1 kg CH4 TJ−1for coal combustion, 3 kg CH4 TJ−1 for oil combustion and 1 kg CH4 TJ−1 for natural gas combustion (IPCC, 2006). For uncertainty analysis, we applied a value of 60 % of the EFs for this sector, based on the work of Peng et al. (2016).
2.3 Methods for waste sector
2.3.1 Landfills
Municipal solid waste (MSW) disposal in China is predominantly handled through landfilling, due to its cost-effectiveness and flexibility in managing varying waste quantities and types. Methane emissions from landfills can be estimated using the first-order decay method according to IPCC guidelines:
where k is reaction constant and TL is decay lifetime period, which are 0.3 and 4.6 years based on national inventory (NDRC, 2014). MSWL is total amount of MSW treated by landfills at grid level. MCFT represents the methane correction factor from three types of landfills: 1.0 for managed anaerobic landfills (Type_A), 0.8 for deep unmanaged landfills exceeding 5 m (Type_B), 0.4 for deep unmanaged landfills within 5 m (Type_C) (IPCC, 2006; NDRC, 2014). FT is the fraction of MSWL assigned to each landfill type by province, as shown in Table 4. DOC is the fraction of degradable organic carbon in MSW, and DOCd is the fraction of DOC that can be decomposed, f is the fraction of methane in landfill gas, and Of is the oxidation factor, set to 0.1. In this study, we adopted a DOC of 6.5 %, DOCd of 0.6, and f of 0.5 (Ma and Gao, 2011; Zhang and Chen, 2014; Peng et al., 2016). For uncertainty analysis, we assumed maximum methane emissions with DOCd=0.6 and f=0.6 and the minimum emissions with DOCd=0.5 and f=0.4.
Table 4Classification of MSW disposal sites and average influent effluent BOD5 COD ratio.
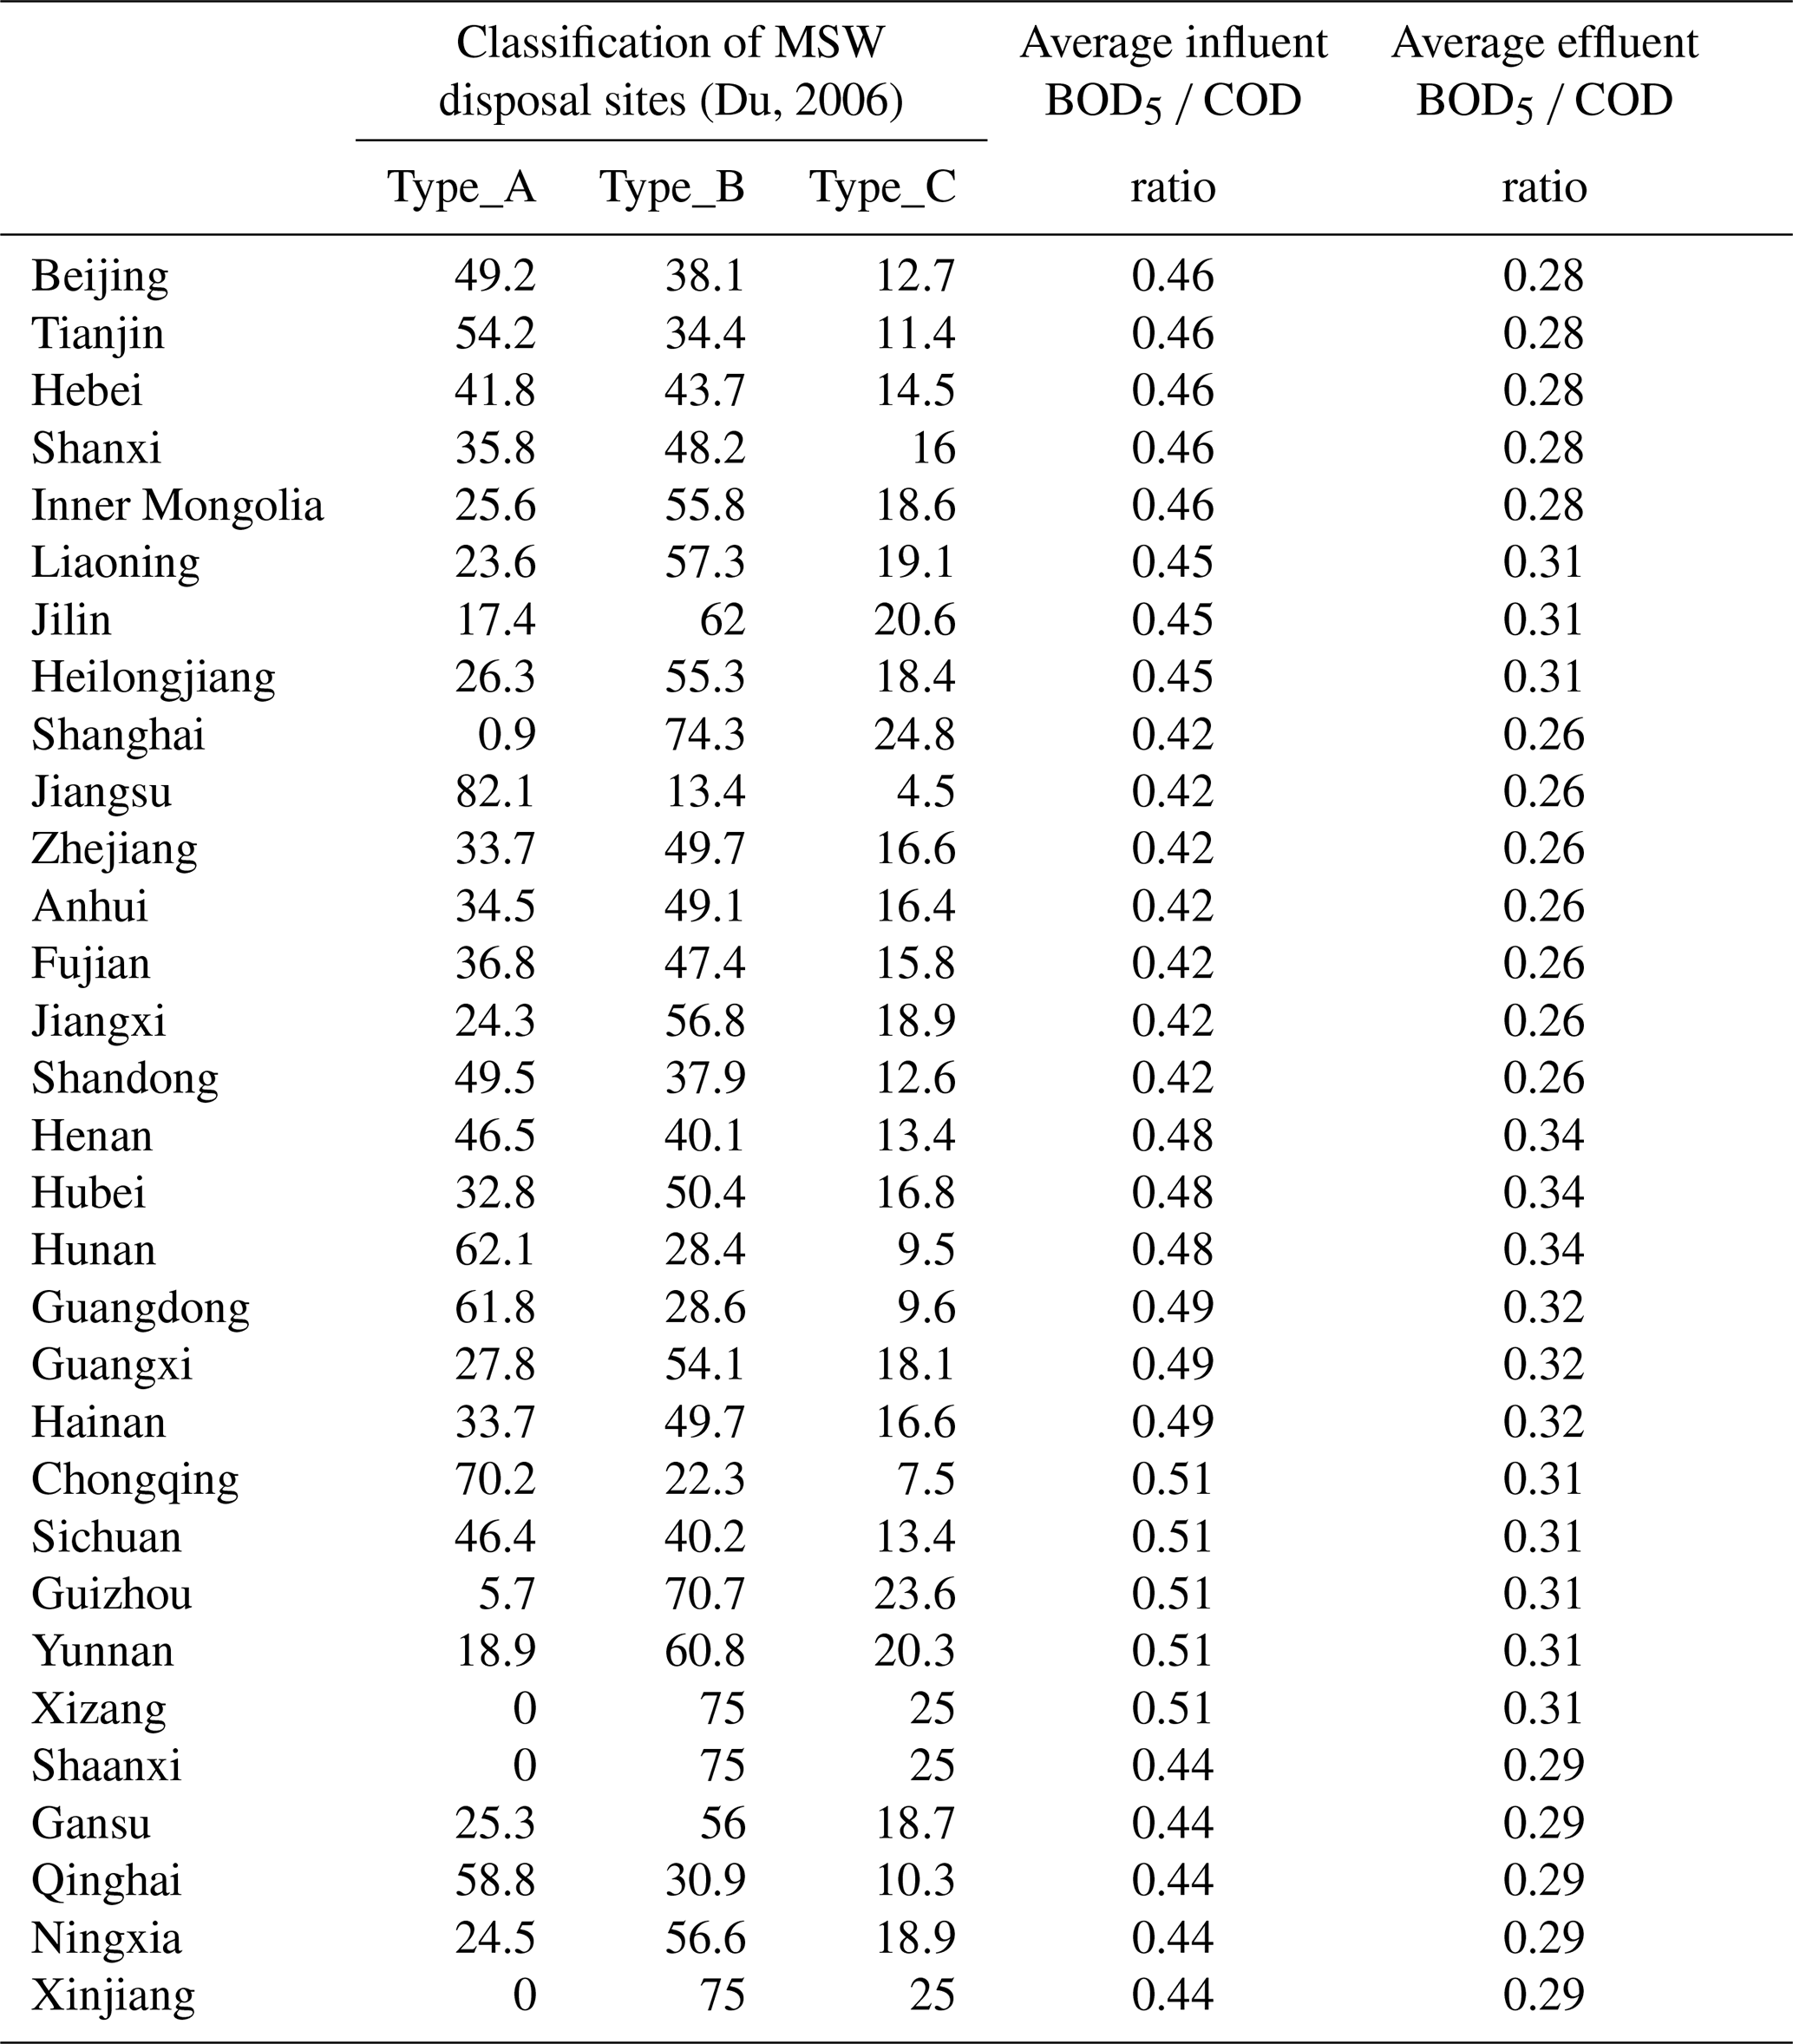
For the activity data, province-level MSW treated by landfills was collected from China Environmental Statistical Yearbook and China Statistical Yearbook, although data is only available from 2003 onward. Following Peng et al. (2016), we identified a linear association between national MSWL and GDP (Fig. S2 with R2 over 0.960). We firstly applied the association to estimate 1990-2002 landfill totals and then attributed the national MSWL to corresponding province using their 2003–2008 average contribution to national landfill amounts. Finally, we downscaled the filled province-level data for 1990–2020 to each grid using the spatial distribution of GDP.
2.3.2 Wastewater
Methane emissions from wastewater management arise from industrial wastewater and domestic sewage. For industrial wastewater, the primary factor influencing methane emissions is the degradable organic fraction, commonly represented by chemical oxygen demand (COD). Methane emissions from industrial wastewater treated by wastewater treatment plants (WTPs) and directly discharged into water bodies are calculated as:
where MCFindustry is the fraction of COD in wastewater treated anaerobically, taken as the correction factor. EFindustry is the emission factor for COD removed, set at 0.25 g CH4 (g COD)−1 removed (IPCC, 2006). For COD removed through WTPs, we used an MCF of 0.458 (Ma and Gao, 2011), while an MCF of 0.1 (IPCC, 2006) was adopted for COD directly discharged into waterbodies.
Methane emissions from domestic sewage are typically estimated using biochemical oxygen demand (BOD5) with the equation:
Regional BOD5 data in China is not directly available. Instead, we calculated organic loading removed based on COD content in domestic sewage and regional BOD5 COD ratios. Table 4 provides these ratios, representing average influent and effluent BOD5 COD ratios from municipal WTPs (Ma and Gao, 2011; Song, 2011). The MCF for BOD5 removed through WTPs was set at 0.165 (Ma and Gao, 2011), and for BOD5 discharged into water bodies, we used 0.1 (IPCC, 2006; NDRC, 2014). For uncertainty, we assumed the maximum emissions with MCF=0.3 for domestic sewage and MCF=0.5 for industrial wastewater treated by WTPs, and minimum emissions with MCF=0.1 for domestic sewage and MCF=0.2 for industrial wastewater treated by WTPs (Ma et al., 2015; Peng et al., 2016).
For the activity data, we collected the province-level and nation-level COD amounts of industrial wastewater and domestic sewage disposed by WTPs or discharged into waterbodies directly from the China Environmental Statistical Yearbook and China Statistical Yearbook. The results in Fig. S3 showed that COD treated by WTPs for both industrial wastewater and domestic sewage increases with GDP (R2 over 0.930), while the fraction of industrial COD directly discharged into water bodies decreases with GDP, reflecting technological advancements and effective environmental policies. Additionally, COD discharge from domestic sewage increases with population growth (R2 over 0.605). To fill the missing national-level data, we interpolated based on these relationships, distributing values to provinces using their average contribution over the nearest five years. We downscaled the COD amounts treated by WTPs for industrial wastewater and domestic sewage to grids using GDP distribution, and we distributed COD amounts from domestic sewage discharged directly into water bodies based on population distribution.
3.1 Evaluation of CHN-CH4 performance with the references
The emissions from CHN-CH4 were comprehensively evaluated against reference inventories at pixel, sectoral, regional and national scales to ensure robust comparisons. Spatial validation against EDGAR v8 and PKU-CH4 v2 datasets for the years 2000, 2009, and 2019 demonstrates strong agreement with CHN-CH4 along the 1:1 line (Fig. 3). The higher R2 between CHN-CH4 and EDGAR indicate greater spatial consistency compared to PKU-CH4. Notable regional differences persist, with CHN-CH4 showing lower emission estimates than both EDGAR and PKU-CH4 in energy-intensive provinces (e.g., Shanxi and Sichuan) and major rice-growing regions (e.g., Hunan and Jiangxi). Particularly, the deviations from EDGAR are more pronounced than those from PKU-CH4.
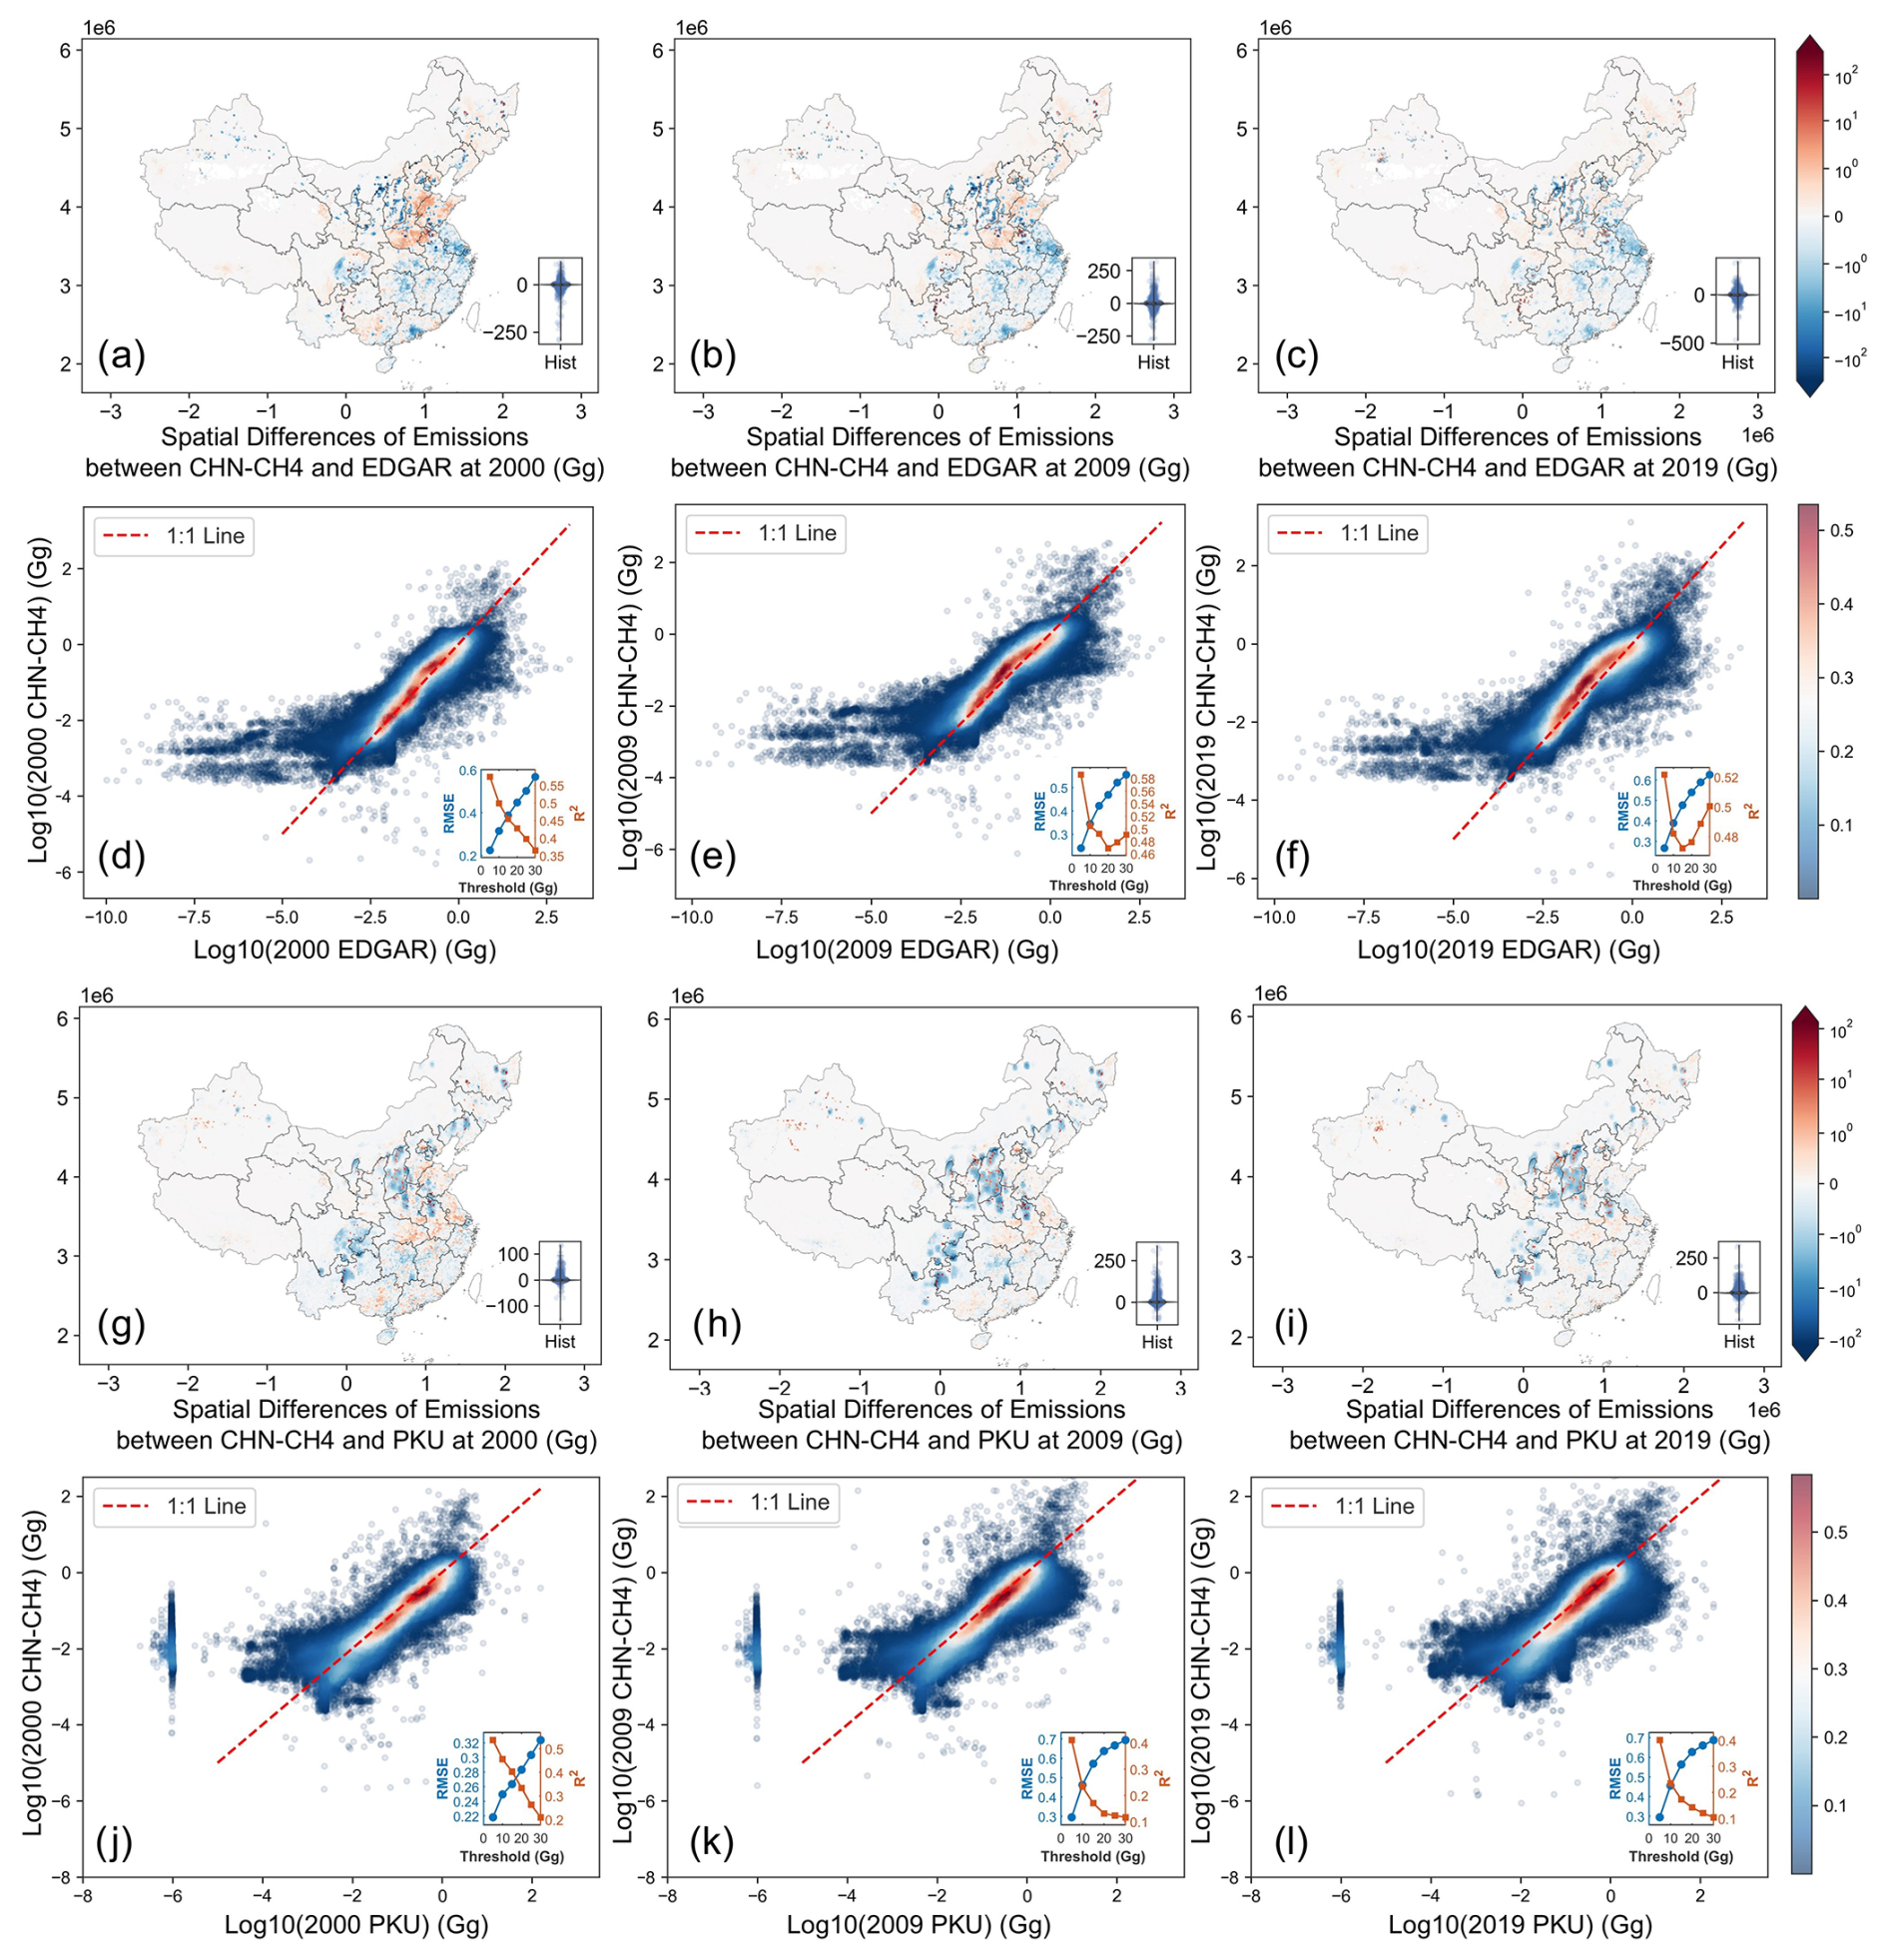
Figure 3Pixel-level comparisons between CHN-CH4 and EDGAR/PKU-CH4. (a)–(f) represent the spatial differences between CHN-CH4 and EDGAR v8, while (g)–(l) represent the comparison between CHN-CH4 and PKU-CH4 v2 at year 2000, 2009, and 2019. “Hist” in each spatial map represents the histogram of the differences between CHN-CH4 and EDGAR/PKU-CH4, with the unit Gg. The bottom-right subfigure in each log–log plot presents threshold-dependent performance metrics, demonstrating how RMSE and R2 vary when excluding grid cells over specific emission thresholds.
Further comparison with the Global Fuel Exploitation Inventory (GFEI) across energy sectors shows well spatial agreement for oil/NG systems but larger discrepancies in coal mining (RMSE > 39.4 Gg, MAE > 24.5 Gg) (Fig. 4). In contrast, the oil/NG sector demonstrates much closer alignment, as evidenced by the log-log plot (Fig. 4c and f). Compared to GFEI and PKU-CH4, CHN-CH4 exhibits stronger spatial consistency with EDGAR, as evidenced by a higher concentration of points along the 1:1 line. The spatial discrepancies between GFEI and EDGAR primarily arise from differences in their underlying data sources for fuel exploitation; EDGAR's coal and oil/gas system locations were adopted in this study. Despite these variations, the overall alignment supports the reliability of CHN-CH4 in identifying key sectoral and regional emission patterns.
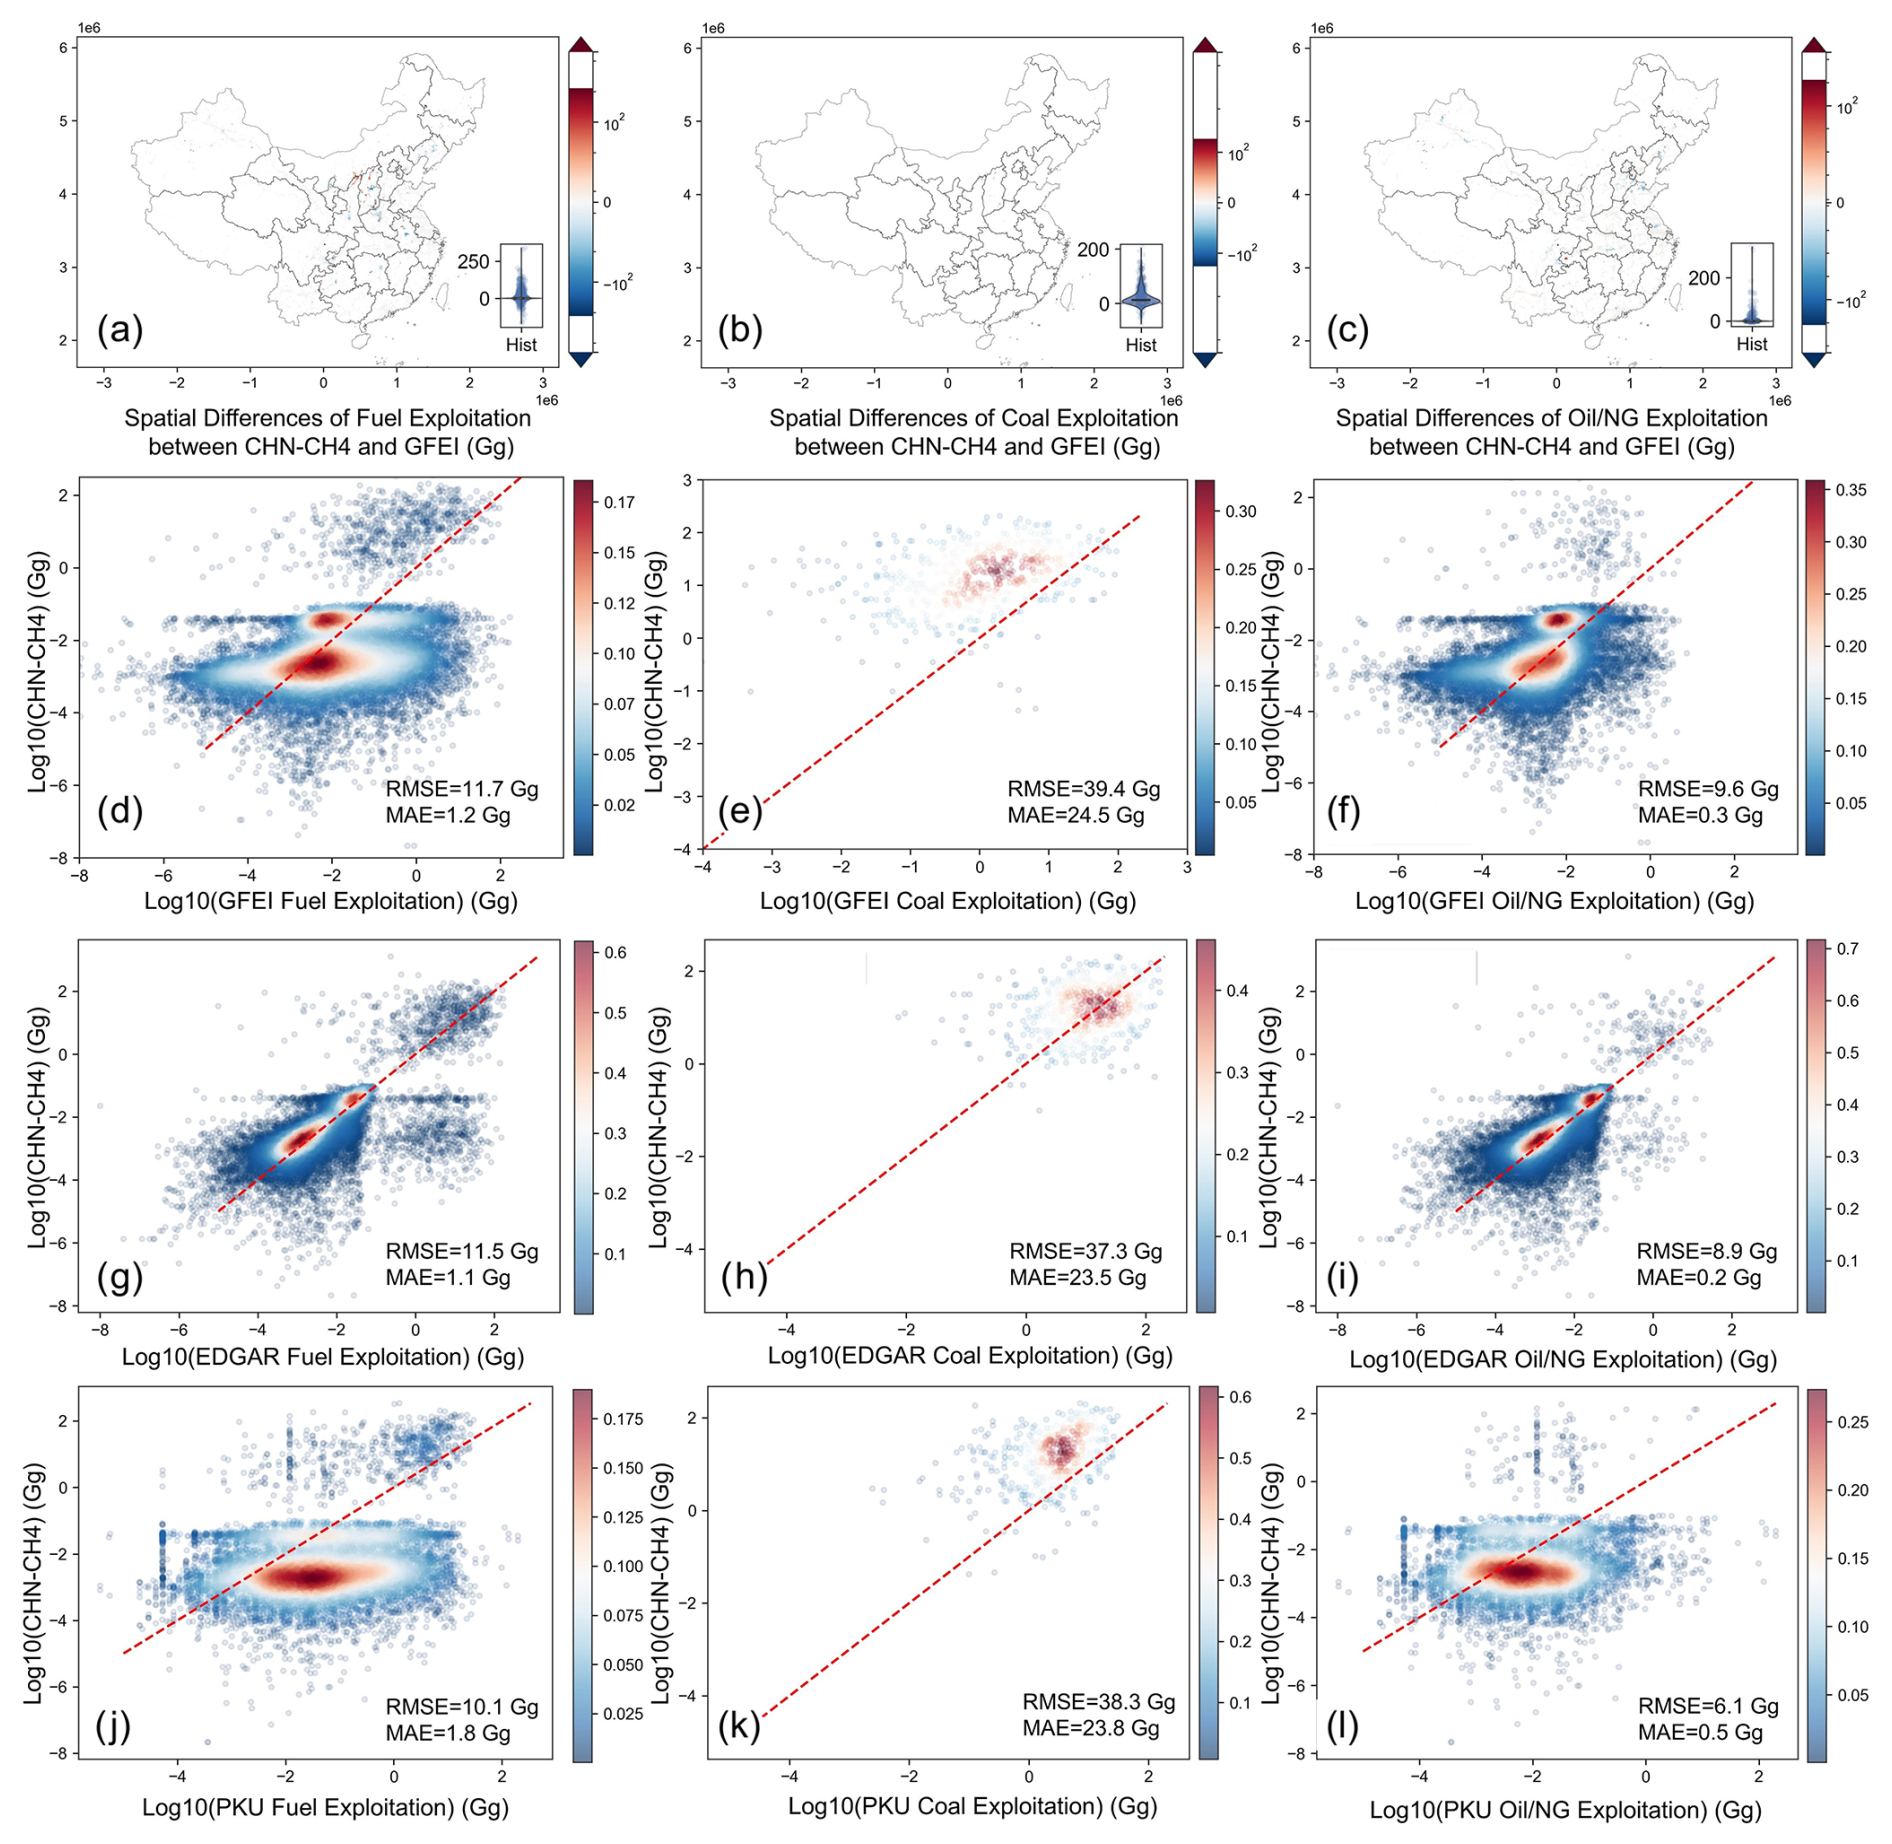
Figure 4Pixel-level comparisons between CHN-CH4 and three inventories (GFEI, EDGAR, and PKU-CH4) in the energy sectors for 2019. (a)–(c) show spatial differences between CHN-CH4 and GFEI. (d)–(i) present log–log scatterplots of pixel-level emissions: CHN-CH4 versus GFEI (d–f), EDGAR (g–i), and PKU-CH4 (j–l), respectively.
The emissions from 26 bottom-up inventory estimates and 14 top-down atmospheric inversion models were selected for the sectoral and national comparisons (Fig. 5). The CHN-CH4 dataset reveals a clear increasing trend in total anthropogenic methane emissions from 1990 to 2020, though with moderate agreement to reference data (R2=0.11, RMSE=10.5 Tg, MAE=7.6 Tg) (Fig. 5a). This discrepancy is largely attributable to EDGAR's systematic overestimation, which exceeds CHN-CH4 estimates by at least 36 % throughout the study period – consistent with the 30 %–40 % overestimation previously reported by Peng et al. (2016). When EDGAR is excluded, the upscaled national emissions show substantially better agreement (R2=0.57, RMSE=6.7 Tg, MAE=4.7 Tg). The overestimation is particularly pronounced in the rice cultivation and wastewater sector, potentially due to EDGAR's use of higher emission factors and assumed continuous flooding rates. In other sectors, this phenomenon is not obvious. Notably, most inventories (including CHN-CH4) show a gradual decline post-2014, although EDGAR's estimates continued increasing with at a slower rate.
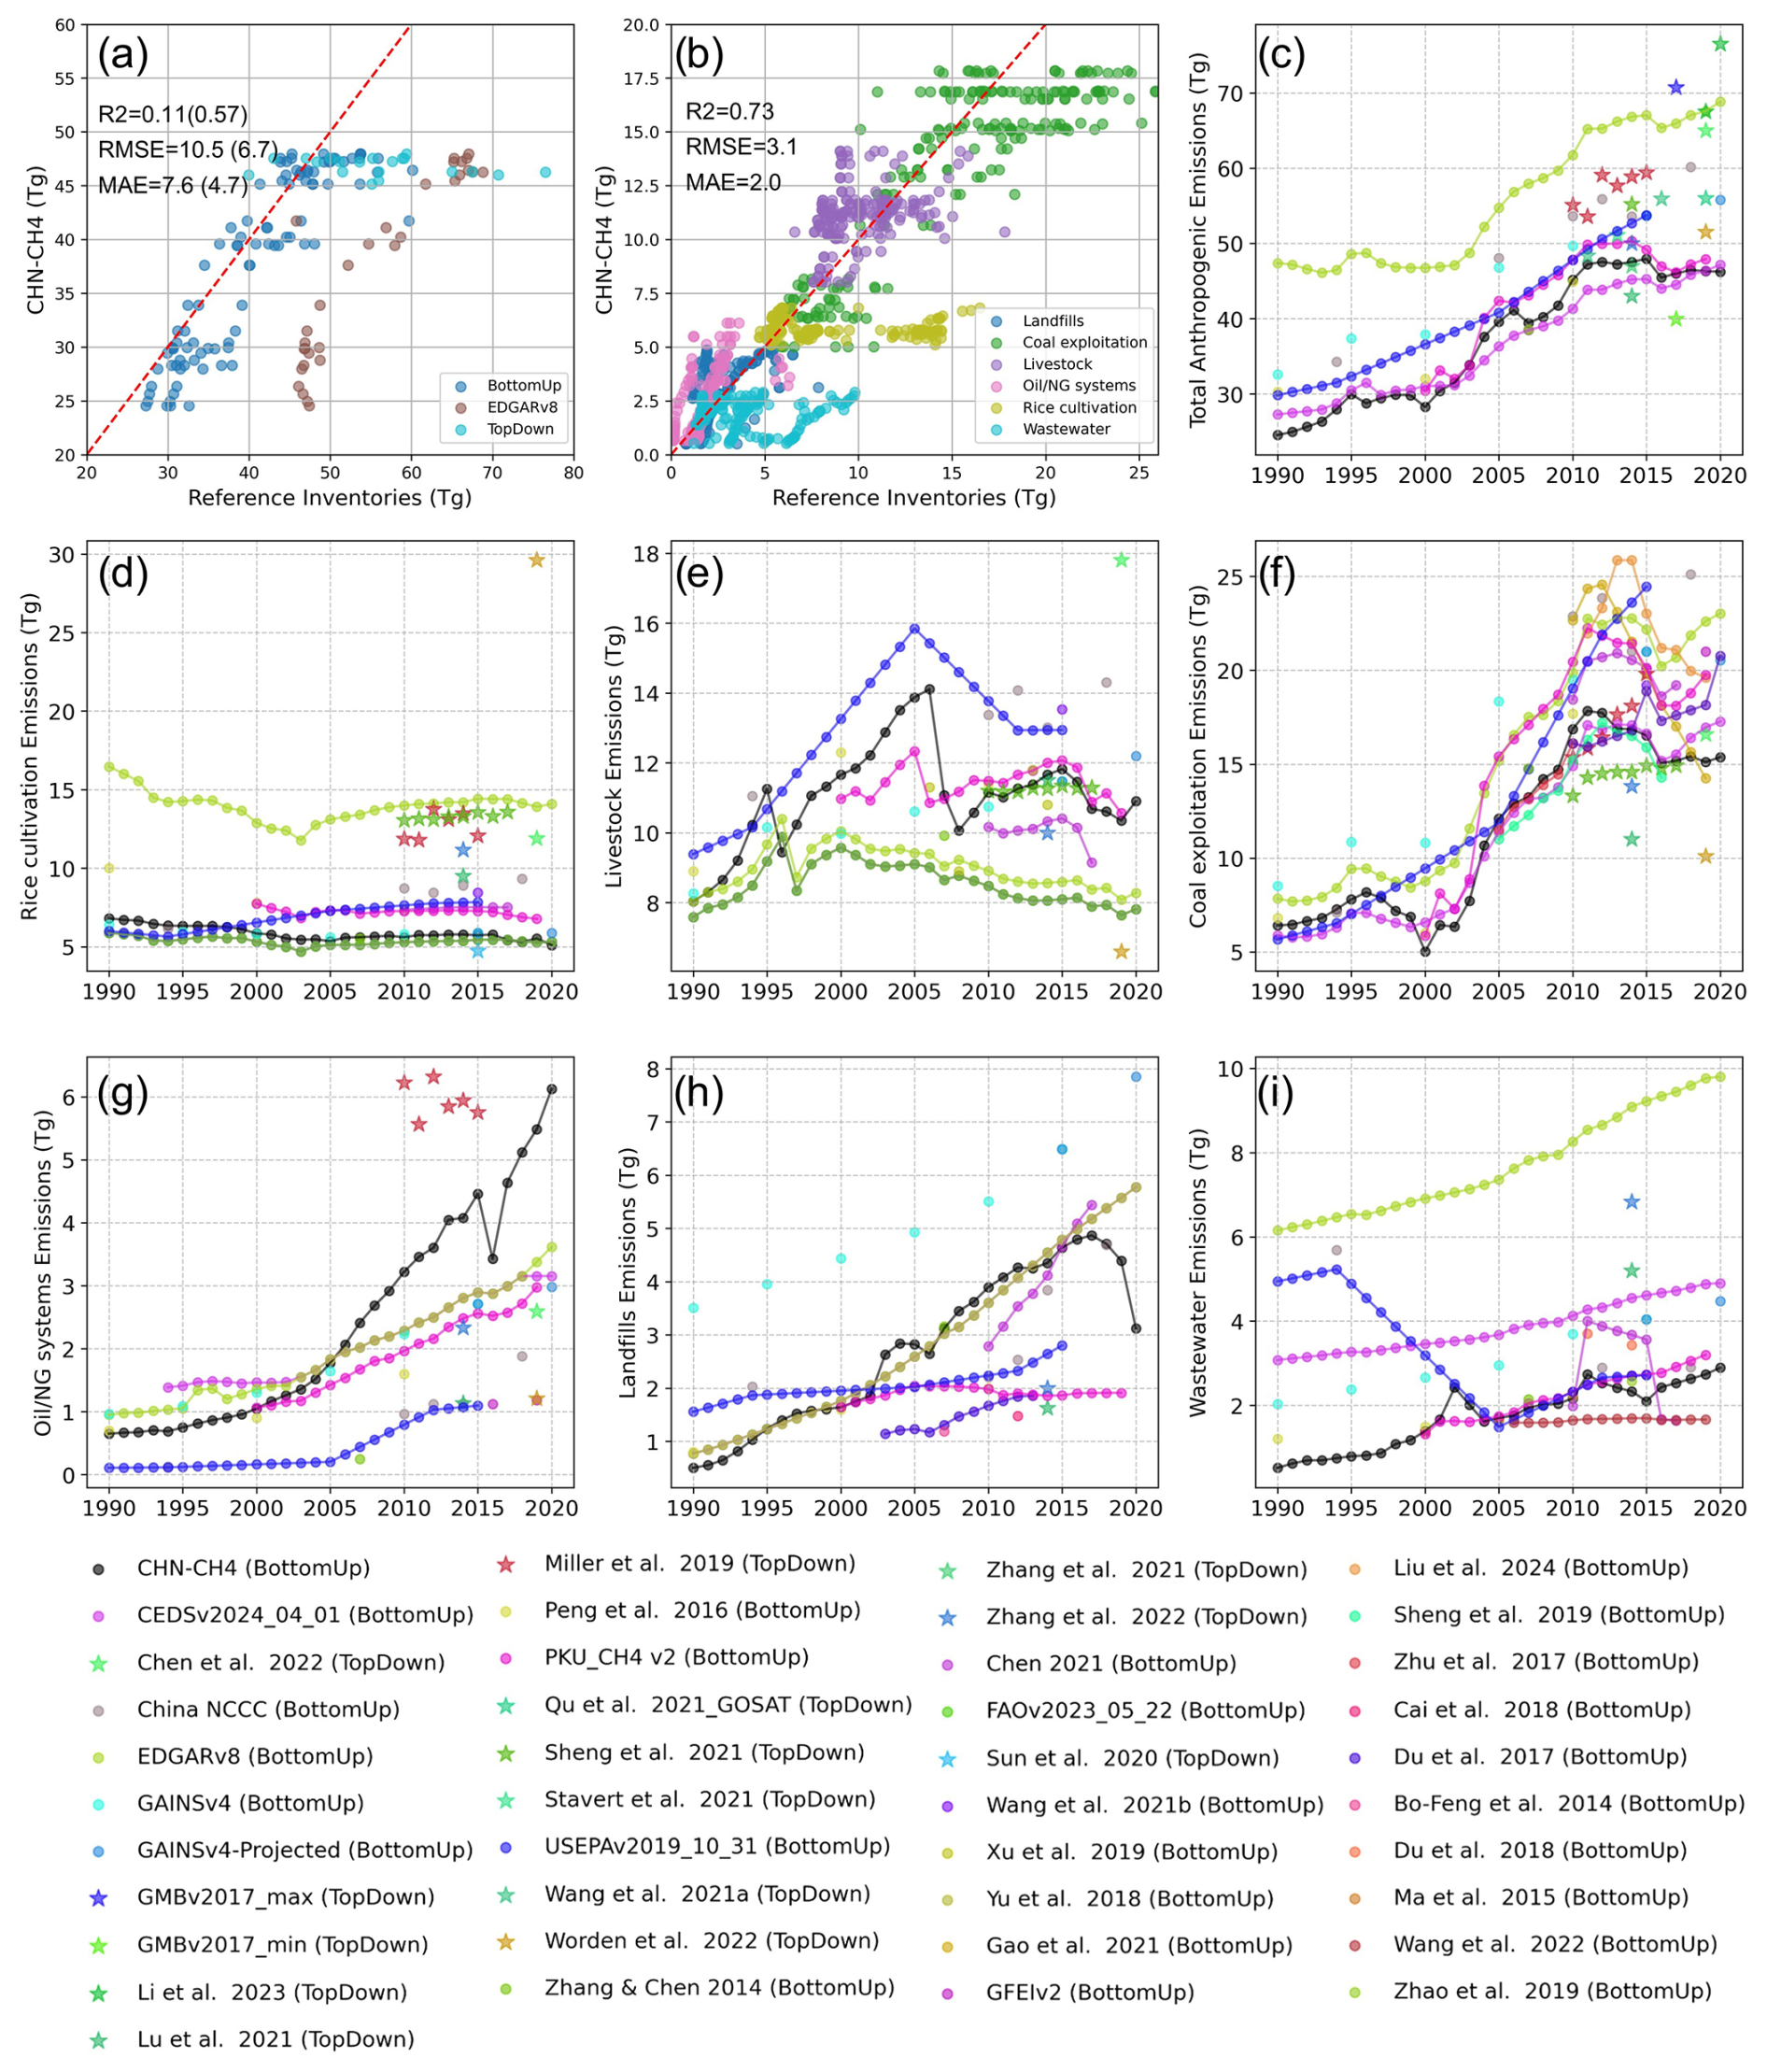
Figure 5Sectoral and national comparisons between CHN-CH4 and reference inventories. (a) National-level emission comparisons between CHN-CH4 and references, (b) Combined sectoral emissions comparison across all inventory sources, (c) Variations of total anthropogenic emissions of CHN-CH4 and references, and (d)–(i) Individual sector-specific variations between CHN-CH4 and the reference (rice cultivation, livestock, coal exploitation, Oil/NG systems, landfills, and wastewater, respectively). The red line is 1:1 line.
At the sectoral level, CHN-CH4 exhibits strong consistency with reference inventories, achieving a R2 of 0.73, RMSE of 3.1 Tg, and MAE of 2.0 Tg across all sectors nationwide. These results clearly identify coal mining, livestock, and rice cultivation as China's three largest methane emission sources (Fig. 5b). CHN-CH4 demonstrates significantly better agreement with bottom-up estimates across both national and sectoral levels, compared to top-down atmospheric inversions (Fig. 5c–i). The RMSE between CHN-CH4 and other bottom-up estimates ranges from 1.3 Tg (landfills, lowest) to 3.7 Tg (rice cultivation, highest), while comparisons with atmospheric inversions show notably higher discrepancies (2.5–8.6 Tg).
3.2 Spatial patterns and historical emissions of methane emissions
Figure 6 shows the spatial distribution of total methane emissions and its eight major sectors in China for the year 2020. The total emissions were estimated at 43.4 [31.6–53.4] Tg. The largest sources of methane emissions were coal exploitation (14.8 [8.8–20.1] Tg), followed by livestock (9.1 [7.6–10.9] Tg), and rice cultivation (5.5 [3.9–7.3] Tg).
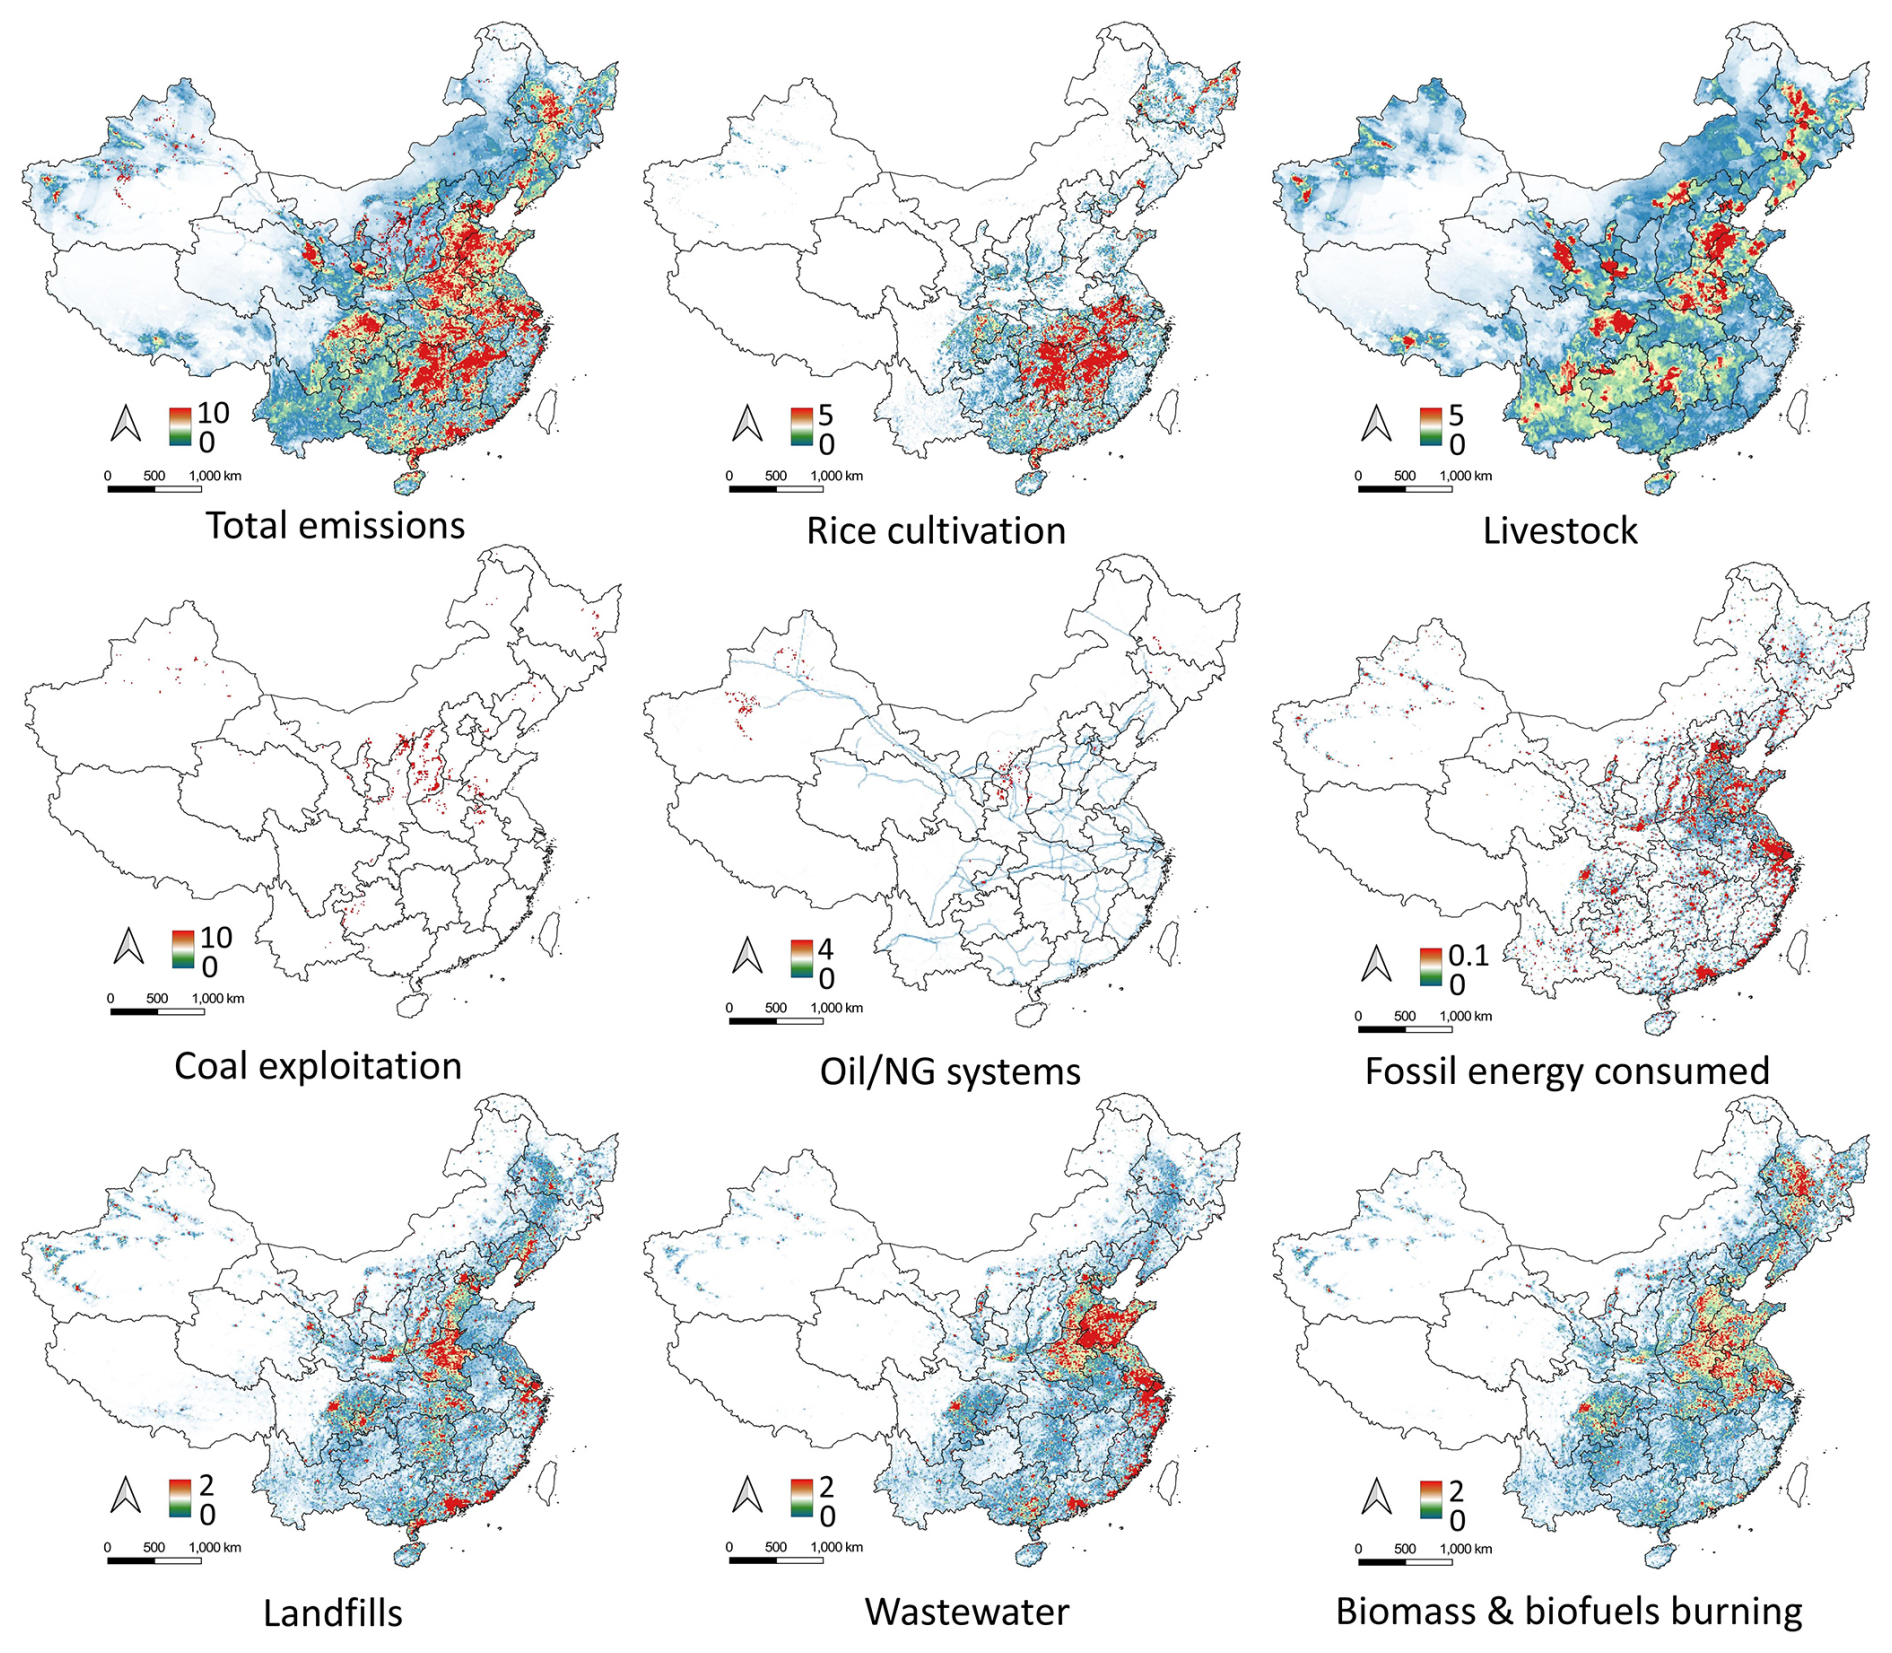
Figure 6Spatial distributions of methane emissions from CHN-CH4 at 2020 (unit: Mg km−2).
The methane emissions decreased from east to west. Provinces in central and northern China, such as Shandong, Henan, Hunan, and Jiangxi, had higher emissions (Fig. 6). In northern China, the spatial distribution of high methane emissions was strongly correlated with areas of fossil energy exploitation, particularly in Shanxi and Xinjiang. In other provinces like Shandong, Henan, Gansu, and Heilongjiang, emissions were more closely linked to livestock production. Additionally, the emissions from biomass and biofuel burning were mainly located in several yield plateaus, including North China Plain (e.g., Shandong, Henan, and Hebei), Northeast China Plain (e.g., Heilongjiang, Jilin and Liaoning), and Jianghuai Plain (e.g., Jiangsu and Anhui). The rice cultivation contributed to the largest methane emissions in central China, including Hubei, Hunan and adjacent Jiangxi province. For the eastern and southern coastal provinces, including Jiangsu, Shanghai, Zhejiang, and Guangdong, methane emissions were higher due to sectors related to modernization and urbanization, such as wastewater management, landfills, and fossil fuel consumption. Over the past decades, China has emitted a total of 1156.7 [868.7–1437.3] Tg of methane. Shanxi, Henan, Guizhou, and Sichuan were the top four emission provinces, accounting for around 338.8 Tg, with 30 % of the total emissions.
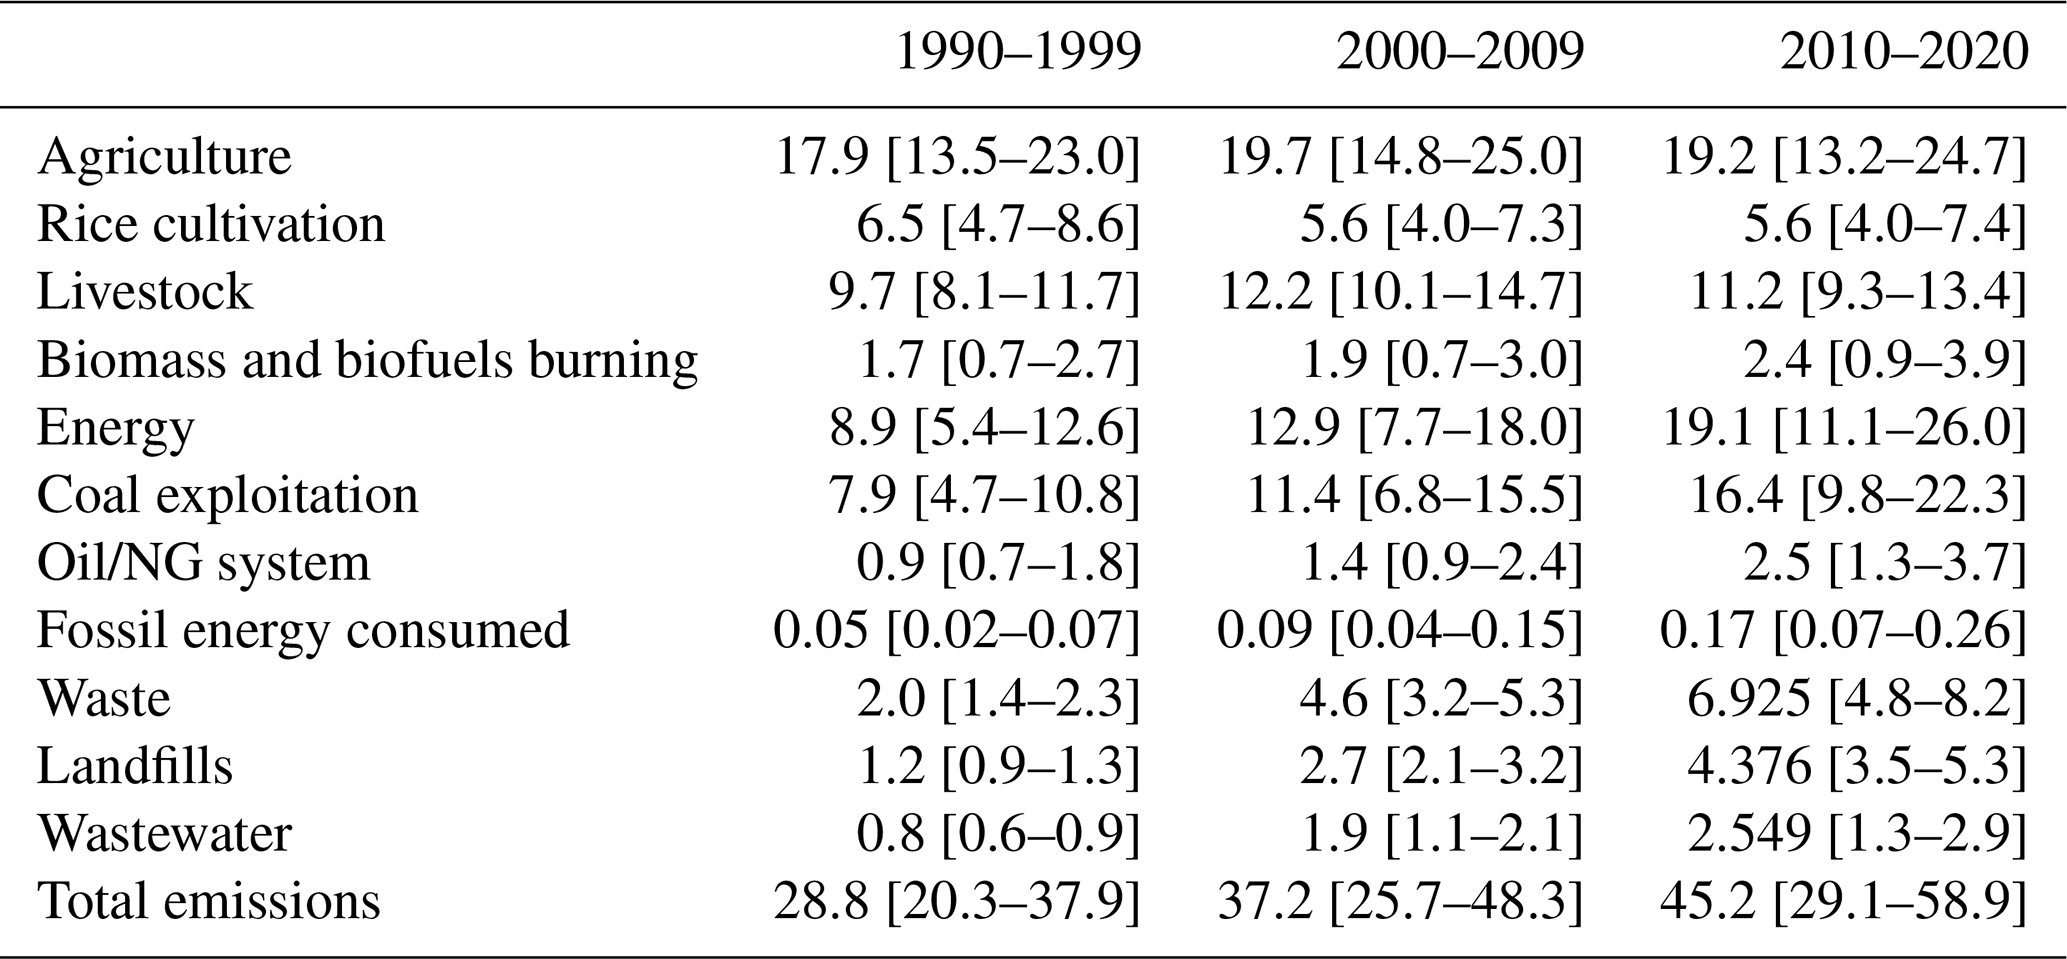
Table 5 shows the average methane emissions from various sectors at the national level over three decades. Total emissions increased from 28.8 [20.3–37.9] to 45.2 [29.1–58.9] Tg, with an increase of over 55 %. Agricultural sectors were the largest contributors during the period 1990–2020, but the proportion of emissions from the energy sector, particularly coal exploitation, rose significantly, making it the largest source of methane emissions in 2010–2020. In the first decade, emissions from agriculture sectors contributed about 62 % to total methane emissions, but decreased to 42 % in the 2010s. In contrast, emissions from the energy sector grew from 28 % to 42 %, particularly the coal exploitation, emitting 16.4 [9.8–22.3] Tg methane in 2010–2020. Similar trends were observed in the RIMAP-hist national historical emissions dataset (Gütschow et al., 2016, 2024). This shift is primarily driven by industrialization, modernization, and urbanization, which have increasingly relied on fossil fuel consumption. Another noteworthy trend is the continuous rise in emissions from waste sectors, including landfills and wastewater, which grew from 6 % to 15 % over the three decades.
Table 5Average methane emissions from 8 major sectors for three decades (units: Tg).
3.3 Spatiotemporal changes of methane emissions
Table 6 shows the temporal changes in methane emissions from major sectors over the three decades from 1990 to 2020. Overall, methane emissions increased by 18.0 Tg from 1990 to 2020, with the energy sector, particularly coal exploitation, contributing to about 43 % of this increase. Additionally, emissions from waste sectors, which increased by 5.0 Tg over the 30 years, also played a significant role in the total rise. The decline in emissions from rice cultivation further highlights the significant impact of economic development on methane emissions. This decrease in rice cultivation emissions was particularly pronounced in southern China (Fig. 7), which benefited from the reform and opening-up policy, leading to higher GDP and more impervious surfaces. Spatially, northern and southern China exhibited contrasting trends. The overall increase in northern China, especially in provinces such as Xinjiang, Shanxi, Henan, Hebei, and Heilongjiang, was primarily driven by emissions from livestock, wastewater, energy exploitation, and biomass and biofuel burning.
Table 6Methane emission changes from 8 major sectors for three decades (units: Tg).
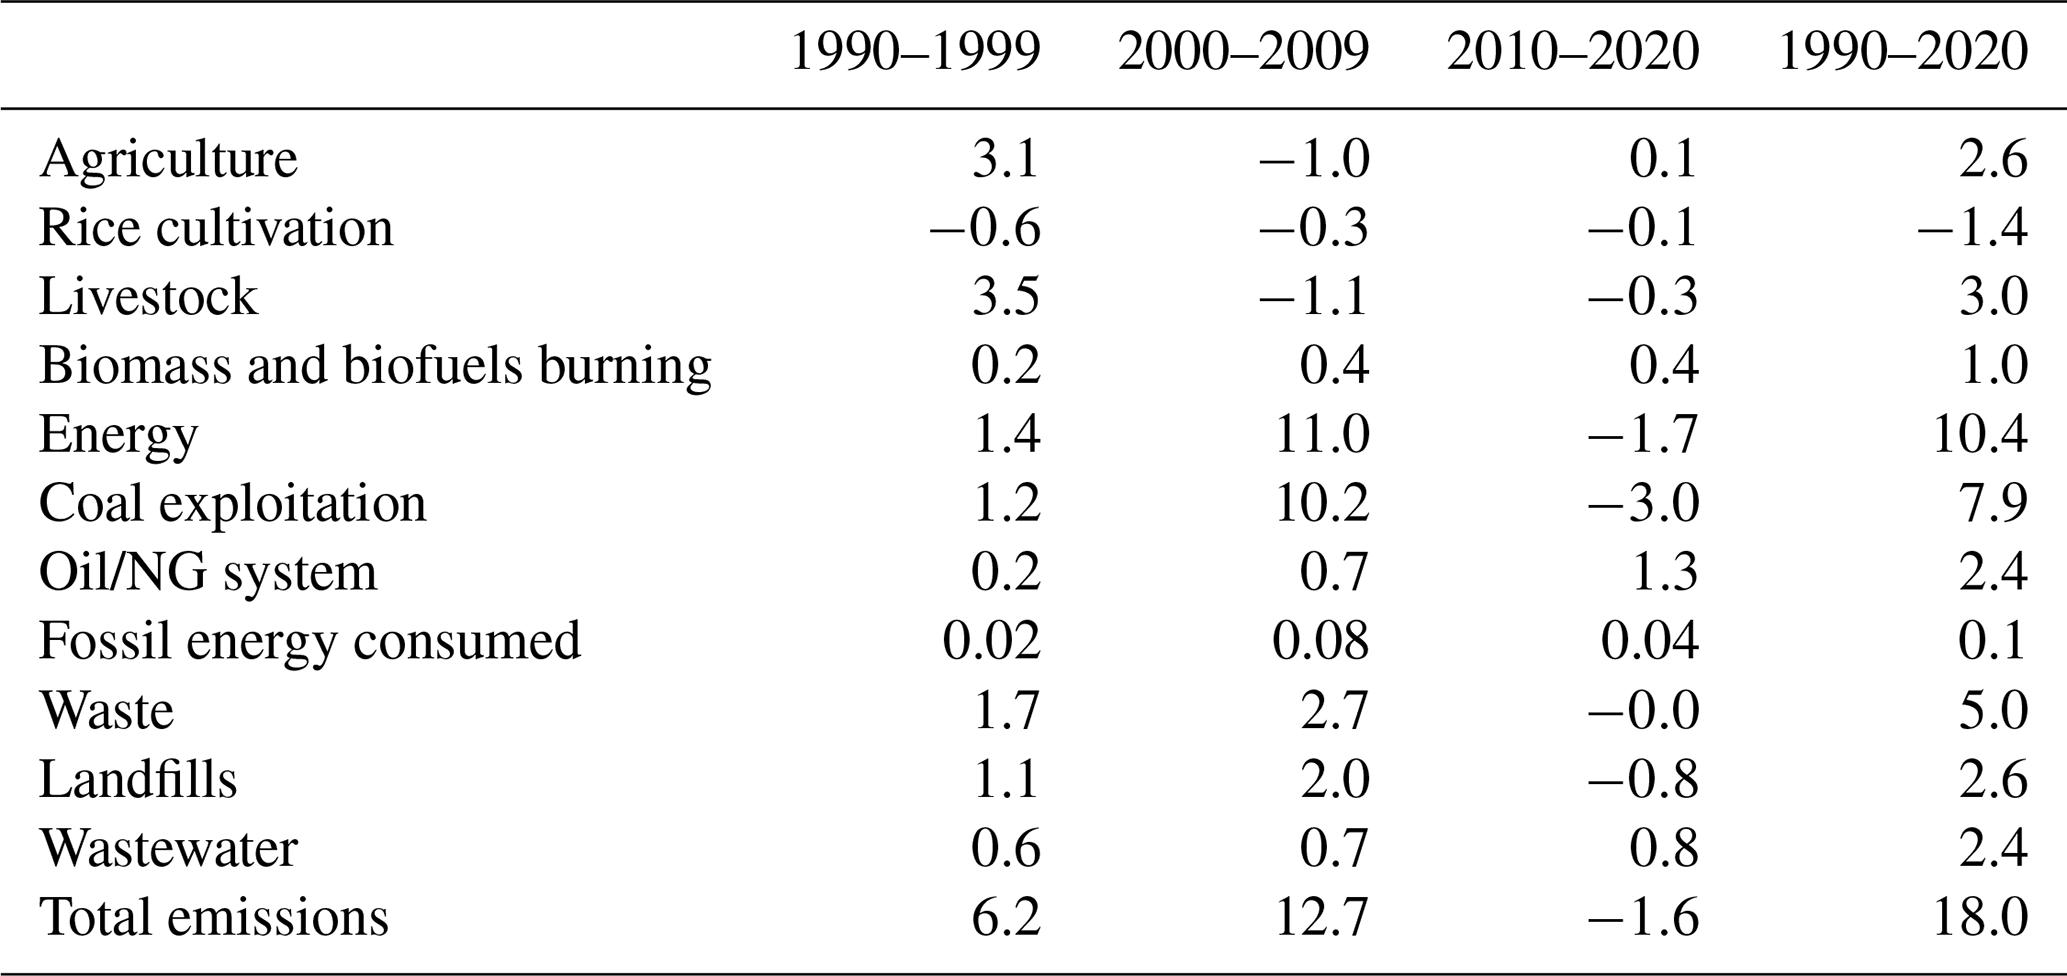
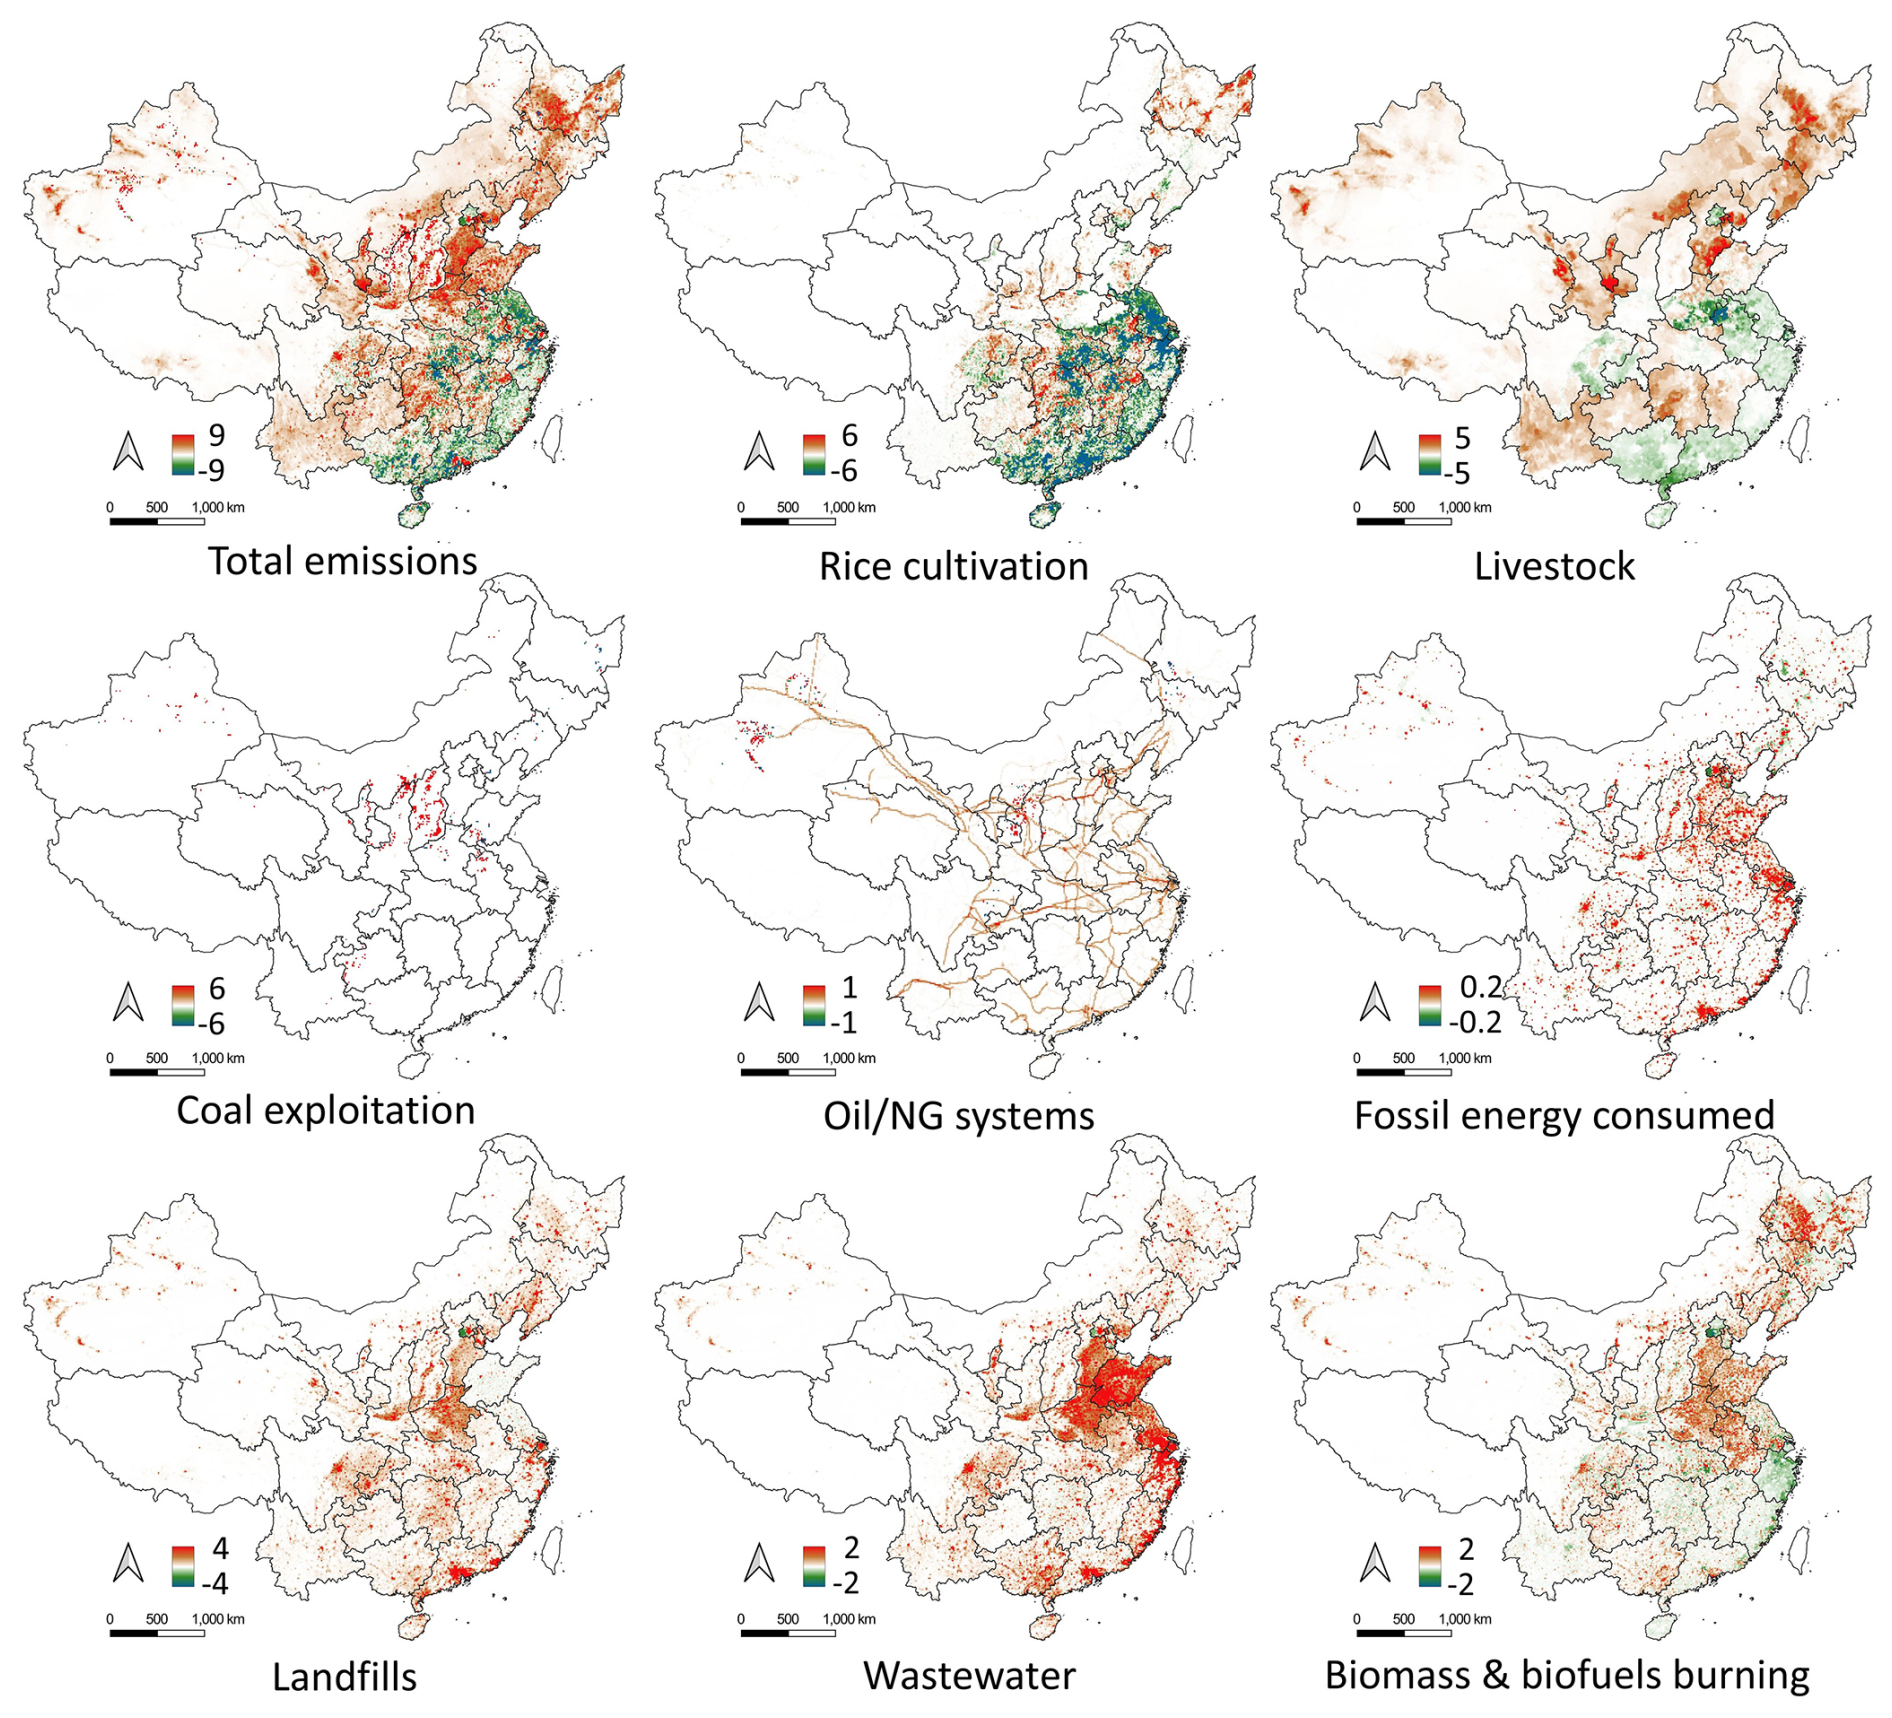
Figure 7Spatial changes of methane emissions from 1990 to 2020 (unit: Mg km−2).
Between 1990 and 2020, the decade from 2000 to 2009 saw the most significant increase in methane emissions, rising by over 12 Tg (Table 6), largely driven by the rapid economic development. During this period, the energy sectors, particularly coal exploitation, accounted for more than 85 % of the increase. In the following decade (2010–2020), under the new government and a series of methane abatement policies, including the Twelfth and Thirteenth Five-Year Plans for Controlling Greenhouse Gas Emissions and the China National Plan for Tackling Climate Change (2014–2020) (NDRC, 2014; State Council of China, 2011, 2016), total methane emissions began to decrease by more than 1.6 Tg. Most sectors met their methane reduction targets, with coal exploitation seeing the largest decrease – over 3 Tg. This was partly due to the consolidation of China's coal mining industry, where approximately 12 000 outdated mines were closed to improve workplace safety, enhance resource utilization, and reduce overcapacity (State Council of China, 2013; Liu et al., 2024).
3.4 Policy implications
CHN-CH4, as a high-resolution gridded methane emission inventory, provides a critical policy tool for guiding national, subnational, and sector-specific methane mitigation efforts. This dataset can potentially enhance emission tracking accuracy, inform policymakers, and facilitate international cooperation.
CHN-CH4 could be applied to support China's domestic efforts in methane mitigation and climate change governance. Given China's existing commitments for 2030 carbon emission peaking and 2060 carbon neutrality, even though the primary focus is on carbon, methane, with its high warming potential, remains a critical yet under-regulated area. The CHN-CH4 inventory provides granular emission data from 1990 to 2020, can enable the assessment of methane emission and enhance data transparency and improved reporting under national initiatives including the 14th Five Year Plan and the National Methane Action Plan. On the regional and subnational level, given China's vast regional disparities in methane emissions (explained in Fig. 6), there is no one-fits-all policy for economy-wide emission reduction. CHN-CH4 can enable regional-specific policy interventions by identifying emission hotspots and regions for more targeted mitigation measures, such us identifying high-emission provinces like Shanxi, Guizhou, Inner Mongolia for coal mining regulations, optimizing reduction strategies in livestock and rice cultivation in regions, and identifying urban centers with high emission from waste management to enhance policymaking around landfill and wastewater treatment efficiency. Furthermore, at the city level, CHN-CH4 can provide evidence for policymaking in urban areas to design more effective methane abatement programs.
Beyond domestic policy, this dataset can enhance China's role in global methane reduction efforts and international cooperation. For example, as a pillar in the 2023 US–China Sunnylands Statement, through enhanced emission tracking and transparency, China and the US can collaborate on effective methane mitigation. Potential integration between CHN-CH4 and other satellite-based methane monitoring can improve the MRV capacity and technique globally.
The CHN-CH4 inventory, derived from eight major sectors, still exhibits relatively high uncertainty. This uncertainty arises from the use of activity data, emission factors, and correction factors. Key sources of uncertainty include:
-
Data Sources and Consistency: the estimates rely on diverse data sources, including remote sensing products, statistical yearbooks, and existing datasets. Each of these sources comes with its own level of accuracy and consistency, which can vary significantly. This variability poses challenges for ensuring the comparability, completeness, and reliability of the CHN-CH4 inventory. Discrepancies in data collection methods, temporal and spatial resolution, and reporting standards across these sources can introduce uncertainties and potential biases in the emission estimates. Therefore, careful consideration and cross-validation of these data sources are essential to enhance the robustness and credibility of the CHN-CH4 inventory.
-
Data Filling Methods for Spatial and Temporal Gaps: the interpolation methods used to fill data gaps introduce additional limitations. Spatially, for instance, the activity data for landfills and wastewater lack detailed spatial proxies. Instead of using specific locational data, the distribution of GDP and population is employed for regression and prediction purposes, which may not accurately reflect the true spatial distribution of emissions. This reliance on indirect proxies can introduce significant uncertainties in the spatial allocation of emissions. For instance, our estimate of methane emissions from landfills in China for 2012 (4.2 Mt) differs from the 1.8 Mt reported by Cai et al. (2018), who estimated the emissions using the activity data from Chinese Ministry of Environmental Protection, provincial environmental protection bureaus and field investigations. This substantial difference suggests that conventional bottom-up approaches can systematically misestimate emissions compared to observational constraints. Temporally, addressing missing data can be even more challenging, as exemplified by livestock data, where global livestock density distributions from selected years and province-level data from various statistical yearbooks were used to fill gaps. This approach, while necessary, may not fully capture the dynamic changes in livestock populations over time and across different regions. It can lead to potential inaccuracies in the temporal trends of methane emissions.
-
Lack of Seasonality Consideration: CHN-CH4 currently focuses only on annual changes, which means it does not capture short-term variations that occur on a seasonal basis. This limitation can be significant, as methane emissions can fluctuate considerably throughout the year due to factors such as agricultural practices, temperature changes, and seasonal variations in industrial activities. For example, emissions from rice paddies, livestock, and waste management can vary seasonally, influenced by planting and harvesting cycles, livestock breeding patterns, and seasonal waste generation and treatment processes. Addressing this limitation would be valuable for future research.
-
Comprehensibility of methane emissions sectors: CHN-CH4 does not take the methane emissions from abandoned coal mines into consideration. Understanding its emissions and trends is critical for a low-carbon planet with more outdated mines closure. Current methodology still tends to use the default emissions factors, or the ratio of flooded or dry coal mines regionally/globally, which might bring large uncertainty. This sector warrants greater attention, particularly in developing spatially explicit mine status data and dynamic emission factors, given its substantial estimated emissions of 20.1 Tg annually from 2010–2019 (Gao et al., 2021). Existing literature also highlights the underestimation of AMM emissions in China, particularly as current bottom-up estimates often fail to account for their increasing trends (Liu et al., 2024). Additionally, the emissions from oil/NG systems were not further subdivided into upstream, midstream, and downstream processes, due to limited spatial information. However, more detailed estimates for this sector are important to identify key emission sources to targeted mitigation technologies, and enable tailored solutions rather than one-size-fits-all policies.
In the future, integrating high-resolution, high-accuracy remote sensing images with big data analysis offers promising solutions to address these limitations through providing detailed and accurate data for methane emission sources. Over the past five years, significant advancements in remote sensing products related to methane emissions have been achieved. Notable examples include the development of CCD-Rice for rice cultivation monitoring (Shen et al., 2025) and GLW for livestock detection (Gilbert et al., 2018; Ocholla et al., 2024). Additionally, Kolluru et al. (2023) developed a high-resolution (1 km) gridded livestock density database for horses and small ruminants (sheep and goats) in Kazakhstan for 2000–2019, using vegetation proxies, climatic, socioeconomic, topographic, and proximity variables through random forest regression modelling. This study demonstrated the potential of remote sensing technologies for mapping spatial distributions of activity data.
Another critical advantage of remote sensing is its ability to detect methane emission sources that are unregistered in administrative records or omitted from official statistics. This includes sources include closed coal mines, small-scale agricultural activities and other diffuse or poorly documented emission points. Remote sensing technologies, with their extensive spatial coverage and high resolution, can identify and quantify emissions from these overlooked sources, thereby providing a more comprehensive and accurate inventory. Additionally, companies like Google, Baidu, and Bing offer API services that can extract geocoded locations for point-source methane emissions, such as coal mines (Sheng et al., 2019). Utilizing these tools can significantly enhance methane emission inventories by filling data gaps and improving spatial accuracy.
The distribution maps of methane emissions in China (CHN-CH4) and its major eight sectors from 1990 to 2020 are publicly available at https://doi.org/10.5281/zenodo.15107383 (Guo et al., 2025). This website also published the reference inventories for comparison, coming from Behrendt et al. (2025), Bo-Feng et al. (2014), Cai et al. (2018), Chen (2021), Chen et al. (2022), Du et al. (2017, 2018), European Commission and Joint Research Centre (2023), Gao et al. (2021), Hoesly and Smith (2024, https://doi.org/10.5281/zenodo.10904361), Höglund-Isaksson et al. (2020), Li et al. (2023), Liu et al. (2024), Lu et al. (2021), Ma et al. (2015), Miller et al. (2019), Peng et al. (2016), PKU-CH4_v2 (2021, https://figshare.com/s/b38a368111749f1412be?file=28320369), Qu et al. (2021), Scarpelli et al. (2022), Sheng et al. (2019, 2021), Stavert et al. (2022), Sun et al. (2020), US Environmental Protection Agency (2019), Wang et al. (2021a, b, 2022), Worden et al. (2022), Xu et al. (2019), Yu et al. (2018), Zhang and Chen (2014), Zhang et al. (2021, 2022), Zhao et al. (2019), and Zhu et al. (2017). The product is provided in GeoTIFF format with a spatial reference system of Krasovsky_1940_Albers.
This study introduces CHN-CH4, a spatially aggregated 0.1°×0.1° anthropogenic methane emission inventory for mainland China annually, covering the period from 1990 to 2020. The inventory integrates long-term remote sensing data, multiple national statistical yearbooks, and methane emission datasets from international organizations. Emissions were estimated using recent regional and localized emission factors, along with IPCC default factors, across eight major sectors, covering the fields of agriculture, energy and waste. CHN-CH4 demonstrates strong consistency with reference inventories – top-down atmospheric observations and bottom-up estimates – at pixel, sectoral, regional, and national scales. This inventory enhances robust comparisons between estimated emissions and observed atmospheric data, improving the accuracy of inverse modelling. Furthermore, CHN-CH4 can complement global climate models such as the Global Change Assessment Model (GCAM) and the Community Earth System Model (CESM) to predict methane emission trends, assess potential climate impacts, and evaluate socioeconomic outcomes under different development and policy scenarios. Moving forward, CHN-CH4 can be further integrated into national reporting frameworks, climate modeling efforts, and even carbon market mechanisms to enhance data transparency and methane mitigation efforts. Additionally, it aims to increase public awareness of environmental and health implications and support effective tracking and policy-making for methane emission mitigation.
The supplement related to this article is available online at https://doi.org/10.5194/essd-17-4799-2025-supplement.
FD and YZ conceptualized the study. FG developed and implemented the computer code, performed the analysis, validation, and visualized the results, and wrote the manuscript. FG, FD, PG, and YZ edited and revised the manuscript.
The contact author has declared that none of the authors has any competing interests.
Publisher's note: Copernicus Publications remains neutral with regard to jurisdictional claims made in the text, published maps, institutional affiliations, or any other geographical representation in this paper. While Copernicus Publications makes every effort to include appropriate place names, the final responsibility lies with the authors. Also, please note that this paper has not received English language copy-editing. Views expressed in the text are those of the authors and do not necessarily reflect the views of the publisher.
This research was supported by the “Global Methane Hub” project and Research Grants Council – Strategic Topics Grant (grant no. STG2/P-705/24-R).
This paper was edited by Yuqiang Zhang and reviewed by two anonymous referees.
Behrendt, J., Smith, S. J., Yu, S., Chen, S., Zhang, H., Zhu, M., Williams, J., Cheng, X., Dule, A. A., Li, W., Cui, R., and Hultman, N.: United States and China Anthropogenic Methane Emissions: A Review of Uncertainties and Collaborative Opportunities, Earth's Future, 13, e2024EF005298, https://doi.org/10.1029/2024EF005298, 2025.
Bo-Feng, C., Jian-Guo, L., Qing-Xian, G., Xiao-Qin, N., Dong, C., Lan-Cui, L., Ying, Z., and Zhan-Sheng, Z.: Estimation of Methane Emissions from Municipal Solid Waste Landfills in China Based on Point Emission Sources, Adv. Clim. Change Res., 5, 81–91, https://doi.org/10.3724/SP.J.1248.2014.081, 2014.
Cai, B., Lou, Z., Wang, J., Geng, Y., Sarkis, J., Liu, J., and Gao, Q.: CH4 mitigation potentials from China landfills and related environmental co-benefits, Sci. Adv., 4, eaar8400, https://doi.org/10.1126/sciadv.aar8400, 2018.
China Climate Change Group: China Climate Change Country Study (CCCCS), Tsinghua University Press, Beijing, ISBN 9787302013525, 2000.
Chen, Z.: Temporospatial Analysis of methane trend in China over the last decade – Estimation of Anthropogenic Methane Emission and Contributions from Different Anthropogenic Sources, IOP Conf. Ser.: Earth Environ. Sci., 687, 012004, https://doi.org/10.1088/1755-1315/687/1/012004, 2021.
Chen, Z., Jacob, D. J., Nesser, H., Sulprizio, M. P., Lorente, A., Varon, D. J., Lu, X., Shen, L., Qu, Z., Penn, E., and Yu, X.: Methane emissions from China: a high-resolution inversion of TROPOMI satellite observations, Atmos. Chem. Phys., 22, 10809–10826, https://doi.org/10.5194/acp-22-10809-2022, 2022.
Du, M., Peng, C., Wang, X., Chen, H., Wang, M., and Zhu, Q.: Quantification of methane emissions from municipal solid waste landfills in China during the past decade, Renew. Sustain. Energ. Rev., 78, 272–279, https://doi.org/10.1016/j.rser.2017.04.082, 2017.
Du, M., Zhu, Q., Wang, X., Li, P., Yang, B., Chen, H., Wang, M., Zhou, X., and Peng, C.: Estimates and Predictions of Methane Emissions from Wastewater in China from 2000 to 2020, Earth's Future, 6, 252–263, https://doi.org/10.1002/2017EF000673, 2018.
Du, W.: Primary study on greenhouse gas–CH4 emission from MSW landfill, MSc thesis, Nanjing University of Information Science and Technology, Nanjing, 2006.
European Commission and Joint Research Centre: EDGAR (emissions database for global atmospheric research) community global greenhouse gas database (version 8.0). European Commission and Joint Research Centre, https://edgar.jrc.ec.europa.eu/dataset_ghg80#p1 (last access: 17 Ocotober 2024), 2023.
European Commission and United States of America: Global methane pledge, https://www.globalmethanepledge.org (last access: 17 September 2024), 2021.
Fu, C. and Yu, G.: Estimation and Spatiotemporal Analysis of Methane Emissions from Agriculture in China, Environ. Manage., 46, 618–632, https://doi.org/10.1007/s00267-010-9495-1, 2010.
Gao, J., Guan, C., Zhang, B., and Li, K.: Decreasing methane emissions from China's coal mining with rebounded coal production, Environ. Res. Lett., 16, 124037, https://doi.org/10.1088/1748-9326/ac38d8, 2021.
Gilbert, M., Nicolas, G., Cinardi, G., Van Boeckel, T. P., Vanwambeke, S. O., Wint, G. R. W., and Robinson, T. P.: Global distribution data for cattle, buffaloes, horses, sheep, goats, pigs, chickens and ducks in 2010, Sci. Data, 5, 180227, https://doi.org/10.1038/sdata.2018.227, 2018.
Gilbert, M., Cinardi, G., Da Re, D., Wint, G. R., Wisser, D., and Robinson, T. P.: Global buffaloes distribution in 2015 (5 minutes of arc), V1, Harvard Dataverse [data set], https://doi.org/10.7910/DVN/I1WCAB, 2022.
Gong, S. and Shi, Y.: Evaluation of comprehensive monthly-gridded methane emissions from natural and anthropogenic sources in China, Sci. Total Environ., 784, 147116, https://doi.org/10.1016/j.scitotenv.2021.147116, 2021.
Guo, F., Dai, F., Gong, P., and Zhou, Y.: CHN-CH4: A Gridded (0.1°×0.1°) Anthropogenic Methane Emission Inventory of China from 1990 to 2020, Zenodo [data set], https://doi.org/10.5281/zenodo.15107383, 2025.
Gütschow, J., Jeffery, M. L., Gieseke, R., Gebel, R., Stevens, D., Krapp, M., and Rocha, M.: The PRIMAP-hist national historical emissions time series, Earth Syst. Sci. Data, 8, 571–603, https://doi.org/10.5194/essd-8-571-2016, 2016.
Gütschow, J., Busch, D., and Pflüger, M.: The PRIMAP-hist national historical emissions time series v2.6 (1750–2023), Zenodo [data set], https://doi.org/10.5281/zenodo.13752654, 2024.
Hoesly, R. and Smith, S.: CEDS v_2024_04_01 release emission data (version v_2024_04_01), Zenodo [data set], https://doi.org/10.5281/zenodo.10904361, 2024.
Höglund-Isaksson, L., Gómez-Sanabria, A., Klimont, Z., Rafaj, P., and Schöpp, W.: Technical potentials and costs for reducing global anthropogenic methane emissions in the 2050 timeframe – results from the GAINS model, Environ. Res. Commun., 2, 025004, https://doi.org/10.1088/2515-7620/ab7457, 2020.
Huang, X., Li, J., Yang, J., Zhang, Z., Li, D., and Liu, X.: 30 m global impervious surface area dynamics and urban expansion pattern observed by Landsat satellites: From 1972 to 2019, Sci. China Earth Sci., 64, 1922–1933, https://doi.org/10.1007/s11430-020-9797-9, 2021.
IEA: World Energy Statistics 2019 Edition, Database Documentation, http://wds.iea.org/wds/pdf/WORLDBES_Documentation.pdf (last access: 17 September 2024), 2019.
IPCC – Intergovernmental Panel on Climate Change: 2006 IPCC guidelines for national greenhouse gas inventories, IGES, Japan, https://www.ipcc.ch/report/2006-ipcc-guidelines-for-national-greenhouse-gas-inventories/ (last access: 18 September 2024), 2006.
IPCC – Intergovernmental Panel on Climate Change: Climate Change 2013: The Physical Science Basis, in: Contribution of Working Group I to the Fifth Assessment Report of the Intergovernmental Panel on Climate Change, Cambridge University Press, Cambridge, UK, https://www.ipcc.ch/report/ar5/wg1/ (last access: 18 September 2024), 2013.
IPCC – Intergovernmental Panel on Climate Change: 2019 Refinement to the 2006 IPCC guidelines for national greenhouse gas inventories, Agricult. Forest. Other Land Use, 4, 824, 2019.
Khalil, M. A. K., Shearer, M. J., and Rasmussen, R. A.: Methane sources in China: historical and current emissions, Chemosphere, 26, 127–142, https://doi.org/10.1016/0045-6535(93)90417-4, 1993.
Kirschke, S., Bousquet, P., Ciais, P., Saunois, M., Canadell, J. G., Dlugokencky, E. J., Bergamaschi, P., Bergmann, D., Blake, D. R., Bruhwiler, L., Cameron-Smith, P., Castaldi, S., Chevallier, F., Feng, L., Fraser, A., Heimann, M., Hodson, E. L., Houweling, S., Josse, B., Fraser, P. J., Krummel, P. B., Lamarque, J.-F., Langenfelds, R. L., Le Quéré, C., Naik, V., O'Doherty, S., Palmer, P. I., Pison, I., Plummer, D., Poulter, B., Prinn, R. G., Rigby, M., Ringeval, B., Santini, M., Schmidt, M., Shindell, D. T., Simpson, I. J., Spahni, R., Steele, L. P., Strode, S. A., Sudo, K., Szopa, S., Van Der Werf, G. R., Voulgarakis, A., Van Weele, M., Weiss, R. F., Williams, J. E., and Zeng, G.: Three decades of global methane sources and sinks, Nat. Geosci., 6, 813–823, https://doi.org/10.1038/ngeo1955, 2013.
Kolluru, V., John, R., Saraf, S., Chen, J., Hankerson, B., Robinson, S., Kussainova, M., and Jain, K.: Gridded livestock density database and spatial trends for Kazakhstan, Sci. Data, 10, 839, https://doi.org/10.1038/s41597-023-02736-5, 2023.
Li, S., Wang, C., Gao, P., Zhao, B., Jin, C., Zhao, L., He, B., and Xue, Y.: High-Spatial-Resolution Methane Emissions Calculation Using TROPOMI Data by a Divergence Method, Atmosphere, 14, 388, https://doi.org/10.3390/atmos14020388, 2023.
Lin, X., Zhang, W., Crippa, M., Peng, S., Han, P., Zeng, N., Yu, L., and Wang, G.: A comparative study of anthropogenic CH4 emissions over China based on the ensembles of bottom-up inventories, Earth Syst. Sci. Data, 13, 1073–1088, https://doi.org/10.5194/essd-13-1073-2021, 2021.
Liu, Q., Teng, F., Nielsen, C. P., Zhang, Y., and Wu, L.: Large methane mitigation potential through prioritized closure of gas-rich coal mines, Nat. Clim. Change, 14, 652–658, https://doi.org/10.1038/s41558-024-02004-3, 2024.
Lu, X., Jacob, D. J., Zhang, Y., Maasakkers, J. D., Sulprizio, M. P., Shen, L., Qu, Z., Scarpelli, T. R., Nesser, H., Yantosca, R. M., Sheng, J., Andrews, A., Parker, R. J., Boesch, H., Bloom, A. A., and Ma, S.: Global methane budget and trend, 2010–2017: complementarity of inverse analyses using in situ (GLOBALVIEWplus CH4 ObsPack) and satellite (GOSAT) observations, Atmos. Chem. Phys., 21, 4637–4657, https://doi.org/10.5194/acp-21-4637-2021, 2021.
Ma, Z., and Gao, Q. X.: Guidelines for calculating GHG emissions of waste disposal, Science Press, Beijing, ISBN 978-7-03-032009-4, 2011.
Ma, Z.-Y., Feng, P., Gao, Q.-X., Lu, Y.-N., Liu, J.-R., and Li, W.-T.: CH4 emissions and reduction potential in wastewater treatment in China, Adv. Clim. Change Res., 6, 216–224, https://doi.org/10.1016/j.accre.2015.11.006, 2015.
Maasakkers, J. D., McDuffie, E. E., Sulprizio, M. P., Chen, C., Schultz, M., Brunelle, L., Thrush, R., Steller, J., Sherry, C., Jacob, D. J., Jeong, S., Irving, B., and Weitz, M.: A Gridded Inventory of Annual 2012–2018 U.S. Anthropogenic Methane Emissions, Environ. Sci. Technol., 57, 16276–16288, https://doi.org/10.1021/acs.est.3c05138, 2023.
Miller, S. M., Michalak, A. M., Detmers, R. G., Hasekamp, O. P., Bruhwiler, L. M. P., and Schwietzke, S.: China's coal mine methane regulations have not curbed growing emissions, Nat. Commun., 10, 303, https://doi.org/10.1038/s41467-018-07891-7, 2019.
Ministry of Ecology and Environment of China: National Methane Action Plan, https://www.mee.gov.cn/xxgk2018/xxgk/xxgk03/202311/W020231107750707766959.pdf (last access: 24 September 2024), 2023.
NDRC – The National Development and Reform Commission: The People's Republic of China national Greenhouse gas inventory, 2014, China Environmental Press, Beijing, https://www.mee.gov.cn/ywgz/ydqhbh/wsqtkz/201904/P020240704447132863172.pdf (last access: 24 September 2024), 2014.
Ocholla, I. A., Pellikka, P., Karanja, F. N., Vuorinne, I., Odipo, V., and Heiskanen, J.: Livestock detection in African rangelands: Potential of high-resolution remote sensing data, Remote Sens. Appl., 33, 101139, https://doi.org/10.1016/j.rsase.2024.101139, 2024.
Peng, S., Piao, S., Bousquet, P., Ciais, P., Li, B., Lin, X., Tao, S., Wang, Z., Zhang, Y., and Zhou, F.: Inventory of anthropogenic methane emissions in mainland China from 1980 to 2010, Atmos. Chem. Phys., 16, 14545–14562, https://doi.org/10.5194/acp-16-14545-2016, 2016.
PKU-CH4_v2: PKU-CH4_2, figshare [data set], https://figshare.com/s/b38a368111749f1412be?file=28320369 (last access: 18 September 2024), 2021.
Qiu, B., Hu, X., Chen, C., Tang, Z., Yang, P., Zhu, X., Yan, C., and Jian, Z.: Maps of cropping patterns in China during 2015–2021, Sci. Data, 9, 479, https://doi.org/10.1038/s41597-022-01589-8, 2022.
Qu, Z., Jacob, D. J., Shen, L., Lu, X., Zhang, Y., Scarpelli, T. R., Nesser, H., Sulprizio, M. P., Maasakkers, J. D., Bloom, A. A., Worden, J. R., Parker, R. J., and Delgado, A. L.: Global distribution of methane emissions: a comparative inverse analysis of observations from the TROPOMI and GOSAT satellite instruments, Atmos. Chem. Phys., 21, 14159–14175, https://doi.org/10.5194/acp-21-14159-2021, 2021.
Saunois, M., Stavert, A. R., Poulter, B., Bousquet, P., Canadell, J. G., Jackson, R. B., Raymond, P. A., Dlugokencky, E. J., Houweling, S., Patra, P. K., Ciais, P., Arora, V. K., Bastviken, D., Bergamaschi, P., Blake, D. R., Brailsford, G., Bruhwiler, L., Carlson, K. M., Carrol, M., Castaldi, S., Chandra, N., Crevoisier, C., Crill, P. M., Covey, K., Curry, C. L., Etiope, G., Frankenberg, C., Gedney, N., Hegglin, M. I., Höglund-Isaksson, L., Hugelius, G., Ishizawa, M., Ito, A., Janssens-Maenhout, G., Jensen, K. M., Joos, F., Kleinen, T., Krummel, P. B., Langenfelds, R. L., Laruelle, G. G., Liu, L., Machida, T., Maksyutov, S., McDonald, K. C., McNorton, J., Miller, P. A., Melton, J. R., Morino, I., Müller, J., Murguia-Flores, F., Naik, V., Niwa, Y., Noce, S., O'Doherty, S., Parker, R. J., Peng, C., Peng, S., Peters, G. P., Prigent, C., Prinn, R., Ramonet, M., Regnier, P., Riley, W. J., Rosentreter, J. A., Segers, A., Simpson, I. J., Shi, H., Smith, S. J., Steele, L. P., Thornton, B. F., Tian, H., Tohjima, Y., Tubiello, F. N., Tsuruta, A., Viovy, N., Voulgarakis, A., Weber, T. S., Van Weele, M., Van Der Werf, G. R., Weiss, R. F., Worthy, D., Wunch, D., Yin, Y., Yoshida, Y., Zhang, W., Zhang, Z., Zhao, Y., Zheng, B., Zhu, Q., Zhu, Q., and Zhuang, Q.: The Global Methane Budget 2000–2017, Earth Syst. Sci. Data, 12, 1561–1623, https://doi.org/10.5194/essd-12-1561-2020, 2020.
Saunois, M., Martinez, A., Poulter, B., Zhang, Z., Raymond, P., Regnier, P., Canadell, J. G., Jackson, R. B., Patra, P. K., Bousquet, P., Ciais, P., Dlugokencky, E. J., Lan, X., Allen, G. H., Bastviken, D., Beerling, D. J., Belikov, D. A., Blake, D. R., Castaldi, S., Crippa, M., Deemer, B. R., Dennison, F., Etiope, G., Gedney, N., Höglund-Isaksson, L., Holgerson, M. A., Hopcroft, P. O., Hugelius, G., Ito, A., Jain, A. K., Janardanan, R., Johnson, M. S., Kleinen, T., Krummel, P., Lauerwald, R., Li, T., Liu, X., McDonald, K. C., Melton, J. R., Mühle, J., Müller, J., Murguia-Flores, F., Niwa, Y., Noce, S., Pan, S., Parker, R. J., Peng, C., Ramonet, M., Riley, W. J., Rocher-Ros, G., Rosentreter, J. A., Sasakawa, M., Segers, A., Smith, S. J., Stanley, E. H., Thanwerdas, J., Tian, H., Tsuruta, A., Tubiello, F. N., Weber, T. S., Van Der Werf, G., Worthy, D. E., Xi, Y., Yoshida, Y., Zhang, W., Zheng, B., Zhu, Q., Zhu, Q., and Zhuang, Q.: Global Methane Budget 2000–2020, Earth Syst. Sci. Data, 17, 1873–1958, https://doi.org/10.5194/essd-17-1873-2025, 2025.
Scarpelli, T. R., Jacob, D. J., Grossman, S., Lu, X., Qu, Z., Sulprizio, M. P., Zhang, Y., Reuland, F., Gordon, D., and Worden, J. R.: Updated Global Fuel Exploitation Inventory (GFEI) for methane emissions from the oil, gas, and coal sectors: evaluation with inversions of atmospheric methane observations, Atmos. Chem. Phys., 22, 3235–3249, https://doi.org/10.5194/acp-22-3235-2022, 2022.
Schwietzke, S., Griffin, W. M., Matthews, H. S., and Bruhwiler, L. M. P.: Global Bottom-Up Fossil Fuel Fugitive Methane and Ethane Emissions Inventory for Atmospheric Modeling, ACS Sustain. Chem. Eng., 2, 1992–2001, https://doi.org/10.1021/sc500163h, 2014.
Shen, L., Jacob, D. J., Gautam, R., Omara, M., Scarpelli, T. R., Lorente, A., Zavala-Araiza, D., Lu, X., Chen, Z., and Lin, J.: National quantifications of methane emissions from fuel exploitation using high resolution inversions of satellite observations, Nat. Commun., 14, 4948, https://doi.org/10.1038/s41467-023-40671-6, 2023.
Shen, R., Peng, Q., Li, X., Chen, X., and Yuan, W.: CCD-Rice: a long-term paddy rice distribution dataset in China at 30 m resolution, Earth Syst. Sci. Data, 17, 2193–2216, https://doi.org/10.5194/essd-17-2193-2025, 2025.
Sheng, J., Song, S., Zhang, Y., Prinn, R. G., and Janssens-Maenhout, G.: Bottom-Up Estimates of Coal Mine Methane Emissions in China: A Gridded Inventory, Emission Factors, and Trends, Environ. Sci. Technol. Lett., 6, 473–478, https://doi.org/10.1021/acs.estlett.9b00294, 2019.
Sheng, J., Tunnicliffe, R., Ganesan, A. L., Maasakkers, J. D., Shen, L., Prinn, R. G., Song, S., Zhang, Y., Scarpelli, T., Anthony Bloom, A., Rigby, M., Manning, A. J., Parker, R. J., Boesch, H., Lan, X., Zhang, B., Zhuang, M., and Lu, X.: Sustained methane emissions from China after 2012 despite declining coal production and rice-cultivated area, Environ. Res. Lett., 16, 104018, https://doi.org/10.1088/1748-9326/ac24d1, 2021.
Sheng, J.-X., Jacob, D. J., Maasakkers, J. D., Sulprizio, M. P., Zavala-Araiza, D., and Hamburg, S. P.: A high-resolution (0.1°×0.1°) inventory of methane emissions from Canadian and Mexican oil and gas systems, Atmos. Environ., 158, 211–215, https://doi.org/10.1016/j.atmosenv.2017.02.036, 2017.
Song, L. L.: Primary study on methane emission from domestic wastewater, MSc thesis, Nanjing University of Information Science and Technology, Nanjing, 2011.
State Council of China: The Twelfth Five-Year Plan for Controlling Greenhouse Gas Emissions, http://www.gov.cn/zwgk/2012-01/13/content_2043645.htm (last access: 24 September 2024), 2011.
State Council of China: Opinions of The General Office of the State Council on promoting the smooth operation of the coal industry, http://www.gov.cn/zhengce/content/2013-11/27/content_2532.htm (last access: 24 September 2024), 2013.
State Council of China: The Thirteenth Five-Year Plan for Controlling Greenhouse Gas Emissions, http://sthj.gansu.gov.cn/sthj/c114861/201909/9f2c11a838a343159e196ec577dce861/files/91277859ddb44ae4be042c91fe9af14a.pdf (last access: 24 September 2024), 2016.
State Council of China: The 14th Five-Year Plan, https://www.gov.cn/xinwen/2021-03/13/content_5592681.htm (last access: 24 September 2024), 2021.
Stavert, A. R., Saunois, M., Canadell, J. G., Poulter, B., Jackson, R. B., Regnier, P., Lauerwald, R., Raymond, P. A., Allen, G. H., Patra, P. K., Bergamaschi, P., Bousquet, P., Chandra, N., Ciais, P., Gustafson, A., Ishizawa, M., Ito, A., Kleinen, T., Maksyutov, S., McNorton, J., Melton, J. R., Müller, J., Niwa, Y., Peng, S., Riley, W. J., Segers, A., Tian, H., Tsuruta, A., Yin, Y., Zhang, Z., Zheng, B., and Zhuang, Q.: Regional trends and drivers of the global methane budget, Global Change Biol., 28, 182–200, https://doi.org/10.1111/gcb.15901, 2022.
Sun, J., Wang, M., Xu, X., Cheng, K., Yue, Q., and Pan, G.: Re-estimating methane emissions from Chinese paddy fields based on a regional empirical model and high-spatial-resolution data, Environ. Pollut., 265, 115017, hhttps://doi.org/10.1016/j.envpol.2020.115017, 2020.
Tian, H., Zhao, D., and Wang, Y.: Emission inventories of atmospheric pollutants discharged from biomass burning in China, Acta Scientiae Circumstantiae, 31, 349-357, 2010.
UNFCCC: Greenhouse Gas Inventory Data Interface, http://di.unfccc.int/detailed_data_by_party (last access: 24 August 2022), 2020.
US Environmental Protection Agency: Global non-CO2 greenhouse gas emission projections & mitigation 2015–2050, https://www.epa.gov/sites/default/files/2019-09/documents/epa_non-co2_greenhouse_gases_rpt-epa430r19010.pdf (last access: 24 September 2024), 2019.
Wang, C. and Wang, J.: Kilometer grid dataset of China's historical population spatial distribution (1990–2015), National Tibetan Plateau/Third Pole Environment Data Center [data set], https://doi.org/10.12078/2017121101, 2022a.
Wang, C. and Wang, J.: Kilometer grid dataset of China's historical GDP spatial distribution (1990–2015), National Tibetan Plateau/Third Pole Environment Data Center [data set], https://doi.org/10.12078/2017121102, 2022b.
Wang, D., Ye, W., Wu, G., Li, R., Guan, Y., Zhang, W., Wang, J., Shan, Y., and Hubacek, K.: Greenhouse gas emissions from municipal wastewater treatment facilities in China from 2006 to 2019, Sci. Data, 9, 317, https://doi.org/10.1038/s41597-022-01439-7, 2022.
Wang, F., Maksyutov, S., Janardanan, R., Tsuruta, A., Ito, A., Morino, I., Yoshida, Y., Tohjima, Y., Kaiser, J. W., Janssens-Maenhout, G., Lan, X., Mammarella, I., Lavric, J. V., and Matsunaga, T.: Interannual variability on methane emissions in monsoon Asia derived from GOSAT and surface observations, Environ. Res. Lett., 16, 024040, https://doi.org/10.1088/1748-9326/abd352, 2021a.
Wang, K., Zhang, J., Cai, B., and Liang, S.: Estimation of Chinese city-level anthropogenic methane emissions in 2015, Resour. Conserv. Recycl., 175, 105861, https://doi.org/10.1016/j.resconrec.2021.105861, 2021b.
Worden, J. R., Cusworth, D. H., Qu, Z., Yin, Y., Zhang, Y., Bloom, A. A., Ma, S., Byrne, B. K., Scarpelli, T., Maasakkers, J. D., Crisp, D., Duren, R., and Jacob, D. J.: The 2019 methane budget and uncertainties at 1° resolution and each country through Bayesian integration Of GOSAT total column methane data and a priori inventory estimates, Atmos. Chem. Phys., 22, 6811–6841, https://doi.org/10.5194/acp-22-6811-2022, 2022.
Xu, P., Liao, Y., Zheng, Y., Zhao, C., Zhang, X., Zheng, Z., and Luan, S.: Northward shift of historical methane emission hotspots from the livestock sector in China and assessment of potential mitigation options, Agr. Forest Meteorol., 272–273, 1–11, https://doi.org/10.1016/j.agrformet.2019.03.022, 2019.
Yamaji, K., Ohara, T., and Akimoto, H.: A country-specific, high-resolution emission inventory for methane from livestock in Asia in 2000, Atmos. Environ., 37, 4393–4406, https://doi.org/10.1016/S1352-2310(03)00586-7, 2003.
Yan, X., Ohara, T., and Akimoto, H.: Development of region-specific emission factors and estimation of methane emission from rice fields in the East, Southeast and South Asian countries, Global Change Biol., 9, 237–254, https://doi.org/10.1046/j.1365-2486.2003.00564.x, 2003.
Yu, J., Peng, S., Chang, J., Ciais, P., Dumas, P., Lin, X., and Piao, S.: Inventory of methane emissions from livestock in China from 1980 to 2013, Atmos. Environ., 184, 69–76, https://doi.org/10.1016/j.atmosenv.2018.04.029, 2018.
Zhang, B. and Chen, G. Q.: Methane emissions by Chinese economy: Inventory and embodiment analysis, Energy Policy, 38, 4304–4316, https://doi.org/10.1016/j.enpol.2010.03.059, 2010.
Zhang, B. and Chen, G. Q.: Methane emissions in China 2007, Renew. Sustain. Energ. Rev., 30, 886–902, https://doi.org/10.1016/j.rser.2013.11.033, 2014.
Zhang, H., Ye, X., Cheng, T., Chen, J., Yang, X., Wang, L., and Zhang, R.: A laboratory study of agricultural crop residue combustion in China: Emission factors and emission inventory, Atmos. Environ., 42, 8432–8441, https://doi.org/10.1016/j.atmosenv.2008.08.015, 2008.
Zhang, J., Smith, K. R., Ma, Y., Ye, S., Jiang, F., Qi, W., Liu, P., Khalil, M. A. K., Rasmussen, R. A., and Thorneloe, S. A.: Greenhouse gases and other airborne pollutants from household stoves in China: a database for emission factors, Atmos. Environ., 34, 4537–4549, https://doi.org/10.1016/S1352-2310(99)00450-1, 2000.
Zhang, Y., Jacob, D. J., Lu, X., Maasakkers, J. D., Scarpelli, T. R., Sheng, J.-X., Shen, L., Qu, Z., Sulprizio, M. P., Chang, J., Bloom, A. A., Ma, S., Worden, J., Parker, R. J., and Boesch, H.: Attribution of the accelerating increase in atmospheric methane during 2010–2018 by inverse analysis of GOSAT observations, Atmos. Chem. Phys., 21, 3643–3666, https://doi.org/10.5194/acp-21-3643-2021, 2021.
Zhang, Y., Fang, S., Chen, J., Lin, Y., Chen, Y., Liang, R., Jiang, K., Parker, R. J., Boesch, H., Steinbacher, M., Sheng, J.-X., Lu, X., Song, S., and Peng, S.: Observed changes in China's methane emissions linked to policy drivers, P. Natl. Acad. Sci. USA, 119, e2202742119, https://doi.org/10.1073/pnas.2202742119, 2022.
Zhao, N., Liu, Y., Cao, G., Samson, E. L., and Zhang, J.: Forecasting China's GDP at the pixel level using nighttime lights time series and population images, GISci. Remote Sens., 54, 407–425, https://doi.org/10.1080/15481603.2016.1276705, 2017.
Zhao, X., Jin, X. K., Guo, W., Zhang, C., Shan, Y. L., Du, M. X., Tillotson, M. R., Yang, H., Liao, X. W., and Li, Y. P.: China's Urban Methane Emissions From Municipal Wastewater Treatment Plant, Earth's Future, 7, 480–490, https://doi.org/10.1029/2018EF001113, 2019.
Zheng, S., Wang, Y., and Wang, Z.: Methane emissions to atmosphere from coal mine in China, Saf. Coal Mines, 36, 29-33, 2005.
Zhou, J. B., Jiang, M. M., and Chen, G. Q.: Estimation of methane and nitrous oxide emission from livestock and poultry in China during 1949–2003, Energy Policy, 35, 3759–3767, https://doi.org/10.1016/j.enpol.2007.01.013, 2007.
Zhu, T., Bian, W., Zhang, S., Di, P., and Nie, B.: An Improved Approach to Estimate Methane Emissions from Coal Mining in China, Environ. Sci. Technol., 51, 12072–12080, https://doi.org/10.1021/acs.est.7b01857, 2017.