the Creative Commons Attribution 4.0 License.
the Creative Commons Attribution 4.0 License.
 | 04 Aug 2025
Global high-resolution fire-sourced PM2.5 concentrations for 2000–2023
Yonghang Hu
Chenguang Tian
Yadong Lei
Yang Cao
Rongbin Xu
Yuming Guo
Fires are a significant disturbance in Earth's systems. Smoke aerosols emitted from fires can cause environmental degradation and climatic perturbations, leading to exacerbated air pollution and posing hazards to public health. However, research on the climatic and health impacts of fire emissions is severely limited by the scarcity of air pollution data directly attributed to these emissions. Here, we develop a global daily fire-sourced PM2.5 concentration ([PM2.5]) dataset at a spatial resolution of 0.25° for the period 2000–2023, using the GEOS-Chem chemical transport model driven with two fire emission inventories, the Global Fire Emissions Database version 4.1 with small fires (GFED4.1s) and the Quick Fire Emission Dataset version 2.5r1 (QFED2.5). Simulated all-source [PM2.5] is bias-corrected using a machine learning algorithm, which incorporates ground observations from over 9000 monitoring sites worldwide. Then the simulated ratios between fire-sourced and all-source [PM2.5] at individual grids are applied to derive fire-sourced [PM2.5]. Globally, the average fire-sourced [PM2.5] is estimated to be 2.04 µg m−3 with GFED4.1s and 3.96 µg m−3 with QFED2.5. Both datasets show consistent spatial distributions with regional hotspots in central Africa and widespread decreasing trends over most areas. While the mean levels of fire-sourced [PM2.5] are much higher at low latitudes, fire episodes in the boreal regions can cause PM2.5 levels that are comparable to those of the tropics. This dataset, available at https://doi.org/10.5281/zenodo.15493914 (Hu et al., 2025a) and https://doi.org/10.5281/zenodo.15496596 (Hu et al., 2025b), serves as a valuable tool for exploring the impacts of fire-related air pollutants on climate, ecosystems, and public health, enabling accurate assessments and support for decision-making in environmental management and policy.
- Article
(8254 KB) - Full-text XML
-
Supplement
(3408 KB) - BibTeX
- EndNote


Atmospheric particulate matter, typically PM2.5 with aerodynamic diameters less than 2.5 µm, has significant impacts on air quality, the climate system, and public health (Gu et al., 2021; Salana et al., 2024; Xie et al., 2024). These fine particles originate from a variety of sources, of which biomass burning from both natural wildfires and anthropogenic activities makes substantial contributions (Burke et al., 2023; Atuyambe et al., 2024; Connolly et al., 2024). Exposure to elevated fire PM2.5 has been observed to increase mortality rates for various diseases, particularly cardiovascular and respiratory ailments (Chen et al., 2021). Additionally, the increased temperatures associated with wildfire emissions promote the likelihood of adverse health effects (Xu et al., 2020). Furthermore, the heterogenous distribution of fire PM2.5 concentrations ([PM2.5]) causes much higher population exposure for low-income countries (Xu et al., 2023). Over the past few decades, the frequency and magnitude of wildfire occurrences have escalated due to climate change and extreme weather events (Ward et al., 2012; Zhu et al., 2021; Melia et al., 2022; Hu et al., 2024). Hence, a comprehensive examination of the trends and influencing factors related to fire PM2.5 is important for the development of effective environmental protection and health policies.
Currently, two principal approaches are used to estimate fire-sourced [PM2.5] at large scales (Yue et al., 2024). The first method derives the changes in air pollutants before and after specific fire events using observational records. For example, Roberts and Wooster (2021) used the Copernicus Atmosphere Monitoring Service, a system integrating remote sensing and ground-based observations, to estimate that fire air pollutants result in approximately 750 000 deaths annually worldwide, with the highest mortality rates observed in Asia and Africa. Burke et al. (2023) utilized both surface and spaceborne PM2.5 measurements (from 2000 to 2022) and found that wildfire smoke has stabilized or even reversed the decreasing trends of [PM2.5] in most US states since 2016. Notably, these fire-induced increases are expected to remain unregulated as the climate continues to warm. In addition to station and satellite observations, numerical modeling is a valuable tool for assessing [PM2.5] from fire emissions. For instance, Chen et al. (2021) employed the GEOS-Chem model to estimate daily [PM2.5] attributable to wildfires and revealed that short-term exposure to fire PM2.5 increases mortality risks, especially all-cause, cardiovascular, and respiratory deaths. Zhang et al. (2023) utilized an advanced model to assess daily [PM2.5] originating from both fire and non-fire sources across various regions of the USA. Their findings showed that fire smokes accounted for over 25 % of the daily PM2.5 levels recorded in the Air Quality System of the Environmental Protection Agency (EPA) from 2007 to 2018, deteriorating US air quality, particularly along the Pacific coast and in the southeast.
However, there are considerable discrepancies in modeled concentrations of wildfire pollutants due to variations in physicochemical processes, model resolutions, and meteorological forcings (Wolke et al., 2012; Markakis et al., 2015). Moreover, differences in fire emission inventories can significantly influence the assessment of fire air pollutants. For example, Desservettaz et al. (2022) used the chemical transport model (CTM) GEOS-Chem and revealed that the Global Fire Emissions Database version 4 with small fires (GFED4s) outperformed other fire inventories in Australia. On the global scale, Pan et al. (2020) used six fire emission inventories to drive the GEOS-Chem model and found that simulations using the Quick Fire Emission Dataset (QFED) version 2.4 yielded the closest estimate of aerosol optical depth compared to both site-level and satellite-based observations during fire seasons. These studies revealed certain discrepancies between fire inventories and suggested a need for comparison between these inventories to improve the accuracy of predicted fire air pollutants.
Due to inherent limitations in the CTMs and inventories, there has been a growing utilization of machine learning algorithms in recent years. These algorithms have proven effective at reducing biases in model simulations, particularly in regional analysis and prediction of wildfire pollutant concentrations. For instance, Wei et al. (2019) developed a space–time random forest (RF) algorithm that integrated satellite data, ground observations, and model outputs to estimate daily PM2.5 and black carbon concentrations at 1 km resolution across the US during 2000–2020. At the global scale, Xu et al. (2023) used the RF algorithm to bias-correct the GEOS-Chem output so as to assess the global daily [PM2.5] generated from wildfires during 2001–2019. They improved the determination coefficient of simulated PM2.5 from 0.22 of the original GEOS-Chem model to 0.75 with the RF adjustment. Their analyses showed that approximately 2.18 billion people experienced at least 1 d of severe pollution per year due to fire-emitted PM2.5, with an average exposure of 9.9 d per person each year. However, due to the high computational cost, most CTM simulations have been performed at the regional scale or driven with a single fire inventory, limiting the ability of machine learning methods to accurately constrain fire-related air pollutants at global and long-term scales.
In this study, the GEOS-Chem model was employed to create two global datasets of fire-sourced [PM2.5] corresponding to the GFED4.1s and QFED2.5 emission inventories. These model datasets were refined using the eXtreme Gradient Boosting (XGBoost) machine learning approach in combination with abundant in situ measurements from thousands of monitoring stations. Subsequently, two sets of daily fire PM2.5 data were generated with temporal coverage from 2000 to 2023 and a fine spatial resolution of 0.25°×0.25°. We aim to systematically compare [PM2.5] across different regions, specifically focusing on the variations in PM2.5 levels attributable to fire emissions.
2.1 Observations of surface PM2.5 concentrations
We collected site-level measurements of [PM2.5] from a total of ∼9000 monitoring stations in the world. The site number varied year by year, with the maximum of 9541 in the year 2022. The data at 1822 sites in China for 2014–2023 were obtained from the China National Environmental Monitoring Center (CNEMC, http://www.cnemc.cn, last access: 21 May 2025). For the earlier years (2000–2013), we interpolated the data-fusion product of Tracking Air Pollution (TAP, http://tapdata.org.cn, last access: 21 May 2025) (Geng et al., 2021; Xiao et al., 2021) to 1822 ground stations to align with the CNEMC data. This TAP dataset has shown good consistency with observed Chinese PM2.5 levels for 2015–2022 (Fig. S1 in the Supplement). In the United States, PM2.5 observations at 1198 sites for 2000–2023 were obtained from the EPA (https://www.epa.gov, last access: 21 May 2025). European PM2.5 data at 1687 sites in 2013–2023 were obtained from the European Environment Agency (EEA, https://www.eea.europa.eu/en, last access: 21 May 2025), with data before 2013 coming from the European Monitoring and Evaluation Programme (EMEP, https://emep.int, last access: 21 May 2025). PM2.5 data for other countries at 4995 sites were downloaded from OpenAQ (https://openaq.org, last access: 21 May 2025) and the World's Air Pollution: Real-time Air Quality Index (https://waqi.info, last access: 21 May 2025), where the Air Quality Index (AQI) was converted into PM2.5 following a standardized methodology (Benchrif et al., 2021). All of the PM2.5 data, both daily and hourly, have undergone rigorous quality checks with outliers removed to ensure accuracy. Daily values were calculated from the hourly data, and sites with fewer than 10 d data in a year were excluded from the analysis. Finally, a total of 2 560 645 records were compiled for the model training and validation.
2.2 Auxiliary data
The auxiliary data utilized in this study are detailed in Table S1 in the Supplement. Climatic data were downloaded from the ECMWF Reanalysis v5 (ERA5, https://www.ecmwf.int/en/forecasts/dataset/ecmwf-reanalysis-v5, last access: 21 May 2025) with a spatial resolution of 0.25°×0.25° at the hourly interval. Relative humidity was calculated using surface pressure, 2 m temperature, and a 2 m dew point, based on the Clausius–Clapeyron equation (Pechony and Shindell, 2009). These meteorological data were aggregated to the daily timescale to be consistent with PM2.5 measurements. Global land cover data from 2000 to 2023 were obtained from MODIS Land Cover (https://modis-land.gsfc.nasa.gov/landcover.html, last access: 21 May 2025), which classifies 17 vegetation types according to the International Geosphere-Biosphere Programme (IGBP).
2.3 GEOS-Chem model simulation
We used the GEOS-Chem (GC) model (version 12.0.0, https://geoschem.github.io, last access: 21 May 2025) to predict the global [PM2.5] and isolate the contributions from fire emissions. The model is a global three-dimensional CTM operating at a horizontal resolution of 2° latitude by 2.5° longitude with 47 vertical layers extending from ground level to the mesosphere (Yan et al., 2018; David et al., 2019; Lu et al., 2019). The model incorporates MERRA-2 meteorological inputs and implements a comprehensive chemical mechanism covering HOx–NOx–VOC–O3–halogen–aerosol interactions (Mao et al., 2013). Previous studies have extensively demonstrated the effectiveness of GEOS-Chem in simulating reasonable distributions of trace gases and aerosols at multiple spatial and temporal scales (Xu et al., 2013; Breider et al., 2014; Li et al., 2019).
Emissions from various sources, regions, and types are processed using the Harvard–NASA Emissions Component (HEMCO) module, which operates online and allows users to specify the grid, apply scaling factors, and dynamically integrate, overlay, and update emission inventories (Keller et al., 2014). In our study, we incorporated two daily fire emission inventories within the HEMCO framework, including GFED4.1s (abbreviated as GFED hereafter) and QFED2.5 (abbreviated as QFED hereafter), both of which range from 2000 to 2023 (last modified on 26 June 2024). All simulated PM2.5 data at 2°×2.5° from GEOS-Chem were downscaled to 0.25°×0.25° using the bilinear interpolation (Wei et al., 2021). In addition, we estimated [PM2.5] unaffected by fires by disabling the biomass combustion inventories in GEOS-Chem.
2.4 The machine learning algorithm
We used the XGBoost machine learning algorithm to bias-correct the simulated all-source [PM2.5]. XGBoost is based on the principle of gradient tree boosting (GTB) algorithms, which combine multiple imperfect decision trees (referred to as base or weak learning trees) to create a more accurate composite decision tree (Chen and Guestrin, 2016). XGBoost is designed for efficiency and speed and is capable of building trees gradually and supporting customized objective functions and evaluation metrics. These features make it particularly well-suited to various regression tasks. The primary objective of this algorithm is to minimize loss functions, enhancing the model's predictive accuracy. Notably, XGBoost provides a robust and scalable solution that optimizes computational speed and reduces memory usage when training large-sample datasets (Li et al., 2020). The formula for prediction is defined as follows:
where is the predicted daily [PM2.5]; X is the input variable related to [PM2.5], which includes simulated [PM2.5] from GEOS-Chem, meteorological fields, and land cover data (Table S1). K is the number of decision trees used in the model, and fk denotes the tree constructed to minimize the residuals left by the (k−1)th tree.
XGBoost implements early stopping strategies and regularization techniques within the objective function to effectively prevent overfitting. The kth iteration of the XGBoost function (Rk) is defined as follows:
where t refers to the number of samples; yi represents the actual value of the ith sample, and means the predicted value of the ith sample after k iterations. The function is a differentiable loss function used to measure the discrepancy between yi and . The regularization term Ω(fj) includes the complexity of the amount of the tree fj, such as the number of nodes and the weights assigned to each node (Ma et al., 2020). In addition, XGBoost employs a second-order Taylor expansion for the loss function, enhancing the precision of the model's error assessment and consequently improving the accuracy of predictions (Wong et al., 2021).
In this study, we used meteorological data, land cover information, and simulated all-source [PM2.5] from the GEOS-Chem model (Table S1) to develop XGBoost models. These gridded input data were interpolated to monitoring sites, and the site-level PM2.5 measurements was used as the predictand. Due to the substantial data volume, we trained the XGBoost model on a year-by-year basis using available measurements and modeling data from the corresponding years. For each year, 80 % of observational records were randomly selected to train the XGBoost model, while the remaining 20 % were used as independent samples for validations. The developed and validated machine learning models were then used to derive global gridded [PM2.5], using meteorological reanalyses, land cover data, and PM2.5 outputs from GEOS-Chem models, at a resolution of 0.25°×0.25° on a daily basis. We estimated fire-emitted [PM2.5] by applying the simulated fire-to-all ratio of [PM2.5] to the XGB-adjusted all-source [PM2.5] following the same approach as Xu et al. (2023):
3.1 Bias correction and validation of all-source [PM2.5]
Figure 1 shows the locations of the monitoring sites and the corresponding [PM2.5] in 2022. High levels of PM2.5 are observed in Asia, especially over India and East Asia, where large anthropogenic emissions are located. The all-source [PM2.5] predicted by the XGBoost model, which implements GEOS-Chem simulations considering GFED fire emissions, in general captures the observed spatial pattern with a determination coefficient (R2) of 0.82, a root-mean-square error (RMSE) of 9.22 µg m−3, and a normalized mean bias (NMB) of 0.71 %, respectively (Fig. 1b). Similarly, the XGBoost model demonstrates good performance when applied to GEOS-Chem simulations driven with the QFED inventory, as shown in Fig. S2 in the Supplement for the results of 2022.
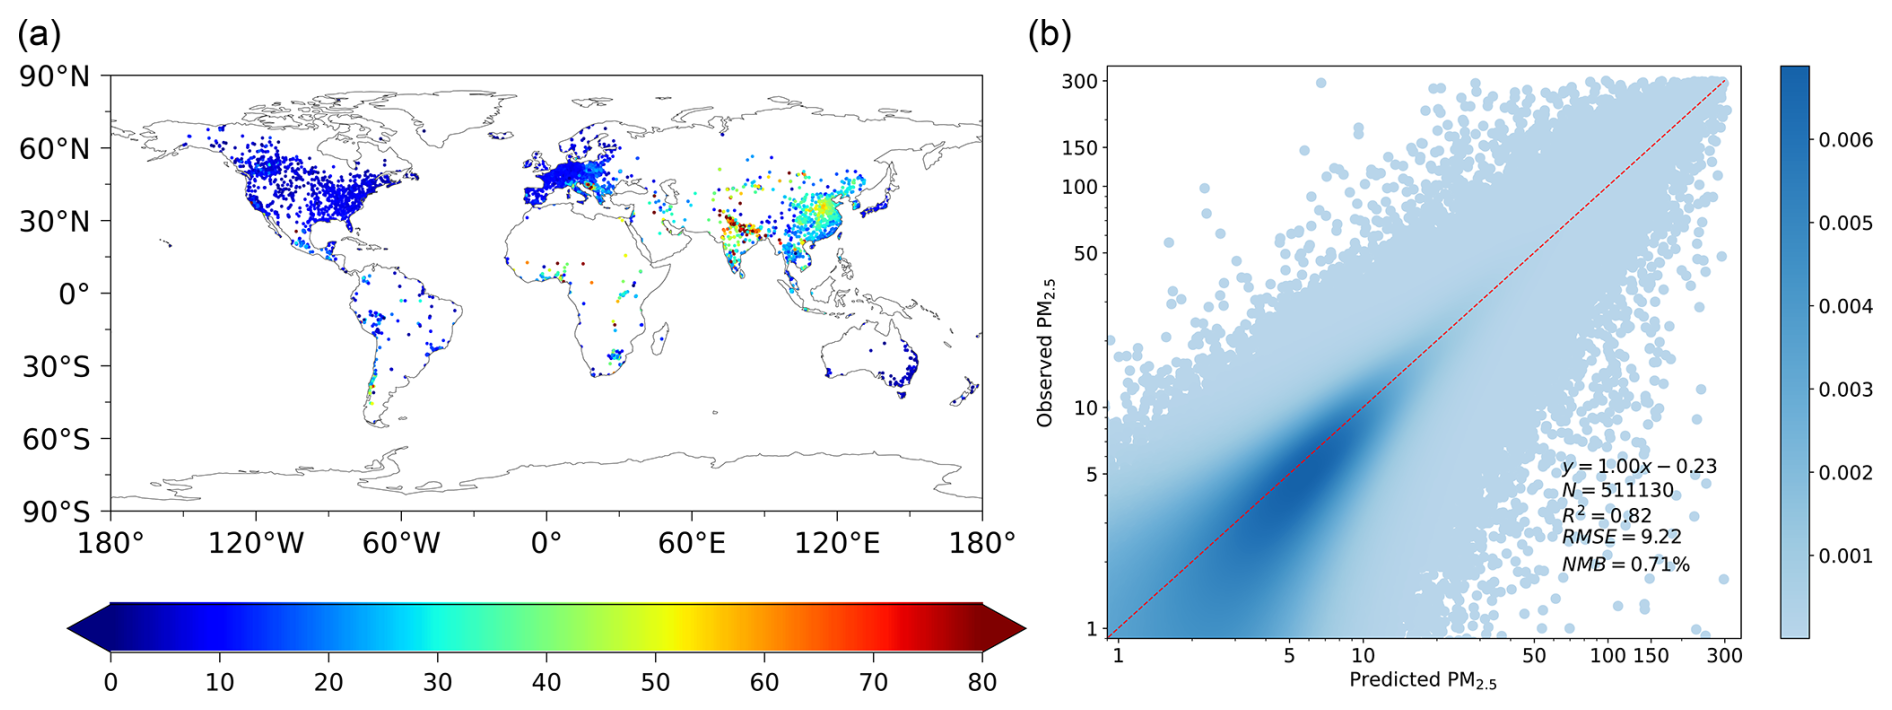
Figure 1Observed PM2.5 concentrations and their comparisons with predictions made by the XGBoost model. Panel (a) presents the annual mean PM2.5 concentrations ([PM2.5], µg m−3) at 9541 monitoring sites in 2022. Panel (b) shows daily PM2.5 concentrations predicted by the GEOS-Chem model, adjusted using the XGBoost approach and compared with validation subsets of observations in 2022. The GEOS-Chem simulations incorporate emissions from both anthropogenic sources and the Global Fire Emissions Database version 4.1s. The colors in panel (b) represent the data frequency, and the red dashed line indicates the linear regression. Validation metrics, including the sample size (N, 20 % of the total number of observational records), regression equation, determination coefficient (R2), root-mean-square error (RMSE), and normalized mean bias (NMB), are provided. GEOS-Chem simulations using the QFED inventory for 2022 are shown in Fig. S2.
Figure S3 in the Supplement presents the top 10 most crucial features identified by the XGBoost model for predicting all-source [PM2.5] using two different fire inventories in 2022. As expected, the data simulated by the GEOS-Chem model consistently rank as the most important feature. This is followed by meteorological variables such 10 m wind speed, surface pressure, and boundary layer height, which have a significant influence on [PM2.5] variations (Wei et al., 2019). Although there are variations in the importance scores of the top 10 features between the two inventories, it is evident that meteorological data have a more pronounced impact on [PM2.5] compared to land use data.
Following the same protocol, we developed machine learning models using the XGBoost method for other years as well. Each year's model featured distinct parameterization schemes, and we utilized a 10-fold cross-validation (CV) method to verify the robustness of these models. The statistical indicators, including the CV score R2, overall R2, and RMSE for the XGBoost procedures over 24 years, are displayed in Fig. S4 in the Supplement. The R2 of CV remained above 0.85 throughout the study period, demonstrating that the XGBoost model effectively bias-corrected the predicted all-source PM2.5 with reasonable spatial coverage and temporal stability. It should be noted that the R2 gradually decreased after 2012, likely due to the rapid growth in data volume, which may have weakened the correlations (Perry and Dickson, 2018).
3.2 Development and validation of fire-sourced [PM2.5]
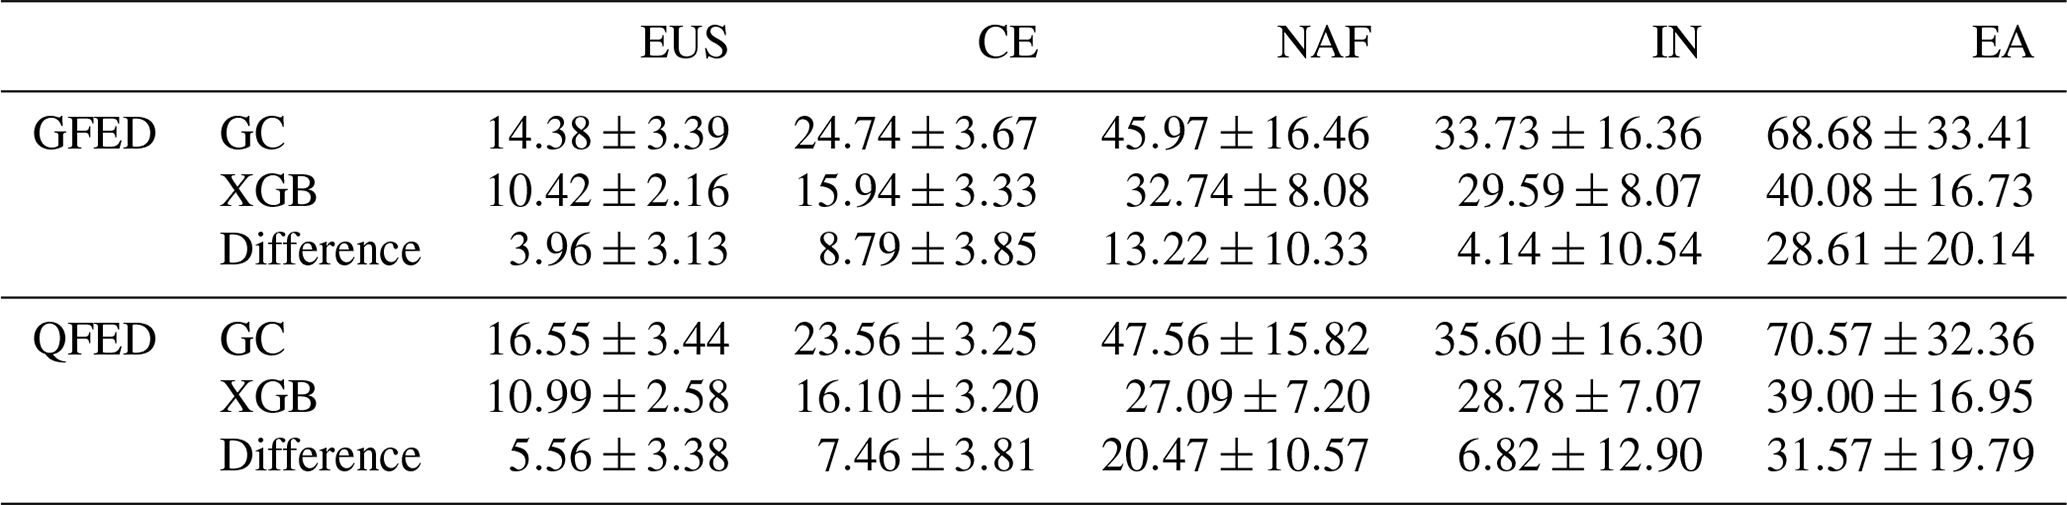
We compare the all-source [PM2.5] with () and without () the XGBoost adjustment. Averaged for 24 years, the original simulations exhibit high [PM2.5] in northern Africa, India, and East Asia and relatively high values in the eastern US and central Europe (Fig. 2a). With the bias correction, those hotspots are either weakened or shrink (Fig. 2c). Specifically, [PM2.5] decreases by 28.8 % in northern Africa, 12.3 % in India, 41.7 % in East Asia, 27.5 % in the eastern US, and 35.5 % in central Europe (Table 1). In contrast, the adjusted [PM2.5] tends to increase over regions with limited anthropogenic perturbations, such as boreal forest, the Tibetan Plateau, or the Australian desert (Fig. 2e). Such discrepancies suggest that the GEOS-Chem model generally underestimates pollution levels in pristine regions (Protonotariou et al., 2010; Kim et al., 2015) and overestimates them in areas with dense pollution (Lei et al., 2021). Similar changes in [PM2.5] are found for the simulations using QFED (Fig. 2b, d, and f) fire inventories. It is worth noting that changes in [PM2.5] varied significantly over some regions in the different fire inventories. For example, the bias-corrected [PM2.5] decreases by 19.2 % in India and 33.6 % in the eastern US with QFED (Table 1), which is much larger than those with GFED, suggesting that differences in fire inventories result in certain discrepancies in the regional [PM2.5].
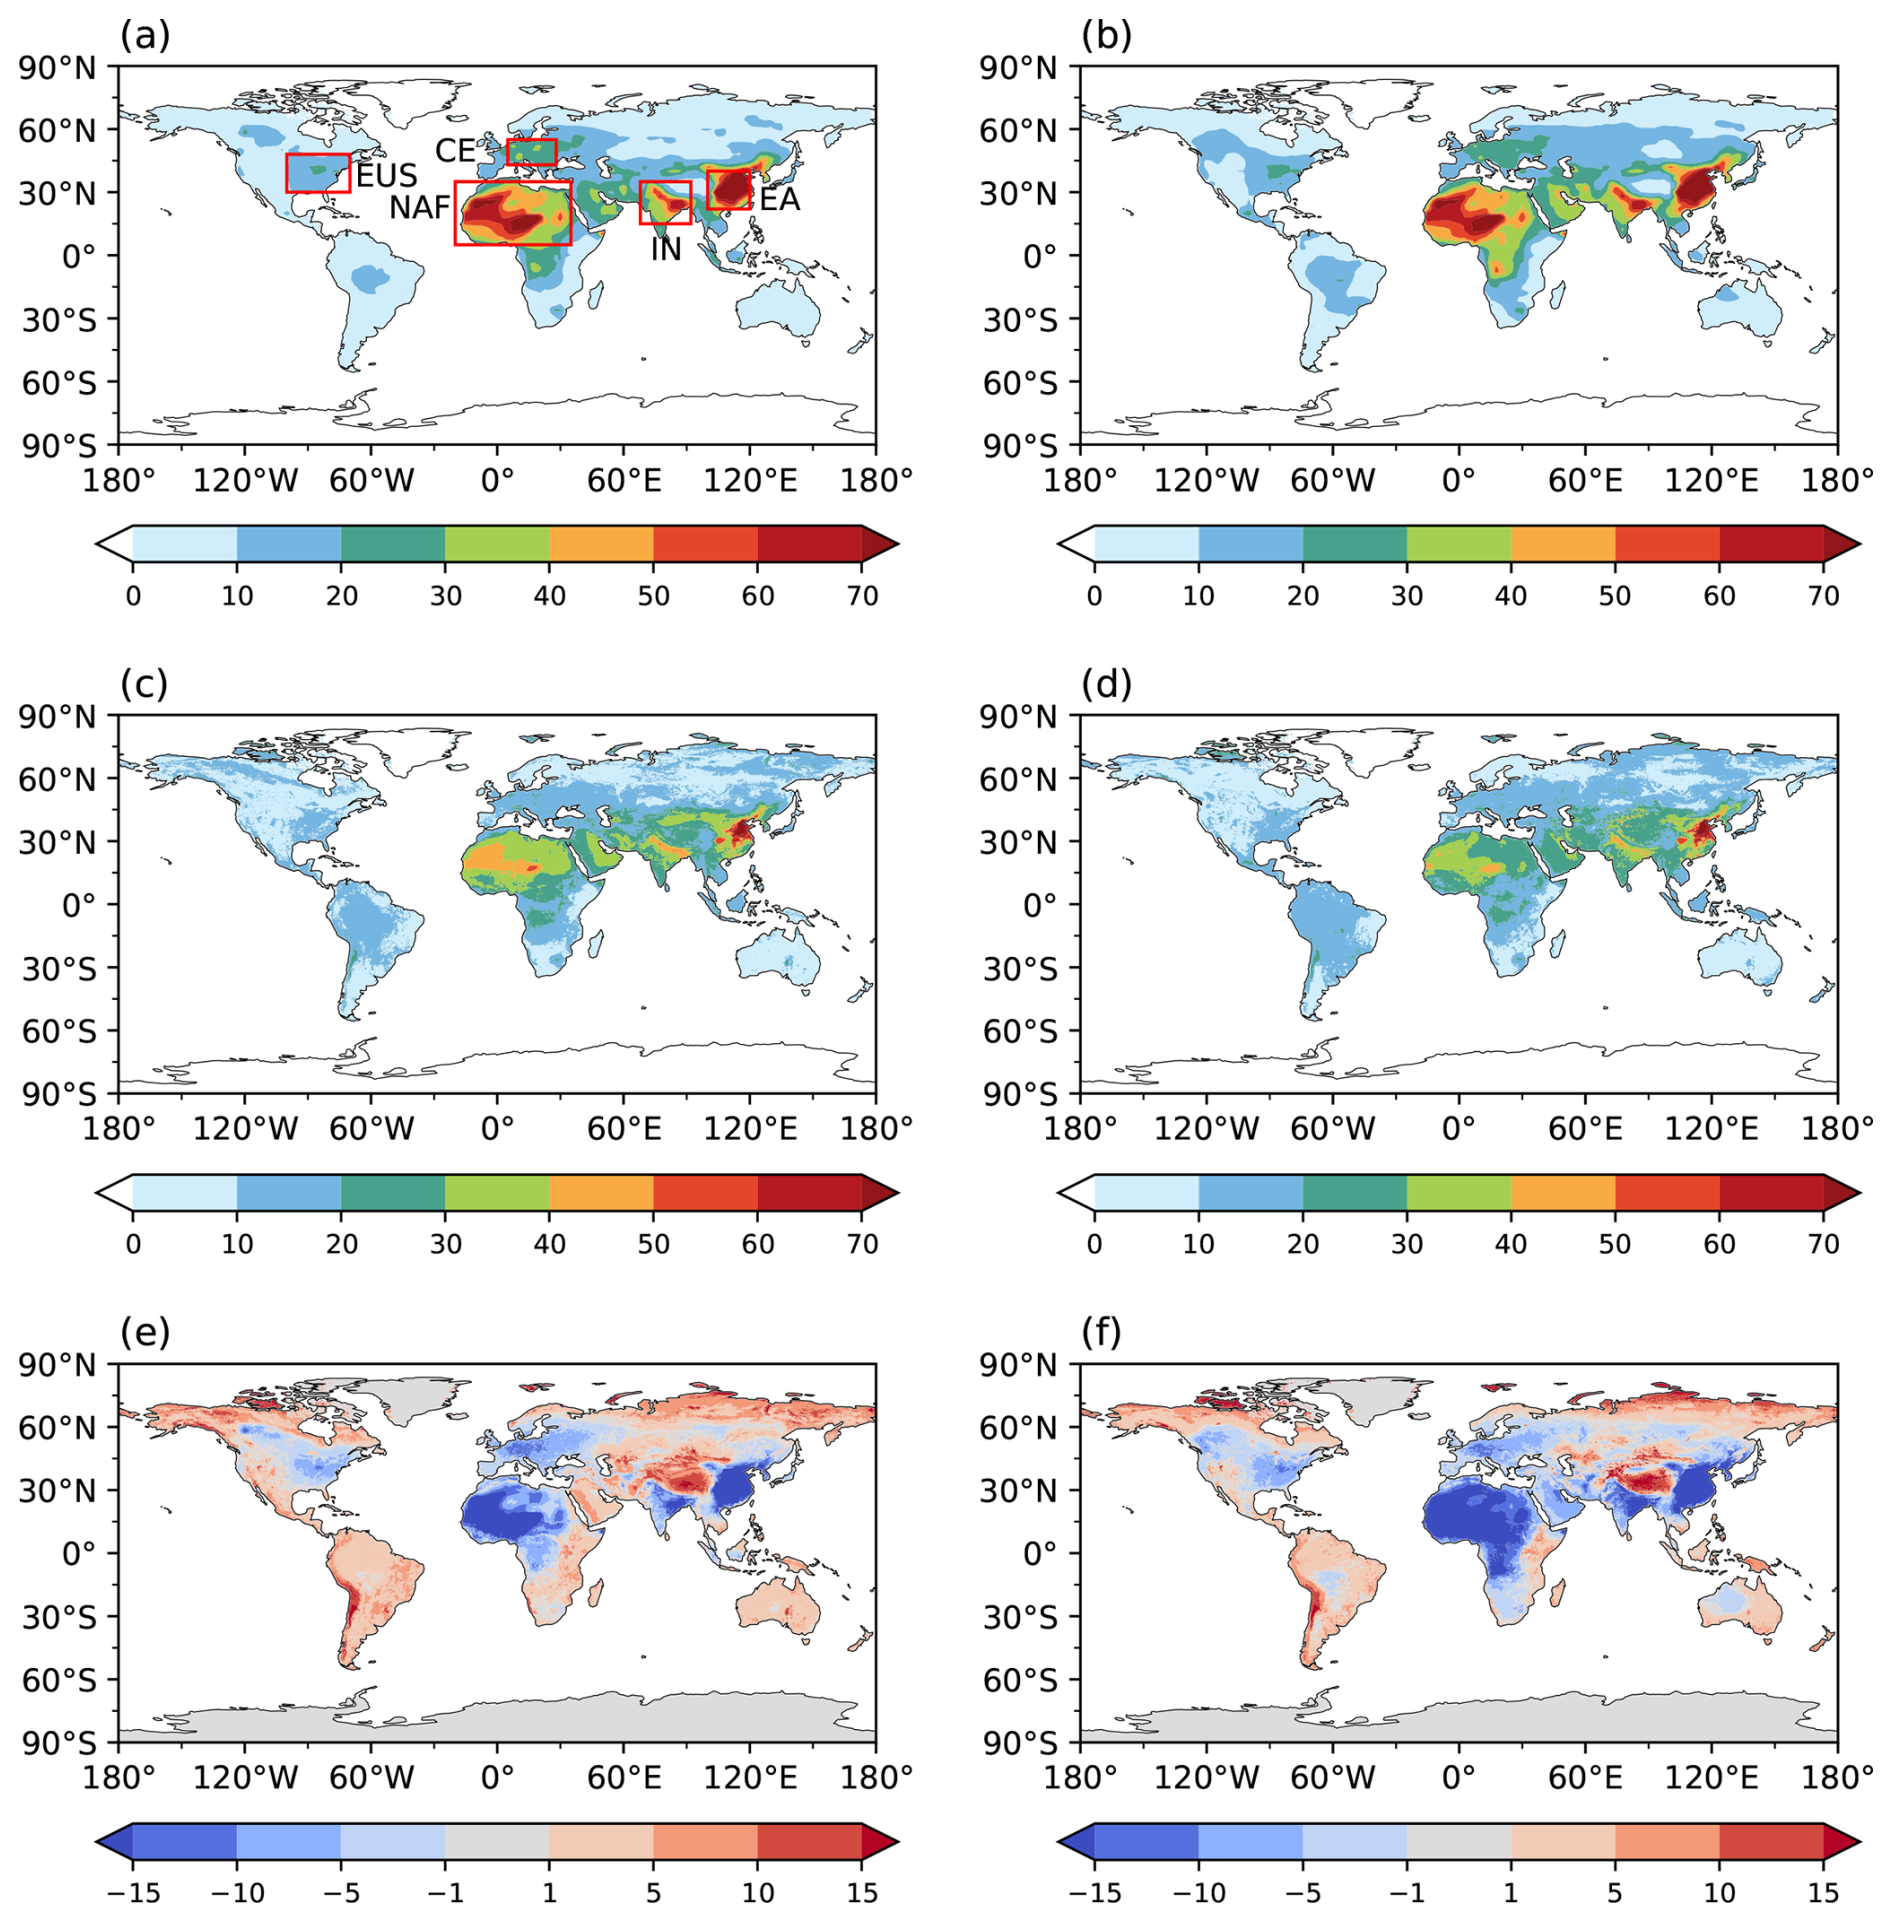
Figure 2Annual mean all-source [PM2.5] for 2000–2023 from the original GEOS-Chem simulations at 0.25°×0.25° resolution derived using the (a) GFED and (b) QFED inventories, as well as (c, d) bias-corrected estimations using the XGBoost approach at the same resolution. The difference between the original and bias-corrected [PM2.5] is shown in panels (e) and (f).
Table 1Mean PM2.5 before and after bias correction in selected regions averaged for 2000–2023.
We derive fire-sourced [PM2.5] using Eq. (3) and validate it for typical fire events during 2018–2022 (Fig. 3). Fire carbon emissions from GFED are used to pinpoint the accurate fire locations for these events (Table S2 in the Supplement). The fire-affected sites are determined if their back trajectories cross the fire locations within 3 d after their occurrence. For example, 55 sites in Canada exhibited an abrupt enhancement of [PM2.5] of more than 5 times the ordinary level around 15 August 2023. The back trajectory of these sites aligned with the large fire emissions on the western coast during 13–15 August (Fig. S5 in the Supplement). Similarly, 94 sites along the eastern coast of Australia were affected by the fire plume transport during 8–10 December 2019 (Fig. S6 in the Supplement). Averaged for these 12 events, the correlation coefficient (R) of [PM2.5] between the observations and simulations increases from 0.16 ± 0.37 without fire emissions to 0.58 ± 0.29 with fire emissions. The NMB is improved from −53.17 % ± 25.50 % without fire emissions to 10.68 % ± 24.96 % with fire emissions during the corresponding fire periods. A similar improvement in [PM2.5] is achieved with the QFED emission inventory for these fire events (Fig. S7 in the Supplement). We further compare the fire-sourced [PM2.5] data with the estimates by Childs et al. (2022) in the US. (Fig. 4). Our estimates show reasonable performance, with a correlation coefficient of 0.68 (0.6) and a RMSE of 2.79 (2.71) µg m−3 using the GFED (QFED) inventory. However, the fire-sourced [PM2.5] form GFED is overall lower than that of Childs et al. (2022) by −55.04 %.
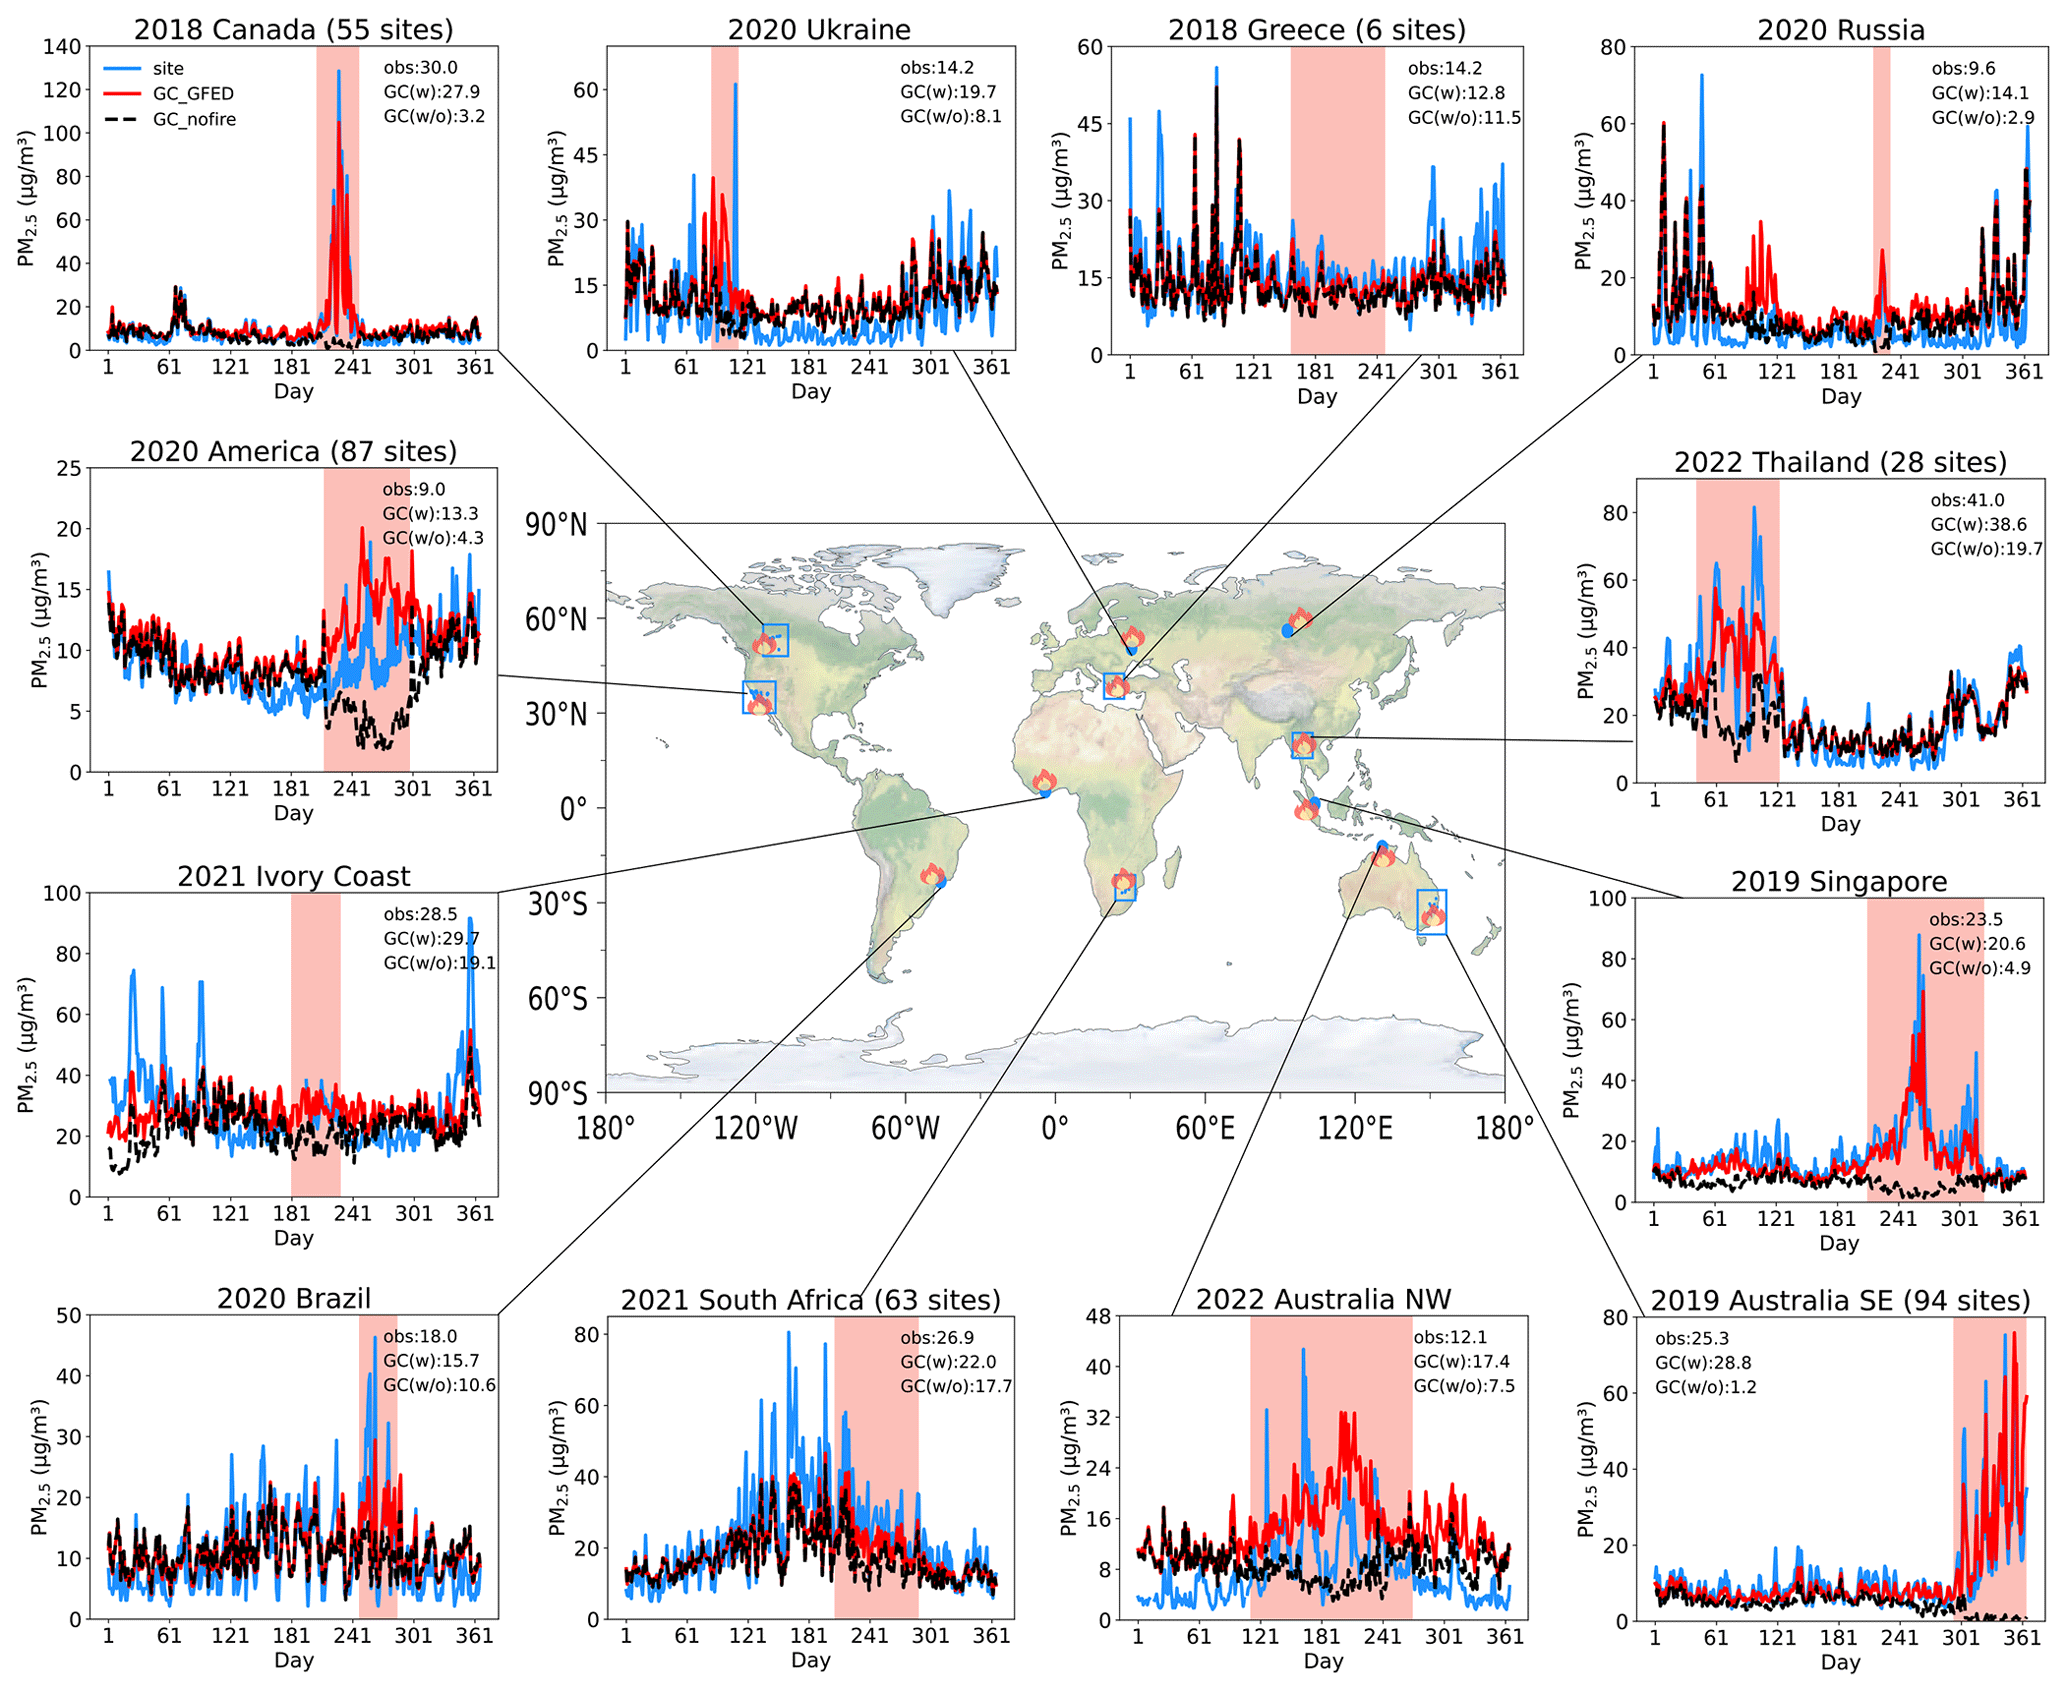
Figure 3Comparisons of [PM2.5] between observations (blue) and estimations with (red) and without (black) fire emissions for 12 incidences during 2018–2022. The estimations are performed using the GEOS-Chem model driven with fire emissions from the GFED inventory and bias-corrected with the XGBoost approach. The blue boxes (representing multiple sites) or points (representing single sites) on the map indicate the locations of air quality monitoring sites affected by nearby fire plumes. The sources of these fire episodes were determined using Lagrangian back-trajectory analysis as shown in Figs. S5 and S6. The observed and estimated [PM2.5] values at all of the sites averaged for fire periods are shown in each panel. These fire events were sourced from the Global Disaster Data Platform (https://www.gddat.cn/newGlobalWeb, last access: 21 May 2025), which provides fire locations and the approximate start and end dates as shown in Table S2.
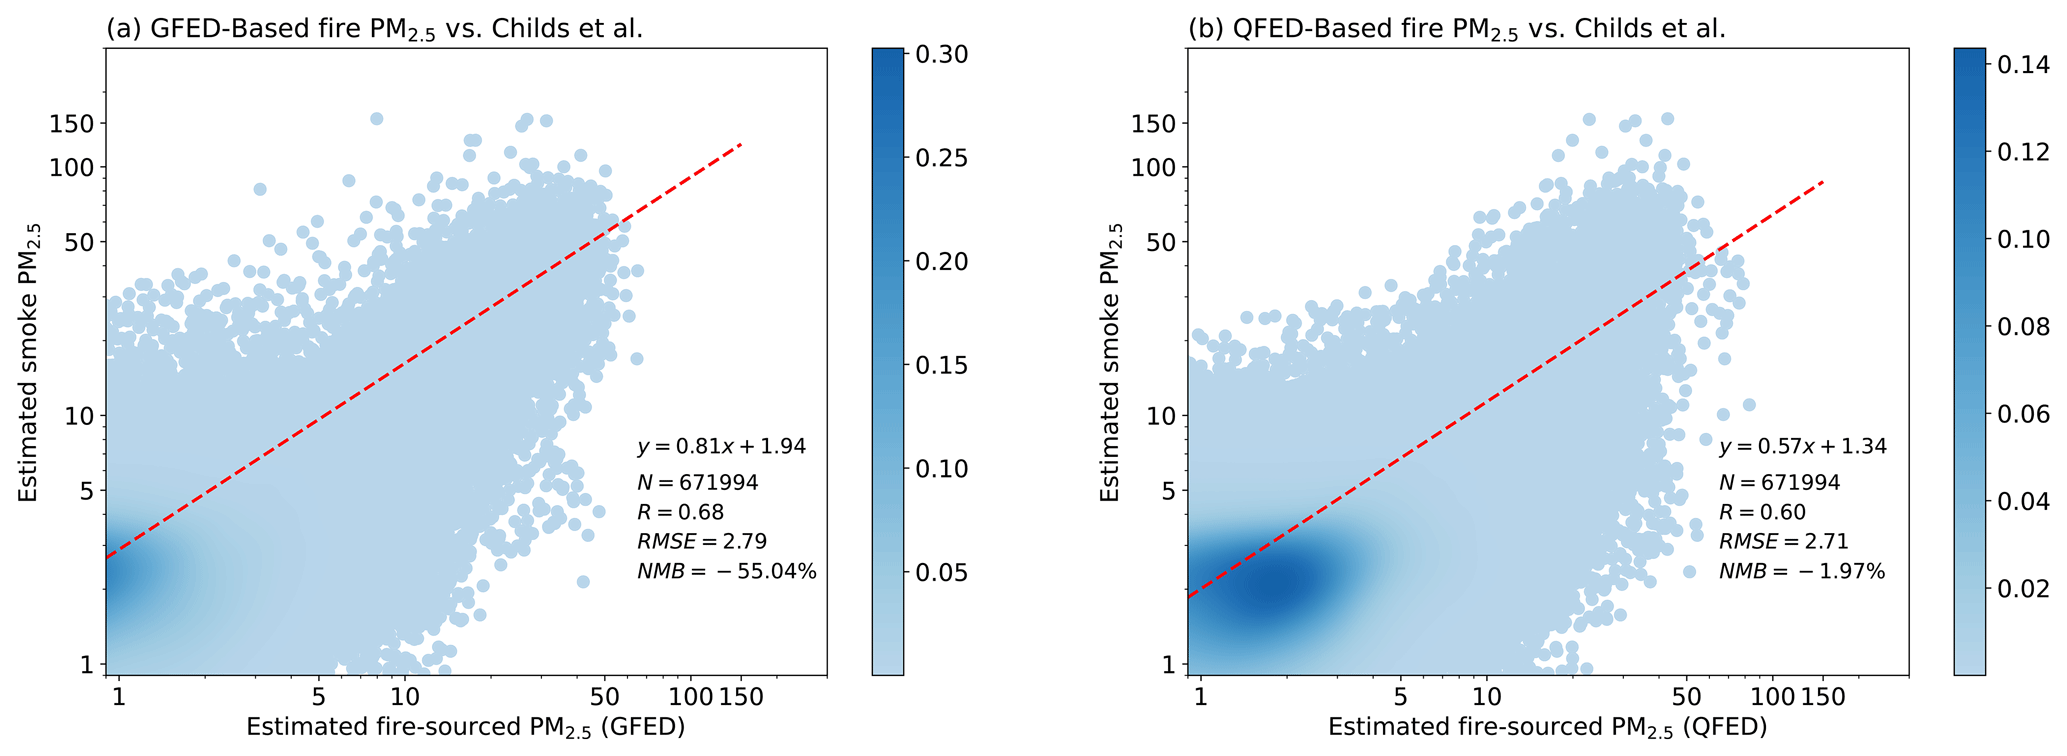
Figure 4Comparison of fire-sourced PM2.5 (µg m−3) estimated using the (a) GFED and (b) QFED inventories with smoke PM2.5 observed by Childs et al. (2022) at 100 156 polygons in the US during 2016–2019. Validation metrics of N, the regression equation, R2, RMSE, and NMB are calculated.
The probability density distributions of fire-sourced [PM2.5] from the two inventories show notable differences (Fig. S8 in the Supplement). During 2000–2023, the fire-sourced [PM2.5] from QFED is more than twice that from GFED below the 75th percentile, indicating that QFED predicts significantly higher [PM2.5] for low to moderate fire events. However, this difference decreases above the 90th percentile and becomes particularly constrained at the 99th percentile, where the fire-sourced [PM2.5] from GFED is 79.29 % that from QFED. This suggests that, while both inventories yield comparable estimates for extreme fire episodes, GFED systematically underestimates emissions from smaller fires. This underestimation persists despite improvements in GFED's representation of small fires through additional implementations (Van Der Werf et al., 2017). Consequently, validations in the US reveal substantially low values with GFED relative to previous estimates (Fig. 4), a bias that is alleviated in QFED for small to moderate fires (Fig. S9 in the Supplement). Although both inventories perform comparably during high-emission events (Figs. 3 and S7), their estimates remain much lower than those of Childs et al. (2022) at the highest levels of fire-sourced [PM2.5] (Fig. S9).
3.3 Spatiotemporal variations of fire-sourced [PM2.5]
We examine the spatiotemporal variations of fire-sourced [PM2.5] derived from the GFED inventory (Figs. 5 and S10 in the Supplement). Averaged for 2000–2023, fire-sourced [PM2.5] shows strong spatial heterogeneity, with the highest concentrations in central Africa (CAF) and secondary hotspots in South America (SA), Southeast Asia (SEA), North America (NA), and Siberia (SB). An upward trend in fire-related [PM2.5] is found in Siberia and North America, while most other regions show downward trends (Fig. 5b). Predictions using the QFED inventory indicate a much higher long-term average fire-related [PM2.5] compared to GFED (Table 2), particularly in the Middle East, western Siberia, and eastern South America (Fig. 5c and e). The decreasing trend in fire-sourced [PM2.5] predicted by QFED is even more pronounced than that predicted by GFED in fire-prone regions such as western Siberia, South America, and Australia (Fig. 5d). In contrast, a positive trend is predicted by QFED in eastern China and Europe, where wildfires are typically limited due to the dense population (Bistinas et al., 2014; Knorr et al., 2014).
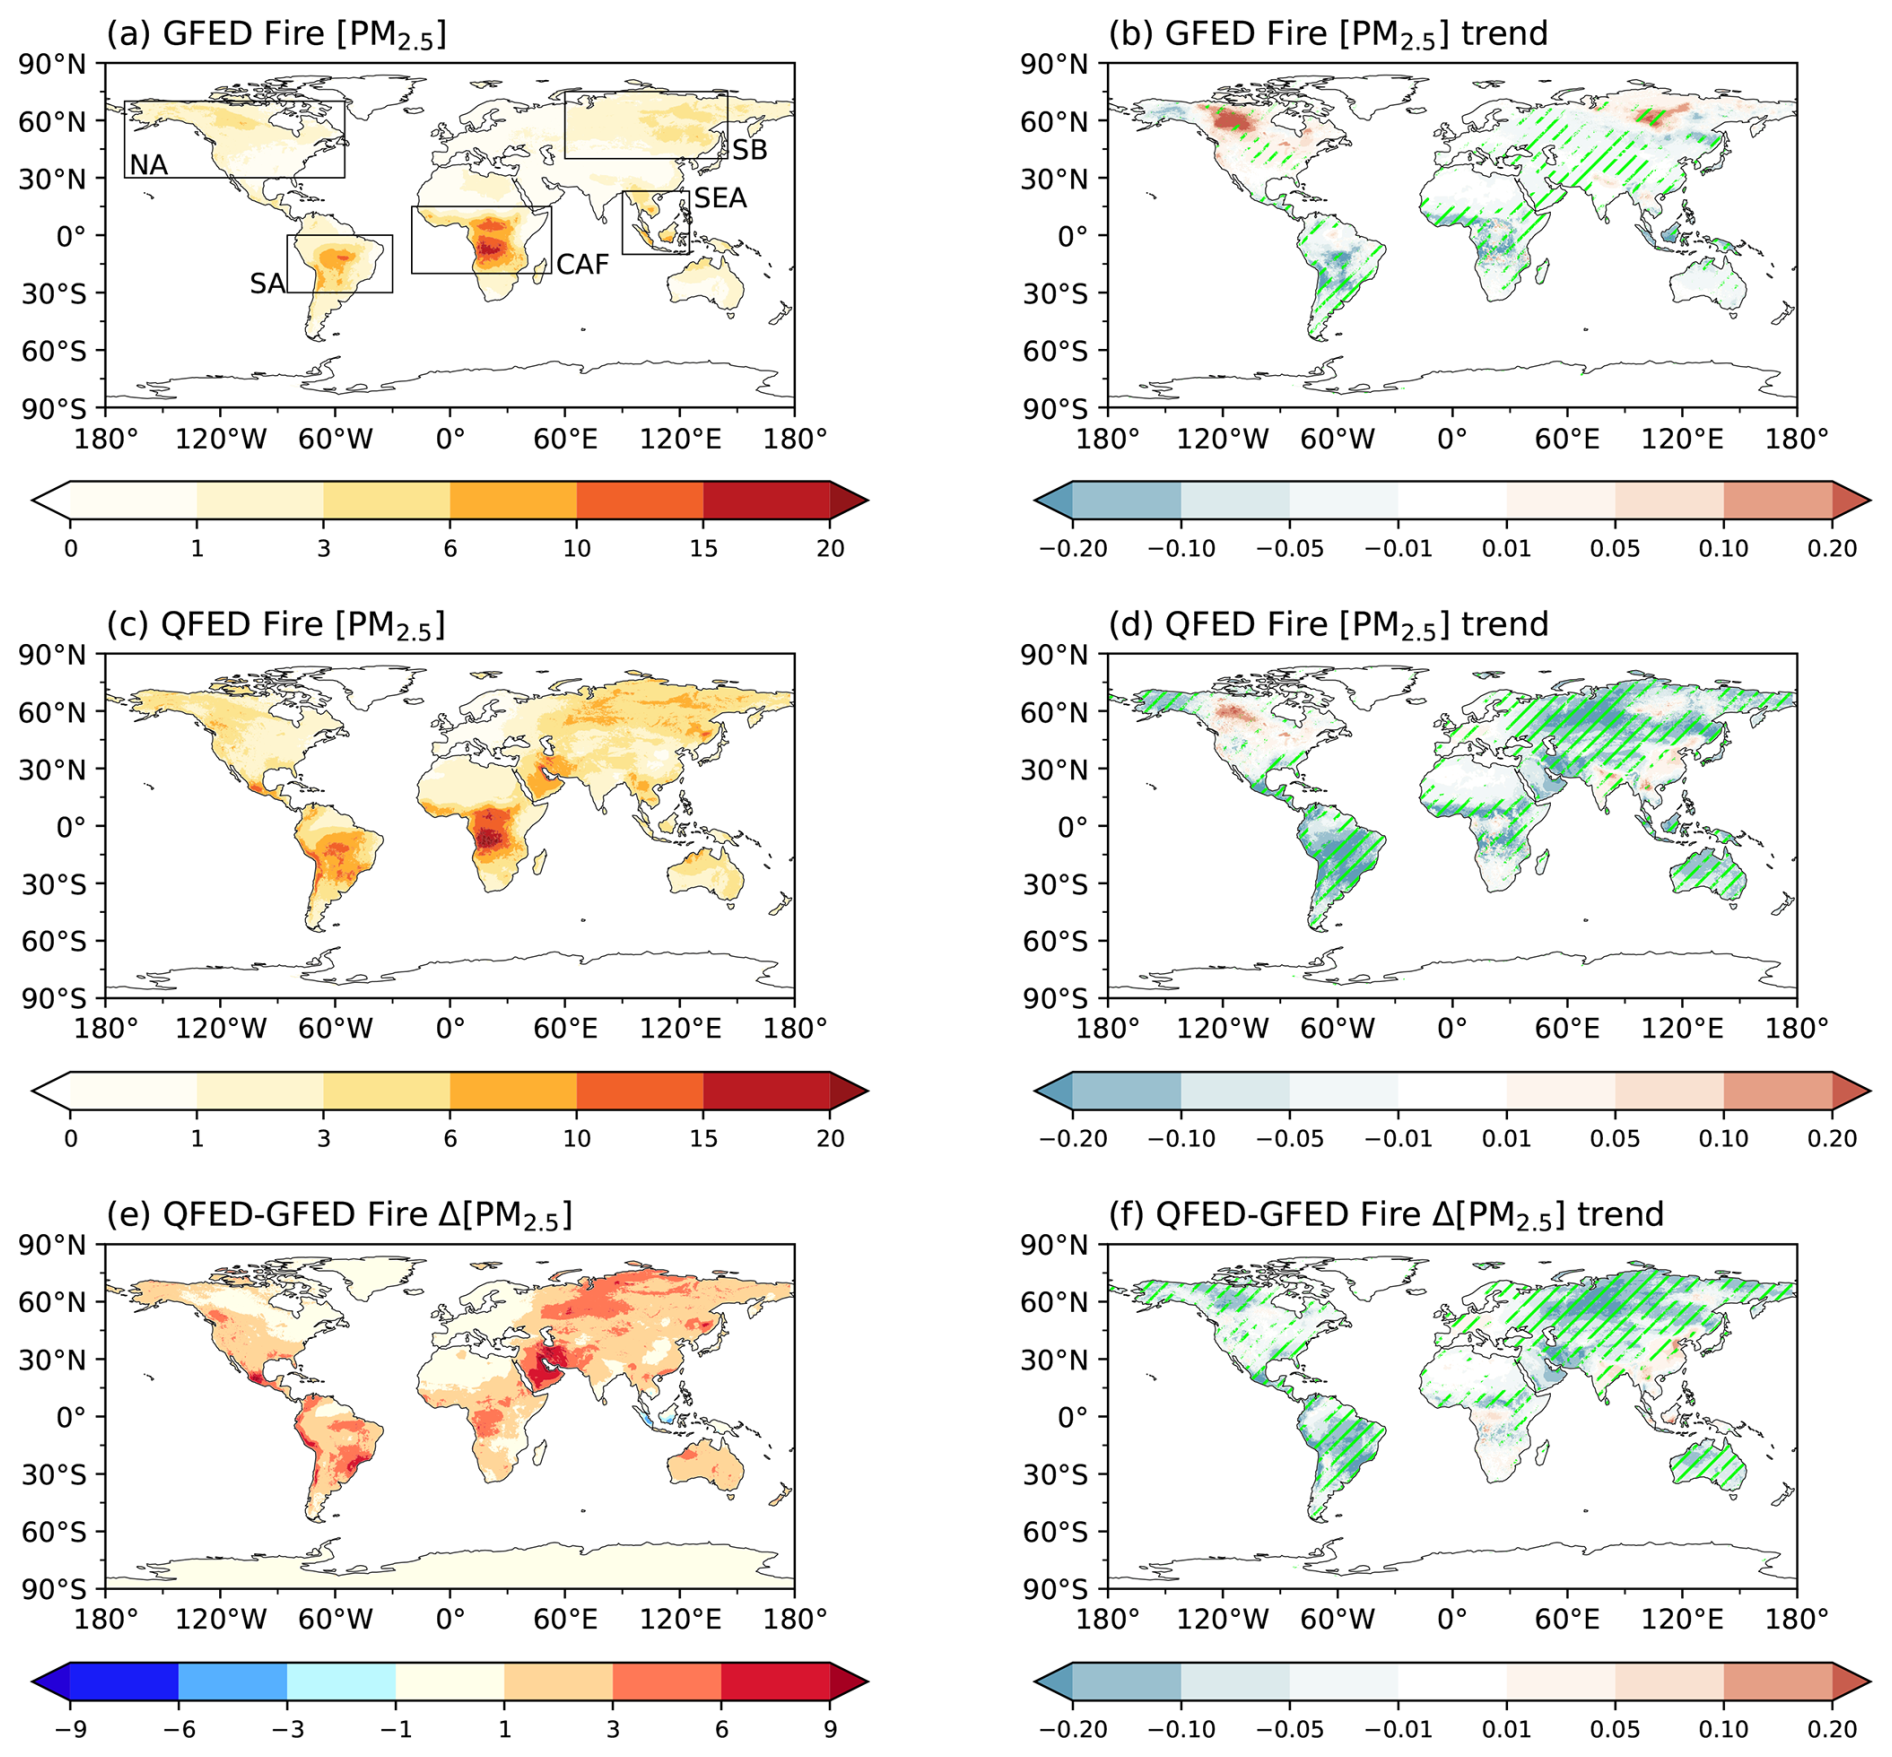
Figure 5Long-term (a) mean and (b) trend of fire-sourced [PM2.5] (µg m−3) derived using the GFED inventory for 2000–2023. The box regions in panel (a) indicate areas used to compare differences between the two inventories. Panels (c) and (d) display the same information as panels (a) and (b) but for fire-sourced [PM2.5] from the QFED inventory. The differences in fire-sourced [PM2.5] (Δ[PM2.5]) between the two inventories are presented for the long-term (e) mean and (f) trend during 2000–2023. Green slashes indicate areas with significant (p<0.05) changes. The p values of these trends are shown in Fig. S10.
Table 2The mean fire-induced [PM2.5] in selected regions averaged for 2000–2023.
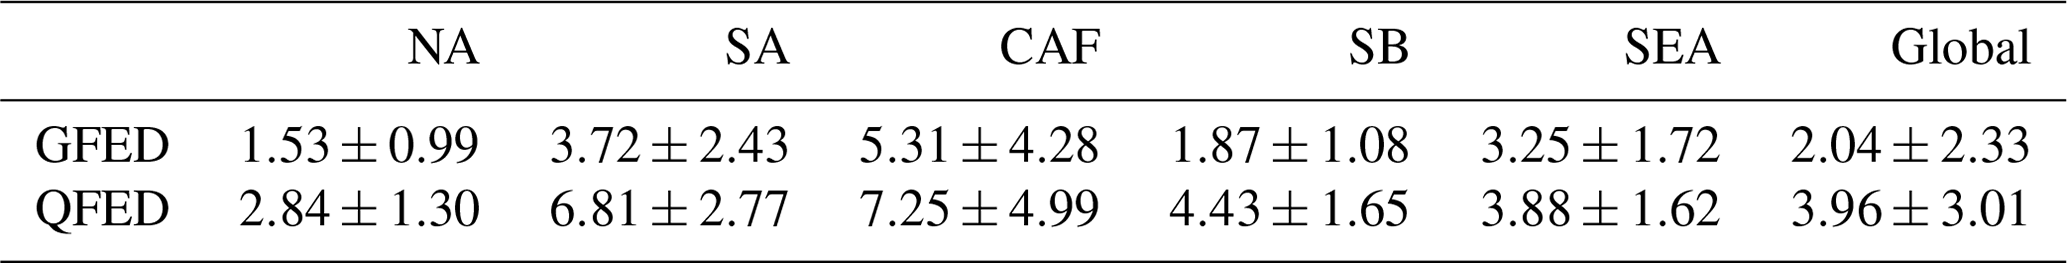
These differences in fire-sourced [PM2.5] are mainly due to the discrepancies in fire inventories. In global fire-prone regions, organic carbon (OC) emissions from fires are 51.08 %–65.18 % lower in the GFED inventory compared to the QFED inventory (Fig. 6a). Consequently, the global average fire-sourced [PM2.5] is estimated at 2.04 µg m−3 with GFED, nearly half of the 3.96 µg m−3 estimated with QFED (Table 2). Moreover, fire emission trends in QFED tend to be more negative or less positive than in GFED (Fig. 6b), leading to stronger negative trends in fire-sourced [PM2.5] derived from QFED (Fig. 6d). For both inventories, simulated fire-sourced [PM2.5] trends are more negative than the corresponding emission trends, likely due to climatic or chemical conditions that enhance pollutant removal. For example, in North America, increased atmospheric oxidant levels (e.g., increased OH and O3) and changes in boundary layer height over the past 2 decades may have offset rising fire emissions by accelerating aerosol aging and modifying vertical mixing (Heilman et al., 2014; Zhou et al., 2019). In Siberia, the positive trend in GFED emissions is not fully reflected in fire-sourced [PM2.5], likely due to concurrent increases in rainfall and deposition efficiency that enhance particulate scavenging (Konovalov et al., 2024).
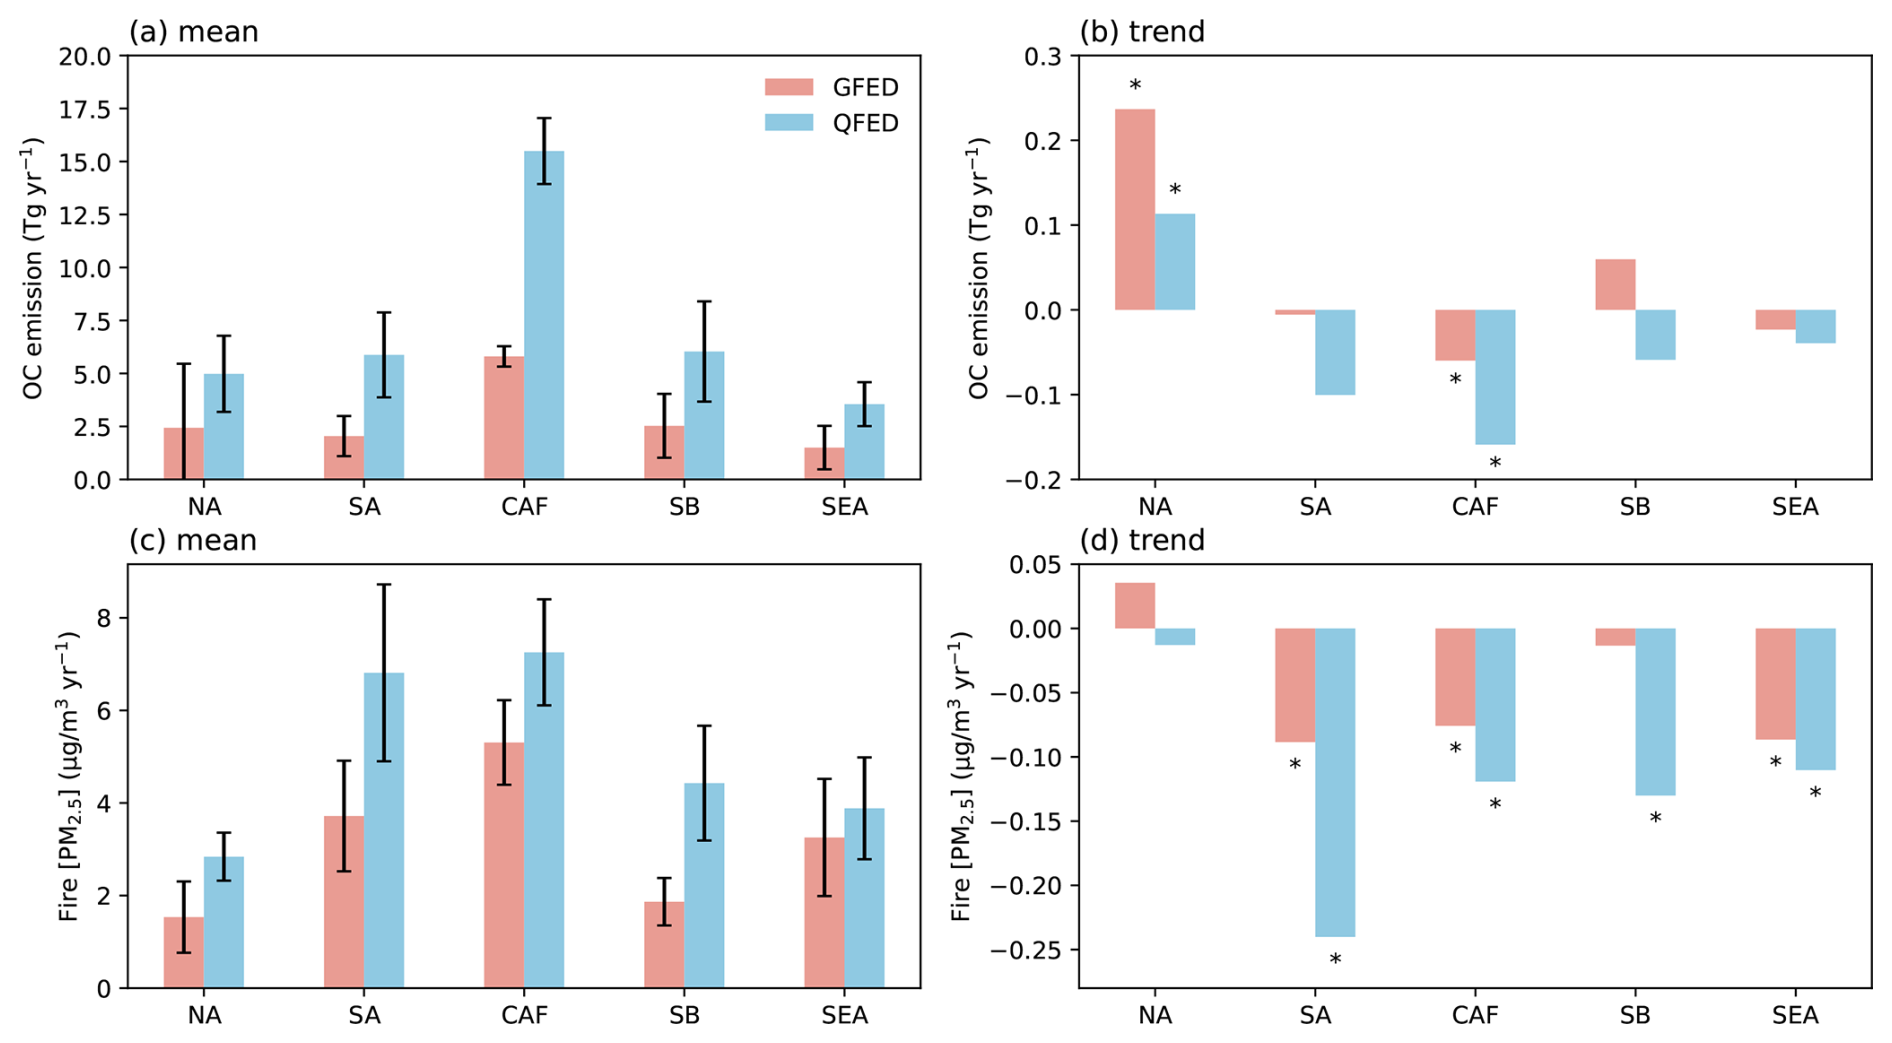
Figure 6The mean (a) and trend (b) of OC emissions in highly fire-prone regions indicated by the GFED (red) and QFED (blue) inventories. Panels (c) and (d) display the fire-sourced [PM2.5] predicted using these two inventories. The error bars represent 1 standard deviation for the year-to-year variations, and an asterisk denotes areas with significant (p<0.05) trends. The domain of the labeled regions is shown in Fig. 5a.
On a long-term mean basis, fire-related [PM2.5] is significantly higher in the tropics than in boreal regions (Fig. 5), primarily due to the high fire emissions in central Africa (Fig. 6). However, during extreme events, fire-sourced [PM2.5] can reach comparable levels at both low and high latitudes (Fig. 7). For instance, an unprecedented fire event over Canada in 2023 resulted in a regional hotspot exceeding 30 µg m−3, surpassing the maximum value of ∼20 µg m−3 in central Africa. Similarly, the extreme Siberian fires in 2019 significantly elevated local [PM2.5] and resulted in air pollution levels comparable to those in South America. From 2000 to 2023, the ratio of the maximum to mean fire-sourced [PM2.5] peaked at values exceeding 4 around 60° in both hemispheres, gradually decreasing to 2 at lower latitudes (Fig. 7a). In the vast tropical areas, fires are primarily driven by anthropogenic activities (Ward et al., 2018; Marques et al., 2021), leading to relatively stable emissions from year to year. In contrast, most biomass burning in boreal regions is caused by wildfires, which are less inhibited by human activities. These uncontrolled fire episodes, combined with the huge carbon storage in boreal forests, result in tremendous emissions in specific years, significantly affecting air quality, the climate system, and ecosystem functions at high latitudes in the Northern Hemisphere. It is worth noting that fire-sourced [PM2.5] shows lower extreme values in QFED (Fig. S11 in the Supplement) compared to those in GFED (Fig. 7) over Canada, though the mean fire-sourced [PM2.5] is much higher when associated with the former inventory (Fig. 6).
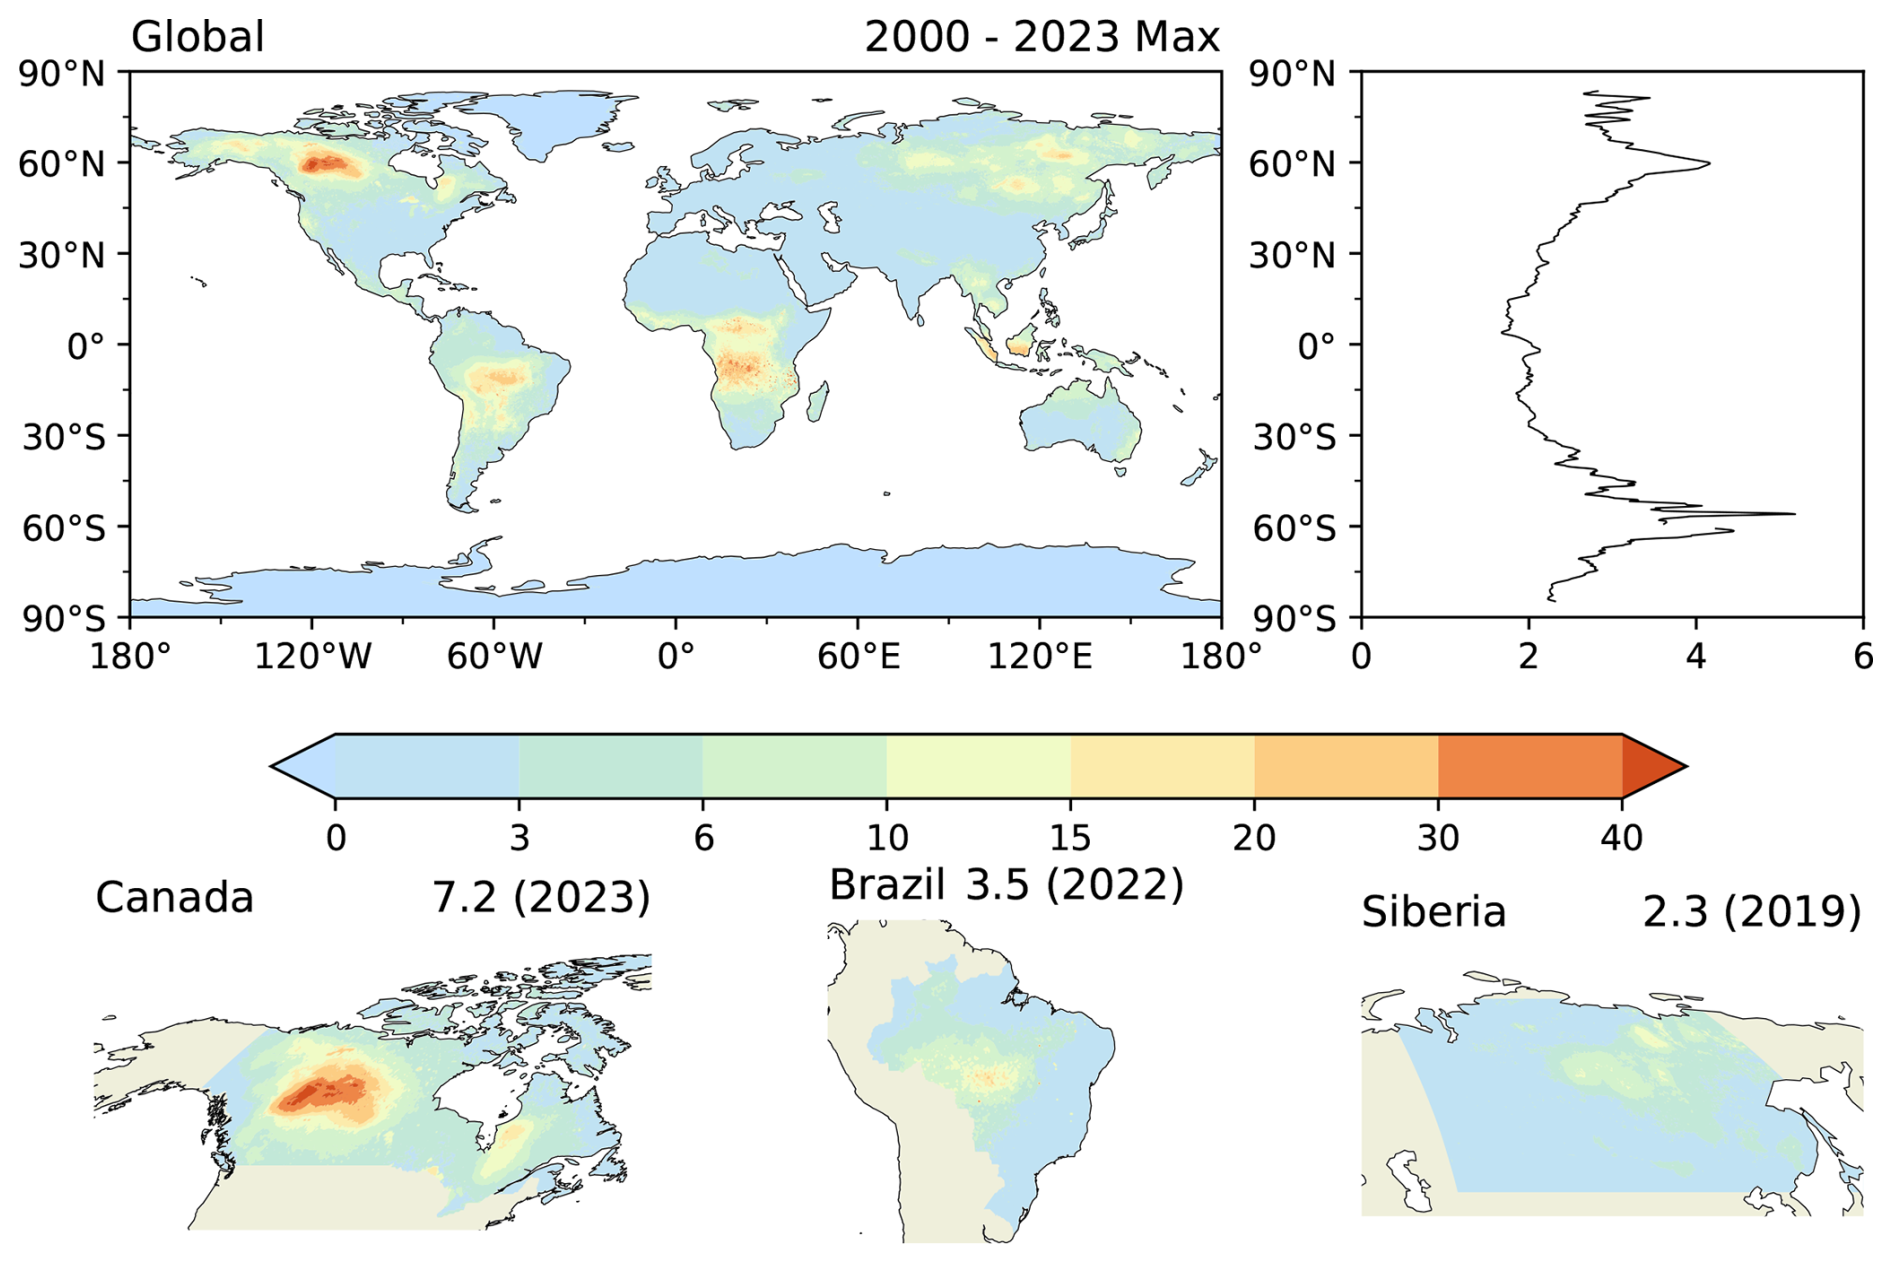
Figure 7The global maximum of fire-sourced [PM2.5] (µg m−3) from 2000 to 2023 derived using the GFED inventory, along with the fire-sourced [PM2.5] during years of high wildfire emissions in the various regions. For each grid on the global map, the maximum fire-sourced [PM2.5] during 2000–2023 is shown. The ratios between the zonal maximum and mean values are shown on the right side. For the three regions, the numbers before the parentheses represent the mean fire-sourced [PM2.5] averaged for the affected countries or regions in that specific year.
Extreme fire episodes pose significant threats to public health. The percentage of days and land grids with fire-sourced [PM2.5] exceeding the World Health Organization's air quality standard of 15 µg m3 showed a global decreasing trend of −0.03 % yr−1 (Fig. 8a). Regionally, an increase of 0.04 % yr−1 was found in North America that was driven by the 2023 Canadian fire episode, though this change was not statistically significant. In other regions, the exposure risk to high levels of fire PM2.5 declines, with the most notable being −0.22 % yr−1 in South America and −0.13 % yr−1 in Africa. While extreme fire-sourced [PM2.5] decreased in general, a turning point occurred in 2017, with more pronounced fire events thereafter. To better understand recent trends, we examined changes in fire-sourced [PM2.5] during the past few years. Relative to 2000–2019, fire-sourced [PM2.5] decreases across nearly all latitudes from 2020 to 2023 for both inventories (Fig. 9). Regionally, hotspots of increased fire-sourced [PM2.5] could be found in North America, due to the 2023 Canadian fires, and in the Amazon, due to the 2022 Brazilian fires. Additionally, fire-sourced [PM2.5] levels increased in central Africa, northern India, and the Indo-China Peninsula, where human-induced agricultural burning is prevalent (Van Der Werf et al., 2017).
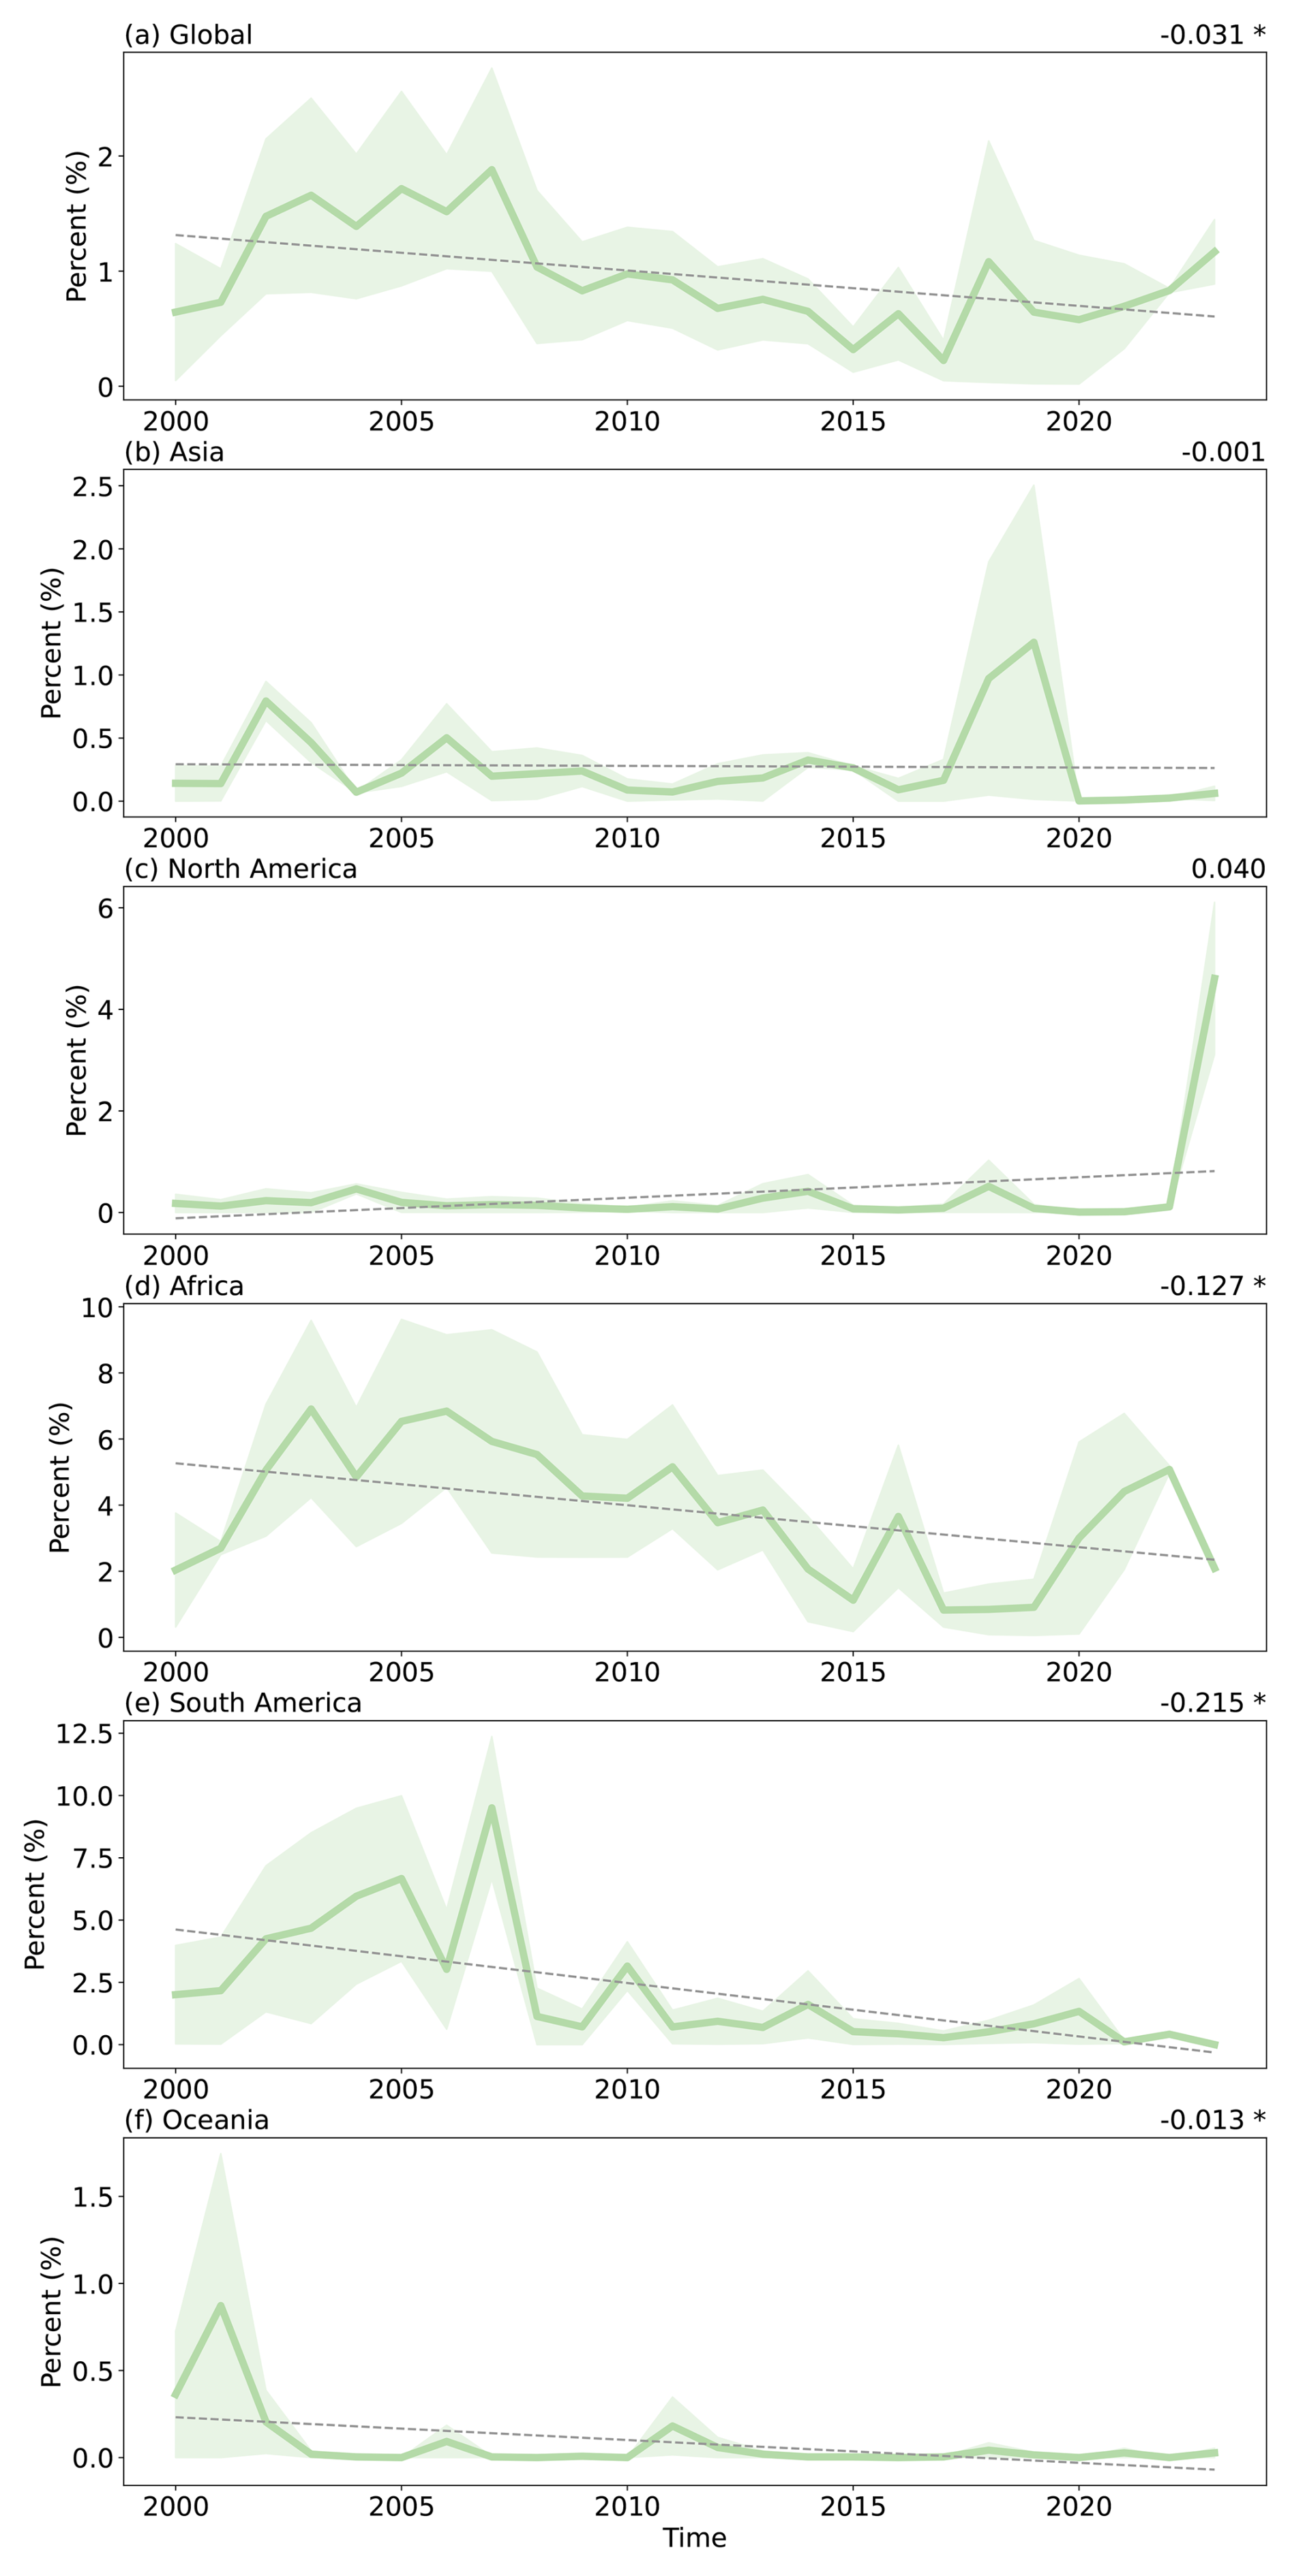
Figure 8Annual percentage of days and land grids with fire-sourced [PM2.5] exceeding 15 µg m3 in (a) Global, (b) Asia, (c) North America, (d) Africa, (e) South America, and (f) Oceania for 2000–2023. The average estimates from GFED and QFED are shown as bold lines, with shadings indicating their range. Regional trends are displayed in the top right of each panel, with an asterisk denoting significant (p<0.05) changes.
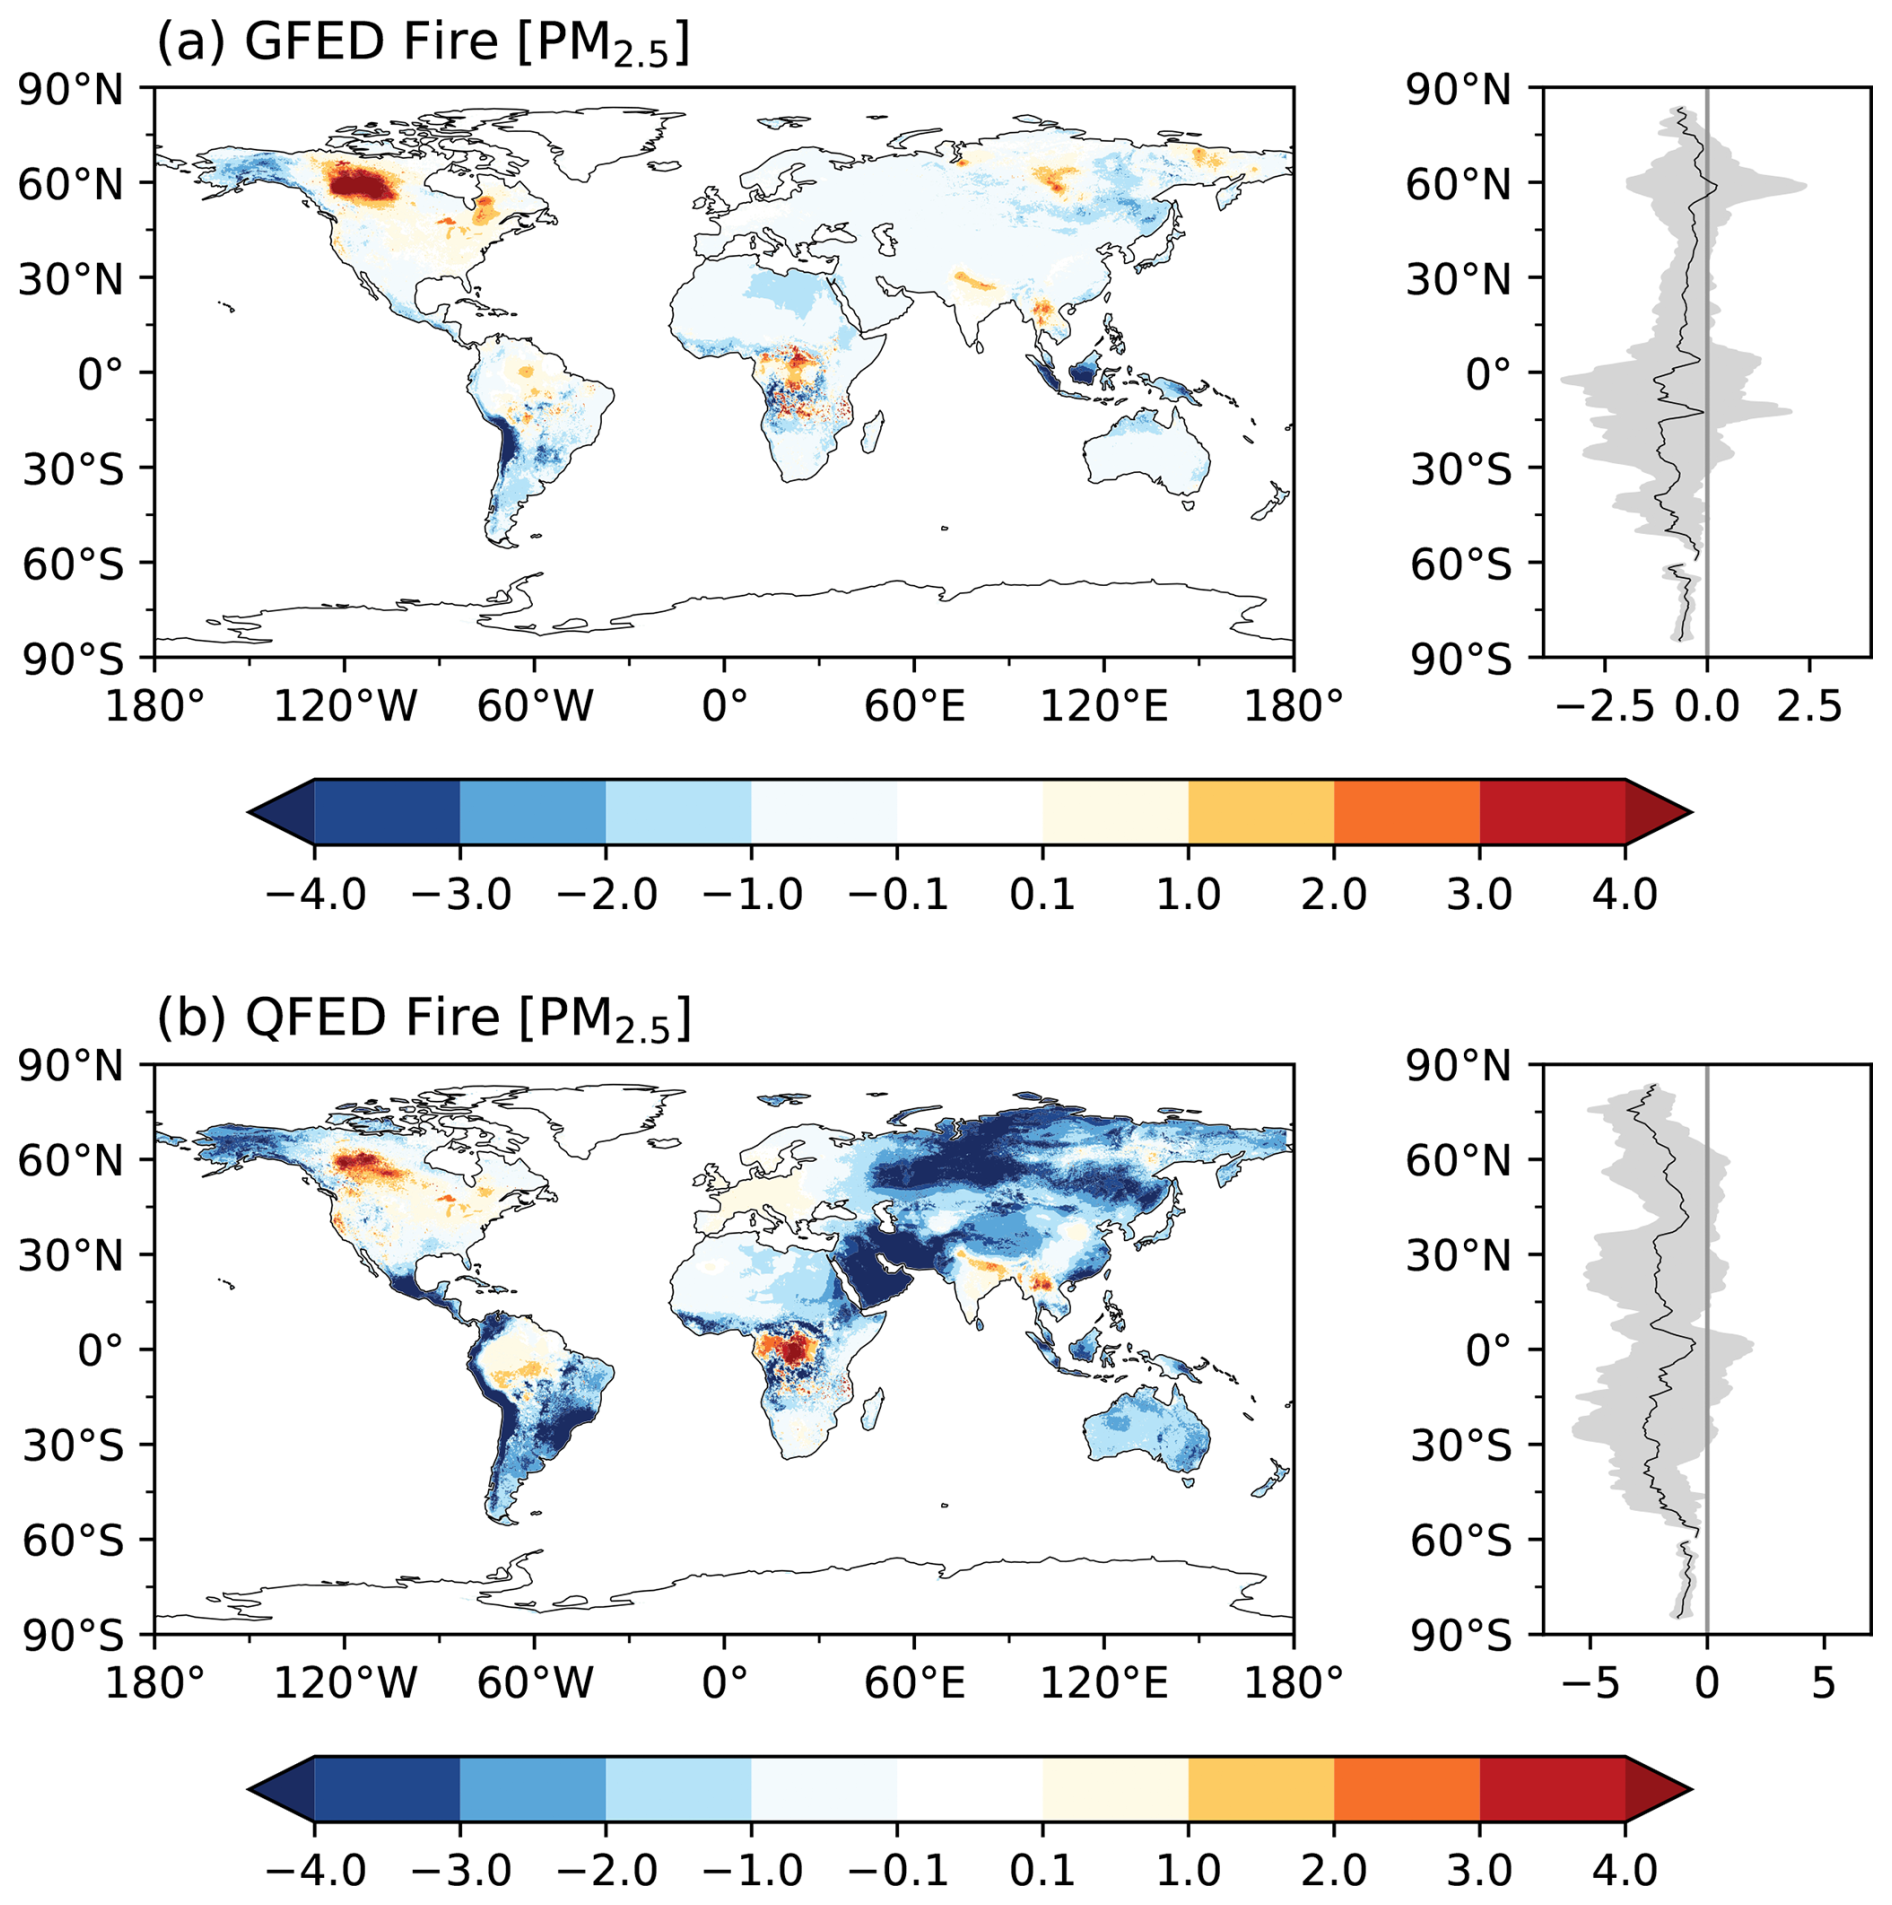
Figure 9Differences in the estimated fire-sourced PM2.5 (µg m−3) between 2020–2023 and 2000–2019 derived using the (a) GFED and (b) QFED inventories. The zonal averages and 1 standard deviation are shown on the right side.
The derived daily fire-sourced [PM2.5] for 2000–2023 is available at https://doi.org/10.5281/zenodo.15493914 for GFED (Hu et al., 2025a) and https://doi.org/10.5281/zenodo.15496596 for QFED (Hu et al., 2025b).
We developed a global high-resolution dataset of fire-sourced PM2.5 concentrations for the period 2000–2023, using a chemical transport model driven with two fire inventories. A machine learning algorithm was applied to correct biases in the simulated [PM2.5] from the GEOS-Chem model and to enhance the spatial resolution of the data product. Validations demonstrated its high accuracy in capturing the all-source [PM2.5] across more than 9000 global sites and the fire-sourced [PM2.5] for typical fire events. Though with some discrepancies, the fire-sourced [PM2.5] from the two inventories displayed a consistent spatial pattern, with high levels of fire-related air pollution in the tropics and relatively lower concentrations at the middle to high latitudes. They also exhibited significant global declines in fire-sourced [PM2.5] over time, with the most pronounced decreases occurring in the tropical regions. In contrast, fire episodes in boreal regions led to stronger enhancement of [PM2.5] compared to those in the tropics due to the larger fuel loads of northern forests and the uncontrolled scale of fires in these areas.
Recent advancements in ground monitoring networks and satellite observation systems have led to the development of high-resolution, long-term benchmark datasets for air pollutants (Gui et al., 2020; Song et al., 2022; Xiao et al., 2022; Wang et al., 2023; Wei et al., 2023). However, these datasets typically retrieve total amounts of PM2.5 without isolating the concentrations specifically caused by fire events. To accurately derive the fire-related [PM2.5], it is crucial to firstly estimate PM2.5 concentrations that are unaffected by fires. Some studies have identified fire-affected sites using satellite imagery and then obtained non-fire PM2.5 either by taking the median [PM2.5] during non-fire seasons or by using data at nearby sites outside the influence of fire plumes (O'Dell et al., 2019; Delp and Singer, 2020; Burke et al., 2023). This approach, however, depends heavily on the accuracy of high-frequency fire tracking systems to correctly identify fire periods and affected areas. Additionally, it may introduce biases due to not accounting for baseline [PM2.5] differences across various locations or periods. In our study, we performed sensitivity experiments using a CTM, where fire emissions were selectively activated or deactivated. This allowed us to more accurately quantify the changes in [PM2.5] attributable to fire emissions. Furthermore, we employed machine learning adjustments to minimize biases inherent in chemical models, thereby improving the accuracy and resolution of the derived fire-related [PM2.5].
We employed a similar approach to Xu et al. (2023) but incorporated new datasets and perspectives. First, we used global observed PM2.5 concentrations from 9541 monitoring sites, significantly more than the 5661 stations used in Xu et al. (2023). The expansion of ground-based stations, particularly in fire-prone regions such as Africa and South America, strengthens the foundation of model training and data validation. Second, we applied two different fire emission inventories. Comparisons showed that fire-sourced [PM2.5] estimates from these inventories were consistent during extreme fire episodes (Figs. 3 and S7). However, for low to moderate fire emissions, fire-sourced [PM2.5] from GFED was much lower than that from QFED (Fig. S8), suggesting that global population exposure to fire-related air pollution may have been underestimated in Xu et al. (2023) due to the application of GFED. Third, we extended the ending simulation year from 2019 to 2023, capturing an additional 4 years that included unprecedent fire events, such as the 2023 Canadian fires and the 2022 Brazilian fires. These events provide valuable data for assessing population exposure and the associated health impacts. Fourth, we found a global decreasing trend in fire-sourced [PM2.5] during 2000–2023, which contrasts with the increasing trend reported in Xu et al. (2023). This discrepancy may stem from differences in machine learning approaches (random forest vs. XGBoost in this study), pollution definitions (population-weighted vs. non-weighted), and observational datasets. Despite these differences, both studies identified a turning point in 2017, after which global fire-sourced [PM2.5] began to increase, with the most pronounced rise observed in boreal regions.
The two datasets derived from the different inventories showed discrepancies in both the long-term mean and trend of fire-sourced [PM2.5] (Fig. 5). In general, fire-related [PM2.5] is much higher when using the QFED inventory compared to GFED, but the long-term trend is more negative with QFED. As expected, these discrepancies can be attributed to differences in the underlying fire emission inventories (Fig. 6), which stem from variations in their estimation methods, data sources, and emission factors (Kaiser et al., 2012; Larkin et al., 2014; Jin et al., 2023). For example, QFED adjusts emission factors based on aerosol optical depth from MODIS (Petrenko et al., 2012; Li et al., 2022), resulting in significantly higher emissions in some regions compared to GFED. In contrast, GFED relies on burning pixels and changes in surface reflectance identified during satellite overpasses under relatively cloud-free conditions, which may lead to underestimation of burned areas, especially for some small fires (Pan et al., 2020). Further validations showed that all-source [PM2.5] using GFED yielded an R value of 0.58 ± 0.29 and an NMB of 10.68 % ± 24.96 % averaged for the 12 fire episodes (Fig. 3). Slightly improved statistical metrics were achieved using QFED, with an R value of 0.63 ± 0.26 and an NMB of 6.56 % ± 27.61 % for the same events (Fig. S7). However, these differences are too minor to conclusively determine which dataset provides a better estimate of fire-sourced [PM2.5]. Fire-sourced [PM2.5] is generally lower in GFED compared to QFED; exceptions exist, such as the 2023 Canadian fires, in which the fire-sourced [PM2.5] from GFED (Fig. 7) was significantly higher than that from QFED (Fig. S11). Therefore, we recommend using the average of the fire-sourced [PM2.5] from both inventories to indicate the mean state while using their difference as the range of uncertainties associated with fire-related air pollutants.
There are some uncertainties and limitations in our study. First, the PM2.5 observations used for machine learning lack broad spatial coverage. Although we gathered data from thousands of monitoring sites worldwide, most of them are located at the middle to high latitudes of the Northern Hemisphere. PM2.5 records are still limited in the fire-prone regions, such as central Africa, which are usually wildland areas far away from populated regions. This uneven distribution of monitoring sites may introduce some biases into the derived all-source [PM2.5] estimates and the subsequent contributions by fire emissions. Second, we used only one machine learning method for data training. In the preliminary stages, we compared the effectiveness of three different machine learning approaches in correcting biases in simulated [PM2.5]. We found that the XGBoost algorithm outperformed the other two methods, random forest and deep neural networks, showing better statistical metrics against observations (not shown). Although we chose XGBoost for the final analyses, further investigation into results from other machine learning algorithms is warranted to reduce uncertainties inherent in data-driven methods. Third, biases in the [PM2.5] simulated by the GC model may significantly affect the accuracy of machine learning. Predicting air pollutants involves uncertainties due to variations in meteorological forcing, chemical and physical schemes, and initial and boundary conditions. For example, Qiu et al. (2024) found that the GC model significantly overestimated [PM2.5] during extreme wildfire events in 2020 over the western US. In contrast, our derived fire-sourced [PM2.5], using the same GFED inventory, is much lower than the estimates of Childs et al. (2022) for low to median fire events (Fig. 4). These findings suggest that incorporating more validated fire inventories and/or chemical models is necessary to better quantify the uncertainties in derived air pollutant concentrations.
Despite the limitations mentioned, our study presents a significant advancement in the development of global daily fire-sourced [PM2.5] datasets, featuring the most up-to-date fine spatial resolution and covering the longest time period available. By integrating a chemical model with a machine learning approach, we have effectively isolated the impact of fire emissions on ground-level [PM2.5] while also addressing and reducing modeling biases. This methodology allows for a more accurate representation of fire-related air pollution. Furthermore, we provide results derived from two different emission inventories, offering a comparison that highlights the uncertainties associated with varying emission estimates. The dataset we have constructed is not only a novel contribution to the field but also holds significant value for future research. It can serve as a critical input for studies examining the climatic, ecological, and epidemiological impacts of air pollutants from global fires. The insights gained from this dataset can inform policy decisions, improve public health strategies, and enhance our understanding of the broader environmental effects of wildfire emissions.
The supplement related to this article is available online at https://doi.org/10.5194/essd-17-3741-2025-supplement.
XY conceived the study. XY, CT, and YH designed the research. YH performed the model runs, completed the data analysis, and wrote the draft. XY reviewed and edited the manuscript. YL, YC, RX, and YG helped with the methods. All of the authors contributed to the discussion of the results and the finalization of the paper.
The contact author has declared that none of the authors has any competing interests.
Publisher's note: Copernicus Publications remains neutral with regard to jurisdictional claims made in the text, published maps, institutional affiliations, or any other geographical representation in this paper. While Copernicus Publications makes every effort to include appropriate place names, the final responsibility lies with the authors.
The authors are grateful to the editor Jing Wei, Minghao Qiu, and an anonymous referee for their constructive comments that improved this study. We are also grateful for the technical support of the National Large Scientific and Technological Infrastructure “Earth System Numerical Simulation Facility” (https://cstr.cn/31134.02.EL, last access: 31 July 2025).
This study was jointly supported by the National Key Research and Development Program of China (grant no. 2023YFF0805402), the National Natural Science Foundation of China (grant no. 42405107), the Natural Science Foundation of Jiangsu Province (grant no. BK20240715), and the Jiangsu Funding Program for Excellent Postdoctoral Talent (grant no. 2023ZB113).
This paper was edited by Jing Wei and reviewed by Minghao Qiu and one anonymous referee.
Atuyambe, L. M., Etajak, S., Walyawula, F., Kasasa, S., Nyabigambo, A., Bazeyo, W., Wipfli, H., Samet, J. M., and Berhane, K. T.: Air quality and attributable mortality among city dwellers in Kampala, Uganda: results from 4 years of continuous PM2.5 concentration monitoring using BAM 1022 reference instrument, J. Expo. Sci. Env. Epid., 35, 288–293, https://doi.org/10.1038/s41370-024-00684-9, 2024.
Benchrif, A., Wheida, A., Tahri, M., Shubbar, R. M., and Biswas, B.: Air quality during three covid-19 lockdown phases: AQI, PM2.5 and NO2 assessment in cities with more than 1 million inhabitants, Sustain. Cities Soc., 74, 103170, https://doi.org/10.1016/j.scs.2021.103170, 2021.
Bistinas, I., Harrison, S. P., Prentice, I. C., and Pereira, J. M. C.: Causal relationships versus emergent patterns in the global controls of fire frequency, Biogeosciences, 11, 5087–5101, https://doi.org/10.5194/bg-11-5087-2014, 2014.
Breider, T. J., Mickley, L. J., Jacob, D. J., Wang, Q., Fisher, J. A., Chang, R. Y. W., and Alexander, B.: Annual distributions and sources of Arctic aerosol components, aerosol optical depth, and aerosol absorption, J. Geophys. Res.-Atmos., 119, 4107–4124, https://doi.org/10.1002/2013JD020996, 2014.
Burke, M., Childs, M. L., de la Cuesta, B., Qiu, M., Li, J., Gould, C. F., Heft-Neal, S., and Wara, M.: The contribution of wildfire to PM2.5 trends in the USA, Nature, 622, 761–766, https://doi.org/10.1038/s41586-023-06522-6, 2023.
Chen, G., Guo, Y., Yue, X., Tong, S., Gasparrini, A., Bell, M. L., Armstrong, B., Schwartz, J., Jaakkola, J. J. K., Zanobetti, A., Lavigne, E., Nascimento Saldiva, P. H., Kan, H., Royé, D., Milojevic, A., Overcenco, A., Urban, A., Schneider, A., Entezari, A., Vicedo-Cabrera, A. M., Zeka, A., Tobias, A., Nunes, B., Alahmad, B., Forsberg, B., Pan, S.-C., Íñiguez, C., Ameling, C., De la Cruz Valencia, C., Åström, C., Houthuijs, D., Van Dung, D., Samoli, E., Mayvaneh, F., Sera, F., Carrasco-Escobar, G., Lei, Y., Orru, H., Kim, H., Holobaca, I.-H., Kyselý, J., Teixeira, J. P., Madureira, J., Katsouyanni, K., Hurtado-Díaz, M., Maasikmets, M., Ragettli, M. S., Hashizume, M., Stafoggia, M., Pascal, M., Scortichini, M., de Sousa Zanotti Stagliorio Coêlho, M., Valdés Ortega, N., Ryti, N. R. I., Scovronick, N., Matus, P., Goodman, P., Garland, R. M., Abrutzky, R., Garcia, S. O., Rao, S., Fratianni, S., Dang, T. N., Colistro, V., Huber, V., Lee, W., Seposo, X., Honda, Y., Guo, Y. L., Ye, T., Yu, W., Abramson, M. J., Samet, J. M., and Li, S.: Mortality risk attributable to wildfire-related PM2.5 pollution: a global time series study in 749 locations, The Lancet Planetary Health, 5, e579–e587, https://doi.org/10.1016/S2542-5196(21)00200-X, 2021.
Chen, T. and Guestrin, C.: XGBoost: A Scalable Tree Boosting System, Proceedings of the 22nd ACM SIGKDD International Conference on Knowledge Discovery and Data Mining, 13–17 August 2016, San Francisco, California, USA, 785–794, https://doi.org/10.1145/2939672.2939785, 2016.
Childs, M. L., Li, J., Wen, J., Heft-Neal, S., Driscoll, A., Wang, S., Gould, C. F., Qiu, M., Burney, J., and Burke, M.: Daily Local-Level Estimates of Ambient Wildfire Smoke PM2.5 for the Contiguous US, Environ. Sci. Technol., 56, 13607–13621, https://doi.org/10.1021/acs.est.2c02934, 2022.
Connolly, R., Marlier, M. E., Garcia-Gonzales, D. A., Wilkins, J., Su, J., Bekker, C., Jung, J., Bonilla, E., Burnett, R. T., Zhu, Y., and Jerrett, M.: Mortality attributable to PM2.5 from wildland fires in California from 2008 to 2018, Science Advances, 10, eadl1252, https://doi.org/10.1126/sciadv.adl1252, 2024.
David, L. M., Ravishankara, A. R., Brewer, J. F., Sauvage, B., Thouret, V., Venkataramani, S., and Sinha, V.: Tropospheric ozone over the Indian subcontinent from 2000 to 2015: Data set and simulation using GEOS-Chem chemical transport model, Atmos. Environ., 219, 117039, https://doi.org/10.1016/j.atmosenv.2019.117039, 2019.
Delp, W. W. and Singer, B. C.: Wildfire Smoke Adjustment Factors for Low-Cost and Professional PM2.5 Monitors with Optical Sensors, Sensors-Basel, 20, 3683, https://doi.org/10.3390/s20133683, 2020.
Desservettaz, M. J., Fisher, J. A., Luhar, A. K., Woodhouse, M. T., Bukosa, B., Buchholz, R. R., Wiedinmyer, C., Griffith, D. W. T., Krummel, P. B., Jones, N. B., Deutscher, N. M., and Greenslade, J. W.: Australian Fire Emissions of Carbon Monoxide Estimated by Global Biomass Burning Inventories: Variability and Observational Constraints, J. Geophys. Res.-Atmos., 127, e2021JD035925, https://doi.org/10.1029/2021JD035925, 2022.
Geng, G., Xiao, Q., Liu, S., Liu, X., Cheng, J., Zheng, Y., Xue, T., Tong, D., Zheng, B., Peng, Y., Huang, X., He, K., and Zhang, Q.: Tracking Air Pollution in China: Near Real-Time PM2.5 Retrievals from Multisource Data Fusion, Environ. Sci. Technol., 55, 12106–12115, https://doi.org/10.1021/acs.est.1c01863, 2021.
Gu, B., Zhang, L., Van Dingenen, R., Vieno, M., Van Grinsven, H. J. M., Zhang, X., Zhang, S., Chen, Y., Wang, S., Ren, C., Rao, S., Holland, M., Winiwarter, W., Chen, D., Xu, J., and Sutton, M. A.: Abating ammonia is more cost-effective than nitrogen oxides for mitigating PM2.5 air pollution, Science, 374, 758–762, https://doi.org/10.1126/science.abf8623, 2021.
Gui, K., Che, H., Zeng, Z., Wang, Y., Zhai, S., Wang, Z., Luo, M., Zhang, L., Liao, T., Zhao, H., Li, L., Zheng, Y., and Zhang, X.: Construction of a virtual PM2.5 observation network in China based on high-density surface meteorological observations using the Extreme Gradient Boosting model, Environ. Int., 141, 105801, https://doi.org/10.1016/j.envint.2020.105801, 2020.
Heilman, W. E., Liu, Y., Urbanski, S., Kovalev, V., and Mickler, R.: Wildland fire emissions, carbon, and climate: Plume rise, atmospheric transport, and chemistry processes, Forest Ecol. Manag., 317, 70–79, https://doi.org/10.1016/j.foreco.2013.02.001, 2014.
Hu, Y., Yue, X., and Tian, C.: Climatic drivers of the Canadian wildfire episode in 2023, Atmospheric and Oceanic Science Letters, 17, 100483, https://doi.org/10.1016/j.aosl.2024.100483, 2024.
Hu, Y., Tian, C., and Yue, X.: GFED: Fire-sourced PM2.5 concentrations dataset, Zenodo [data set], https://doi.org/10.5281/zenodo.15493914, 2025a.
Hu, Y., Tian, C., and Yue, X.: QFED: Fire-sourced PM2.5 concentrations dataset, Zenodo [data set], https://doi.org/10.5281/zenodo.15496596, 2025b.
Jin, L., Permar, W., Selimovic, V., Ketcherside, D., Yokelson, R. J., Hornbrook, R. S., Apel, E. C., Ku, I.-T., Collett Jr., J. L., Sullivan, A. P., Jaffe, D. A., Pierce, J. R., Fried, A., Coggon, M. M., Gkatzelis, G. I., Warneke, C., Fischer, E. V., and Hu, L.: Constraining emissions of volatile organic compounds from western US wildfires with WE-CAN and FIREX-AQ airborne observations, Atmos. Chem. Phys., 23, 5969–5991, https://doi.org/10.5194/acp-23-5969-2023, 2023.
Kaiser, J. W., Heil, A., Andreae, M. O., Benedetti, A., Chubarova, N., Jones, L., Morcrette, J.-J., Razinger, M., Schultz, M. G., Suttie, M., and van der Werf, G. R.: Biomass burning emissions estimated with a global fire assimilation system based on observed fire radiative power, Biogeosciences, 9, 527–554, https://doi.org/10.5194/bg-9-527-2012, 2012.
Keller, C. A., Long, M. S., Yantosca, R. M., Da Silva, A. M., Pawson, S., and Jacob, D. J.: HEMCO v1.0: a versatile, ESMF-compliant component for calculating emissions in atmospheric models, Geosci. Model Dev., 7, 1409–1417, https://doi.org/10.5194/gmd-7-1409-2014, 2014.
Kim, P. S., Jacob, D. J., Fisher, J. A., Travis, K., Yu, K., Zhu, L., Yantosca, R. M., Sulprizio, M. P., Jimenez, J. L., Campuzano-Jost, P., Froyd, K. D., Liao, J., Hair, J. W., Fenn, M. A., Butler, C. F., Wagner, N. L., Gordon, T. D., Welti, A., Wennberg, P. O., Crounse, J. D., St. Clair, J. M., Teng, A. P., Millet, D. B., Schwarz, J. P., Markovic, M. Z., and Perring, A. E.: Sources, seasonality, and trends of southeast US aerosol: an integrated analysis of surface, aircraft, and satellite observations with the GEOS-Chem chemical transport model, Atmos. Chem. Phys., 15, 10411–10433, https://doi.org/10.5194/acp-15-10411-2015, 2015.
Knorr, W., Kaminski, T., Arneth, A., and Weber, U.: Impact of human population density on fire frequency at the global scale, Biogeosciences, 11, 1085–1102, https://doi.org/10.5194/bg-11-1085-2014, 2014.
Konovalov, I. B., Golovushkin, N. A., and Beekmann, M.: Wildfire-smoke-precipitation interactions in Siberia: Insights from a regional model study, Sci. Total Environ., 951, 175518, https://doi.org/10.1016/j.scitotenv.2024.175518, 2024.
Larkin, N. K., Raffuse, S. M., and Strand, T. M.: Wildland fire emissions, carbon, and climate: U. S. emissions inventories, Forest Ecol. Manag., 317, 61–69, https://doi.org/10.1016/j.foreco.2013.09.012, 2014.
Lei, Y., Yue, X., Liao, H., Zhang, L., Yang, Y., Zhou, H., Tian, C., Gong, C., Ma, Y., Gao, L., and Cao, Y.: Indirect contributions of global fires to surface ozone through ozone–vegetation feedback, Atmos. Chem. Phys., 21, 11531–11543, https://doi.org/10.5194/acp-21-11531-2021, 2021.
Li, F., Zhang, X., Kondragunta, S., Lu, X., Csiszar, I., and Schmidt, C. C.: Hourly biomass burning emissions product from blended geostationary and polar-orbiting satellites for air quality forecasting applications, Remote Sens. Environ., 281, 113237, https://doi.org/10.1016/j.rse.2022.113237, 2022.
Li, S., Zhang, L., Cai, K., Ge, W., and Zhang, X.: Comparisons of the vertical distributions of aerosols in the CALIPSO and GEOS-Chem datasets in China, Atmospheric Environment: X, 3, 100036, https://doi.org/10.1016/j.aeaoa.2019.100036, 2019.
Li, Y., Li, M., Li, C., and Liu, Z.: Forest aboveground biomass estimation using Landsat 8 and Sentinel-1A data with machine learning algorithms, Sci. Rep.-UK, 10, 9952, https://doi.org/10.1038/s41598-020-67024-3, 2020.
Lu, X., Zhang, L., Chen, Y., Zhou, M., Zheng, B., Li, K., Liu, Y., Lin, J., Fu, T.-M., and Zhang, Q.: Exploring 2016–2017 surface ozone pollution over China: source contributions and meteorological influences, Atmos. Chem. Phys., 19, 8339–8361, https://doi.org/10.5194/acp-19-8339-2019, 2019.
Ma, J., Cheng, J. C. P., Xu, Z., Chen, K., Lin, C., and Jiang, F.: Identification of the most influential areas for air pollution control using XGBoost and Grid Importance Rank, J. Clean. Prod., 274, 122835, https://doi.org/10.1016/j.jclepro.2020.122835, 2020.
Mao, J., Paulot, F., Jacob, D. J., Cohen, R. C., Crounse, J. D., Wennberg, P. O., Keller, C. A., Hudman, R. C., Barkley, M. P., and Horowitz, L. W.: Ozone and organic nitrates over the eastern United States: Sensitivity to isoprene chemistry, J. Geophys. Res.-Atmos., 118, 11256–11268, https://doi.org/10.1002/jgrd.50817, 2013.
Markakis, K., Valari, M., Perrussel, O., Sanchez, O., and Honore, C.: Climate-forced air-quality modeling at the urban scale: sensitivity to model resolution, emissions and meteorology, Atmos. Chem. Phys., 15, 7703–7723, https://doi.org/10.5194/acp-15-7703-2015, 2015.
Marques, J. F., Alves, M. B., Silveira, C. F., Amaral e Silva, A., Silva, T. A., dos Santos, V. J., and Calijuri, M. L.: Fires dynamics in the Pantanal: Impacts of anthropogenic activities and climate change, J. Environ. Manage., 299, 113586, https://doi.org/10.1016/j.jenvman.2021.113586, 2021.
Melia, N., Dean, S., Pearce, H. G., Harrington, L., Frame, D. J., and Strand, T.: Aotearoa New Zealand's 21st-Century Wildfire Climate, Earths Future, 10, e2022EF002853, https://doi.org/10.1029/2022EF002853, 2022.
O'Dell, K., Ford, B., Fischer, E. V., and Pierce, J. R.: Contribution of Wildland-Fire Smoke to US PM2.5 and Its Influence on Recent Trends, Environ. Sci. Technol., 53, 1797–1804, https://doi.org/10.1021/acs.est.8b05430, 2019.
Pan, X., Ichoku, C., Chin, M., Bian, H., Darmenov, A., Colarco, P., Ellison, L., Kucsera, T., da Silva, A., Wang, J., Oda, T., and Cui, G.: Six global biomass burning emission datasets: intercomparison and application in one global aerosol model, Atmos. Chem. Phys., 20, 969–994, https://doi.org/10.5194/acp-20-969-2020, 2020.
Pechony, O. and Shindell, D. T.: Fire parameterization on a global scale, J. Geophys. Res.-Atmos., 114, D16115, https://doi.org/10.1029/2009JD011927, 2009.
Perry, G. L. W. and Dickson, M. E.: Using Machine Learning to Predict Geomorphic Disturbance: The Effects of Sample Size, Sample Prevalence, and Sampling Strategy, J. Geophys. Res.-Earth, 123, 2954–2970, https://doi.org/10.1029/2018JF004640, 2018.
Petrenko, M., Kahn, R., Chin, M., Soja, A., Kucsera, T., and Harshvardhan: The use of satellite-measured aerosol optical depth to constrain biomass burning emissions source strength in the global model GOCART, J. Geophys. Res.-Atmos., 117, D18212, https://doi.org/10.1029/2012JD017870, 2012.
Protonotariou, A., Tombrou, M., Giannakopoulos, C., Kostopoulou, E., and Le Sager, P.: Study of CO surface pollution in Europe based on observations and nested-grid applications of GEOS-CHEM global chemical transport model, Tellus B, 62, 209–227, https://doi.org/10.1111/j.1600-0889.2010.00462.x, 2010.
Qiu, M., Kelp, M., Heft-Neal, S., Jin, X., Gould, C. F., Tong, D. Q., and Burke, M.: Evaluating Chemical Transport and Machine Learning Models for Wildfire Smoke PM2.5: Implications for Assessment of Health Impacts, Environ. Sci. Technol., 58, 22880–22893, https://doi.org/10.1021/acs.est.4c05922, 2024.
Roberts, G. and Wooster, M. J.: Global impact of landscape fire emissions on surface level PM2.5 concentrations, air quality exposure and population mortality, Atmos. Environ., 252, 118210, https://doi.org/10.1016/j.atmosenv.2021.118210, 2021.
Salana, S., Yu, H., Dai, Z., Subramanian, P. S. G., Puthussery, J. V., Wang, Y., Singh, A., Pope, F. D., Leiva G, M. A., Rastogi, N., Tripathi, S. N., Weber, R. J., and Verma, V.: Inter-continental variability in the relationship of oxidative potential and cytotoxicity with PM2.5 mass, Nat. Commun., 15, 5263, https://doi.org/10.1038/s41467-024-49649-4, 2024.
Song, Z., Chen, B., Zhang, P., Guan, X., Wang, X., Ge, J., Hu, X., Zhang, X., and Wang, Y.: High temporal and spatial resolution PM2.5 dataset acquisition and pollution assessment based on FY-4A TOAR data and deep forest model in China, Atmos. Res., 274, 106199, https://doi.org/10.1016/j.atmosres.2022.106199, 2022.
van der Werf, G. R., Randerson, J. T., Giglio, L., van Leeuwen, T. T., Chen, Y., Rogers, B. M., Mu, M., van Marle, M. J. E., Morton, D. C., Collatz, G. J., Yokelson, R. J., and Kasibhatla, P. S.: Global fire emissions estimates during 1997–2016, Earth Syst. Sci. Data, 9, 697–720, https://doi.org/10.5194/essd-9-697-2017, 2017.
Wang, L., Liu, B., Li, R., Chen, X., Liu, L., Tang, X., Liu, J., Liao, Z., Xin, J., Wang, Y., and Hu, B.: Prediction of daily PM2.5 and ozone based on high-density weather stations in China: Nonlinear effects of meteorology, human and ecosystem health risks, Atmos. Res., 293, 106889, https://doi.org/10.1016/j.atmosres.2023.106889, 2023.
Ward, D. S., Kloster, S., Mahowald, N. M., Rogers, B. M., Randerson, J. T., and Hess, P. G.: The changing radiative forcing of fires: global model estimates for past, present and future, Atmos. Chem. Phys., 12, 10857–10886, https://doi.org/10.5194/acp-12-10857-2012, 2012.
Ward, D. S., Shevliakova, E., Malyshev, S., and Rabin, S.: Trends and Variability of Global Fire Emissions Due To Historical Anthropogenic Activities, Global Biogeochem. Cy., 32, 122–142, https://doi.org/10.1002/2017gb005787, 2018.
Wei, J., Huang, W., Li, Z., Xue, W., Peng, Y., Sun, L., and Cribb, M.: Estimating 1-km-resolution PM2.5 concentrations across China using the space-time random forest approach, Remote Sens. Environ., 231, 111221, https://doi.org/10.1016/j.rse.2019.111221, 2019.
Wei, J., Li, Z., Lyapustin, A. I., Sun, L., Peng, Y., Xue, W., Su, T., and Cribb, M.: Reconstructing 1-km-resolution high-quality PM2.5 data records from 2000 to 2018 in China: spatiotemporal variations and policy implications, Remote Sens. Environ., 252, 112136, https://doi.org/10.1016/j.rse.2020.112136, 2021.
Wei, J., Li, Z., Lyapustin, A., Wang, J., Dubovik, O., Schwartz, J., Sun, L., Li, C., Liu, S., and Zhu, T.: First close insight into global daily gapless 1 km PM2.5 pollution, variability, and health impact, Nat. Commun., 14, 8349, https://doi.org/10.1038/s41467-023-43862-3, 2023.
Wolke, R., Schröder, W., Schrödner, R., and Renner, E.: Influence of grid resolution and meteorological forcing on simulated European air quality: A sensitivity study with the modeling system COSMO–MUSCAT, Atmos. Environ., 53, 110–130, https://doi.org/10.1016/j.atmosenv.2012.02.085, 2012.
Wong, P.-Y., Lee, H.-Y., Chen, Y.-C., Zeng, Y.-T., Chern, Y.-R., Chen, N.-T., Candice Lung, S.-C., Su, H.-J., and Wu, C.-D.: Using a land use regression model with machine learning to estimate ground level PM2.5, Environ. Pollut., 277, 116846, https://doi.org/10.1016/j.envpol.2021.116846, 2021.
Xiao, Q., Geng, G., Cheng, J., Liang, F., Li, R., Meng, X., Xue, T., Huang, X., Kan, H., Zhang, Q., and He, K.: Evaluation of gap-filling approaches in satellite-based daily PM2.5 prediction models, Atmos. Environ., 244, 117921, https://doi.org/10.1016/j.atmosenv.2020.117921, 2021.
Xiao, Y., Wang, Y., Yuan, Q., He, J., and Zhang, L.: Generating a long-term (2003–2020) hourly 0.25° global PM2.5 dataset via spatiotemporal downscaling of CAMS with deep learning (DeepCAMS), Sci. Total Environ., 848, 157747, https://doi.org/10.1016/j.scitotenv.2022.157747, 2022.
Xie, Y., Zhou, M., Hunt, K. M. R., and Mauzerall, D. L.: Recent PM2.5 air quality improvements in India benefited from meteorological variation, Nature Sustainability, 7, 983–993, https://doi.org/10.1038/s41893-024-01366-y, 2024.
Xu, R., Yu, P., Abramson, M. J., Johnston, F. H., Samet, J. M., Bell, M. L., Haines, A., Ebi, K. L., Li, S., and Guo, Y.: Wildfires, Global Climate Change, and Human Health, New Engl. J. Med., 383, 2173–2181, https://doi.org/10.1056/NEJMsr2028985, 2020.
Xu, R., Ye, T., Yue, X., Yang, Z., Yu, W., Zhang, Y., Bell, M. L., Morawska, L., Yu, P., Zhang, Y., Wu, Y., Liu, Y., Johnston, F., Lei, Y., Abramson, M. J., Guo, Y., and Li, S.: Global population exposure to landscape fire air pollution from 2000 to 2019, Nature, 621, 521–529, https://doi.org/10.1038/s41586-023-06398-6, 2023.
Xu, X., Wang, J., Henze, D. K., Qu, W., and Kopacz, M.: Constraints on aerosol sources using GEOS-Chem adjoint and MODIS radiances, and evaluation with multisensor (OMI, MISR) data, J. Geophys. Res.-Atmos., 118, 6396–6413, https://doi.org/10.1002/jgrd.50515, 2013.
Yan, Y., Lin, J., and He, C.: Ozone trends over the United States at different times of day, Atmos. Chem. Phys., 18, 1185–1202, https://doi.org/10.5194/acp-18-1185-2018, 2018.
Yue, X., Hu, Y., Tian, C., Xu, R., Yu, W., and Guo, Y.: Increasing impacts of fire air pollution on public and ecosystem health, The Innovation, 5, 100609, https://doi.org/10.1016/j.xinn.2024.100609, 2024.
Zhang, D., Wang, W., Xi, Y., Bi, J., Hang, Y., Zhu, Q., Pu, Q., Chang, H., and Liu, Y.: Wildland Fires Worsened Population Exposure to PM2.5 Pollution in the Contiguous United States, Environ. Sci. Technol., 57, 19990–19998, https://doi.org/10.1021/acs.est.3c05143, 2023.
Zhou, S., Collier, S., Jaffe, D. A., and Zhang, Q.: Free tropospheric aerosols at the Mt. Bachelor Observatory: more oxidized and higher sulfate content compared to boundary layer aerosols, Atmos. Chem. Phys., 19, 1571–1585, https://doi.org/10.5194/acp-19-1571-2019, 2019.
Zhu, A., Xu, H., Deng, J., Ma, J., and Li, S.: El Niño–Southern Oscillation (ENSO) effect on interannual variability in spring aerosols over East Asia, Atmos. Chem. Phys., 21, 5919–5933, https://doi.org/10.5194/acp-21-5919-2021, 2021.