the Creative Commons Attribution 4.0 License.
the Creative Commons Attribution 4.0 License.
 | 10 Jul 2025
Integrating point sources to map anthropogenic atmospheric mercury emissions in China, 1978–2021
Yuying Cui
Qingru Wu
Shuxiao Wang
Kaiyun Liu
Shengyue Li
Zhezhe Shi
Daiwei Ouyang
Zhongyan Li
Qinqin Chen
Changwei Lü
Yi Tang
Yan Wang
Jiming Hao
Mercury emissions from human activities persist in the environment, posing risks to humans and ecosystem, and are regulated by the Minamata Convention. Understanding historical mercury emissions is critical for explaining their presence in the environment, and a long-term gridded emission inventory is essential for simulation and evaluation. While previous studies have improved the spatial resolution of emission inventories for recent years, few have combined long timescales with high spatial resolutions. Here, we compile a new comprehensive point source database by fusing multiple data sources and integrate it with the previous China Atmospheric Mercury Emission model to develop a long-term gridded emission inventory for China, covering 1978–2021, named P-CAME. By integrating point sources, P-CAME improves the accuracy of gridded emissions, reducing the normalized mean error by 108 % compared to an inventory without point sources for the most recent year of 2021. P-CAME highlights potential pollution hotspots, revealing that 20 % of cumulative emissions originate from just 0.3 % of the grids, primarily in the provinces of Gansu, Yunnan, and Hunan. These areas are dominated by non-ferrous metal smelting or mixed emissions from coal-fired industries and cement production. P-CAME also demonstrates consistency with observed Hg0 (gaseous elemental mercury) concentration trends over the past decade and shows potential to enhance the simulation of atmospheric mercury concentrations in urban areas, though its capacity is still limited by overall model performance. With improvements in terms of spatial distribution accuracy and reliable long-term trends, this updated inventory will provide valuable data support for global emissions modeling, facilitate assessments of mercury cycling and legacy impacts, and aid in the evaluation of the Minamata Convention. The dataset can be found at https://doi.org/10.6084/m9.figshare.26076907 (Cui et al., 2024).
- Article
(6478 KB) - Full-text XML
-
Supplement
(1855 KB) - BibTeX
- EndNote


Mercury is a persistent environmental pollutant that is harmful to the nervous systems and can affect health across generations. Human activities have liberated mercury from stable long-lived reservoirs, mainly geologic deposits and coal, and have allowed it to reach the Earth's surface, leading to 3- to 5-fold increases in mercury content on the land, in the atmosphere, and in the oceans since the industrial revolution (Streets et al., 2011; Corbitt et al., 2011; Selin, 2009; Selin et al., 2008). The increased load of mercury in the environment poses significant risks to human health and ecosystems worldwide (Selin, 2009; Bishop et al., 2020; Amos et al., 2013; Li et al., 2022; Meng et al., 2011; Giang and Selin, 2016; Smith-Downey et al., 2010), promoting the establishment of the Minamata Convention on Mercury in 2013, a legally binding international treaty aimed at regulating mercury use and emissions in and through human activities. In accordance with the convention's regulation, the fifth Conference of the Parties formally initiated the first effectiveness evaluation of the convention at the end of 2023. Updated historical mercury emissions, with both temporal continuity and spatial precision, are critical and urgent in understanding the changing trajectory and present state of mercury pollution and in evaluating the effectiveness of pollution control efforts.
Amidst a wide array of studies, four main global emission inventories stand out for their comprehensiveness and broad implications for CTMs (chemical transport models): those established by Streets et al. (2011, 2019; referred to hereafter as Streets), EDGAR (Muntean et al., 2014, 2018), AMAP/UNEP (AMAP/UNEP, 2013, 2019), and WHET (Zhang et al., 2016b). The annual emission magnitudes across inventories are ranked as WHET > Streets > AMAP/UNEP > EDGAR. Spatially, higher-emission grids are observed in WHET, Streets, and AMAP/UNEP for 2010, whereas EDGAR shows lower emissions, particularly in East and South Asia. Regarding long-term trends, EDGAR and Streets exhibit a gradual increase in emissions from 1980 to 2012 and from 1980 to 2015, respectively. In contrast, WHET shows a decline followed by an increase during 1990–2010. These emission inventories have been extensively used in CTMs to simulate the atmospheric transport, transformation, and deposition of Hg. Comparing simulated Hg0 concentrations with observations provides a critical metric for evaluating the performance of emission inventories in CTMs. Despite discrepancies among inventories in terms of emission magnitudes, species composition, and spatial distributions, a study employing the ECHMERIT model (Jung et al., 2009) reported no statistically significant differences in terms of regression slopes when inventory-based simulations were compared with observational data (Simone et al., 2016). In terms of trends, both Streets and EDGAR indicate increasing emissions. However, when Streets inventory data were used as CTM inputs, the simulated Hg0 concentrations conflicted with the observed decline in atmospheric Hg0 concentrations in the Northern Hemisphere during 2005–2020 (Feinberg et al., 2024). Anthropogenic emissions were identified as the primary driver of the divergence between simulated and observed Hg0 concentrations and the associated declining trend (Feinberg et al., 2024). The WHET inventory, which incorporates updated country-specific emissions for China, India, the US, and western Europe, successfully reproduced observed atmospheric Hg concentration declines in GEOS-Chem simulations (Zhang et al., 2016b). Emission estimates from WHET for 1990, 2000, and 2010 were 1.3 to 2.4 times higher than those reported by Streets or EDGAR, highlighting the pivotal role of regional emissions in accurately capturing global emission trends and aligning them with observational data.
In particular, China has garnered great attention due to its substantial emission levels, complex source profiles, and swift advancement of control technologies. These factors collectively pose challenges to precisely estimating atmospheric mercury emissions in China. Prior research projects have reduced the uncertainty of emission factors through extensive field experiments in China, culminating in the development of regional, sectoral, and national emission inventories for specific years (Wu et al., 2006, 2016; Tian et al., 2010, 2015; Zhang et al., 2015, 2023; Zhao et al., 2015; Liu et al., 2019). Among these, three notable decadal emission inventories have been developed (Tian et al., 2015; Wu et al., 2016; Zhang et al., 2023). Yet, variations in emission trends, particularly after 2010, were pronounced. Tian et al. (2015) provided neither long-term spatial characteristics nor species profiles, limiting the comprehensiveness of their inventory. Wu et al. (2016) presented gridded emission data, but their reliance on population and GDP proxies introduced a notable degree of uncertainty with regard to spatial accuracy. Zhang et al. (2023) took a step forward by aligning emissions from several critical sectors with point source locations; however, detailed gridded emissions were made available only for 2010, 2015, and 2020. These inventories underscore a persistent gap in fine-resolution gridded and speciated mercury emission data in China, which are essential for evaluating the present state of mercury pollution and supporting effective regulatory actions.
Here, we introduce a novel, speciated annual mercury emission inventory spanning from 1978 to 2021, derived from the point-source-integrated China Atmospheric Mercury Emission model, herein referred to as the P-CAME inventory. This updated inventory opens avenues for enhancing our comprehension of atmospheric mercury pollution. Crucially, our inventory's accurate, annual, high-resolution emission maps can identify cumulative emission hotspots and highlight areas of potential multi-media environmental impacts. This inventory is publicly accessible and maintains temporal and spatial consistency with simulation performance for future studies and lays a solid foundation for discussions on anthropogenic emissions, atmospheric pollution, and health implications. Furthermore, it is poised to offer robust support for the inaugural evaluation of the effectiveness of the Minamata Convention.
2.1 P-CAME emission inventory
This study coupled the China Atmospheric Mercury Emission model (Zhang et al., 2015; Wu et al., 2016) with the point source database to generate the P-CAME emission inventory. The 24 studied sectors (Table S1 in the Supplement) were divided into three categories (tiers 1–3). Tier 1 was the point source emission category, including coal-fired power plants (CFPPs), zinc smelting (Zn), lead smelting (Pb), copper smelting (Cu), cement production (CEM), iron and steel production (ISP), coal-fired industrial boilers (CFIBs), municipal solid-waste incineration (MSWI), and large-scale gold production (LSGP). Emissions in tier 1 were computed using facility-level activity and dynamic technology-based emission factors (Eq. S1 in the Supplement). Emissions from other sectors were calculated using provincial activity data combined with probabilistic technology-based emission factors (tier 2, Eq. S2) or time-varying emission factors (tier 3, Eq. S3). To acquire gridded emissions for sectors in tier 2 and tier 3, source-specific spatial proxies (Table S1) were used to allocate provincial area sources to grids at a resolution of 0.25°×0.3125°. Emissions from each point source were assigned to the grid corresponding to their geographical coordinates and combined with non-point source data to create comprehensive emission maps at a resolution of 0.25°×0.3125° for total mercury (HgT) and each mercury species, namely gaseous elemental mercury (Hg0), gaseous oxidized mercury (HgII), and particulate-bound mercury (HgP).
2.1.1 Point source emission model (tier 1)
Annual facility-level activity was from the point source database. The point source database combined point sources we could get from environmental statistics, industry associations, pollution source censuses, yearbooks of various industry sectors, and previous studies, as shown in Table S2. To construct the point source database, detailed data collected for each facility included corporate name, type of industry, capacity, types of raw materials or fuels used, production or consumption levels, production or combustion processes, control technologies, and geographical information. Data from various sources were integrated based on the Unified Corporate Social Credit Code unique to each enterprise. Missing information for point sources in the database was addressed using data retrieval or assimilation methods. The Baidu Map System (2023) and Qichacha website (Qichacha, 2023) were used to fill in missing coordinates and operational years, respectively. For 2013–2021, we acquired the point source activity for each year and validated and adjusted the activity by comparing it with provincial activity from the yearbook. For earlier years, where varying activity information was more difficult to obtain, we used point source data from the best-validated year and time-varying provincial activity to estimate point source activity for the period 1978–2012. Specifically, for the annual activity, we first extracted operating-facility data for the current year based on their operational years. Then, the activity was obtained by multiplying the provincial activity in that year by the proportion of the point source activity in the province. Dynamic technology-based emission factors for point sources were derived from provincial mercury concentrations in fuel or raw materials, combustion or production technology release rates, air pollution control device (APCD) removal efficiencies, and speciation profiles (Eq. S1). Raw mercury concentrations in fuel or raw materials were obtained from our previous studies (Zhang et al., 2012; Wu et al., 2012; Liu et al., 2018). Release rates and mercury removal efficiency were obtained from field experiments (Zhang et al., 2016a; Zhang, 2012; Chang and Ghorishi, 2003; Omine et al., 2012). The removal efficiencies and speciation profiles for APCDs were detailed in Table S3.
2.1.2 Probabilistic technology-based emission model (tier 2)
Annual provincial activity information for sectors in tier 2 was obtained from statistical yearbooks (Table S2). To estimate mercury emissions with greater accuracy and reduced bias, Monte Carlo simulations were applied to produce probabilistic technology-based emission factors, addressing the variability and uncertainty in key parameters. Emission factors were calculated based on the provincial mercury concentration in fuel or raw materials (log-normal distribution), release rates associated with combustion or production technologies (as specified for coal-fired sectors), removal efficiencies of APCDs (normal or Weibull distributions), and the proportions of mercury species determined by APCD combinations (Eq. S2). Raw mercury concentration data and their standard deviations were sourced from previous studies (Zhang et al., 2012; Wu et al., 2012; Liu et al., 2018, 2019), while mercury removal efficiencies and release rates were obtained from prior research based on field experiments (Zhang et al., 2016a; Zhang, 2012; Chang and Ghorishi, 2003; Omine et al., 2012). Speciated mercury proportions for various APCD combinations were derived from our earlier work (Liu et al., 2019; Zhang et al., 2023; Wu et al., 2016). By incorporating these parameters into Monte Carlo simulations, probabilistic emission factors were generated, providing a robust and comprehensive estimation of mercury emissions across tier-2 sectors.
2.1.3 Time-varying emission model (tier 3)
Annual provincial activity information for sectors in tier 3 was obtained from statistical yearbooks, Chinese environmental statistics, and investigation reports (Table S2). The emission factors for tier-3 sectors dynamically changed with technology iterations, assuming that emission factors fit a transformed normal distribution due to the dynamics of technology change (Tian et al., 2015; Streets et al., 2011). The emission factor for a specific year was calculated using the emission factor at the beginning year of technological transition (efa) and the best achievable emission factor (efb), as outlined in Eq. (S3). The parameters efa and efb and the curve shape parameter S were derived from previous studies (Tian et al., 2015; Streets et al., 2011; Wu et al., 2006, 2016; Zhang et al., 2015).
Provincial emissions from sectors in tier 2 and tier 3 were allocated to grids at a resolution of 0.25°×0.3125° using a newly developed spatial allocation system, as detailed in Table S1. This allocation relied on proxies such as GDP, population data, and a roadmap dataset. Provincial non-point sources were first allocated to the city level based on GDP and then further distributed to the grid level using either population or road network datasets, as specified in Eq. (S4). City-level GDP data were extracted from statistical yearbooks, with the GDPs of primary, secondary, and tertiary industries being utilized for various sectors, as detailed in Table S1. Population data at the grid level were obtained from the resource and environmental science data registration and publication system (Xu, 2017). While population data were available for select years (1990, 1995, 2000, 2005, 2010, 2015, and 2019), data for intermediate years were interpolated. Specifically, data for the years 1978–1989 were estimated based on available data and observed trends during the period of 1990–2000. Road network data utilized in this study were sourced from OpenStreetMap contributors (2023). The widths of various route types in the road network were determined based on classifications provided in the Interim Provisions on Urban Planning Quota Index (MOHURD, 1980). These routes were then converted into areas and subdivided into grids. The gridded routes served as a proxy for the spatial distribution of atmospheric mercury emissions from the transportation sector. To develop this long-term anthropogenic mercury emission dataset, software tools such as ArcGIS and MATLAB were employed.
2.2 Uncertainty analysis
Monte Carlo simulation assessed mercury emission uncertainty using key parameters and their probability distributions. Parameters included activities, mercury concentrations in fuel and/or raw materials, and mercury removal efficiencies of APCDs. Activities were normally distributed, with variation coefficients of 5 %–30 % (Liu et al., 2019). Mercury concentrations followed a log-normal distribution, and mercury removal efficiencies followed normal or Weibull distributions, which were generated based on field experiments (Zhang et al., 2012, 2016a; Wu et al., 2012; Liu et al., 2018; Zhang, 2012; Chang and Ghorishi, 2003; Omine et al., 2012). MATLAB conducted 10 000 Monte Carlo simulations. Mean values served as the best estimates, with the 2.5 % and 97.5 % quantiles establishing the lower and upper limits of the simulation results.
2.3 Evaluation and validation of emission inventory
We applied a global 3-D atmospheric chemistry model (GEOS-Chem, v12.6.3, http://geos-chem.org, last accessed: 21 Dec ember 019) to simulate atmospheric mercury concentrations from 2006 to 2021. A 3-year spin-up (2006–2008) was used to achieve balanced concentrations, which serve as the restart field for the analysis year (2009–2021). The global simulation was conducted at a resolution of 2.0°×2.5° to provide boundary conditions for a nested simulation over the China region, which had a finer resolution of 0.5°×0.625° and 47 vertical levels. Meteorological input was driven by the Modern-Era Retrospective analysis for Research and Applications, Version 2 (MERRA2) (Gelaro et al., 2017). For the global simulation, the EDGAR emission inventory was used as it provides long-term emissions data for the entire simulation period. However, since EDGAR tends to underestimate emissions in China, we replaced China's emissions with the P-CAME inventory. Biomass burning emissions were calculated based on GFED4 (van der Werf et al., 2017), while geogenic activities, soil emission, and re-emission followed the calculation scheme outlined in Selin et al. (2008). The chemical scheme in GEOS-Chem v12.6.3 involves the oxidation of Hg0 through a two-step mechanism initiated by Br. Photoreduction of Hg2 occurs in the aqueous phase and is governed by the NO2 photolysis rate and organic aerosol concentrations (Horowitz et al., 2017).
To assess the impacts of the point source inventory, we designed two simulation scenarios with different anthropogenic emission inputs: one using P-CAME and the other relying solely on proxies for emission allocation, referred to as “only-proxy-based” hereafter. In the only-proxy-based inventory, original point source sectors were initially calculated at the provincial level and then distributed to grids based on secondary GDP and population. We compared the simulations from both scenarios with monthly observations of atmospheric mercury concentrations for 2020. For the long-term simulation, we evaluated and compared the results using P-CAME against observed data to assess its performance over time. We applied the normalized mean bias (NMB), normalized mean error (NME), root mean square error (RMSE), and Pearson correlation coefficient (R) to quantify these comparisons, with their calculations provided in Eqs. (S5)–(S8).
We included Hg0 concentration observations from 10 sites, comprising 4 urban sites and 6 rural sites (Sun et al., 2024; Wu et al., 2023; Shao et al., 2022; Feng et al., 2024; Tang et al., 2018). For the Chongming, Tsinghua, Miyun, and Hohhot sites, we present long-term observational data for the first time from our own measurements at these locations. Most sites, except for Qingdao, have long-term observations, enabling a comparison of long-term trends with simulations. At the Qingdao site, data are only available for 2020–2021; thus, this dataset was used exclusively to compare simulations based on the P-CAME and only-proxy-based inventories. Additionally, observed meteorological data were obtained from NOAA's National Climatic Data Center (NCDC).
3.1 Spatial distribution pattern of atmospheric mercury emissions
This study developed an extensive point source database covering the period from 1978 to 2021. For instance, in the most recent year of 2021, the inventory includes over 26 000 industrial facilities. Atmospheric mercury emissions in 2021 were estimated to be 351 t, with Hg0, HgII, and HgP accounting for 54 %, 44 %, and 2 %, respectively. The point source emissions accounted for over 85 % in 2021. The point sources were unevenly distributed, primarily concentrated in eastern and southern China (Fig. 1). Their emissions exhibited a broad spectrum of orders of magnitude, with 90 % of the total emissions budget being dominated by only the top one-third of large point sources (Fig. 1). Among the top one-third of large point sources, 68 % were from cement production (CEM) facilities, widely distributed in northern China, eastern China, southern China, central China, and southwestern China, as indicated by P-CAME.
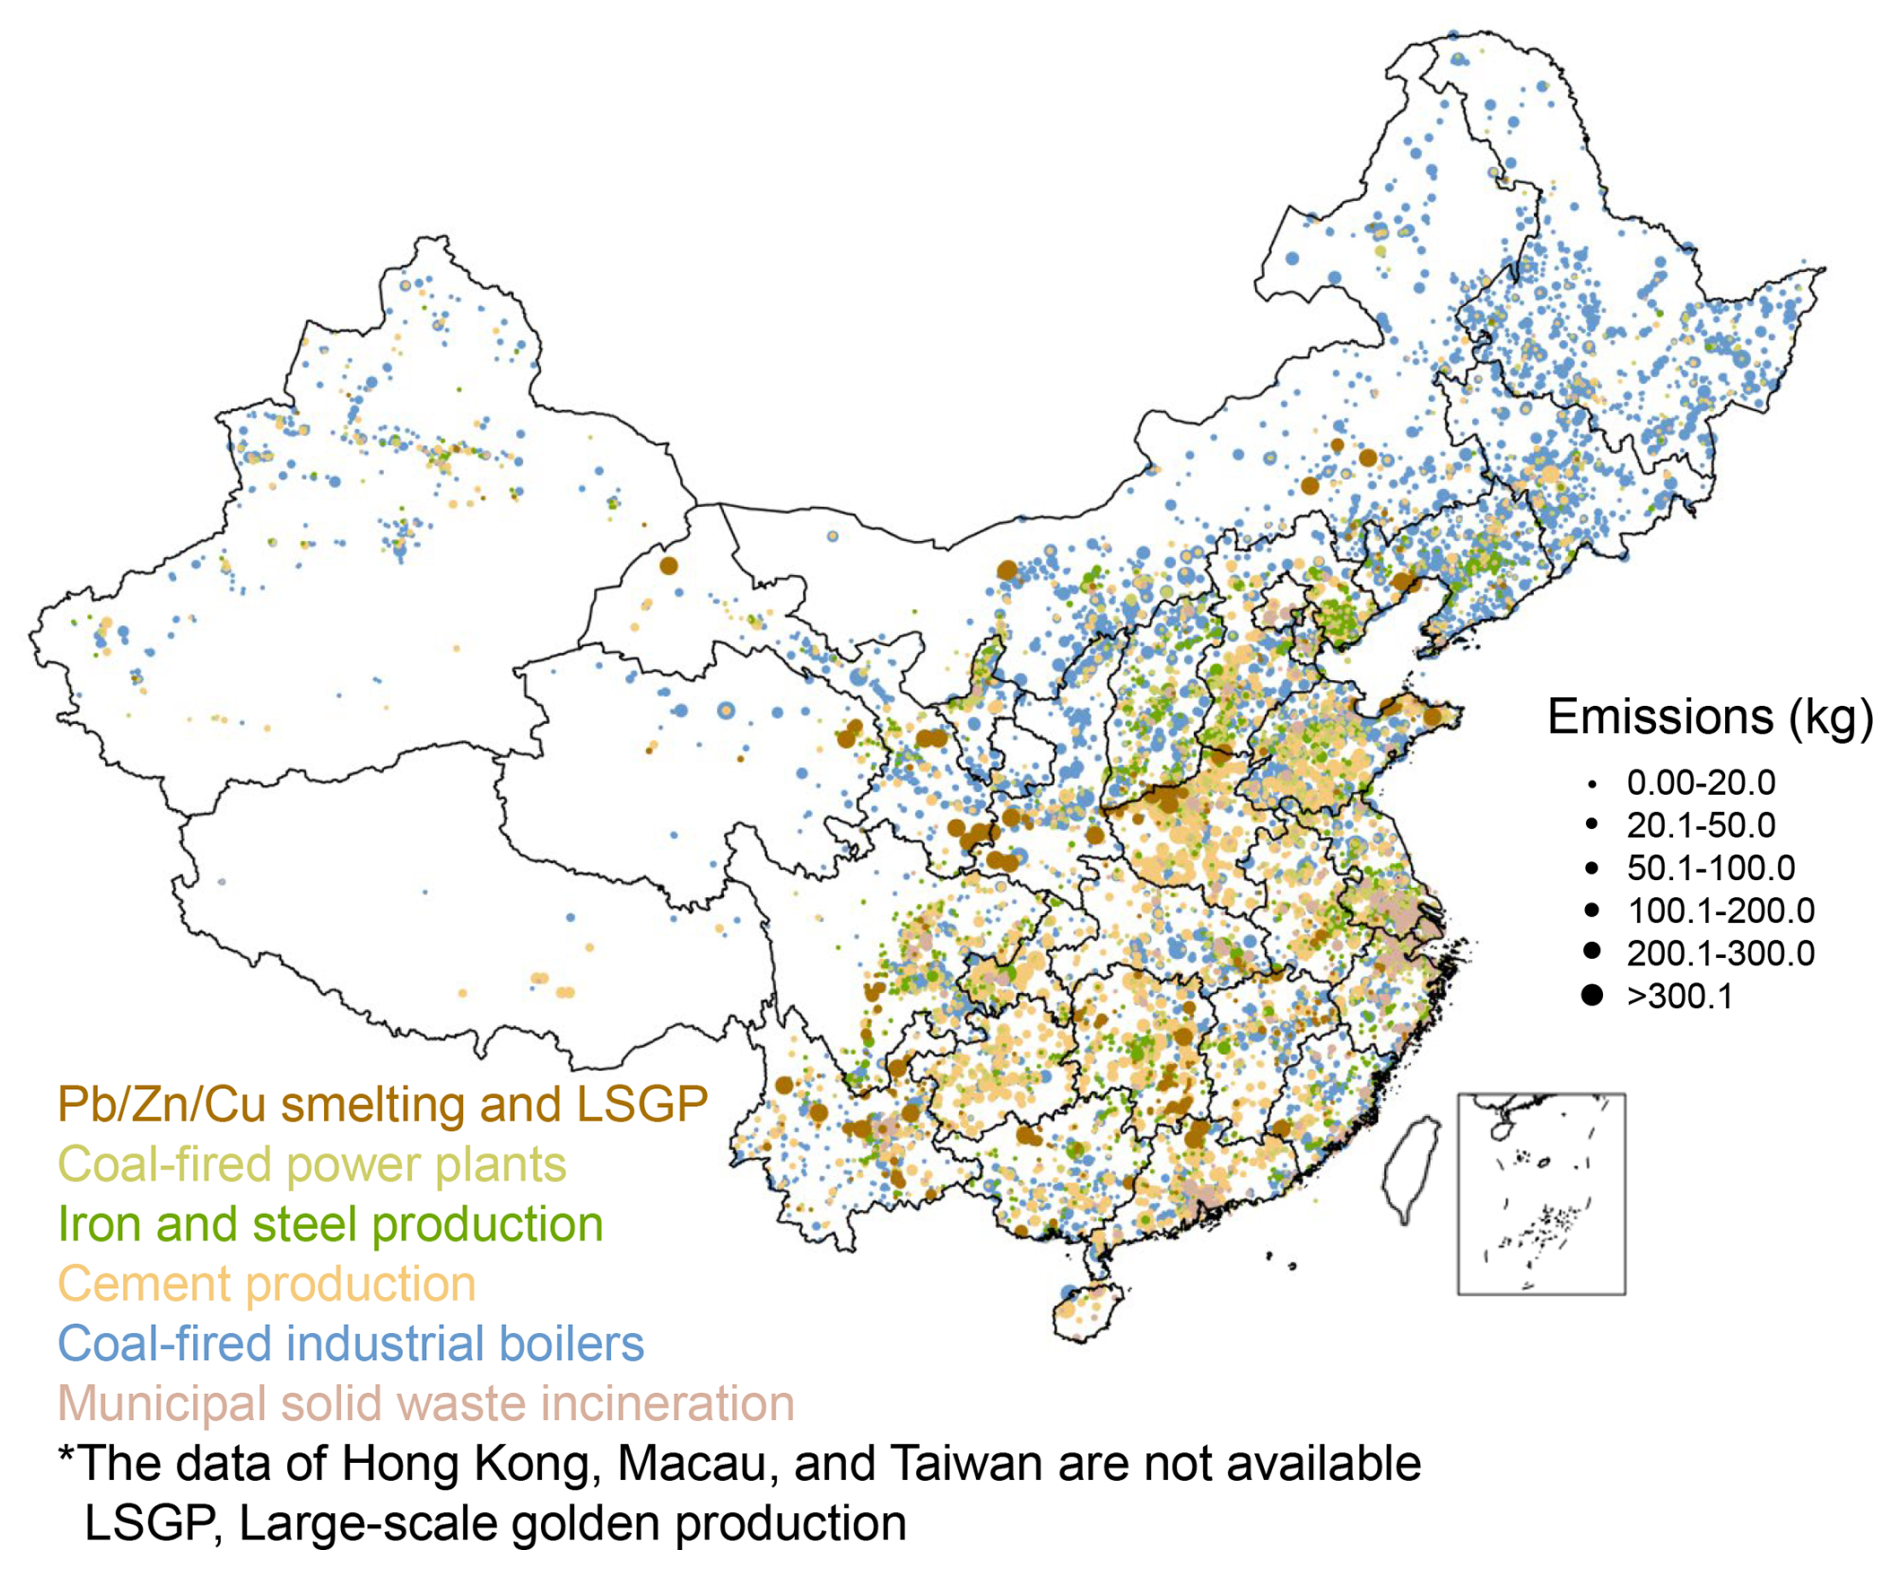
Figure 1Spatial distribution of point source emissions in 2021.
The integration of point sources in the P-CAME inventories improved the accuracy of the located gridded emissions compared to the only-proxy-based inventory (Fig. 2a and b). To quantify these differences, the NMB and NME were employed. The calculated NMB and NME for all grids stood at 1 % and 108 %, respectively. The low NMB, alongside the high NME, indicated a pronounced discrepancy between P-CAME inventories and the only-proxy-based inventory, primarily due to misalignment in grids with high and low emissions. Overall, the proxy method tended to overestimate emissions in densely populated areas, notably in main cities such as Lanzhou, Xi'an, Kunming, Guizhou, and Guangdong, while it underestimated emissions in industrial clusters like Jiaozuo, Baoji, Handan, Tangshan, and Chenzhou (Fig. 2c). At a more granular grid scale, discrepancies included both overestimations and underestimations. For example, in Handan's grids, emissions using the proxy method were overestimated in the eastern parts and underestimated in the west, contributing to the substantial NME value (108 %). This illustrated that the emissions using the proxy method were inaccurately distributed, not just between cities but also within individual city grids, causing significant variations.
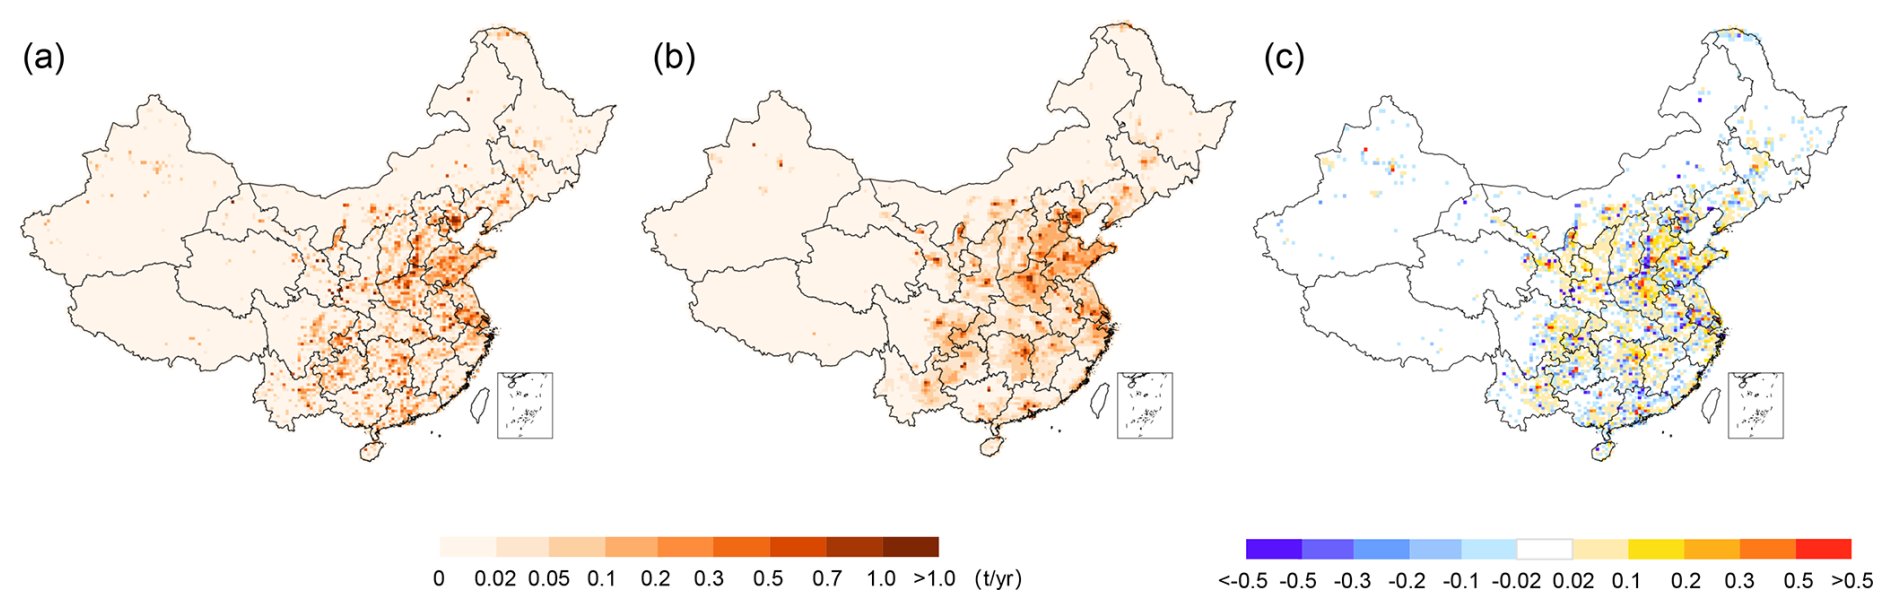
Figure 2Comparison of spatial distribution between (a) P-CAME and (b) the only-proxy-based inventory and (c) absolute difference between these two distributions.
3.2 Temporal trends of annual emissions
The analysis of long-term point source emissions enabled a reassessment of historical mercury emission trends and sector contributions from 1978 to 2021. The overall trend showcased an initial rise in emissions, peaking at 581 t, following which the emissions declined. This trend reflected substantial shifts across key sectors such as coal-fired power plants (CFPPs), non-ferrous metal smelting (NFMS), cement production (CEM), and coal-fired industrial boilers (CFIBs) (Fig. 3a). By 1990, emissions had nearly doubled compared to 1978, reaching 272 t, with an average annual rising rate of 5 % and with CFIBs, NFMS, and CFPPs being the primary sources. The NFMS emissions peaked in 2004, following which the emissions declined, while the CEM emissions rose faster, with CEM becoming the second-largest contributor by 2010. The decade ending in 2010 saw emissions reaching 558 t, with an average growth rate of 4 %, despite a brief period of reduction due to drops in the CFPP and NFMS emissions. The following decade highlighted a general decline in emissions from NFMS, CFIBs, and CFPPs, but the CEM emissions were still increasing, making it the largest contributor to the total emissions since 2011. It was until 2021 that a slight increase in total emissions was noted, driven mainly by rises in municipal solid-waste incineration (MSWI) and the CEM emissions.
In line with the trend observed in total mercury emissions, annual speciated mercury emissions also followed a pattern of initial increase followed by a decline. Specifically, annual Hg0 emissions rose from 89 to 299 t during the period of 1978–2011, subsequently decreasing to 188 t by 2021 (Fig. 3b). Notably, three peaks occurred during the increasing phase of Hg0 emissions: the first peak was in 1997 and was due to battery production emissions; the second peak was in 2007, resulting from reduced activity levels and enhanced SO2 control in CFPPs; and the third peak was in 2011 and was due to enhanced NOx control in CFPPs. Annual HgII emissions increased from 42 to 267 t during 1978–2011, followed by a decline to 155 t by 2021 (Fig. 3c). During the increasing phase of HgII emissions, two peaks occurred: the first peak was in 2007 and was attributed to a rapid decline in NFMS and CFPP emissions during 2007–2009, while the second peak was in 2011 and was caused by a peak in continuous CEM emissions. Annual HgP emissions rose from 17 to 29 t during 1978–1997 and then decreased to 8 t by 2021 (Fig. 3d), with the peak occurring in 1997 mainly being dominated by emissions from CFIBs.
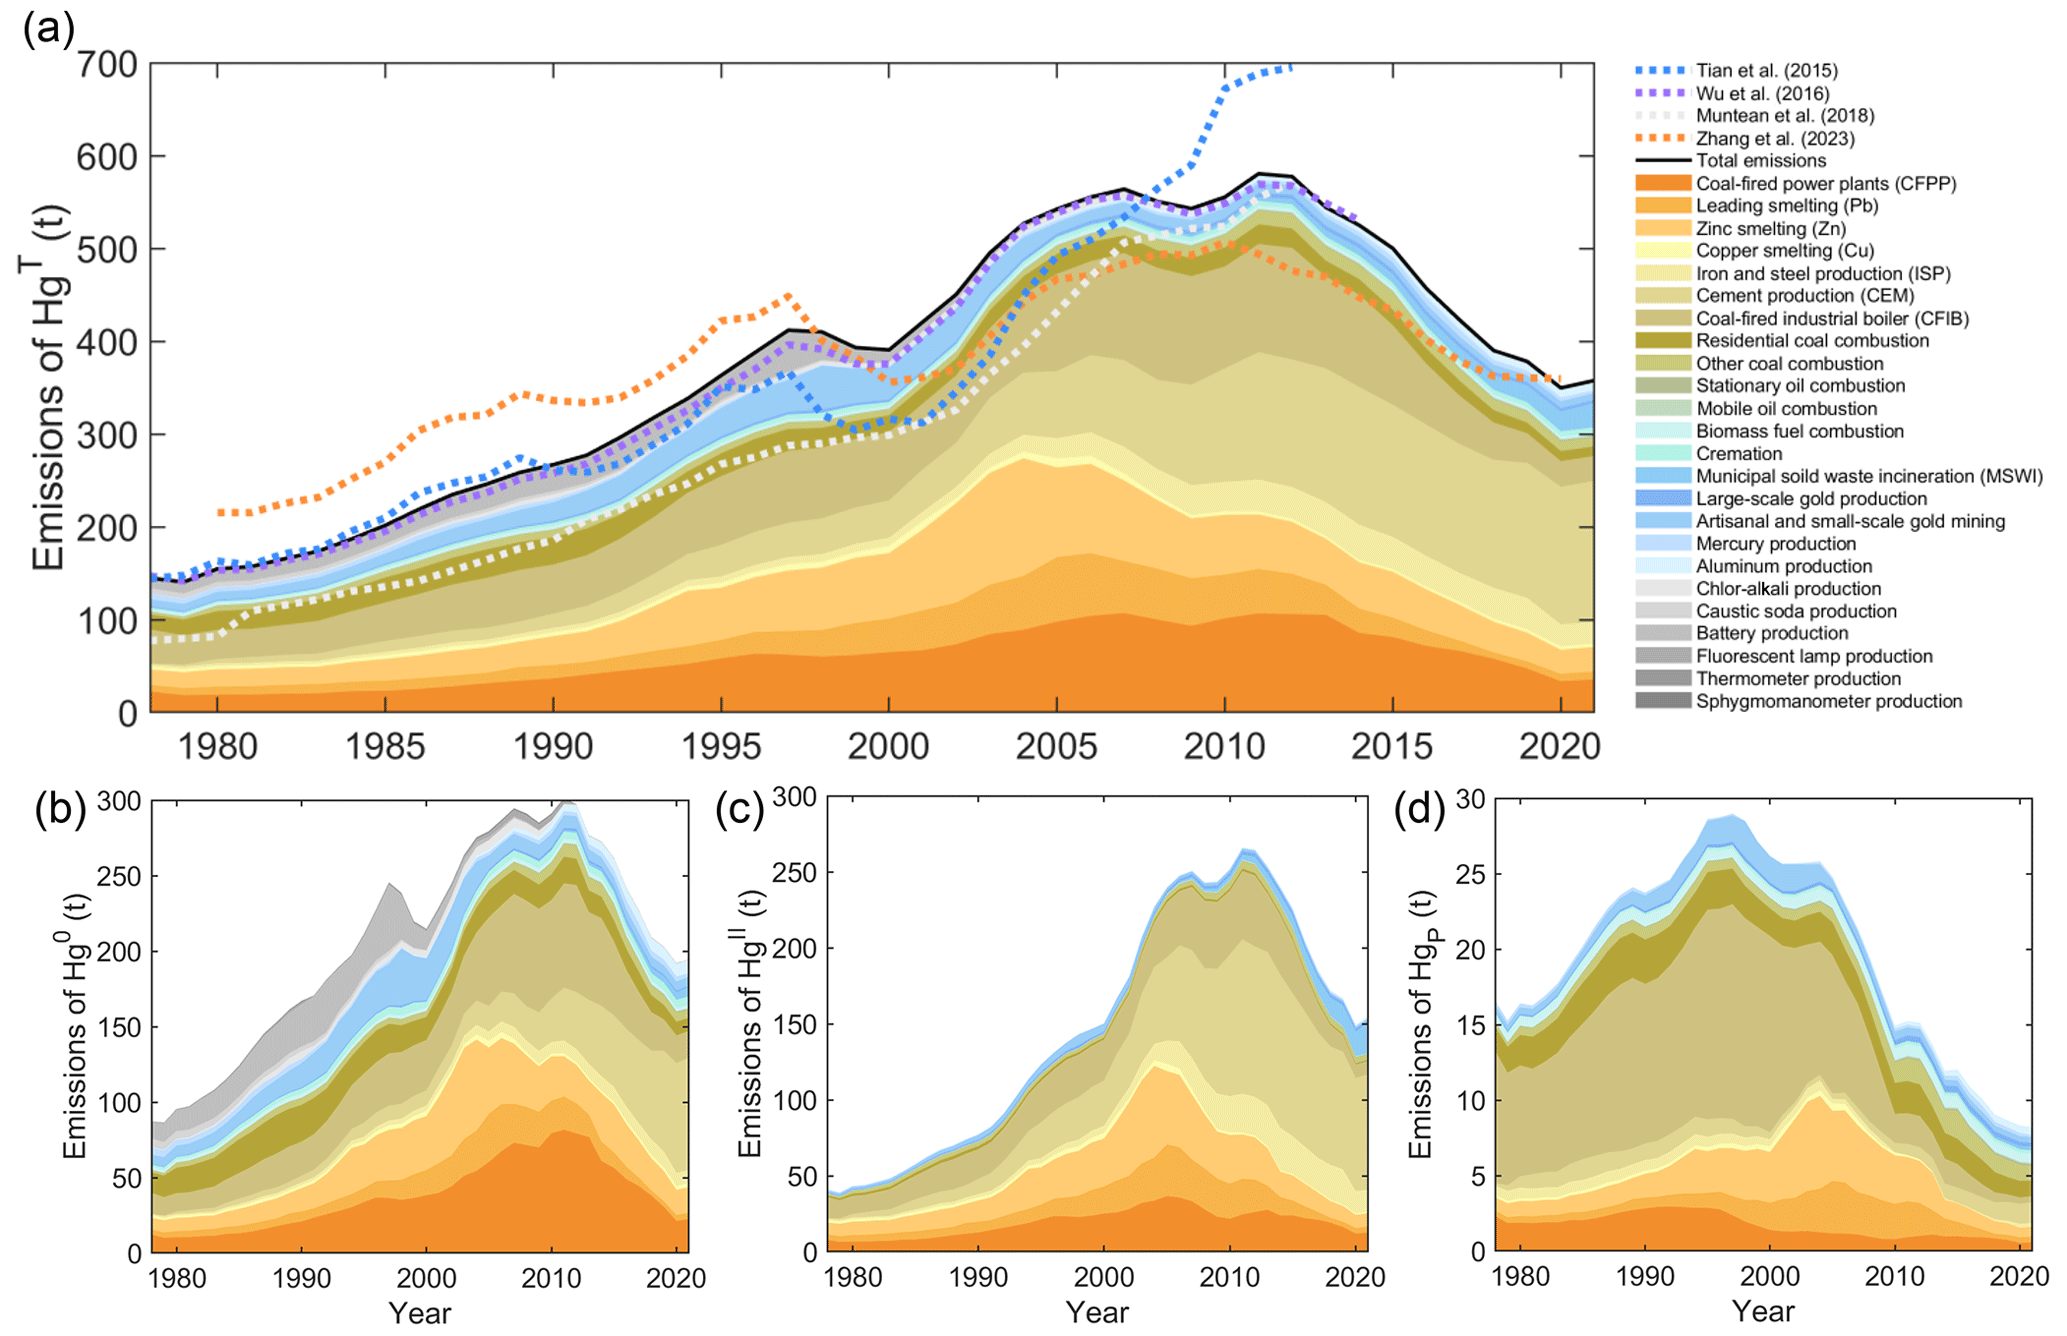
Figure 3Annual anthropogenic mercury emissions and comparison with other emission inventories. (a) HgT, (b) Hg0, (c) HgII, (d) HgP.
Overall, mercury emissions in China have experienced three distinct phases: an increase from 1978 to 2007, stabilization from 2008 to 2012, and a decrease from 2013 onwards. These phases reflect varying emission and control characteristics. The first phase (1978–2007) was marked by rapid growth in activity levels, leading to a significant increase and peak in emissions. The second phase (2008–2012) saw the combined effects of continued growth in activity levels and the implementation of emission controls, resulting in relatively stable changes. The third phase (2013–2021) was characterized by a reduction in emissions driven by more stringent emission controls. These three phases were also clearly delineated in the patterns of gridded emissions depicted across three rows in Fig. S1 in the Supplement. During the first period, there was an average increase of 5 % in annual emissions, particularly noticeable in the border areas of northern China, central China, and the Yangtze River Delta (first row of Fig. S1). Throughout the second period (2008–2012), the emissions remained relatively unchanged, with an average increase of 0.5 % in annual emissions (second row of Fig. S1). In the subsequent third period (2013–2021), a noticeable reduction, with an average decrease of 5 %, in annual emissions was observed, particularly in terms of the area that increased during the growth period (third row of Fig. S1).
3.3 Comparison with previous emission inventories
The P-CAME emission inventory was evaluated against prior long-term inventories in China, demonstrating good alignment with our earlier findings as reported by Wu et al. (2016) and closely matching the estimates by Tian et al. (2015) until 1995 (Fig. 3a). A detailed sectoral comparison (Fig. S2) revealed that the congruence with Tian et al. (2015) was somewhat coincidental. This study reported lower emissions from the NFMS and intentional mercury use but higher emissions from mercury production than Tian et al. (2015) before 1995. Post-1995, the primary discrepancies compared to prior studies stemmed from the zinc, lead, and copper sectors and CFPPs. Differences compared to the Zhang et al. (2023) study were assessed for two periods – before and after 1998 – based on total mercury emissions (Fig. 3a). Before 1998, our study reported lower emissions, mainly attributable to a reduction of approximately 40 t in terms of the estimation of emissions from CFIBs. A higher reported utilization of air pollution control devices (APCDs) accounted for the underestimation. After 1998, our study reported higher emissions, particularly in the CEM and NFMS sectors, attributable to differences in mercury concentrations in fuels or raw materials and the application of APCDs. The uncertainty range, defined by the 2.5 % and 97.5 % quantiles, represents a 95 % confidence interval, indicating a 95 % probability that the true value lies within this range. For the P-CAME emission inventory, the uncertainty range was −16.1 % to 15.9 % in 2021, reflecting lower uncertainty in the parameters. In 1978, the uncertainty range was −21.8 % to 21.5 %, primarily due to greater uncertainty in the parameters resulting from data fusion (Fig. S3). The uncertainty ranges were among the lowest reported in existing studies (Wu et al., 2016; Liu et al., 2019; Zhang et al., 2023).
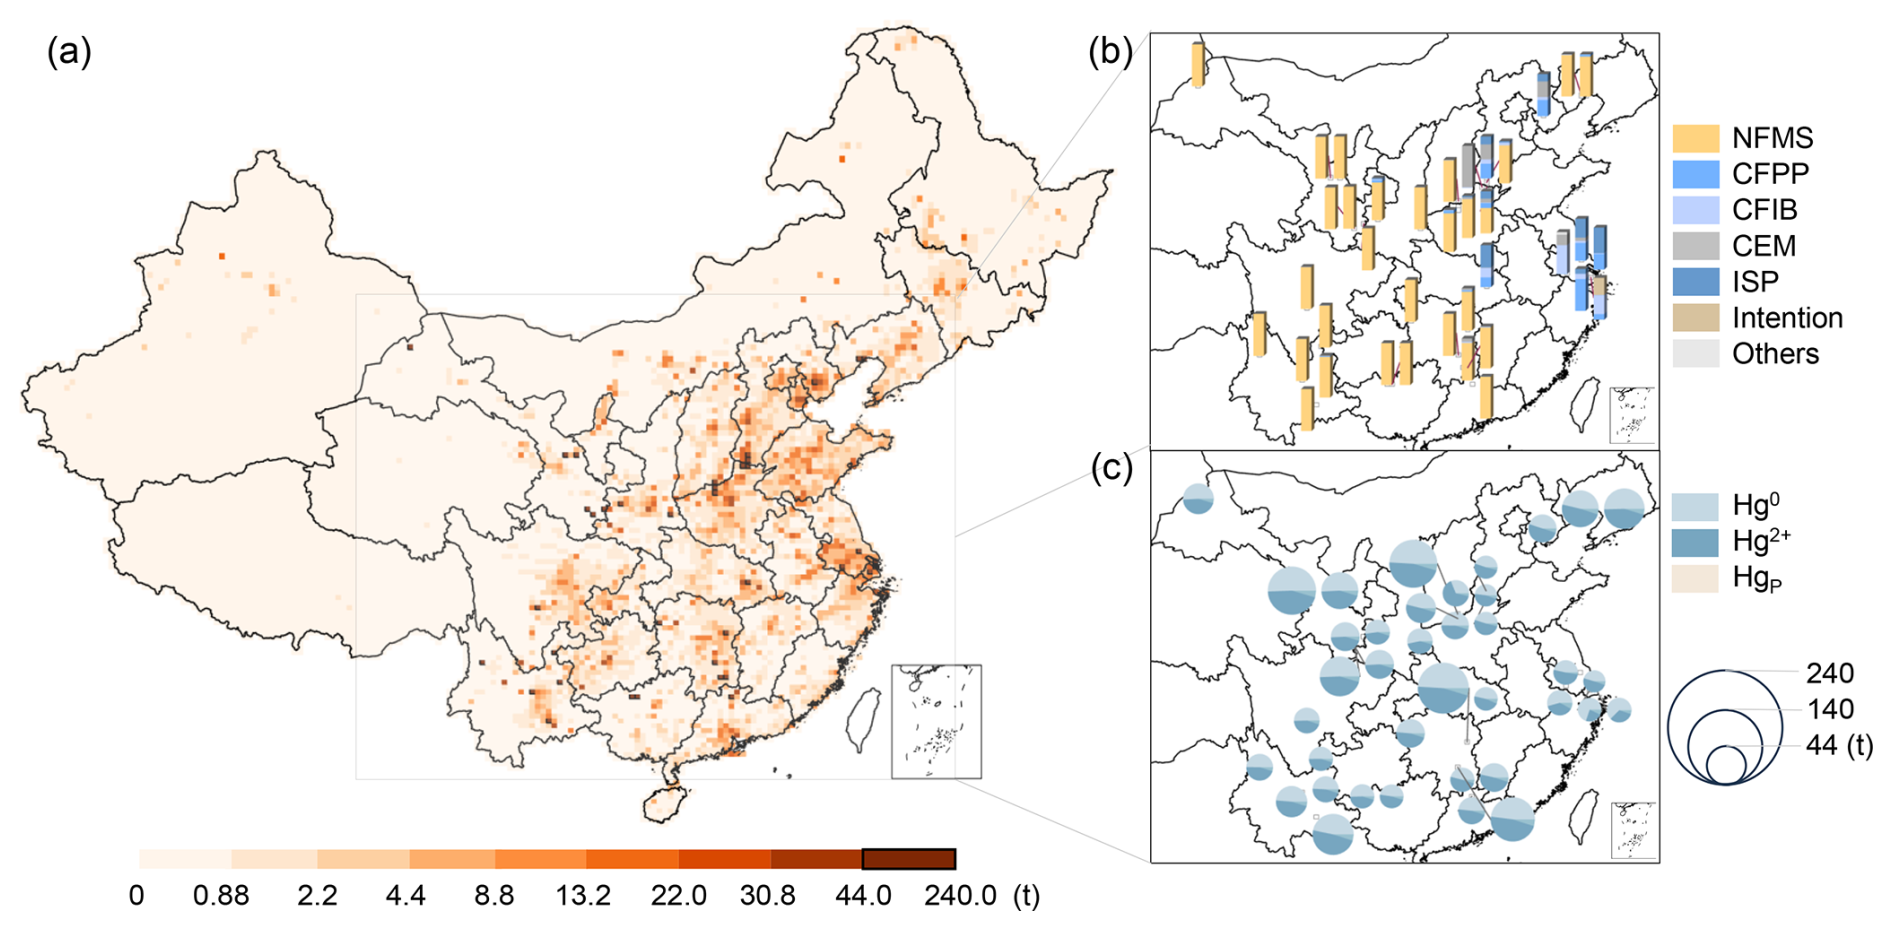
Figure 4Spatial distribution of cumulative mercury emissions. (a) Total mercury emissions, (b) sector contributions for total mercury emissions in hotspots, (c) speciation profiles in hotspots.
3.4 Identification of cumulative emission hotspots
Atmospheric mercury emissions can affect human health through air inhalation; however, their deposition on surfaces and prolonged retention pose even greater risks by causing cross-media impacts and persistent threats. The continuous, high-resolution, and spatially detailed P-CAME inventories enable the identification of hotspots for cumulative atmospheric mercury emissions from 1978 onwards, marking the start of China's economic expansion with its reform and opening-up policy. Over this period, total mercury emissions reached 16 537 t, with Hg0 accounting for 9093 t (55.0 %), HgII accounting for 6570 t (39.7 %), and HgP accounting for 874 t (5.3 %). The cumulative emissions map, as depicted in Fig. 4a, identifies critical hotspots that, despite covering only 0.3 % of the grids, contributed to 20 % of the total emissions. These hotspots, where cumulative emissions exceeded 44 t (averaging more than 1 t annually), were chiefly found in the provinces of Gansu, Yunnan, and Hunan. Emission sources within these hotspots fall into two primary categories based on sectoral contributions: those predominantly influenced by NFMS and those influenced by sectors other than NFMS, as shown in Fig. 4b. Grids dominated by NFMS represented 76 % of the areas with high cumulative emissions, where NFMS contributions averaged 96 %. These areas also exhibited a significant presence of HgII and HgP, averaging 51 %, as indicated in Fig. 4c. Conversely, grids primarily affected by other sectors – such as CFPPs, CFIBs, CEM, and iron and steel production (ISP) – were located in Hebei, Henan, Hubei, Jiangsu, and Shanghai. The sectoral contribution to the hotspots of cumulative emissions indicated that grids with NFMS tend to cause severe cross-media mercury pollution due to their high emission intensity and HgII proportion.
To further inform future pollution control strategies, we analyzed the atmospheric mercury emission hotspots for 2021, defined by emissions exceeding 1 t. Remarkably, half of the hotspots identified in 2021 coincided with those identified through cumulative emission analyses (Fig. S4). These overlapping hotspots were predominantly found in the provinces of Gansu, Shaanxi, Henan, and Hebei. In detail, Gansu and Shaanxi's hotspots were mainly attributed to emissions from NFMS, whereas Henan and Hebei's hotspots were largely due to emissions from the CEM. These areas warrant heightened focus as addressing pollution here involved not only mitigating the impact of historical emissions but also urgently implementing controls on current emissions to prevent further environmental degradation. Moreover, new hotspots emerging in 2021 that did not coincide with historical cumulative emission hotspots were primarily located in the provinces of Hebei, Henan, and Anhui (Fig. S4), with CEM emissions contributing an average of 82 % to these areas. While grids in Yunnan, Hunan, and Guangxi Provinces had high cumulative emissions, their 2021 emissions did not reach similar levels. Therefore, it is clear that future efforts in pollution prevention and control should prioritize areas with both significant cumulative emissions and high recent emissions, especially those impacted predominantly by cement industry activities. This focused approach is essential to simultaneously tackle the challenges of accumulated historical pollution and prevent the exacerbation of current emission levels, ensuring targeted and effective pollution control measures.
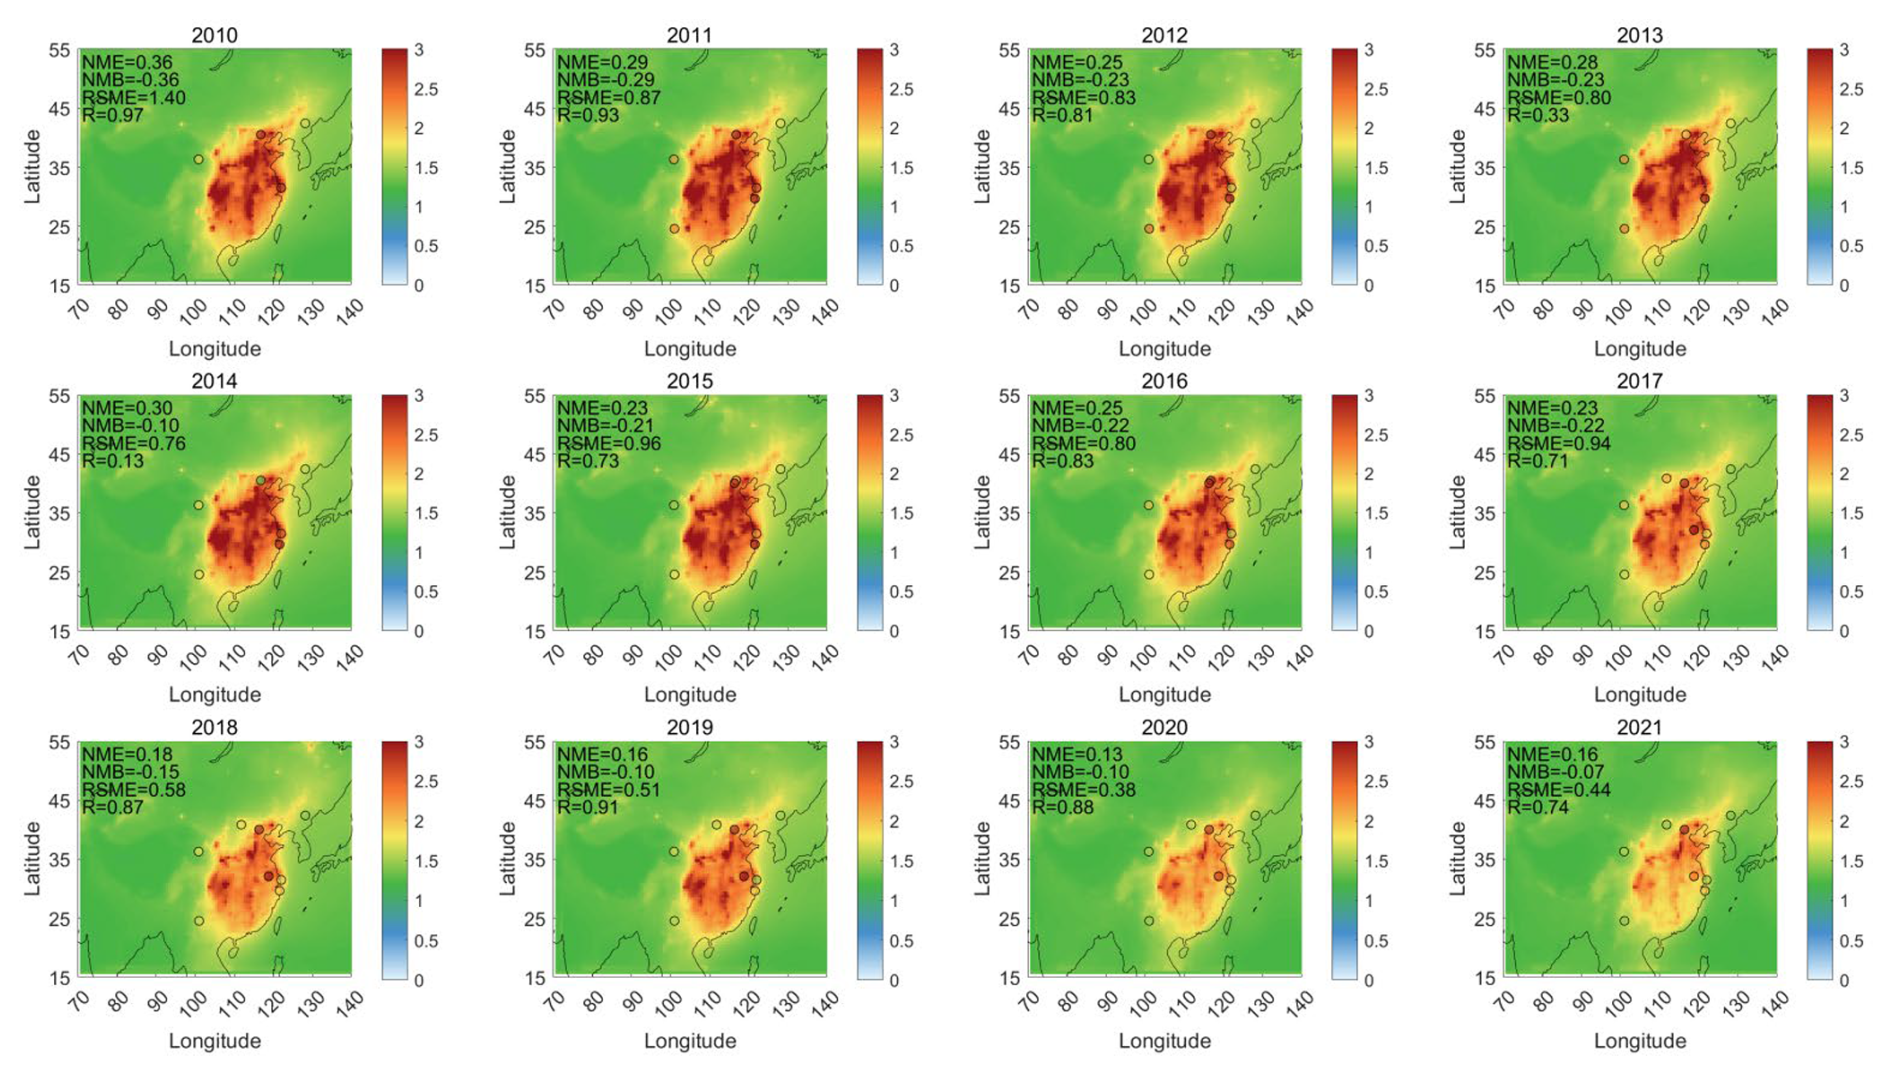
Figure 5Temporal and spatial distribution of simulated Hg0 concentration (ng m−3). The figure displays the model simulation domain: 70–140° E and 15–55° N.
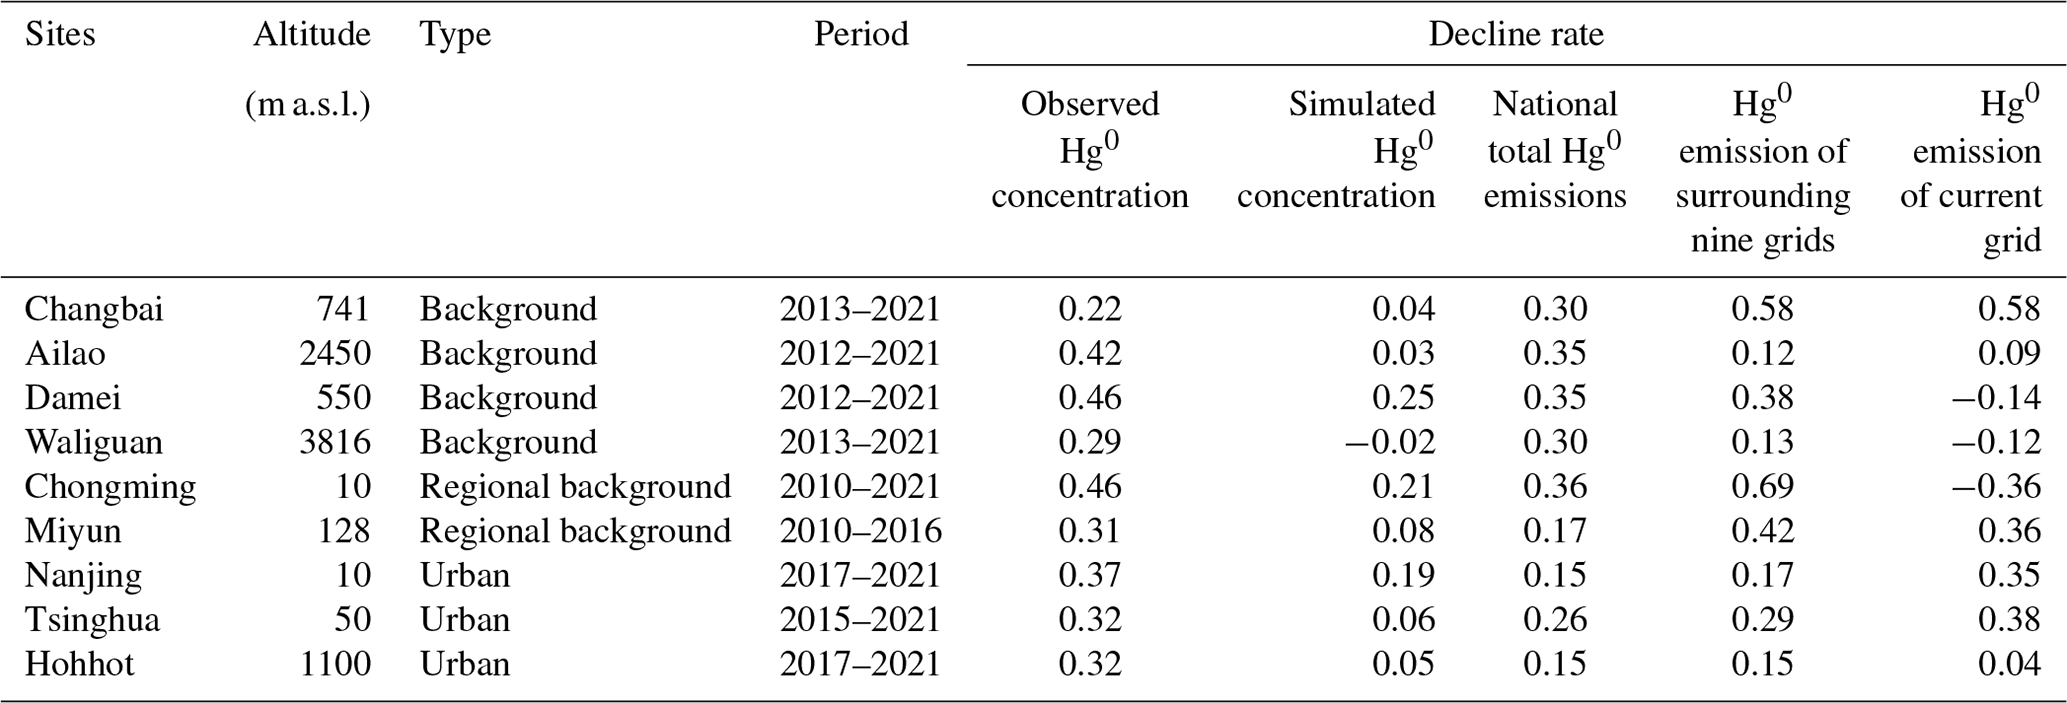
Table 1Decline rate of observed Hg0 concentration, Hg0 emissions, and simulated Hg0 concentration.
3.5 Long-term simulation of atmospheric mercury concentrations
The temporal and spatial distributions of annual atmospheric Hg0 concentration are presented in Fig. 5. During 2011 to 2021, the simulated Hg0 concentrations showed a declining trend, with the maximum values decreasing from 5.7 to 3.0 ng m−3 and the national average dropping slightly from 1.5 to 1.4 ng m−3. The spatial distribution analysis (Fig. 5) highlights a decline in simulated Hg0 concentrations in high-emission regions. However, the simulated magnitude of decline fails to capture the observed decline at monitoring sites, primarily due to an underestimation of Hg0 concentration from 2010 to 2013, when anthropogenic emissions peaked in China (Fig. S5). This issue has also been exhibited in previous studies, which found that GEOS-Chem simulations underestimate Hg0 concentrations during this period (Liu et al., 2019; Sun et al., 2024). The underestimation may stem from either the model or our anthropogenic emission inventory. Observational studies have shown that the decline in anthropogenic emissions is the key driver behind the decrease in Hg0 concentrations at both background sites (Changbai, Ailao, Damei, Waliguan, Chongming) (Feng et al., 2024; Tang et al., 2018) and urban sites (Nanjing) (Sun et al., 2024). To explore reasons for simulation underestimation, we compared the decline rates of observed Hg0 concentrations, simulated Hg0 concentrations, and anthropogenic emissions at these sites, as shown in Table 1. For each site, the decline rate of observed Hg0 concentrations was calculated as the difference between the maximum value and the concentration at the end of observation period, divided by the maximum value (see Eq. S9 for an example of the calculation for Changbai). The same method was applied to calculate decline rates for simulated Hg0 concentrations, national total Hg0 emissions, and Hg0 emissions from the nine surrounding grids (approximately 500 km × 500 km) and Hg0 emissions from the current grid over the same period.
As shown in Table 1, the decline rates of observed Hg0 concentrations vary across different site types based on their location and emission impacts: (1) in the case of background sites (Changbai, Ailao, Damei, Waliguan), these high-altitude sites with minimal local emissions represent national or even global impacts. Their observed Hg0 concentration decline rates closely align with the national total Hg0 emission decline rates and are significantly higher than simulated Hg0 concentration decline rates. (2) With regard to regional background sites (Chongming, Miyun), located in suburban areas, these sites reflect regional impacts. Their observed Hg0 concentration decline rates align more closely with the emission decline rates from nearby grids (nine surrounding grids) and are also much higher than simulated Hg0 decline rates. (3) With regard to urban sites (Nanjing, Tsinghua, Hohhot), these are influenced by diverse emission sources, making it difficult to directly associate observed Hg0 concentrations with specific emission types. At the Nanjing site, which is impacted by point source emissions from CFPPs and CEM within the local grid, the observed decline rates closely align with local emission decline rates and are higher than simulated rates. At the Tsinghua site, which is impacted by emissions transported from adjacent provinces, the observed Hg0 decline rates are comparable to the national total Hg0 emission decline rates. At the Hohhot site, which is situated at a high altitude and impacted by broader area emissions, the observed Hg0 decline rates align with national total Hg0 emission decline rates.
The observed decline rate matches the emission decline rate and exceeds the simulated rate at all sites. This suggests that our anthropogenic emission inventory is reasonable and should have reproduced the observed trends. Potential reasons for the model's underestimation include the following: (1) boundary conditions play a critical role in determining the global background concentration of Hg0 in nested simulations. However, global anthropogenic emissions used in simulations often fail to capture the observed decline trend in Hg0 concentrations. For example, observations from the Northern Hemisphere indicate a decline of approximately 0.011 ng m−3 yr−1, while simulations show only a slight decline of 0.0014 ng m−3 yr−1 (Feinberg et al., 2024). This discrepancy introduces bias into nested simulation trends, particularly at background sites. The inability of boundary conditions to reflect observed trends highlights a key limitation in current simulation. (2) Legacy re-emissions refer to the re-emission of previously deposited Hg. These Hg0 emissions diffuse back into the atmosphere and are reported to contribute significantly to current atmospheric mercury concentration (Angot et al., 2021) or deposition (Amos et al., 2013). For example, studies suggest that legacy re-emissions account for approximately 60 % of atmospheric deposition compared to 27 % from anthropogenic emissions (Amos et al., 2013). (3) The transport process plays a critical role in controlling Hg0 concentrations and trends (Roy et al., 2023), while the wind field is a key factor in determining transport processes (Brasseur and Jacob, 2017; Yang et al., 2024). By comparing simulated 10 m wind speed from MERRA2 with observed wind speed, we found discrepancies in the monthly wind speed trends between MERRA2 and meteorological observations (Fig. S6). These inconsistencies in monthly trends suggest a potential bias in MERRA2 wind speed data, consistently with findings from other evaluation studies (Miao et al., 2020). Similar biases are observed in wind direction when comparing MERRA2 with observations (Fig. S7). These biases are likely to contribute to transport simulation errors and may significantly underestimate Hg0 concentrations in the model.
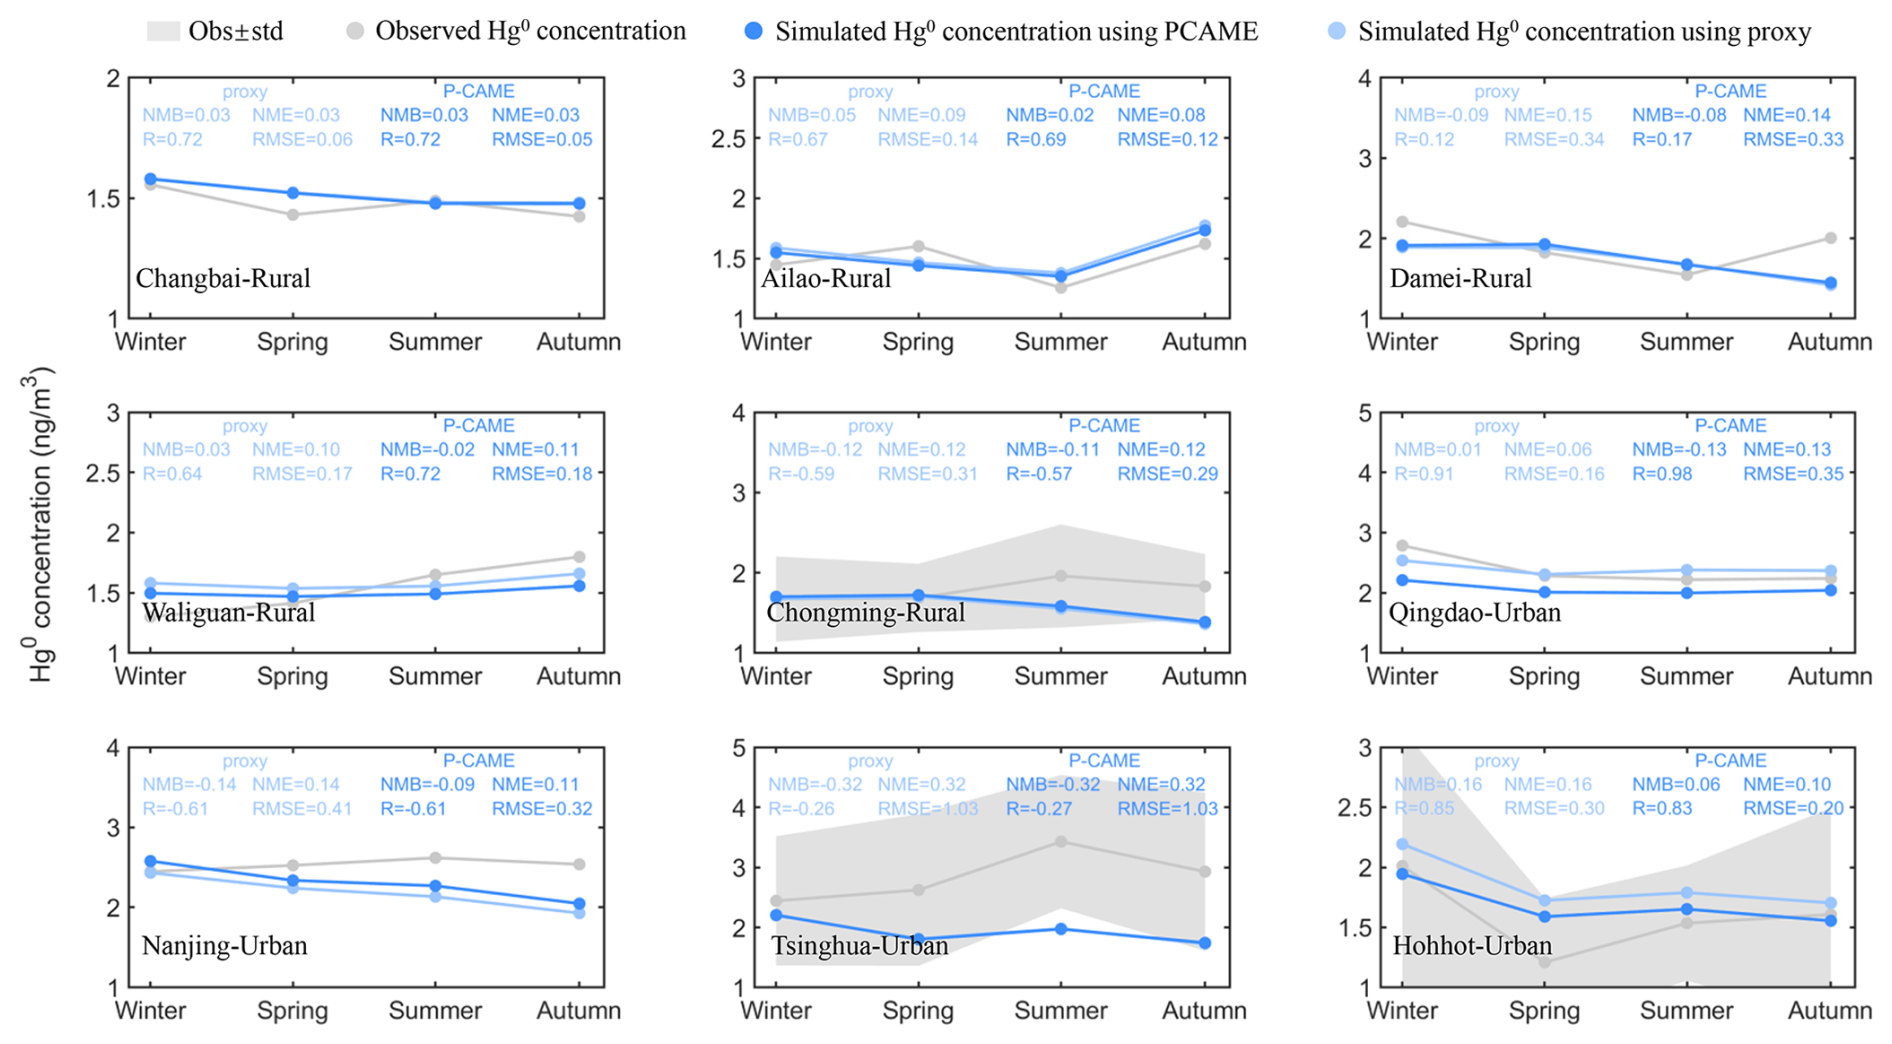
Figure 6Comparison of observed and simulated atmospheric mercury concentrations using only-proxy-based and P-CAME inventories.
3.6 Simulation comparison using P-CAME and only-proxy-based inventory
We selected 2020 to compare the simulation differences between the P-CAME and only-proxy-based inventories as 2020 exhibits less bias according to Fig. 5. For each site, we compared seasonal average Hg0 concentrations and evaluated performance using the NMB, NME, RMSE, and R, as detailed in Fig. 6. Our analysis revealed that P-CAME has the potential to improve simulation accuracy for urban sites, such as Nanjing and Hohhot. The grid containing the Nanjing site includes CFPP and CEM point sources. The only-proxy-based method underestimates emissions compared to P-CAME (Fig. S8), resulting in lower simulated Hg0 concentrations. P-CAME reduces the simulation bias, yielding lower NMB, NME, and RMSE values, indicating better agreement with observations. At the Hohhot site, the only-proxy-based method tends to overestimate emissions due to the high population density (Fig. S8). By contrast, P-CAME produces lower simulated Hg0 concentrations, which align better with observations, with lower NMB, NME, and RMSE values. These two sites highlight two common scenarios: (1) overestimated emissions in densely populated areas and (2) underestimated emissions in industrial clusters; see the discussion in Sect. 3.1. From this perspective, P-CAME has the capacity to reduce simulation bias by more accurately allocating spatial emissions in urban regions. However, this capacity is currently limited by model bias, such as poor performance in simulating transport processes, as discussed in Sect. 3.5. For urban sites like Qingdao and Tsinghua, seasonal trends are influenced by air mass sources from different directions, driven by air pressure changes between land and ocean (Shao et al., 2022; Wang et al., 2021). For example, we found that the wind field from MERRA2 does not closely match observations (Fig. S7), which could lead to simulation bias. Since the model struggles to accurately capture these transport processes, its performance at these sites is poor, making it more challenging to identify improvements from revising the emission inventory. The model performs relatively better at rural sites when compared with observations. At these locations, there is little difference in terms of simulation outcomes between the P-CAME and the only-proxy-based inventories.
The integrated point source emission inventory (P-CAME) can be accessed from https://doi.org/10.6084/m9.figshare.26076907 (Cui et al., 2024).
In this study, we introduce an annual speciated mercury emission inventory for 1978–2021, the P-CAME inventory. Its accurate, annual, high-resolution emission maps can identify cumulative emission hotspots. The identification of hotspots where cumulative mercury emissions are exceptionally high suggests that targeted pollution control measures could be highly effective. By focusing on these critical areas, which contribute disproportionately to total emissions despite covering a small fraction of the land area, policymakers can allocate resources more efficiently and achieve significant reductions in overall mercury pollution. The substantial presence of HgII and HgP in areas dominated by NFMS and CEM points to the potential for severe cross-media mercury pollution. This form of pollution affects not only the air but also waterbodies and soils, leading to broader environmental degradation and health risks. Strategies to mitigate mercury emissions in areas such as the provinces of Gansu, Shaanxi, and Hunan must therefore consider the cross-media implications of mercury pollution.
P-CAME aligns with observed Hg0 concentration trends over the past decade, showing potential to improve atmospheric mercury simulations, especially in urban areas. However, its effectiveness is limited by the overall model performance. In the future, improvements in spatial accuracy and long-term trend reliability will enhance the inventory's value. These improvements will support more accurate global Hg simulation and deepen our understanding of mercury cycling and the impacts of past emissions. This will be crucial for evaluating the success of the Minamata Convention, helping assess current mercury control policies and guiding future actions to reduce global mercury pollution. Owing to constraints in data availability, this study limited its scope to reviewing anthropogenic mercury emissions in China from 1978 onwards, with an incomplete point source coverage. To improve the percentage of point sources emissions, future research can incorporate data such as satellite images and visual identity to enhance the accuracy of the identification of industrial point sources, thereby refining the inventory of industrial emissions. Additionally, more studies should be conducted across multiple dimensions, including time, space, and emission impacts, potentially incorporating machine learning techniques and AI techniques to expand the temporal and spatial scope of anthropogenic emissions analysis. Those innovative methods could facilitate the investigation and assessment of the long-term environmental implications of historical anthropogenic mercury emissions.
The supplement related to this article is available online at https://doi.org/10.5194/essd-17-3315-2025-supplement.
YC established the emission inventories and wrote the draft. QW supervised the study, helped conduct data analysis, and wrote and edited the paper. SW helped conceive the idea for this article and edited the paper. KL, SL, ZS, DO, and ZL helped to collect basic data for the calculations. QC polished the draft. CL, FX, YT, and YW provided Hg0 concentration data for validation. JH helped conceive the idea for this article. All of the co-authors revised the paper.
The contact author has declared that none of the authors has any competing interests.
Publisher's note: Copernicus Publications remains neutral with regard to jurisdictional claims made in the text, published maps, institutional affiliations, or any other geographical representation in this paper. While Copernicus Publications makes every effort to include appropriate place names, the final responsibility lies with the authors. Publisher's remark: please note that Figs. 1, 2, and 4 contain disputed territories.
We would like to express our gratitude to the authors of the referenced articles for providing the observation data utilized in this article, and we extend our gratitude to the staff members at the Environmental Protection Key Laboratory of Sources and Control of Air Pollution Complex for their invaluable contributions to supplementing the data on point sources.
This research has been supported by the National Natural Science Foundation of China (grant nos. 22222604 and 42394094) and the National Key Research and Development Program of China (grant no. 2022YFC3700602).
This paper was edited by Chunlüe Zhou and reviewed by two anonymous referees.
AMAP/UNEP: AMAP/UNEP geospatially distributed mercury emissions dataset 2010v1 [data set], https://www.amap.no/work-area/document/862 (last access: 30 October 2023), 2013.
AMAP/UNEP: Technical Background Report to the Global Mercury Assessment 2018, Geneva, Switzerland, https://www.unep.org/globalmercurypartnership/resources/report/technical-background-report-global-mercury-assessment-2018 (last access: 30 October 2023), 2019.
Amos, H. M., Jacob, D. J., Streets, D. G., and Sunderland, E. M.: Legacy impacts of all-time anthropogenic emissions on the global mercury cycle, Global Biogeochem. Cy., 27, 410–421, https://doi.org/10.1002/gbc.20040, 2013.
Angot, H., Rutkowski, E., Sargent, M., Wofsy, S. C., Hutyra, L. R., Howard, D., Obrist, D., and Selin, N. E.: Atmospheric mercury sources in a coastal-urban environment: a case study in Boston, Massachusetts, USA, Environ. Sci. Process. Imp., 23, 1914–1929, https://doi.org/10.1039/d1em00253h, 2021.
Bishop, K., Shanley, J. B., Riscassi, A., de Wit, H. A., Eklöf, K., Meng, B., Mitchell, C., Osterwalder, S., Schuster, P. F., Webster, J., and Zhu, W.: Recent advances in understanding and measurement of mercury in the environment: Terrestrial Hg cycling, Sci. Total Environ., 721, 137647, https://doi.org/10.1016/j.scitotenv.2020.137647, 2020.
Brasseur, G. P. and Jacob, D. J.: Modeling of Atmospheric Chemistry, Cambridge University Press, Cambridge, https://doi.org/10.1017/9781316544754, 2017.
Chang, J. C. S. and Ghorishi, S. B.: Simulation and Evaluation of Elemental Mercury Concentration Increase in Flue Gas Across a Wet Scrubber, Environ. Sci. Technol., 37, 5763–5766, https://doi.org/10.1021/es034352s, 2003.
Corbitt, E. S., Jacob, D. J., Holmes, C. D., Streets, D. G., and Sunderland, E. M.: Global Source–Receptor Relationships for Mercury Deposition Under Present-Day and 2050 Emissions Scenarios, Environ. Sci. Technol., 45, 10477–10484, https://doi.org/10.1021/es202496y, 2011.
Cui, Y., Wu, Q., Wang, S., Liu, K., Li, S., Shi, Z., Ouyang, D., Li, Z., Chen, Q., Lv, C., Xie, F., Tang, Y., Wang, Y., and Hao, J.: Integrating Point Sources to Map Anthropogenic Atmospheric Mercury Emissions in China, 1978–2021, figshare [data set], https://doi.org/10.6084/m9.figshare.26076907.v1, 2024.
Feinberg, A., Selin, N. E., Braban, C. F., Chang, K. L., Custodio, D., Jaffe, D. A., Kyllonen, K., Landis, M. S., Leeson, S. R., Luke, W., Molepo, K. M., Murovec, M., Nerentorp Mastromonaco, M. G., Aspmo Pfaffhuber, K., Rudiger, J., Sheu, G. R., and St Louis, V. L.: Unexpected anthropogenic emission decreases explain recent atmospheric mercury concentration declines, P. Natl. Acad. Sci. USA, 121, e2401950121, https://doi.org/10.1073/pnas.2401950121, 2024.
Feng, X., Fu, X., Zhang, H., Wang, X., Jia, L., Zhang, L., Lin, C.-J., Huang, J.-H., Liu, K., and Wang, S.: Combating air pollution significantly reduced air mercury concentrations in China, Natl. Sci. Rev., 11, nwae264, https://doi.org/10.1093/nsr/nwae264, 2024.
Gelaro, R., McCarty, W., Suarez, M. J., Todling, R., Molod, A., Takacs, L., Randles, C., Darmenov, A., Bosilovich, M. G., Reichle, R., Wargan, K., Coy, L., Cullather, R., Draper, C., Akella, S., Buchard, V., Conaty, A., da Silva, A., Gu, W., Kim, G. K., Koster, R., Lucchesi, R., Merkova, D., Nielsen, J. E., Partyka, G., Pawson, S., Putman, W., Rienecker, M., Schubert, S. D., Sienkiewicz, M., and Zhao, B.: The Modern-Era Retrospective Analysis for Research and Applications, Version 2 (MERRA-2), J. Climate, 30, 5419–5454, https://doi.org/10.1175/JCLI-D-16-0758.1, 2017.
Giang, A. and Selin, N. E.: Benefits of mercury controls for the United States, P. Natl. Acad. Sci. USA, 113, 286–291, https://doi.org/10.1073/pnas.1514395113, 2016.
Horowitz, H. M., Jacob, D. J., Zhang, Y., Dibble, T. S., Slemr, F., Amos, H. M., Schmidt, J. A., Corbitt, E. S., Marais, E. A., and Sunderland, E. M.: A new mechanism for atmospheric mercury redox chemistry: implications for the global mercury budget, Atmos. Chem. Phys., 17, 6353–6371, https://doi.org/10.5194/acp-17-6353-2017, 2017.
Jung, G., Hedgecock, I. M., and Pirrone, N.: ECHMERIT V1.0 – a new global fully coupled mercury-chemistry and transport model, Geosci. Model Dev., 2, 175–195, https://doi.org/10.5194/gmd-2-175-2009, 2009.
Li, Y., Chen, L., Liang, S., Zhou, H., Liu, Y.-R., Zhong, H., and Yang, Z.: Looping Mercury Cycle in Global Environmental–Economic System Modeling, Environ. Sci. Technol., 56, 2861–2879, https://doi.org/10.1021/acs.est.1c03936, 2022.
Liu, K., Wang, S., Wu, Q., Wang, L., Ma, Q., Zhang, L., Li, G., Tian, H., Duan, L., and Hao, J.: A Highly Resolved Mercury Emission Inventory of Chinese Coal-Fired Power Plants, Environ. Sci. Technol., 52, 2400–2408, https://doi.org/10.1021/acs.est.7b06209, 2018.
Liu, K., Wu, Q., Wang, L., Wang, S., Liu, T., Ding, D., Tang, Y., Li, G., Tian, H., Duan, L., Wang, X., Fu, X., Feng, X., and Hao, J.: Measure-Specific Effectiveness of Air Pollution Control on China's Atmospheric Mercury Concentration and Deposition during 2013–2017, Environ. Sci. Technol., 53, 8938–8946, https://doi.org/10.1021/acs.est.9b02428, 2019.
Meng, B., Feng, X., Qiu, G., Liang, P., Li, P., Chen, C., and Shang, L.: The process of methylmercury accumulation in rice (Oryza sativa L.), Environ. Sci. Technol., 45, 2711–2717, 2011.
Miao, H., Dong, D., Huang, G., Hu, K., Tian, Q., and Gong, Y.: Evaluation of Northern Hemisphere surface wind speed and wind power density in multiple reanalysis datasets, Energy, 200, 117382, https://doi.org/10.1016/j.energy.2020.117382, 2020.
MOHURD – Ministry of Housing and Urban-Rural Development of the People's Republic of China: Interim Provisions on Urban Planning Quota Index, https://law168.com.cn/doc/view?id=106965 (last access: 30 October 2023), 1980.
Muntean, M., Janssens-Maenhout, G., Song, S., Selin, N. E., Olivier, J. G. J., Guizzardi, D., Maas, R., and Dentener, F.: Trend analysis from 1970 to 2008 and model evaluation of EDGARv4 global gridded anthropogenic mercury emissions, Sci. Total Environ., 494–495, 337—50, https://doi.org/10.1016/j.scitotenv.2014.06.014, 2014.
Muntean, M., Janssens-Maenhout, G., Song, S., Giang, A., Selin, N. E., Zhong, H., Zhao, Y., Olivier, J. G. J., Guizzardi, D., Crippa, M., Schaaf, E., and Dentener, F.: Evaluating EDGARv4.tox2 speciated mercury emissions ex-post scenarios and their impacts on modelled global and regional wet deposition patterns, Atmos. Environ., 184, 56–68, https://doi.org/10.1016/j.atmosenv.2018.04.017, 2018.
Omine, N., Romero, C. E., Kikkawa, H., Wu, S., and Eswaran, S.: Study of elemental mercury re-emission in a simulated wet scrubber, Fuel, 91, 93–101, https://doi.org/10.1016/j.fuel.2011.06.018, 2012.
OpenStreetMap contributors: OpenStreetMap, https://www.openstreetmap.org/ (last access: 30 October 2023), 2023.
Qichacha: https://www.qcc.com/ (last access: 30 October 2023), 2023.
Roy, E. M., Zhou, J., Wania, F., and Obrist, D.: Use of atmospheric concentrations and passive samplers to assess surface-atmosphere exchange of gaseous mercury in forests, Chemosphere, 341, 140113, https://doi.org/10.1016/j.chemosphere.2023.140113, 2023.
Selin, N. E.: Global Biogeochemical Cycling of Mercury: A Review, Annu. Rev. Environ. Resour., 34, 43–63, https://doi.org/10.1146/annurev.environ.051308.084314, 2009.
Selin, N. E., Jacob, D. J., Yantosca, R. M., Strode, S., Jaeglé, L., and Sunderland, E. M.: Global 3-D land-ocean-atmosphere model for mercury: Present-day versus preindustrial cycles and anthropogenic enrichment factors for deposition, Global Biogeochem. Cy., 22, GB2011, https://doi.org/10.1029/2007GB003040, 2008.
Shao, L., Wang, Y., Liu, X., Liu, R., Han, K., and Zhang, Y.: Temporal variation of gaseous elemental mercury in a northern coastal city in China: Monsoon and COVID-19 lockdown effects, Atmos. Pollut. Res., 13, 101436, https://doi.org/10.1016/j.apr.2022.101436, 2022.
Simone, F. D., Gencarelli, C. N., Hedgecock, I. M., and Pirrone, N.: A Modeling Comparison of Mercury Deposition from Current Anthropogenic Mercury Emission Inventories, Environ. Sci. Technol., 50, 5154–5162, https://doi.org/10.1021/acs.est.6b00691, 2016.
Smith-Downey, N. V., Sunderland, E. M., and Jacob, D. J.: Anthropogenic impacts on global storage and emissions of mercury from terrestrial soils: Insights from a new global model, J. Geophys. Res., 115, G03008, https://doi.org/10.1029/2009jg001124, 2010.
Streets, D. G., Devane, M. K., Lu, Z., Bond, T. C., Sunderland, E. M., and Jacob, D. J.: All-Time Releases of Mercury to the Atmosphere from Human Activities, Environ. Sci. Technol., 45, 10485–10491, https://doi.org/10.1021/es202765m, 2011.
Streets, D. G., Horowitz, H. M., Lu, Z., Levin, L., Thackray, C. P., and Sunderland, E. M.: Global and regional trends in mercury emissions and concentrations, 2010–2015, Atmos. Environ., 201, 417–427, https://doi.org/10.1016/j.atmosenv.2018.12.031, 2019.
Sun, P., Song, Z., Qin, Y., Xu, Z., Zhang, Y., Zhong, S., and Yu, J.: Declines of gaseous element mercury concentrations at an urban site in eastern China caused by reductions of anthropogenic emission, Atmos. Environ., 317, 120199, https://doi.org/10.1016/j.atmosenv.2023.120199, 2024.
Tang, Y., Wang, S., Wu, Q., Liu, K., Wang, L., Li, S., Gao, W., Zhang, L., Zheng, H., Li, Z., and Hao, J.: Recent decrease trend of atmospheric mercury concentrations in East China: the influence of anthropogenic emissions, Atmos. Chem. Phys., 18, 8279–8291, https://doi.org/10.5194/acp-18-8279-2018, 2018.
The Baidu Map System: Latitude and longitude query positioning, http://jingweidu.757dy.com/ (last access: 30 Octorber 2023), 2023.
Tian, H. Z., Wang, Y., Xue, Z. G., Cheng, K., Qu, Y. P., Chai, F. H., and Hao, J. M.: Trend and characteristics of atmospheric emissions of Hg, As, and Se from coal combustion in China, 1980–2007, Atmos. Chem. Phys., 10, 11905–11919, https://doi.org/10.5194/acp-10-11905-2010, 2010.
Tian, H. Z., Zhu, C. Y., Gao, J. J., Cheng, K., Hao, J. M., Wang, K., Hua, S. B., Wang, Y., and Zhou, J. R.: Quantitative assessment of atmospheric emissions of toxic heavy metals from anthropogenic sources in China: historical trend, spatial distribution, uncertainties, and control policies, Atmos. Chem. Phys., 15, 10127–10147, https://doi.org/10.5194/acp-15-10127-2015, 2015.
van der Werf, G. R., Randerson, J. T., Giglio, L., van Leeuwen, T. T., Chen, Y., Rogers, B. M., Mu, M., van Marle, M. J. E., Morton, D. C., Collatz, G. J., Yokelson, R. J., and Kasibhatla, P. S.: Global fire emissions estimates during 1997–2016, Earth Syst. Sci. Data, 9, 697–720, https://doi.org/10.5194/essd-9-697-2017, 2017.
Wang, C., Wang, Z., and Zhang, X.: Speciated atmospheric mercury during haze and non-haze periods in winter at an urban site in Beijing, China: Pollution characteristics, sources, and causes analyses, Atmos. Res., 247, 105209, https://doi.org/10.1016/j.atmosres.2020.105209, 2021.
Wu, Q., Wang, S., Li, G., Liang, S., Lin, C.-J., Wang, Y., Cai, S., Liu, K., and Hao, J.: Temporal Trend and Spatial Distribution of Speciated Atmospheric Mercury Emissions in China During 1978–2014, Environ. Sci. Technol., 50, 13428–13435, https://doi.org/10.1021/acs.est.6b04308, 2016.
Wu, Q. R., Wang, S. X., Zhang, L., Song, J. X., Yang, H., and Meng, Y.: Update of mercury emissions from China's primary zinc, lead and copper smelters, 2000–2010, Atmos. Chem. Phys., 12, 11153–11163, https://doi.org/10.5194/acp-12-11153-2012, 2012.
Wu, X., Fu, X., Zhang, H., Tang, K., Wang, X., Zhang, H., Deng, Q., Zhang, L., Liu, K., Wu, Q., Wang, S., and Feng, X.: Changes in Atmospheric Gaseous Elemental Mercury Concentrations and Isotopic Compositions at Mt. Changbai During 2015–2021 and Mt. Ailao During 2017–2021 in China, J. Geophys. Res.-Atmos., 128, e2022JD037749, https://doi.org/10.1029/2022JD037749, 2023.
Wu, Y., Wang, S., Streets, D. G., Hao, J., Chan, M., and Jiang, J.: Trends in Anthropogenic Mercury Emissions in China from 1995 to 2003, Environ. Sci. Technol., 40, 5312–5318, https://doi.org/10.1021/es060406x, 2006.
Xu, X.: China population spatial distribution kilometer grid dataset. Resource and environmental science data registration and publication system, Resource and Environmental Science Data Platform [data set], https://doi.org/10.12078/2017121101, 2017.
Yang, L. H., Jacob, D. J., Dang, R., Oak, Y. J., Lin, H., Kim, J., Zhai, S., Colombi, N. K., Pendergrass, D. C., Beaudry, E., Shah, V., Feng, X., Yantosca, R. M., Chong, H., Park, J., Lee, H., Lee, W.-J., Kim, S., Kim, E., Travis, K. R., Crawford, J. H., and Liao, H.: Interpreting Geostationary Environment Monitoring Spectrometer (GEMS) geostationary satellite observations of the diurnal variation in nitrogen dioxide (NO2) over East Asia, Atmos. Chem. Phys., 24, 7027–7039, https://doi.org/10.5194/acp-24-7027-2024, 2024.
Zhang, L.: Emission characteristics and synergistic control strategies of atmospheric mercury from coal combustion in China, PhD thesis, School of Environment, Tsinghua University, Beijing, 2012.
Zhang, L., Wang, S., Meng, Y., and Hao, J.: Influence of Mercury and Chlorine Content of Coal on Mercury Emissions from Coal-Fired Power Plants in China, Environ. Sci. Technol., 46, 6385–6392, https://doi.org/10.1021/es300286n, 2012.
Zhang, L., Wang, S., Wu, Q., Wang, F., Lin, C. J., Zhang, L., Hui, M., Yang, M., Su, H., and Hao, J.: Mercury transformation and speciation in flue gases from anthropogenic emission sources: a critical review, Atmos. Chem. Phys., 16, 2417–2433, https://doi.org/10.5194/acp-16-2417-2016, 2016a.
Zhang, L., Wang, S., Wang, L., Wu, Y., Duan, L., Wu, Q., Wang, F., Yang, M., Yang, H., Hao, J., and Liu, X.: Updated Emission Inventories for Speciated Atmospheric Mercury from Anthropogenic Sources in China, Environ. Sci. Technol., 49, 3185–3194, https://doi.org/10.1021/es504840m, 2015.
Zhang, Y., Jacob, D. J., Horowitz, H. M., Chen, L., Amos, H. M., Krabbenhoft, D. P., Slemr, F., St. Louis, V. L., and Sunderland, E. M.: Observed decrease in atmospheric mercury explained by global decline in anthropogenic emissions, P. Natl. Acad. Sci. USA, 113, 526–531, https://doi.org/10.1073/pnas.1516312113, 2016b.
Zhang, Y., Zhang, L., Cao, S., Liu, X., Jin, J., and Zhao, Y.: Improved Anthropogenic Mercury Emission Inventories for China from 1980 to 2020: Toward More Accurate Effectiveness Evaluation for the Minamata Convention, Environ. Sci. Technol., 57, 8660–8670, https://doi.org/10.1021/acs.est.3c01065, 2023.
Zhao, Y., Zhong, H., Zhang, J., and Nielsen, C. P.: Evaluating the effects of China's pollution controls on inter-annual trends and uncertainties of atmospheric mercury emissions, Atmos. Chem. Phys., 15, 4317–4337, https://doi.org/10.5194/acp-15-4317-2015, 2015.