the Creative Commons Attribution 4.0 License.
the Creative Commons Attribution 4.0 License.
 | 12 May 2025
LegacyVegetation: Northern Hemisphere reconstruction of past plant cover and total tree cover from pollen archives of the last 14 kyr
Laura Schild
Peter Ewald
Chenzhi Li
Raphaël Hébert
Thomas Laepple
Ulrike Herzschuh
With rapid anthropogenic climate change, future vegetation trajectories are uncertain. Climate–vegetation models can be useful for predictions, but they require extensive data on past vegetation for validation and improving systemic understanding. Even though pollen data provide a great source of this information, they are compositionally biased due to differences in taxon-specific relative pollen productivity (RPP) and dispersal.
Here, we present a Northern Hemisphere reconstruction of quantitative regional vegetation cover from a sedimentary pollen dataset for the last 14 kyr using the REVEALS model to correct for taxon- and basin-specific biases. For the reconstruction, we expanded on a previously published synthesis of continental RPP values.
The datasets include the taxonomic composition and reconstructed tree cover for each original pollen sample. Additional metadata include modeled ages, age model sources, basin locations, types, and sizes.
The improvements in tree cover reconstructions with the REVEALS reconstruction using continental RPP values range from 22 % (Asia) to 67 % (Europe) relative to the mean absolute error (MAE) of the pollen-based tree cover. The dataset can be used as a grid with binned and aggregated samples (adjustable script provided on Zenodo at https://doi.org/10.5281/zenodo.13902976, Schild, 2024) or as individual time series if the record's basin size exceeds 50 ha.
This alternative quantitative reconstruction of vegetation cover is beneficial for the investigation of past vegetation dynamics and modern model validation when varying spatial and temporal resolutions may be required. By collecting more RPP estimates, especially in North America, and adding more records to existing pollen data syntheses, reconstructions may be improved even further. The new REVEALS dataset is freely available on PANGAEA (see the Code and data availability section; https://doi.org/10.1594/PANGAEA.974798, Herzschuh et al., 2025).
- Article
(4979 KB) - Full-text XML
-
Supplement
(2898 KB) - BibTeX
- EndNote


Anthropogenic climate change is driving vegetation shifts that could lead to disruptions to ecosystem functions and services or even trigger feedback effects on other Earth system elements (IPCC, 2023; Armstrong McKay et al., 2022). Predicting these changes through modeling is challenging. A thorough mechanistic understanding of vegetation dynamics and their interactions with climate is essential. This requires the validation and testing of data from coupled climate–vegetation models, which in turn depends on the availability of extensive vegetation data from periods spanning climatic transitions (Dearing et al., 2012). Given the relatively brief duration of available instrumental climate and vegetation data, there is a clear need for long-term vegetation records derived from paleoecological archives that cover broader climatic gradients than modern datasets (Dearing et al., 2010; Dallmeyer et al., 2023).
Pollen data, as a direct proxy for paleo-vegetation, are especially useful for comparisons with modeled data, as they can be used to reconstruct land use (Fyfe et al., 2015; Davis et al., 2015), biomes (Woodbridge et al., 2014; Prentice et al., 1996), and climate (Herzschuh et al., 2023a, b; Bartlein et al., 2011; Viau et al., 2012). The compilation of pollen data syntheses is essential to aid this purpose (Anderson et al., 2006; Gaillard et al., 2010; Strandberg et al., 2014). Several subcontinental and continental collections of pollen data already exist, spanning regions such as Europe, North America, Africa, Siberia, and China (Fyfe et al., 2009; Whitmore et al., 2005; Vincens et al., 2007; Cao et al., 2014, 2020), and have been integrated into the global Neotoma Paleoecology Database (Williams et al., 2018). To allow for a broader application of pollen data, LegacyPollen 2.0 (Li et al., 2024b) offers a global, harmonized pollen dataset that has undergone taxonomic standardization, metadata verification, and consistent age modeling (Li et al., 2022a; Herzschuh et al., 2022). This taxonomic harmonization forgoes the higher taxonomic resolution of some datasets in favor of equivalence, resulting in overall comparability useful for analyses at large spatial scales. Despite advances in harmonization, the use of pollen data remains limited due to the fact that the pollen composition does not accurately reflect vegetation (Davis, 1963; Prentice, 1985; Prentice and Webb, 1986). This limitation arises from variations in taxon-specific parameters such as relative pollen productivity (RPP) and pollen dispersal characteristics, leading to discrepancies between the pollen record and actual past vegetation. This hinders quantitative vegetation assessment, as taxa with high pollen productivity and efficient pollen dispersal tend to be overrepresented in the pollen record, whereas those with low pollen productivity and less effective dispersal are underrepresented. These factors, along with the compositional nature of pollen data, result in a nonlinear relationship between pollen and vegetation, titled the Fagerlind effect (Prentice and Webb, 1986; Fagerlind, 1952). Approaches such as the R-value model (Davis, 1963; Webb et al., 1981) and the extended R-value model (Parsons and Prentice, 1981) were created to address this issue and were later included into the Regional Estimates of Vegetation Abundance from Large Sites (REVEALS) model (Sugita, 2007). By accounting for taxon-specific RPP and fall speed values, as well as basin-specific parameters such as basin size and type, REVEALS estimates regional vegetation cover from pollen counts. The model has been applied in several regional-scale studies (Nielsen et al., 2012; Mazier et al., 2015; Hellman et al., 2008a), and multiple validations have demonstrated its ability to approximate actual vegetation (Sugita et al., 2010; Hellman et al., 2008a; Soepboer et al., 2010; Mazier et al., 2012), even though the model's performance heavily relies on accurate taxon-specific parameters. While Li et al. (2017), Wieczorek and Herzschuh (2020), and Githumbi et al. (2022) provide comprehensive compilations of RPP and fall speed values for taxa of China, the Northern Hemisphere, and Europe, respectively, the overall availability of RPP studies is still limited, and regional variations in RPP values exist (Harris et al., 2020; Broström et al., 2008; Li et al., 2017; Mazier et al., 2012). This makes the application of REVEALS on larger scales particularly challenging. Only some (sub-)continental REVEALS reconstructions are available for Europe (Trondman et al., 2015; Roberts et al., 2018; Githumbi et al., 2022; Serge et al., 2023), Asia (Cao et al., 2019; Li et al., 2022b, 2023, 2024a), and North America (Dawson et al., 2024). Currently, no global or northern hemispheric quantitative vegetation cover reconstructions using REVEALS exist.
Because of its importance for the assessment of biome stability, carbon storage, climatic feedbacks, and land-use change, tree cover is a commonly reconstructed variable (e.g., Fyfe et al., 2015; Githumbi et al., 2022; Serge et al., 2023). Due to the global availability of remote-sensing data on contemporary tree cover, reconstructions of tree cover in modern time slices may even be validated (Hjelle et al., 2015; Roberts et al., 2018). However, only Serge et al. (2023) and Pirzamanbein et al. (2014) have used this opportunity for extensive validation and even improvement of reconstructions from European pollen records. No grid-cell-based validations exist for the Northern Hemisphere.
Here, we present reconstructed quantitative vegetation cover for the Northern Hemisphere from the LegacyPollen2.0 dataset – an updated global, taxonomically and temporally standardized fossil pollen dataset of 3680 palynological records – using REVEALS for the last 14 kyr. The datasets were created using existing estimates of taxon-specific parameters. The REVEALS reconstruction includes corrected vegetation composition and reconstructed tree cover.
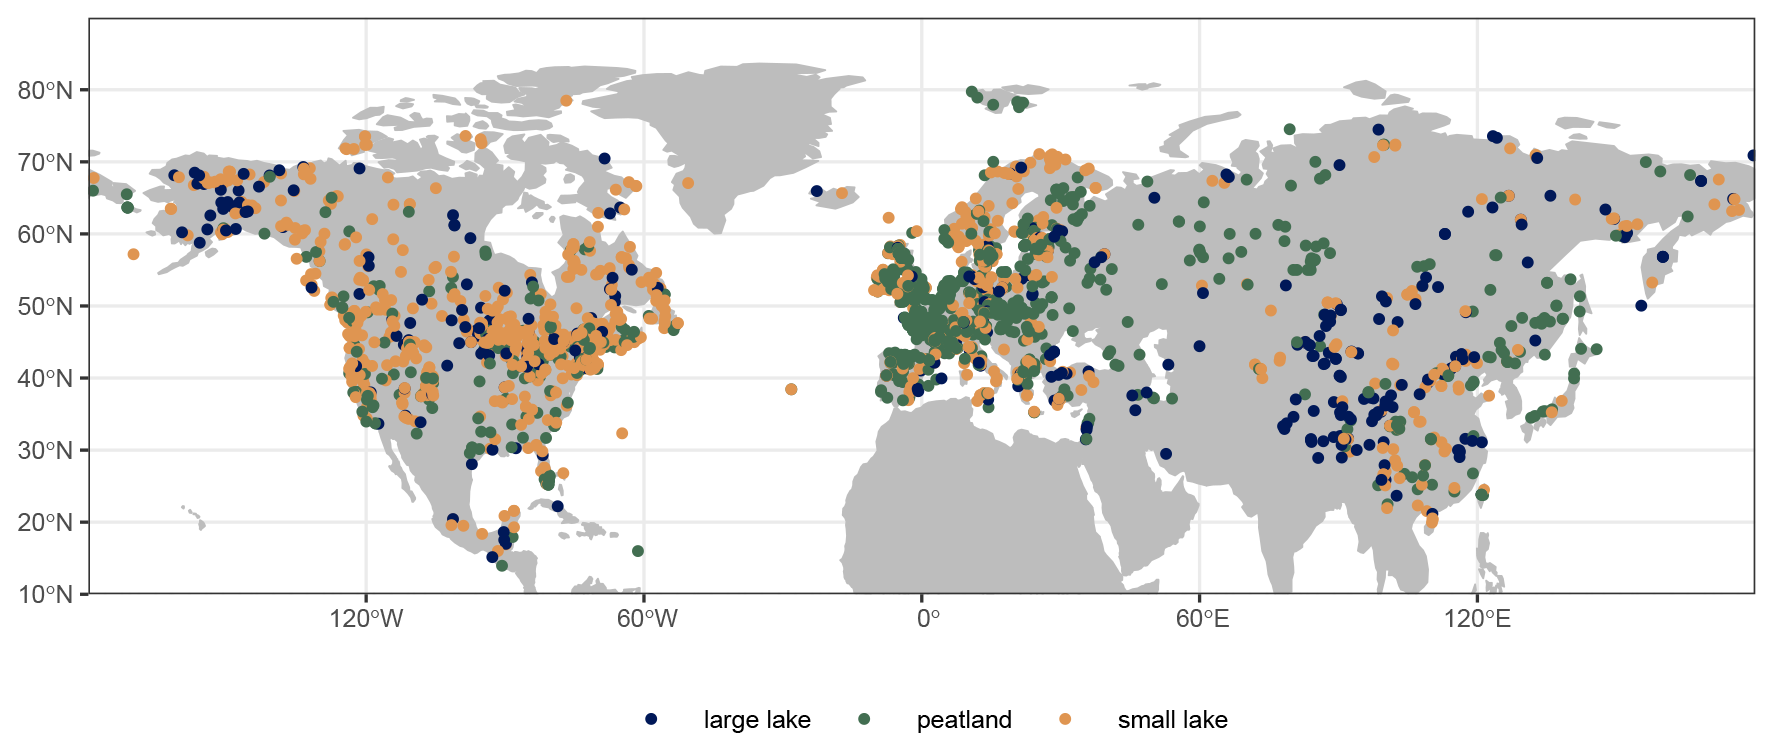
Figure 1Pollen record locations in the LegacyVegetation dataset. Colors indicate the record type (large lake ≥ 50 ha). The record density is highest in Europe and eastern North America, whereas it is lowest in northern and central Asia.
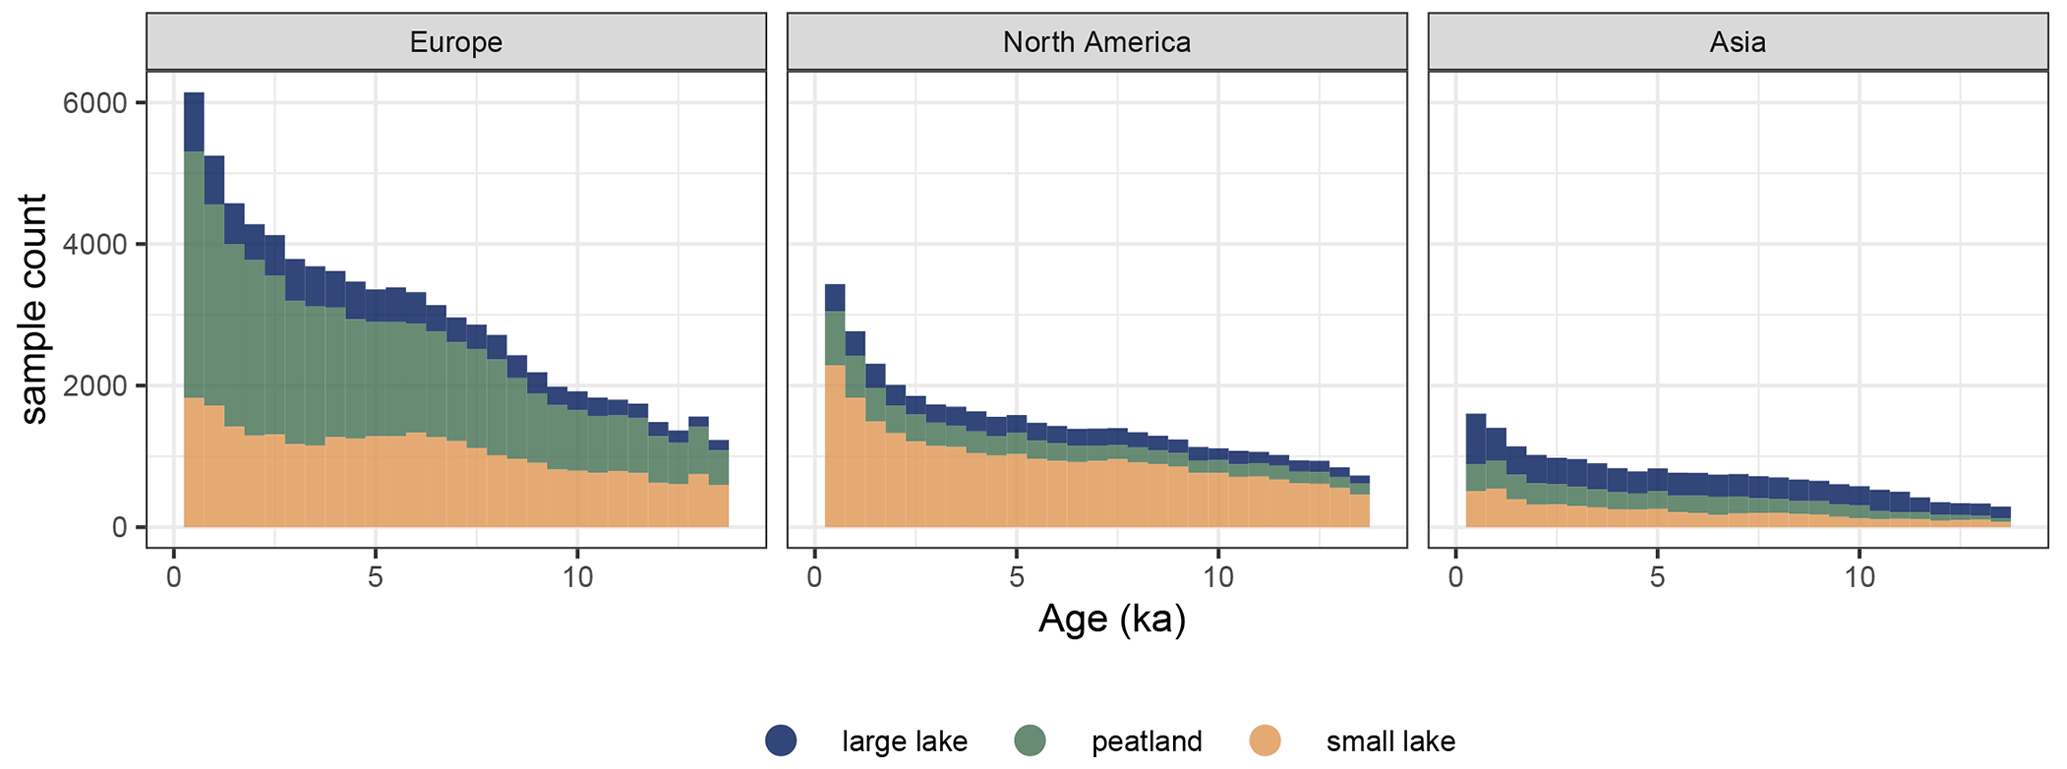
Figure 2Temporal coverage of records in the LegacyVegetation dataset per continent. Bins are 500 years wide. Sample count decreases with age, and Europe has the most samples overall.
2.1 Pollen dataset
The pollen data synthesis LegacyPollen 2.0 (Li et al., 2024b) includes 3680 temporally resolved records (time series) that are distributed globally. Data were collected from individual publications and the Neotoma Paleoecology Database, which includes data from the European Pollen Database and the North American Pollen Database (Fyfe et al., 2009; Giesecke et al., 2014; Williams et al., 2018). An overview of Neotoma records included in LegacyPollen 2.0 and this reconstruction can be found in Sect. S1 in the Supplement.
For the REVEALS reconstruction, only lake and peat records in the Northern Hemisphere were used (n=2752). Analogous to the preceding LegacyPollen 1.0 dataset (Herzschuh et al., 2022), the data synthesis involved revising and standardizing age modeling and taxonomic harmonization for consistency of records. Reconstruction chronologies may, therefore, differ slightly from previous reconstructions due to this revised age modeling. The spatial data coverage of records in the reconstruction is dense in Europe (1287 records) and North America (1040), whereas it is the sparsest in Asia (446) (see Fig. 1). The records' sample density decreases with age (see Fig. 2). Only samples dated to 14 kyr or younger were used to ensure that the climatic conditions of recorded vegetation were similar to the modern climate (Shakun et al., 2012; Mottl et al., 2021; Li et al., 2024c).
2.2 Implementing REVEALS
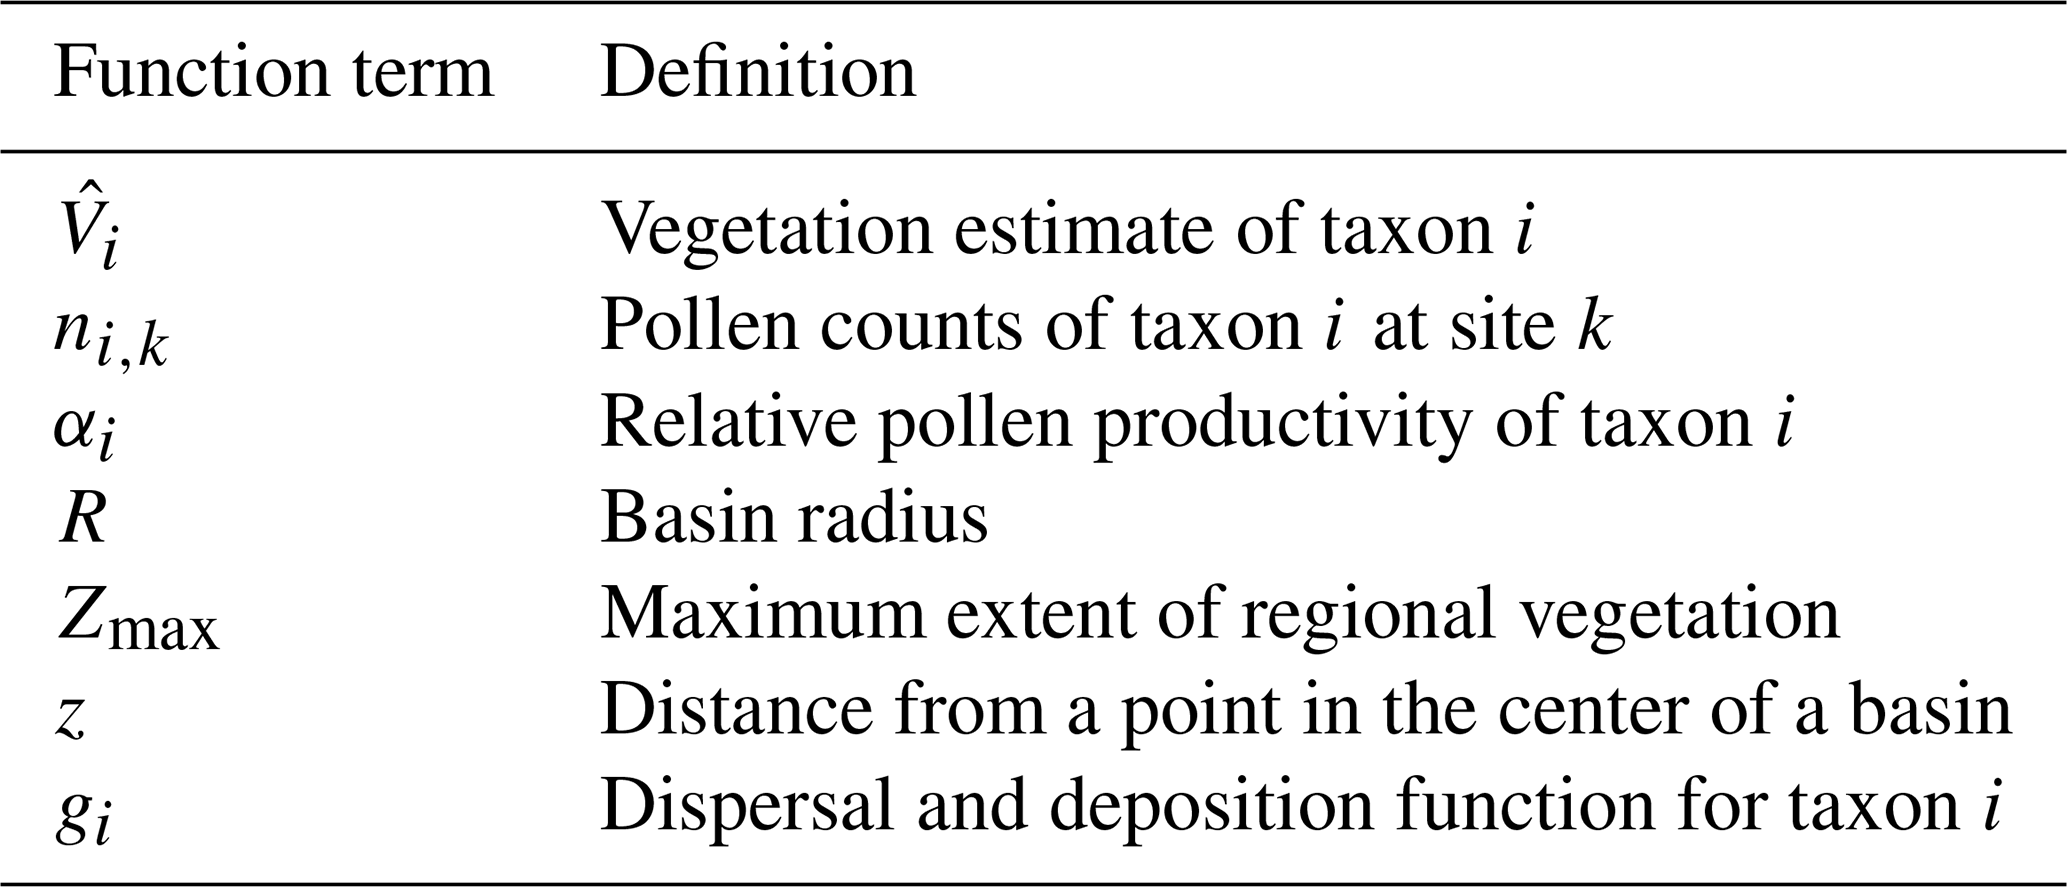
The REVEALS model estimates quantitative vegetation coverage from pollen assemblages using site- and taxon-specific parameters (Sugita, 2007). Based on wind speed and taxon-specific fall speed, pollen dispersal is modeled in ring sources around the basin, and deposition over the lake basin is integrated to give pollen influx. Along with the RPP, this dispersal factor is used to correct original pollen counts to better represent actual vegetation (see Eq. 1 and Table 1).
The REVEALS model follows a set of assumptions. Firstly, neither directionality nor pollen transport through agents other than wind are considered in the model. The maximum spatial extent for this pollen transport (Zmax; see Table 2) has to be set to define the region in which most of the pollen originates. This value will always be an assumption and has only been tested empirically by Hellman et al. (2008b). Additionally, it is assumed that the basin is circular with no source of pollen within the basin radius. The peatland and bog sites used in our reconstructions inherently violate this assumption. Nevertheless, the quantitative reconstruction of vegetation cover from peatland cores is possible using Prentice's deposition model (Prentice, 1985, 1988) instead of Sugita's deposition model (Sugita, 1993) in the dispersal and deposition function (see Eq. 1; Sugita, 2007). Previous studies have shown that results from small bogs are still reliable when aggregated, whereas results from large bogs alone tend to deviate from those of large lakes due to the violation of the aforementioned assumption (Trondman et al., 2016). Using small peatland records for reconstructions is, therefore, appropriate when spatially averaging multiple sites. Following Trondman et al. (2015), we average multiple sites by using both large and small peatlands. We use REVEALSinR from the DISQOVER package in R to implement REVEALS (Theuerkauf et al., 2016, Version 0.9.13, https://github.com/MartinTheuerkauf/disqover, last access: 31 March 2025). It mainly differs from the original program by Sugita (2007) with respect to the process of error calculation. REVEALSinR includes repeated model runs with random error added to RPP values and pollen counts (see Table 2 for the number of variations). The resulting distribution of the REVEALS results allows for an estimation of the standard deviation of vegetation cover per taxon. These error estimates are included in our dataset as the standard deviations as well as the 10th and 90th percentile estimates for each taxon. However, the program by Sugita (2007) derives error estimates with a hybrid method from a variance–covariance matrix of RPP and Monte Carlo simulations. For further details on the REVEALS model, the reader is referred to the original publication Sugita (2007), while previous REVEALS applications on continental scales can be found in publications such as Li et al. (2017), Githumbi et al. (2022), Serge et al. (2023), and Dawson et al. (2024). While the error estimates give insights into how certain the model is, estimates can still be wrong depending on the quality of the RPP values provided.
Parameters and model settings
For each taxon, values for the RPP (with uncertainties provided as standard deviation) and fall speeds are used. We made use of the synthesis of the Northern Hemisphere RPP and fall speed values from Wieczorek and Herzschuh (2020). Several RPP studies published since this synthesis were added to the compilation (Geng et al., 2022; Li et al., 2022b; Wang et al., 2021; Huang et al., 2021; Zhang et al., 2021b, a; Wan et al., 2020, 2023; Jiang et al., 2020). The methods for the study selection and calculation of synthesis values follow Wieczorek and Herzschuh (2020) and Githumbi et al. (2022). We expanded the synthesis calculation of the RPP to different taxonomic levels (genus, family, and order) to account for the taxonomic harmonization in the pollen dataset. An overview of the original values and synthesized values can be found in Appendices A and B, respectively. The number of available RPP values in Asia (59) and Europe (69) is higher than in previous RPP syntheses due to the inclusion of multiple taxonomic levels (Li et al., 2018; Githumbi et al., 2022).
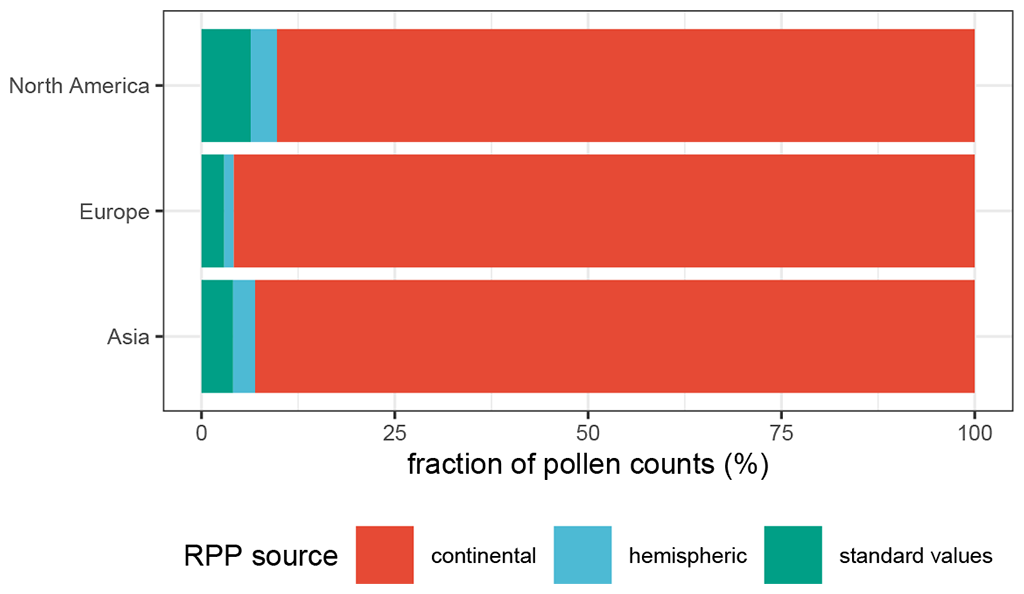
Figure 3Percentage of the total pollen counts for which either continental, hemispheric, or “standard” RPP values were used. The standard value (1 ± 0.5) is used when no RPP value is available for a specific taxon.
Table 2Static model parameters and model settings for REVEALS runs using REVEALSinR (Theuerkauf et al., 2016).
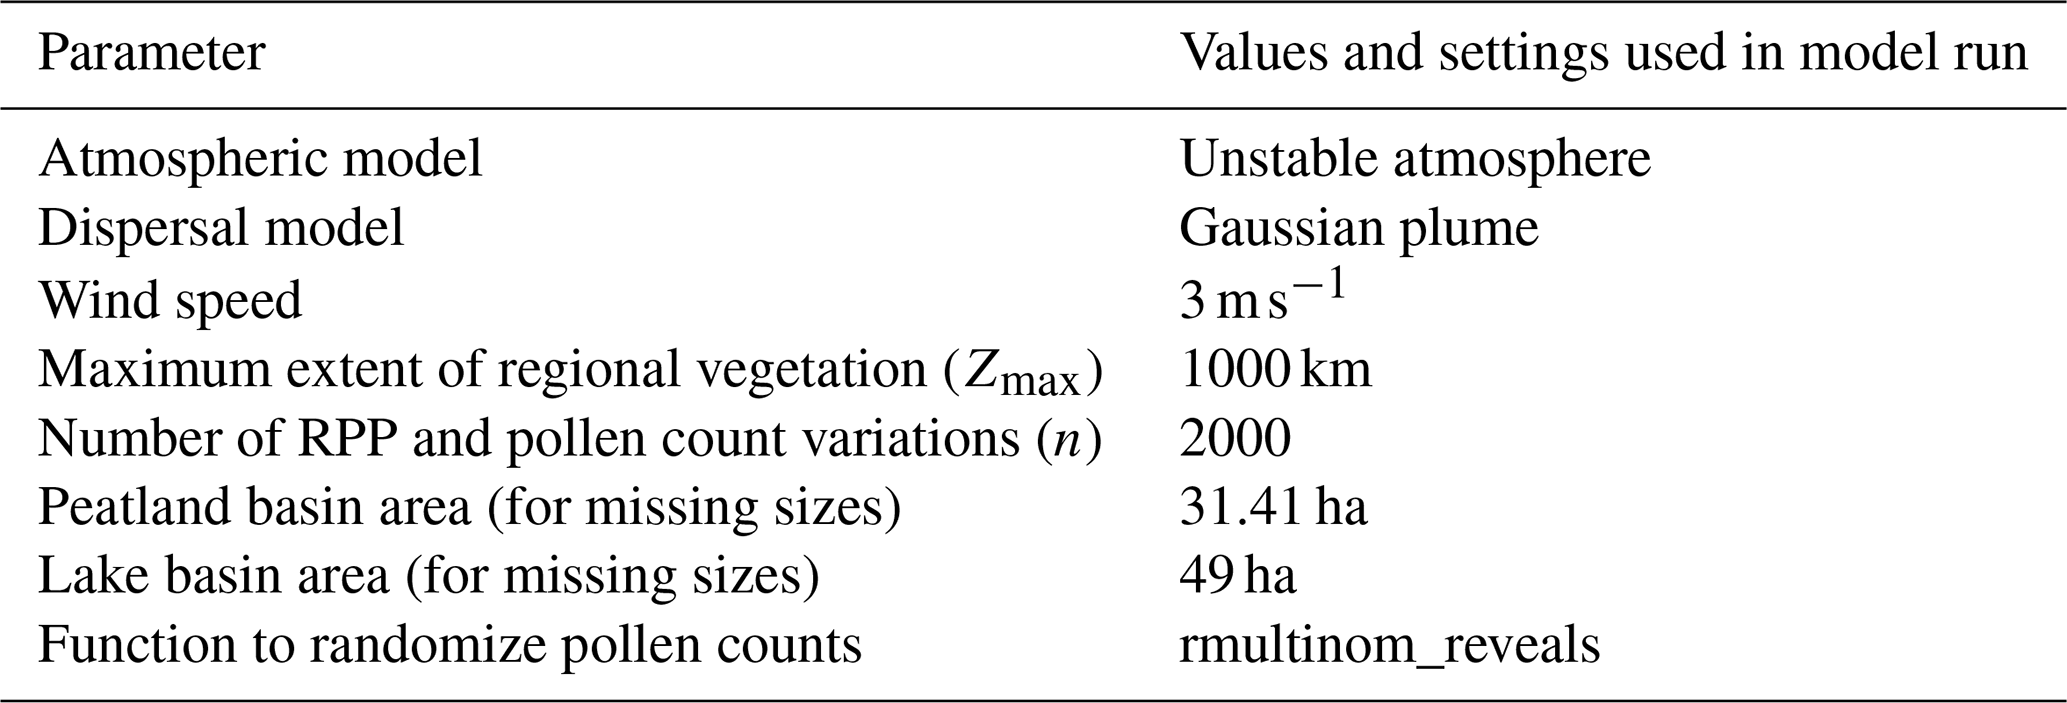
When available, we use continent-specific values in our reconstruction. For taxa with no continental values present, we use northern hemispheric values. If no values exist for a taxon, the RPP is set to a constant (RPP = 1, σ = 0.25) and fall speeds are filled with mean continental fall speeds in order to maximize the number of taxa used in the reconstruction. Continental RPP values are available for the majority of pollen counts for all three continents (see Fig. 3). The fraction of pollen sums for which standard RPP values were assumed is highest in North America, although it is still < 10 %. For each site, the REVEALS model also requires information on basin type, basin size, and original pollen counts, all of which were collected in the LegacyPollen 2.0 dataset (Li et al., 2024b). Missing basin areas for lakes and peatlands are set to a standard value, which can be found in Table 2 along with several constant parameters set in REVEALSinR. For the standard value of missing lake areas, we build on the standard value of 50 ha used by Dawson et al. (2024). However, we reduce it slightly so as not to have those lakes count as large lakes (see Sect. 2). Lastly, we also reduced the computational effort in REVEALSinR by implementing a maximum number of steps in the lake model used for model mixing in the basin. The number of steps was now set to 500 unless m fell below the maximum value of for basins with a radius of at least 1000 m and for basins with a radius smaller than 1000 m. This adjustment prevented unnecessarily small steps for large lakes while also maintaining robust and reliable results.
2.3 Reconstruction of tree cover and validation
Tree cover was reconstructed by summing up the percentages of arboreal taxa (see the list of arboreal taxa in Sect. S2) with Betulaceae, Betula, and Alnus being classified as arboreal at sites below 60° N. The mean reconstructed compositional coverages from the REVEALS results were used for the tree cover reconstructions. REVEALS results were then rasterized to also include records from smaller basins in a temporal and spatial aggregation. Reconstructed time series were averaged in 500-year bins and then rasterized and averaged in grids of differing spatial resolution. A grid cell was classified as having a valid reconstruction when it contained records from at least one large lake (≥ 50 ha) or at least two small basins, following Serge et al. (2023). Standard deviations of the REVEALS estimates were aggregated by applying the delta method by Stuart and Ord (1994), using the same equation as Wieczorek and Herzschuh (2020). We provide a script for rasterization with adjustable temporal and spatial resolution for users of the dataset on Zenodo (https://doi.org/10.5281/zenodo.13902976, Schild, 2024).
This method of temporal and spatial averaging differs from several previous REVEALS applications. Pollen counts are often summed in temporal bins prior to running REVEALS to increase pollen counts and reduce uncertainty (Trondman et al., 2015; Githumbi et al., 2022; Serge et al., 2023; Dawson et al., 2024). However, temporally averaging after the REVEALS application, as implemented by us, increases the flexibility of the dataset's spatial and temporal resolution with the trade-off of potentially increased uncertainty. Rasterization has previously been performed by using a weighted average considering the basin size of the original record (Trondman et al., 2015; Githumbi et al., 2022; Serge et al., 2023). However, the most recent REVEALS-based North American vegetation reconstruction uses the same arithmetic mean as described above (Dawson et al., 2024). When comparing our method of temporal and spatial aggregation to that used by previous European reconstructions (e.g., Serge et al., 2023), we also found no significant differences in the validation of reconstructed tree cover (see Sect. S6).
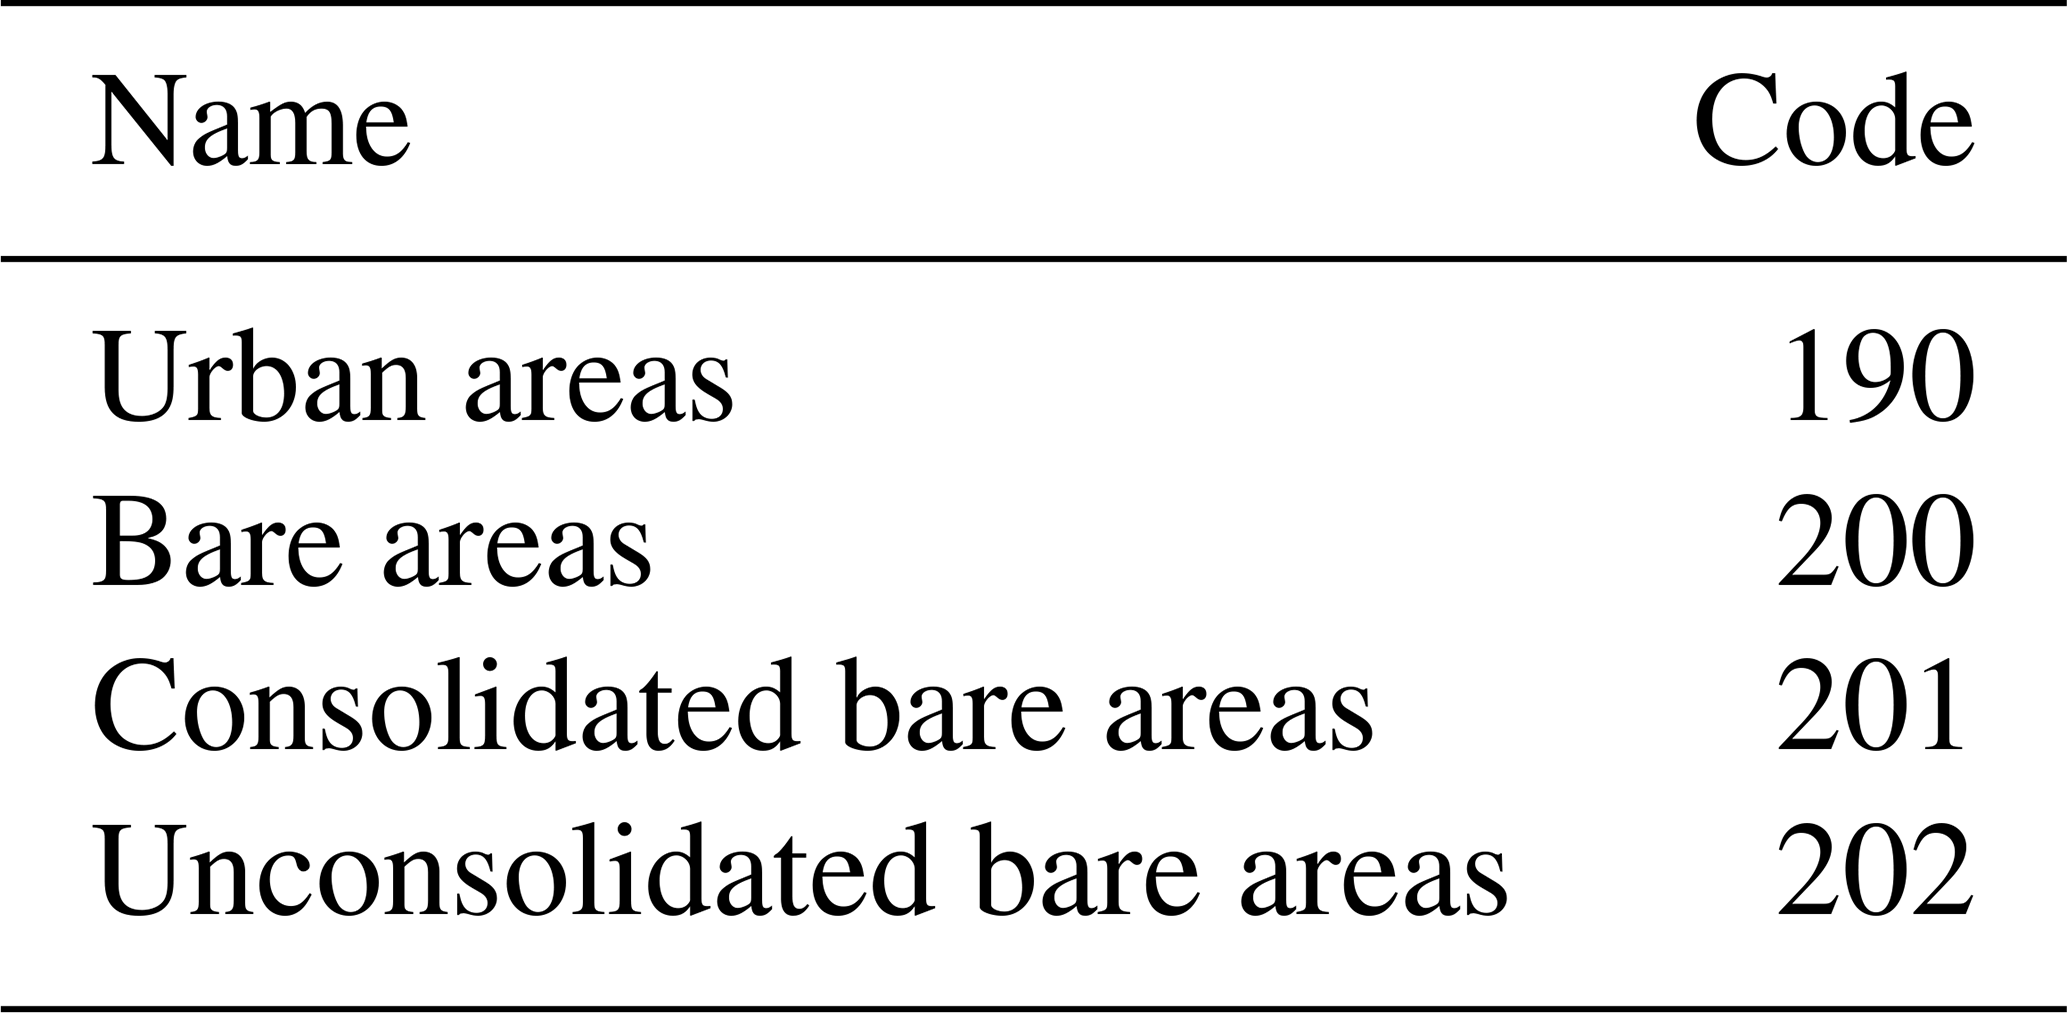
For validation, the reconstructed tree cover of all samples younger than 100 years BP was rasterized and compared to modern remote-sensing forest cover. Only valid grid cells as defined above were used for validation. Average forest canopy cover for all grid cells was extracted from the Landsat Global Forest Cover Change (GFCC) dataset from the temporal average of the years 2000, 2005, 2010, and 2015 (Sexton et al., 2013; Townshend, 2016). An openness correction was applied to sites containing urban areas and paved surfaces within the 80 % pollen source areas (PSAs) (Sect. S5) to correct for areas without any pollen sources and, thus, ensure comparability to modern remote-sensing forest cover (see Eqs. 2–4). For this, the percentage of unvegetated land-cover classes for the year 2015 in the ESA Climate Change Initiative (CCI) land-cover (LC) dataset was used (ESA, 2017; see Table 3). Areas covered by water or ice are already considered to be missing values in the remote-sensing forest cover dataset and do not need to be corrected for. Reconstructed tree cover was validated for each grid cell, and mean absolute error () and correlation coefficients were calculated for each continent. No openness correction was applied to the reconstruction values in the final dataset. Validation for a 2° × 2° grid is included in the data summary (Sect. 3.2). Further validations using 1, 5, and 10° resolution are included in the Supplement (Sect. S4).
Table 3Unvegetated land-cover classes in ESA CCI LC chosen for the openness correction.
Additionally, we compare our REVEALS reconstruction to the most recently published REVEALS reconstruction in Europe by Serge et al. (2023, version: RPPs.st1). We average our reconstruction in the same grid and temporal bins as used by Serge et al. (2023) to compare the reconstructed tree cover between both reconstructions. To get the total tree cover, we sum evergreen and summergreen tree cover values in the dataset of Serge et al. (2023), while excluding broadleaved summergreen temperate warm shrubs (BSTWS) and broadleaved evergreen xeric shrubs (BEXS). We validate the previous reconstruction and our reconstruction in the most recent time slice available in the reconstruction of Serge et al. (2023) (−65 to 100 BP, https://doi.org/10.48579/PRO/J5GZUO, Serge and Mazier, 2023) with the remote-sensing forest cover and compare validations. Unfortunately, direct validation could only be performed with the most recent time slice available online, rather than the historical time slice used in the validation by Serge et al. (2023), which limits the ability to reproduce their validation results exactly. We do not apply any openness correction here, as we do not have comparable 80 % pollen source areas available for the records used in Serge et al. (2023). The reconstruction by Serge et al. (2023) differs with respect to both the temporal and spatial aggregation routine, as described above. The definition of arboreal taxa varies, a different RPP-value set was used, and the number of total records included is higher than in our reconstruction (Serge et al., 2023: 1607, LegacyVegetation: 1287).
3.1 Dataset description
The published dataset includes vegetation reconstructions for individual records in Asia, Europe, and North America up until 14 kyr. The reconstructed coverage values include mean, median, standard deviation, and 10 % and 90 % quantile values for each taxon. Mean values and standard deviations are given for tree cover. For each sample, its validity as a site is given, as only reconstructions from large lakes are valid independently. To include all other records, a spatial and temporal average is necessary (rasterization, https://doi.org/10.5281/zenodo.13902976, Schild, 2024).
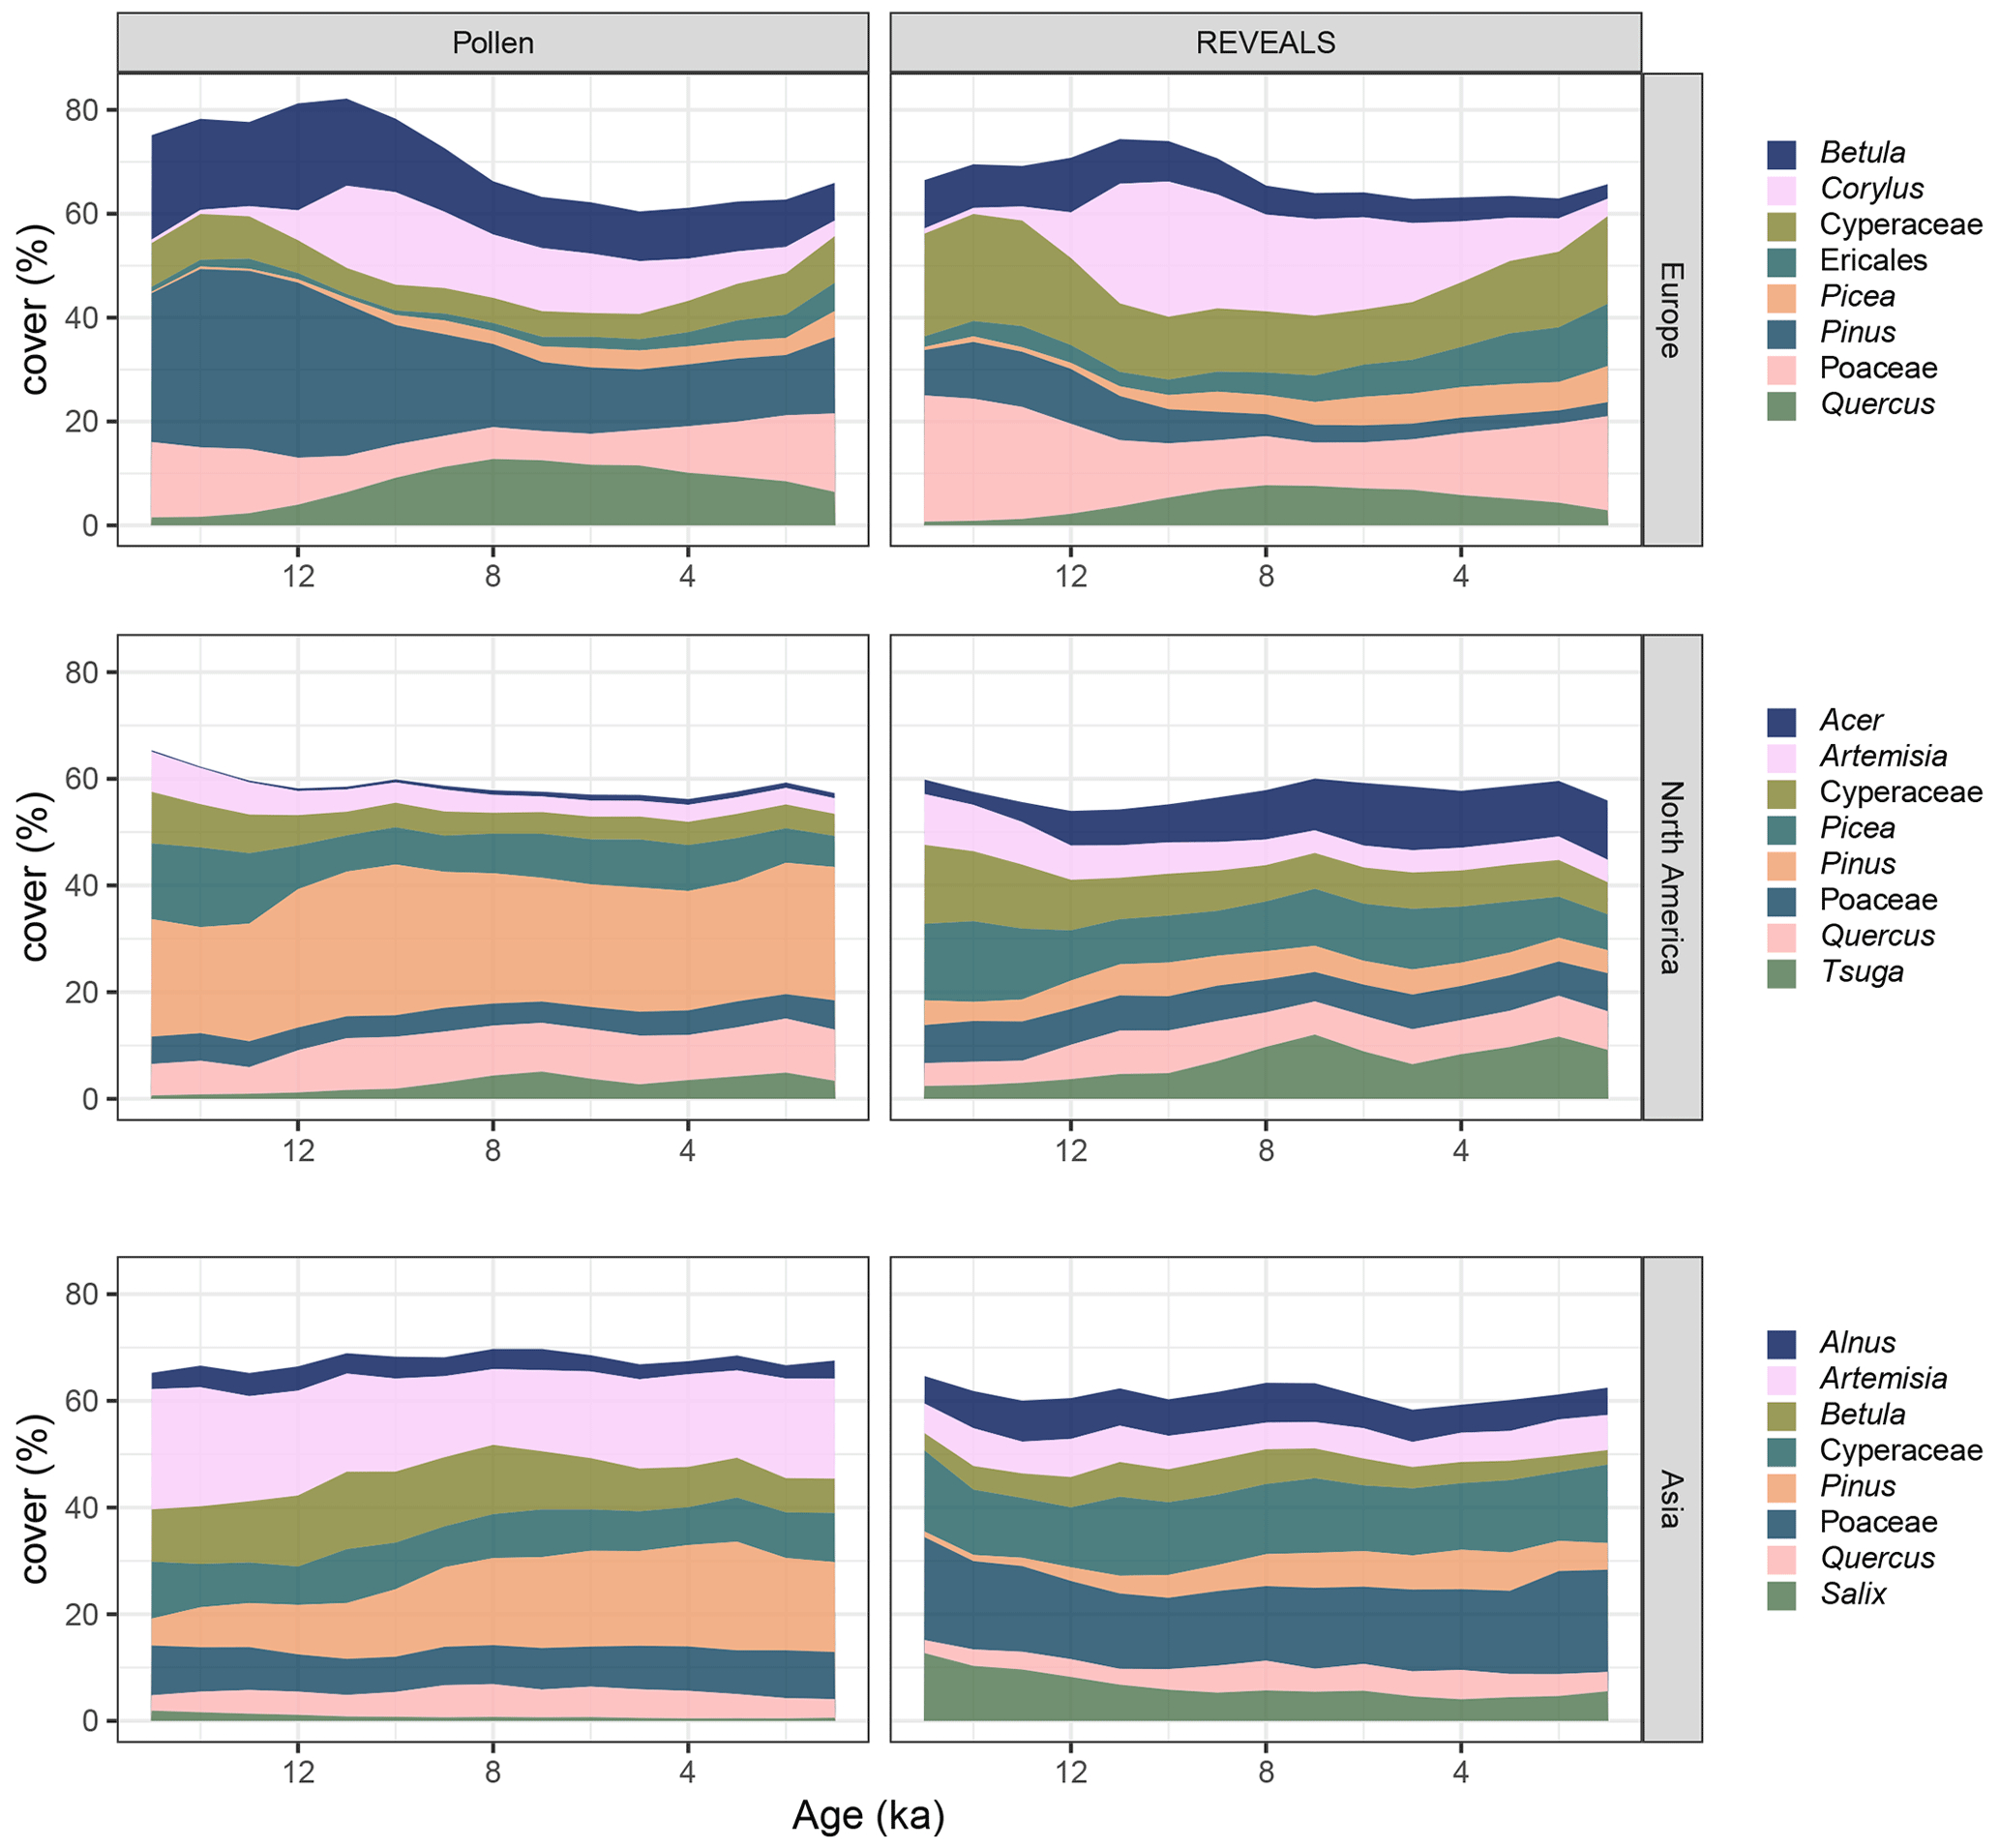
Figure 4Average continental taxonomic coverage per reconstruction for the eight most common taxa per continent. Differences are especially evident for Pinus, Artemisia, and Betula, which all have decreased coverage after the application of REVEALS, and for Poaceae and Ericales, which have increased coverage.
REVEALS was used to reconstruct quantitative vegetation cover. Here, we illustrate a comparison between these reconstructed composition and the original pollen composition. Differences in composition between pollen data and REVEALS are apparent for all continents of the Northern Hemisphere. Some clear examples with the application of REVEALS and its intended correction of taxon-specific biases (see Fig. 4) include the following: increases in Ericales in Europe, decreases in Betula in Europe, decreases in Pinus on all continents, and increases in Acer in North America.
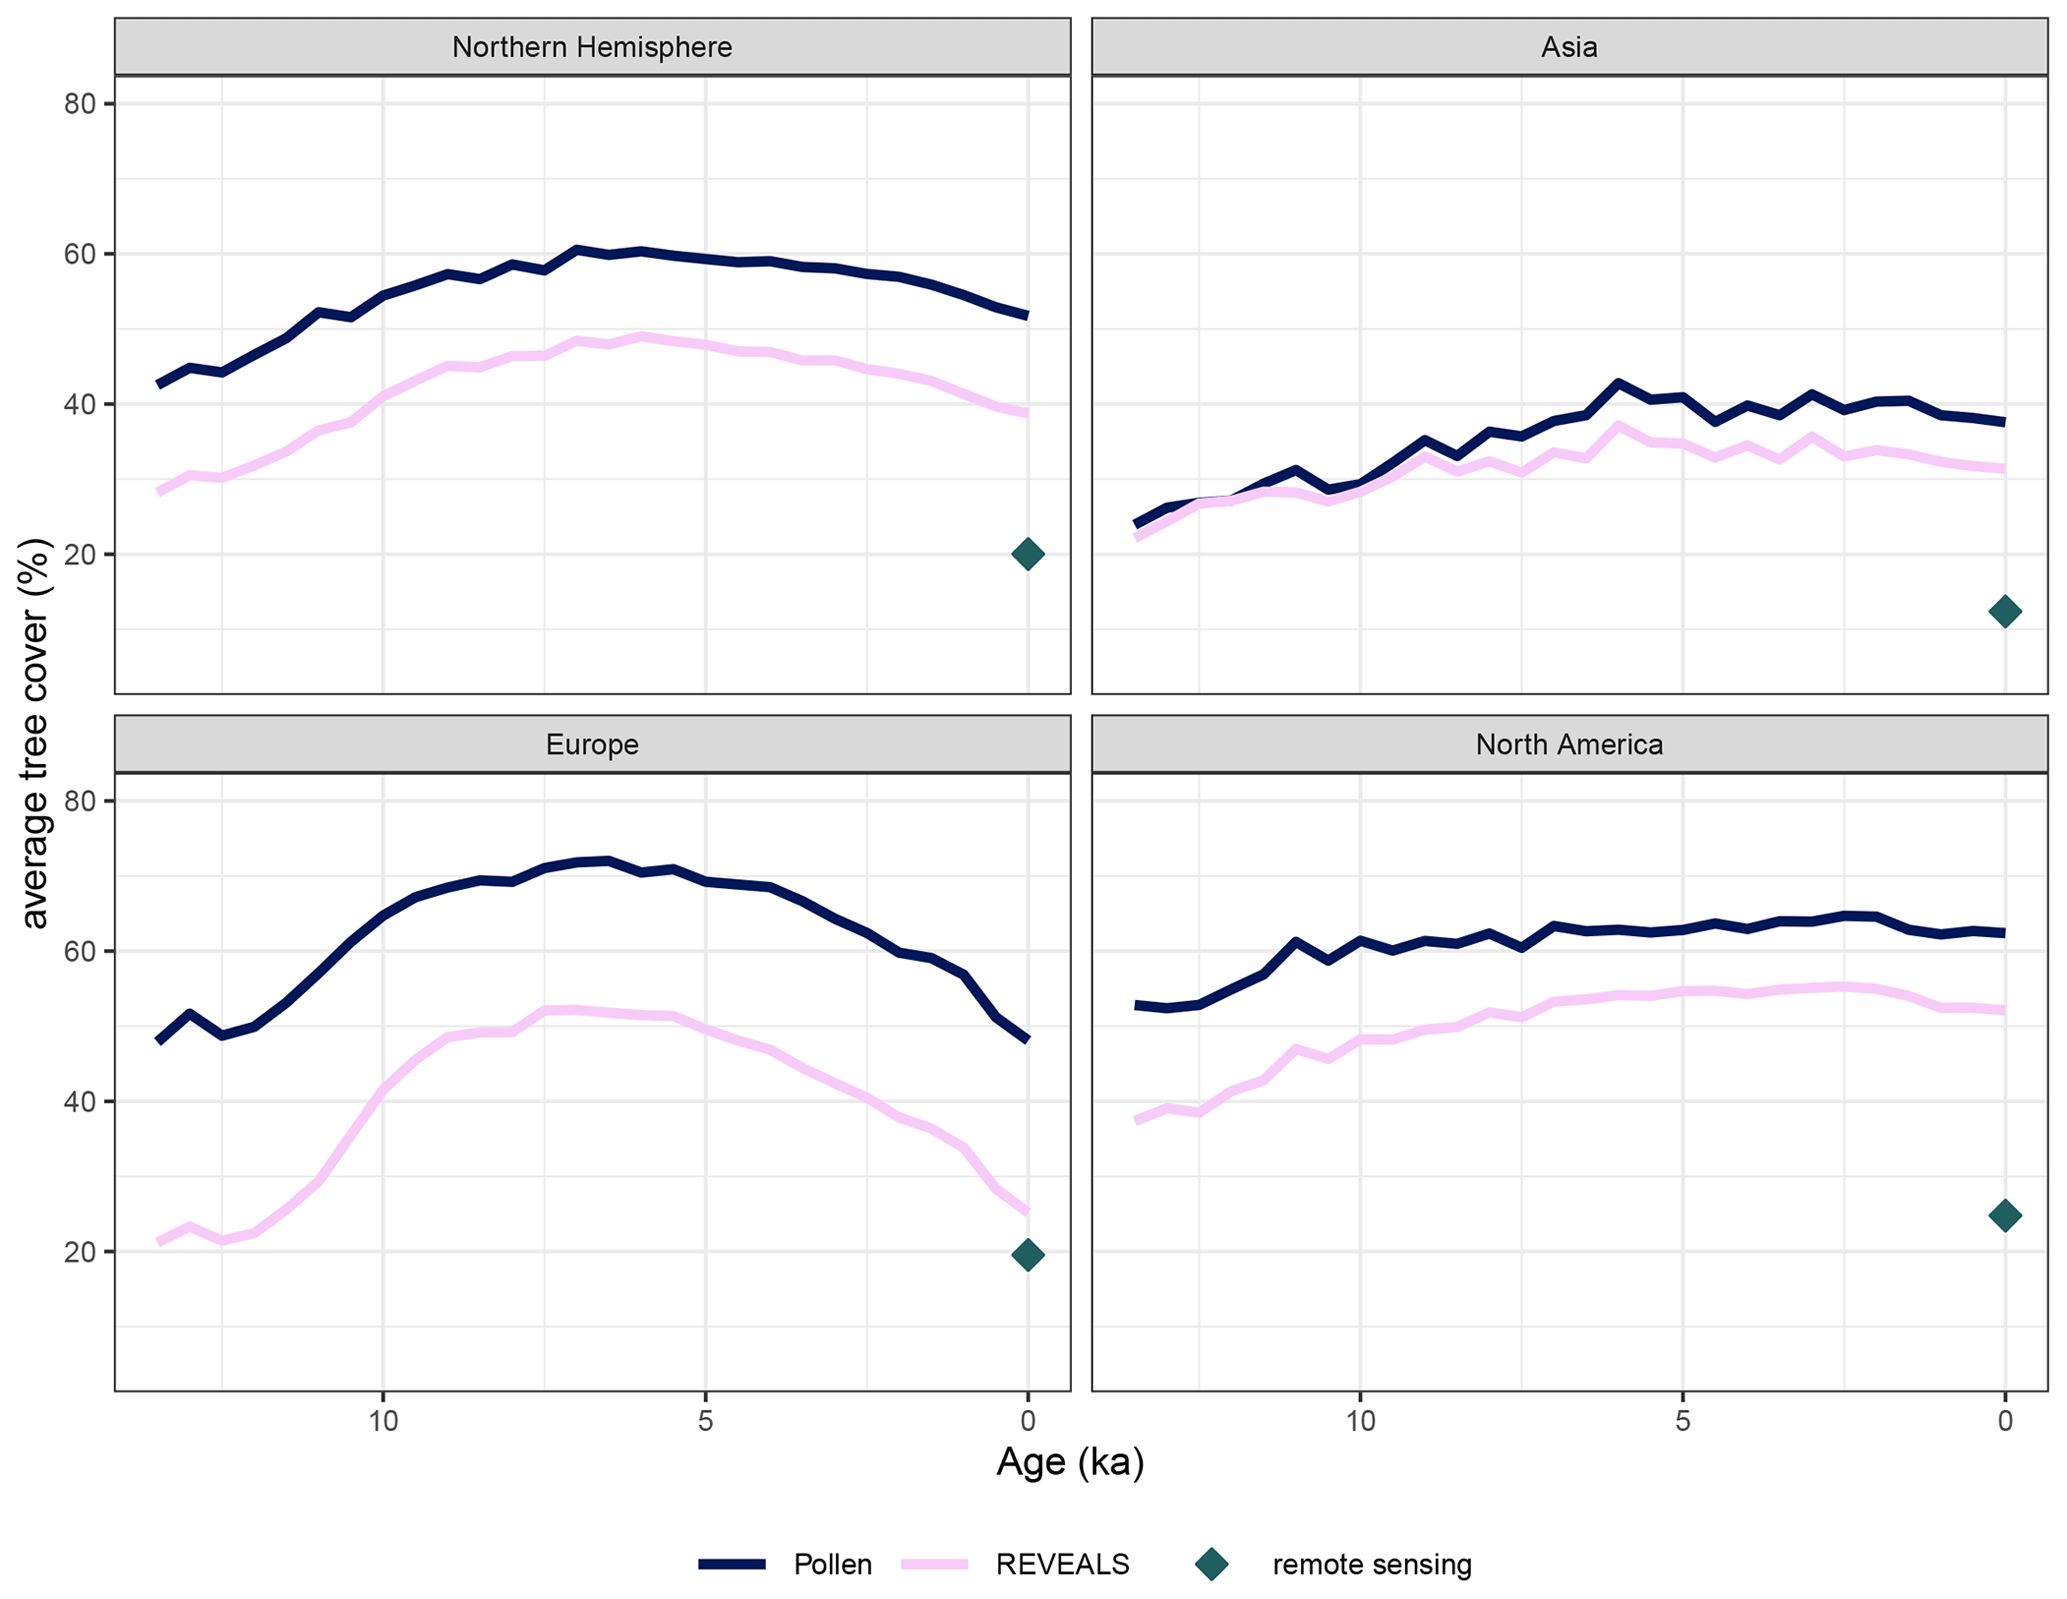
Figure 5Northern Hemisphere and continental mean tree pollen percentage and mean REVEALS tree cover for 2° × 2° grid cells through the Holocene. (Northern Hemisphere and continental averages from different grid cell resolutions are available in Sect. S3). The remotely sensed average forest cover for the grid cells with valid pollen coverage (at least one large lake or multiple other basins present in the time slice) is indicated by the diamond. Temporal trends are the same, but absolute tree cover is reduced in the REVEALS reconstructions compared to the original pollen data. Both pollen percentages and REVEALS estimates still overestimate tree cover.
Using the compositional data available from the original pollen data and the REVEALS run, we reconstructed tree cover for all sites and samples and rasterized the result with different spatial resolutions. The temporal trend in Northern Hemisphere tree cover is the same for both pollen and REVEALS data. Tree cover increases from 14 kyr until roughly 6 kyr and decreases again towards the present (see Fig. 5). REVEALS-reconstructed tree cover is generally lower than the tree pollen percentages in the original samples. However, the difference between pollen and REVEALS tree cover is smaller in North America compared to Europe and Asia. On average, tree cover values from the REVEALS run are roughly 14.54 % lower than values from original pollen composition. The temporal trends in Asia and North America are positive, whereas tree cover in Europe reached its maximum around 6 kyr and has been decreasing since.

Figure 6Total tree pollen percentages and REVEALS-reconstructed tree cover in 2° × 2° grid cells for five example time slices (reconstructions with different grid cell sizes are available in Sect. S3). Valid cells are filled and include reconstructions from at least one large lake (≥ 50 ha) or several smaller basins. Tree cover in eastern North America is higher than in Europe and Asia. REVEALS-reconstructed tree cover is generally lower than tree pollen percentages.
Tree cover is generally highest in eastern North America. This is also where data coverage is best in North America (see Fig. 6). The density of valid grid cells is very high in Europe. Data coverage in Asia is sparse, but valid grid cells indicate higher tree cover on the southeastern coast and in the boreal biome than in central Asia. Rather open areas exist on the Tibetan Plateau and at very high latitudes.
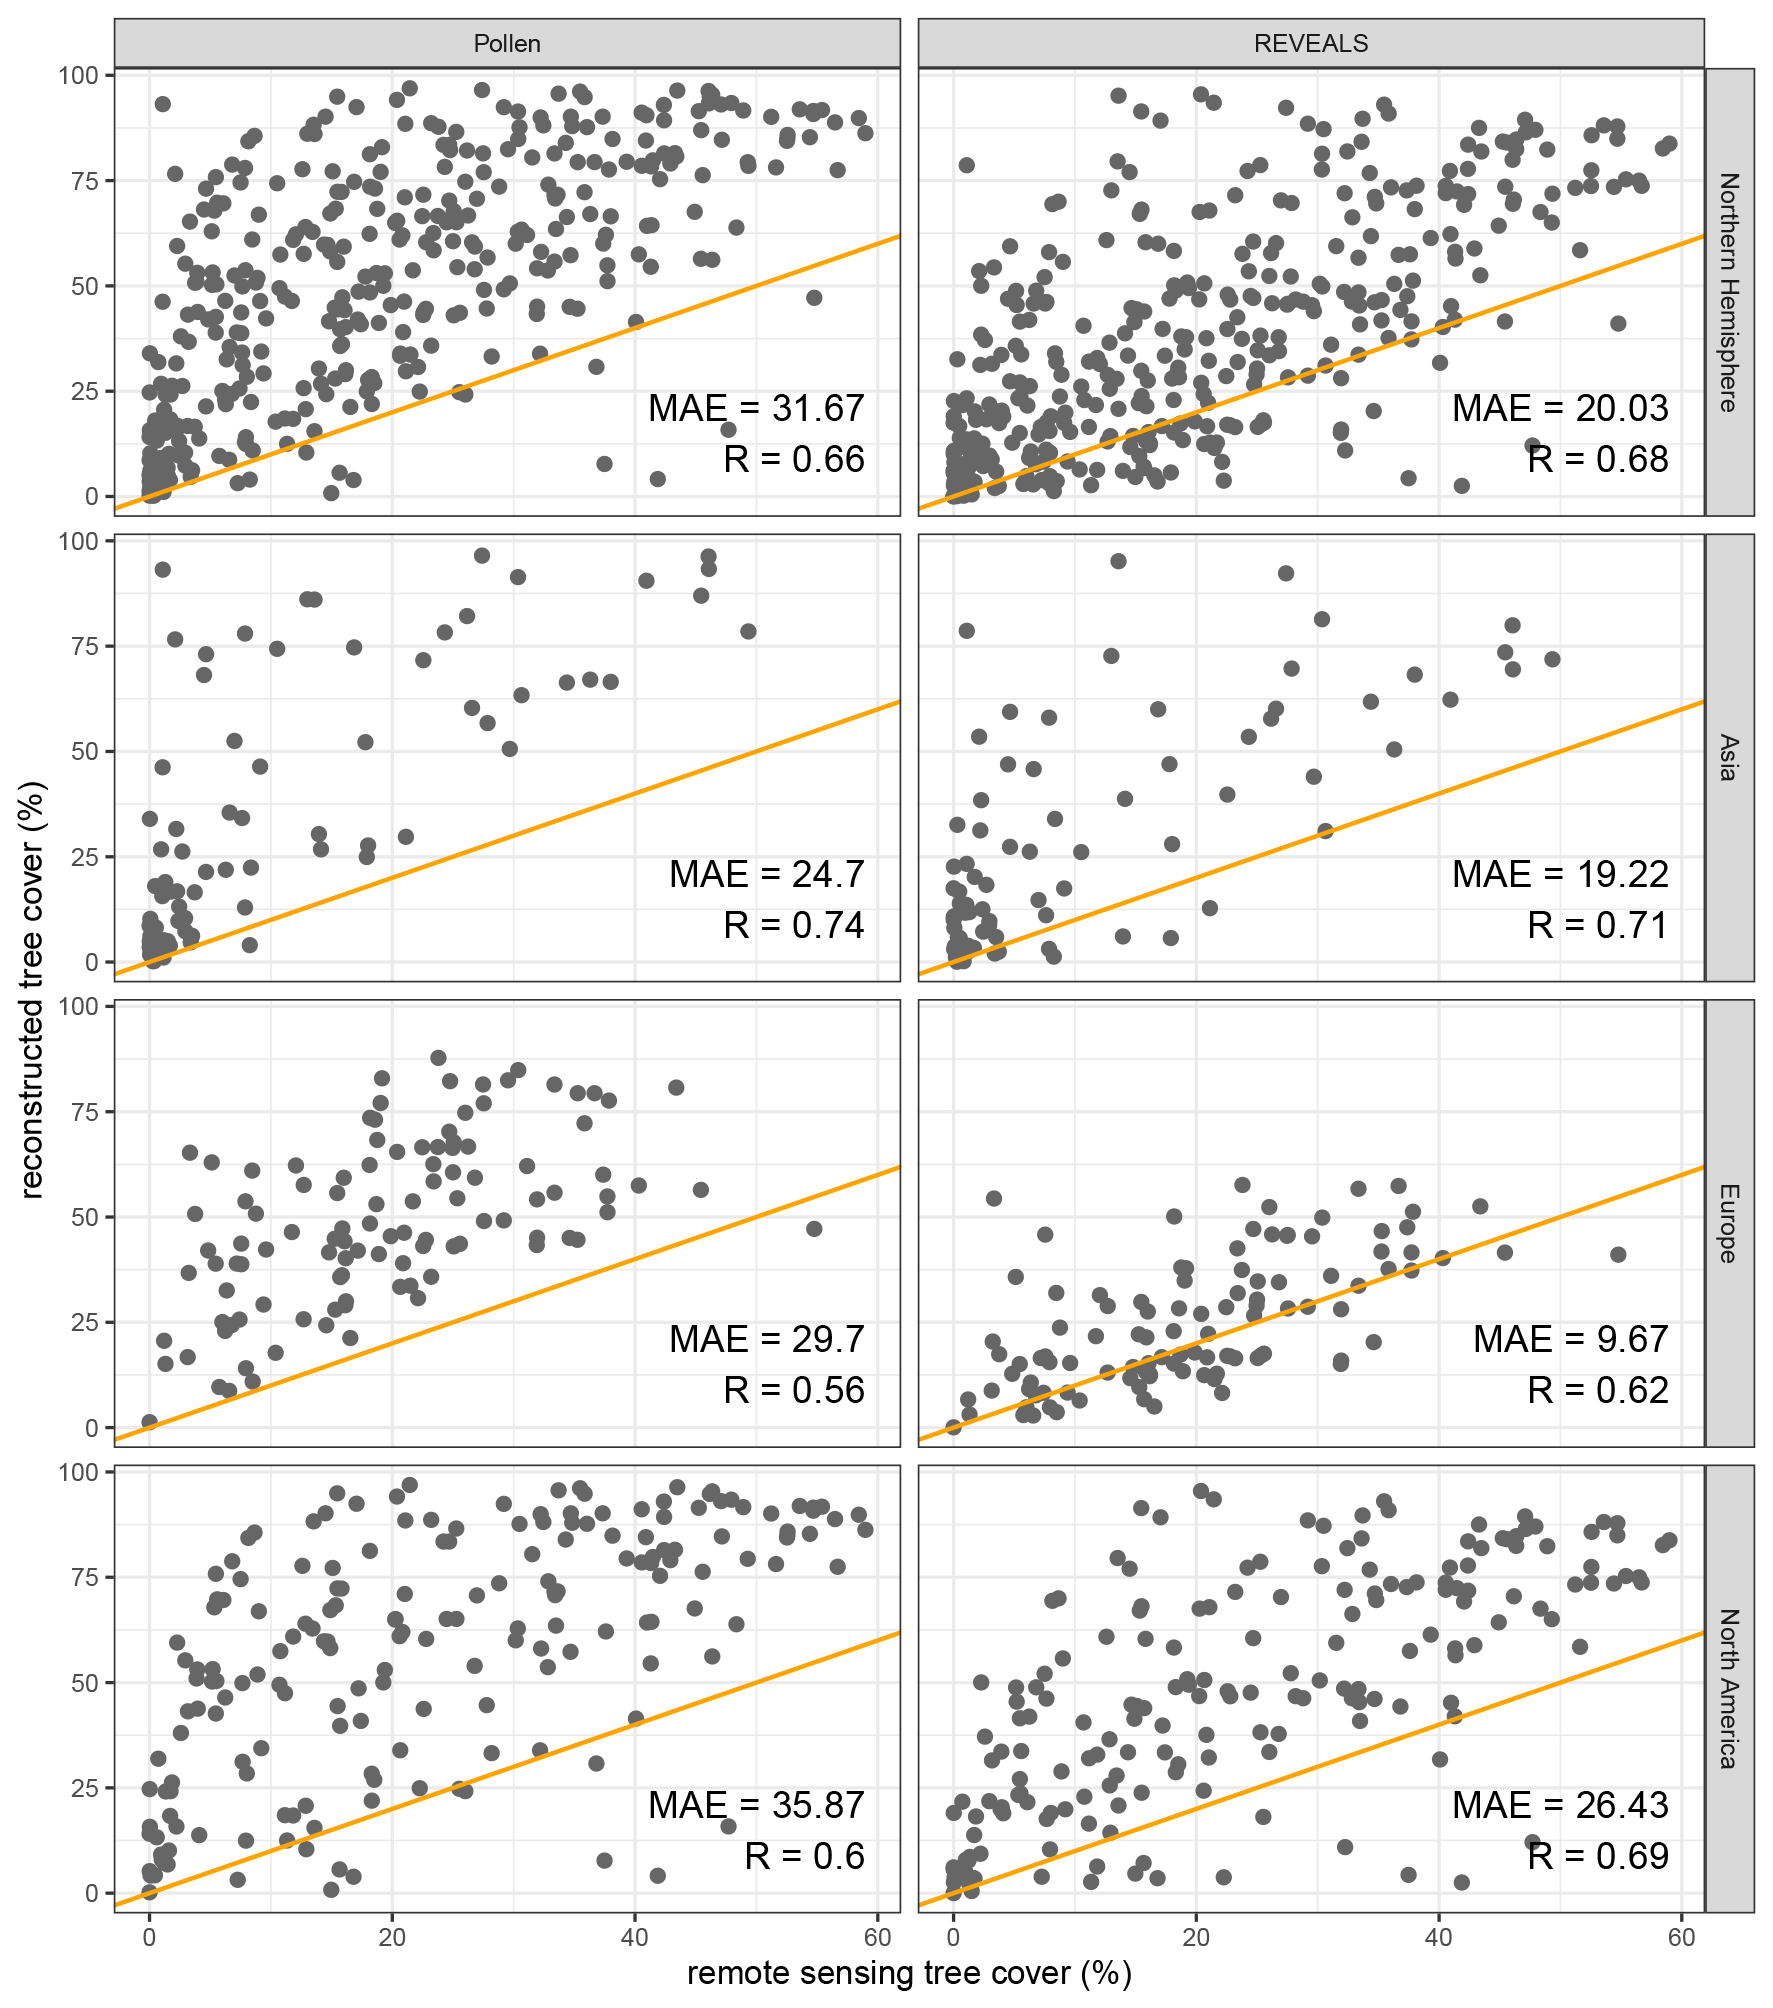
Figure 7Remote-sensing tree cover (Landsat) and modern tree cover from tree pollen and REVEALS estimates (< 100 years BP) in 2° × 2° grid cells with the mean absolute error (MAE; see Sect. 2) and correlation coefficient (R) per group. Reconstructed tree cover from the original pollen data tends to overestimate observed (remote-sensing) forest cover. Tree pollen percentages tend to overestimate observed tree cover from remote-sensing data more than REVEALS-estimated tree cover. The correlation between REVEALS estimates of tree cover and observed data is generally better, especially for Europe. Validations with different grid cell sizes are available in the Supplement (Sect. S4).
3.2 Validation with gridded datasets
Remote-sensing forest cover within grid cells was used to validate the modern reconstructed tree cover from the original pollen data and the REVEALS estimates for each grid cell. Here, we present validation of gridded data with a 2° spatial resolution. Validations with additional spatial resolutions differ only marginally and are included in the Supplement (Sect. S4). Tree pollen percentages from original samples are predominantly higher than remote-sensing forest cover with a mean absolute error (MAE) of 31.67 % in the Northern Hemisphere (see Fig. 7). As reconstructed tree cover is much lower for the REVEALS reconstruction (see Fig.5), the MAE value is reduced significantly to 20.03 % (see Fig. 7).
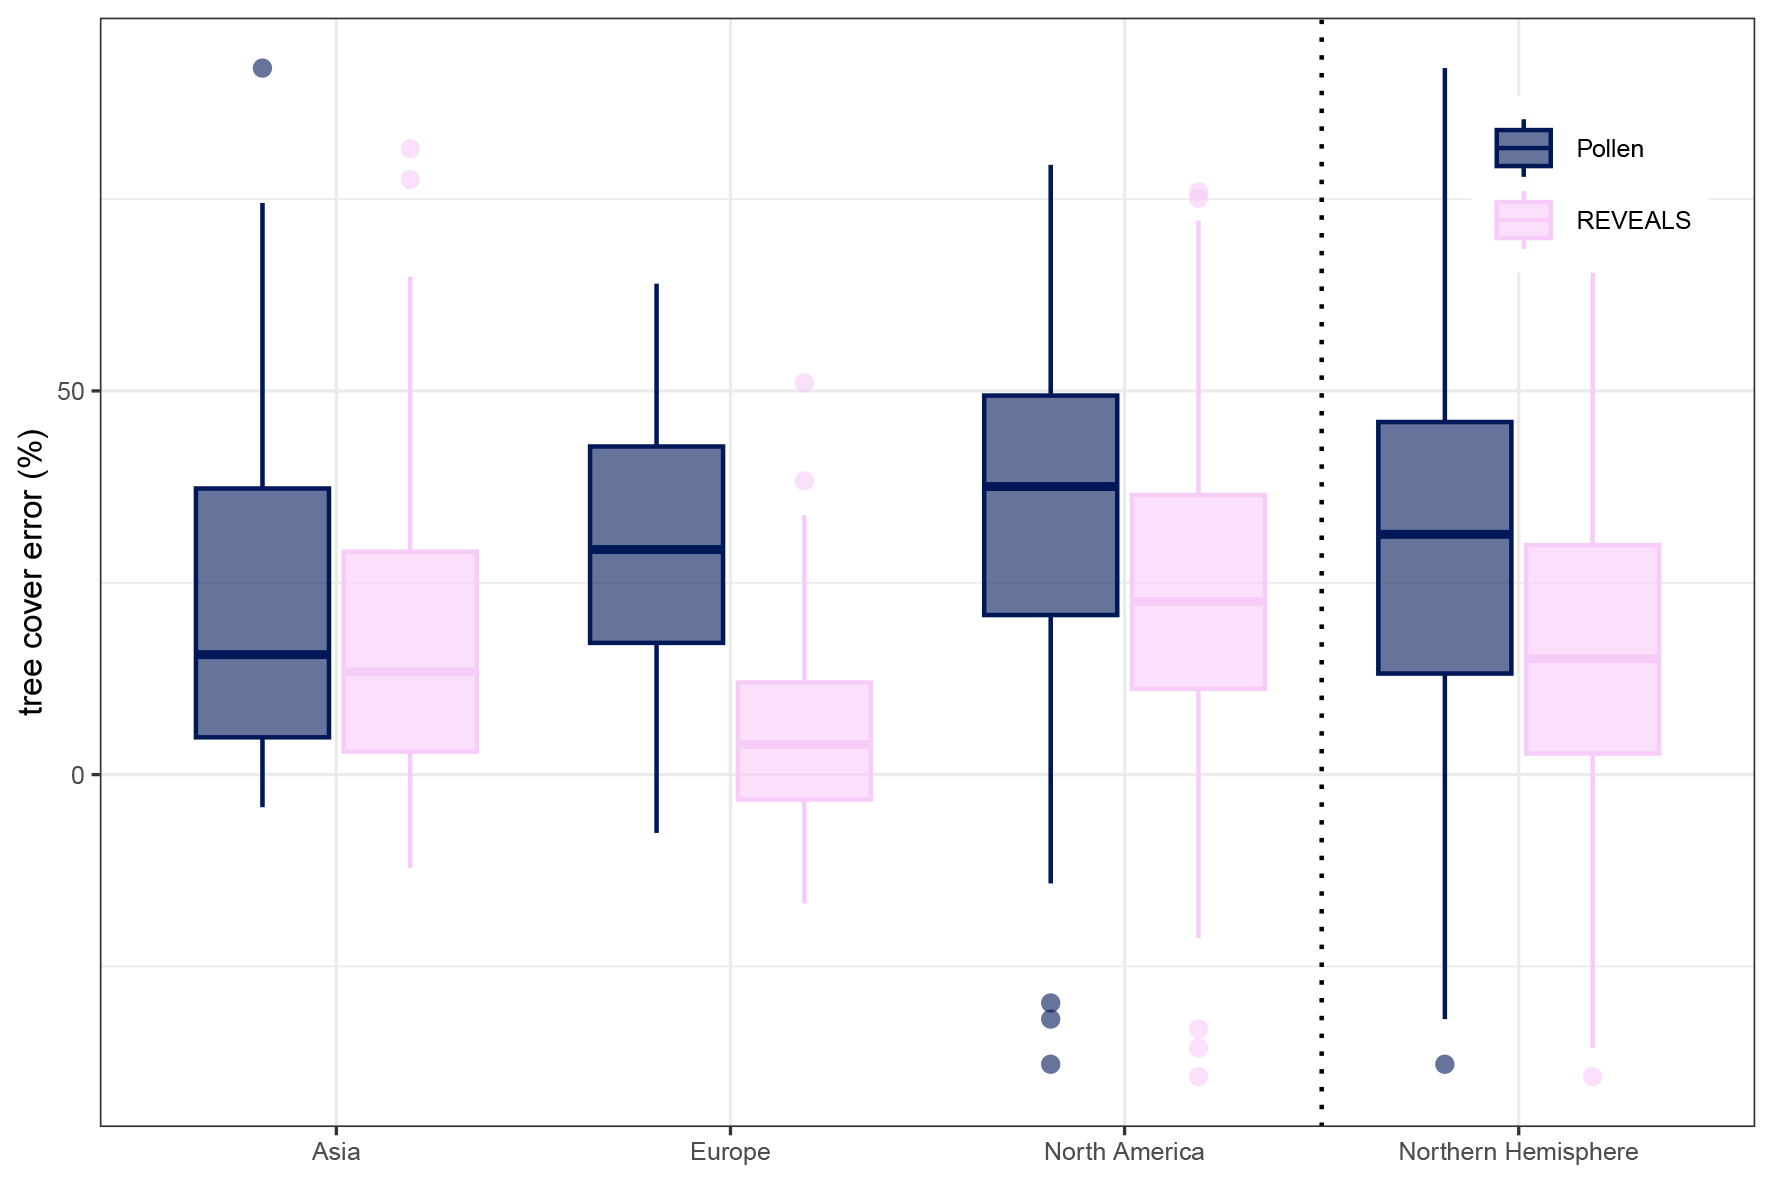
Figure 8Tree pollen percentage and tree cover reconstruction error per continent for a gridded 2° × 2° reconstruction. Mean errors decreased with the REVEALS reconstruction for all continents but are still generally > 0 (overestimation of tree cover). The lowest errors are present in Europe.
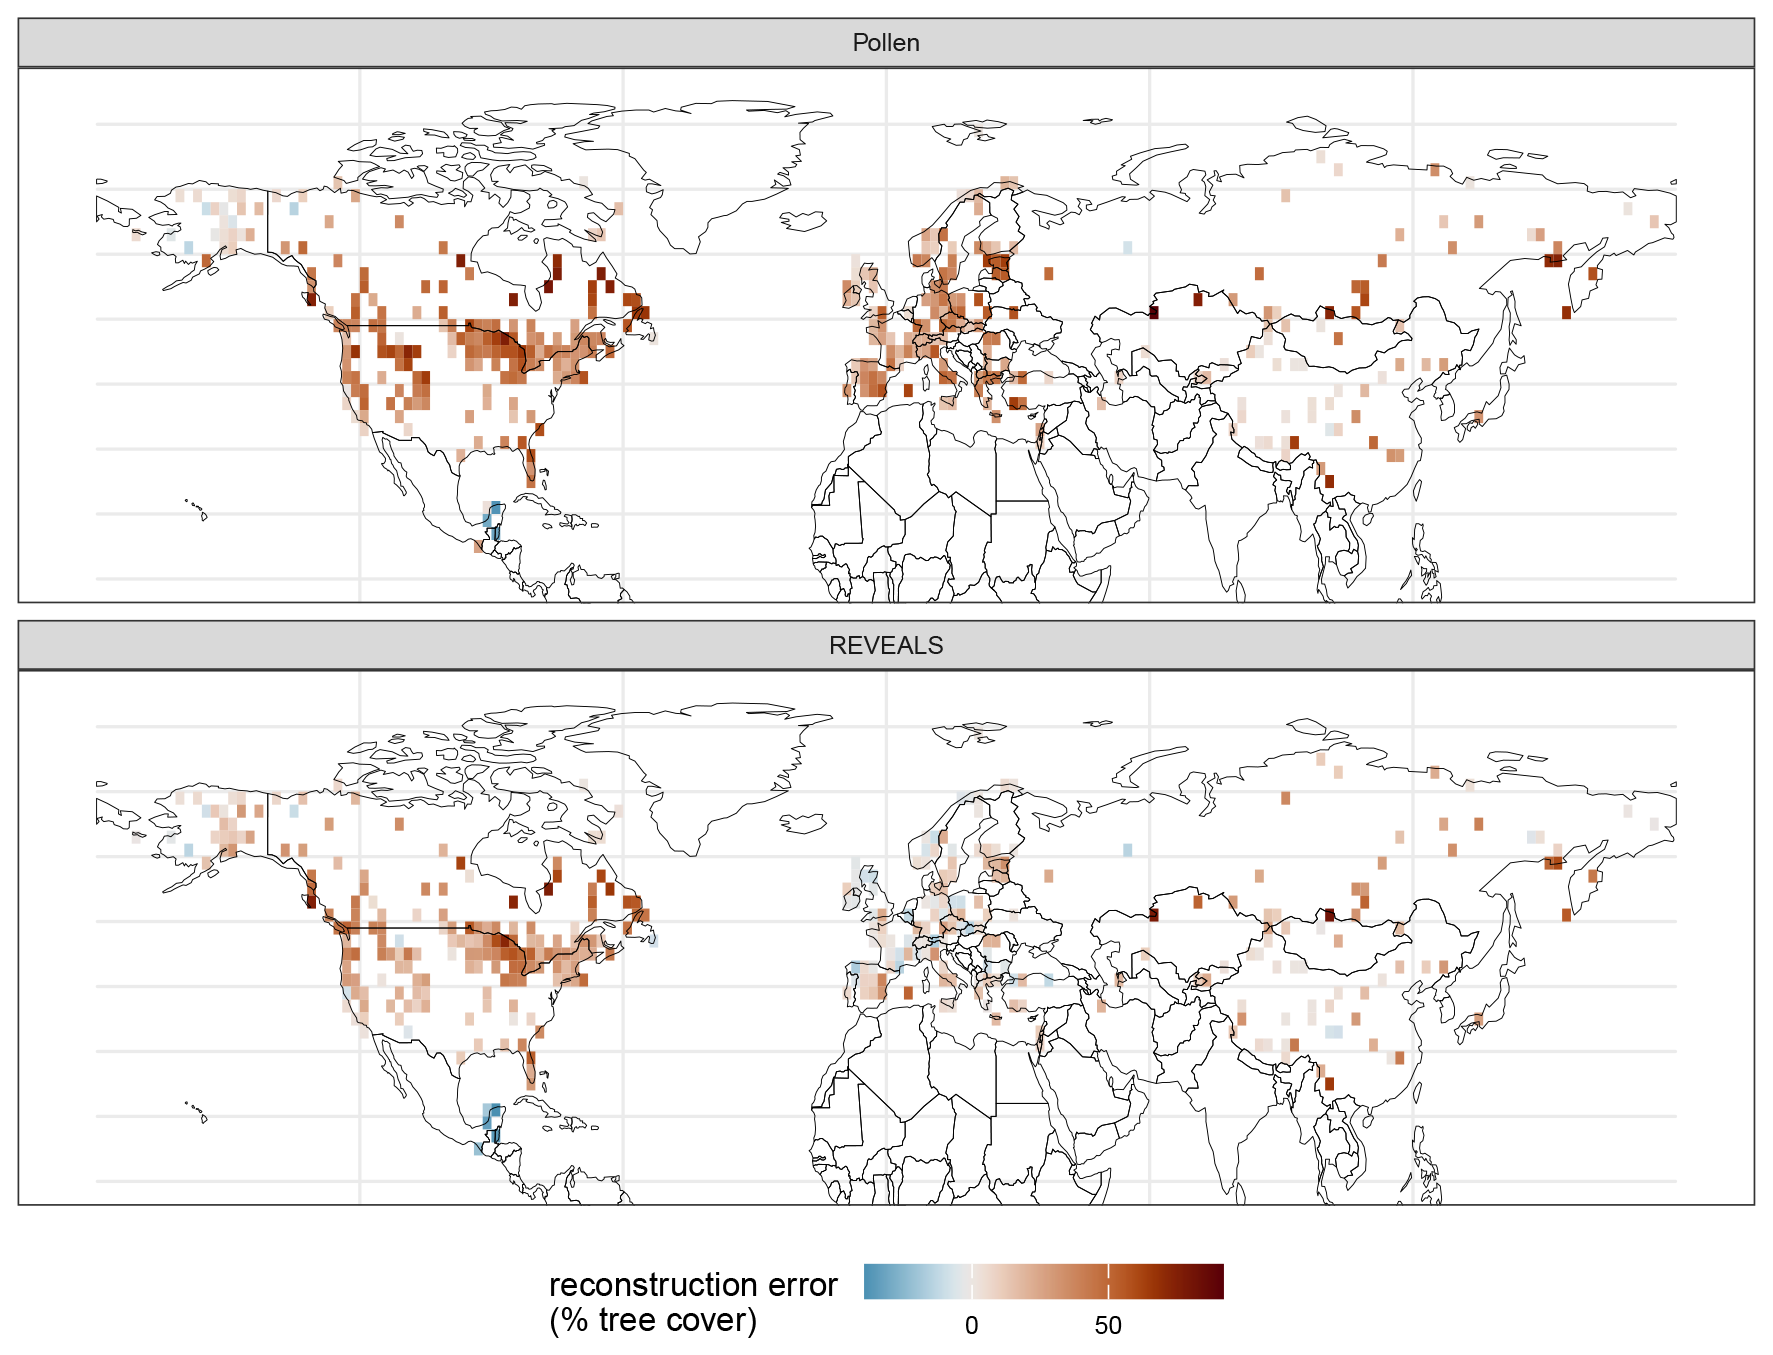
Figure 9Map of the reconstruction error (in % tree cover) for tree cover from pollen counts and REVEALS estimates. Remaining errors with the overall better REVEALS reconstructions are especially high in North America (northern West Coast and Labrador Peninsula).
Average continental mean absolute errors (MAE) in tree cover from original pollen data range from 24.7 % (Asia) to 35.87 % tree cover (North America; see Fig. 7b). All continental MAE values are lower for the REVEALS reconstruction and range from 9.67 % (Europe) to 26.43 % (North America). The improvement is largest in Europe (67 % relative to the initial MAE of the pollen-based tree percentage; see Figs. 7 and 8) and smallest in Asia (22 %). REVEALS-reconstructed tree cover also increases correlation coefficients with the exception of Asia. The REVEALS run, therefore, produced reconstructed tree cover that corresponds better to remote-sensing forest cover. Nevertheless, tree cover still tends to be overestimated. Spatial patterns are present for the errors in both tree cover reconstructions (see Fig. 9). In Europe the REVEALS reconstruction manages to reduce errors extensively. In eastern and coastal northwestern North America, the REVEALS reconstruction still tends to overestimate tree cover.
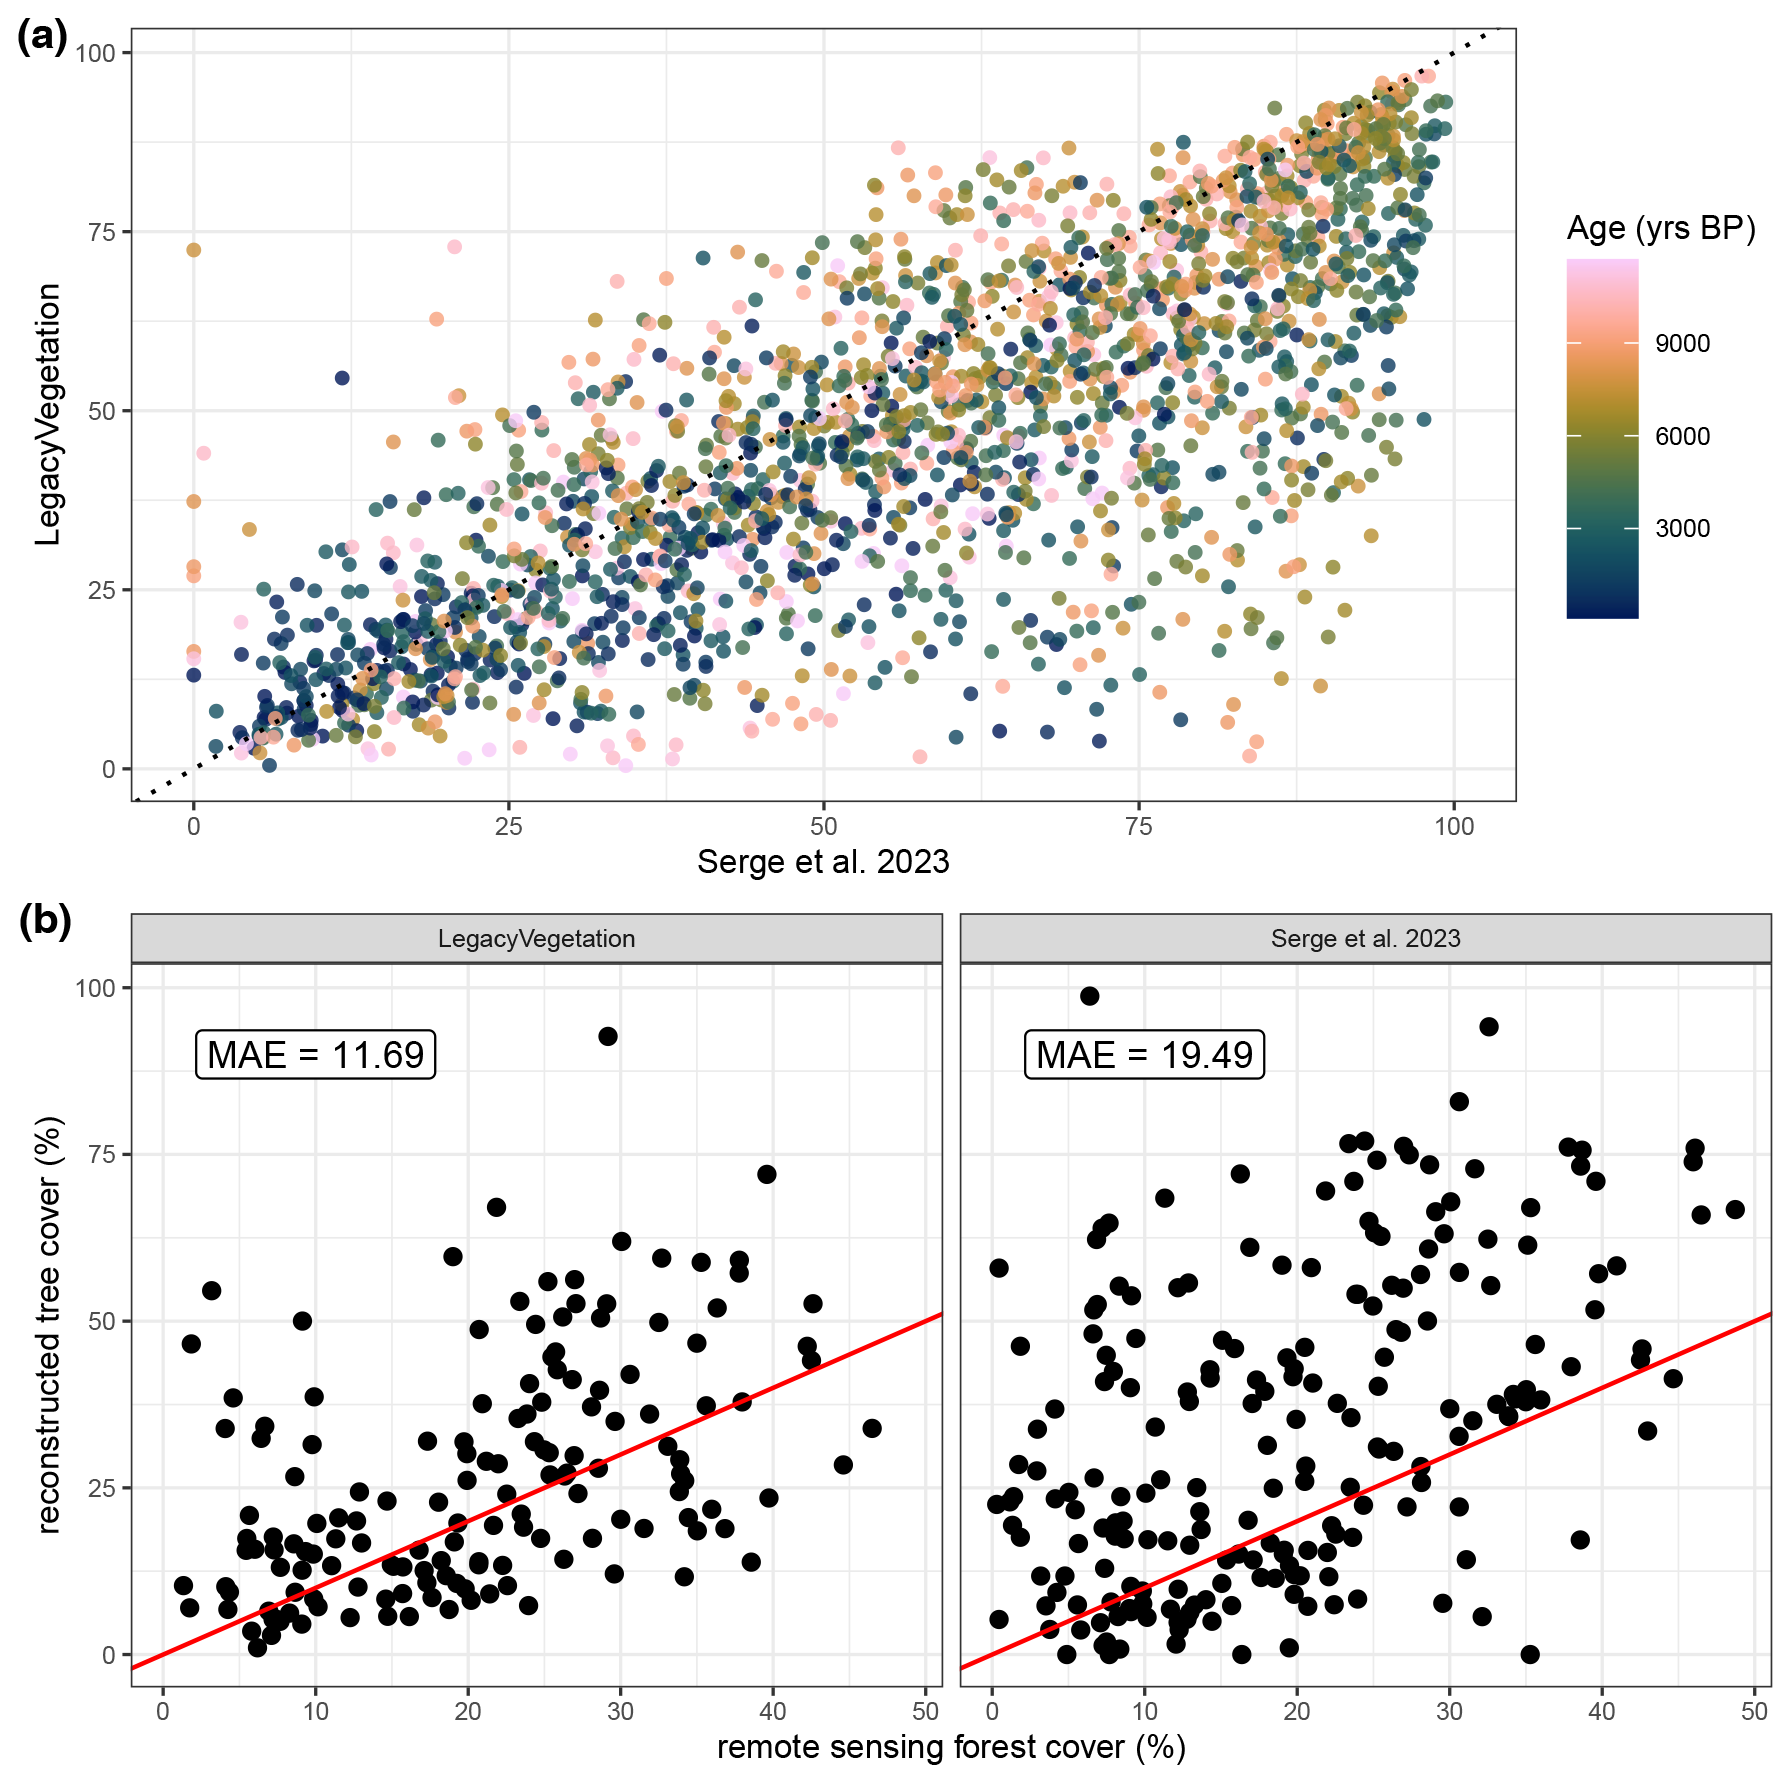
Figure 10(a) Comparison between LegacyVegetation (this publication) and the tree cover from Serge et al. (2023) and (b) validations with modern remote-sensing forest cover for both datasets.
The comparison between our reconstruction and tree cover reconstructed in Serge et al. (2023) shows that LegacyVegetation (this publication) tends to have a lower tree cover independent of sample age (Fig. 10a). Serge et al. (2023) tend to overestimate forest cover even more than LegacyVegetation, leading to a much lower mean absolute error in LegacyVegetation compared to Serge et al. (2023) (Fig. 10b). The MAE for LegacyVegetation is slightly higher than presented in Fig. 7 due to the difference in spatial resolution and the lack of openness correction.
4.1 Continental patterns in reconstruction validity
Our reconstructed quantitative vegetation cover datasets using REVEALS provide reconstructions of taxonomic composition and tree cover in Europe, Asia, and North America and extend to 14 kyr. The reconstructions made use of taxon-specific parameters and were, thus, able to correct some of the compositional biases present in pollen composition. Notably, the error in modern reconstructed tree cover was reduced compared to pollen-based reconstructions on all continents which shows that improvements in tree cover reconstructions from REVEALS applications are considerable.
However, continental differences are evident in the quality of tree cover reconstruction, with Europe showing a significantly larger reduction in errors compared to other regions. North America and Asia exhibit larger reconstruction errors in the REVEALS estimates, although these are still lower than those derived from tree pollen percentages. Notably, regions such as the Great Lakes, the Labrador Peninsula, and the Pacific Northwest display particularly high errors in tree cover reconstruction. Asia, characterized by sparser coverage, presents fewer large errors increasing the overall continental reconstruction error. This highlights the need for improved vegetation reconstruction, especially in North America and Asia. The reason for this reduced performance could lie in a lack of RPP studies, especially in North America, or in a significantly higher regional variability in RPP values compared to Europe. While differences in validation outcomes across varying spatial resolutions are marginal (see Sect. S4), some variability is observed when different grids are employed, highlighting spatial heterogeneity in reconstruction success. Despite these caveats, overall trends in tree cover appear consistent, with acceptable correlation coefficients, although absolute values in certain regions remain challenging to interpret with confidence as tree cover continues to be overestimated in all continents. As a result, arboreal taxa might still be overrepresented in the reconstruction because of inaccurate or missing RPP values. Very few grid cells, predominantly in central Europe, slightly underestimate forest cover.
A specific comparison with the previous European REVEALS reconstruction by Serge et al. (2023) reveals that our reconstruction generally shows lower forest cover across Europe and demonstrates a much lower MAE, indicating improved accuracy. This is notable given that Serge et al. (2023) utilized a larger number of records in their study. One potential explanation for these differences could lie in the variations in the RPP values and the selection of the arboreal taxa used in the reconstruction, as we employ an arboreal tree threshold and include more taxa in our REVEALS reconstruction.
In general, the tree cover trends in our reconstruction results are similar to available large-scale pollen-based vegetation reconstructions. Increases in tree cover in northern and eastern Asia up until the Holocene thermal maximum as seen in our results are consistent with reconstructions by Cao et al. (2019) and Tian et al. (2016). The reconstructed spatial patterns of tree cover in China with low tree cover on the North China Plain and the Tibetan Plateau and a higher tree cover along the east coast and in the south agree with previous reconstructions as well (Li et al., 2023, 2022b, 2024a). Results for European tree cover trends also roughly correspond to previous REVEALS applications and show an increase in tree cover after the Last Glacial Maximum until roughly 6 kyr (Githumbi et al., 2022; Fyfe et al., 2015; Serge et al., 2023; Strandberg et al., 2023). Still, this is the first effort to apply REVEALS across the Northern Hemisphere and reconstruct vegetation with a gridded, large-scale validation using remote-sensing data, and it represents a clear improvement in reconstruction success compared to the most recent European reconstruction.
4.2 Data use and methodological limitations
To ensure proper dataset utilization and obtain reliable analytical results, several key considerations must be followed. The reliability of individual time series data varies based on the size of the lakes from which samples were taken. Only data from large lakes (≥ 50 ha) are considered reliable for site-specific analyses, and these are clearly marked with validity flags in the dataset. When incorporating records from smaller lakes or other sources, rasterization is necessary (https://doi.org/10.5281/zenodo.13902976, Schild, 2024). Although our rasterization method is more flexible than previous efforts, the temporal and spatial aggregation used may reduce its reliability, due to smaller total pollen counts used in REVEALS runs and the use of an arithmetic as opposed to a weighted spatial mean. We do, however, find that reconstructions differences between these methods are marginal (Sect. S6).
The reliability of reconstructions also varies among different taxa due to the quality of RPP values, which is documented in detail in Appendix B, outlining the sources of RPP values (see the “Code and data availability” section). Reconstructions based on taxa with continental RPP values are the most reliable, followed by those based on hemispheric data, with standardized RPP values being the least reliable. This hierarchy should be considered when interpreting results. The use of continental RPP values could also make our reconstruction more reliable at larger spatial scales as opposed to local reconstructions. Additionally, uncertainties in RPP values themselves can affect reconstruction success and could be leading to the persistent overrepresentation of tree taxa despite the application of REVEALS. Tree cover reconstructions tend to have higher certainty compared to taxon-specific reconstructions, as they are based on aggregation across taxa. However, the static latitudinal arboreal threshold for Betulaceae, Betula, and Alnus poses a limitation in our reconstruction. This could be improved by incorporating a dynamic, climate-dependent threshold in future work.
Validating pollen-based tree cover estimates with remote-sensing-derived forest cover also presents a challenge. One key issue is the inherent error associated with remote-sensing forest cover data. While validation using other sensors is possible, only a limited subset of the available data is cross-validated with lidar data, which themselves are characterized by limited spatial coverage (Sexton et al., 2013). A critical limitation of surface reflectance methods, as used in the Landsat-based forest cover, is their reliance on a 2D perspective, primarily capturing the forest canopy. This means that the understory is often not detected, resulting in an incomplete representation of the forest structure. In contrast, pollen-based estimates provide a more comprehensive, stratified view of the vegetation, as they incorporate all contributing taxa, not just the tree canopy. Despite this broader scope, pollen data and REVEALS estimates tend to emphasize trees more than other vegetation types consistently, as is evident in the validations. Few records in central Europe, where forest cover seems to be slightly underestimated, pose an exception to this (see Fig. 9). Furthermore, pollen-based estimates are derived from records that span a much longer timescale than the modern forest cover data available, even though modern time slices are used for validation. Increased anthropogenic impact could exacerbate discrepancies between pollen-based and remote-sensing estimates. This could contribute to the overestimation of forest cover, which persists on all continents. Additionally, these modern and arguably unnatural vegetation conditions may not correspond to past vegetation and may therefore have reduced significance for the reconstruction of past natural landscapes.
Another challenge lies in validating the compositional reconstruction results. It remains uncertain whether RPP values have remained stable over time, and historical compositional data are not only scarce but also likely too recent to test this assumption effectively (Baker et al., 2016). Validating modern compositional reconstructions on large spatial scales is therefore difficult. As global compositional vegetation data are not readily available, remote sensing of tree cover serves as the best option for validation. But even with accurate tree cover reconstructions, uncertainties remain regarding the abundance of individual taxa due to the aggregated nature of the tree cover measure. To address this issue, global syntheses of tree and plant inventories or compositional remote-sensing products could provide more robust validation. Additionally, vegetational composition derived from sedimentary ancient DNA (sedaDNA) offers a promising avenue for comparing past vegetation data. Local quantitative sedaDNA vegetation signals could be averaged across multiple records to compare with pollen-based results (Niemeyer et al., 2017; Capo et al., 2021).
Lastly, the reconstructions are subject to certain limitations inherent to sedimentary pollen data, such as age uncertainty, temporal mixing, and the irregular spatial and temporal resolution of records. Age uncertainty has been addressed as effectively as possible through consistent age modeling of the pollen dataset (Li et al., 2022a). However, replicating sediment and peat cores could generally provide more accurate estimates of record variability. Moreover, sampling more large lakes and ensuring precise dating would improve spatial coverage. Further, additional RPP studies are necessary to provide more accurate RPP estimates, including the development of regional RPP datasets to enhance reconstruction accuracy. This is especially the case in North America.
4.3 Outlook
The REVEALS tree cover reconstructions presented here offer insight into past vegetation changes and are a valuable alternative to already existing regional reconstructions, which follow different temporal and spatial aggregation methods. The Northern Hemisphere dataset provides an opportunity to explore past vegetation dynamics, gaining a deeper understanding of responses, trajectories, and potential feedback mechanisms. This is especially the case in Europe, whereas trend-based analyses should be the focus in North America and Asia. Given the increasing discussions surrounding the possibility of tipping events in vegetation cover (Armstrong McKay et al., 2022; Lenton and Williams, 2013), this could be of considerable use. While a reconstruction of exact tree lines is not trivial with pollen data, the application of REVEALS and subsequent biomization improve treeline reconstructions, as shown by Binney et al. (2011). Additionally, this dataset can help address unanswered questions about Holocene vegetation dynamics, including the deglacial forest conundrum (Dallmeyer et al., 2022; Strandberg et al., 2022). It could also serve as a valuable tool for validating Earth system models that require extensive time series and vegetation data for accurate predictions (Dallmeyer et al., 2023). Comparing modeled vegetation to reconstructed vegetation could help uncover missing dynamics in coupled climate–vegetation models, and new insights gained from these applications could enhance our ability to predict future changes.
The produced datasets are freely available from PANGAEA (https://doi.org/10.1594/PANGAEA.974798, Herzschuh et al., 2025). Input data from LegacyPollen 2.0 are also available on PANGAEA (https://doi.org/10.1594/PANGAEA.965907, Li et al., 2024b). The code used to produce the datasets and adjustable rasterization code are freely available from Zenodo (https://doi.org/10.5281/zenodo.10191859, Schild and Ewald, 2023, https://doi.org/10.5281/zenodo.13902976, Schild, 2024).
We present datasets of reconstructed past plant cover and tree cover in the Northern Hemisphere from a sedimentary pollen dataset using the REVEALS model. We used synthesized RPP values for reconstruction and made use of hemispheric or standardized values, when continental ones were not available. This approach allowed us to address some of the inherent biases in pollen composition. Considerable improvement in the reconstruction of tree cover compared to pollen percentages is achieved for all continents, and reconstruction errors in Europe are lower compared to previous reconstructions. However, the strong overestimation of tree cover persisted in North America and Asia, highlighting the need for improved regional RPP syntheses.
Extensive data on past vegetation are invaluable for the validation of coupled climate–vegetation models and the testing of hypotheses on feedback effects and vegetation dynamics. This knowledge is essential for modeling and predicting vegetation trajectories under anthropogenic climate change.
The supplement related to this article is available online at https://doi.org/10.5194/essd-17-2007-2025-supplement.
UH conceptualized the dataset production. CL curated the pollen dataset and revised the age models under the supervision of UH. CL, PE, and LS collected metadata for the pollen records under the supervision of UH. PE set up, improved, and tested code to run the REVEALS model and ran the initial REVEALS reconstructions under the supervision of UH. LS, TL, RH, and UH developed the optimization methodology. LS wrote optimization code; curated remote-sensing data; and executed the optimization, final reconstructions, and validations. TL, RH, and UH supervised LS. LS prepared the original manuscript draft under the supervision of UH. All authors reviewed and edited the manuscript.
The contact author has declared that none of the authors has any competing interests.
Publisher's note: Copernicus Publications remains neutral with regard to jurisdictional claims made in the text, published maps, institutional affiliations, or any other geographical representation in this paper. While Copernicus Publications makes every effort to include appropriate place names, the final responsibility lies with the authors.
The authors wish to thank Thomas Böhmer for support with dataset curation and harmonization. The project was supported by the Bundesministerium für Bildung, Wissenschaft, Forschung und Technologie through the German Climate Modeling Initiative PALMOD (grant no. 01LP1510C to Ulrike Herzschuh); the European Union (ERC, GlacialLegacy grant no. 772852 to Ulrike Herzschuh); and the China Scholarship Council (grant no. 201908130165 to Chenzhi Li). Data were partly obtained from the Neotoma Paleoecology Database (http://www.neotomadb.org, last access: 31 March 2025) and its constituent databases (the European Pollen Database and the North American Pollen Database). The work of data contributors, data stewards, and the Neotoma community is gratefully acknowledged.
This research has been supported by the Bundesministerium für Bildung, Wissenschaft, Forschung und Technologie (grant no. 01LP1510C); the European Research Council, H2020 program (grant no. 772852); and the China Scholarship Council (grant no. 201908130165).
The article processing charges for this open-access publication were covered by the Alfred-Wegener-Institut Helmholtz-Zentrum für Polar- und Meeresforschung.
This paper was edited by Kirsten Elger and reviewed by Thomas Giesecke, Marie-Jose Gaillard, and two anonymous referees.
Abraham, V. and Kozáková, R.: Relative pollen productivity estimates in the modern agricultural landscape of Central Bohemia (Czech Republic), Rev. Palaeobot. Palyno., 179, 1–12, https://doi.org/10.1016/j.revpalbo.2012.04.004, 2012. a, b, c, d, e, f, g, h, i, j, k, l, m
Anderson, N. J., Bugmann, H., Dearing, J. A., and Gaillard, M.-J.: Linking palaeoenvironmental data and models to understand the past and to predict the future, Trends Ecol. Evol., 21, 696–704, https://doi.org/10.1016/j.tree.2006.09.005, 2006. a
Armstrong McKay, D. I., Staal, A., Abrams, J. F., Winkelmann, R., Sakschewski, B., Loriani, S., Fetzer, I., Cornell, S. E., Rockström, J., and Lenton, T. M.: Exceeding 1.5 °C global warming could trigger multiple climate tipping points, Science, 377, eabn7950, https://doi.org/10.1126/science.abn7950, 2022. a, b
Baker, A. G., Zimny, M., Keczyński, A., Bhagwat, S. A., Willis, K. J., and Latałowa, M.: Pollen productivity estimates from old-growth forest strongly differ from those obtained in cultural landscapes: Evidence from the Białowieża National Park, Poland, Holocene, 26, 80–92, https://doi.org/10.1177/0959683615596822, 2016. a, b, c, d, e, f, g, h, i
Bartlein, P. J., Harrison, S. P., Brewer, S., Connor, S., Davis, B. A. S., Gajewski, K., Guiot, J., Harrison-Prentice, T. I., Henderson, A., Peyron, O., Prentice, I. C., Scholze, M., Seppä, H., Shuman, B., Sugita, S., Thompson, R. S., Viau, A. E., Williams, J., and Wu, H.: Pollen-based continental climate reconstructions at 6 and 21 ka: a global synthesis, Clim. Dynam., 37, 775–802, https://doi.org/10.1007/s00382-010-0904-1, 2011. a
Binney, H. A., Gething, P. W., Nield, J. M., Sugita, S., and Edwards, M. E.: Tree line identification from pollen data: beyond the limit?, J. Biogeogr., 38, 1792–1806, https://doi.org/10.1111/j.1365-2699.2011.02507.x, 2011. a
Broström, A., Sugita, S., and Gaillard, M.-J.: Pollen Productivity Estimates for the Reconstruction of Past Vegetation Cover in the Cultural Landscape of Southern Sweden, Holocene, 14, 368–381, https://doi.org/10.1191/0959683604hl713rp, 2004. a, b, c, d, e, f, g, h, i, j, k, l
Broström, A., Nielsen, A. B., Gaillard, M.-J., Hjelle, K., Mazier, F., Binney, H., Bunting, J., Fyfe, R., Meltsov, V., Poska, A., Räsänen, S., Soepboer, W., von Stedingk, H., Suutari, H., and Sugita, S.: Pollen productivity estimates of key European plant taxa for quantitative reconstruction of past vegetation: a review, Veg. Hist. Archaeobot., 17, 461–478, https://doi.org/10.1007/s00334-008-0148-8, 2008. a
Bunting, M. J., Armitage, R., Binney, H. A., and Waller, M.: Estimates of “Relative Pollen Productivity” and “Relevant Source Area of Pollen” for Major Tree Taxa in Two Norfolk (UK) Woodlands, Holocene, 15, 459–465, https://doi.org/10.1191/0959683605hl821rr, 2005. a, b, c, d, e, f
Bunting, M. J., Schofield, J. E., and Edwards, K. J.: Estimates of relative pollen productivity (RPP) for selected taxa from southern Greenland: A pragmatic solution, Rev. Palaeobot. Palyno., 190, 66–74, https://doi.org/10.1016/j.revpalbo.2012.11.003, 2013. a, b, c, d, e, f, g, h, i, j, k, l, m, n, o, p, q
Cao, X., Tian, F., Li, F., Gaillard, M.-J., Rudaya, N., Xu, Q., and Herzschuh, U.: Pollen-based quantitative land-cover reconstruction for northern Asia covering the last 40 ka cal BP, Clim. Past, 15, 1503–1536, https://doi.org/10.5194/cp-15-1503-2019, 2019. a, b
Cao, X., Tian, F., Andreev, A., Anderson, P. M., Lozhkin, A. V., Bezrukova, E., Ni, J., Rudaya, N., Stobbe, A., Wieczorek, M., and Herzschuh, U.: A taxonomically harmonized and temporally standardized fossil pollen dataset from Siberia covering the last 40 kyr, Earth Syst. Sci. Data, 12, 119–135, https://doi.org/10.5194/essd-12-119-2020, 2020. a
Cao, X.-Y., Herzschuh, U., Telford, R. J., and Ni, J.: A modern pollen–climate dataset from China and Mongolia: Assessing its potential for climate reconstruction, Rev. Palaeobot. Palyno., 211, 87–96, https://doi.org/10.1016/j.revpalbo.2014.08.007, 2014. a
Capo, E., Giguet-Covex, C., Rouillard, A., Nota, K., Heintzman, P. D., Vuillemin, A., Ariztegui, D., Arnaud, F., Belle, S., Bertilsson, S., Bigler, C., Bindler, R., Brown, A. G., Clarke, C. L., Crump, S. E., Debroas, D., Englund, G., Ficetola, G. F., Garner, R. E., Gauthier, J., Gregory-Eaves, I., Heinecke, L., Herzschuh, U., Ibrahim, A., Kisand, V., Kjær, K. H., Lammers, Y., Littlefair, J., Messager, E., Monchamp, M.-E., Olajos, F., Orsi, W., Pedersen, M. W., Rijal, D. P., Rydberg, J., Spanbauer, T., Stoof-Leichsenring, K. R., Taberlet, P., Talas, L., Thomas, C., Walsh, D. A., Wang, Y., Willerslev, E., van Woerkom, A., Zimmermann, H. H., Coolen, M. J. L., Epp, L. S., Domaizon, I., G. Alsos, I., and Parducci, L.: Lake Sedimentary DNA Research on Past Terrestrial and Aquatic Biodiversity: Overview and Recommendations, Quaternary, 4, 6, https://doi.org/10.3390/quat4010006, 2021. a
Commerford, J. L., McLauchlan, K. K., and Sugita, S.: Calibrating Vegetation Cover and Grassland Pollen Assemblages in the Flint Hills of Kansas, USA, Am. J. Plant Sci., 4, 1–10, https://doi.org/10.4236/ajps.2013.47A1001, 2013. a, b, c, d, e, f, g, h, i, j
Dallmeyer, A., Kleinen, T., Claussen, M., Weitzel, N., Cao, X., and Herzschuh, U.: The deglacial forest conundrum, Nat. Commun., 13, 6035, https://doi.org/10.1038/s41467-022-33646-6, 2022. a
Dallmeyer, A., Poska, A., Marquer, L., Seim, A., and Gaillard, M.-J.: The challenge of comparing pollen-based quantitative vegetation reconstructions with outputs from vegetation models – a European perspective, Clim. Past, 19, 1531–1557, https://doi.org/10.5194/cp-19-1531-2023, 2023. a, b
Davis, B. A. S., Collins, P. M., and Kaplan, J. O.: The age and post-glacial development of the modern European vegetation: a plant functional approach based on pollen data, Veg. Hist. Archaeobot., 24, 303–317, https://doi.org/10.1007/s00334-014-0476-9, 2015. a
Davis, M. B.: On the theory of pollen analysis, Am. J. Sci., 261, 897–912, https://doi.org/10.2475/ajs.261.10.897, 1963. a, b
Dawson, A., Williams, J. W., Gaillard, M.-J., Goring, S. J., Pirzamanbein, B., Lindstrom, J., Anderson, R. S., Brunelle, A., Foster, D., Gajewski, K., Gavin, D. G., Lacourse, T., Minckley, T. A., Oswald, W., Shuman, B., and Whitlock, C.: Holocene land cover change in North America: continental trends, regional drivers, and implications for vegetation-atmosphere feedbacks, Clim. Past Discuss. [preprint], https://doi.org/10.5194/cp-2024-6, in review, 2024. a, b, c, d, e
Dearing, J., Braimoh, A., Reenberg, A., Turner, B., and van der Leeuw, S.: Complex Land Systems: the Need for Long Time Perspectives to Assess their Future, Ecol. Soc., 15, https://doi.org/10.5751/ES-03645-150421, 2010. a
Dearing, J. A., Bullock, S., Costanza, R., Dawson, T. P., Edwards, M. E., Poppy, G. M., and Smith, G. M.: Navigating the Perfect Storm: Research Strategies for Socialecological Systems in a Rapidly Evolving World, Environ. Manage., 49, 767–775, https://doi.org/10.1007/s00267-012-9833-6, 2012. a
ESA: Land Cover CCI Product User Guide Version 2, ESA [data set], https://maps.elie.ucl.ac.be/CCI/viewer/download/ESACCI-LC-Ph2-PUGv2_2.0.pdf (last access: 31 March 2025), 2017. a
Fagerlind, F.: The real signification of pollen diagrams, Bot. Notiser, p. 40, 1952. a
Fyfe, R. M., de Beaulieu, J.-L., Binney, H., Bradshaw, R. H. W., Brewer, S., Le Flao, A., Finsinger, W., Gaillard, M.-J., Giesecke, T., Gil-Romera, G., Grimm, E. C., Huntley, B., Kunes, P., Kühl, N., Leydet, M., Lotter, A. F., Tarasov, P. E., and Tonkov, S.: The European Pollen Database: past efforts and current activities, Veg. Hist. Archaeobot., 18, 417–424, https://doi.org/10.1007/s00334-009-0215-9, 2009. a, b
Fyfe, R. M., Woodbridge, J., and Roberts, N.: From forest to farmland: pollen-inferred land cover change across Europe using the pseudobiomization approach, Glob. Change Biol., 21, 1197–1212, https://doi.org/10.1111/gcb.12776, 2015. a, b, c
Gaillard, M.-J., Sugita, S., Mazier, F., Trondman, A.-K., Broström, A., Hickler, T., Kaplan, J. O., Kjellström, E., Kokfelt, U., Kuneš, P., Lemmen, C., Miller, P., Olofsson, J., Poska, A., Rundgren, M., Smith, B., Strandberg, G., Fyfe, R., Nielsen, A. B., Alenius, T., Balakauskas, L., Barnekow, L., Birks, H. J. B., Bjune, A., Björkman, L., Giesecke, T., Hjelle, K., Kalnina, L., Kangur, M., van der Knaap, W. O., Koff, T., Lagerås, P., Latałowa, M., Leydet, M., Lechterbeck, J., Lindbladh, M., Odgaard, B., Peglar, S., Segerström, U., von Stedingk, H., and Seppä, H.: Holocene land-cover reconstructions for studies on land cover-climate feedbacks, Clim. Past, 6, 483–499, https://doi.org/10.5194/cp-6-483-2010, 2010. a
Ge, Y., Li, Y., Li, Y., Yang, X., Zhang, R., and Xu, Q.: Relevant source area of pollen and relative pollen productivity estimates in Bashang steppe, Quaternary Sci., 35, 934–945, http://www.dsjyj.com.cn/en/article/doi/10.11928/j.issn.1001-7410.2015.04.15 (last access: 31 March 2025), 2015. a, b, c, d, e, f, g, h, i, j
Ge, Y., Li, Y., Bunting, M. J., Li, B., Li, Z., and Wang, J.: Relation between modern pollen rain, vegetation and climate in northern China: Implications for quantitative vegetation reconstruction in a steppe environment, Sci. Total Environ., 586, 25–41, https://doi.org/10.1016/j.scitotenv.2017.02.027, 2017. a, b, c, d, e, f
Geng, R., Andreev, A., Kruse, S., Heim, B., van Geffen, F., Pestryakova, L., Zakharov, E., Troeva, E., Shevtsova, I., Li, F., Zhao, Y., and Herzschuh, U.: Modern Pollen Assemblages From Lake Sediments and Soil in East Siberia and Relative Pollen Productivity Estimates for Major Taxa, Frontiers in Ecology and Evolution, 10, 837857, https://doi.org/10.3389/fevo.2022.837857, 2022. a, b, c, d, e, f, g, h, i, j, k, l, m, n, o, p
Giesecke, T., Ammann, B., and Brande, A.: Palynological richness and evenness: insights from the taxa accumulation curve, Veg. Hist. Archaeobot., 23, 217–228, https://doi.org/10.1007/s00334-014-0435-5, 2014. a
Githumbi, E., Fyfe, R., Gaillard, M.-J., Trondman, A.-K., Mazier, F., Nielsen, A.-B., Poska, A., Sugita, S., Woodbridge, J., Azuara, J., Feurdean, A., Grindean, R., Lebreton, V., Marquer, L., Nebout-Combourieu, N., Stančikaitė, M., Tanţău, I., Tonkov, S., Shumilovskikh, L., and LandClimII data contributors: European pollen-based REVEALS land-cover reconstructions for the Holocene: methodology, mapping and potentials, Earth Syst. Sci. Data, 14, 1581–1619, https://doi.org/10.5194/essd-14-1581-2022, 2022. a, b, c, d, e, f, g, h, i
Grindean, R., Nielsen, A. B., Tanţău, I., and Feurdean, A.: Relative pollen productivity estimates in the forest steppe landscape of southeastern Romania, Rev. Palaeobot. Palyno., 264, 54–63, https://doi.org/10.1016/j.revpalbo.2019.02.007, 2019. a, b, c, d, e, f, g, h, i, j, k, l
Harris, I., Osborn, T. J., Jones, P., and Lister, D.: Version 4 of the CRU TS monthly high-resolution gridded multivariate climate dataset, Scientific Data, 7, 109, https://doi.org/10.1038/s41597-020-0453-3, 2020. a
Hellman, S., Gaillard, M.-J., Broström, A., and Sugita, S.: The REVEALS model, a new tool to estimate past regional plant abundance from pollen data in large lakes: validation in southern Sweden, Journal of Quaternary Science, 23, 21–42, https://doi.org/10.1002/jqs.1126, 2008a. a, b
Hellman, S. E. V., Gaillard, M.-j., Broström, A., and Sugita, S.: Effects of the sampling design and selection of parameter values on pollen-based quantitative reconstructions of regional vegetation: a case study in southern Sweden using the REVEALS model, Veg. Hist. Archaeobot., 17, 445–459, https://doi.org/10.1007/s00334-008-0149-7, 2008b. a
Herzschuh, U., Li, C., Bömer, T., Postl, A. K., Heim, B., Andreev, A. A., Cao, X., Wieczorek, M., and Ni, J.: LegacyPollen 1.0: a taxonomically harmonized global late Quaternary pollen dataset of 2831 records with standardized chronologies, Earth Syst. Sci. Data, 14, 3213–3227, https://doi.org/10.5194/essd-14-3213-2022, 2022. a
Herzschuh, U., Böhmer, T., Li, C., and Cao, X.: Northern Hemisphere temperature and precipitation reconstruction from taxonomically harmonized pollen data set with revised chronologies using WA-PLS and MAT (LegacyClimate 1.0), PANGAEA, https://doi.org/10.1594/PANGAEA.930512, 2023a. a
Herzschuh, U., Böhmer, T., Li, C., Chevalier, M., Hébert, R., Dallmeyer, A., Cao, X., Bigelow, N. H., Nazarova, L., Novenko, E. Y., Park, J., Peyron, O., Rudaya, N. A., Schlütz, F., Shumilovskikh, L. S., Tarasov, P. E., Wang, Y., Wen, R., Xu, Q., and Zheng, Z.: LegacyClimate 1.0: a dataset of pollen-based climate reconstructions from 2594 Northern Hemisphere sites covering the last 30 kyr and beyond, Earth Syst. Sci. Data, 15, 2235–2258, https://doi.org/10.5194/essd-15-2235-2023, 2023b. a
Herzschuh, U., Ewald, P., Schild, L., Li, C., and Böhmer, T.: LegacyVegetation: Northern Hemisphere reconstruction of past plant cover and total tree cover from pollen archives of the last 14 ka, PANGAEA [data set], https://doi.org/10.1594/PANGAEA.974798, 2025. a, b
Hjelle, K. L.: Herb Pollen Representation in Surface Moss Samples from Mown Meadows and Pastures in Western Norway, Vegetation History and Archaeobotany, 7, 79–96, https://doi.org/10.1007/BF01373926, 1998. a, b, c, d, e, f, g, h, i, j, k, l, m, n, o, p, q, r, s, t, u
Hjelle, K. L., Mehl, I. K., Sugita, S., and Andersen, G. L.: From pollen percentage to vegetation cover: evaluation of the Landscape Reconstruction Algorithm in western Norway, Journal of Quaternary Science, 30, 312–324, https://doi.org/10.1002/jqs.2769, 2015. a
Hopla, E.-J.: A New Perspective on Quaternary Land Cover in Central Alaska, PhD, University of Southampton, https://eprints.soton.ac.uk/422162/ (last access: 31 March 2025), 2017. a, b, c, d, e, f, g, h, i, j, k
Huang, R., Xu, Q., Tian, F., Li, J., Wang, Y., and Hao, J.: Re-estimated relative pollen productivity of typical steppe and meadow steppe in Inner Mongolia, Quaternary Sci., 41, 1727–1737, https://doi.org/10.11928/j.issn.1001-7410.2021.06.18, 2021. a, b, c, d, e, f, g, h, i, j, k, l, m, n
IPCC: Climate Change 2023: Synthesis Report. Contribution of Working Groups I, II and III to the Sixth Assessment Report of the Intergovernmental Panel on Climate Change, Tech. rep., Core Writing Team, edited by: Lee, H. and Romero, J., Intergovernmental Panel on Climate Change (IPCC), Geneva, Switzerland, https://www.ipcc.ch/report/ar6/syr/ (last access: 31 March 2025), 2023. a
Jiang, F., Xu, Q., Zhang, S., Li, F., Zhang, K., Wang, M., Shen, W., Sun, Y., and Zhou, Z.: Relative pollen productivities of the major plant taxa of subtropical evergreen–deciduous mixed woodland in China, Journal of Quaternary Science, 35, 526–538, https://doi.org/10.1002/jqs.3197, 2020. a, b, c, d, e, f, g, h, i, j, k, l, m, n, o, p, q
Kuneš, P., Abraham, V., Werchan, B., Plesková, Z., Fajmon, K., Jamrichová, E., and Roleček, J.: Relative Pollen Productivity Estimates for Vegetation Reconstruction in Central-Eastern Europe Inferred at Local and Regional Scales, Holocene, 29, 1708–1719, https://doi.org/10.1177/0959683619862026, 2019. a, b, c, d, e, f, g, h, i, j, k, l, m, n, o, p
Lenton, T. M. and Williams, H. T. P.: On the origin of planetary-scale tipping points, Trends Ecol. Evol., 28, 380–382, https://doi.org/10.1016/j.tree.2013.06.001, 2013. a
Li, B., Zhang, W., Fyfe, R., Fan, B., Wang, S., Xu, Q., Zhang, N., Ding, G., Yang, J., and Li, Y.: High-resolution quantitative vegetation reconstruction in the North China Plain during the early-to-middle Holocene using the REVEALS model, CATENA, 234, 107577, https://doi.org/10.1016/j.catena.2023.107577, 2024a. a, b
Li, C., Postl, A. K., Böhmer, T., Cao, X., Dolman, A. M., and Herzschuh, U.: Harmonized chronologies of a global late Quaternary pollen dataset (LegacyAge 1.0), Earth Syst. Sci. Data, 14, 1331–1343, https://doi.org/10.5194/essd-14-1331-2022, 2022a. a, b
Li, C., Böhmer, T., Cao, X., Zhou, B., Liao, M., Li, K., and Herzschuh, U.: LegacyPollen2.0: an updated global taxonomically and temporally standardized fossil pollen dataset of 3728 palynological records, PANGAEA [data set], https://doi.org/10.1594/PANGAEA.965907, 2024b. a, b, c, d
Li, C., Dallmeyer, A., Ni, J., Chevalier, M., Willeit, M., Andreev, A. A., Cao, X., Schild, L., Heim, B., and Herzschuh, U.: Global biome changes over the last 21,000 years inferred from model-data comparisons, EGUsphere [preprint], https://doi.org/10.5194/egusphere-2024-1862, 2024c. a
Li, F., Gaillard, M.-J., Sugita, S., Mazier, F., Xu, Q., Zhou, Z., Zhang, Y., Li, Y., and Laffly, D.: Relative pollen productivity estimates for major plant taxa of cultural landscapes in central eastern China, Veg. Hist. Archaeobot., 26, 587–605, https://doi.org/10.1007/s00334-017-0636-9, 2017. a, b, c, d, e, f, g, h, i, j, k, l, m, n, o, p, q, r, s, t, u, v, w, x, y, z, aa, ab, ac
Li, F., Gaillard, M.-J., Xu, Q., Bunting, M. J., Li, Y., Li, J., Mu, H., Lu, J., Zhang, P., Zhang, S., Cui, Q., Zhang, Y., and Shen, W.: A Review of Relative Pollen Productivity Estimates From Temperate China for Pollen-Based Quantitative Reconstruction of Past Plant Cover, Front. Plant Sci., 9, 1214, https://doi.org/10.3389/fpls.2018.01214, 2018. a, b, c, d, e, f, g, h
Li, F., Gaillard, M.-J., Cao, X., Herzschuh, U., Sugita, S., Ni, J., Zhao, Y., An, C., Huang, X., Li, Y., Liu, H., Sun, A., and Yao, Y.: Gridded pollen-based Holocene regional plant cover in temperate and northern subtropical China suitable for climate modelling, Earth Syst. Sci. Data, 15, 95–112, https://doi.org/10.5194/essd-15-95-2023, 2023. a, b
Li, M., Zhang, S., Shen, W., Zhang, R., Zhou, Z., and Xu, Q.: Relative pollen productivities of major woody plant taxa in deciduous broadleaved forest in the Ziwuling Mountains of the central Chinese Loess Plateau, Quatern. Int., 641, 97–105, https://doi.org/10.1016/j.quaint.2022.03.010, 2022b. a, b, c, d, e, f, g, h, i, j
Li, Y., Nielsen, A. B., Zhao, X., Shan, L., Wang, S., Wu, J., and Zhou, L.: Pollen production estimates (PPEs) and fall speeds for major tree taxa and relevant source areas of pollen (RSAP) in Changbai Mountain, northeastern China, Rev. Palaeobot. Palyno., 216, 92–100, https://doi.org/10.1016/j.revpalbo.2015.02.003, 2015. a, b, c, d, e, f, g, h
Matthias, I., Nielsen, A. B., and Giesecke, T.: Evaluating the Effect of Flowering Age and Forest Structure on Pollen Productivity Estimates, Veg. Hist. Archaeobot., 21, 471–484, https://doi.org/10.1007/s00334-012-0373-z, 2012. a, b, c, d, e, f, g, h, i, j, k, l, m, n
Mazier, F., Broström, A., Gaillard, M.-J., Sugita, S., Vittoz, P., and Buttler, A.: Pollen Productivity Estimates and Relevant Source Area of Pollen for Selected Plant Taxa in a Pasture Woodland Landscape of the Jura Mountains (Switzerland), Veg. Hist. Archaeobot., 17, 479–495, https://doi.org/10.1007/s00334-008-0143-0, 2008. a, b, c, d, e, f, g, h, i, j, k
Mazier, F., Gaillard, M. J., Kuneš, P., Sugita, S., Trondman, A. K., and Broström, A.: Testing the effect of site selection and parameter setting on REVEALS-model estimates of plant abundance using the Czech Quaternary Palynological Database, Rev. Palaeobot. Palyno., 187, 38–49, https://doi.org/10.1016/j.revpalbo.2012.07.017, 2012. a, b
Mazier, F., Broström, A., Bragée, P., Fredh, D., Stenberg, L., Thiere, G., Sugita, S., and Hammarlund, D.: Two hundred years of land-use change in the South Swedish Uplands: comparison of historical map-based estimates with a pollen-based reconstruction using the landscape reconstruction algorithm, Veg. Hist. Archaeobot., 24, 555–570, https://doi.org/10.1007/s00334-015-0516-0, 2015. a
Mottl, O., Flantua, S. G. A., Bhatta, K. P., Felde, V. A., Giesecke, T., Goring, S., Grimm, E. C., Haberle, S., Hooghiemstra, H., Ivory, S., Kuneš, P., Wolters, S., Seddon, A. W. R., and Williams, J. W.: Global acceleration in rates of vegetation change over the past 18,000 years, Science, 372, 860–864, https://doi.org/10.1126/science.abg1685, 2021. a
Nielsen, A. B.: Modelling Pollen Sedimentation in Danish Lakes at c.Ad 1800: An Attempt to Validate the POLLSCAPE Model, J. Biogeogr., 31, 1693–1709, https://doi.org/10.1111/j.1365-2699.2004.01080.x, 2004. a, b, c, d, e, f, g
Nielsen, A. B., Giesecke, T., Theuerkauf, M., Feeser, I., Behre, K.-E., Beug, H.-J., Chen, S.-H., Christiansen, J., Dörfler, W., Endtmann, E., Jahns, S., de Klerk, P., Kühl, N., Latałowa, M., Odgaard, B. V., Rasmussen, P., Stockholm, J. R., Voigt, R., Wiethold, J., and Wolters, S.: Quantitative reconstructions of changes in regional openness in north-central Europe reveal new insights into old questions, Quaternary Sci. Rev., 47, 131–149, https://doi.org/10.1016/j.quascirev.2012.05.011, 2012. a
Niemeyer, B., Klemm, J., Pestryakova, L. A., and Herzschuh, U.: Relative pollen productivity estimates for common taxa of the northern Siberian Arctic, Rev. Palaeobot. Palyno., 221, 71–82, https://doi.org/10.1016/j.revpalbo.2015.06.008, 2015. a, b, c, d, e, f, g, h, i, j, k
Niemeyer, B., Epp, L. S., Stoof-Leichsenring, K. R., Pestryakova, L. A., and Herzschuh, U.: A comparison of sedimentary DNA and pollen from lake sediments in recording vegetation composition at the Siberian treeline, Mol. Ecol. Resour., 17, e46–e62, https://doi.org/10.1111/1755-0998.12689, 2017. a
Pirzamanbein, B., Lindström, J., Poska, A., Sugita, S., Trondman, A.-K., Fyfe, R., Mazier, F., Nielsen, A. B., Kaplan, J. O., Bjune, A. E., Birks, H. J. B., Giesecke, T., Kangur, M., Latałowa, M., Marquer, L., Smith, B., and Gaillard, M.-J.: Creating spatially continuous maps of past land cover from point estimates: A new statistical approach applied to pollen data, Ecol. Complex., 20, 127–141, https://doi.org/10.1016/j.ecocom.2014.09.005, 2014. a
Prentice, C.: Records of vegetation in time and space: the principles of pollen analysis, in: Vegetation history, Handbook of vegetation science, edited by: Huntley, B. and Webb, T., Springer Netherlands, Dordrecht, https://doi.org/10.1007/978-94-009-3081-0_2, 17–42, 1988. a
Prentice, C., Guiot, J., Huntley, B., Jolly, D., and Cheddadi, R.: Reconstructing biomes from palaeoecological data: a general method and its application to European pollen data at 0 and 6 ka, Clim. Dynam., 12, 185–194, https://doi.org/10.1007/BF00211617, 1996. a
Prentice, I. C.: Pollen representation, source area, and basin size: Toward a unified theory of pollen analysis, Quaternary Res., 23, 76–86, https://doi.org/10.1016/0033-5894(85)90073-0, 1985. a, b
Prentice, I. C. and Webb III, T.: Pollen percentages, tree abundances and the Fagerlind effect, Journal of Quaternary Science, 1, 35–43, https://doi.org/10.1002/jqs.3390010105, 1986. a, b
Räsänen, S., Suutari, H., and Nielsen, A. B.: A step further towards quantitative reconstruction of past vegetation in Fennoscandian boreal forests: Pollen productivity estimates for six dominant taxa, Rev. Palaeobot. Palyno., 146, 208–220, https://doi.org/10.1016/j.revpalbo.2007.04.004, 2007. a, b, c, d, e
Roberts, N., Fyfe, R. M., Woodbridge, J., Gaillard, M.-J., Davis, B. a. S., Kaplan, J. O., Marquer, L., Mazier, F., Nielsen, A. B., Sugita, S., Trondman, A.-K., and Leydet, M.: Europe's lost forests: a pollen-based synthesis for the last 11,000 years, Sci. Rep., 8, 716, https://doi.org/10.1038/s41598-017-18646-7, 2018. a, b
Schild, L.: lauraschild/rasterization: Rasterization V1.1, Zenodo [code], https://doi.org/10.5281/zenodo.13902976, 2024. a, b, c, d, e
Schild, L. and Ewald, P.: [Analysis code] LegacyVegetation 1.0: Global reconstruction of vegetation compositions and forest cover from pollen archives of the last 50 ka, Zenodo [code], https://doi.org/10.5281/zenodo.10191859, 2023. a
Serge, M. A. and Mazier, F.: Spatially extensive and temporally continuous three REVEALS pollen-based vegetation reconstructions in Europe over the Holocene, GEODE [data set], https://doi.org/10.48579/PRO/J5GZUO, 2023. a
Serge, M. A., Mazier, F., Fyfe, R., Gaillard, M.-J., Klein, T., Lagnoux, A., Galop, D., Githumbi, E., Mindrescu, M., Nielsen, A. B., Trondman, A.-K., Poska, A., Sugita, S., Woodbridge, J., Abel-Schaad, D., Åkesson, C., Alenius, T., Ammann, B., Andersen, S. T., Anderson, R. S., Andrič, M., Balakauskas, L., Barnekow, L., Batalova, V., Bergman, J., Birks, H. J. B., Björkman, L., Bjune, A. E., Borisova, O., Broothaerts, N., Carrion, J., Caseldine, C., Christiansen, J., Cui, Q., Currás, A., Czerwiński, S., David, R., Davies, A. L., De Jong, R., Di Rita, F., Dietre, B., Dörfler, W., Doyen, E., Edwards, K. J., Ejarque, A., Endtmann, E., Etienne, D., Faure, E., Feeser, I., Feurdean, A., Fischer, E., Fletcher, W., Franco-Múgica, F., Fredh, E. D., Froyd, C., Garcés-Pastor, S., García-Moreiras, I., Gauthier, E., Gil-Romera, G., González-Sampériz, P., Grant, M. J., Grindean, R., Haas, J. N., Hannon, G., Heather, A.-J., Heikkilä, M., Hjelle, K., Jahns, S., Jasiunas, N., Jiménez-Moreno, G., Jouffroy-Bapicot, I., Kabailienè, M., Kamerling, I. M., Kangur, M., Karpińska-Kołaczek, M., Kasianova, A., Kołaczek, P., Lagerås, P., Latalowa, M., Lechterbeck, J., Leroyer, C., Leydet, M., Lindbladh, M., Lisitsyna, O., López-Sáez, J.-A., Lowe, J., Luelmo-Lautenschlaeger, R., Lukanina, E., Macijauskaitè, L., Magri, D., Marguerie, D., Marquer, L., Martinez-Cortizas, A., Mehl, I., Mesa-Fernández, J. M., Mighall, T., Miola, A., Miras, Y., Morales-Molino, C., Mrotzek, A., Sobrino, C. M., Odgaard, B., Ozola, I., Pérez-Díaz, S., Pérez-Obiol, R. P., Poggi, C., Rego, P. R., Ramos-Román, M. J., Rasmussen, P., Reille, M., Rösch, M., Ruffaldi, P., Goni, M. S., Savukynienè, N., Schröder, T., Schult, M., Segerström, U., Seppä, H., Vives, G. S., Shumilovskikh, L., Smettan, H. W., Stancikaite, M., Stevenson, A. C., Stivrins, N., Tantau, I., Theuerkauf, M., Tonkov, S., van der Knaap, W. O., van Leeuwen, J. F. N., Vecmane, E., Verstraeten, G., Veski, S., Voigt, R., Von Stedingk, H., Waller, M. P., Wiethold, J., Willis, K. J., Wolters, S., and Zernitskaya, V. P.: Testing the Effect of Relative Pollen Productivity on the REVEALS Model: A Validated Reconstruction of Europe-Wide Holocene Vegetation, Land, 12, 986, https://doi.org/10.3390/land12050986, 2023. a, b, c, d, e, f, g, h, i, j, k, l, m, n, o, p, q, r, s, t, u, v, w
Sexton, J. O., Song, X.-P., Feng, M., Noojipady, P., Anand, A., Huang, C., Kim, D.-H., Collins, K. M., Channan, S., DiMiceli, C., and Townshend, J. R.: Global, 30-m resolution continuous fields of tree cover: Landsat-based rescaling of MODIS vegetation continuous fields with lidar-based estimates of error, Int. J. Digit. Earth, 6, 427–448, https://doi.org/10.1080/17538947.2013.786146, 2013. a, b
Shakun, J. D., Clark, P. U., He, F., Marcott, S. A., Mix, A. C., Liu, Z., Otto-Bliesner, B., Schmittner, A., and Bard, E.: Global warming preceded by increasing carbon dioxide concentrations during the last deglaciation, Nature, 484, 49–54, https://doi.org/10.1038/nature10915, 2012. a
Soepboer, W., Sugita, S., Lotter, A. F., van Leeuwen, J. F. N., and van der Knaap, W. O.: Pollen Productivity Estimates for Quantitative Reconstruction of Vegetation Cover on the Swiss Plateau, Holocene, 17, 65–77, https://doi.org/10.1177/0959683607073279, 2007. a, b, c, d, e, f, g, h, i, j, k, l
Soepboer, W., Sugita, S., and Lotter, A. F.: Regional vegetation-cover changes on the Swiss Plateau during the past two millennia: A pollen-based reconstruction using the REVEALS model, Quaternary Sci. Rev., 29, 472–483, https://doi.org/10.1016/j.quascirev.2009.09.027, 2010. a
Strandberg, G., Kjellström, E., Poska, A., Wagner, S., Gaillard, M.-J., Trondman, A.-K., Mauri, A., Davis, B. A. S., Kaplan, J. O., Birks, H. J. B., Bjune, A. E., Fyfe, R., Giesecke, T., Kalnina, L., Kangur, M., van der Knaap, W. O., Kokfelt, U., Kuneš, P., Latałowa, M., Marquer, L., Mazier, F., Nielsen, A. B., Smith, B., Seppä, H., and Sugita, S.: Regional climate model simulations for Europe at 6 and 0.2 k BP: sensitivity to changes in anthropogenic deforestation, Clim. Past, 10, 661–680, https://doi.org/10.5194/cp-10-661-2014, 2014. a
Strandberg, G., Lindström, J., Poska, A., Zhang, Q., Fyfe, R., Githumbi, E., Kjellström, E., Mazier, F., Nielsen, A. B., Sugita, S., Trondman, A.-K., Woodbridge, J., and Gaillard, M.-J.: Mid-Holocene European climate revisited: New high-resolution regional climate model simulations using pollen-based land-cover, Quaternary Sci. Rev., 281, 107431, https://doi.org/10.1016/j.quascirev.2022.107431, 2022. a
Strandberg, G., Chen, J., Fyfe, R., Kjellström, E., Lindström, J., Poska, A., Zhang, Q., and Gaillard, M.-J.: Did the Bronze Age deforestation of Europe affect its climate? A regional climate model study using pollen-based land cover reconstructions, Clim. Past, 19, 1507–1530, https://doi.org/10.5194/cp-19-1507-2023, 2023. a
Stuart, A. and Ord, J.: Kendall's Advanced Theory of Statistic, Vol. 1 of Distribution Theory, Edward Arnold, London, ISBN 978-0-470-66530-5, 1994. a
Sugita, S.: A Model of Pollen Source Area for an Entire Lake Surface, Quaternary Res., 39, 239–244, https://doi.org/10.1006/qres.1993.1027, 1993. a
Sugita, S.: Theory of quantitative reconstruction of vegetation I: pollen from large sites REVEALS regional vegetation composition, Holocene, 17, 229–241, https://doi.org/10.1177/0959683607075837, 2007. a, b, c, d, e
Sugita, S., Parshall, T., Calcote, R., and Walker, K.: Testing the Landscape Reconstruction Algorithm for spatially explicit reconstruction of vegetation in northern Michigan and Wisconsin, Quaternary Res., 74, 289–300, https://doi.org/10.1016/j.yqres.2010.07.008, 2010. a
Theuerkauf, M., Couwenberg, J., Kuparinen, A., and Liebscher, V.: A matter of dispersal: REVEALSinR introduces state-of-the-art dispersal models to quantitative vegetation reconstruction, Veg. Hist. Archaeobot., 25, 541–553, https://doi.org/10.1007/s00334-016-0572-0, 2016. a, b
Tian, F., Cao, X., Dallmeyer, A., Ni, J., Zhao, Y., Wang, Y., and Herzschuh, U.: Quantitative woody cover reconstructions from eastern continental Asia of the last 22 kyr reveal strong regional peculiarities, Quaternary Sci. Rev., 137, 33–44, https://doi.org/10.1016/j.quascirev.2016.02.001, 2016. a
Townshend, J.: Global Forest Cover Change (GFCC) Tree Cover Multi-Year Global 30 m V003, NASA EOSDIS Land Processes Distributed Active Archive Center [data set], https://doi.org/10.5067/MEASURES/GFCC/GFCC30TC.003, 2016. a
Trondman, A.-K., Gaillard, M.-J., Mazier, F., Sugita, S., Fyfe, R., Nielsen, A. B., Twiddle, C., Barratt, P., Birks, H. J. B., Bjune, A. E., Björkman, L., Broström, A., Caseldine, C., David, R., Dodson, J., Dörfler, W., Fischer, E., van Geel, B., Giesecke, T., Hultberg, T., Kalnina, L., Kangur, M., van der Knaap, P., Koff, T., Kuneš, P., Lagerås, P., Latałowa, M., Lechterbeck, J., Leroyer, C., Leydet, M., Lindbladh, M., Marquer, L., Mitchell, F. J. G., Odgaard, B. V., Peglar, S. M., Persson, T., Poska, A., Rösch, M., Seppä, H., Veski, S., and Wick, L.: Pollen-based quantitative reconstructions of Holocene regional vegetation cover (plant-functional types and land-cover types) in Europe suitable for climate modelling, Glob. Change Biol., 21, 676–697, https://doi.org/10.1111/gcb.12737, 2015. a, b, c, d
Trondman, A.-K., Gaillard, M.-J., Sugita, S., Björkman, L., Greisman, A., Hultberg, T., Lagerås, P., Lindbladh, M., and Mazier, F.: Are pollen records from small sites appropriate for REVEALS model-based quantitative reconstructions of past regional vegetation? An empirical test in southern Sweden, Veg. Hist. Archaeobot., 25, 131–151, https://doi.org/10.1007/s00334-015-0536-9, 2016. a
Viau, A. E., Ladd, M., and Gajewski, K.: The climate of North America during the past 2000 years reconstructed from pollen data, Global Planet. Change, 84–85, 75–83, https://doi.org/10.1016/j.gloplacha.2011.09.010, 2012. a
Vincens, A., Lézine, A.-M., Buchet, G., Lewden, D., and Le Thomas, A.: African pollen database inventory of tree and shrub pollen types, Rev. Palaeobot. Palyno., 145, 135–141, https://doi.org/10.1016/j.revpalbo.2006.09.004, 2007. a
von Stedingk, H., Fyfe, R. M., and Allard, A.: Pollen Productivity Estimates from the Forest—Tundra Ecotone in West-Central Sweden: Implications for Vegetation Reconstruction at the Limits of the Boreal Forest, Holocene, 18, 323–332, https://doi.org/10.1177/0959683607086769, 2008. a, b, c, d, e, f, g, h, i
Wan, Q., Zhang, Y., Huang, K., Sun, Q., Zhang, X., Gaillard, M.-J., Xu, Q., Li, F., and Zheng, Z.: Evaluating quantitative pollen representation of vegetation in the tropics: A case study on the Hainan Island, tropical China, Ecol. Indic., 114, 106297, https://doi.org/10.1016/j.ecolind.2020.106297, 2020. a, b, c, d, e, f, g, h, i, j
Wan, Q., Huang, K., Chen, C., Tang, Y., Zhang, X., Zhang, Z., and Zheng, Z.: Relative Pollen Productivity Estimates for Major Plant Taxa in Middle Subtropical China, Land, 12, 1337, https://doi.org/10.3390/land12071337, 2023. a, b, c, d, e, f
Wang, Y. und Herzschuh, U.: Reassessment of Holocene vegetation change on the upper Tibetan Plateau using the pollen-based REVEALS model, Rev. Palaeobot. Palyno., 168, 31–40, https://doi.org/10.1016/J.REVPALBO.2011.09.004, 2011. a, b, c, d
Wang, Y., Xu, Q., Zhang, S., Sun, Y., Li, Y., Hao, J., Huang, R., Shi, J., Wang, N., Wang, T., Li, Y., Zhang, R., Zhang, X., and Zhou, Z.: Relative pollen productivity estimates and landcover reconstruction of desert steppe in arid Western China: An example in Barkol Basin, Quaternary Sci., 41, 1738–1748, https://doi.org/10.11928/j.issn.1001-7410.2021.06.19, 2021. a, b, c, d, e, f, g
Webb, T., Howe, S. E., Bradshaw, R. H. W., and Heide, K. M.: Estimating plant abundances from pollen percentages: The use of regression analysis, Rev. Palaeobot. Palyno., 34, 269–300, https://doi.org/10.1016/0034-6667(81)90046-4, 1981. a
Whitmore, J., Gajewski, K., Sawada, M., Williams, J. W., Shuman, B., Bartlein, P. J., Minckley, T., Viau, A. E., Webb, T., Shafer, S., Anderson, P., and Brubaker, L.: Modern pollen data from North America and Greenland for multi-scale paleoenvironmental applications, Quaternary Sci. Rev., 24, 1828–1848, https://doi.org/10.1016/j.quascirev.2005.03.005, 2005. a
Wieczorek, M. and Herzschuh, U.: Compilation of relative pollen productivity (RPP) estimates and taxonomically harmonised RPP datasets for single continents and Northern Hemisphere extratropics, Earth Syst. Sci. Data, 12, 3515–3528, https://doi.org/10.5194/essd-12-3515-2020, 2020. a, b, c, d
Williams, J. W., Grimm, E. C., Blois, J. L., Charles, D. F., Davis, E. B., Goring, S. J., Graham, R. W., Smith, A. J., Anderson, M., Arroyo-Cabrales, J., Ashworth, A. C., Betancourt, J. L., Bills, B. W., Booth, R. K., Buckland, P. I., Curry, B. B., Giesecke, T., Jackson, S. T., Latorre, C., Nichols, J., Purdum, T., Roth, R. E., Stryker, M., and Takahara, H.: The Neotoma Paleoecology Database, a multiproxy, international, community-curated data resource, Quaternary Res., 89, 156–177, https://doi.org/10.1017/qua.2017.105, 2018. a, b
Woodbridge, J., Fyfe, R. M., and Roberts, N.: A comparison of remotely sensed and pollen-based approaches to mapping Europe's land cover, J. Biogeogr., 41, 2080–2092, https://doi.org/10.1111/jbi.12353, 2014. a
Zhang, Y., Wei, Q., Zhang, Z., Xu, Q., Gao, W., and Li, Y.: Relative pollen productivity estimates of major plant taxa and relevant source area of pollen in the warm-temperate forest landscape of northern China, Veg. Hist. Archaeobot., 30, 231–241, https://doi.org/10.1007/s00334-020-00779-x, 2021a. a, b, c, d, e, f, g, h, i, j, k, l, m, n, o, p, q
Zhang, N., Ge, Y., Li, Y., Li, B., Zhang, R., Zhang, Z., Fan, B., Zhang, W., and Ding, G.: Modern pollen-vegetation relationships in the Taihang Mountains: Towards the quantitative reconstruction of land-cover changes in the North China Plain, Ecol. Indic., 129, 107928, https://doi.org/10.1016/j.ecolind.2021.107928, 2021b. a, b, c, d, e, f, g, h, i, j, k
Zhang, P., Xu, Q., Gaillard, M.-J., Mu, H., Zhang, Y., and Lu, J.: Research of main plant species's relative pollen productivities and relevant source area of temperate coniferous and broad-leaved mixed forest in Northern China, Quaternary Sci., 37, 1429–1443, http://www.dsjyj.com.cn/en/article/doi/10.11928/j.issn.1001-7410.2017.06.24?viewType=HTML (last access: 10 April 2025), 2017. a, b, c, d, e, f, g, h, i, j, k, l, m, n, o, p