the Creative Commons Attribution 4.0 License.
the Creative Commons Attribution 4.0 License.
 | 24 Apr 2025
Hyperspectral library of submerged aquatic vegetation and benthic substrates in the Baltic Sea
Ele Vahtmäe
Laura Argus
Kaire Toming
Martin Ligi
Tiit Kutser
A hyperspectral reflectance database was acquired for Baltic Sea submerged aquatic vegetation (SAV) and bare substrates by using Ramses (TriOS GmbH, Germany) radiometers capturing spectral data within the visible (VIS) and near-infrared (NIR) spectral ranges. The target samples included the most dominant and characteristic SAV species in the Baltic Sea, as well as several bare substrate types and beach cast communities. Target samples were measured within the 350–900 nm wavelength range under sunlight conditions without the water column influence. That is, samples were taken out of the water. Such a library is expected to provide insight into the spectral properties of various SAV species and substrates occurring in the coastal waters of the temperate geographic regions, facilitating the development of algorithms for differentiating and mapping various SAV communities. Additionally, measured reflectance spectra can be used as spectral end-members in physical models and classification algorithms for coastal vegetation mapping and quantification. The data are openly available in the PANGAEA online repository at https://doi.org/10.1594/PANGAEA.971518 (Vahtmäe et al., 2024).
- Article
(1643 KB) - Full-text XML
- BibTeX
- EndNote


Vegetated coastal ecosystems provide valuable ecosystem services – they constitute feeding, spawning, and sheltering grounds for a wide variety of species, they act as soft sediment stabilizers, they protect coastlines, and they remove nutrients and contaminants from the water column (Cotas et al., 2023; Macreadie et al., 2017). They also play an important role in climate change mitigation by sequestering and storing carbon from the atmosphere (Duarte et al., 2005; McLeod et al., 2011). Information on such highly valued ecosystems is important from both scientific and management perspectives. Optical remote sensing can provide information on large temporal and spatial scales, which has led to increased use of such technology in coastal studies (Kutser et al., 2020). To better implement these technologies, there is a need for improved knowledge of spectral properties of vegetation species and benthic substrates inhabiting coastal areas.
The Baltic Sea is located in the temperate geographic region. It is a semi-enclosed non-tidal water body that lacks an intertidal zone and where benthic vegetation species mostly grow submerged. Submerged aquatic vegetation (SAV) in the Baltic Sea includes several taxonomic groups of macroalgae as well as higher plants, e.g. vascular plants. Macroalgae are classified according to their pigmentation into three major groups: brown algae (Phaeophyceae), green algae (Chlorophyta), and red algae (Rhodophyta) (Vimala and Poonghuzhali, 2013). Consequently, there exists a need to generate a substantiated dataset representing reflectance spectra of SAV species from different taxonomic groups. Such a dataset can be used to give insights into the spectral properties of SAV species and substrates characteristic of the Baltic Sea but also the broader temperate geographic region. As such, the current database contributes to the global dataset of SAV reflectance spectra, allowing further analysis of whether the spectral resolutions of current and future remote sensing instruments can discriminate between broader SAV classes and/or species based on their spectral signatures.
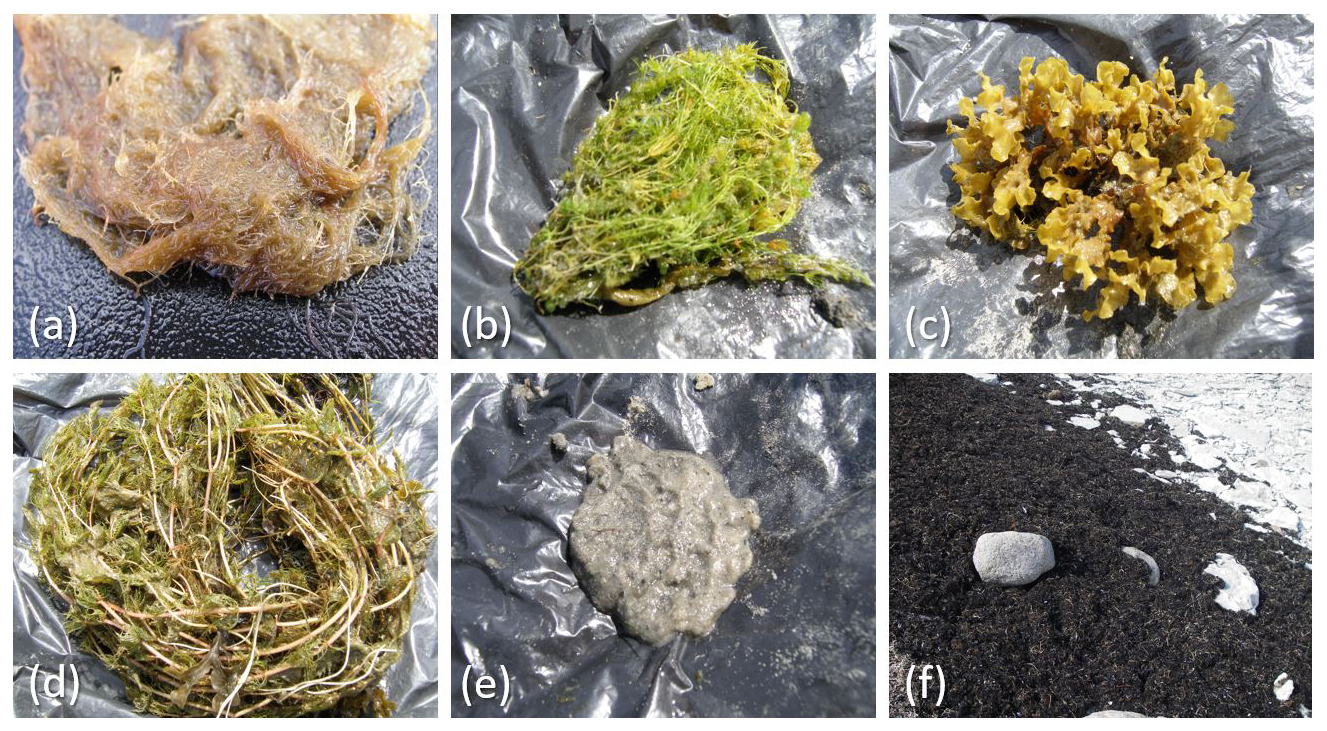
Figure 1Photographs of selected target samples of each of the six groups: (a) red macroalgae (Ceramium tenuicorne), (b) green macroalgae (Chara spp.), (c) brown macroalgae (Fucus vesiculosus), (d) higher plants (Myriophyllum spicatum), (e) bare substrates, and (f) beach casts.
SAV distribution maps are mostly created by using different image-based classification approaches, such as unsupervised and supervised classification (Bouvet et al., 2003; Fornes et al., 2006; Phinn et al., 2012; Roelfsema et al., 2013; Traganos and Reinartz, 2018). Such image-based methods require a high amount of ground truth data or detailed expert knowledge of the area to train classification algorithms (Campbell et al., 2023). An alternative here is to use signal-based classification approaches where measured and/or modelled spectral libraries are used to interpret imagery (Kutser et al., 2006; Lesser and Mobley, 2007; Vahtmäe and Kutser, 2013). The signal-based classification does not require simultaneous and continuous field surveys. Instead, a given method requires the availability of an end-member spectral library. The data we propose in the current work are designed to be this kind of library for SAV classification applications.
Benthic reflectance spectra are also required parameters in physics-based forward models, e.g. the HydroLight model for natural waters, where they can be used together with inherent water optical properties in numerical simulations if measured data are not sufficiently represented or are lacking. Additionally, physics-based bio-optical inversion models (e.g. WASI-2D, BOMBER, IDA, or HOPE) require benthic end-members as input parameters in order to model benthic signatures through the water column. Then, modelled spectra are compared with measured spectra from remote sensing images, and optimization algorithms can retrieve SAV distribution and abundance assessments from this comparison (Dekker et al., 2011; Fritz et al., 2019; Gege, 2014; Giardino et al., 2012; Hedley et al., 2009, 2018). The collected spectra can serve as end-members in such bio-optical forward and inversion models. Spectral signatures of benthic end-members can also be used to assess the quality of water column corrections in satellite or airborne images, as benthic spectra without the water column influence should resemble the spectra in our spectral library.
To meet all of the above-mentioned needs, the current work aimed to compile a dataset of hyperspectral reflectance measurements from SAV species and substrate types that occur naturally in the coastal waters of the Baltic Sea. This spectral dataset was collected by the research team of the Estonian Marine Institute at the University of Tartu. Various coastal areas of the Baltic Sea were visited in Estonia and Sweden to collect reflectance spectra of the most characteristic and dominant SAV species and substrate types. A subset of this database has already been used for example by Kotta et al. (2014), where statistical differences between reflectance spectra of SAV species were quantified and spectral regions, contributing the most to the statistical differences, defined.
Although we aimed to capture reflectance spectra of the most dominant and characteristic SAV species and substrate types present in the coastal waters of the Baltic Sea, the dataset presented here is not complete. More importantly, spectral properties of SAV species may vary depending on seasonality and environmental conditions, e.g. a decrease in the chlorophyll concentration during senescence or stress. As a result, there exists considerable variation in pigment composition and quantity among broad taxonomic groups and even within species (Kotta et al., 2014). In the future, we plan to complement the collected dataset with additional species and/or substrate types using a similar approach to that presented here. Moreover, we aim to collect reflectance spectra of various SAV species all throughout the vegetation period to capture seasonal changes in their reflectance spectra. Still, we believe that, in the present form, the dataset may lead to several implications for current and future satellite missions.
Measured reflectance spectra of various SAV species are displayed in a number of publications (Chao Rodríguez et al., 2017; Davies et al., 2023; Dekker et al., 2005; Fyfe, 2003; Kutser et al., 2006, 2020; Olmedo-Masat et al., 2020). However, such information is often lacking in the data format, which would allow us to re-use the measured data. By making the current dataset available to other researchers, we hope to encourage them to do similar work and propose new algorithms for SAV detection and classification.
2.1 Samples
This dataset was compiled over a period of 2 years (2011–2012) during field campaigns in Baltic Sea coastal waters in Estonia and Sweden. The set of target samples presented in this database was divided into six groups: red macroalgae, green macroalgae, brown macroalgae, higher plants, bare substrates, and beach casts (Fig. 1).
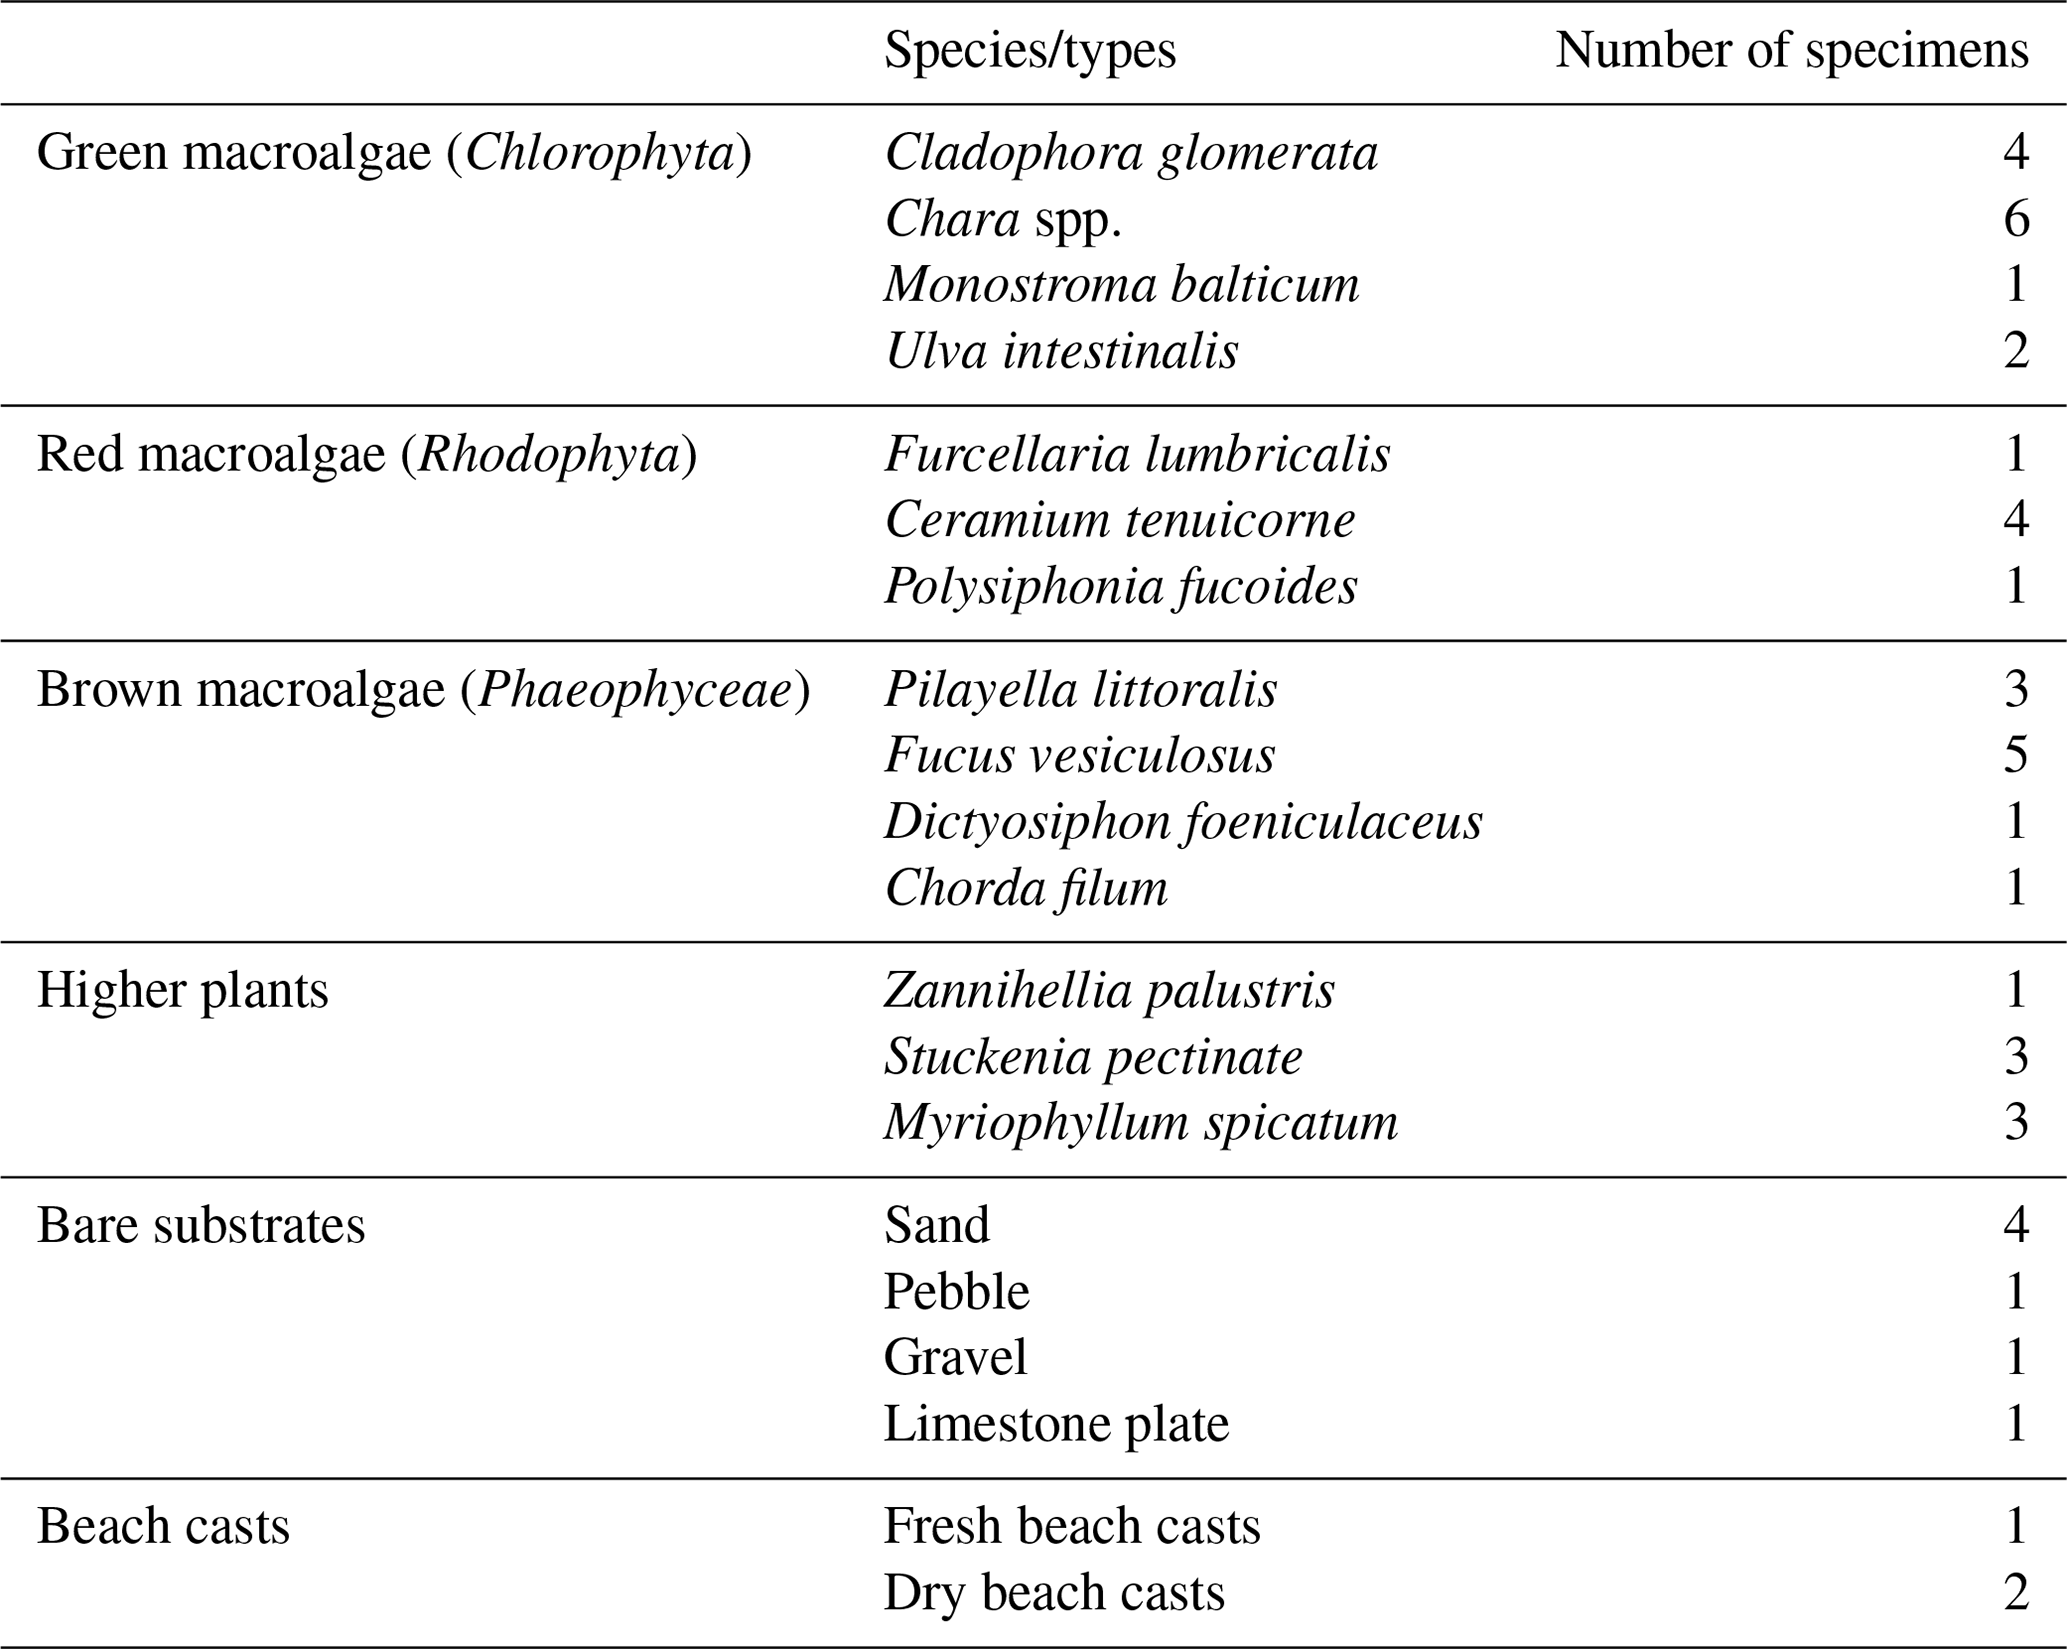
Green macroalgae, red macroalgae, and brown macroalgae are three major taxonomic groups of macroalgae in the Baltic Sea according to their pigmentation, each of which exhibits its own characteristic spectral features (groups 1–3, Table 1). In addition to macroalgae, the Baltic Sea also hosts higher plants or vascular plants (group 4, Table 1). Besides the vegetated habitats, the benthic environment of the Baltic Sea includes unvegetated bare substrates (group 5, Table 1). Finally, the last group is beach casts, which consist of decaying vegetation material (group 6, Table 1). Several benthic vegetation species and substrate types were measured in each of the six given groups.
Recorded red macroalgae species included Furcellaria lumbricalis, Ceramium tenuicorne, and Polysiphonia fucoides. Green macroalgae species included Cladophora glomerata, Chara spp., Monostroma balticum, and Ulva intestinalis. Brown macroalgae species included Pilayella littoralis, Fucus vesiculosus, Dictyosiphon foeniculaceus, and Chorda filum. Higher plant species included Zannihellia palustris, Stuckenia pectinate, and Myriophyllum spicatum (Table 1). Bare substrate reflectance spectra are measured for sand, pebble, gravel, and limestone plate. Beach cast communities included SAV communities that were either recently washed out of the sea or already dried in the Sun. Most of the SAV species and substrates are measured more than once (up to six different specimens) in different locations and/or during different field campaigns.
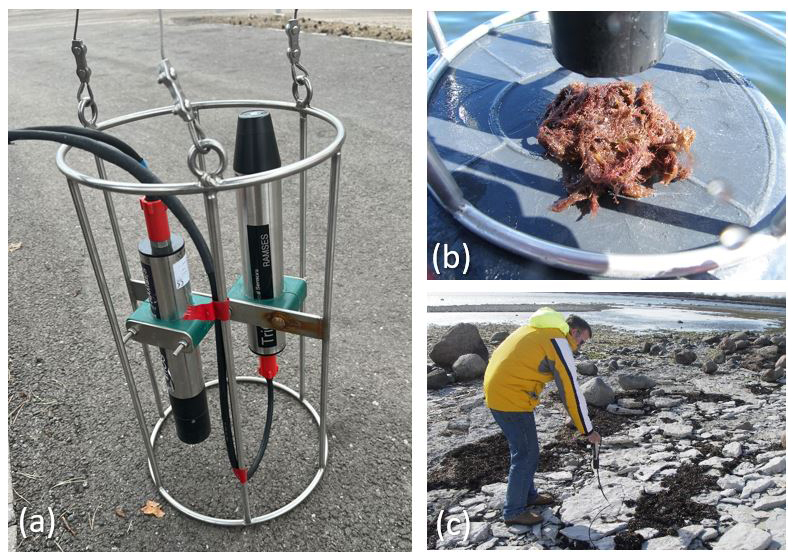
Figure 2Ramses two-sensor measurement set (a), the Lu sensor installed on the measuring frame while conducting measurements (b), and the Lu sensor held in the hand while conducting measurements (c).
2.2 Spectral reflectance measurements
Before conducting measurements, all of the samples were taken out of the water, and SAV species were identified to the lowest possible taxonomic level by the biologist. Most of the samples were identified to the species level, and only charophytes from the green macroalgae group were identified to their genus level (Chara spp.). All reflectance measurements were performed outdoors in the field, using solar light as an illumination source. Samples were measured in the boat or on the beach, against the natural background or against an artificial black background to minimize the signal from the adjacent environment. Bare substrate samples (e.g. sand or gravel on the beach) and beach casts were mostly measured at their locations on the beach.
Ramses (TriOS GmbH, Germany) portable field radiometers were used to capture the spectral data within the 350–900 nm wavelength range with a spectral resolution of 3.3 nm. It is important to point out that the signal-to-noise ratio (SNR) for the measurements below 400 nm and above 850 nm is significantly higher than within the rest of the spectral range. The Ramses measurement set consisted of two simultaneously operated sensors: irradiance and radiance sensors. The radiance sensor measured the upwelling spectral radiance Lu (), and the irradiance sensor measured the downwelling spectral irradiance Ed (). Remote sensing reflectance (Rrs; sr−1) was calculated as the ratio . As sensors measure at slightly different wavelengths, before reflectance calculation, signals from both sensors were interpolated to a fixed wavelength with a 2 nm step.
While the Ed sensor was always attached to the standard TriOS measuring frame, the Lu sensor was either attached to the frame or handheld and pointed down to the sample during measurements (Fig. 2). The field of view (FOV) of the Lu sensor is 7°, resulting in an imaged area of around 1.1 cm2 when positioned at a distance of 10 cm. For each sample, multiple consecutive measurements (5 to 10 individual measurements) were performed. All consecutively measured spectra were inspected visually, and outliers were removed. After initial assessment, average spectra of multiple measurements were calculated for each sample to reduce the noise.
For the current database, Rrs was obtained for benthic species and substrates by using radiance and irradiance sensors. The spectral data can also be measured as reflectance (R), which is the ratio of upwelling radiance to downwelling radiance () or upwelling irradiance to downwelling irradiance (). Often, R is measured with only one sensor by using a white Spectralon panel as a reference (Chao Rodríguez et al., 2017; Davies et al., 2023; Fyfe, 2003; Olmedo-Masat et al., 2020). The relationship between radiance and irradiance is not so straightforward, but in the case of Lambertian surfaces the radiance value can be multiplied by π to get irradiance. Similarly, the outcome of the atmospheric correction, applied to the remote sensing images, can be either Rrs or R. If the outcome of the atmospheric correction is irradiance reflectance, our Ramses-measured Rrs can be multiplied by the Q factor, which converts it into the irradiance reflectance, making Ramses measurements thereafter comparable to the outcome of the atmospheric correction. The Q value may range from 0.3 to 6.5 (Gentili and Morel, 1993), but to simplify it the Q factor can be considered equal to π.
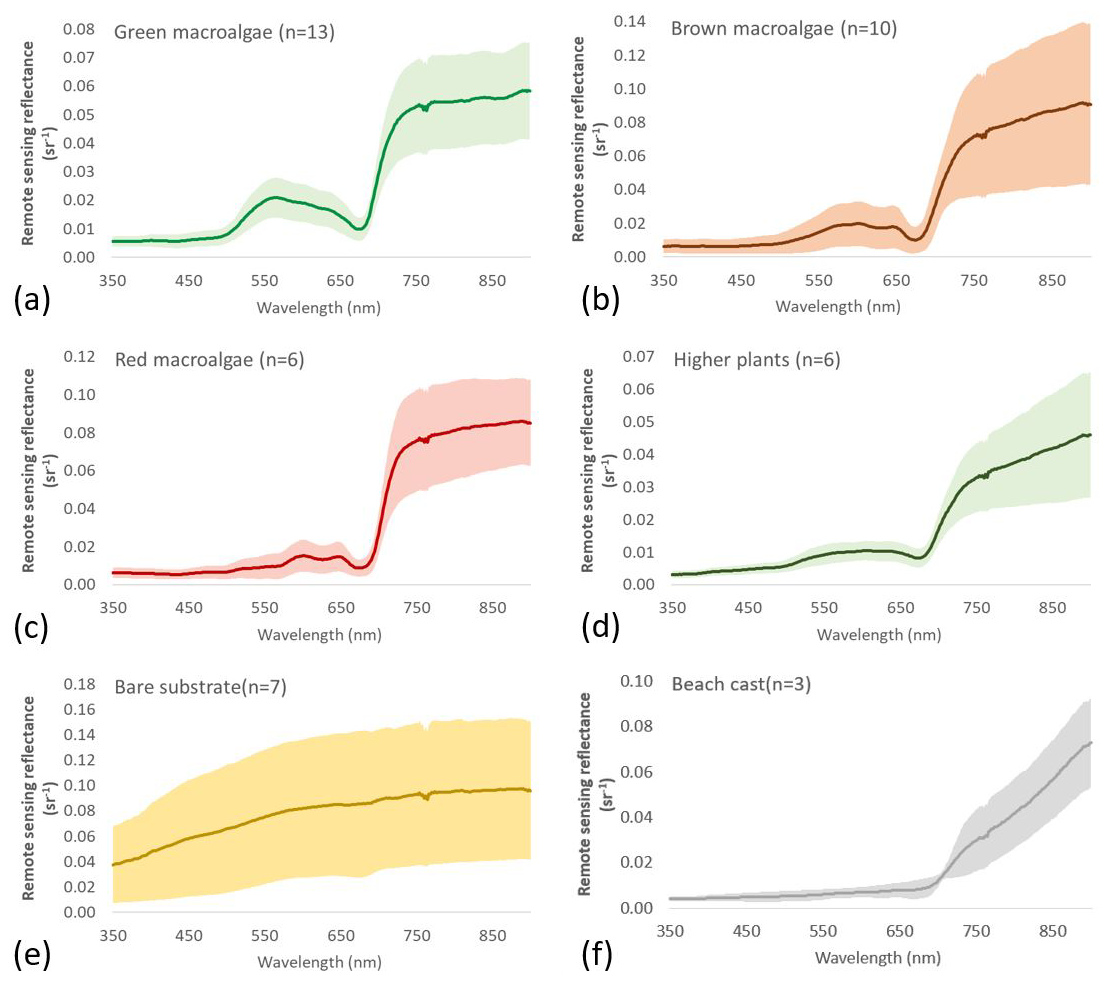
Figure 3Remote sensing reflectance () of the six target groups: (a) green macroalgae, (b) brown macroalgae, (c) red macroalgae, (d) higher plants, (e) bare substrates, and (f) beach casts. The mean spectra are represented by the solid lines, and the colour shading indicates the variability in the standard deviation.
The spectral properties of SAV species are determined by their tissue morphology, their cellular structure, and the concentration and distribution of leaf biochemical components such as pigments, water, nitrogen, cellulose, and lignin pigment contents, shaping the formation of the spectral signature of each specimen (Penuelas and Filella, 1998). Pigments absorb light at certain distinctive wavelengths, affecting the shapes of the reflectance spectra, while tissular structures mostly affect the absolute reflectance (Chao Rodríguez et al., 2017). All SAV groups contain chlorophyll a (Chl a), which is the predominant green pigment in plants with absorption maxima in the blue (435 nm) and red (675 nm) parts of the spectrum (Chao Rodríguez et al., 2017; Haxo and Blinks, 1950). Therefore, all SAV groups in the current database exhibit characteristic vegetation spectra, e.g. low reflectance around 400–500 and 650–680 nm and high reflectance in the near-infrared (NIR) spectral range (Fig. 3a–d).
Green macroalgae mostly contain chlorophyll pigments (Chl a or Chl b) (Chao Rodríguez et al., 2017; Rowan, 1989). As a result, green macroalgae show absorption minima near 440 and 675 nm, which correspond to the chlorophyll absorption peaks, and a broad reflectance peak in the green spectral range centred around 550 nm that gives them their characteristic green colour (Fig. 3a). Chl a is also present in brown and red macroalgae, but their green colour is partially masked out by other accessory pigments. Brown algae predominantly contain the brown pigment fucoxanthin, which absorbs light up to 560 nm (Rowan, 1989), shifting the reflectance maxima away from the green wavelengths further to the yellow spectral range. Typical spectral features of brown macroalgae are peaks around 600 and 650 nm and a shoulder around 575 nm (Fig. 3b). The red algae contain large quantities of the red pigment phycoerythrin, which absorbs light in the middle of the visible spectrum between 495 and 565 nm, also depressing reflectance in the green part of the spectrum (Haxo and Blinks, 1950). Red macroalgae show two reflectance peaks in the red region of the visible spectrum around 600 and 650 nm (Fig. 3c). Higher plant characteristic pigments are similar to those of green macroalgae, showing higher reflectivity in the green spectral range (Chao Rodríguez et al., 2017; Kutser et al., 2006, 2020). However, higher plant spectra (Fig. 3d) show flatter spectral shapes between 550 and 640 nm when compared to the green macroalgae spectra (Fig. 3a).
In contrast, bare substrates do not show specific red-edge reflectance or other pigment-induced spectral features at the visible wavelengths (Fig. 3e). The bare substrate group has the highest variability in absolute values, as this group includes substrate types with various brightness levels from muddy sand to bright limestone plate. The beach cast materials in Fig. 3f show spectral characteristics different from both living SAV species and bare substrates. They exhibit a very low signal in the visible spectral range and increasing reflectance in the NIR spectral range. Beach cast reflectance spectra were measured for fresh and dry beach casts. While the fresh beach casts still had visible Chl-a absorption features near 675 nm, the dry beach casts had lost the chlorophyll absorption feature.
This dataset contains the reflectance spectra of each target in 276 spectral bands (between 350 and 900 nm). Pictures of the targets were included when available. A metadata section is added to each spectral measurement, containing the following information:
-
acquisition date;
-
country where samples were collected;
-
location name;
-
latitude of measurement (approximate);
-
longitude of measurement (approximate);
-
illumination source;
-
measurement instrument name;
-
measurement unit;
-
use of a reference panel and its name;
-
sampling environment (boat, beach, or laboratory);
-
sampling background (natural or artificial);
-
target description (macroalgae, higher plants, or substrates); and
-
target species or genus name in Latin.
For every target sample, an average spectrum was calculated from 5 to 10 reflectance measurements. Averaging multiple measurements minimizes noise in the data.
The current dataset is publicly available in the PANGAEA repository at https://doi.org/10.1594/PANGAEA.971518 (Vahtmäe et al., 2024).
Remote sensing technology is increasingly being used to detect, map, and monitor benthic ecosystems in shallow coastal waters. For efficient implementation, the technology requires information about the spectral properties of benthic habitats. The database presented here aims to add new data on the spectral properties of the Baltic Sea benthic vegetation species, enabling us to identify and characterize them and to evaluate the potential to discriminate between them based on their spectral signatures. At the same time, it allows us to facilitate comparative analysis of SAV species from different locations and regions all over the globe in order to study spectral variations within broader and narrower SAV groups. Additionally, reflectance spectra of several bare substrate types were recorded to facilitate discrimination between vegetated and unvegetated areas.
Our hyperspectral reflectance database further improves scientific knowledge about optical characteristics of SAV species and substrates. We believe that such information is essential in remote sensing algorithm development and in defining requirements for future remote sensing missions (spectral resolution, band selection, bandwidth, or signal-to-noise ratio). The presented database can also be used in remote sensing applications, which require spectral information, e.g. algorithm development or numerical simulations. The database can be used in remote sensing image processing, which requires benthic end-members (physics-based radiative transfer modelling) and image classifications where spectral libraries are used.
Conceptualization: EV. Data curation: ML and LA. Formal analysis: EV and KT. Funding acquisition: TK. Investigation: EV, LA, and ML. Visualization: EV and KT. Writing – original draft preparation: EV. Writing – review and editing: KT and TK. All the authors have read and agreed to the published version of the manuscript.
The contact author has declared that none of the authors has any competing interests.
Publisher's note: Copernicus Publications remains neutral with regard to jurisdictional claims made in the text, published maps, institutional affiliations, or any other geographical representation in this paper. While Copernicus Publications makes every effort to include appropriate place names, the final responsibility lies with the authors.
We wish to thank the Department of Marine Biology at the Estonian Marine Institute for their help in performing the fieldwork and identifying the vegetation species.
This research has been supported by the Eesti Teadusagentuur (grant no. PRG2630).
This paper was edited by François G. Schmitt and reviewed by two anonymous referees.
Bouvet, G., Ferraris, J., and Andréfouët, S.: Evaluation of large-scale unsupervised classification of New Caledonia reef ecosystems using Landsat 7 ETM+ imagery, Oceanol. Acta, 26, 281–290, https://doi.org/10.1016/S0399-1784(03)00012-4, 2003.
Campbell, J. B., Wynne, R. H., and Thomas, V.: Introduction to remote sensing, Guilford Press, 634 pp., ISBN 9781462549405, 2023.
Chao Rodríguez, Y., Domínguez Gómez, J. A., Sánchez-Carnero, N., and Rodríguez-Pérez, D.: A comparison of spectral macroalgae taxa separability methods using an extensive spectral library, Algal Res., 26, 463–473, https://doi.org/10.1016/J.ALGAL.2017.04.021, 2017.
Cotas, J., Gomes, L., Pacheco, D., and Pereira, L.: Ecosystem Services Provided by Seaweeds, Hydrobiology, 2, 75–96, https://doi.org/10.3390/hydrobiology2010006, 2023.
Davies, B. F. R., Gernez, P., Geraud, A., Oiry, S., Rosa, P., Zoffoli, M. L., and Barillé, L.: Multi- and hyperspectral classification of soft-bottom intertidal vegetation using a spectral library for coastal biodiversity remote sensing, Remote Sens. Environ., 290, 113554, https://doi.org/10.1016/J.RSE.2023.113554, 2023.
Dekker, A. G., Brando, V. E., and Anstee, J. M.: Retrospective seagrass change detection in a shallow coastal tidal Australian lake, Remote Sens. Environ., 97, 415–433, https://doi.org/10.1016/j.rse.2005.02.017, 2005.
Dekker, A. G., Phinn, S. R., Anstee, J., Bissett, P., Brando, V. E., Casey, B., Fearns, P., Hedley, J., Klonowski, W., Lee, Z. P., Lynch, M., Lyons, M., Mobley, C., and Roelfsema, C.: Intercomparison of shallow water bathymetry, hydro-optics, and benthos mapping techniques in Australian and Caribbean coastal environments, Limnol. Oceanogr.-Meth., 9, 396–425, 2011.
Duarte, C. M., Middelburg, J. J., and Caraco, N.: Major role of marine vegetation on the oceanic carbon cycle, Biogeosciences, 2, 1–8, https://doi.org/10.5194/bg-2-1-2005, 2005.
Fornes, A., Basterretxea, G., Orfila, A., Jordi, A., Alvarez, A., and Tintore, J.: Mapping Posidonia oceanica from IKONOS, ISPRS J. Photogramm., 60, 315–322, https://doi.org/10.1016/j.isprsjprs.2006.04.002, 2006.
Fritz, C., Kuhwald, K., Schneider, T., Geist, J., and Oppelt, N.: Sentinel-2 for mapping the spatio-temporal development of submerged aquatic vegetation at Lake Starnberg (Germany), J. Limnol., 78, 71–91, https://doi.org/10.4081/jlimnol.2019.1824, 2019.
Fyfe, S. K.: Spatial and temporal variation in spectral reflectance: Are seagrass species spectrally distinct?, Limnol. Oceanogr., 48, 464–479, 2003.
Gege, P.: WASI-2D: A software tool for regionally optimized analysis of imaging spectrometer data from deep and shallow waters, Comput. Geosci., 62, 208–215, https://doi.org/10.1016/J.CAGEO.2013.07.022, 2014.
Gentili, B. and Morel, A.: Diffuse reflectance of oceanic waters. II. Bidirectional aspects, Appl. Optics, 32, 6864–6879, https://doi.org/10.1364/AO.32.006864, 1993.
Giardino, C., Candiani, G., Bresciani, M., Lee, Z., Gagliano, S., and Pepe, M.: BOMBER: A tool for estimating water quality and bottom properties from remote sensing images, Comput. Geosci., 45, 313–318, https://doi.org/10.1016/j.cageo.2011.11.022, 2012.
Haxo, F. T. and Blinks, R. L.: PHOTOSYNTHETIC ACTION SPECTRA OF MARINE ALGAE, J. Gen. Physiol., 33, 389–422, 1950.
Hedley, J., Roelfsema, C., and Phinn, S. R.: Efficient radiative transfer model inversion for remote sensing applications, Remote Sens. Environ., 113, 2527–2532, https://doi.org/10.1016/J.RSE.2009.07.008, 2009.
Hedley, J. D., Roelfsema, C., Brando, V., Giardino, C., Kutser, T., Phinn, S., Mumby, P. J., Barrilero, O., Laporte, J., and Koetz, B.: Coral reef applications of Sentinel-2: Coverage, characteristics, bathymetry and benthic mapping with comparison to Landsat 8, Remote Sens. Environ., 216, 598–614, https://doi.org/10.1016/J.RSE.2018.07.014, 2018.
Kotta, J., Remm, K., Vahtmäe, E., Kutser, T., and Orav-Kotta, H.: In-air spectral signatures of the Baltic Sea macrophytes and their statistical separability, J. Appl. Remote Sens., 8, 083634, https://doi.org/10.1117/1.jrs.8.083634, 2014.
Kutser, T., Metsamaa, L., and Vahtmäe, E.: Spectral library of macroalgae and benthic substrates in Estonian coastal waters, Proc. Est. Acad. Sci.-Biol. Ecol., 55, 329, https://doi.org/10.3176/BIOL.ECOL.2006.4.05, 2006.
Kutser, T., Hedley, J., Giardino, C., Roelfsema, C., and Brando, V. E.: Remote sensing of shallow waters – A 50 year retrospective and future directions, Remote Sens. Environ., 240, 111619, https://doi.org/10.1016/J.RSE.2019.111619, 2020.
Lesser, M. P. and Mobley, C. D.: Bathymetry, water optical properties, and benthic classification of coral reefs using hyperspectral remote sensing imagery, Coral Reefs, 26, 819–829, https://doi.org/10.1007/s00338-007-0271-5, 2007.
Macreadie, P. I., Jarvis, J., Trevathan-Tackett, S. M., and Bellgrove, A.: Seagrasses and Macroalgae: Importance, Vulnerability and Impacts, in: Climate Change Impacts on Fisheries and Aquaculture, John Wiley & Sons, Ltd, https://doi.org/10.1002/9781119154051.ch22, 729–770, 2017.
McLeod, E., Chmura, G. L., Bouillon, S., Salm, R., Björk, M., Duarte, C. M., Lovelock, C. E., Schlesinger, W. H., and Silliman, B. R.: A blueprint for blue carbon: Toward an improved understanding of the role of vegetated coastal habitats in sequestering CO2, Front. Ecol. Environ., 9, 552–560, https://doi.org/10.1890/110004, 2011.
Olmedo-Masat, O. M., Paula Raffo, M., Rodríguez-Pérez, D., Arijón, M., and Sánchez-Carnero, N.: How Far Can We Classify Macroalgae Remotely? An Example Using a New Spectral Library of Species from the South West Atlantic (Argentine Patagonia), Remote Sens.-Basel, 12, 3870, https://doi.org/10.3390/RS12233870, 2020.
Penuelas, J. and Filella, I.: Visible and near-infrared reflectance techniques for diagnosing plant physiological status, Trends Plant Sci., 3, 151–156, 1998.
Phinn, S. R., Roelfsema, C. M., and Mumby, P. J.: Multi-scale, object-based image analysis for mapping geomorphic and ecological zones on coral reefs, Int. J. Remote Sens., 33, 3768–3797, https://doi.org/10.1080/01431161.2011.633122, 2012.
Roelfsema, C., Phinn, S., Jupiter, S., Comley, J., and Albert, S.: Mapping coral reefs at reef to reef-system scales, 10s–1000s km2, using object-based image analysis, Int. J. Remote Sens., 34, 6367–6388, https://doi.org/10.1080/01431161.2013.800660, 2013.
Rowan, K. S.: Photosynthetic Pigments of Algae, 1st edition, Cambridge University Press, ISBN 521105943, 1989.
Traganos, D. and Reinartz, P.: Mapping Mediterranean seagrasses with Sentinel-2 imagery, Mar. Pollut. Bull., 134, 197–209, https://doi.org/10.1016/j.marpolbul.2017.06.075, 2018.
Vahtmäe, E. and Kutser, T.: Classifying the baltic sea shallow water habitats using image-based and spectral library methods, Remote Sens.-Basel, 5, 2451–2474, https://doi.org/10.3390/rs5052451, 2013.
Vahtmäe, E., Argus, L., Toming, K., Ligi, M., and Kutser, T.: Reflectance spectra of submerged aquatic vegetation (SAV) species and substrates from the Baltic Sea coastal waters, PANGAEA [data set], https://doi.org/10.1594/PANGAEA.971518, 2024.
Vimala, T. and Poonghuzhali, T. V.: Estimation of Pigments from Seaweeds by Using Acetone and DMSO, Int. J. Sci. Res., 4, 2319–7064, https://doi.org/10.13140/RG.2.2.35655.47524, 2013.