the Creative Commons Attribution 4.0 License.
the Creative Commons Attribution 4.0 License.
 | 21 Feb 2024
A quality-assured dataset of nine radiation components observed at the Shangdianzi regional GAW station in China (2013–2022)
Zhenfa Wang
Lin Qiao
Xiangdong Zheng
Junli Jin
Yinruo Li
Xiaomei Yin
Zhiqiang Ma
The New Baseline Surface Radiation (NBSR) system was established at the Shangdianzi (SDZ) regional Global Atmosphere Watch (GAW) station in 2013 to observe nine broadband radiation components, i.e. the global, direct, diffuse, and upwelling shortwave irradiance (GSWI, DSWI, DifSWI, and UpSWI); the photosynthetically active radiation (PAR); the ultraviolet irradiance (UVAI and UVBI); and the down- and upwelling longwave irradiance (DnLWI and UpLWI). To test the 1 min raw radiometric data, a Hybrid Algorithm for Radiation Data Quality Control (HARDQC) is presented in this study based on well-established methods, together with the solar irradiance dataset and the spectral features of the instrument bands. Subsequently, a NBSR dataset, which consists of radiation data at multiple timescales (i.e. 1 min, hourly, daily, monthly, monthly average hourly, and monthly average daily) over 2013–2022, is established and evaluated. Results show that more than 98.7 % of all radiation components passed the physical possibility test. The percentages of those that passed the extremely rare test are greater than 98.6 % for all radiation components except for the DnLWI (97.1 %). The percentages of those that passed the comparison test are greater than 83.3 % (GSWI), 78.3 % (DSWI), 81.7 % (DifSWI), 93.1 % (UpSWI), 88.9 % (PAR), 95.6 % (UVAI), 96.3 % (UVBI), 99.8 % (DnLWI), and 99.7 % (UpLWI), respectively. Due to data logger faults, removal of the instruments for calibration, and lightning strikes, some apparent data gaps in the upwelling radiation components (January 2015–August 2017) and all radiation components (December 2018; July to September 2021) were detected. Despite the existence of a few imperfections in the NBSR dataset, it is still reliable to apply it in many fields such as the validation of satellite products and numerical models, the investigation of relationships between radiation and atmospheric composition, and the detection of changes in the surface fluxes. The dataset described in this paper is available at https://doi.org/10.1594/PANGAEA.963330 (Quan et al., 2023b).
- Article
(5262 KB) - Full-text XML
- BibTeX
- EndNote


High-temporal-resolution ground-based radiation measurement plays a critical role in lots of applications such as verifying satellite retrievals (e.g. Yan et al., 2011; Zhang et al., 2013) and numerical model predictions (e.g. Nowak et al., 2008; García et al., 2014, 2018; Gueymard et al., 2016), establishing parameterization models (e.g. Yang et al., 2023), understanding the genesis and evolution of Earth's climate (e.g. Ohmura et al., 1998; Driemel et al., 2018), investigating global dimming/brightening (e.g. Wild et al., 2005, 2009), and assessing renewable energy technologies (e.g. Yang et al., 2022), as well as evaluating the influence of atmospheric components on energy budget (e.g. García et al., 2008; Mol et al., 2023). However, it is a hard task to accurately measure the high-temporal-resolution radiation components due to several constraints, for example, the malfunction of the instruments, inappropriate operating by the operators, inadequate calibration of the instruments, and lack of quality control (QC) approaches, as well as the influence of the adverse weather conditions (Ohmura et al., 1998; Younes et al., 2005; Journée and Bertrand, 2011; Vuilleumier et al., 2014). To support the research projects of the World Climate Research Programme (WCRP) and other scientific programmes, the World Meteorological Organization/International Council of Scientific Unions (WMO/ICSU) joint Scientific Committee for the WCRP proposed the establishments of the international Baseline Surface Radiation Network (BSRN) in October 1988 (Ohmura et al., 1998; Driemel et al., 2018). The BSRN was designed to offer a long-term high temporal resolution (1 min) of Earth's surface irradiance to validate satellite-based estimates of the surface radiation budget, to verify and improve radiation codes of climate models, and to monitor long-term changes in irradiance at the Earth's surface. The accuracy targets for BSRN shortwave irradiance measurements are 0.5 % for direct normal and 2 % for global or diffuse irradiance (McArthur, 2005). The BSRN operation started in 1992 at nine sites (Ohmura et al., 1998) and now consists of 76 stations (51 active, 9 declared as inactive, 16 are closed in 2023) situated in various climatic zones, covering a latitude range from 80∘ N to 90∘ S (https://bsrn.awi.de/nc/stations/maps/, last access: 25 April 2023). As a part of the BSRN, the Surface Radiation Budget Network (SURFRAD), which was established by the United States in 1993, has provided abundant high-temporal-resolution data of broadband solar and thermal infrared irradiance for satellite retrieval and modelling validation, climate and hydrology research since 1995 (e.g. Augustine et al., 2000; Yang and Boland, 2019). At present, seven SURFRAD stations are operating in climatologically diverse regions: Montana, Colorado, Illinois, Mississippi, Pennsylvania, Nevada, and South Dakota (https://gml.noaa.gov/grad/surfrad/overview.html, last access: 26 April 2023). Meanwhile, the US Atmospheric Radiation Measurement (ARM) programme is another famous network for monitoring surface radiation with the most rigorous procedures (e.g. Stokes and Schwartz, 1994; Ackerman and Stokes, 2003; Peppler et al., 2008).
In China, high-temporal-resolution (1 min or 3 min) radiation measurements merely date back to 1994 (Quan et al., 2021). Under the auspice of the Global Environment Facility of the United Nations Development Programme (UNDP-GEF), the China Meteorological Administration (CMA) established the first high-temporal-resolution radiation observations at the Mt. Waliguan (WLG) Global Atmosphere Watch (GAW) station in 1994. Up to now, the WLG has yielded a long-term (1994–2019) high-temporal-resolution dataset of the global shortwave irradiance (GSWI), diffuse shortwave irradiance (DifSWI), direct shortwave irradiance normal to the solar rays (DnSWI), and near-infrared solar irradiance (NirSWI) (e.g. Zhou, 2005; Wei, 2010; Quan et al., 2021). Apart from the WLG, three regional GAW stations of the CMA, i.e. the Shangdianzi (SDZ), Lin'an, and Longfengshan stations, began to perform high-resolution (1 min) observations of both short- and longwave radiation in 2005 (e.g. Song 2013; Quan et al., 2021). Furthermore, the CMA established a network entitled the “China Baseline Surface Radiation Network” (CBSRN) in 2013, which currently consists of seven stations, i.e. Mohe, Xilinhot, Yanqi, SDZ, Xuchang, Wenjiang, and Dali (e.g. Li et al., 2013; Yang et al., 2023). Apart from the CMA, the Chinese Academy of Sciences (CAS) established a Chinese Ecosystem Research Network (CERN) in 2004, in which both the shortwave radiation flux and the longwave radiation flux were recorded in 1 min resolution at 44 stations (e.g. Hu et al., 2007a, b, 2012; Liao et al., 2020; http://cern.ac.cn/1wljs/index.asp, last access: 15 May 2023). In particular, as a unique BSRN station in China, Xianghe (XH), which is operated by the Institute of Atmospheric Physics of CAS, has measured the radiation components for approximately 15 years (e.g. Driemel et al., 2018; Liu et al., 2023). The long-term measurements at XH have been applied in many scientific fields (e.g. Yu, 2006; Yu et al., 2008; Bai et al., 2018; Liu et al., 2021, 2022) as well as yielded a high-temporal-resolution (1 min) database of short- and longwave radiation (Liu et al., 2023). In addition, some high-resolution scientific research radiation stations were established by universities in China. For instance, the Semi-Arid Climate and Environment Observatory of Lanzhou University (SACOL) station (35∘34′ N, 104∘5′ E; 1965.8 m a.s.l.) and the Wuhan University station (30∘32′ N, 114∘21′ E; 30 m a.s.l.), which were established by Lanzhou University and Wuhan University, respectively, have a capability to provide high-temporal-resolution measurements of both short- and longwave radiation (e.g. Huang et al., 2008; Wang et al., 2014).
As one of the earliest regional GAW stations of the WMO in China, SDZ has been observing upward and downward shortwave and longwave broadband irradiances in 1 min resolution by means of two radiation observation systems since 2005. One is the so-called “Old Baseline Surface Radiation” (OBSR) system, which is mainly composed of the precision radiometers manufactured by the Eppley laboratory (e.g. the PSP pyranometer, the 8-48 pyranometer, the PIR pyrgeometer, and the NIP pyrheliometer) as well as the UV radiometer made by Kipp & Zonen (e.g. the UV-S-B-T radiometer). The other is entitled the “New Baseline Surface Radiation” (NBSR) system, which consists of precision radiometers made by Kipp & Zonen (e.g. the CMP11 pyranometer, the CHP1 pyrheliometer, the UV-S-AB-T radiometer), Hukseflux (e.g. the IR02 pyrgeometer), and Campbell Scientific Inc. (e.g. the Li190SB Quantum sensor). The NBSR system has been established to measure nine radiation components, i.e. the GSWI, DnSWI, DifSWI, ultraviolet irradiance in the spectral interval of 315–400 (UVAI) and 280–315 nm (UVBI), photosynthetically active radiation (PAR), upwelling shortwave irradiance (UpSWI), downwelling longwave irradiance (DnLWI), and upwelling longwave irradiance (UpLWI), since 2013. The OBSR system had been introduced by the CMA to observe seven radiation components (i.e. GSWI, DnSWI, DifSWI, UVBI, UpSWI, DnLWI, and UpLWI) at SDZ during 2005–2016. Therefore, it is probable to improve the consistency of long-term radiation data at the SDZ by comparing the simultaneous measurements from both the OBSR and the NBSR systems during the overlapping period (2013–2016). However, besides some previous investigations relevant for the measurements of the OBSR (Cheng et al., 2009; Quan et al., 2009a; Quan et al., 2010; Song, 2013), few studies have been carried out with respect to the observations of the NBSR. The aim of this study, thus, is to foster the utilization of the NBSR measurements in both scientific research field and operational applications via establishing a quality-assured dataset of nine radiation components at SDZ. This paper is organized as follows: the site and the associated instruments are depicted in Sect. 2. Section 3 describes the associated theoretical calculations and the QC procedures. Detailed descriptions of the establishment, the evaluation, and the potential application of the NBSR dataset are conducted in the Sect. 4. Finally, Sect. 5 is dedicated to the summary and discussions.
2.1 Site description
SDZ (40.65∘ N, 117.12∘ E; 293.3 m a.s.l.) is located in the centre of the Beijing–Tianjin–Hebei (BTH) region and south of the Yanshan, approximately 150 km northeast of downtown Beijing. Some medium-sized cities (e.g. Zhangjiakou, Chengde, Tangshan, Langfang, and Baoding) and the megacity Tianjin are circulated around it, and to its southeast is the Bohai Sea (Fig. 1a). The working area of SDZ is situated on the top of a hill in the county of Miyun in Beijing (Fig. 1b), which consists of a gradient observation tower (GOT), a vertical sounding area (VSA), a meteorological observation field (MOF), and a two-story detection and office building (DOB). Note that the measurements of meteorological elements as well as the UpSWI and UpLWI are conducted in the MOF, while the GSWI, DnSWI, DifSWI, PAR, UVAI, UVBI, and DnLWI are performed using the radiometers mounted on two brackets at the rooftop of the DOB. The MOF is located to the northwest of the DOB and has approximately the same elevation as the top of the DOB, which warrants the measurements for downward- and upward radiation at the same level.
Major land cover types of SDZ include conifer forest, chestnut trees, pear trees, and maize. Only small villages in mountainous areas have a sparse population within 30 km of SDZ. The anthropogenic emission is thus negligible, and the measurements at SDZ can be considered representative of the background status of the atmospheric components over northern China. SDZ was initially established by the CMA as a meteorological observation station in 1958 and became one of the earliest regional GAW stations of WMO in China in 1981 (Zhou et al., 2021).
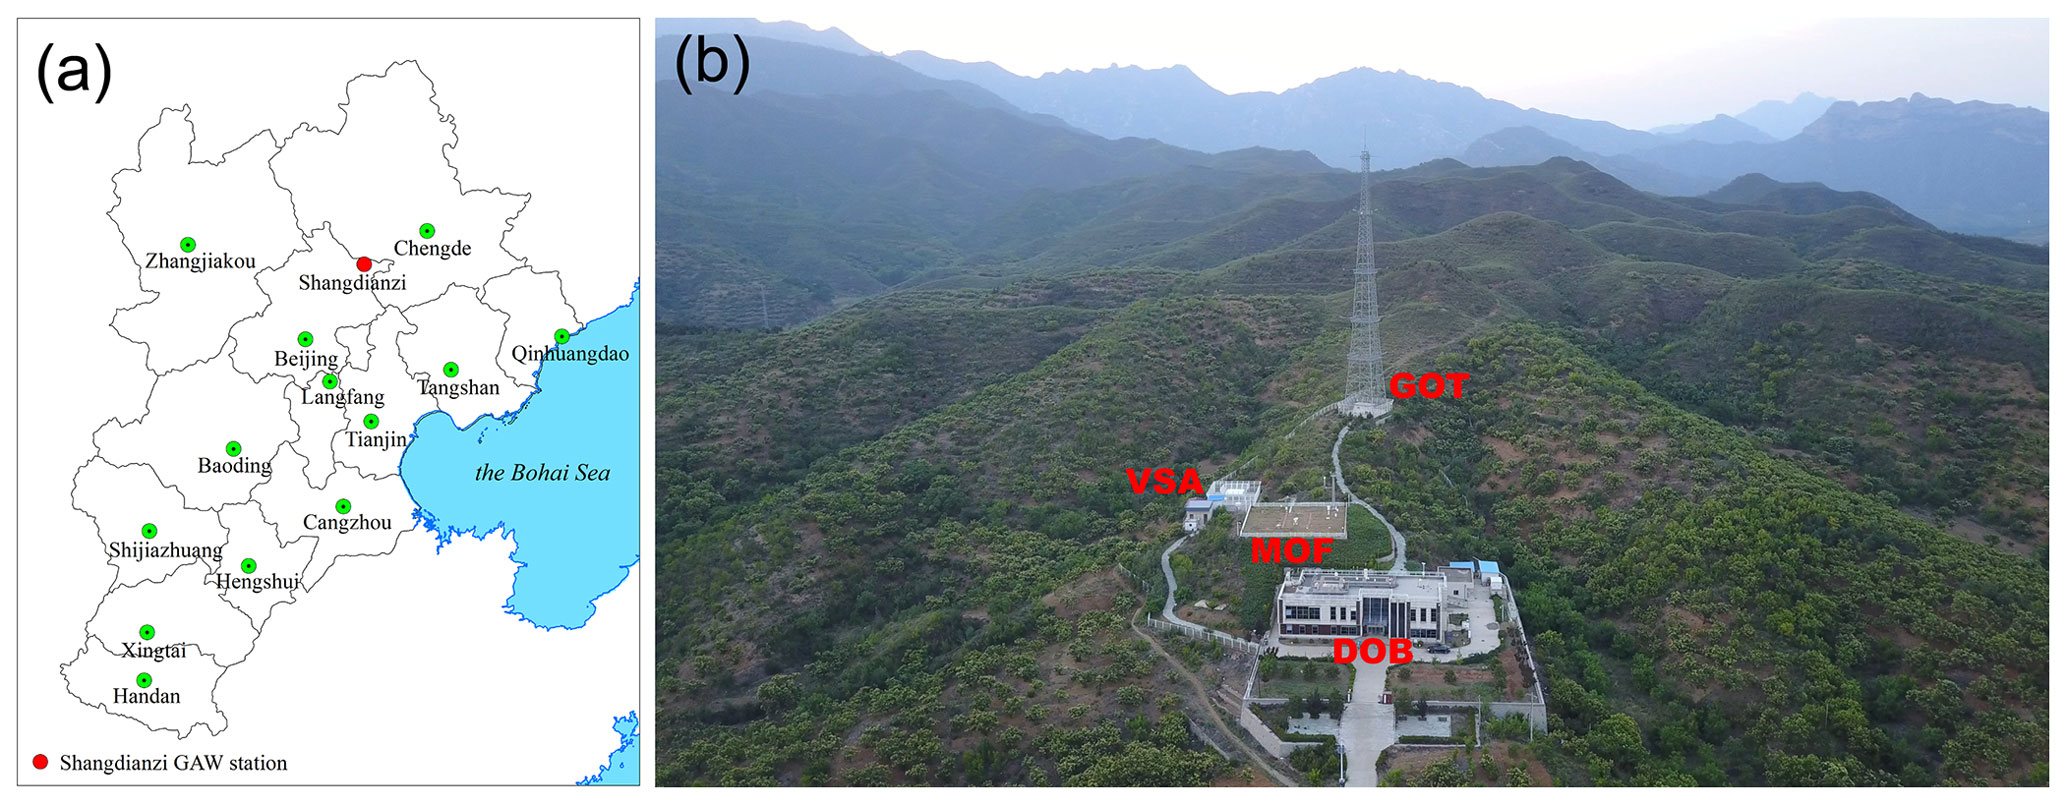
Figure 1Geographic location of SDZ in BTH (a) and a drone photo of the working area of SDZ (b), which consists of the GOT, the VSA, the MOF, and the DOB.
2.2 Irradiance measurements
2.2.1 Instruments and data storage
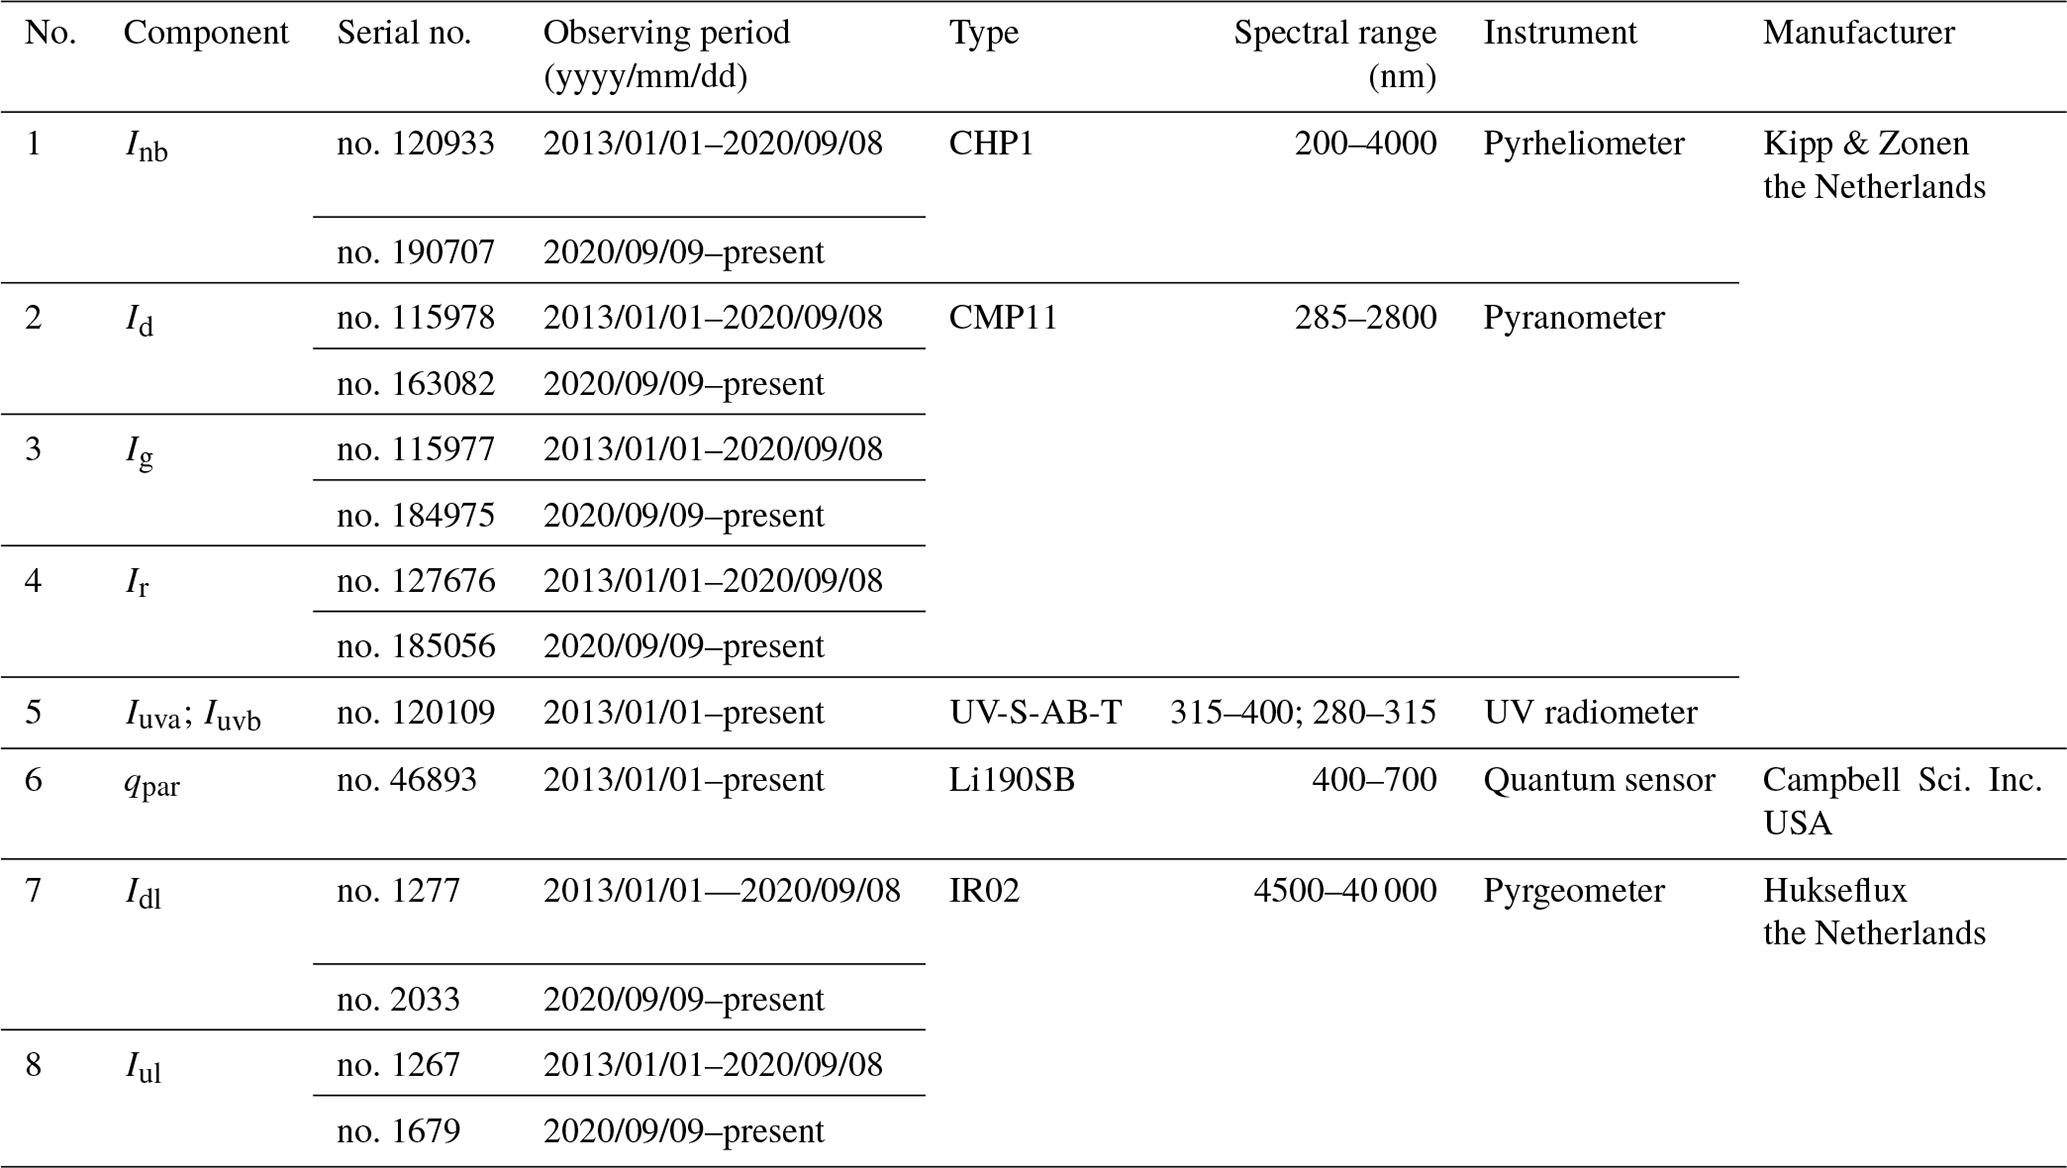
Figure 2 and Table 1 summarize the general characteristics of the instruments in the NBSR at SDZ. The DnSWI is measured by a CHP1 (Kipp & Zonen, the Netherlands) pyrheliometer (denoted with “1” in Fig. 2a), which is installed on a two-axis automatic sun tracker (FT-ST22) manufactured by the Jiangsu Radio Scientific Institute Co., Ltd., China. The FT-ST22 is mounted on a 1.5 m high off-white fibreglass grating on the rooftop of the DOB. The CHP1 is a widely used high-accuracy radiometer (response time <5 s; non-linearity <0.5 % yr−1) to measure direct normal solar irradiance in the range of 200–4000 nm (Table 1).
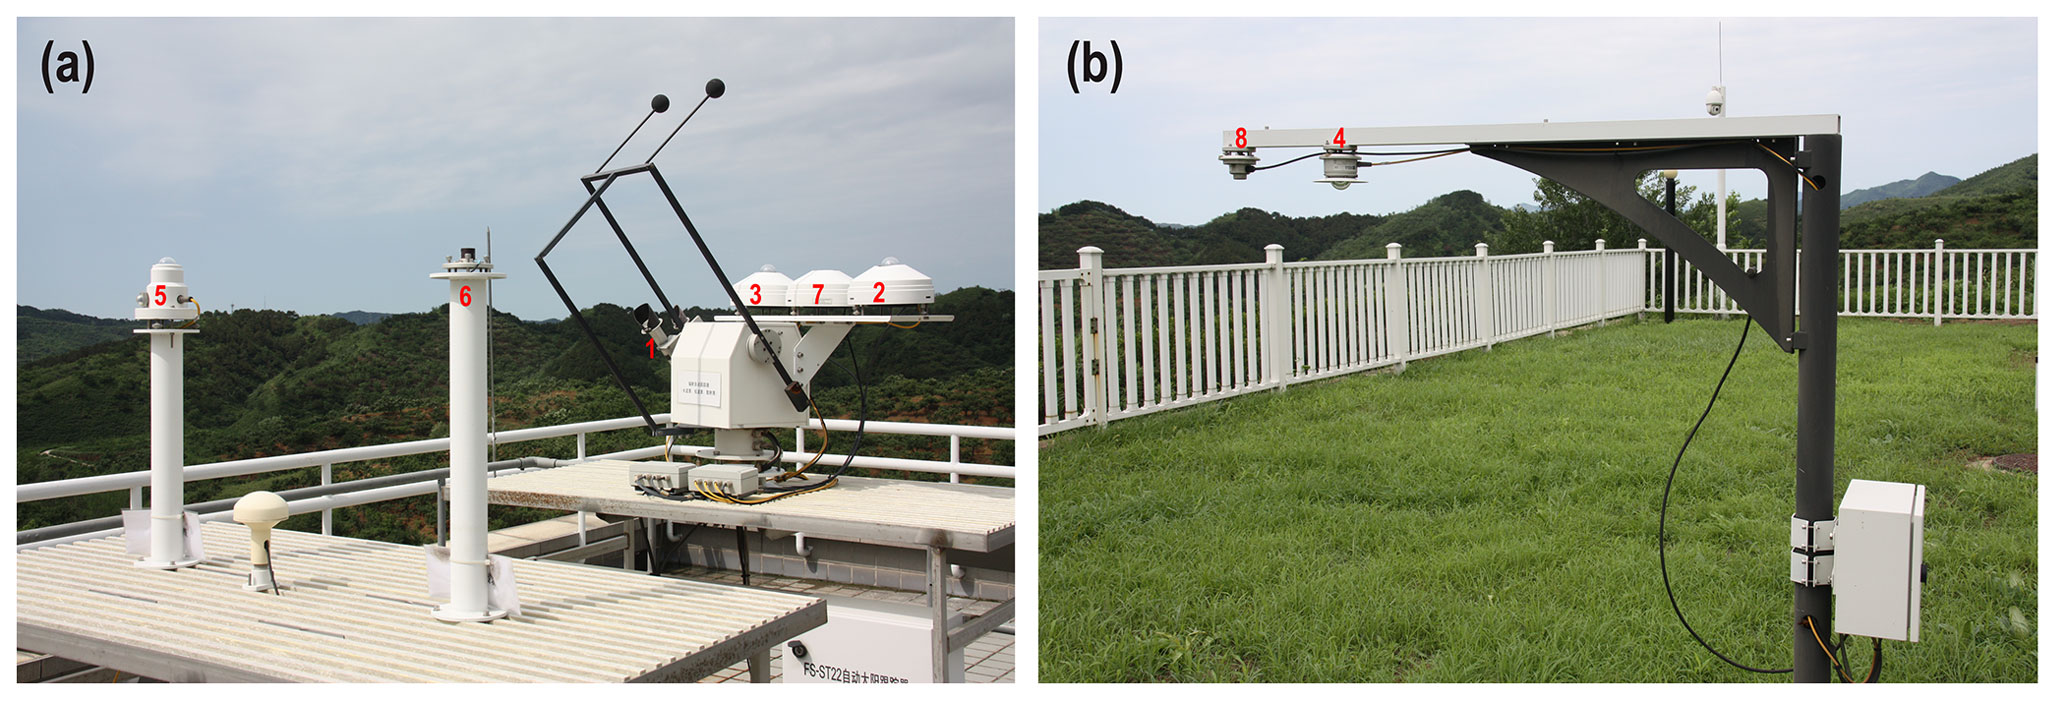
Figure 2Photos of the downward radiation measuring platform located on the rooftop of the DOB at SDZ (a) and the upward radiation measuring bracket rooted in the MOF (b). The CHP1 (no. 120933; no. 190707) pyrheliometer (denoted with “1”) is selected to measure the DnSWI. The face-up CMP11 (no. 115978; no. 163082) pyranometer (denoted with “2”) with shading and ventilation is used to measure the DifSWI. The face-up CMP11 (no. 115977; no. 184975) without shading but with ventilation (denoted with “3”) is utilized to observe the GSWI. The face-down CMP11 (no. 127676; no. 185056) with a glare screen kit (denoted with “4”) is adopted to observe the UpSWI. Both the UVAI and the UVBI are monitored by a UV-S-AB-T (no. 120109) broadband UV radiometer (denoted with “5”). The Li190SB quantum sensor (denoted with “6”) is used to observe the PAR. The face-up IR02 (no. 1277; no. 2033) pyrgeometer with shading and ventilation (denoted with “7”) is designated to observe the DnLWI. The face-down IR02 (no. 1267; no. 1679) without ventilation (denoted with “8”) is adopted to measure the UpLWI.
One face-up CMP11 (Kipp & Zonen, the Netherlands) pyranometer mounted on the FT-ST22 (denoted with “3” in Fig. 2a) is designed to measure the GSWI, while the other with a shade ball is used to record the DifSWI (denoted with “2” in Fig. 2a). To improve the reliability and accuracy of the radiation measurements, a ventilation and heating device is attached on the CMP11, which can alleviate the thermal offsets as well as automatically clean any dirt that may fall on the dome of the pyranometer such as snow, frost, precipitation, dust, and air pollutants. On the other hand, a face-down CMP11 (denoted with “4” in Fig. 2b) installed on the top of the 1.5 m high steel bracket on the MOF is allotted to measure the UpSWI. It has no ventilation and heating device but has an accessory glare screen kit, which protects the pyranometer dome from being illuminated by the direct solar irradiance at low solar elevation (e.g. <5∘) (Ohmura et al., 1998; Kipp & Zonen, 2016). The CMP11 meets the criterion of the ISO-9060 secondary standard pyranometer with a spectral range of 285–2800 nm (Table 1). Moreover, it has several new features and benefits such as low dome thermal offset error ( W m−2 at 5 K h−1 of temperature change), excellent cosine/directional response ( W m−2), outstanding long-term stability of sensitivity, and excellent linearity (non-linearity % yr−1) performance (Kipp & Zonen, 2016).
The DnLWI and UpLWI are measured by IR02 pyrgeometers (Hukseflux, the Netherlands) with a spectral range of 4.5–42 µm, which covers most of the spectrum of atmospheric longwave radiation. The face-up IR02 (no. 1277; no. 2033), which is mounted on the FS-ST22 automatic solar tracker and shaded with a shade ball (denoted with “7” in Fig. 2a), is used to measure the DnLWI. The shade ball prevents excessive heating of the dome by the sun and shields the sensor from receiving the infrared fraction of the solar beam (e.g. Philipona et al., 1998; Driemel et al., 2018), which is not part of the atmospheric longwave radiation (e.g. Enz et al., 1975). The temperature dependence of IR02 is within ±3 % (−10 to 40 ∘C), and a ventilation/heating system is installed beneath it to alleviate the influence of environmental temperature as well as to avoid dew/dust falling on its window. The face-down IR02 (no. 1267; no. 1679) installed on the bracket (denoted with “8” in Fig. 2b) is used to measure the UpLWI. Note that the field of view of the IR02 pyrgeometer is 150∘ rather than the desired 180∘, which decreases its price while keeping a relatively high accuracy (Hukseflux, 2022).
Besides the radiation components related to the surface radiation budget, other ancillary radiation components (e.g. the PAR, the UVAI, and the UVBI) are also monitored in this station. A dual-band ultraviolet radiometer UV-S-AB-T (Kipp & Zonen, 2012), which is mounted on the top of a 1.2 m high steel column on the other off-white fibreglass grating (denoted with “5” in Fig. 2a), is employed to simultaneously measure the ultraviolet radiation both in the spectra of UVA (315–400 nm) and UVB (280–315 nm). Meanwhile, a Li190SB quantum sensor (Campbell Scientific, Inc., USA) installed on the top of a 1.5 m high steel column on the same grating (denoted with “6” in Fig. 2a) is adopted to monitor the photosynthetic photon flux density (PPFD) in µmol s−1 m−2 (CSI, 2015). The PPFD reflects the number of photons in the 400–700 nm waveband received during a given time on a unit surface (Hu et al., 2007a).
On the other hand, a total of six proxy instruments (i.e. no. 190707, no. 163082, no. 184975, no. 185056, no. 2033, and no. 1679) were used to substitute their counterparts (i.e. no. 120933, no. 115978, no. 115977, no. 127676, no. 1277, and no. 1267) to measure the DnSWI, DifSWI, GSWI, UpSWI, DnLWI, and UpLWI after 9 September 2020 (Table 1).
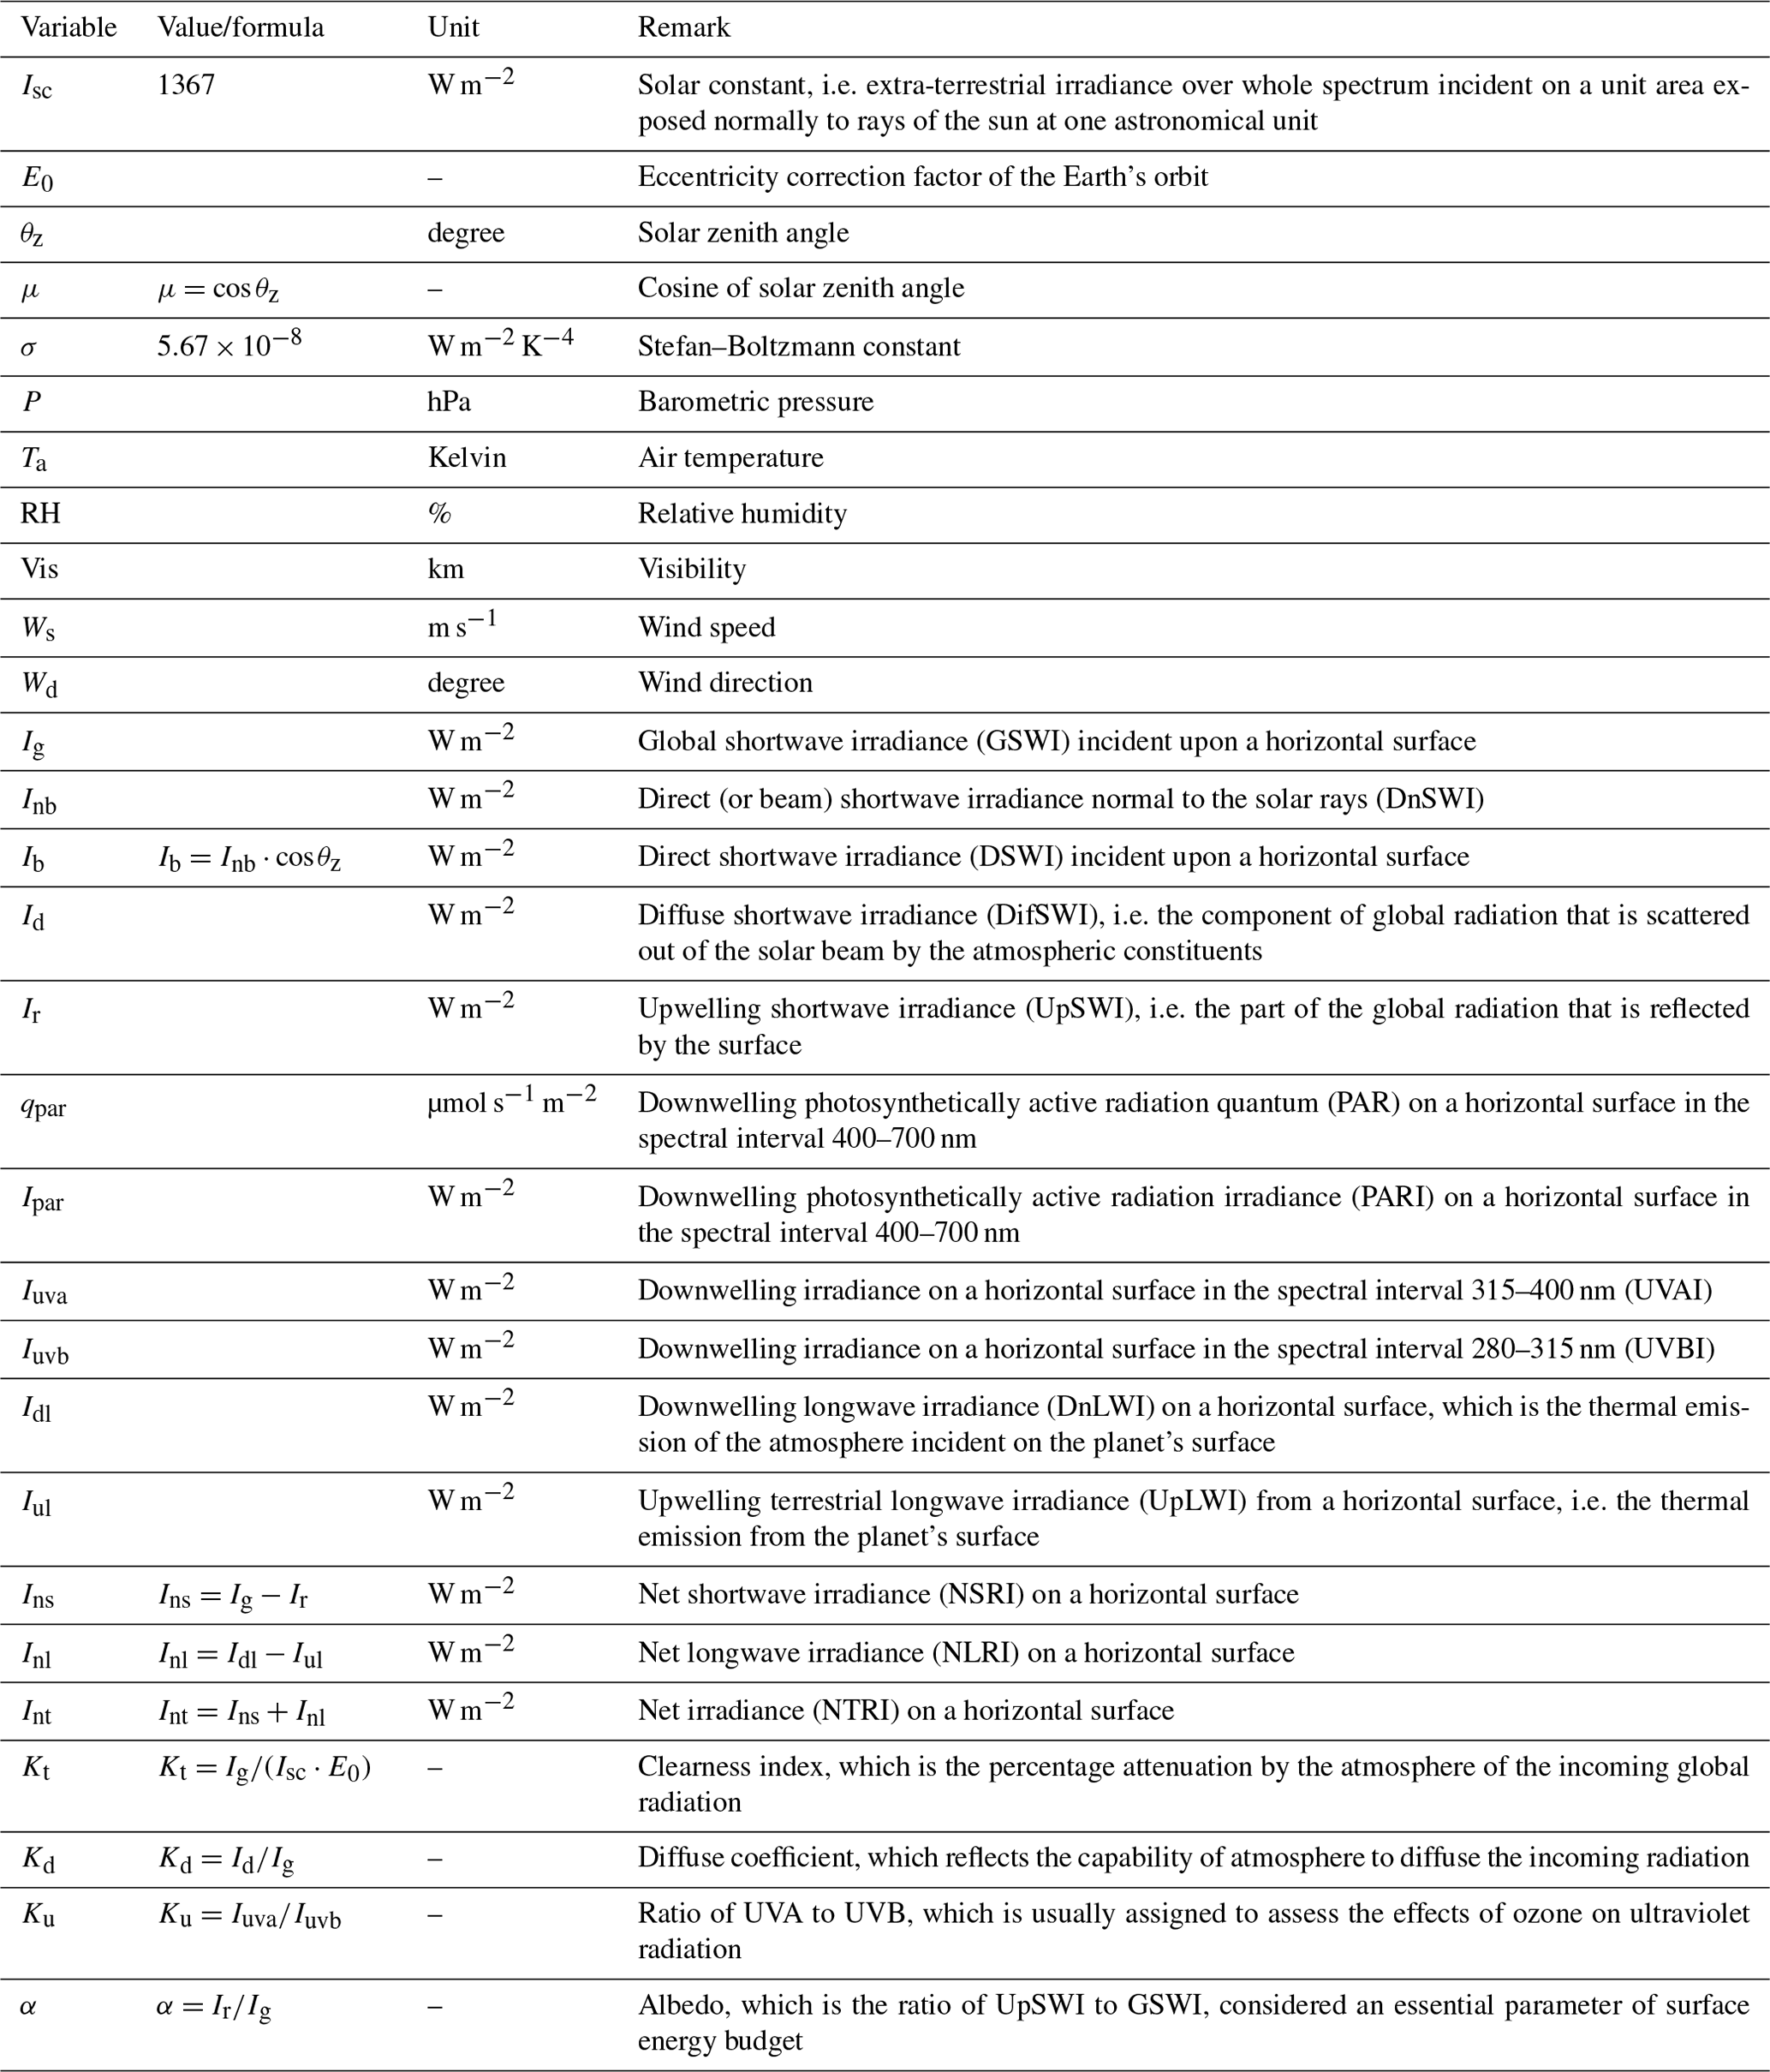
Table 1Brief summary of the instruments employed to measure nine radiation components at SDZ.
Definitions of radiation components in Table 1 are listed in the nomenclature (see Appendix). All radiation components are sampled every second, and 1 min statistics (i.e. the mean, minimum, maximum, and sample standard deviation) are recorded as a so-called station-to-archive file in the data logger of the NBSR (Jiangsu Radio Scientific Institute Co., Ltd., China). The relatively complex, strictly defined format of the station-to-archive file is intended to encapsulate both the data and all relevant metadata within a single ASCII file. The first record of the file is the fundamental information relevant for the observation including the station identifier; the observation date; the longitude, latitude, and elevation of the station; the installing heights; and the identifiers of the instruments. The actual data are stored starting with the second record in the file. The byte order of items is listed in Table 2.
Table 2Byte order of the actual data record in the station-to-archive file.
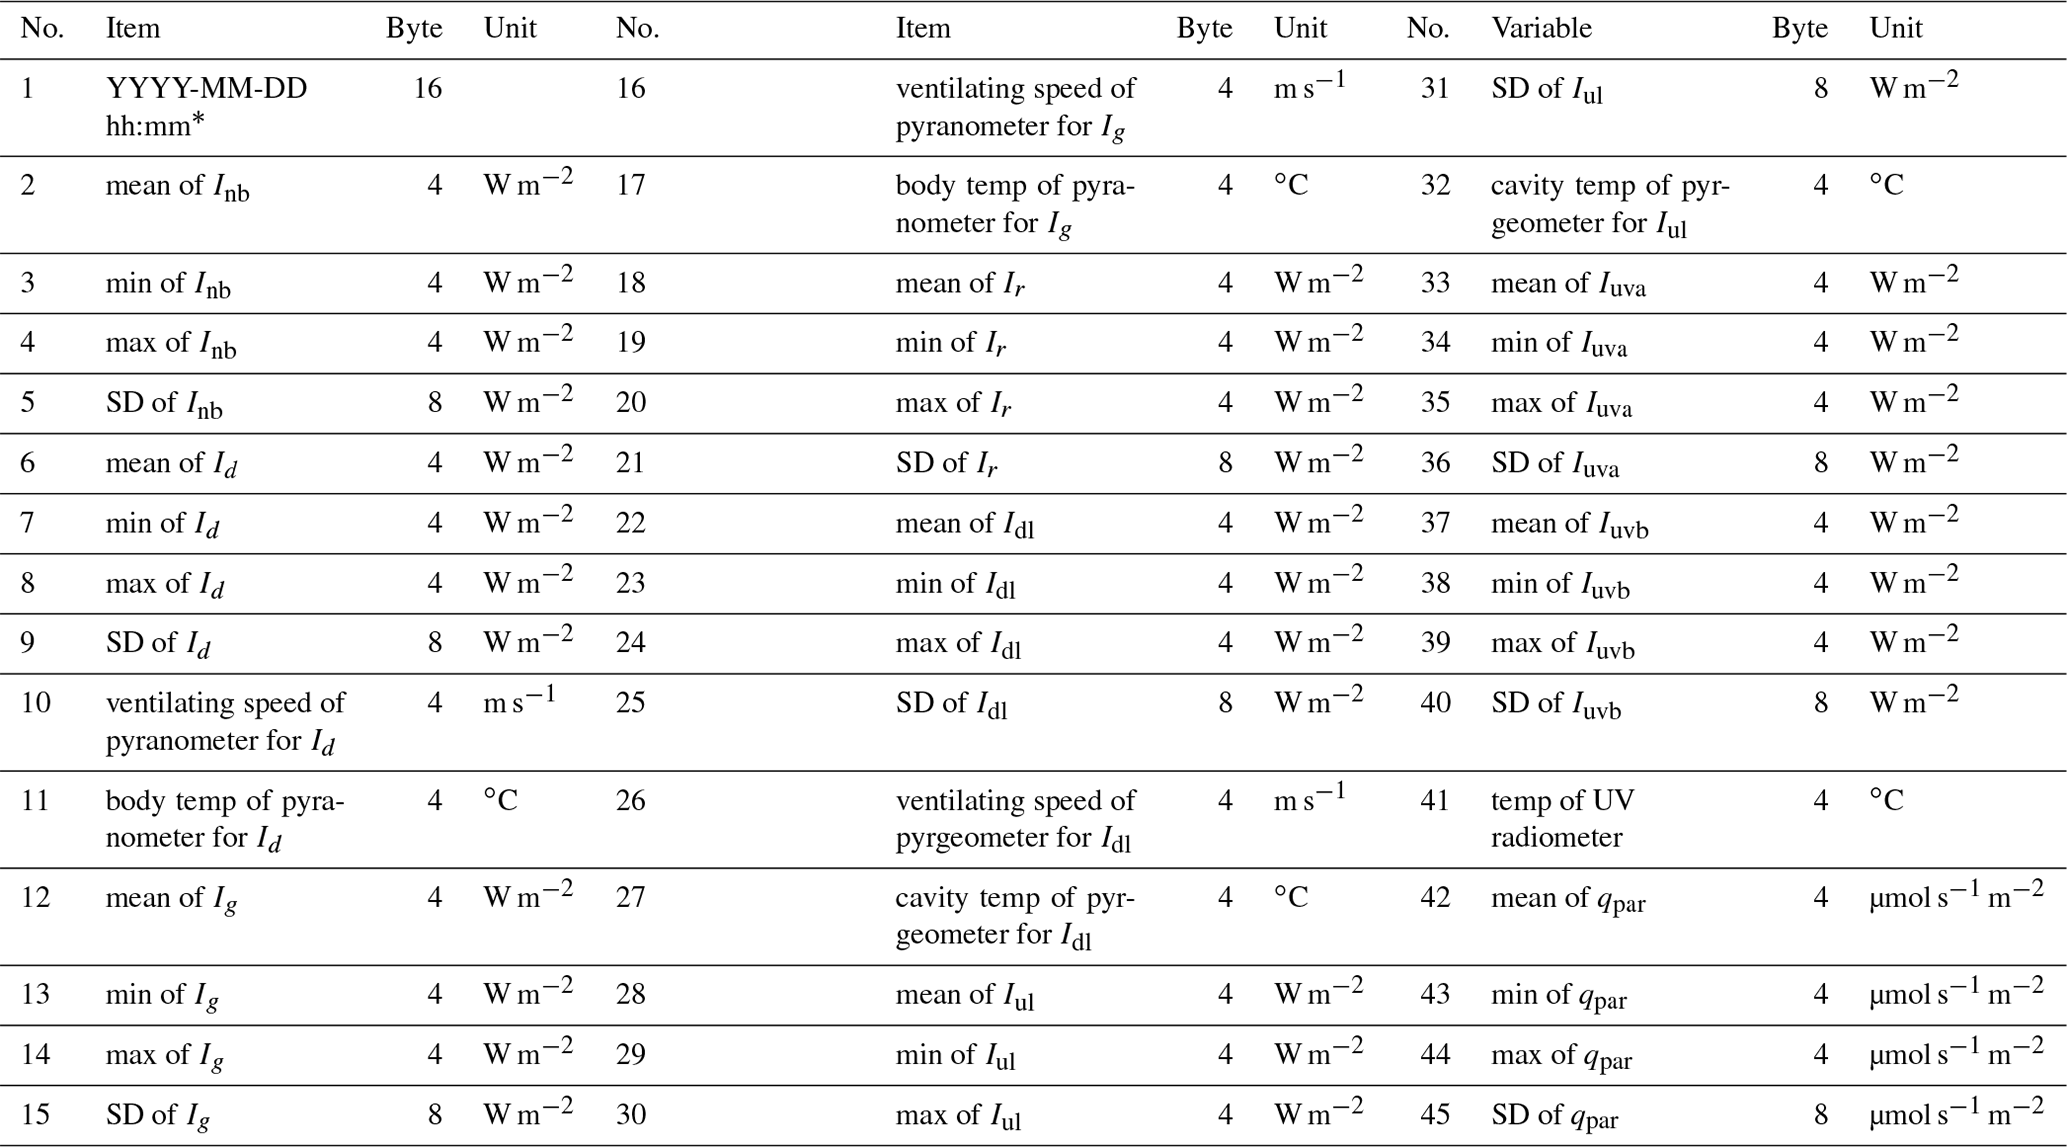
* True solar time.
2.2.2 Instrument maintenance and calibration
All instruments adopted in this study are carefully maintained by the operators at the SDZ, which includes regular cleaning of dust and snow deposited on the dome and replacing the desiccant in the instruments. In order to ensure the radiation measurements at the SDZ are traceable to the World Radiometric Reference, all instruments employed in the NBSR were sent to the manufacturer (Jiangsu Radio Scientific Institute Co., Ltd.) to be calibrated against the reference instruments (e.g. the CM21 pyranometer, the CHP1 pyrheliometer, the CGR4 pyrgeometer, the UVS-AB-T radiometer, and the Li-200190SB sensor). These reference instruments were compared against the national radiometric standards of China (e.g. the CM22 pyranometer, the H-F absolute cavity radiometer, the CG4 pyrgeometer), which were transferred from the World Radiation Center in Davos, Switzerland (e.g. Quan et al., 2010; Yang et al., 2015; PMOD/WRC, 2022; Yang et al., 2023).
Table 3 summarizes the instruments employed in the NBSR, the sensitivities of instruments, and the ratio of changes of sensitivities between two calibration campaigns. The original sensitivities of the instruments were supplied by the manufacturer before the installation in the NBSR. Subsequently, the first calibration of the instruments was performed by the manufacturer on 14 November 2018. It can be seen from Table 3 that the sensitivities of the pyrheliometer (no. 120933), the pyranometers (no. 115978, no. 115977, and no. 127676), and the pyrgeometers (no. 1277 and no. 1267) are relatively stable over the whole observation period, e.g. the ratio of change ranges from −0.4 % to 0.8 %. Nevertheless, the sensitivities of the UVS-AB-T radiometer (no. 120109) altered apparently, i.e. the ratios of sensitivity changes are 10.7 % and 14.7 % in the UVA and UVB band, respectively. The Li190SB quantum sensor (no. 46893) had a moderate sensitivity change ratio of −3.0 %. Additionally, six new instruments, which includes the pyrheliometer (no. 190707), the pyranometers (no. 163082, no. 184975, and no. 185056), and the pyrgeometers (no. 2033 and no. 1679), were utilized to replace their counterparts as listed in Table 3 on 19 August 2020.
Table 3The sensitivities of the instruments employed in the NBSR at SDZ.
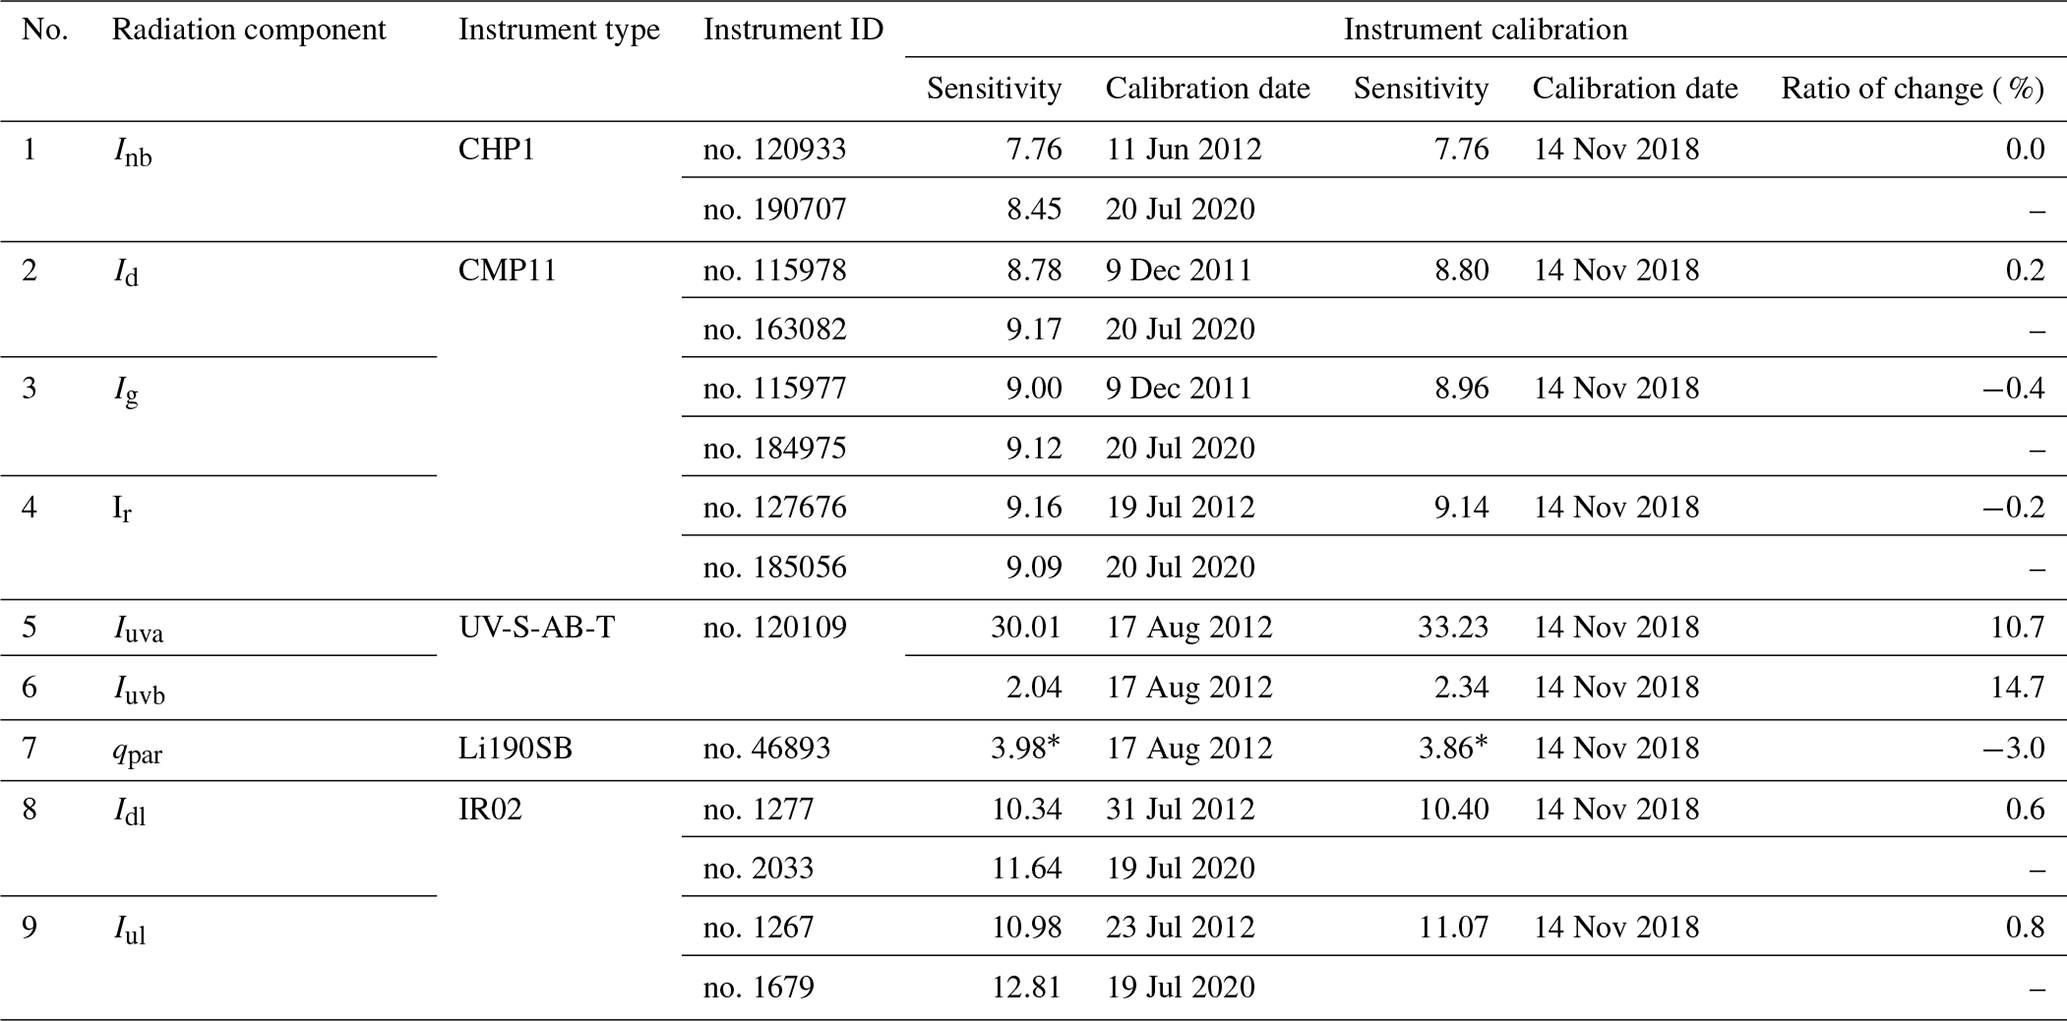
The unit of sensitivity marked with the symbol * is µv (µmol s−1 m−2)−1, otherwise the unit is µv (W m−2)−1.
2.3 Meteorological element measurements
Fundamental meteorological elements (e.g. near-surface air temperature, pressure, wind direction/speed, relative humidity, and visibility) are also measured at SDZ using an automatic weather station (AWS) in a 1 min interval and stored in a HY3000 data logger (Huayun Sounding Meteorological Technology Inc., China). The air temperature and relative humidity are detected by a humidity and temperature probe HMP 115 (Vaisala, Finland) mounted within an instrument shelter. Barometric pressure is detected via a PTB110 barometer (Vaisala, Finland), and the wind speed/direction is monitored by a cup anemometer mounted on the top of 10 m high tower in the MOF. A DNQ1 visibility meter (Huayun Sounding Meteorological Technology Inc., China) rooted on the MOF is adopted to measure the visibility (Li et al., 2021). The raw data of the meteorological elements are processed carefully by experienced engineers according to the standards of WMO to yield a high-quality meteorological dataset.
Apart from six radiation components (i.e. the GSWI, the DifSWI, the DnSWI, the UpSWI, the DnLWI, and the UpLWI) that can be quality controlled using the recommended methods of the BSRN (e.g. Long and Dutton, 2002; Long and Shi, 2008), the three other components (i.e. the PAR, the UVAI, and the UVBI) are also included in the NBSR. Therefore, a comprehensive QC scheme appropriate for all nine radiation components is presented in this study as follows.
3.1 Unit conversion of PAR observations
PAR is the solar radiation received at the Earth's surface in the visible electromagnetic spectrum (400–700 nm), and it can be expressed in energy units (W m−2) or in quantum units (µmol s−1 m−2) depending on the actual application (Hu et al., 2007a). In other words, the former is adopted when the energy aspect of radiation is required, while the latter is mostly applied in photobiology. As the photon energy is inversely proportional to its wavelength, the number of photons should decrease with the reduction of the wavelength in the case of radiative energy conservation. Thus, the ideal spectral response function of the quantum sensor should increase with wavelength rather than keep a constant value (denoted with the dashed lines in the Fig. 3a). The actual spectral response function of the Li190SB (denoted with the thick curve in the Fig. 3a) is fairly close to that of the ideal quantum response function with a systematic spectral error not exceeding 1 % (Ross and Sulev, 2000; CSI, 2015).
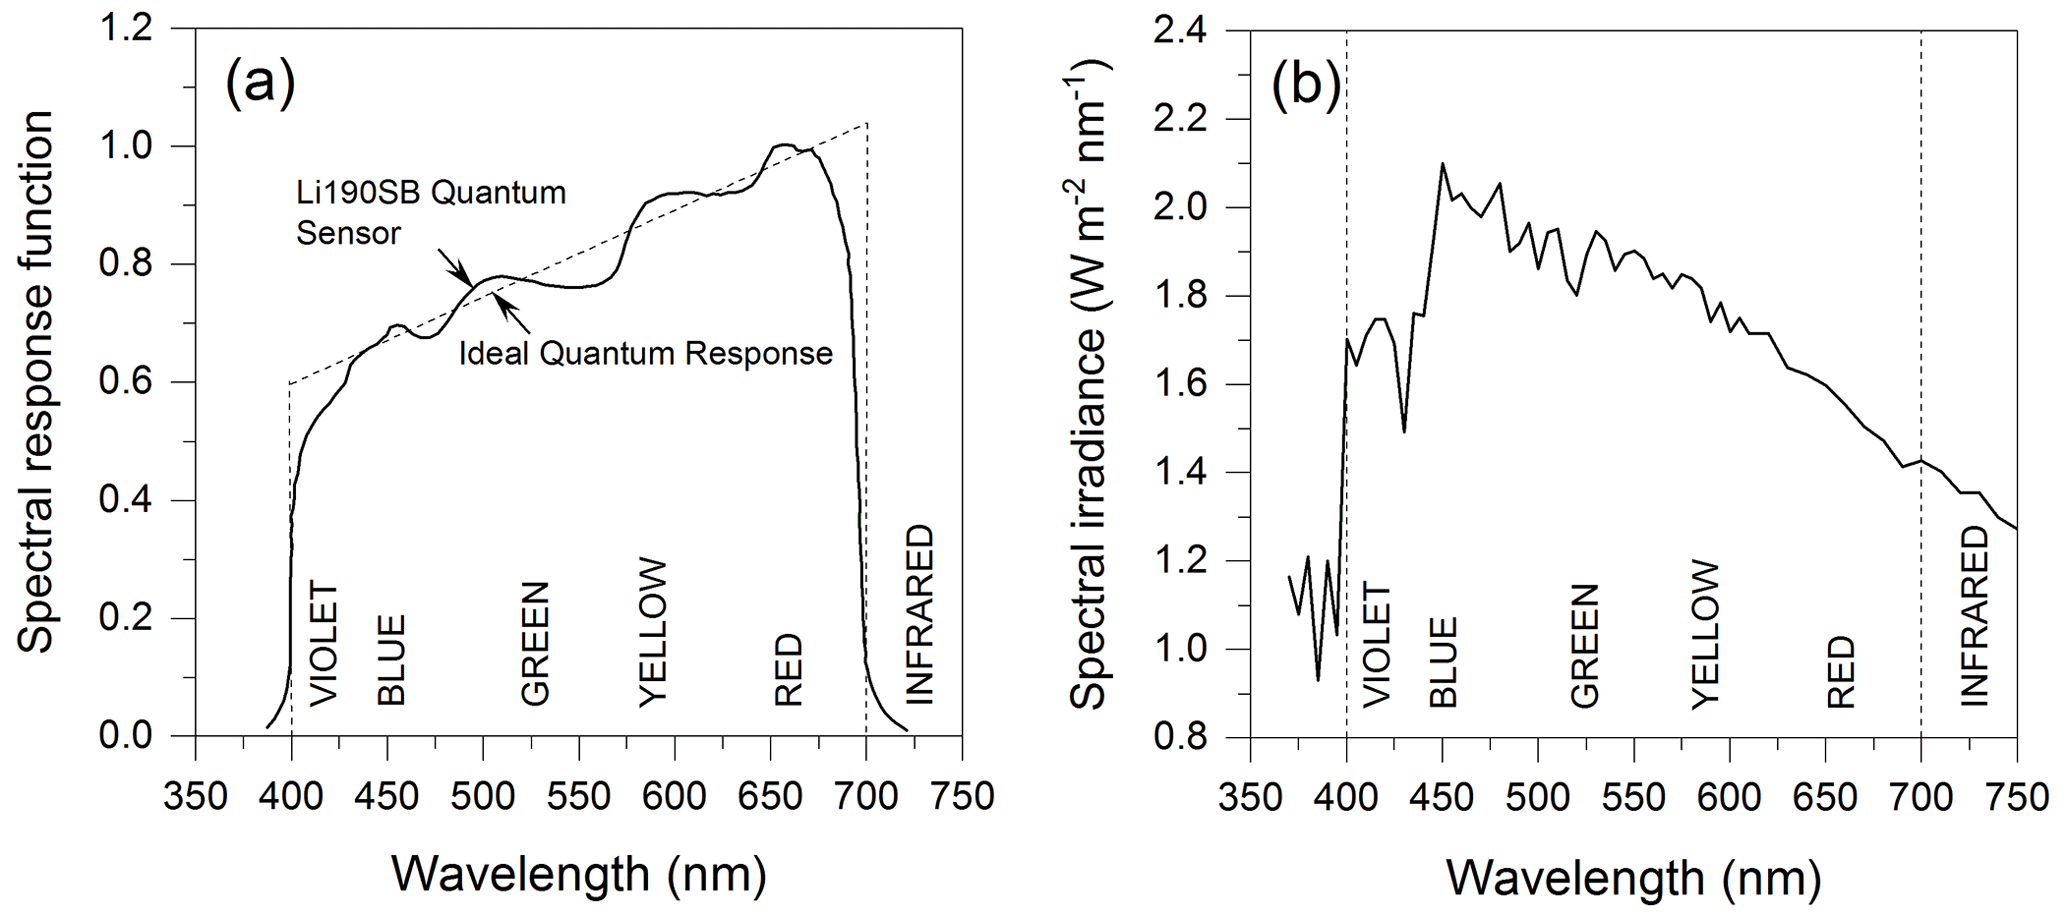
Figure 3Spectral response function of the Li190SB quantum sensor (a) and spectral irradiance in the spectral interval 400–700 nm (b). Data source of spectral irradiance: WRC spectrum (Iqbal, 1983).
The raw data of PAR observed by the Li190SB of NBSR at SDZ are recorded in the quantum units (µmol s−1 m−2), which can be converted to energy units (W m−2) according to the formula presented by Nie et al. (1992).
where Ipar is the PAR irradiance (PARI) at the land surface (W m−2); qpar is the PAR directly measured by the Li190SB (µmol s−1 m−2); h is Planck's constant ( J ⋅ s); c is the velocity of light ( nm s−1); Iλ is the spectral irradiance, which was derived from the WRC solar spectral irradiance dataset (Iqbal, 1983) and adopted in this study (see Fig. 3b); and λ is the wavelength in nanometres. After an integral calculation of the spectral irradiance, Eq. (1a) is simplified as
3.2 Calculation of eccentricity and solar zenith angle
During QC processing of the shortwave irradiance, two astronomical parameters (i.e. θz and E0) are required to provide the essential geographic location of the sun. E0 can be estimated in terms of the day number of the year using the formula presented by the Spencer (1971).
In this equation, Γ, in radians, is called the day angle. It is represented by
where dn is the day number of the year, ranging from 1 on 1 January to 365 on 31 December (Iqbal, 1983).
For a given geographical position, in the absence of the Earth's refractive atmosphere, the trigonometric relations between the sun and a horizontal surface are well known as follows (Iqbal, 1983):
where θz is the zenith angle in degrees; φ is the geographic latitude of the site in degrees, north positive; and δ is the declination, the angular position of the sun at solar noon with respect to the plane of the Equator, north positive, in degrees. Spencer (1971) presented the following expression for δ, in degrees:
This equation estimates δ with a maximum error <3′.
The ω in Eq. (4) is the hour angle, with noon zero and morning positive, which can be expressed in hours as follows (Iqbal, 1983):
3.3 Processing workflow of quality control
The QC of radiometric observations involves several tests, in which the measured irradiance is checked whether it passes the test by comparing it to the limits (Journée and Bertrand, 2011). Though the NBSR is well maintained and all instruments are regularly calibrated as well as the zero offsets in pyranometers and solar tracking precision being automatically amended via a built-in program in the data collector, some irrational records still exist due to the influence of adverse weather, operational mistakes, power failure, and data transmission interruptions, etc. Therefore, the QC procedure is essential in improving the quality of baseline surface radiation data as well as its potential application. To this end, a Hybrid Algorithm for Radiation Data Quality Control (HARDQC) is presented in this study to test the 1 min raw data of nine radiation components observed by the NBSR. Several previous QC approaches (e.g. Papaioannou et al., 1993; Long and Dutton, 2002; CMA, 2007; Hu et al., 2007a, b; Long and Shi, 2008) as well as the new presented limits, which were derived from a calculation based on the solar spectral irradiance dataset and the spectral response functions of the instruments, are incorporated in the HARDQC algorithm to fulfil the QC procedure for all nine radiation components. If a radiation record is detected by the HARDQC as a suspicious value, it is marked with a relevant flag but not deleted, which provides an option for the individual NBSR customers to decide how to effectively use the data depending on the aim of their work. Moreover, the QC procedure can also deliver necessary information for the operator to solve the related problems in the NBSR during the operation.
Figure 4 exhibits the flow chart of the QC algorithm for the 1 min raw data of the NBSR. First, the observation date, the latitude and longitude of SDZ, and the shortwave and longwave irradiance are extracted from the original record of the NBSR. Second, the eccentricity and solar zenith angle are calculated in terms of the observation time and the latitude and the longitude of the site using the empirical formulae (Iqbal, 1983). Third, the PARI is calculated from the PAR using Eq. (1b). Hereto, seven shortwave radiation components and two longwave radiation components have been processed to perform the QC algorithm. Fourth, the “physically possible limits test” is conducted on the basis of the input shortwave and longwave irradiances. The QC flag is set to if the measured irradiance exceeds the upper/lower limit in this step, otherwise, the procedure will proceed to the next step. Fifth, if the irradiance that has passed the physically possible limits test fails to pass the “extremely rare limits test”, then the QC flag will be set to 4 (greater than the upper limit) or 3 (less than the lower limit), otherwise, it enters the next step. Sixth, if the irradiance that has passed the previous tests does not pass the “comparison test between radiation components”, then the QC flag is set to 2 (greater than the upper limit) or 1 (less than the lower limit). Eventually, if the irradiance has passed all three tests, the associated QC flag is set to 0, which represents the best-quality data recording in the NBSR. Note that the air temperature is also involved in the comparison test between radiation components to assess the QC of the longwave irradiance.

Figure 4Flow chart of the HARDQC procedure based on the 1 min raw data observed by the NBSR.
3.3.1 Physically possible limits test
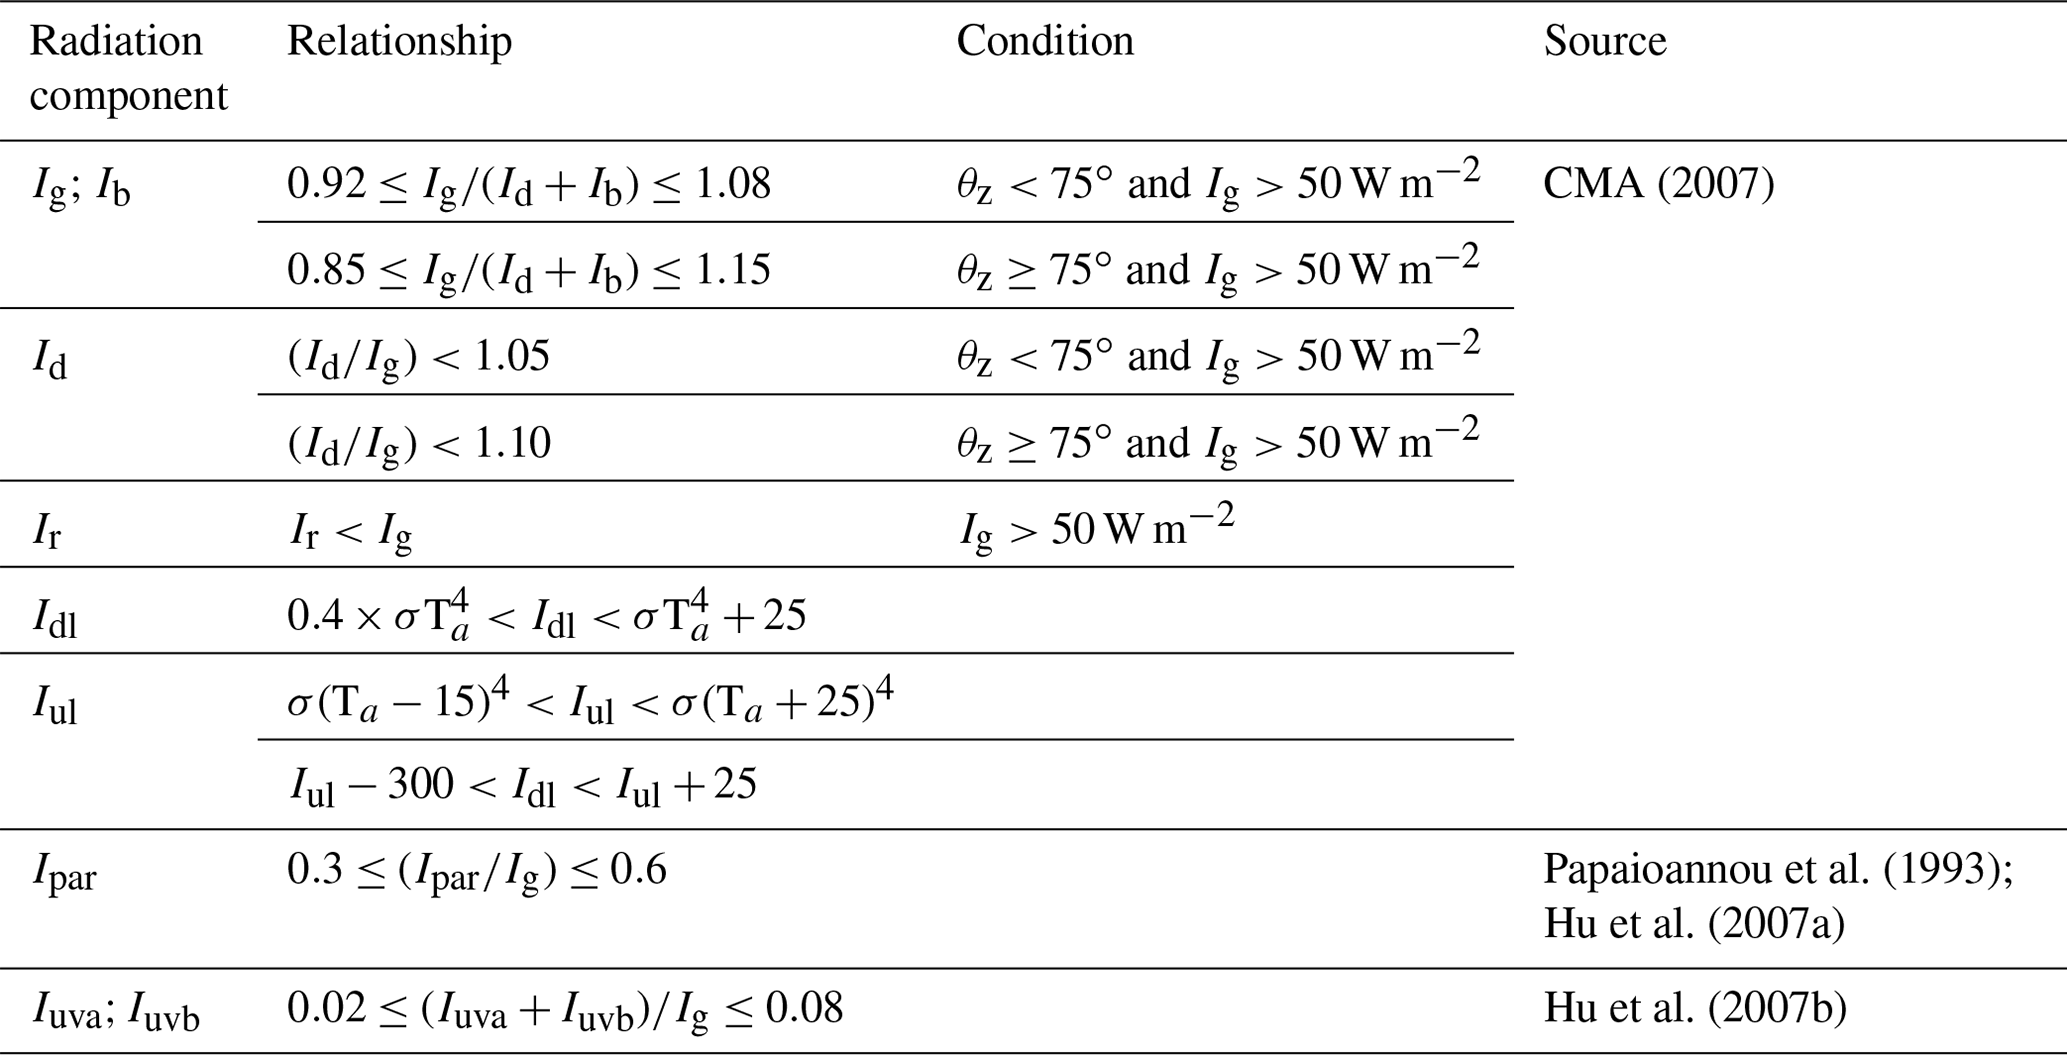
This is the first step of the HARDQC procedure conducted to detect extremely large observational errors and random errors associated with the data handling (e.g. Ohmura et al., 1998; Long and Shi, 2008). In this test, the irradiance that falls outside the limit is assigned a QC flag of 6 (above the maximum limit) or 5 (below the minimum limit). The lower and upper limits for nine radiation components in the physically possible limits text recommended in this study are summarized in Table 4.
Table 4Lower and upper limits in the “Possible physical limits test”.
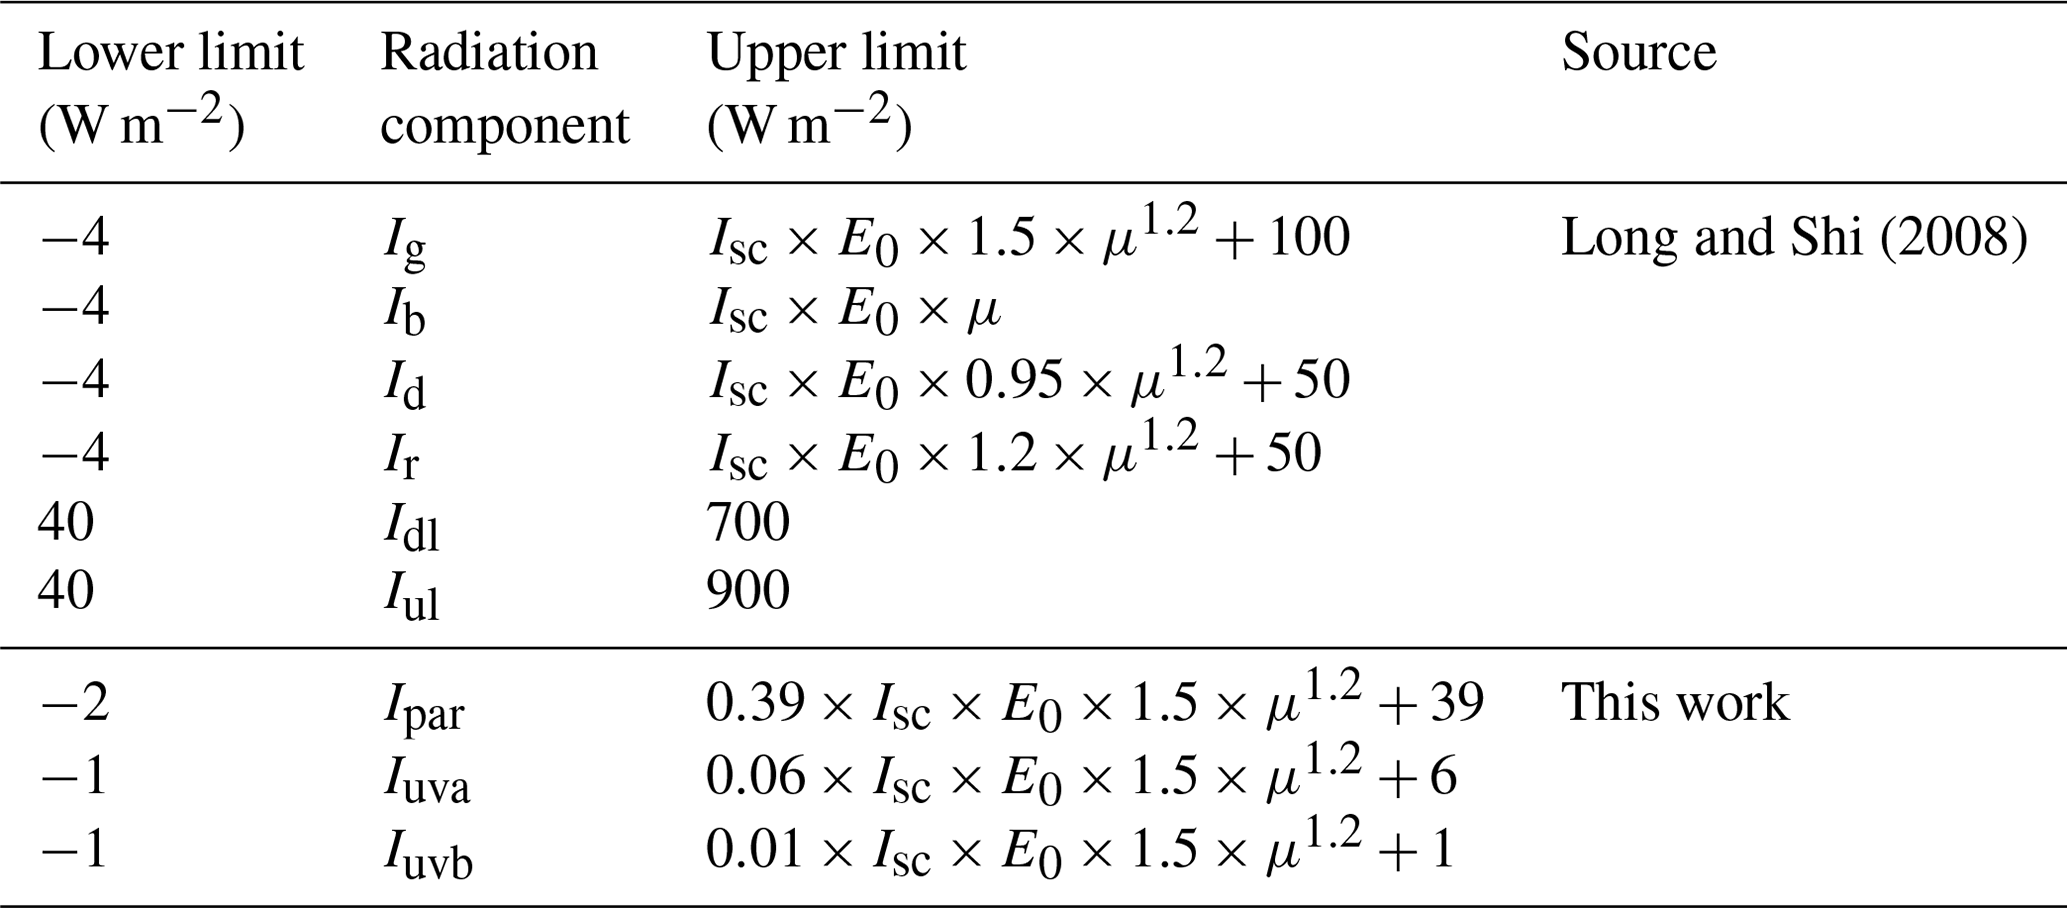
Table 4 shows that the limits for the GSWI, the direct shortwave irradiance incident upon a horizontal surface (DSWI), the DifSWI, the UpSWI, the DnLWI, and the UpLWI in this study are the same as those in the QC of the BSRN data recommended by Long and Shi (2008), but the limits for the PARI, the UVAI, and the UVBI were derived by scaling the solar constants over the spectrum of the PAR (533.7 W m−2), UVA (85.0 W m−2), and UVB (18.6 W m−2) to those over the whole spectrum (1367.0 W m−2). Namely, the corresponding coefficients of 0.39, 0.06, and 0.01 as well as the intercepts of 39, 6, and 1 W m−2 were adopted for modulating the upper limits of the PARI, the UVAI, and the UVBI, respectively. It is worth noting that the ratio (0.39) for PARI adopted in this study has been widely accepted in the previous studies (Smith and Gottlieb; 1974; Hu et al., 2007a). Meanwhile, the values of −2, −1, and −1 W m−2 were used as the lower limits for the PARI, the UVAI, and the UVBI in the physically possible limits test, respectively.
3.3.2 Extremely rare limits test
A more stringent test is the so-called extremely rare limits test, in which a radiation record is further checked to determine whether it falls outside the interval acquired from historical measurements at the similar time (Ohmura et al., 1998). If a radiation measurement has successfully passed the physically possible limits test but exceeds the upper/lower limit in this test, the corresponding QC flag of the measurement is set to , otherwise, the HARDQC procedure goes to the next step. The lower and upper limits of the extremely rare limits test employed in this study are presented in Table 5.
Table 5Lower and upper limits in the “Extremely rare limits test”.
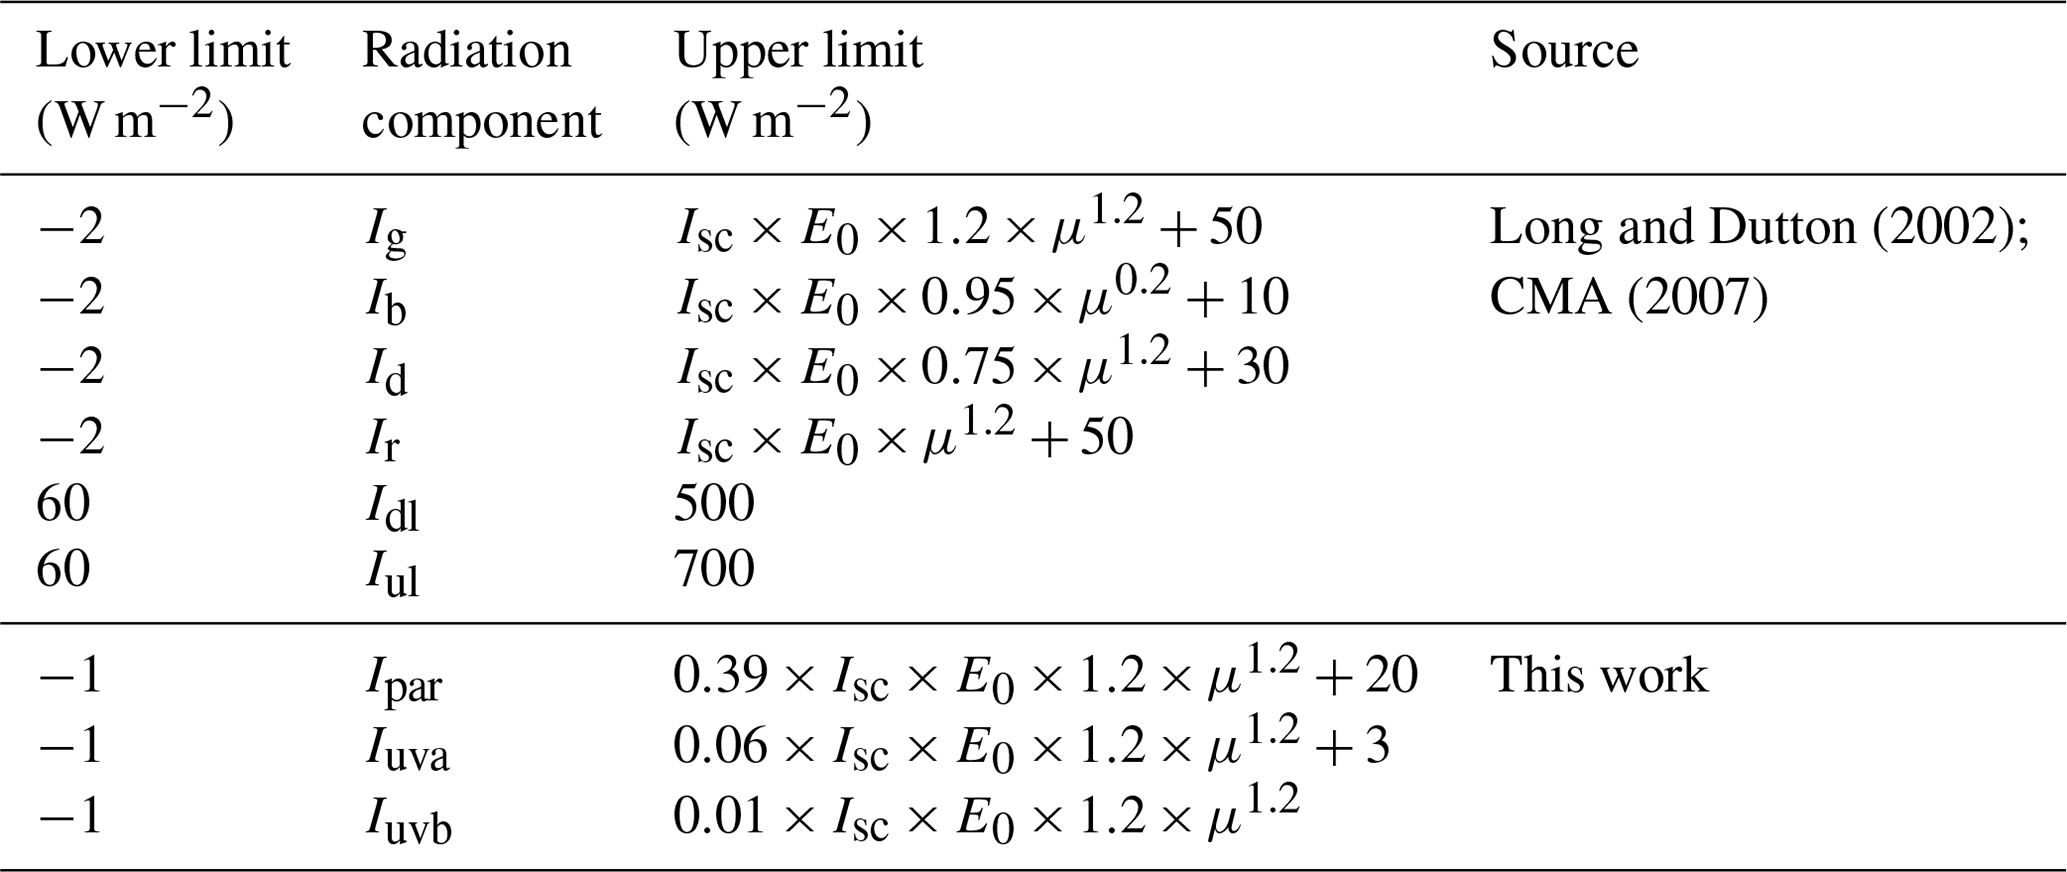
The limits for the GSWI, the DSWI, the DifSWI, the UpSWI, the DnLWI, and the UpLWI in this work are identical to those provided by the Long and Dutton (2002) and CMA (2007), while the limits for the PARI, the UVAI, and the UVBI presented in this study are derived according to the relationships between the solar constants over the spectrum of the PAR, the UVA, and the UVB and the whole solar spectrum.
3.3.3 Comparison test between radiation components
Several investigators (e.g. Ohmura et al., 1998; Michalsky et al., 1999; Augustine et al., 2000; Philipona, 2002; Gupta et al., 2004; Kratz et al., 2010) pointed out that some stable relationships exist between certain irradiances. For example, the global solar irradiance directly measured by a pyranometer should be similar to the sum of the simultaneous diffuse sky irradiance measured by a shaded pyranometer and the vertical part of the direct shortwave irradiance observed by a pyrheliometer. In practice, the gross differences between these two values often arise from inaccuracies in the solar tracker positioning or in the shading disc driver. Furthermore, the ultraviolet and PAR irradiance has a spectral correlation to the global solar irradiance (Hu et al., 2007a, b). On the other hand, the longwave irradiances are constrained by certain boundaries defined by functions of air temperature. Consequently, the comparison test between radiation components takes advantage of the relationships between the radiation components to examine unreasonable radiation measurements. In this test, the QC flag is set to if the irradiance exceeds the upper/lower limit, otherwise, it is set to 0, which represents the highest quality of the radiation data. The associated limits of the comparison test between radiation components in this study are presented in Table 6.
Table 6Test of comparison between relevant radiation components.
4.1 Establishment of the NBSR dataset
4.1.1 Process of the NBSR dataset construction
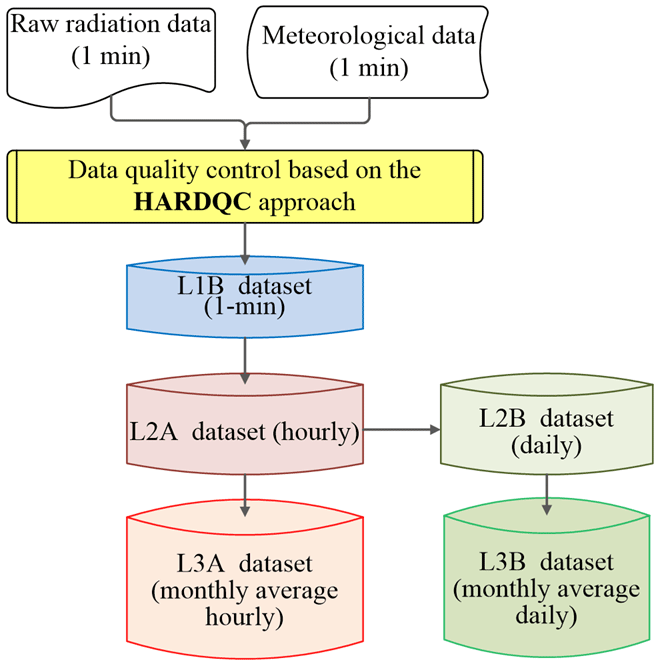
The NBSR dataset is composed of five multi-temporal resolution datasets, i.e. the 1 min (L1B), hourly (L2A), daily (L2B), monthly average hourly (L3A), and monthly average daily (L3B) datasets. Figure 5 shows the flow chart of the generation of the NBSR dataset as follows: at first, the HARDQC approach is applied together with the 1 min raw data of irradiance and meteorological elements to produce the L1B dataset. The L1B dataset contains a header record and six groups of actual data. Secondly, the hourly dataset (L2A) is derived from the L1B dataset using statistical methods. Note that only the 1 min radiation data with QC_flag ≤2 rather than the idealistic QC_flag = 0 were selected to calculate the hourly statistics (i.e. hourly mean, minimum, maximum, and standard deviation), which states a compromise between keeping as many hourly data samples as possible and ensuring that each hourly data has a relatively high quality. Thirdly, the daily dataset (L2B) is derived based on the L2A dataset, in which each daily data is computed in terms of the hourly data when the actual number of hourly data in a day is greater than 90 % of its maximum values in a day. At last, the L2A and L2B datasets are taken as input to yield the monthly average hourly dataset (L3A) and monthly average daily dataset (L3B) when the number of valid L2A and L2B files in a month is greater than 25 (Wang et al., 2007), respectively.
4.1.2 Structure and content of the NBSR dataset
The NBSR dataset is stored as a Hierarchical Data Format (HDF5) file owing to its high data access efficiency and portability. The HDF5 is a data storage format developed by the National Center for Supercomputing Applications (https://docs.hdfgroup.org/hdf5/develop/_u_g.html, last acess: 6 January 2002) and is widely applied in astronomy, Earth science, etc. The NBSR dataset contains six groups as follows:
-
time, in which the year, month, day, hour, and minute corresponding to the observation data are stored in Beijing time (BJT = UTC+8), the local standard time (LST), and the true solar time (TST), respectively;
-
astronomical variable, which consists of theoretical calculations of astronomical parameters such as the eccentricity correction factor of the Earth's orbit, solar zenith angle, and solar azimuth angle;
-
irradiance variable, which includes nine fundamental radiation components, i.e. the GSWI, DnSWI, DifSWI, UpSWI, PAR, UVAI, UVBI, DnLWI, and UpLWI, and the corresponding QC flags and, in addition, five additional radiation components, i.e. the DSWI, PARI, net shortwave irradiance (NSRI), net longwave irradiance (NLRI), and net irradiance (NTRI), which are derived from the fundamental radiation components and also included in this group.
-
atmospheric variable, which consists of three variables to depict the sky conditions, i.e. the clearness index, the diffuse coefficient, and the ratio of UVA to UVB;
-
surface variable, in which only one surface variable, i.e. the albedo derived from the UpSWI and the DnSWI, is available up to now;
-
meteorological variable, which contains simultaneous measurements of six meteorological near-surface variables, i.e. the air pressure, relative humidity, air temperature, visibility, wind speed, and wind direction, providing necessary auxiliary information for analysing the radiation data.
4.2 Assessment of the NBSR dataset
4.2.1 Data gaps and data integrity of the NBSR dataset
Figure 6 exhibits the time series of daily irradiance of nine radiation components observed at SDZ during 2013–2022, in which five apparent data gaps existed. The first data gap occurred in the period from 23 January 2015 to 24 August 2017 (denoted with 1 in Fig. 6), in which both the UpSWI and the UpLWI were improperly recorded due to an error setting of the data logger. This problem was not founded until 24 August 2017, when the first QC was performed on the raw data of the NBSR. The second data gap appeared in the period from 6 November to 5 December 2018, in which all instruments were unloaded and sent to the manufacturer (Jiangsu Radio Scientific Institute Co., Ltd.) to calibrate against the reference instruments (denoted with 2 in Fig. 6). The calibration of instruments essentially improved the reliability of measurements of the NBSR, but it bought a data gap in data time series in 2018. Due to the failure of the motherboard in the data logger caused by a lightning strike on 1 June 2020, the third data gap appeared in the UpSWI and the UpLWI from 1 June to 26 July 2020 (denoted with 3 in Fig. 6). Moreover, the measurements of the DifSWI (from 12 May to 28 June 2021), the UVBI (from 18 July to 13 September 2021), and the UpSWI and UpLWI (from 17 July to 11 October 2021) were interrupted due to the malfunction of the pyranometers (no. 163082 and no. 185056), UV-S-AB-T sensor (no. 120109), and pyrgeometer (no. 1679). Unfortunately, a lightning strike that occurred on 25 May 2022 resulted in a lack of measurements for all radiation components from 25 May to 1 July 2022 (denoted with 5 in Fig. 6).
The daily irradiance series reveals that all radiation components have a significant inter-annual variation and periodic features over the entire observation period (Fig. 6). Compared with the shortwave irradiance, the fluctuation of the longwave irradiance (Fig. 6d; i) is relatively smooth because the former is prone to be disturbed by the clouds, aerosols, water vapour, and gases in the atmosphere (Opálková et al., 2019; Wang et al., 2021). It is interesting that the snow cover can be identified via an abrupt increase in the UpSWI, owing to its high albedo that remarkably augment the upwelling shortwave irradiance (Fig. 6h).
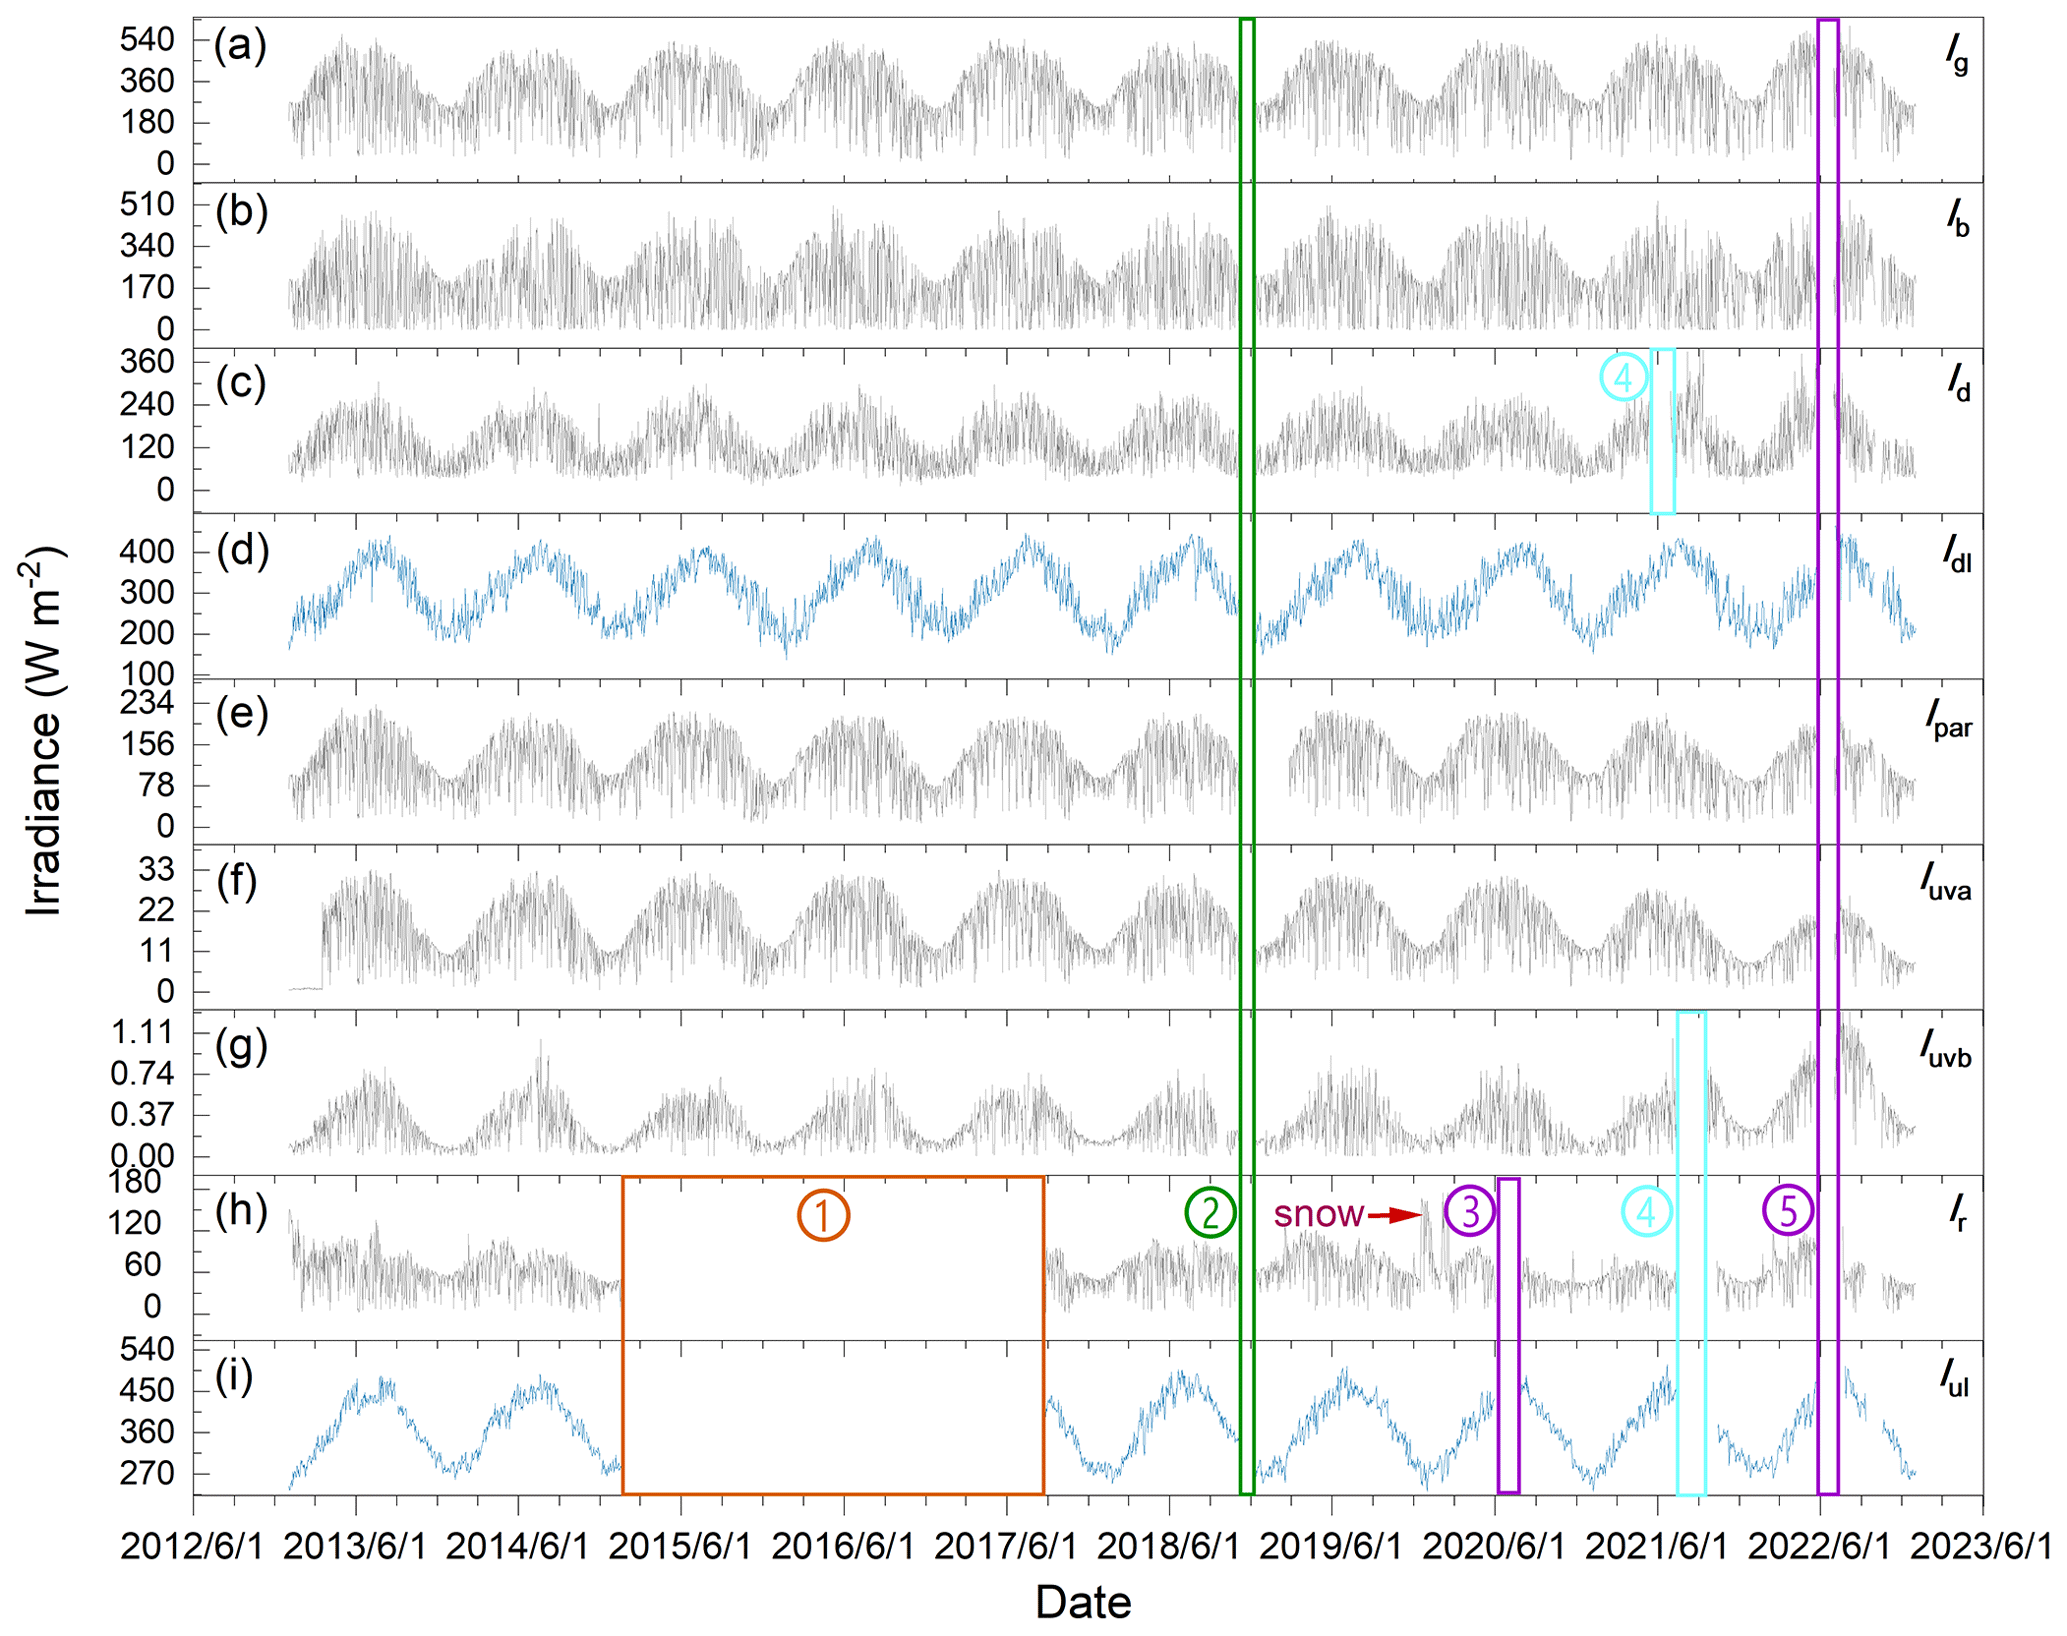
Figure 6Time series of daily GSWI (a), DSWI (b), DifSWI (c), DnLWI (d), PARI (e), UVAI (f), UVBI (g), UpSWI (h), and UpLWI (i) observed by the NBSR from 1 January 2013 to 31 December 2022.
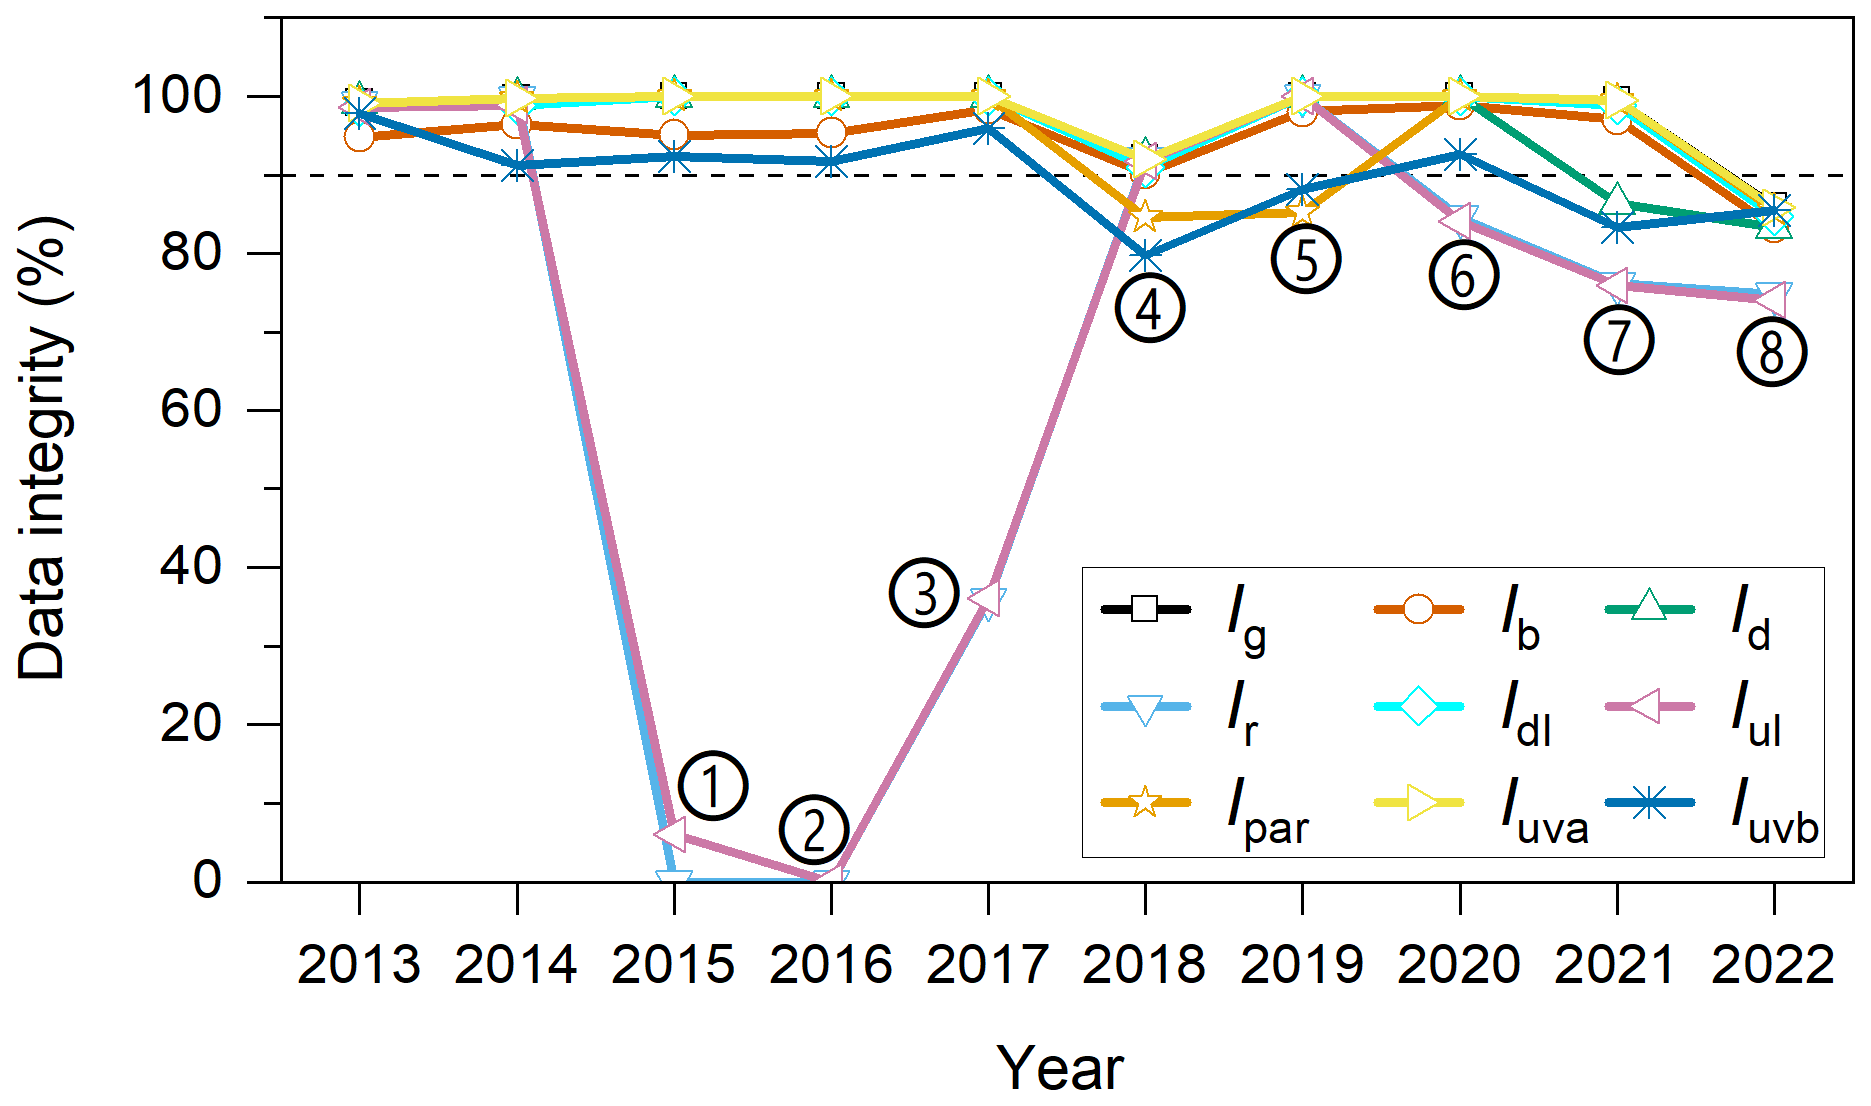
Data integrity, which is defined as a ratio of the number of actual valid radiation records to the total record number in a year, was introduced to elucidate the completeness of the radiation dataset in this study. Figure 7 indicates that most of the radiation components observed by the NBSR have data integrity >90 % over the entire period except for eight unusual cases. For instance, affected by the error setting of the data logger as mentioned above, the UpSWI/UpLWI has three extraordinarily low data integrities occurring in 2015 (0.0 %/6.0 %), 2016 (0.0 %/0.0 %), and 2017 (35.9 %/36.2 %) (denoted with 1–3 in Fig. 7). Influenced by the instrument calibration performed in 2018 (denoted with 4 in Fig. 7), the data integrities of all radiation components declined to some extent, especially for those of PARI (84.7 %) and UVBI (79.7 %). In addition, the low data integrities of the PARI (85.2 %) and UVBI (88.2 %) in 2019 were mainly attributed to the malfunction of the Li190SB (no. 46893) and the UV-S-AB-T (no. 120109) instruments (denoted with 5 in Fig. 7). The lightning strike that occurred on 1 June 2020 at SDZ shrank the data integrity of UpSWI/UpLWI to 84.7 % and 84.1 % in 2020, respectively (denoted with 6 in Fig. 7). As a consequence of malfunction of the pyranometers (no. 163082, and no. 185056), the pyrgeometer (no. 1679), and the UV-S-AB-T sensor (no. 120109) occurring in 2021, the data integrities of DifSWI, UVBI, UpSWI, and UpLWI were 86.3 %, 83.3 %, 76.2 %, and 75.9 %, respectively (denoted with 7 in Fig. 7). Note that the data integrities of all radiation components were less than 90 % in 2022, primarily affected by the data logger fault rooted in a lightning strike that occurred on 25 May 2022 at SDZ (denoted with 8 in Fig. 7).
4.2.2 Assessment of the QC of the NBSR dataset
Theoretically, the maximal number of 1 min raw data of the longwave radiation component is 525 600 in a common year or 527 040 in a leap year, and the number of the shortwave radiation component data is approximately half of that of the former because of the null values recorded for the shortwave radiation during nighttime. However, the number of actual measurements of radiation is less than the theoretical value due to disturbances such as instrument failure, incorrect operation, and synoptic events. Figure 8a indicates that the DnLWI was almost continuously observed by the NBSR over the whole period, with a data number varying from 480 148 (in 2018) to 527 035 (in 2016). Nevertheless, the UpLWI suffered serious deficits in 2016, 2015, and 2017, and the corresponding data numbers are 0, 30 866, and 186 643, respectively. The GSWI has been observed nearly undisturbed over the whole period, with a data number per year varying from 217 138 (in 2022) to 263 649 (in 2019). Similar to the GSWI, the DifSWI has also been uninterruptedly measured during the entire period with a total number per year from 209 724 (in 2022) to 263 337 (in 2019). Affected by the occasionally inaccurate solar tracking of the FT-ST22, the actual valid data number of the DSWI ranges from 170 168 (in 2022) to 212 109 (in 2017). In addition, the valid data number of the PARI is from 132 939 (in 2021) to 182 273 (in 2016), and the data number of the UVAI/UVBI ranges from 81 162 (in 2014) to 146 007/144 830 (in 2017). On the other hand, the UpSWI has lower data numbers in 2016 (0), 2015 (11 409), and 2017 (79 053) due to the influence of the error setting in the data logger but more than 185 666 in other years.
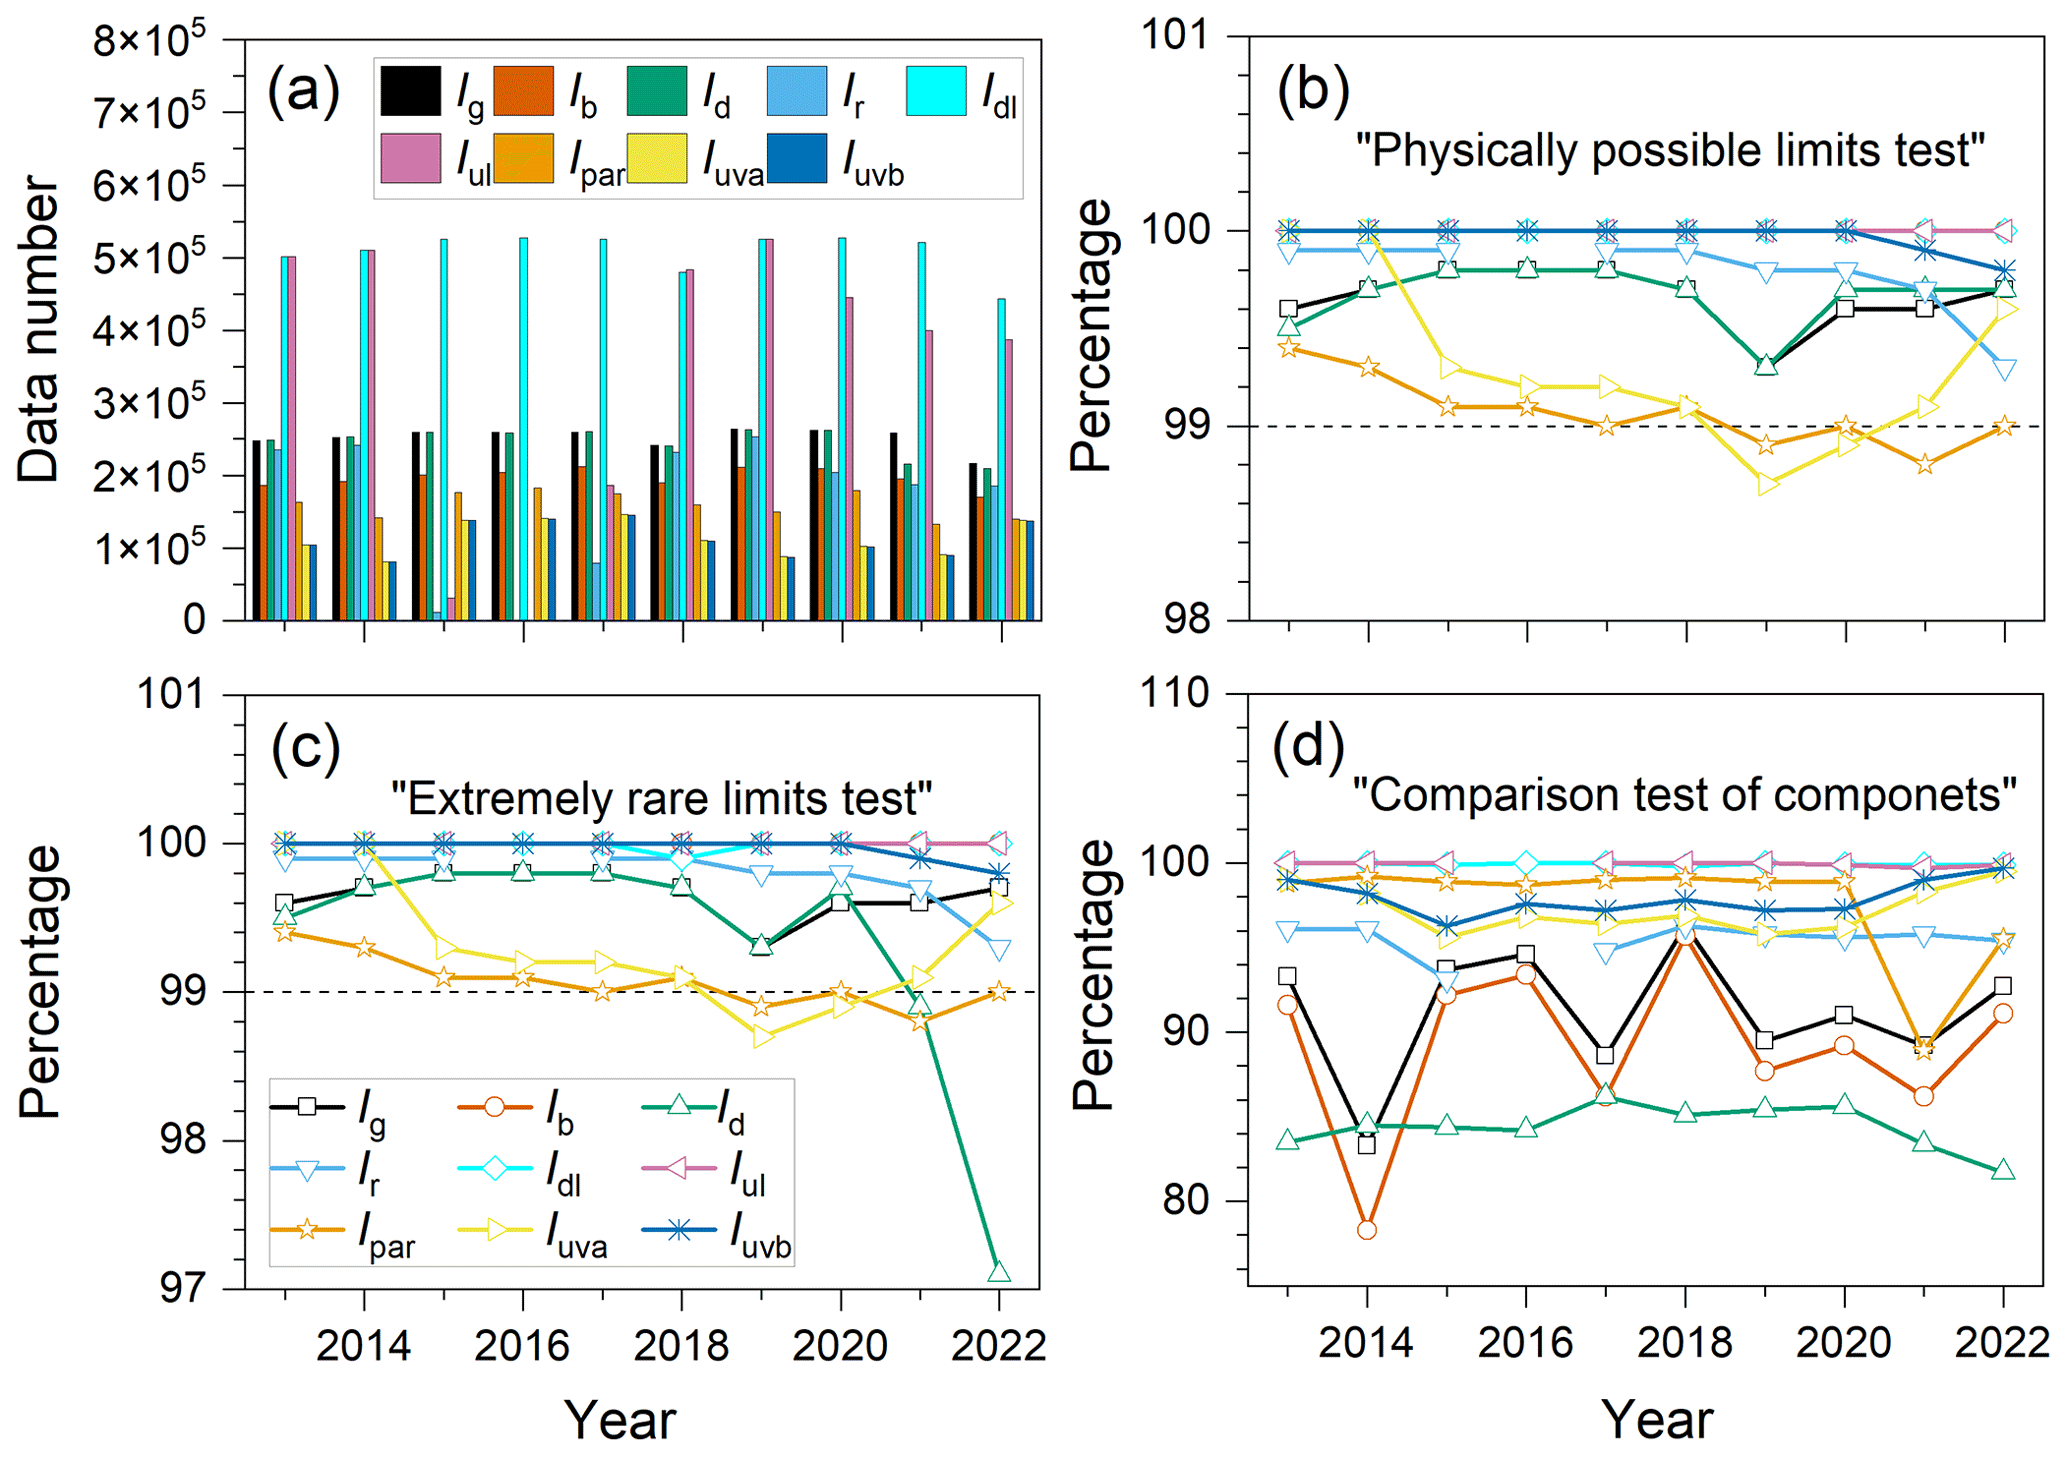
Figure 8Actual data number of the 1 min raw irradiances measured by the NBSR over the period 2013–2022 (a) as well as the percentage that passed the physically possible limits test (b), the extremely rare limits test (c), and the comparison test of components (d).
Figure 8b demonstrates that more than 99.0 % of radiation component data have passed the physically possible limits test in all years except for the UVAI in 2019 (98.7 %) and in 2020 (98.9 %) as well as the PARI in 2019 (98.9 %) and in 2021 (98.8 %). By comparing Fig. 8b and c, we found that the 1 min raw data that have passed the physically possible limits test can completely pass through the extremely rare limits test for all radiation components except for the DifSWI in 2021 (98.9 %) and in 2022 (97.1 %). On the other hand, the comparison test of components can certainly filter out some radiation data that have passed the previous two tests; i.e. the percentage ranges that passed all three tests of the 1 min raw data are GSWI (83.3 %–96.3 %), DSWI (78.3 %–95.7 %), DifSWI (81.7 %–86.2 %), UpSWI (93.1 %–96.3 %), PARI (88.9 %–99.2 %), UVAI (95.6 %–99.5 %), UVBI (96.3 %–99.7 %), DnLWI (99.8 %–100.0 %), and UpLWI (99.7 %–100.0 %), respectively (Fig. 9d). Note that the percentages of 1 min raw data that passed the comparison test of components fluctuated significantly during 2013–2022 for the GSWI and the DSWI but were relatively stable at a lower level of ∼ 84.4 % for the DifSWI. This phenomenon can be explained by the influence of the imprecise tracking of the sun on the measurements of the GSWI, the DSWI, and the DifSWI.
4.3 Potential application of the NBSR dataset
Though it is not likely to present all possible applications of the high-temporal-resolution NBSR dataset in this study, we try to give some summaries and prospects on the potential application of the NBSR dataset as follows.
4.3.1 Validation of the satellite-derived surface radiation flux and numerical model prediction
High-temporal-resolution (1 min) in situ measurements of radiation components can match the precise timing of a satellite overpass and have great advantages in verifying satellite-derived surface radiation flux over different climatic regions (Ohmura et al., 1998). For instance, Kratz (2010) took advantage of a number of BSRN measurements to verify the Clouds and the Earth's Radiant Energy System (CERES) Edition 2B products for a wide variety of surface conditions. Yan et al. (2011) employed the high-temporal-resolution surface radiative flux measurements taken at the SACOL station to evaluate the performance of the Terra/Aqua Single Scanner Footprint (SSF) product over the Loess Plateau in China. In addition, Quan et al. (2009b) validated the net surface solar radiation products of CERES/SSF based on the OBSR measurements at SDZ during January, April, July, and October in 2005. The results show that the SSF products retrieved from the Li model (Li et al., 1993) and the Masuda model (Masuda et al., 1995) overestimate the net surface flux by 62.2 and 50.8 W m−2 under clear-sky conditions, respectively. As one of the crucial observation of the SDZ regional GAW station, the NBSR dataset is expected to play a more vital role in the interpretation of the interaction between radiation and atmospheric components, in the validation of satellite-derived surface radiation flux (e.g. the CERES flux products and the FengYun-4 Geostationary satellite-based solar energy products), and in the satellite-based solar energy nowcasting (Huang et al., 2022).
Owing to its accurate measurement of the radiation fluxes, the high-temporal-resolution radiation measurements from radiation observation networks like the BSRN have been widely used to assess and improve the performance of general circulation models (GCMs) and radiative transfer models (e.g. Ohmura et al., 1998; Wild et al., 2006, 2019). For example, the BSRN data have been used for the interpretation of the underestimation of atmospheric longwave emission as well as the clarification of the debate regarding the missing shortwave absorption in the atmosphere in the GCMs (Wild et al., 1995, 1996). In addition, Liu et al. (2008) evaluated the clear-sky net surface solar radiation calculated by the Moderate Resolution Transmittance Model (Berk et al., 1999) based on a 1 min dataset of DnSWI and UpSWI observed by the OBSR at SDZ in 2005. As a successor and improved version of the OBSR, the NBSR is expected to play a significant role in investigation of radiation codes, climate models, and numerical weather prediction models.
4.3.2 Investigation of temporal variation of the radiation components
The high-temporal-resolution radiation measurements are essential to accurately trace the diurnal cycle, which is important in GCM simulations (Dutton, 1990). Figure 9 shows the diurnal variations of the nine radiation components measured at SDZ. The annual hourly mean value and the associated standard deviation for each radiation component were calculated in terms of the hourly data at the same hour measured in 2013. The reason that the L2A dataset in 2013 was chosen as a data source for calculating the annual hourly mean value and standard deviation is attributed to its highest data integrity and quality in that year. The GSWI, DSWI, DifSWI, and UpSWI display the familiar bell shape, rising to a peak during the middle of the day (∼ 13:00 BJT) and possessing a zero value during the night (Fig. 9a). The diurnal course of the GSWI, DSWI, and DifSWI is caused by the diurnal cycle of the solar zenith angle but also varies with atmospheric composition and cloudiness. The UpSWI cycle is dominated by the GSWI cycle but is also influenced by the surface albedo, which varies with vegetation and growing season, surface modification, moisture, snow cover, and incident angle of the sun (Dutton, 1990). Furthermore, the standard deviation of the hourly irradiance is larger at noon while smaller at sunrise and sunset, which may be impacted by its absolute values as well as the diurnal variation of the water vapour in the atmosphere; i.e. the moisture in the atmosphere is generally lower in early morning or dusk but reaches its maximum at noon (Hu et al., 2007a). The diurnal cycle of the DifSWI, which is useful for investigating atmospheric physics and for evaluating the implications for biological systems, is affected by the variation of the GSWI as well as the atmospheric conditions such as the aerosol loading (Che et al., 2005).
As a part of the solar radiation in the visible spectrum (400–700 nm), the diurnal variation of the PARI is closer to that of the GSWI in spite of the ratio of the PARI to GSWI would be modulated by the water vapour in the atmosphere (Hu et al., 2007a). The hourly PARI at SDZ reaches its maximum around noon with a value of 220.3 W m−2 and has a minimum of zero during night time (Fig. 9b). Ultraviolet radiation is defined as a portion of solar irradiance within the spectrum between 100 and 400 nm. The UVC (100–280 nm) is absorbed by the atmospheric ozone, whereas most radiation in the UVA (315–400 nm) and about 10 % of the UVB rays (280–315 nm) reach the Earth's surface (Hu et al., 2007b). Therefore, the ultraviolet radiation reaching the Earth's surface is largely composed of the UVA with a small UVB component. The value of UVBI at the Earth's surface is generally small due to the attenuation of the strong stratospheric ozone absorption, Rayleigh scattering, etc. However, the UVBI also exhibits a diurnal cycle that is analogous to the one of the UVAI at SDZ; i.e. the highest values of the UVAI (31.9 W m−2) and the UVBI (0.5 W m−2) occur when the sun elevation reaches its maximum (∼ 13:00 BJT), and the lowest values appear during the night. Note that the ratio of the UVAI to UVBI at SDZ varies from 79.2 at noon to 95.5 at sunrise and sunset, with a daily mean value of 84.5 (Fig. 9c).
Figure 9d indicates that the diurnal variation of the hourly mean DnLWI is relatively stable, with an average value of 300.0 ± 7.1 W m−2 over a whole day. However, the standard deviation of the DnLWI is relatively large (∼ 73.3 W m−2), which is affected by the vertically integrated atmospheric temperature, water vapour, ozone, carbon dioxide, and other trace constituents (Dutton, 1990). Moreover, the phase of the diurnal cycle of the UpLWI is postponed an hour compared to the one of the downwelling shortwave irradiance; e.g. the UpLWI reaches its peak at 14:00 BJT rather than at 13:00 BJT, which is predominately caused by the large thermal inertia of the land surface (Fig. 9d). On the other hand, the hourly mean UpLWI exhibits a remarkable diurnal cycle, with an average value of 365.8 ± 35.2 W m−2 and the standard deviation of the hourly UpLWI ranging from 58.4 to 82.7 W m−2 (Fig. 9d).
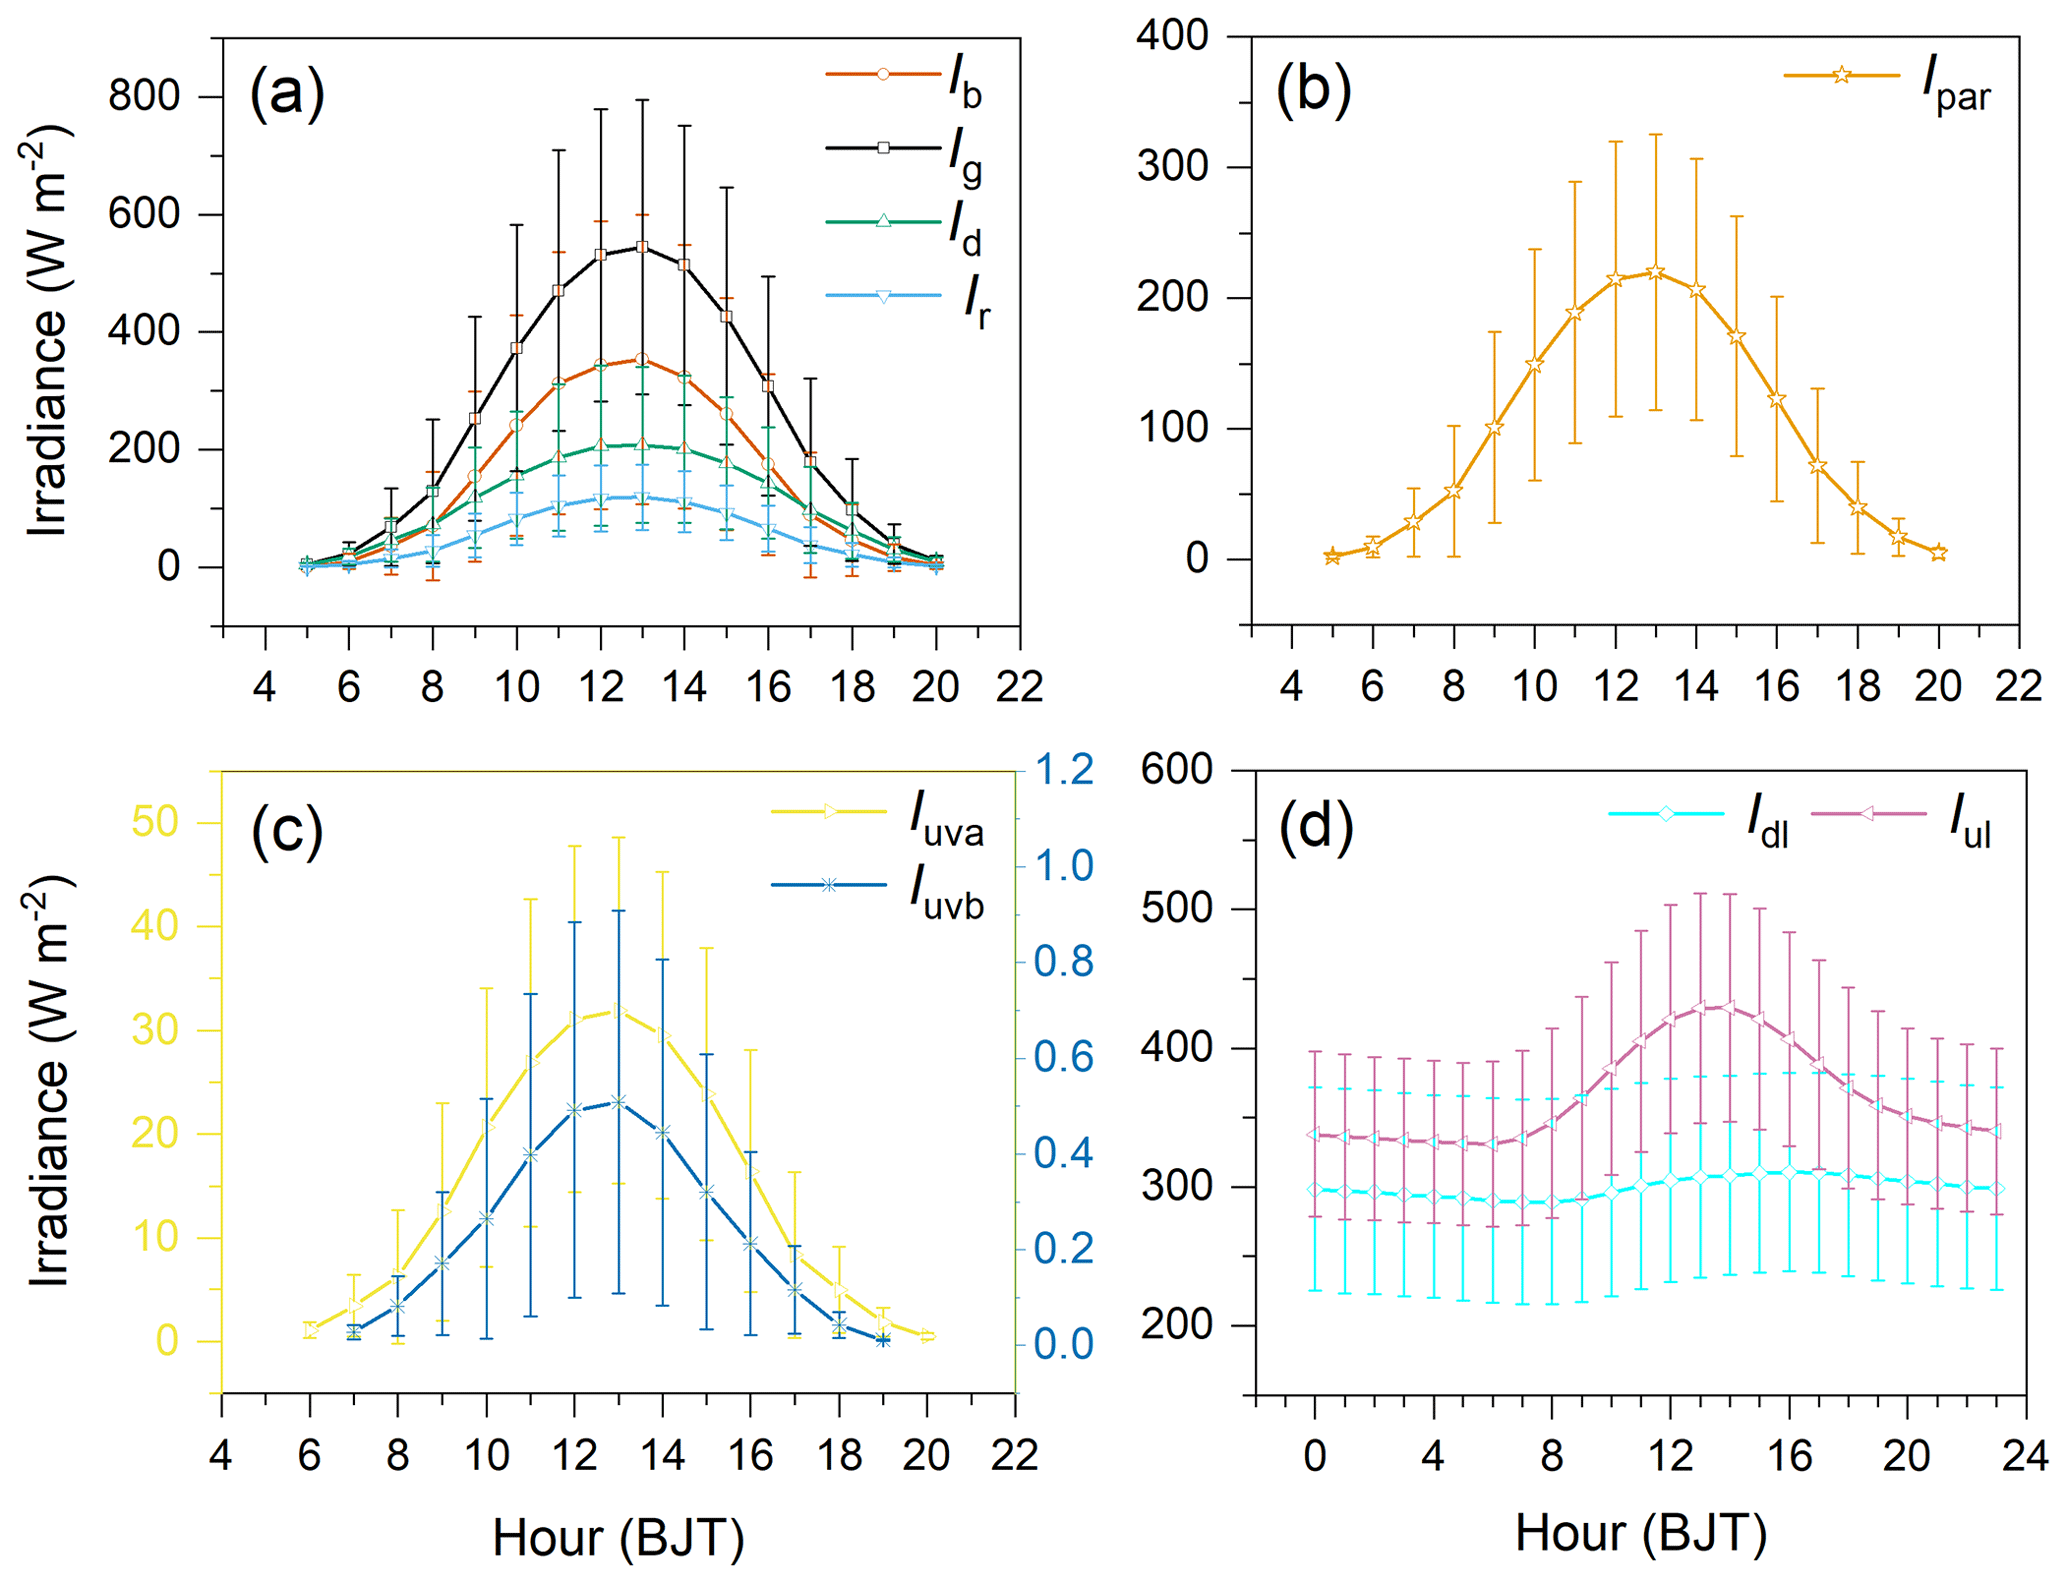
Figure 9Annual averaged diurnal variation in the GSWI, DSWI, DifSWI, and UpSWI (a); the PARI (b); the UVAI and UVBI (c); and the DnLWI and UpLWI (d) at SDZ. The vertical lines denote the standard deviations calculated from the hourly irradiances in 2013.
Figure 10 shows the inter-annual variations and associated linear trends for three shortwave radiation components (i.e. the GSWI, DSWI, and DifSWI) over the SDZ in the period 2013–2021. As a prerequisite in constructing a time series of annual irradiance, a few missing monthly irradiances, e.g. the monthly GSWI, DSWI, and DifSWI in November 2018 as well as the DifSWI in May and June 2021, were replaced by the averages of the corresponding months over all other years during the 2013–2021. Note that the annual radiation data of 2022 were not selected because too many missing observations (more than 3 months) appeared in this year, which leads the annual radiation data of the year 2022 to be highly suspicious. The annual daytime GSWI (with a linear trend of 21.2 W m−2 per decade) and DSWI (with a linear trend of 23.9 W m−2 per decade) increase over the period 2013–2021, while the annual daytime DifSWI decreases with a linear trend of −4.9 W m−2 per decade. A previous study indicated that both the total cloud cover (with a linear trend of −0.8 tenth per decade) and the low cloud cover (with a linear trend of −1.2 tenth per decade) over the SDZ suffered remarkable decreases in the 2010s (Quan et al., 2023a). In general, a decrease in cloud cover will increase the total and direct solar radiation reaching the ground as well as alter the ratio between the DSWI and DifSWI (Wild et al., 2019). Thereby, it is reasonable to believe that increasing trends of shortwave radiation over the SDZ are mostly attributed to the decline of the cloud cover. On the other hand, the linear trends of the GSWI, DSWI, and DifSWI are also influenced by the variation of aerosol loading over the SDZ. For instance, the surface particulate matter with an aerodynamic diameter of <2.5 µm (PM2.5) measured at the SDZ reached its maximum value in 2013 and declined subsequently after 2014, which is attributed to the severe haze episodes that occurred over the BTH in 2013 and the implementation of the air pollution action plan at the end of 2013 (Fu et al., 2020). Moreover, the relationship between the DSWI and DifSWI can be modulated by the particulates in the atmosphere due to their scattering effects on solar radiation. It is worth noting that the dramatic declines in the GSWI and the DSWI as well as the incline in the DifSWI in 2021 were essentially caused by an increase in precipitation clouds in 2021, in which the historic maximum precipitation amount (1047.3 mm) and third-highest number of rainy days (108 d) over the past 6 decades occurred at the SDZ (Quan et al., 2023a).
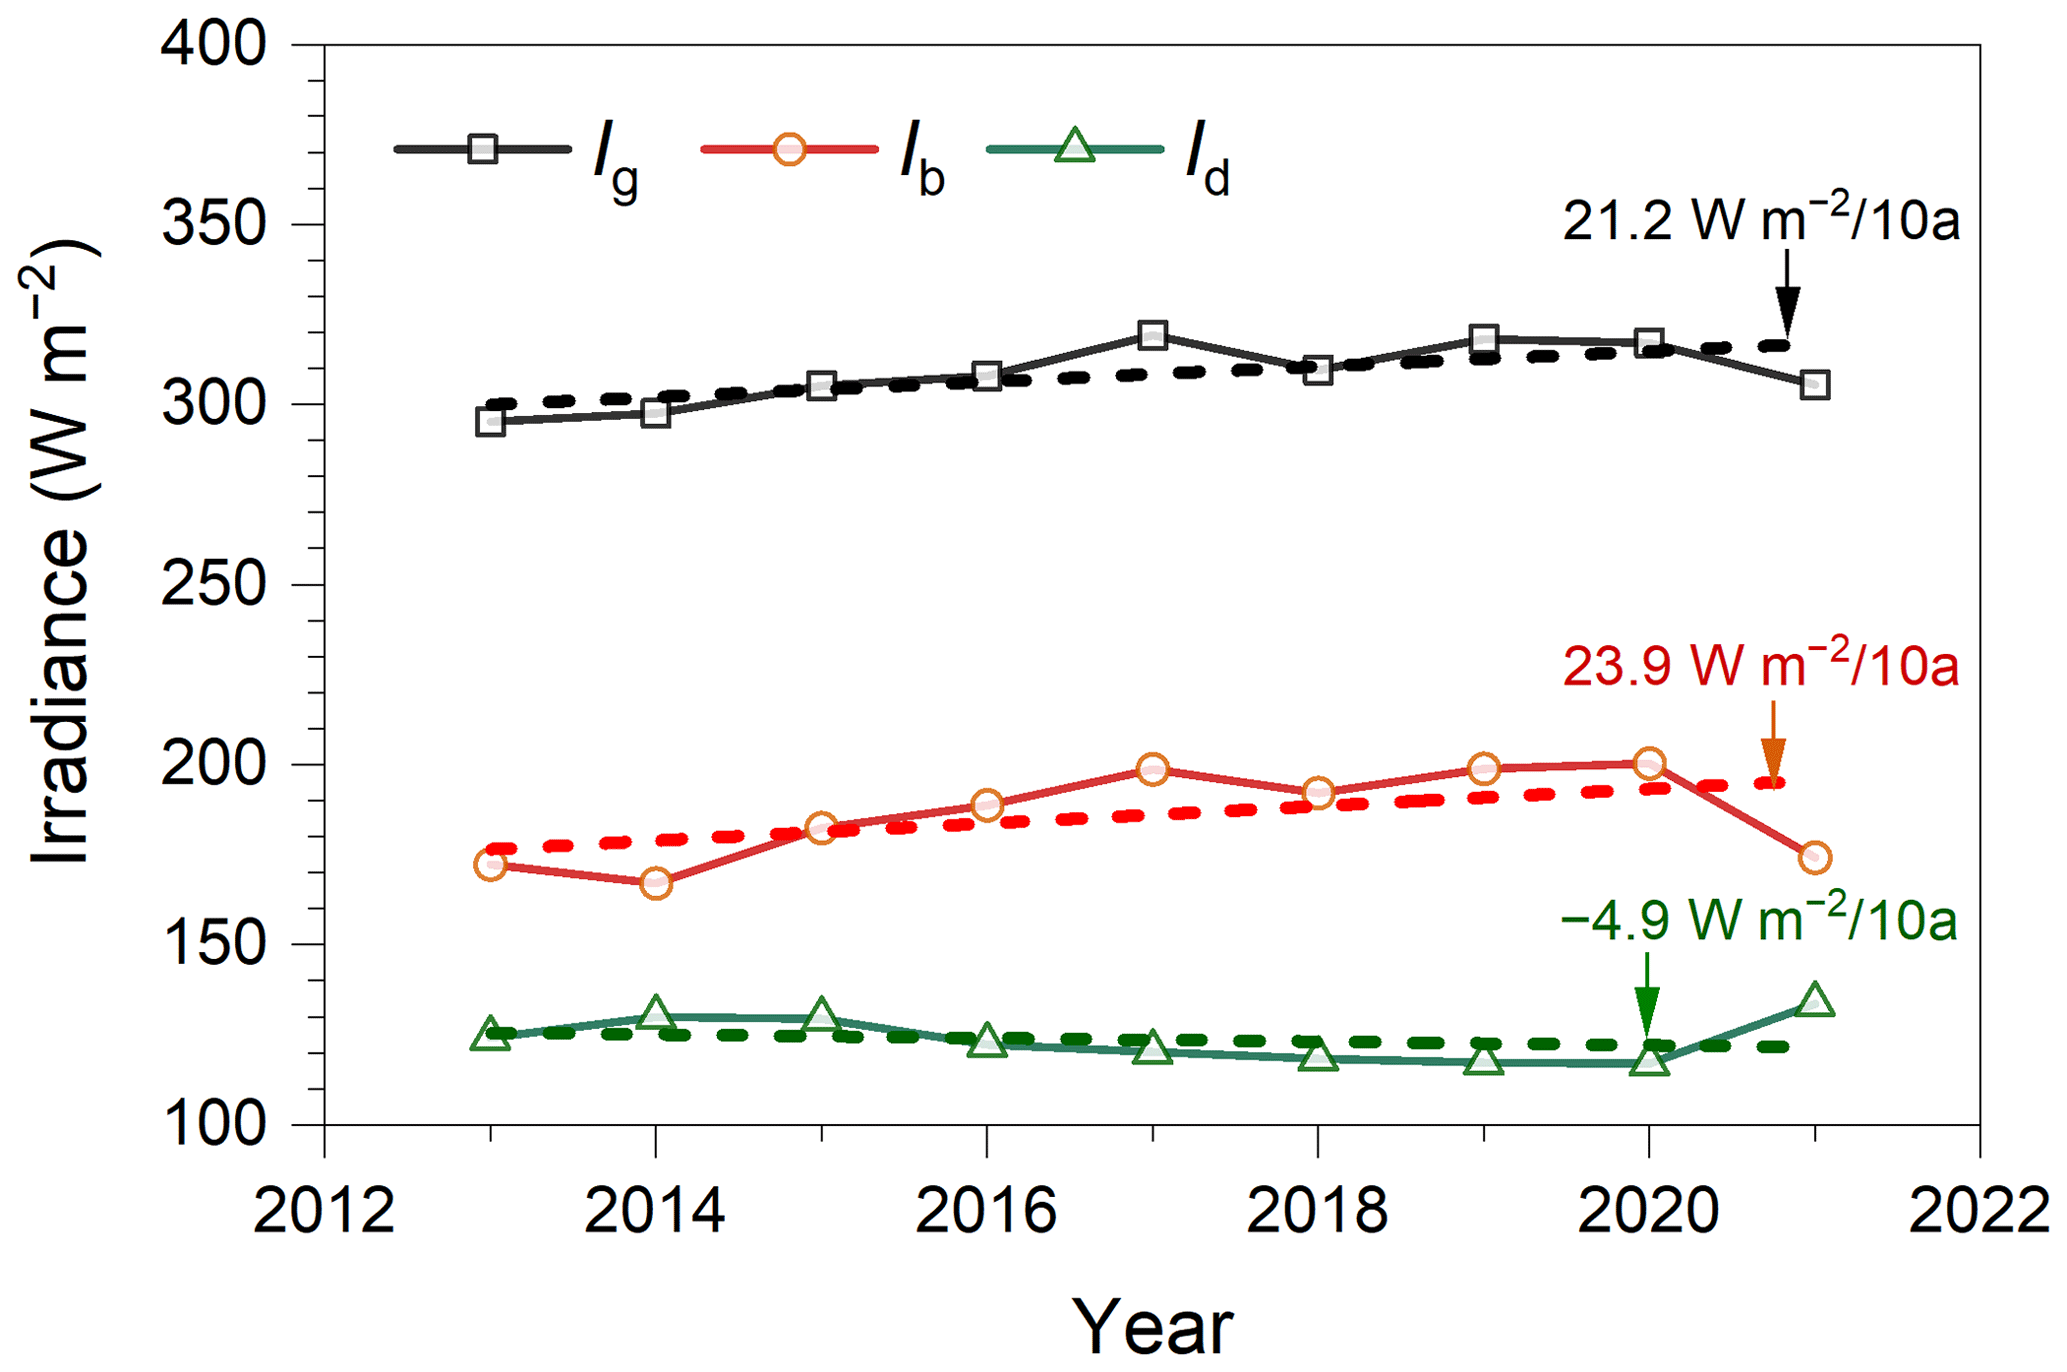
Figure 10Inter-annual variations of the annual mean daytime GSWI, DSWI, and DifSWI and associated linear trends for GSWI (denoted with a dashed thick black line), DSWI (denoted with a thick red line), and DifSWI (denoted with a dashed thick green line) over the SDZ area during the period 2013–2021, respectively.
4.3.3 Acting as a reference to correct other analogous instruments
Using the parallel sunshine duration observations from the Jordan sunshine recorder and the DFC2 photoelectric sunshine meter as well as those derived from the measurements of the CHP1 pyrheliometer and CMP11 pyranometer of the NBSR, we have elucidated the mechanism that produced inconsistency among these instruments and proposed a simple linear regression function to improve the consistency of the long-term sunshine duration series observed at SDZ (Zhou et al., 2021). Hence, the highly accurate radiometric instruments of the NBSR can act as a reference to improve the consistency of long-term sunshine duration records measured by different sunshine duration recorders, which may be beneficial for climate studies as well as for the promotion of tourist destinations since the sunshine duration takes into account the psychological effects of strong solar light on human wellbeing (WMO, 2006).
4.3.4 Establishing parameterization models for retrieving surface radiation components
As pointed out by Ohmura et al. (1998), the measurements at the BSRN stations have provided detailed information of radiative effects on the climate system and contributed to a better parameterization of radiation in climate models. In our recent research, a long-term (2011–2022) hourly dataset of DnLWI and associated meteorological elements obtained from seven CBSRN stations including the SDZ were used to recalculate the coefficients of the Brunt model (Brunt, 1932) and the Weng model (Weng et al., 1993) as well as to develop a new parameterization model to estimate the downwelling longwave irradiance at the surface (Yang et al., 2023).
4.3.5 Assistance to evaluate the effects of aerosol loading on sunshine duration
The clear-sky hourly clearness index (Kt), which is defined as the ratio of the measured hourly global shortwave irradiance to the corresponding extra-terrestrial irradiance at the top of the atmosphere under cloud-free conditions, can be taken as an indicator to represent the atmospheric aerosol loading (Iqbal, 1983; Che et al., 2007). In our previous study, we found that the start time of sunshine duration at SDZ is 08:00, 06:00, and 05:00 BJT under high (0.70≤Kt<1.0), middle (0.55≤Kt<0.7), and low (Kt<0.55) levels of clearness index, which were calculated in terms of the GSWI observed by the NBSR, respectively. The end time of hourly sunshine duration under the middle/high clearness index is 1 or 2 h earlier than that at low clearness index, which may be partly influenced by the blocking effect of hills located to the west of the SDZ. The value of hourly sunshine duration in the second period (10:00–16:00 BJT) under high aerosol loading (or low level of clearness index) is ∼ 0.6 h h−1, i.e. approximately 60 % and 56 % of that under middle and low aerosol loadings, respectively (Quan et al., 2023a).
The daily dataset of the NBSR (2013–2022) presented in this study is available online at https://doi.org/10.1594/PANGAEA.963330 (Quan et al., 2023b). In addition, the hourly radiation dataset for 2016 can be downloaded from https://doi.org/10.12072/SDZRAW.001.2017.db (Quan and Wang, 2017), and the hourly radiation dataset for 2017 is available from https://doi.org/10.12072/SDZRAW.003.2018.db (Quan and Wang, 2018).
In this study, the NBSR at the SDZ was introduced in detail for the first time. As a unique atmospheric background station in northern China, SDZ has a good spatial representativeness of this area. Therefore, the measurements at the SDZ including the high-temporal-resolution radiation data are expected to contribute to great achievements in a lot of scientific fields in the future. The objective of this study includes the introduction of the site and instruments, the development of the HARDQC algorithm, and the establishment and assessment of the NBSR dataset, as well as some demonstrations of its potential applications. The major conclusions of this study are as follows.
The HARDQC algorithm presented in this study proved to be effective in quality-controlling the 1 min raw data of the nine radiation components observed by the NBSR. More than 99.0 % of 1 min raw data of the nine radiation components except for the UVAI (98.7 %) and the PARI (98.9 %) passed the physically possible limits test over the period 2013–2022. Apart from the DnLWI (97.1 %), the percentages of the other radiation components that passed the extremely rare limits test are greater than 98.6 %. Nevertheless, the percentages of those that passed the comparison test between radiation components over the period 2013–2022 range from 83.3 % to 96.3 % for the GSWI, 78.3 %–95.7 % for the DSWI, 81.7 %–86.2 % for the DifSWI, 93.1 %–96.3 % for the UpSWI, 88.9 %–99.2 % for the PARI, 95.6 %–99.5 % for the UVAI, 96.3 %–99.7 % for the UVBI, >99.8 % for the DnLWI, and >99.7 % for the UpLWI, respectively.
Adverse synoptic conditions (e.g. lightning strike), improper operation, and instrument removal for calibration are three primary reasons leading to the data deficiency of the NBSR. Therefore, it is highly recommended that a backup radiation observing system should be simultaneously operated with the NBSR in order to solve the issues of unpredictable instrument failures and missing data.
All instruments in the NBSR except for the UV-S-AB-T and Li190SB are considerably stable, with a relative deviation less than 1 % over the whole observation period according to the results of instrument calibration. Thus, it is recommended that the UV-S-AB-T and the Li190SB should be calibrated regularly (e.g. once per year) in future operations. The IR02 pyrgeometer is found to output abnormal longwave irradiances in the case of extreme cold and dry conditions due to its large temperature dependency. We thus suggest that the IR02 pyrgeometer should be replaced by a more precise instrument (e.g. the CGR4) in the future.
The representativeness of the UpSWI and the UpLWI is insufficient because the face-down CMP11 and IR02 are mounted on the top of the 1.5 m high steel bracket on the MOF rather than installed on a 10 m tall tower. By means of the high tower, the face-down radiometric instruments can view a wider underlying surface, which could be very helpful to improve its representativeness of the actual underlying surface.
Despite the existence of a few imperfections in the NBSR dataset, the long-term (more than 10 years) quality-assured dataset of nine radiation components can provide surface radiation budget data for many applications such as the validation of satellite products and numerical models, investigations on the interaction between radiation fluxes and atmospheric composition, and the detection of the long-term changes in the radiative fluxes. Moreover, it is very useful for interpreting the physical and chemical processes along with other atmospheric component observations at the SDZ station.
In the near future, the dataset of the OBSR is also planned to be established to prolong the NBSR dataset back in time up to more than 18 years. Both the OBSR dataset and the NBSR dataset are designed to be permanently archived and freely accessible, which will contribute to radiation-related scientific studies in the future.
WQ contributed the ideas, organized the research, edited the manuscript, and provided the funding acquisitions; ZW, YL, and XY performed the data processing such as the QC procedure on the radiation components; LQ and XZ contributed to an analysis of the data and calibration of the instruments; JJ and ZM provided the instrument maintenance and data collection; and MW contributed to improving the ideas and to checking and rectifying the manuscript.
The contact author has declared that none of the authors has any competing interests
Publisher’s note: Copernicus Publications remains neutral with regard to jurisdictional claims made in the text, published maps, institutional affiliations, or any other geographical representation in this paper. While Copernicus Publications makes every effort to include appropriate place names, the final responsibility lies with the authors.
We would like to thank Yao Wang of the Beijing Meteorological Observatory for providing the drone photo of Shangdianzi station and Bo Hu of the Institute of Atmospheric Physics, Chinese Academy of Science, for his suggestions on how to use the PAR data, which were much appreciated. We wish to thank reviewers and the editor for their valuable insights that helped to greatly improve the manuscript.
This research has been supported by the China Scholarship Council (grant no. 202205330024), the National Key Research and Development Program of China (grant no. 2017YFB0504002), and the National Natural Science Foundation of China (grant no. 42275199).
This paper was edited by Hanqin Tian and reviewed by two anonymous referees.
Ackerman, T. P. and Stokes, G. M.: The atmospheric radiation measurement program, Phys. Today, 56, 38–44, https://doi.org/10.1063/1.1554135, 2003.
Augustine, J. A., DeLuisi, J. J., and Long, C. N.: SURFRAD–A national surface radiation budget network for atmospheric research, B. Am. Meteorol. Soc., 81, 2341–2357, https://doi.org/10.1175/1520-0477(2000)081<2341:SANSRB>2.3.CO;2, 2000.
Bai, J. H., de Leeuw, G., van der A, R., De Smedt, I., Theys, N., Roozendael, M. V., Sogacheva, L., and Chai, W. H.: Variations and photochemical transformations of atmospheric constituents in North China, Atmos. Environ., 189, 213–226, https://doi.org/10.1016/j.atmosenv.2018.07.004, 2018.
Berk, A., Anderson, G. P., Acharya, P. K., Chetwynd, J. H., Bernstein, L. S., Shettle, E. P., Matthew, M. W., and Adler-Golden, S. M.: MODTRAN4 User's Manual, Air Force Research Laboratory, North Andover, MA, USA, 94 pp., https://www.docin.com/p-635510257.html (last access: 23 February 2022), 1999.
Brunt, D.: Notes on radiation in the atmosphere, Q. J. Roy. Meteor. Soc., 58, 389–418, https://doi.org/10.1002/qj.49705824704, 1932.
Che, H. Z., Shi, G. Y., Zhang, X. Y., Arimoto, R., Zhao, J. Q., Xu, L., Wang, B., and Chen, Z. H.: Analysis of 40 years of solar radiation data from China, 1961–2000, Geophys. Res. Lett., 32, L06803, https://doi.org/10.1029/2004GL022322, 2005.
Che, H. Z., Shi, G. Y., Zhang, X. Y., Zhao, J. Q., and Li, Y.: Analysis of sky conditions using 40 year records of solar radiation data in China, Theor. Appl. Climatol., 89, 83–94, https://doi.org/10.1007/s00704-006-0258-0, 2007.
Cheng, X. H., Zhang, X. L., Zheng, X. D., Zhou, H. G., and Li, D. P.: Characteristics of thermal offset of a precision spectral pyranometer (PSP) and its error in global solar radiation measurement, Acta Energiae Solaris Sinica, 30, 19–26, 2009 (in Chinese).
CMA: Observation service specification for baseline surface radiation, User Manual, v2207, Beijing, China, 59 pp., 2007 (in Chinese).
CSI: Instruction manual for LI190SB quantum sensor, Campbell Scientific, Inc., Utah, U. S. A., 30 pp., https://s.campbellsci.com/documents/us/manuals/li190sb.pdf (last access: 20 October 2022), 2015.
Driemel, A., Augustine, J., Behrens, K., Colle, S., Cox, C., Cuevas-Agulló, E., Denn, F. M., Duprat, T., Fukuda, M., Grobe, H., Haeffelin, M., Hodges, G., Hyett, N., Ijima, O., Kallis, A., Knap, W., Kustov, V., Long, C. N., Longenecker, D., Lupi, A., Maturilli, M., Mimouni, M., Ntsangwane, L., Ogihara, H., Olano, X., Olefs, M., Omori, M., Passamani, L., Pereira, E. B., Schmithüsen, H., Schumacher, S., Sieger, R., Tamlyn, J., Vogt, R., Vuilleumier, L., Xia, X., Ohmura, A., and König-Langlo, G.: Baseline Surface Radiation Network (BSRN): structure and data description (1992–2017), Earth Syst. Sci. Data, 10, 1491–1501, https://doi.org/10.5194/essd-10-1491-2018, 2018.
Dutton, E. G.: Annual forcing of the surface radiation balance diurnal cycle measured from a high tower near Boulder, Colorado, J. Climate, 3, 1400–1408, https://doi.org/10.1175/1520-0442(1990)003<1400:AFOTSR>2.0.CO;2, 1990.
Enz, J. W., Klink, J. C., and Baker, D.: Solar radiation effects on pyrgeometer performance, J. Appl. Meteorol. Clim., 14, 1297–1302, https://doi.org/10.1175/1520-0450(1975)014<1297:SREOPP>2.0.CO;2, 1975.
Fu, D. S., Song, Z. J., Zhang, X. L., Wu, Y. F., Duan, M. Z. Pu, W. W., Ma, Z. Q., Quan, W. J. Zhou, H. G., Che, H. Z., and Xia, X. A.: Similarities and differences in the temporal variability of PM2.5 and AOD between urban and rural stations in Beijing, Remote Sens., 12, 1193, https://doi.org/10.3390/rs12071193, 2020.
García, O. E., Díaz, A. M., Expósito, F. J., Díaz, J. P., Dubovik, O., Dubuisson, P., Roger, J. C., Eck, T. F., Sinyuk, A., Derimian, Y., Dutton, E. G., Schafer, J. S., Holben, B. N., and García, C. A.: Validation of AERONET estimates of atmospheric solar fluxes and aerosol radiative forcing by ground-based broadband measurements, J. Geophys. Res., 113, D21207, https://doi.org/10.1029/2008JD010211, 2008.
García, R. D., García, O. E., Cuevas, E., Cachorro, V. E., Romero-Campos, P. M., Ramos, R., and de Frutos, A. M.: Solar radiation measurements compared to simulations at the BSRN Izaña station: Mineral dust radiative forcing and efficiency study, J. Geophys. Res.-Atmos., 119, 179–194, https://doi.org/10.1002/2013JD020301, 2014.
García, R. D., Barreto, A., Cuevas, E., Gröbner, J., García, O. E., Gómez-Peláez, A., Romero-Campos, P. M., Redondas, A., Cachorro, V. E., and Ramos, R.: Comparison of observed and modeled cloud-free longwave downward radiation (2010–2016) at the high mountain BSRN Izaña station, Geosci. Model Dev., 11, 2139–2152, https://doi.org/10.5194/gmd-11-2139-2018, 2018.
Gueymard, C. A. and Ruiz-Arias, J. A.: Extensive worldwide validation and climate sensitivity analysis of direct irradiance predictions from 10-min global irradiance, Sol. Energy, 128, 1–30, https://doi.org/10.1016/j.solener.2015.10.010, 2016.
Gupta, S. K., Kratz, D. P., Wilber, A. C., and Nguyen, L. C.: Validation of parameterized algorithms used to derive TRMM-CERES surface radiative fluxes, J. Atmos. Oceanic Technol., 21, 742–752, https://doi.org/10.1175/1520-0426(2004)021<0742:vopaut>2.0.co;2, 2004.
Hu, B., Wang, Y. S., and Liu, G. R.: Spatiotemporal characteristic of photosynthetically active radiation in China, J. Geophys. Res., 112, D14106, https://doi.org/10.1029/2006JD007965, 2007a.
Hu, B., Wang, Y. S., and Liu, G. R.: Ultraviolet radiation spatio-temporal characteristics derived from the ground-based measurements taken in China, Atmos. Environ., 41, 5707–5718, https://doi.org/10.1016/j.atmosenv.2007.02.044, 2007b.
Hu, B., Wang, Y. S., and Liu, G. R.: Relationship between net radiation and broadband solar radiation in the Tibetan Plateau, Adv. Atmos. Sci., 29, 135–143, https://doi.org/10.1007/s00376-011-0221-6, 2012.
Huang, J. P., Zhang, W., Zuo, J. Q., Bi, J. R., Shi, J. S., Wang, X., Chang, Z. L., Huang, Z. W., Yang, S., Zhang, B. D., Wang, G. Y., Feng, G. H., Yuan, J. Y., Zhang, L., Zuo, H. C., Wang, S. G., Fu, C. B., and Chou, J. F.: An overview of the semi-arid climate and environment research observatory over the Loess Plateau, Adv. Atmos. Sci., 25, 906–921, https://doi.org/10.1007/s00376-008-0906-7, 2008.
Huang, C. L., Shi, H. R., Gao, L., Liu, M. Q., Chen, Q. X., Fu, D. S., Wang, S., Yuan, Y., and Xia, X. A.: Fengyun-4 Geostationary satellite-based solar energy nowcasting system and its application in North China, Adv. Atmos. Sci., 39, 1316–1328, https://doi.org/10.1007/s00376-022-1464-0, 2022.
Hukseflux: User manual IR02 pyrgeometer with heater, User mannual, v2207, 43 pp., Hukseflux Thermal Sensors B. V., Delftechpark 31, 2628 XJ Delft, the Netherlands, https://www.hukseflux.com/uploads/product-documents/IR02_manual_v2208.pdf (last access: 25 January 2022), 2022.
Iqbal, M.: An Introduction to Solar Radiation, Academic Press, Ontario, Canada, 390 pp., ISBN 0123737508, 1983.
Journée, M. and Bertrand, C.: Quality control of solar data with the RMIB solar measurements network, Sol. Energy, 85, 72–86, https://doi.org/10.1016/j.solener.2010.10.021, 2011.
Kipp & Zonen: Broadband UV radiometers for the accurate measurement of solar ultraviolet radiation, Kipp & Zonen B.V., Delft, the Netherlands, 4 pp., http://www.kippzonen.com/ProductGroup/11/UV-Radiometers (last access: 1 March 2023), 2012.
Kipp & Zonen: Instruction manual for CMP series: Pyranometer, Kipp & Zonen B.V., Delft, the Netherlands, 28 pp., https://www.kippzonen.com/Download/72/Manual-Pyranometers-CMP-series-English?ShowInfo=true (last access: 2 August 2022), 2016.
Kratz, D. P., Gupta, S. K., Wilber, A. C., and Sothcott, V. E.: Validation of the CERES edition 2B surface-only flux algorithms, J. Appl. Meteorol. Clim., 49, 164–180, https://doi.org/10.1175/2009JAMC2246.1, 2010.
Li, F., Ji, C. L., Mo, Y. Q., and Guo, Z. J.: Examination and evaluation of integrality and rationality of China basic radiation station data, Plateau Meteorol., 32, 1203–1213, http://www.gyqx.ac.cn/CN/10.7522/j.issn.1000-0534.2012.00113 (last access: 18 September 2022), 2013 (in Chinese).
Li, X. L., Quan, W. J., Wang, D. D., and Wang, D.: Comparison of visibility measurements using DNQ1 and FD12 visibility meters and their major influencing factors, J. Meteor. Environ., 37, 25–32, http://www.jme1984.net.cn/CN/10.3969/j.issn.1673-503X.2021.03.004 (last access: 8 January 2023), 2021 (in Chinese).
Li, Z. Q., Leighton, H. G., Masuda, K., and Takashima, T.: Estimation of SW flux absorbed at the surface from TOA reflected flux, J. Climate, 6, 317–330, https://doi.org/10.1175/1520-0442(1993)006<0317:EOSFAA>2.0.CO;2, 1993.
Liao, X. H., Feng, Z. M., Gao, X., Sun, H. L., Sun, J. L., Yu, G. R., Dai, E. F., Zhan, C. S., Ma, Z. Q., Yu, X. B., He, H. L., Yang, Y. P., Liu, R. G., Dai, J. H., Liu, C., and Wang, J. L.: The development of field scientific observation and research stations (networks) and scientific data centers, Acta Geogr. Sin., 75, 2669–2683, 2020 (in Chinese).
Liu, M. Q., Xia, X. A., Fu, D. S., and Zhang, J. Q.: Development and validation of machine-learning clear-sky detection method using 1 min irradiance data and sky imagers at a polluted suburban site, Xianghe, Remote Sens., 13, 3763, https://doi.org/10.3390/rs13183763, 2021.
Liu, M. Q., Zhang, J. Q., Shi, H. R., Fu, D. S., and Xia, X. A.: Data-driven estimation of cloud effects on surface irradiance at Xianghe, a suburban site on the North China Plain, Adv. Atmos. Sci., 39, 2213–2223, https://doi.org/10.1007/s00376-022-1414-x, 2022.
Liu, M. Q., Fan, X. H., Xia, X. A., Zhang, J. Q., and Li, J.: Value-added products derived from 15 years of high-quality surface solar radiation measurements at Xianghe, a suburban site in the North China Plain, Adv. Atmos. Sci., 40, 1132–1141, https://doi.org/10.1007/s00376-022-2205-0, 2023.
Liu, Y. H., Quan, W. J., Xia, X. A., and Guo, W. L.: Net surface solar radiation in the clear sky based on MODTRAN model and satellite data, Plateau Meteorol., 27, 1410–1415, 2008 (in Chinese).
Long, C. N. and Dutton, E. G.: BSRN global network recommended QC tests, V2.0, BSRN Technical Report, 3 pp., http://hdl.handle.net/10013/epic.38770.d001 (last access: 10 December 2022), 2002.
Long, C. N. and Shi, Y.: An automated quality assessment and control algorithm for surface radiation measurements, Open Atmos. Sci. J., 2, 23–37, https://doi.org/10.2174/1874282300802010023, 2008.
Masuda, K., Leighton, H. G., and Li, Z. Q.: A new parameterization for the determination of solar flux absorbed at the surface from satellite measurements, J. Climate, 8, 1615–1629, https://doi.org/10.1175/1520-0442(1995)008<1615:ANPFTD>2.0.CO;2, 1995.
McArthur, L. J. B.: Baseline Surface Radiation Network (BSRN) – Operation Manual Version 2.1, WMO/TD-No. 1274, WMO, Geneva, Switzerland, 176 pp., https://epic.awi.de/id/eprint/45991/ (last access: 26 December 2021), 2005.
Michalsky, J., Dutton, E., Rubes, M., Nelson, D., Stoffel, T., Wesley, M., Splitt, M., and Deluisi, J.: Optimal measurement of surface shortwave irradiance using current instrumentation, J. Atmos. Ocean Tech., 16, 55–69, https://doi.org/10.1175/1520-0426(1999)016<0055:OMOSSI>2.0.CO;2, 1999.
Mol, W. B., Knap, W. H., and van Heerwaarden, C. C.: Ten years of 1 Hz solar irradiance observations at Cabauw, the Netherlands, with cloud observations, variability classifications, and statistics, Earth Syst. Sci. Data, 15, 2139–2151, https://doi.org/10.5194/essd-15-2139-2023, 2023.
Nie, X. H., Nie, Y. M., Nie, J. H., and Jiang, L. X.: The principle for measuring available photosynthetic radiation and related conversion of units, J. Shandong Agr. Univ., 23, 247–253, 1992 (in Chinese).
Nowak, D., Vuilleumier, L., Long, C. N., and Ohmura, A.: Solar irradiance computations compared with observations at the Baseline Surface Radiation Network Payerne site, J. Geophys. Res., 113, D14206, https://doi.org/10.1029/2007JD009441, 2008.
Ohmura, A., Dutton, E. G., Forgan, B., Fröhlich, C., Gilgen, H., Hegner, H., Heimo, A., König-Langlo, G., McArthur, B., Müller, G., Philipona, R., Pinker, R., Whitlock, C. H., Dehne, K., and Wild, M.: Baseline surface radiation network (BSRN/WCRP): New precision radiometry for climate research, B. Am. Meteorol. Soc., 79, 2115–2136, https://doi.org/10.1175/1520-0477(1998)079<2115:BSRNBW>2.0.CO;2, 1998.
Opálková, M., Burda, M., Navrátil, M., and Spunda, V.: Influence of air pollution to incident photosynthetically active radiation during clear sky conditions in Ostrava, Czech Republic, Atmos. Environ., 215, 116910, https://doi.org/10.1016/j.atmosenv.2019.116910, 2019.
Papaioannou, G., Papanikolaou, N., and Retalis, D.: Relationships of photosynthetically active radiation and shortwave irradiance, Theor. Appl. Climatol., 48, 23–27, https://doi.org/10.1016/0002-1571(76)90080-7, 1993.
Peppler, R. A., Long, C. N., Sisterson, D. L., Turner, D. D., Bahrmann, C. P., Christensen, S. W., Doty, K. J., Eagan, R. C., Halter, T. D., Ivey, M. D., Keck, N. N., Kehoe, K. E., Liljegren, J. C., Macduff, M. C., Mather, J. H., McCord, R. A., Monroe, J. M., Moore, S. T., Nitschke, K. L., Orr, B. W., Perez, R. C., Perkins, B. D., Richardson, S. J., Sonntag, K. L., and Voyles, J. W.: An overview of ARM program climate research facility data quality assurance, Open Atmos. Sci., 2, 192–216, https://doi.org/10.2174/1874282300802010192, 2008.
Philipona, R.: Underestimation of solar global and diffuse radiation measured at Earth's surface, J. Geophys. Res., 107, 4654, https://doi.org/10.1029/2002JD002396, 2002.
Philipona, R., Fröhlich, C., Dehne, K., DeLuisi, J., Augustine, J., Dutton, E., Nelson, D., Forgan, B., Novotny, P., Hickey, J., Love, S. P., Bender, S., McArthur, B., Ohmura, A., Seymour, J. H., Foot, J. S., Shiobara, M., Valero, F. P. J., and Strawa, A. W.: The baseline surface radiation network pyrgeometer round-robin calibration experiment, J. Geophys. Res., 107, 4654, https://doi.org/10.1029/2002JD002396, 1998.
PMOD/WRC: Annual Report 2021, Davos, Switzerland, 68 pp., https://www.pmodwrc.ch/wp-content/uploads/2022/06/2021_PMODWRC_Annual_Report.pdf, lass access: 12 September 2022.
Quan, J. M., Ding, L., Zheng, X. D., Yang, Y., and Wang, D.: Comparison between two field calibration methods of pyranometer, Meteor. Mon., 36, 116–119, http://qxqk.nmc.cn/html/2010/9/20100919.html (last access: 15 August 2022), 2010 (in Chinese).
Quan, W. J. and Wang, Z. F.: Radiation data set of Beijing Shangdianzi atmospheric background station in 2016, National Cryosphere Desert Data Center [data set], https://doi.org/10.12072/SDZRAW.001.2017.db, 2017.
Quan, W. J. and Wang, Z. F.: Beijing Shangdianzi station reference radiation data set in 2017, National Cryosphere Desert Data Center [data set], https://doi.org/10.12072/SDZRAW.003.2018.db, 2018.
Quan, W. J., Chen, H. B., Gao, Y. H., Guo, W. L., and Liu, Y. H.: The quality evaluation of solar radiation data measured in Shangdianzi background station, Plateau Meteorol., 28, 136–142, 2009a (in Chinese).
Quan, W. J., Chen, H. B., Guo, W. L., Xia, X. A., and Zhang, X. L.: Net surface solar radiation over Beijing area derived by two parameterization models: A comparison, Acta Meteorol. Sinica, 67, 623–630, 2009b (in Chinese).
Quan, W. J., Yao, B., Liu, W. D., Liu, P., Zhang, X. C., Song, Q. L., Ma, Q. L., Ma, Z. Q., Qiao, L., and Che, H. Z.: The innovative development of atmospheric background stations in China: Thoughts and recommendations, Chin. Sci. Bull., 66, 2367–2378, https://doi.org/10.1360/TB-2020-0692, 2021 (in Chinese).
Quan, W. J., Ma, Z. Q., Li, Z. M., Li, X. L., Li, Y. R., Xia, X. A., Zhou, H. G., Zhao, H. J., Wang, Z. F., Pu, W. W., Dong, F., He, D., Zhou, L. Y., Shi, Q. F., Wang, W. Y., and Jia, F.: Variation in sunshine duration and related aerosol influences at Shangdianzi GAW station, China: 1958–2021, J. Meteorol. Res., 37, 551–563, https://doi.org/10.1007/s13351-023-2196-5, 2023a.
Quan, W. J., Wang, Z. F., and Ma, Z. Q.: Nine radiation components observed at the Shangdianzi regional GAW station in China (2013–2022), PANGAEA [data set], https://doi.org/10.1594/PANGAEA.963330, 2023b.
Ross, J. and Sulev, M.: Sources of errors in measurements of PAR, Agr. Forest Metorol., 100, 103–125, https://doi.org/10.1016/S0168-1923(99)00144-6, 2000.
Smith, E. V. P. and Gottlieb, D. M.: Solar flux and its variations, Space. Sci. Rev., 16, 771–802, https://doi.org/10.1007/BF00182600, 1974.
Song, J. Y.: Quality Evaluations and Feature Analysis of Radiation Data at Background Stations in China, MS thesis, Chinese Academe of Meteorological Science, China, 63 pp., https://kns.cnki.net/KCMS/detail/detail.aspx?dbname=CMFD201302&filename=1013212486.nh (last access: 6 June 2021), 2013 (in Chinese).
Spencer, J. W.: Fourier series representation of the position of the sun, Search, 2, 165–172, 1971.
Stokes, G. M. and Schwartz, S. E.: The Atmospheric Radiation Measurement (ARM) program: Programmatic background and design of the cloud and radiation test bed, B. Am. Meteorol. Soc., 75, 1201–1221, https://doi.org/10.1175/1520-0477(1994)075<1201:TARMPP>2.0.CO;2, 1994.
Vuilleumier, L., Hauser, M., Félix, C., Vignola, F., Blanc, P., Kazantzidis, A. and Calpini, B.: Accuracy of ground surface broadband shortwave radiation monitoring, J. Geophys. Res.-Atmos., 119, 13838–13860, https://doi.org/10.1002/2014JD022335, 2014.
Wang, L. C., Gong, W., Lin, A. W., and Hu, B.: Measurements and cloudiness influence on UV radiation in Central China, Int. J. Climatol., 34, 3417–3425, https://doi.org/10.1002/joc.3918, 2014.
Wang, Q. Y., Zhang, H., Yang, S., Chen, Q., Zhou, X. X., Shi, G. Y., Cheng, Y. M., and Wild, M.: Potential driving factors on surface solar radiation trends over China in recent years, Remote Sens., 13, 704, https://doi.org/10.3390/rs13040704, 2021.
Wang, S. T., Liu, X. N., Ma, S. Q., Chen, Y. Q., and Yang, Z. B.: Specifications for Surface Meteorological Observation Part 21: Processed of Missing Data and Statistic of Half-baked Data, QX/T 65–2007, China Meteorological Press, Beijing, 9 pp., 2007 (in Chinese).
Wei, X. L.: Quality assessment and trend analysis of solar radiation measured at Mt. Waliguan GAW station (1994–2008), MS thesis, Chinese Academe of Meteorological Science, China, 51 pp., https://kns.cnki.net/KCMS/detail/detail.aspx?dbname=CMFD2012&filename=2010088082.nh (last access: 24 September 2021), 2010 (in Chinese).
Weng, D. M., Sun, Z. A. and Wen, Z. Z.: Climatological study on downward atmospheric radiation in China, J. Nanjing Inst. Meteorol., 16, 1–6, https://doi.org/10.13878/j.cnki.dqkxxb.1993.01.001, 1993 (in Chinese).
Wild, M., Ohmura, A., and Gilgen, H.: Validation of general circulation model radiative fluxes using surface observations, J. Climate, 8, 1309–1324, https://doi.org/10.1175/1520-0442(1995)008<1309:VOGCMR>2.0.CO;2, 1995.
Wild, M., Dümenil, L., and Schulz, J. P.: Regional climate simulation with a high resolution GCM: surface hydrology, Clim. Dynam., 12, 755–774, https://doi.org/10.1007/s003820050141, 1996.
Wild, M., Gilgen, H., Roesch, A., Ohmura, A., Long, C. N., Dutton, E. G., Forgan, B., Kallis, A., Russak, V., and Tsvetkov, A.: From dimming to brightening: Decadal changes in solar radiation at Earth's surface, Science, 308, 847–850, https://doi.org/10.1126/science.1103215, 2005.
Wild, M., Long, C. N., and Ohmura, A.: Evaluation of clear-sky solar fluxes in GCMs participating in AMIP and IPCC-AR4 from a surface perspective, J. Geophys. Res., 111, D01104, https://doi.org/10.1029/2005JD006118, 2006.
Wild, M., Trüssel, B., Ohmura, A., Long, C. N., König-Langlo, G., Dutton, E. G., and Tsvetkov, A.: Global dimming and brightening: An update beyond 2000, J. Geophys. Res., 114, D00D13, https://doi.org/10.1029/2008JD011382, 2009.
Wild, M., Hakuba, M. Z., Folini, D., Dörig-Ott, P., Schär, C., Kato, S., and Long, C. N.: The cloud-free global energy balance and inferred cloud radiative effects: an assessment based on direct observations and climate models, Clim. Dynam., 52, 4787–4812, https://doi.org/10.1007/s00382-018-4413-y, 2019.
WMO: Guide to Meteorological Instruments and Methods of Observation – Preliminary Seventh Edition, WMO- No. 8, WMO, Geneva, Switzerland, 569 pp., https://www.seedmech.com/documents_folder/wmo_no_8.pdf (last access: 16 July 2020), 2006.
Yan, H. R., Huang, J. P., Minnis, P., Wang, T. H., and Bi, J. R.: Comparison of CERES surface radiation fluxes with surface observations over Loess Plateau, Remote Sens. Environ., 115, 1489–1500, https://doi.org/10.1016/j.rse.2011.02.008, 2011.
Yang, D. Z. and Boland, J.: Satellite-augmented diffuse solar radiation separation models, J. Renew. Sustain. Ener., 11, 023705, https://doi.org/10.1063/1.5087463, 2019.
Yang, D. Z., Wang, W. T., and Xia, X. A.: A concise overview on solar resource assessment and forecasting, Adv. Atmos. Sci., 39, 1239–1251, https://doi.org/10.1007/s00376-021-1372-8, 2022.
Yang, J., Hu, J., Chen, Q., and Quan, W.: Parameterization of downward long-wave radiation based on long-term baseline surface radiation measurements in China, Atmos. Chem. Phys., 23, 4419–4430, https://doi.org/10.5194/acp-23-4419-2023, 2023.
Yang, Y., Quan, J. M., Ding, L., and Bian, Z. Q.: National solar radiation measurement standards and quality control, J. Appl. Meteor. Sci., 26, 95–102, https://doi.org/10.11898/1001-7313.20150110, 2015 (in Chinese).
Younes, S., Claywell, R., and Muneer, T.: Quality control of solar radiation data: Present status and proposed new approaches, Energy, 30, 1533–1549, https://doi.org/10.1016/j.energy.2004.04.031, 2005.
Yu, Y.: Analysis of Solar Radiation Measurement Data at Xianghe Atmospheric Observation Station, M.S. thesis, Nanjing University of Information Science and Technology, China, 74 pp., https://kns.cnki.net/KCMS/detail/detail.aspx?dbname=CMFD0506&filename=2006066567.nh (last access: 22 March 2022), 2006 (in Chinese).
Yu, Y., Chen, H. B., Xia, X. A., Wang, P. C., and Li, Z. Q.: Observations and analyses on Photosynthetically Active Radiation (PAR) in Xianghe region, Plateau Meteorol., 27, 1094–1101, 2008 (in Chinese).
Zhang, T. P., Stackhouse Jr., P. W., Gupta, S. K., Cox, S. J., Mikovitz, J. C., and Hinkelman, L. M.: The validation of the GEWEX SRB surface shortwave flux data products using BSRN measurements: A systematic quality control, production and application approach, J. Quant. Spectrosc. Ra., 122, 127–140, https://doi.org/10.1016/j.jqsrt.2012.10.004, 2013.
Zhou, H. G., Quan, W. J., Wang, Z. F., Li, X. L., Li, Y. R., and Zhao, H. J.: Comparison of sunshine duration measurements between a Jordan sunshine recorder and three automatic sensors at Shangdianzi GAW station, J. Meteorol. Res., 35, 716–728, https://doi.org/10.1007/s13351-021-0158-3, 2021.
Zhou, X. J.: Chinese Background Atmospheric Baseline Observatory Summary of Progress Reports: 1994–2004 (Chinese Edition), 98 pp., Beijing, China Meteorological Press, ISBN 7502939563, 2005 (in Chinese).