the Creative Commons Attribution 4.0 License.
the Creative Commons Attribution 4.0 License.
 | 09 Feb 2024
GloCAB: global cropland burned area from mid-2002 to 2020
Joanne V. Hall
Fernanda Argueta
Maria Zubkova
Yang Chen
James T. Randerson
Louis Giglio
Burned area estimates are an essential component of cropland management systems, inventory-based fire emission calculations, and air quality models, and any inaccuracies in these estimates propagate into the final outputs and decision-making process. While satellite-based global burned area and fire emission datasets (e.g., GFED, FireCCI51, and MCD64A1) are frequently cited in the scientific literature and are employed by a range of users from atmospheric and carbon modelers to policy-makers, they are generally not optimized for cropland burning – a quintessential small-fire type. Here we describe a new dataset (GloCAB; global cropland area burned) which represents the first attempt at a global cropland-focused burned area product. The GloCAB dataset provides global, monthly cropland burned area at 0.25∘ spatial resolution from July 2002 to December 2020. Crop-specific burned area conversion factors for several widespread burnable crops (winter wheat, spring wheat, maize, rice, and sugarcane) were calculated from extensively mapped cropland reference regions spanning 191 560 fields over 5 different countries. We found global annual cropland burned area (2003–2020) ranged between 64 Mha (2018) and 102 Mha (2008) with an average of 81 Mha using our lower-bound estimates, which are substantially higher than the annual average of 32 Mha in the MCD64A1 C6 product. Region-specific trend analysis found some areas with significant increasing trends (northwest India), while the heterogeneity of many other regions showed no burned area trends. The GloCAB product is freely accessible at https://doi.org/10.5281/zenodo.7860452 (Hall et al., 2023).
- Article
(6742 KB) - Full-text XML
- Companion paper
-
Supplement
(1598 KB) - BibTeX
- EndNote


Burned area estimates are an essential component of inventory-based fire emission calculations (e.g., Seiler and Crutzen, 1980; UNFCCC, 2022), and any inaccuracies in this component contribute to uncertainties in estimates of emissions and fire impacts on atmospheric composition. Satellite-based global burned area and fire emission datasets are generally not optimized for cropland burning – a quintessential small-fire type – yet these datasets are frequently employed by a broad range of users from atmospheric and carbon modelers to policy-makers in the context of cropland fire monitoring. Reliable remotely sensed fire products are required to quantify trends in fire occurrence and behavior, assess impacts of biomass burning on social and environmental systems, characterize fire behavior and potential future risks, and provide key inputs to fire emission and air quality models. Cropland burned area and associated emission estimates have been incorporated into socioeconomic decisions, such as economic incentives to reduce crop-residue burning (Jack et al., 2022), extension service programs (e.g., ABC-iCAP, 2022), public health policy (e.g., USDA, 1999), and national emission inventories (e.g., UNFCCC, 2022). Despite the widespread use of cropland burned area and emission estimates, the methodologies used to produce these estimates are often not well adapted to the complications that are specific to agricultural fires.
Fire management in agricultural landscapes typically occurs either before planting a new crop or after harvest, depending on a range of factors that include crop type, double-cropping, available machinery, pest control, and socioeconomic circumstances (e.g., McCarty et al., 2007). For example, sugarcane is typically burned before harvest to get rid of pests before it is (often) manually harvested; however, there has been a growing trend toward harvesting “green cane”, as mechanization has improved in many areas around the world (Leal et al., 2013; Pryor et al., 2017). This socioeconomic shift toward reducing burning has implications for mapping products that employ assumptions about the burning characteristics within this heterogeneous landscape. Further, double-cropping areas, such as the rice and corn rotations in Arkansas, United States, often result in burning of the rice residue after harvest and before planting of the corn. Despite the level of mechanization in this area, burning still helps clear the fields quickly before the next planting. The heterogeneity of cropland fire types, the small field sizes, and the quick nature of these burns result in a very difficult mapping problem that requires specialized methodology to help improve the accuracy of these burns within burned area and emission products.
Although a single cropland fire has negligible emissions compared to a large wildfire, improved representation of crop-residue burned area and emissions is essential for detection and attribution of trends in air quality in many regions (e.g., Yevich and Logan, 2003; Liu et al., 2021). Post-harvest and/or pre-planting agricultural fires are recurrent, typically occurring once or twice a year (McCarty et al., 2009; Zhang et al., 2018). Due to similar local weather conditions and planting/harvesting cycles in many areas, these fires often occur on or around the same day leading to a pulse of emissions across a region. Given the proximity of cropland fields to population centers and the magnitude of these emission pulses, health impacts related to exposure from repeated crop-residue burning can be extensive (e.g., Argarwal et al., 2013; Saggu et al., 2018). In addition, despite the low atmospheric injection heights of these burns, crop-residue emissions have the potential to travel great distances and impact locations far beyond the cropland area (Zhou et al., 2018; Hall and Loboda, 2017). For example, Hall and Loboda (2017) found that black carbon emissions from crop-residue fires in Russia – as far south as 40∘ N – were transported to the Arctic and deposited on snow- and ice-covered areas. Due to the seasonal timing of the spring pre-planting fires in Russia, the black carbon contributed to the accelerated melting of snow and sea ice (Hall and Loboda, 2017, 2018). Finally, the widespread use of global burned area and emission products, such as the Global Fire Emissions Database (GFED; van der Werf et al., 2017), within the scientific community (e.g., Friedlingstein et al., 2020; Gao et al., 2018; Kong et al., 2021; Lin et al., 2020) can compound systematic and random errors in cropland burned area and emission estimates. The increasing conversion to cropland observed around the world (particularly in Africa; e.g., Brink et al., 2014; Abera et al., 2020; Li et al., 2019) will likely further increase the need for crop-specific remote sensing approaches that take into account regional and crop-specific differences in management practice and satellite detection efficiencies.
Many factors make accurate satellite-based mapping of crop-residue burned area particularly challenging, including (i) the heterogeneity of the global agricultural landscape, (ii) the rapid nature of these burns and possible subsequent plowing and/or seeding, and (iii) the human-driven changes in fire timing. To effectively map the spatial extent of these small fires, it is ideal to have remote sensing data with high temporal resolution (e.g., less than 2 h between observations (Hall et al., 2021a)), high spatial resolution (less than 10 m to capture pile burns and partial field burns), and appropriate spectral bands. Even using a combination of Landsat, Sentinel, and Planet imagery would not provide adequate coverage to capture the vast majority of these burns. Furthermore, unlike the 22-year Moderate Resolution Imaging Spectroradiometer (MODIS) record, the longevity and temporal coverage of the Sentinel and Planet platforms is not adequate for long-term studies. Therefore, designing a long-term, global cropland burned area dataset calls for a methodology that could balance these requirements while ensuring the magnitude of these fires is adequately captured.
Our new dataset (GloCAB; global cropland area burned) provides global, monthly cropland burned area at 0.25∘ spatial resolution from July 2002 to December 2020, encompassing the Aqua and Terra time period. Unlike many remotely sensed burned area datasets such as MCD64A1 (Giglio et al., 2018) and FireCCI51 (Lizundia-Loiola et al., 2020; Pettinari et al., 2021), our methodology does not attempt to directly map burned area. Instead, it aims to estimate the area of cropland burned in each grid cell based on a combination of MODIS active fire observations and our novel high-resolution database of mapped field-level burned area conversion factors. GloCAB presents a unique resource for improving the overall representation of cropland burning within global burned area and fire emission datasets. Version 1 presented here is a stepping stone toward addressing this gap by way of a crop-type-focused burned area methodology that addresses several of the limitations found in other global burned area products. Firstly, the active fire product is used as the primary fire input and offers both an accurate time of burning and is also able to identify fires that are much smaller than the minimum size that can be mapped with the MODIS burned area product (Giglio et al., 2003; McCarty et al., 2009). Although the Visible Infrared Imaging Radiometer Suite (VIIRS) 375 m active fire product (Schroeder et al., 2014) is even better suited for identifying small fires, the MODIS product has the longevity required for long-term analyses. Secondly, GloCAB is designed around a specialized cropland burned area reference dataset, comprising almost 200 000 manually classified cropland fields. This unique dataset allowed us to develop a new technique to estimate burned area from this highly ephemeral fire type. Finally, the use of MODIS data as the primary input allows for analysis of the impacts from changes in agricultural management practices over a period spanning more than two decades. Going forward, since the MODIS instruments will be decommissioned in the next few years, an inter-calibrated MODIS-VIIRS input data stream will be used to produce later versions of GloCAB as the forthcoming Collection 2 VIIRS land products become publicly available.
Here, we first present a description of the GloCAB methodology, followed by an intercomparison with the MODIS MCD64A1 burned area product (the primary input for the burned area component of GFED), global and regional assessments, and finally product caveats and conclusions.
2.1 MODIS land cover product
The Collection-6 MODIS 500 m Land Cover Type (MCD12Q1; Sulla-Menashe and Friedl, 2022) annual International Geosphere–Biosphere Programme (IGBP) classification product (2002–2020) Class 12 (Croplands) and Class 14 (Cropland/Natural Vegetation Mosaic) was used as the base cropland extent. Although other global products exist at a higher spatial scale (e.g., GFSAD30; Phalke et al., 2020), or are delineated by crop type for a single year (e.g., SPAM; International Food Policy Research Institute, 2019), the annual layers of the MCD12Q1 product have a temporal advantage given the nearly 20-year time span of this analysis. For this analysis, it was assumed that the MODIS IGBP cropland classes represented the full extent of cropland area each year. As with all remotely sensed land cover classification datasets, the product contains both omission and commission errors (e.g., Tsendbazar et al., 2016; Zubkova et al., 2023) that represent a significant source of uncertainty in our regional and global burned area estimates.
2.2 MODIS and VIIRS active fire products
The 1 km MODIS Aqua and Terra active fire location product (MCD14ML C6 V3; Giglio et al., 2016) served as the primary input dataset for GloCAB and was obtained from the University of Maryland's SFTP server (sftp://fuoco.geog.umd.edu, last access: 7 February 2024; Giglio et al., 2021). The MCD14ML product contains multiple variables including latitude, longitude, date, time, and type for each fire pixel. Active fire pixels were filtered to include only presumed vegetation fires (type = 0) having a center within 500 m of an MCD12Q1 IGBP class-12 or class-14 cropland grid cell. Filtering by pixel-center locations (versus spatially buffered active fire pixel boundaries) helped reduce the double-counting of active fires associated with neighboring land cover classes. The presumed cropland active fire points were summed per month within 0.25∘ grid cells. To account for the impact of latitude on the sampling frequency, and hence the number of active fires mapped, the monthly active fire counts per 0.25∘ grid cell (AFcount) were adjusted using Eq. (1) assuming a reference latitude of 40∘ N or, equivalently, 40∘ S (Giglio et al., 2006):
The adjusted MODIS Aqua and Terra monthly active fire counts (AFcorrected) were used in the calculation of the effective burned area per fire pixel per cropland burning reference region (see Sect. 3.1 for details) and the monthly adjusted burned area (Sect. 3.4).
The 0.25∘, monthly MODIS Aqua and Terra Active Fire Climate Modeling Grid (CMG) Collection-6 products (MOD14CMQ/MYD14CMQ; Giglio et al., 2006) were used to obtain the mean monthly cloud fraction over all cropland land cover pixels. The CMG products contain gridded summaries that include corrected fire pixel counts, mean cloud fraction, and mean fire radiative power.
The Collection-1 375 m VIIRS fire location product from Suomi NPP (VNP14IMGML; Schroeder et al., 2014) was also obtained from the University of Maryland's SFTP server. All active fire locations contain a number of attributes, including the latitude, longitude, date, and UTC time to the nearest minute. The VNPIMG14ML product was only used in the creation of the cropland burned area reference maps (see Sect. 3.1 for details) using the same approach as Hall et al. (2021a).
2.3 Global crop-type maps
We focused on five burnable crop types: winter wheat, maize, rice, spring wheat, and sugarcane. Although there are other crop types that burn (e.g., soybean and cotton), and other agricultural landscapes (e.g., pastures and orchards) within each 0.25∘ grid cell, we focused on these main crop types due to their larger global extent and greater proportion of under-represented fire activity (e.g., Becker-Reshef et al., 2023; Blickensdörfer et al., 2022; McCarty et al., 2009). Global crop-type maps were used to assign each 500 m MCD12Q1 IGBP cropland pixel a specific crop type. The crop-type data will be used to assign crop-specific burned area conversion factors and emission coefficients (Hall et al., 2022) in later steps, and are an improvement over the generic agricultural waste models often used in previous studies (e.g., GFED4.1s; van der Werf et al., 2017; Randerson et al., 2018).
The GEO Global Agricultural Monitoring (GEOGLAM) Best Available Global Crop-Specific (BACS) maps are available for several crops, including winter wheat, spring wheat, maize, and rice at 0.05∘ resolution (Becker-Reshef et al., 2020; Whitcraft et al., 2019). These crop percentage maps are continually updated and are only available as one layer per crop type. The GEOGLAM initiative is mainly focused on gathering data for the major crop-producing countries participating in the Agricultural Market Information System (AMIS): United States, Canada, Mexico, Brazil, Argentina, EU-28, Egypt, Nigeria, South Africa, Turkey, Saudi Arabia, Ukraine, Russia, Kazakhstan, China, India, Thailand, Viet Nam, Philippines, Indonesia, and Australia. These maps use a combination of the best-available remotely sensed crop maps for each region and crop type. These crop maps were resampled and projected to match the 500 m sinusoidal MCD12Q1 IGBP cropland layers. The GEOGLAM-BACS does not map sugarcane, therefore the 2010 Spatial Production Allocation Model (SPAM) global sugarcane physical area (0.08333∘ spatial resolution) data layer was also resampled and projected to match the MCD12Q1 cropland layers (International Food Policy Research Institute, 2019).
Any areas where the crop-type maps and the MCD12Q1 cropland did not agree were either assigned as a “generic” crop or were eliminated at the 500 m scale. Specifically, if the MCD12Q1 product labeled a pixel as cropland, and none of the five crop-type maps had an associated crop percentage, then that 500 m grid cell was recorded as a “generic” crop type. These 500 m crop type maps (Fig. 1) are used in the calculation of the majority crop type that burns per month per 0.25∘ grid cell (see Sect. 3.3 for details).
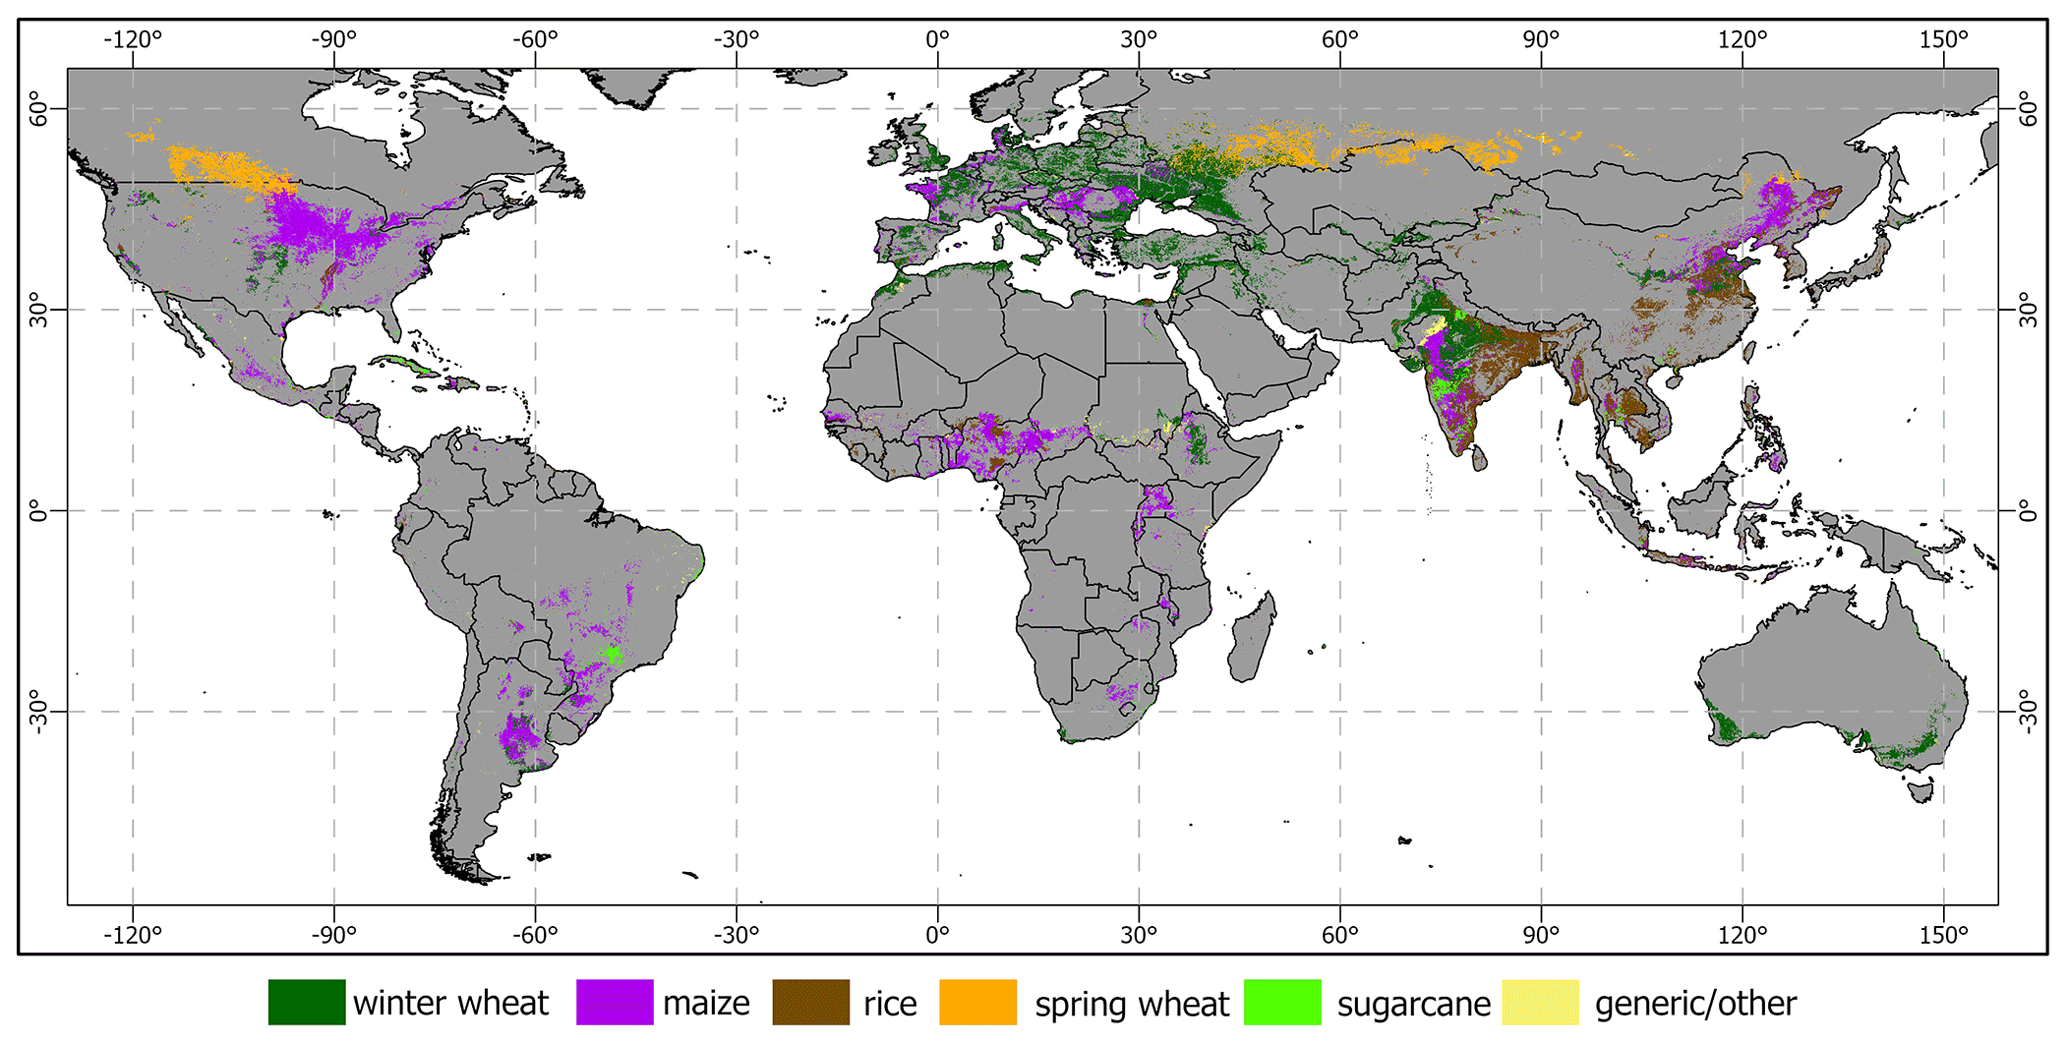
Figure 1Example of a 500 m converted crop-type MODIS MCD12Q1 cropland layer. The coarser-resolution crop-type data from GEOGLAM-BACS and SPAM were used in the creation of these 500 m annual layers. These annual layers, in conjunction with the MODIS active fire location product, are used in the generation of the majority crop type that burns per month per 0.25∘ grid cell (see Sect. 3.3 for details).
3.1 Cropland burning reference areas
Overall, 24 cropland burning reference areas were manually digitized and each polygon classified to create highly detailed cropland field maps over a range of countries, crop types, and dates (Table 1; Fig. 2). These reference areas, in conjunction with the MODIS active fire data, were used to calculate the effective burned area per fire pixel (α), which ultimately serves as a conversion factor that is used to extrapolate our reference areas to much larger regions (Giglio et al., 2006; see Sect. 3.2). These regions are an extension of previously created cropland field-level burned area maps within Ukraine (Hall et al., 2021a, b) using a combination of all available 20 m Sentinel-2 Multi-Spectral Instrument (MSI), 30 m Landsat-8 Operational Land Imager (OLI), and 3 m PlanetScope imagery, in conjunction with filtered VIIRS (VNP14IMGML) and MODIS (MCD14ML) active fire location data. The creation of the reference regions used the more sensitive 375 m VIIRS active fires alongside the 1 km MODIS active fires as an independent verification for some of the burned fields.
Each digitized polygon was classified via visual interpretation of all available imagery and attributed with the following field classification: 1 = active flame/smoke or burned area with corresponding active fire polygon (i.e., an overlapping polygon with a date aligned with the visual change on the field); 2 = definite burned area but with no flame/smoke or active fire point; 3 = ambiguous (a distinct darkening occurred on the field, but the analysts are unsure if the field was burned then plowed or only plowed); 4 = definitely unburned; 5 = not cropland or fields are too small that land cover conditions were difficult to determine on very high resolution (3 m) imagery. Each Class 1, 2, and 3 polygon was also tagged with the fraction burned (see Hall et al., 2021a for details). For the sake of clarity, the classes will hereafter be referenced using the following naming convention: definite burn (Classes 1 and 2), possible burn (Class 3), unburned (Class 4), and non-cropland/other (Class 5). In total, 191 560 cropland fields were manually digitized by a team of 20 trained analysts and classified as either a definite burn, possible burn, or unburned.
Table 1Summary information on the 20 training reference areas used in the burned area conversion factor analysis and the four validation reference regions. The locations of reference areas are shown in Fig. 2.
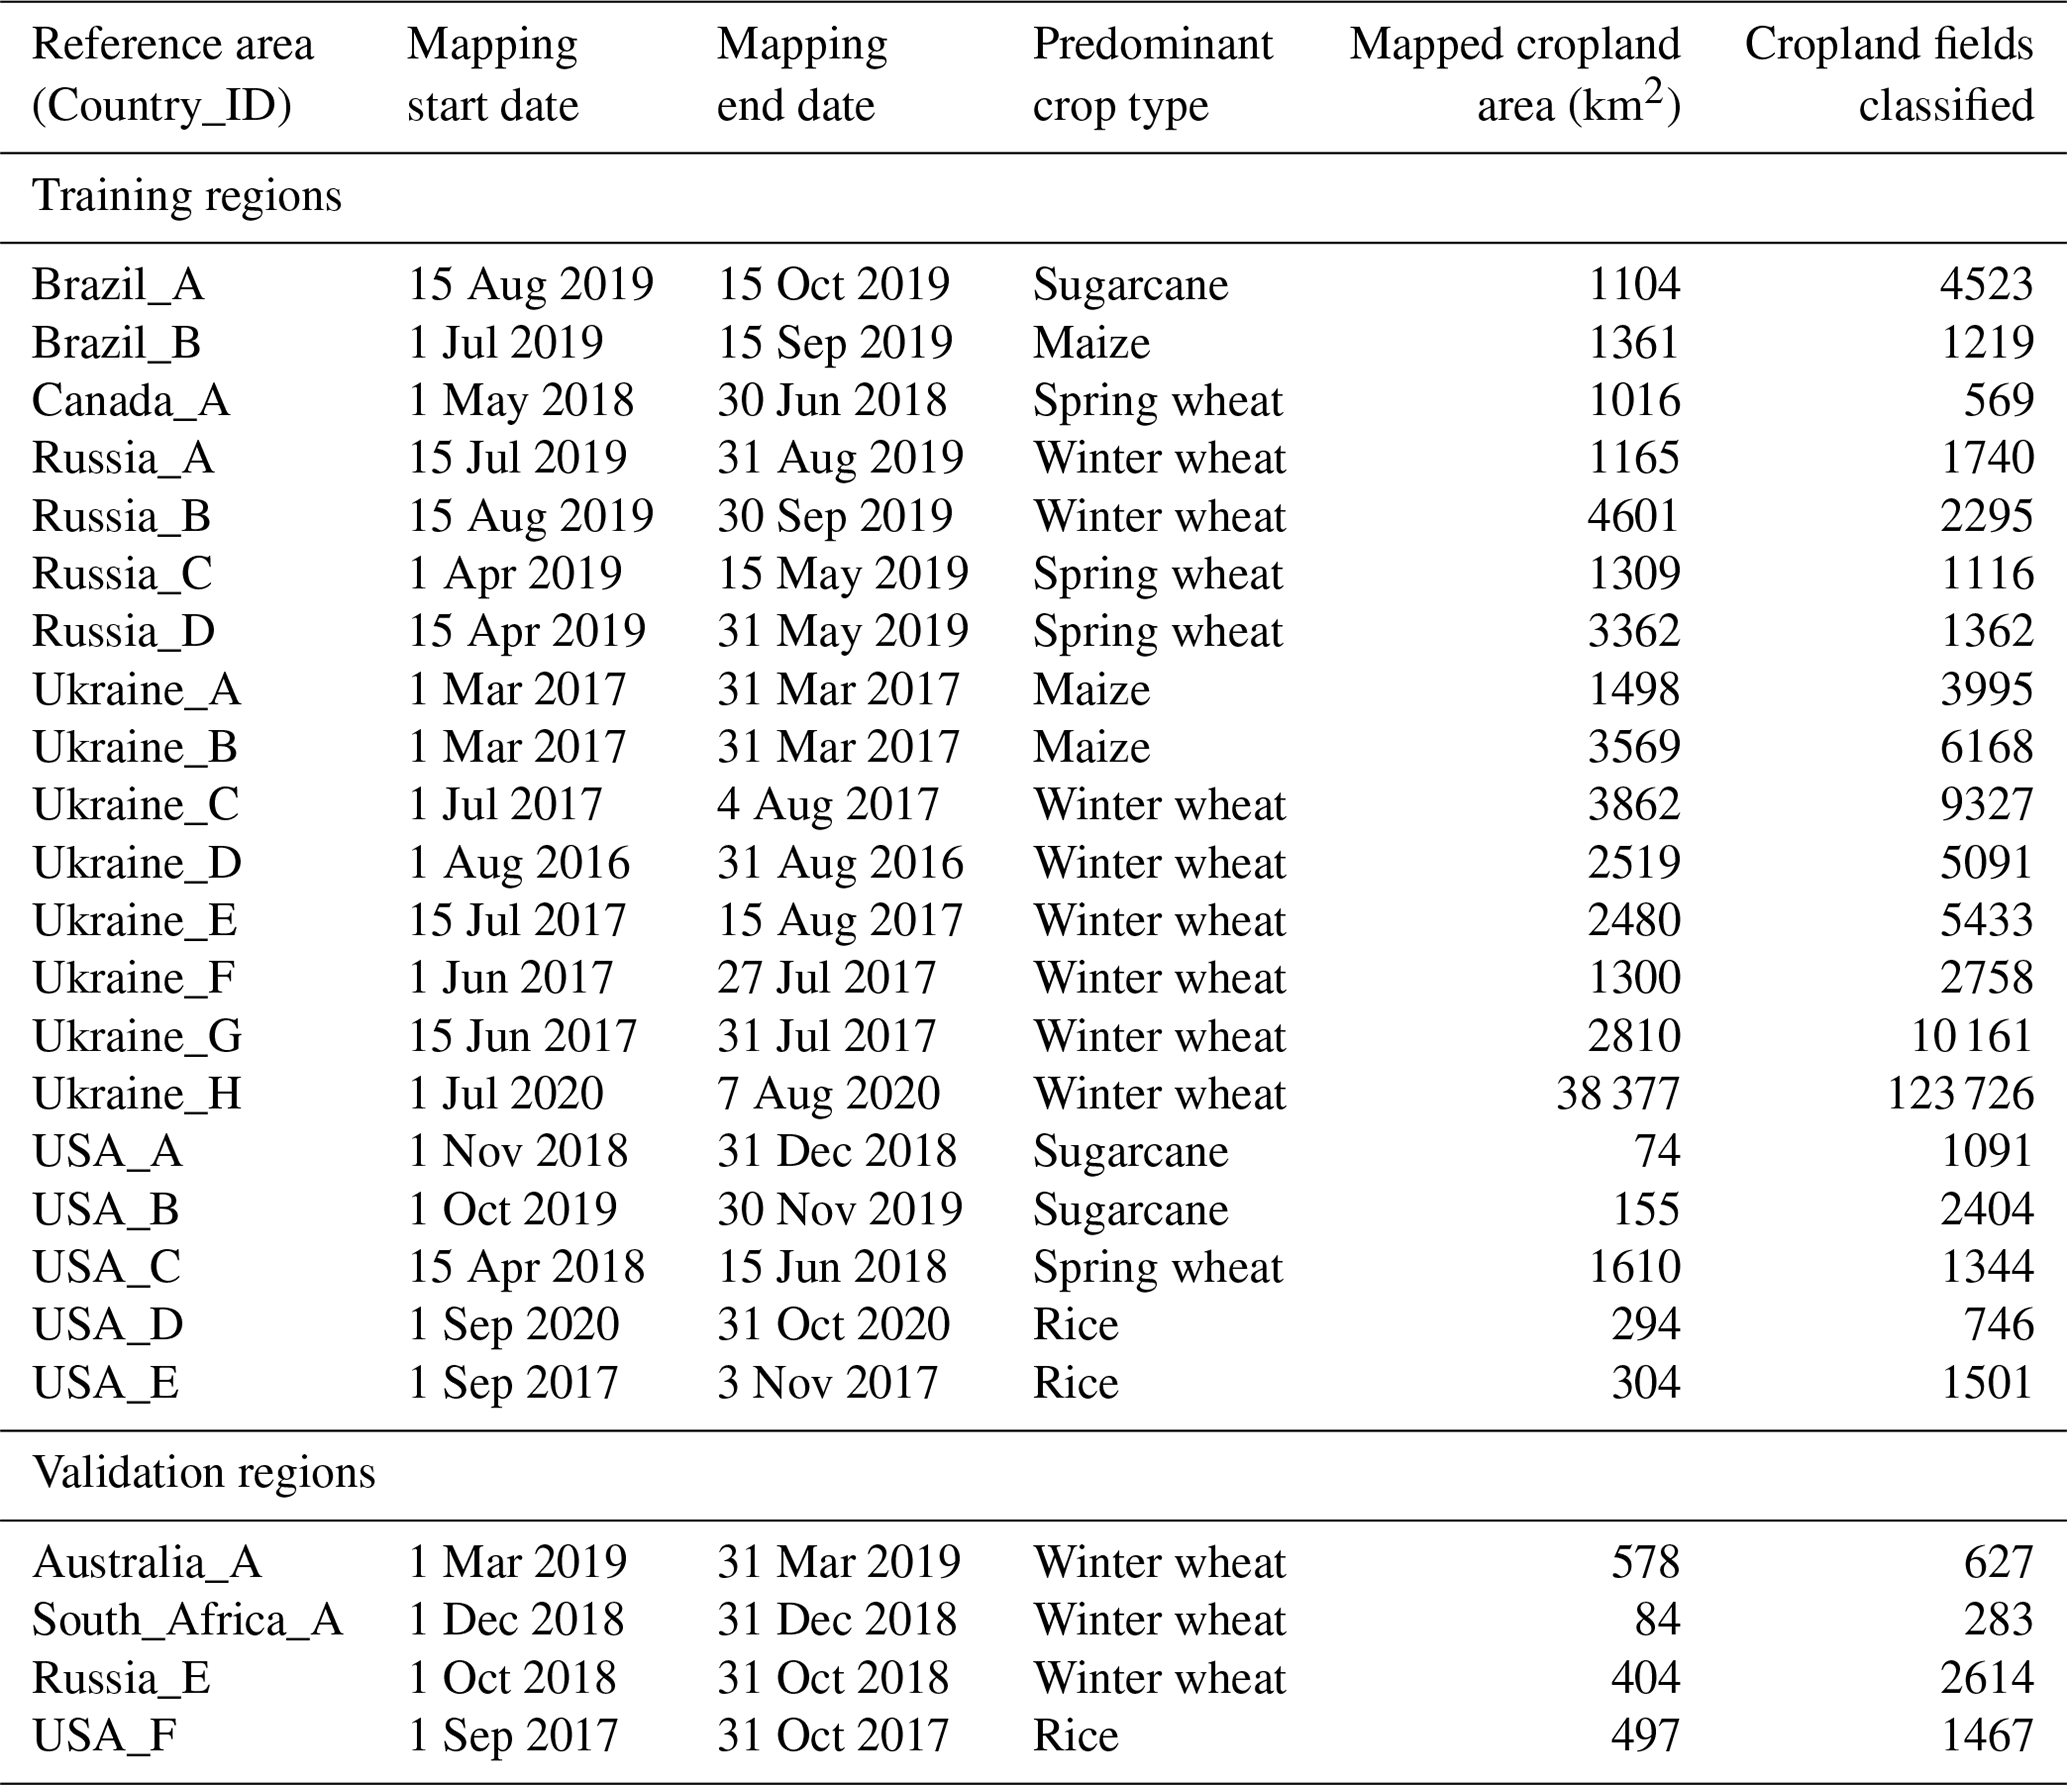
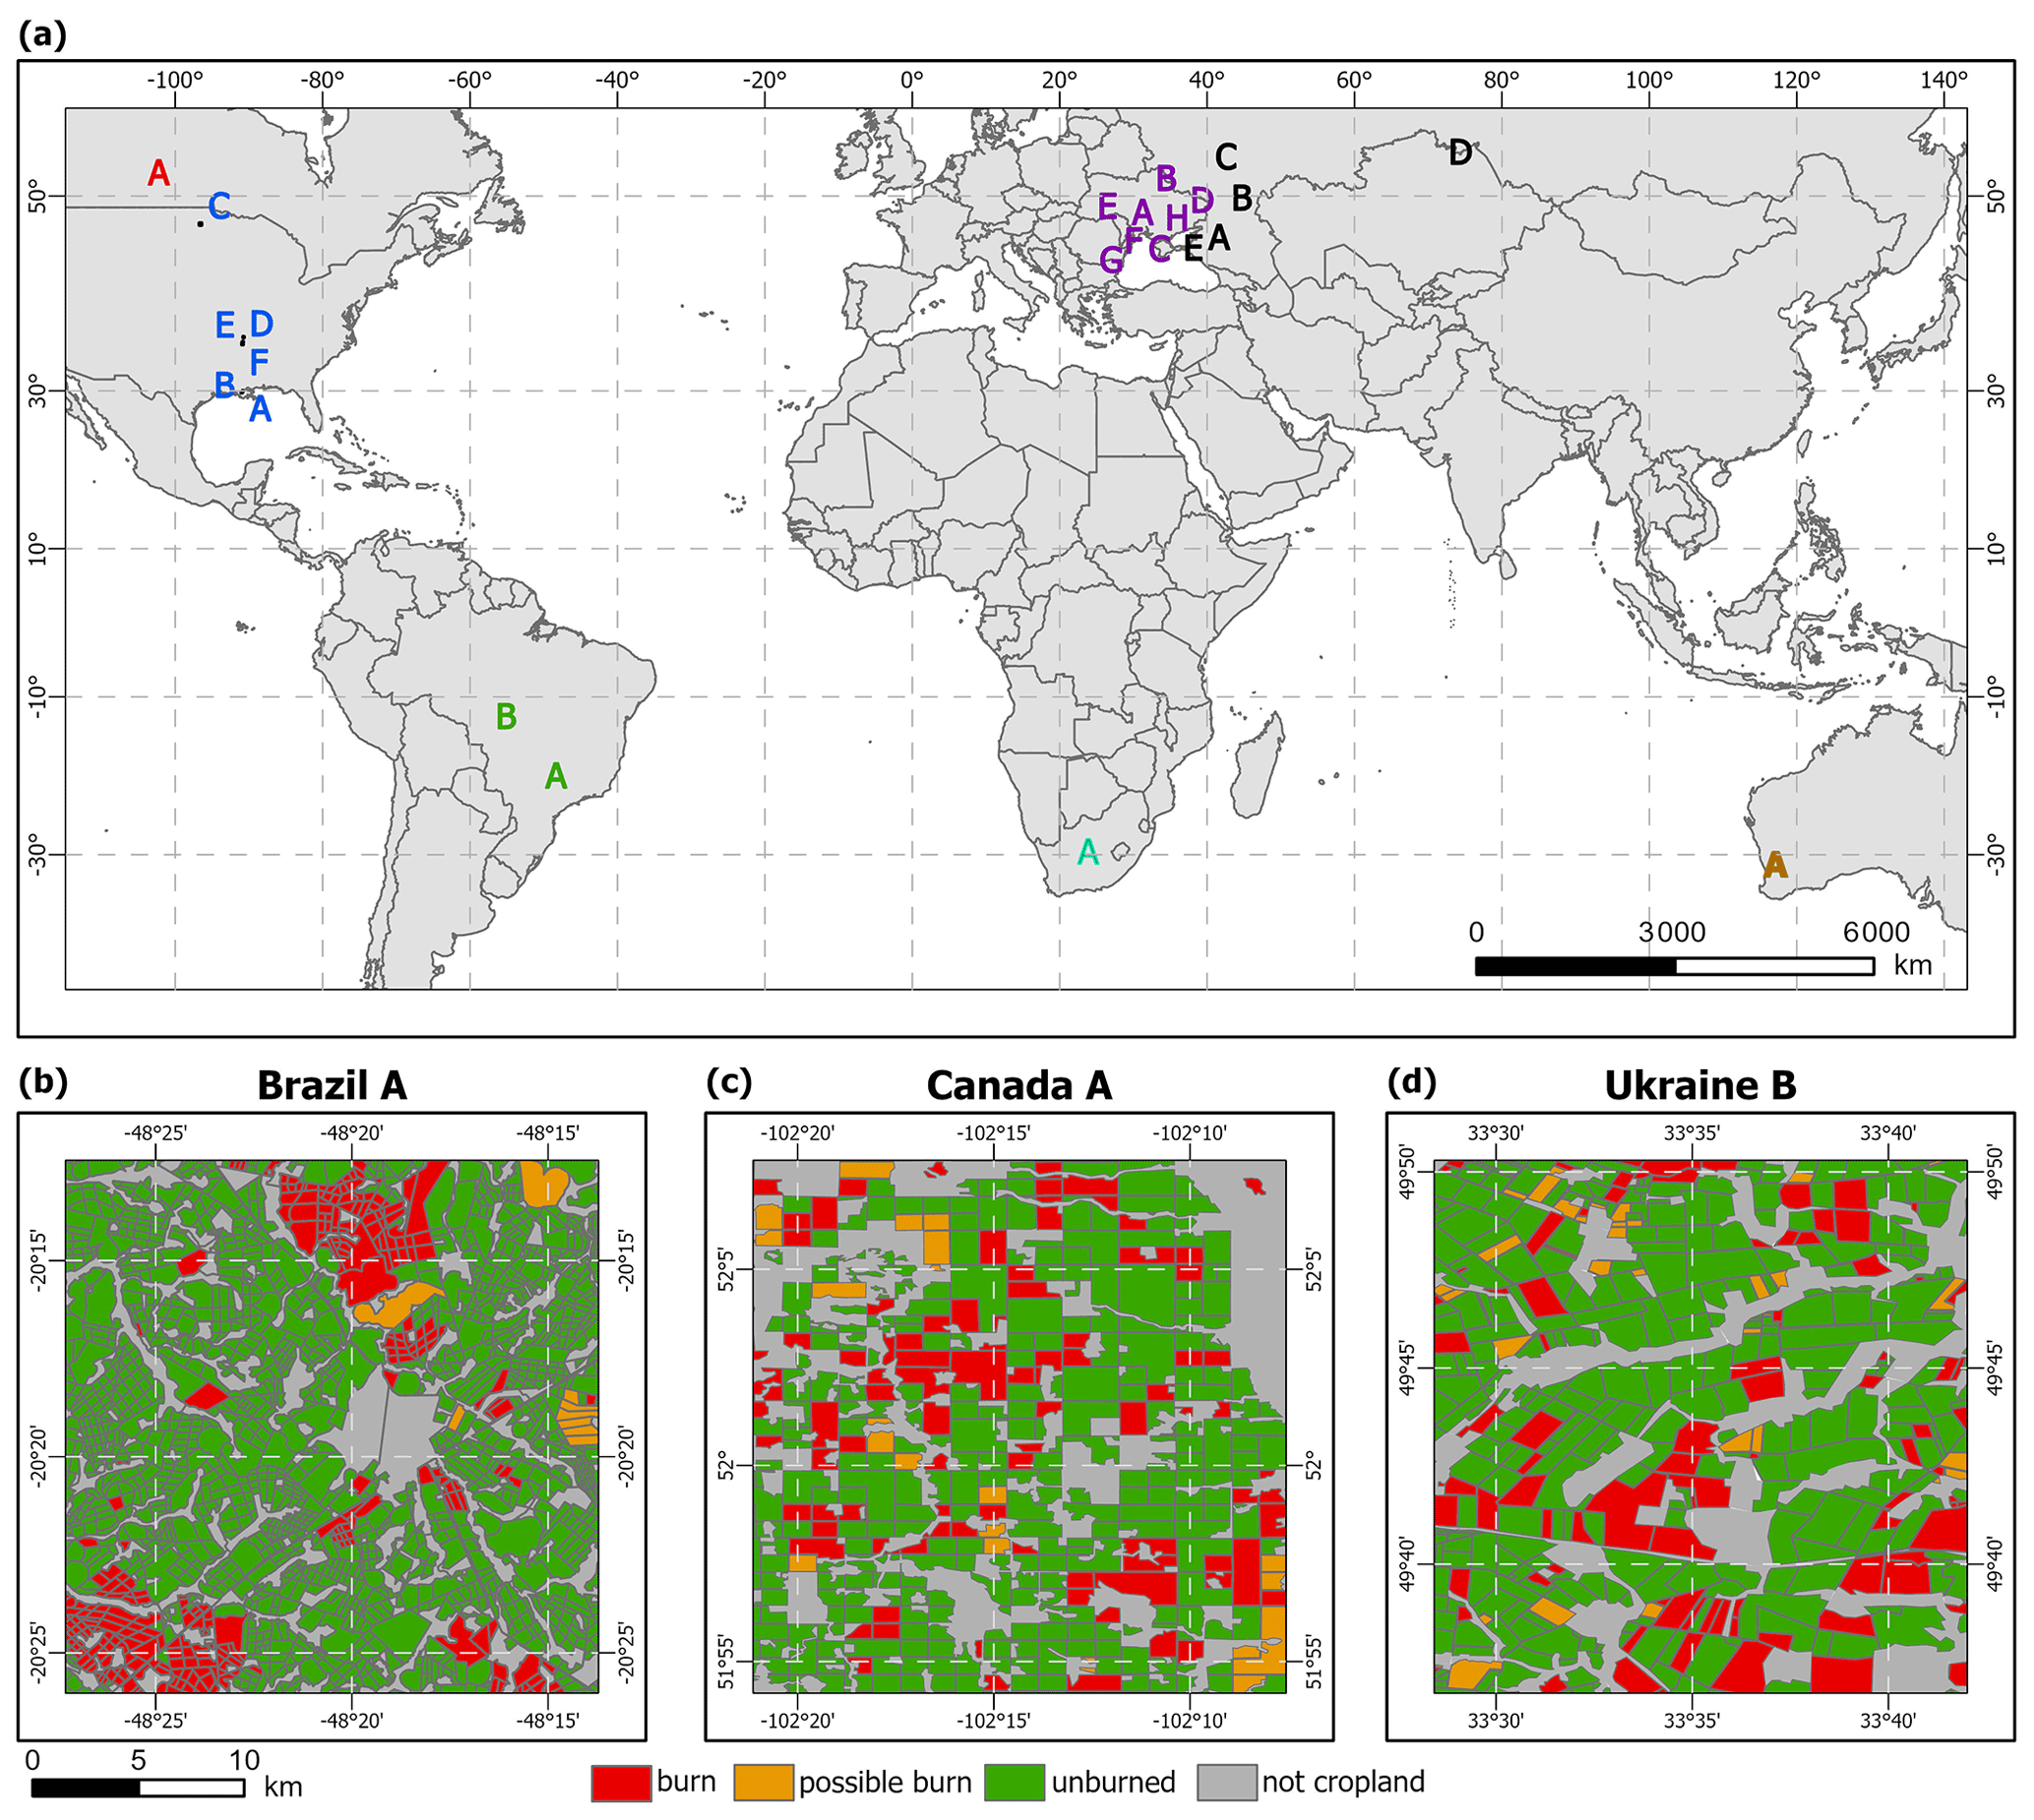
Figure 2Location of the 24 mapped reference areas (a) with examples of the field-level mapped reference regions from Brazil (b; 15 August–15 October 2019), Canada (c; 1 May 2018–30 June 2018), and Ukraine (d; 1–31 March 2017). These examples illustrate the variety in cropland fields witnessed during the mapping process. For visual distinction, the colored letters in (a) represent individual countries: green (Brazil), blue (USA), red (Canada), purple (Ukraine), black (Russia), cyan (South Africa), and brown (Australia).
3.2 Effective burned area per fire pixel
As in Hall et al. (2021a), the conversion factor α was used to extrapolate our high-resolution reference areas to much larger regions. Because our high-resolution reference areas include an indeterminate label (Class 3) for fields that could not be unambiguously labeled as burned or unburned, we calculated a lower limit conversion factor (αL) using only the fields with definitive burns (Classes 1 and 2) and an upper limit conversion factor (αH) using the definitive burns (Classes 1 and 2) and the ambiguously labeled burned fields (Class 3). The area of each burned field for Classes 1, 2, and 3 was weighted by its burned area fraction, summed, and then divided by the total number of cropland-filtered MODIS active fire points within the spatial and temporal constraints of each reference area, i.e.,
Although care was taken to account for different crop burning seasons, crop types, and spatial locations within the 20 training reference areas, several challenges limited the mapping. Most importantly, small fields and poor air quality in several countries (e.g., India and Thailand) prevented the analysts from observing changes in the fields even with 3 m Planet data. This resulted in the spatial distribution of our 24 reference areas being focused in high-density cropland regions with fields large enough to confidently identify the changing conditions (Fig. 2). Therefore, the final αL and αH values for each crop type were based on the median values of a particular combination of reference regions (see Tables 2 and 3); the generic crop type was assigned the median value of all 20 training reference regions. We chose the median value over the mean to reduce the impact of any outliers.
Table 2Low (αL) and high (αH) conversion factors and the adjusted sum of MODIS Aqua and Terra (A&T) active fire counts for each reference area. The lower limit conversion factor (αL) represents the effective burned area per fire pixel when only including the fields with definitive burns (Classes 1 and 2), whereas, the higher limit conversion factor (αH) includes both the definite burned fields and the ambiguous fields (Class 3). The locations of the reference areas are shown in Fig. 2.
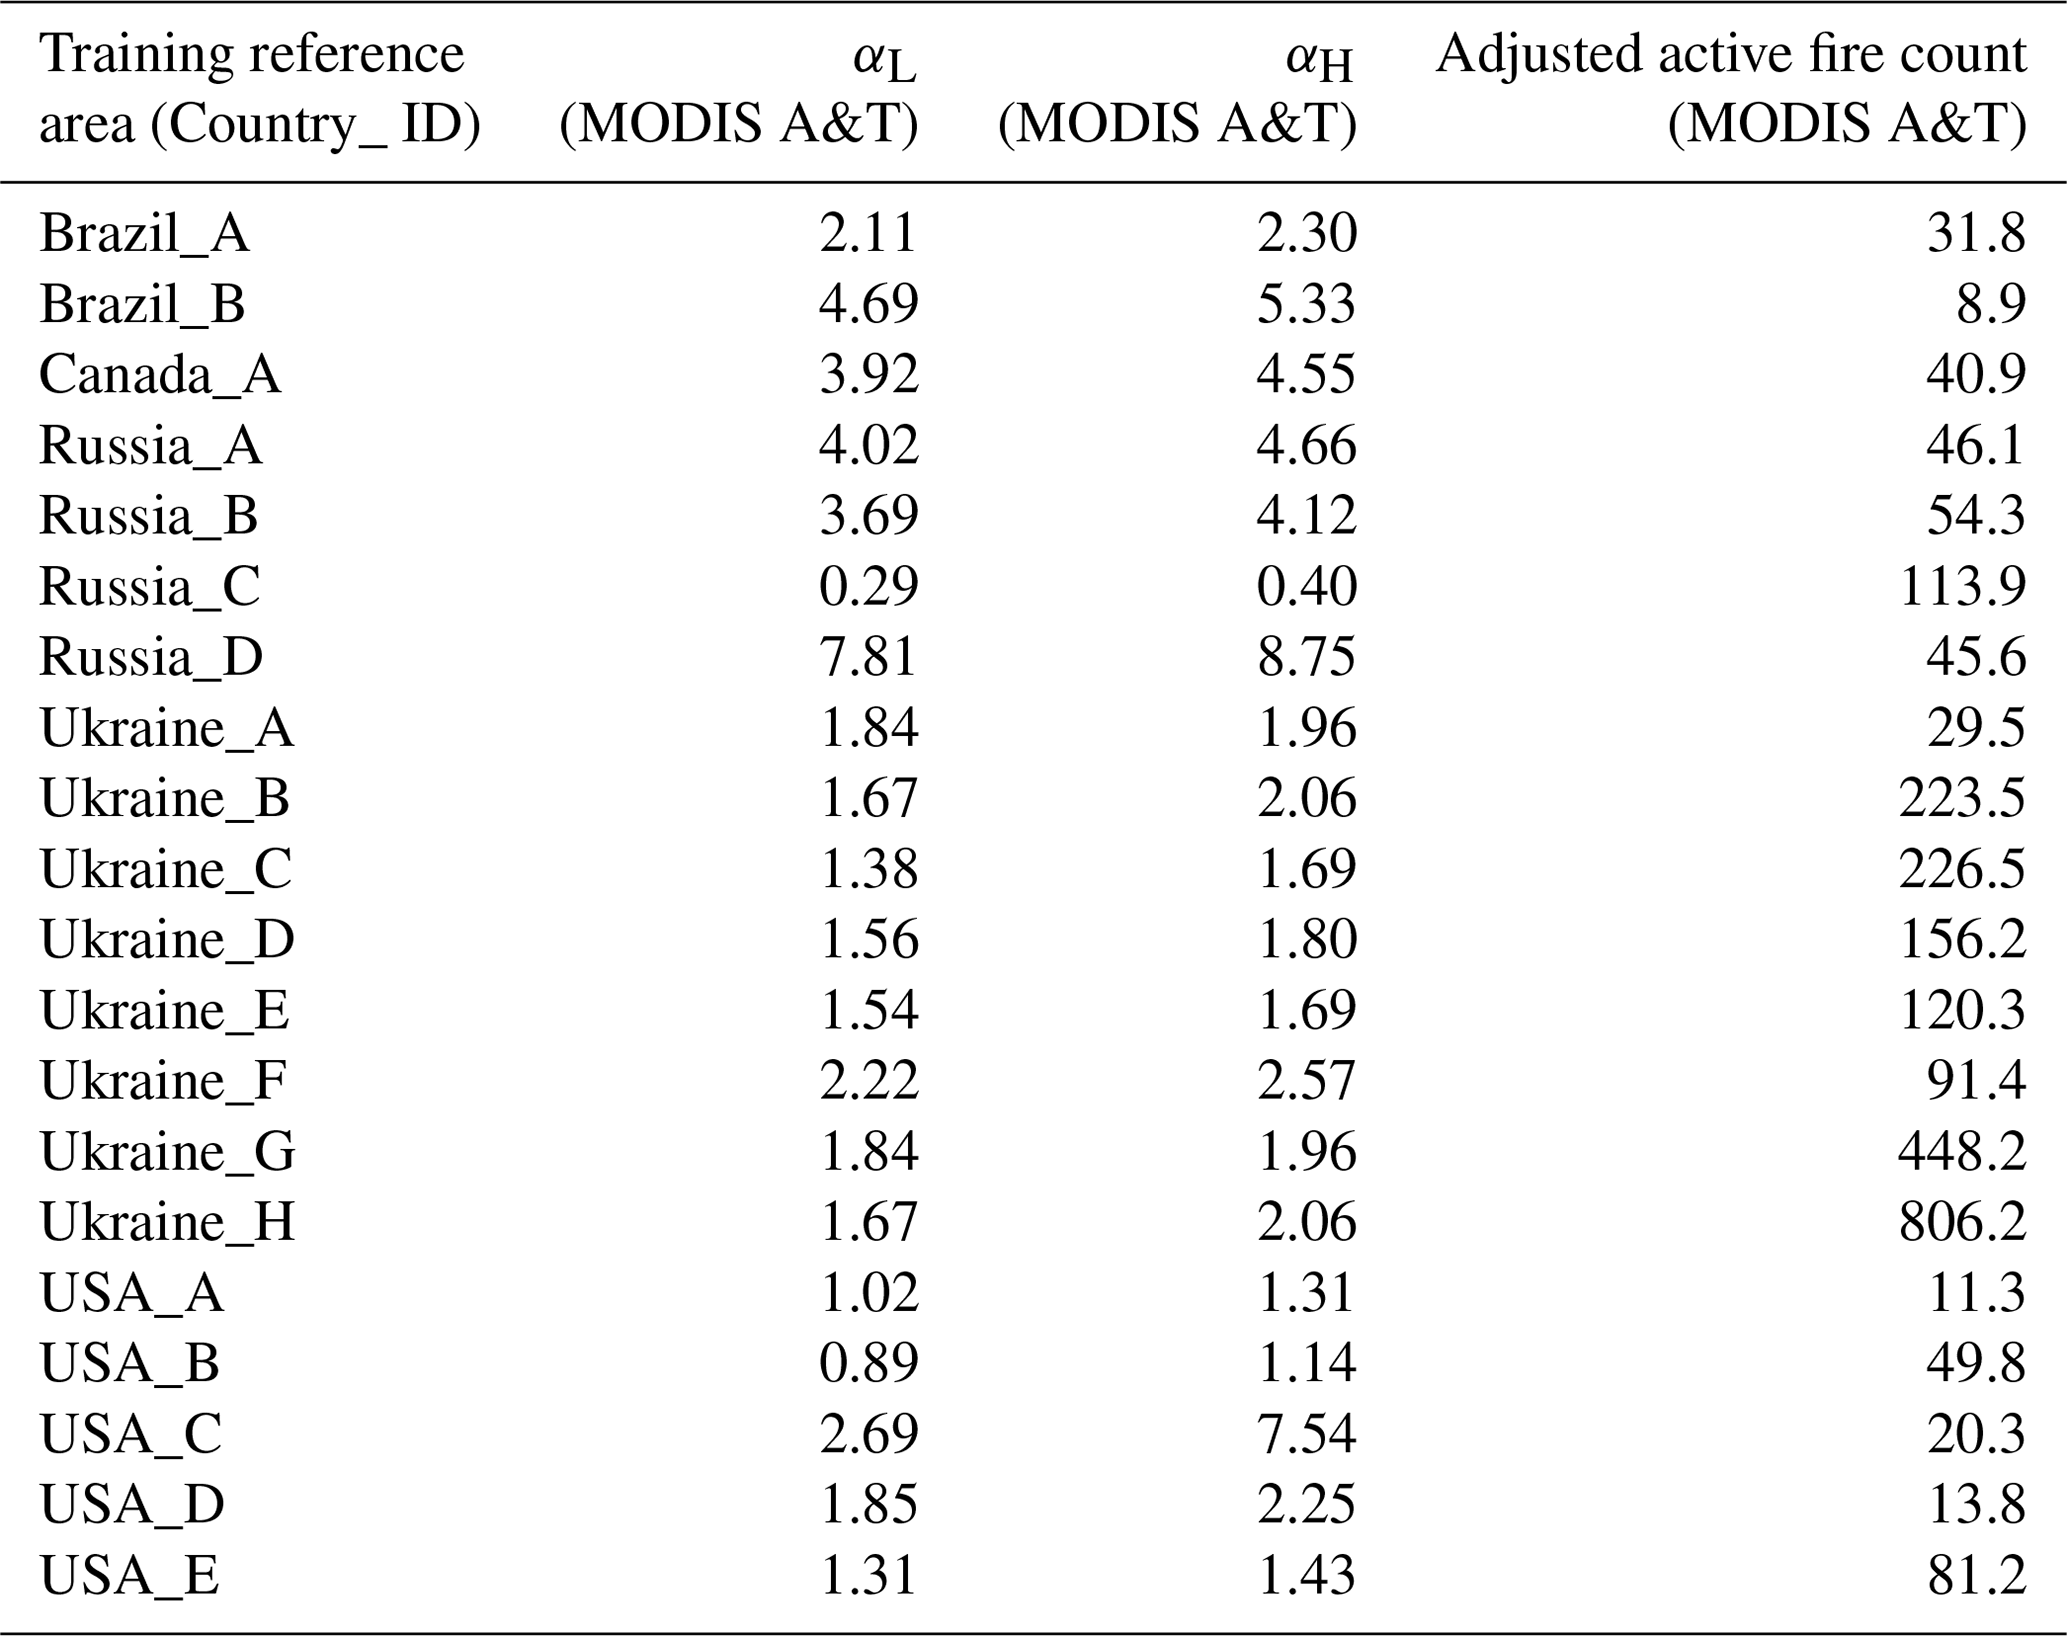
Table 3Low (αL) and high (αH) conversion factors for each crop type used in the calculation of the monthly adjusted burned area.
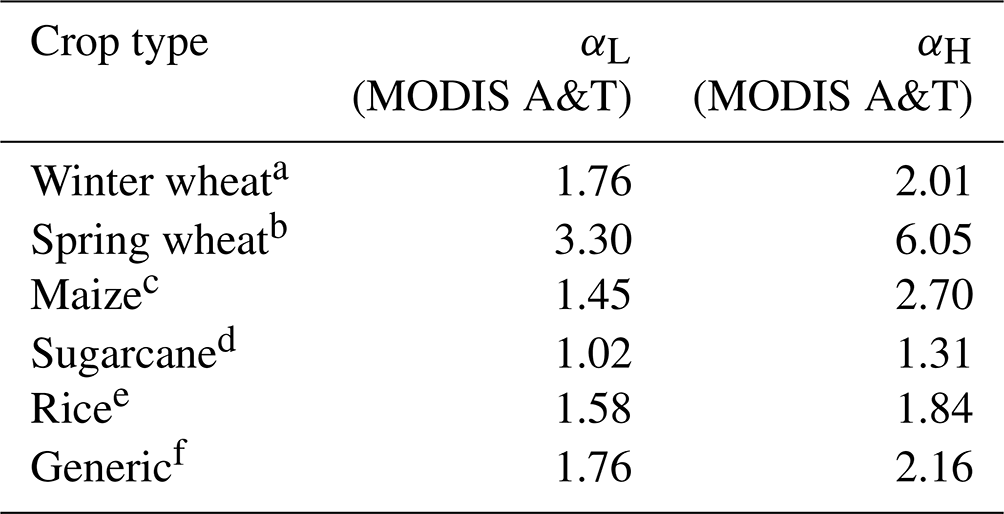
a Median Ukraine (C–H) and Russia (A and B) summer reference areas. b Median Russia (C and D) spring, Canada (A), and United States (C) reference areas. c Median Ukraine (A and B) spring and Brazil (B) reference areas. d Median United States (A and B) and Brazil (A) reference areas. e Median United States (D and E) reference areas. f Median of all training reference regions.
3.3 Monthly majority crop type that burns in 0.25∘ grid cells
To assign the appropriate value of α to the larger 0.25∘ grid cell, we first identified the majority crop type (winter wheat, spring wheat, maize, rice, sugarcane, or other/generic) associated with burning – at the 500 m scale – within the grid cell each month. The 500 m sinusoidal crop-type maps (Sect. 2.3) were reprojected and resampled to 0.005∘ to nest inside the larger 0.25∘ grid cell. The filtered MCD14ML fire pixels were then associated with these 0.005∘ crop-type grid cells to identify the crop types that burned that month. The majority crop type within a 0.25∘ grid cell was chosen based on the number of “burned” 0.005∘ cells. If there was a tie (i.e., more than one crop type had the same number of active fires) then the majority crop type for that 0.25∘ grid cell was assigned the crop type with the lowest ObjectID (ArcGIS Shapefile database) of those tied classes. This data layer is not only used to assign the crop type α values (Sect. 3.2) but will also be used in a later emissions analysis to assign crop-specific emission factors and combustion completeness.
3.4 Monthly adjusted burned area in 0.25∘ grid cells
Monthly burned area was estimated by multiplying the crop-specific α values by the adjusted active fire counts per 0.25∘ grid cell. Adjustments to these layers were needed to ensure the burned area did not exceed the crop area. Typically, crop-residue burning occurs once or twice a year depending on the crop type and agricultural practices. Depending on the crop type, the two main burning periods occur either before planting and/or after harvest (e.g., Lasko and Vadrevu, 2018; McCarty et al., 2007; Rangel et al., 2018) and often occur in spring and late summer/fall seasons. To account for any double burning within a 12-month period, the final burned area was adjusted to ensure the 6-month cumulative sum (centered on the peak burning month) did not exceed the crop area within the 0.25∘ grid cell. The peak burning month was calculated over larger 1∘ grid cells to identify the month with the largest number of fires on average between July 2002 and December 2020 and this formed the “middle” month of the initial 6-month window. For example, if the peak month of a 1∘ cell was August, the first 6-month window quantified the cumulative burned area between May and October (encompasses the peak in the middle) and compared that with the cropland area, while the second 6-month window quantified the cumulative burned area between November and April (encompasses a second smaller peak if there was double burning in that region). If there was a tie for peak month, the earliest month was chosen. Quality assessment layers were created to identify the grid cells that were scaled to match the crop area within the 6-month window.
3.5 Cloud cover analysis
An implicit assumption in estimating burned area with counts of active fire pixels (Sect. 3.4) is that the proportion of fire pixels obscured by cloud (and which were therefore not reported in the MODIS fire product) is approximately the same each burning season. Here it is important to distinguish between raining versus non-raining clouds, and during the cropland burning season we are primarily dealing with the latter; thus for this category of burning, clouds must be treated as a source of missed rather than suppressed fires. To understand the potential impact of cloud obscuration on the burned area estimates, the mean cloud fraction for each cropland grid cell was extracted over the burning season (nominally peak burning month ±1 month, but in some cases longer). We examined the resulting regional mean cloud fraction (MCF) time series for trends and/or anomalous years that could potentially distort our burned area estimates and trends.
4.1 Product intercomparison and accuracy assessment
Validating a cropland burned area dataset requires a more stringent standard than the paired reference-image approach (Boschetti et al., 2010) recommended in the Committee on Earth Observing Satellites Working Group on Calibration and Validation (CEOS) Land Product Validation (LPV; https://lpvs.gsfc.nasa.gov/, last access: 7 February 2024) protocol. That approach is suitable for more persistent burn scars (e.g., forest fires) but is unsuitable for small and comparatively fleeting cropland fires (Boschetti et al., 2019; Hall et al., 2021b). Given the enormous undertaking required to create the high-resolution reference maps, a large-scale validation assessment is not feasible. Furthermore, given (i) the high omission errors in cropland burned area studies, (ii) the inappropriate mapping methodologies typically used for this fire type in previous studies, and (iii) the differences in spatial resolution (0.25∘ in this study compared to 10–30 m resolution in other higher-resolution studies), even a seemingly straightforward product intercomparison is also difficult. Therefore, we conducted several different assessments using two different methods to help understand the accuracy of this product.
For the first accuracy assessment, we compared the manually mapped burned area within four validation regions and the corresponding 0.25∘ grid cells over the same time period (Fig. 3; Table 4). Given the high cost to create the high-resolution cropland reference regions, our Stage 1 accuracy assessment (Boschetti et al., 2010) was limited to just five 0.25∘ reference grid cells. Only 4 out of 24 reference regions were chosen for an initial accuracy assessment to ensure sufficient global coverage for the generation of the GloCAB product. We recognize that this sample is much too small to yield statistically meaningful results, and this proof of concept demonstrates the difficulty in validating cropland burning given the heterogeneity of the landscape. The first validation grid cell was within a predominantly rice area in the United States between 1 September and 31 October 2017. The average field size within this grid cell was 0.3 km2, which is comparable to the 0.37 km2 average size of fields with the 24 reference regions. The second grid cell was located in a predominantly winter wheat area in Russia between 1 and 31 October 2018 with a much smaller average field size of 0.08 km2. The third grid cell contained primarily winter wheat fields (0.9 km2 average) in Australia, mapped between 1 and 31 March 2019. The final validation region in South Africa covered two grid cells and contained predominantly winter wheat, irrigated fields (0.3 km2 average), and was mapped between 1 and 31 December 2018.
Table 4Lower and upper limits of grid cell-level validation analysis.
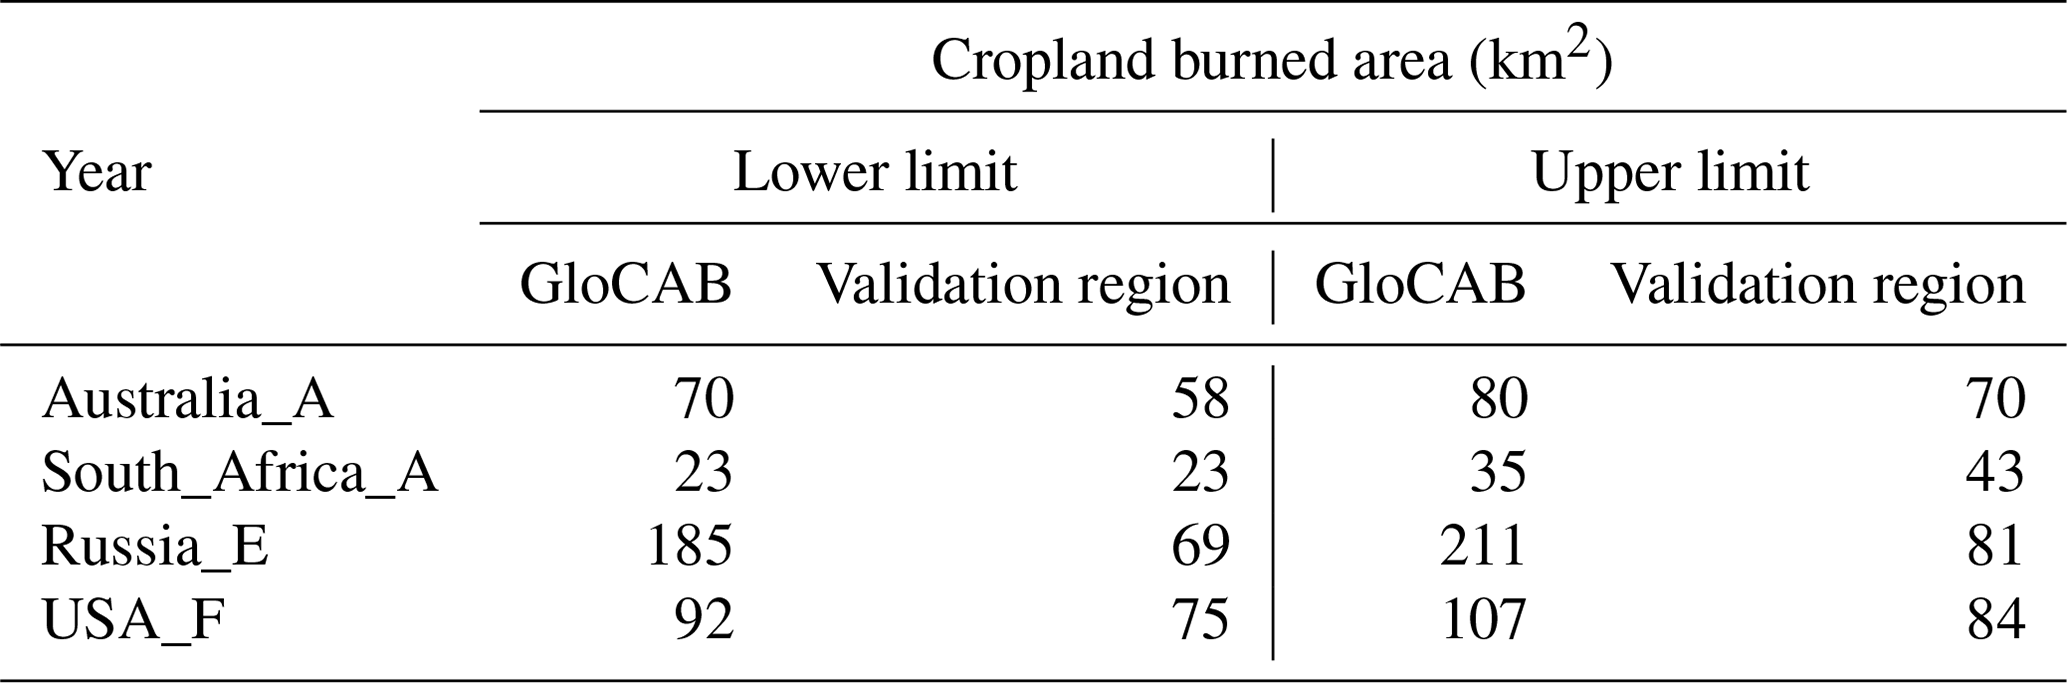
Our validation analysis found the South Africa, Australia, and USA grid cells showed close agreement to the reference burned area, while within the Russian grid cell, the estimated burned area was approximately double the reference burned area. There are several possible explanations for this discrepancy, including a lack of reference training data in areas with very small fields (i.e., the inability to view the fields using Planet or Sentinel-2 limited our scope in the dataset creation). Furthermore, the mapped burned area agreement in South Africa and Australia is promising since these areas did not contain any nearby training reference regions.
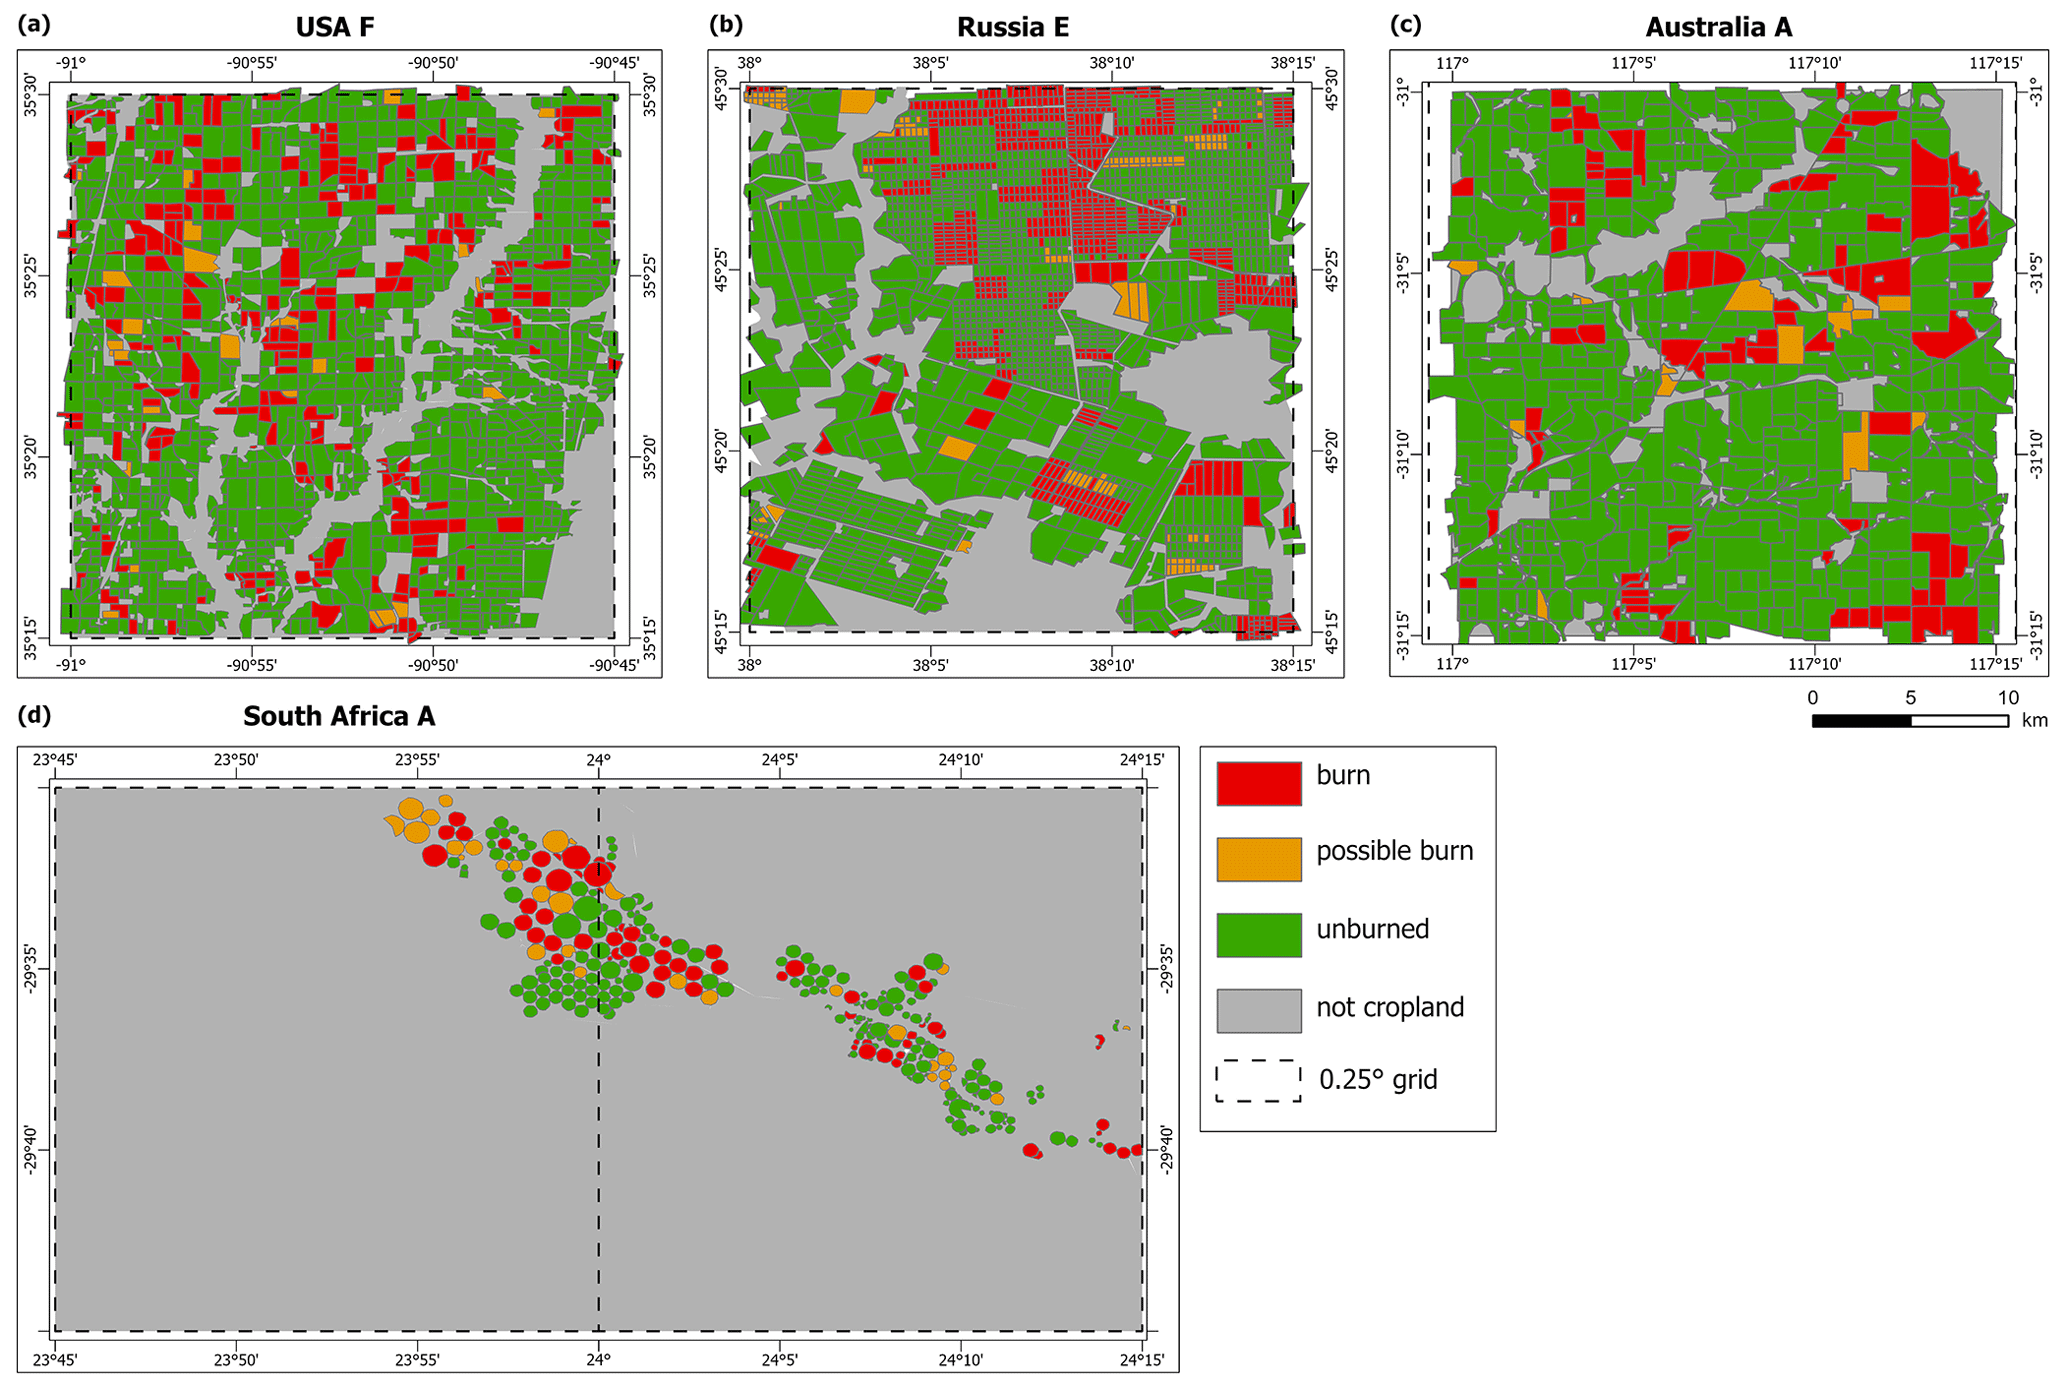
Figure 3Maps of the four validation reference regions in the USA (a), Russia (b), Australia (c), and South Africa (d).
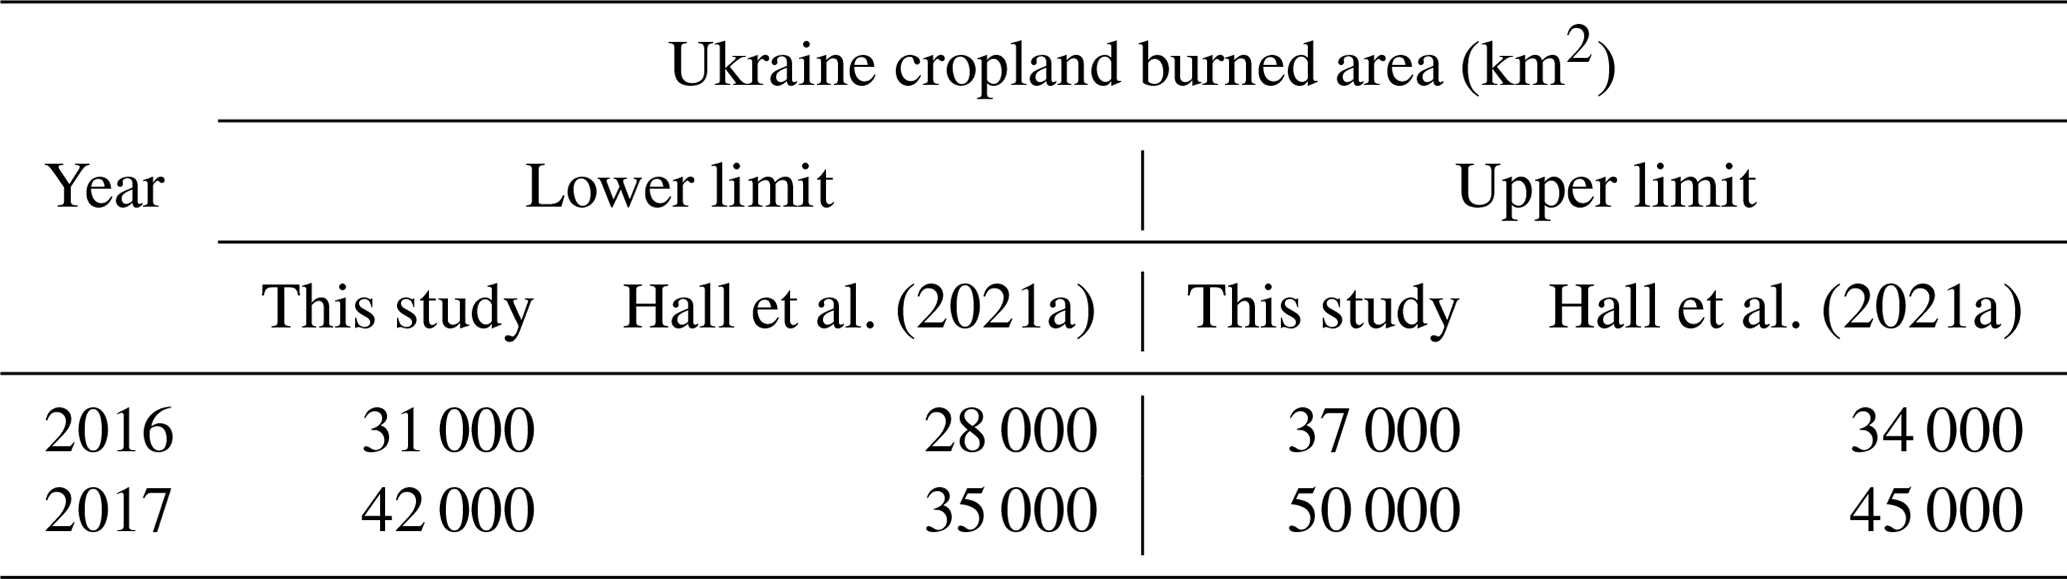
Given that the GloCAB product is designed to be used at a much larger scale than an individual grid cell, we also undertook two regional accuracy assessments in Ukraine and Turkey. The first compared the estimated annual cropland burned area totals for 2016 and 2017 in Ukraine with those calculated in a previous study (Hall et al., 2021a) using higher-resolution datasets and a similar methodology but one designed specifically for Ukraine cropland (Table 5). Unsurprisingly, the values in this study's 0.25∘ output are higher (8 %–11 % higher for the lower-limit estimate) compared to the previous study. This is expected given (i) the different reference regions used to derive α values, (ii) the coarser 500 m resolution of the MODIS land cover data versus the 10 m land cover map used in the Ukraine-specific study, and (iii) the use of MODIS active fires in this study compared to the highly filtered VIIRS active fire data in the Ukraine-specific study. Visual assessment of both cropland burned area products also shows similar spatial and temporal burning patterns, i.e., predominantly maize springtime burning in northern and central Ukraine and predominantly winter wheat burning in southern Ukraine.
Table 5Lower and upper limits of 2016 and 2017 estimated annual cropland burned area in Ukraine derived from this study and a previous Ukraine-focused analysis (Hall et al., 2021a).
The second regional assessment compared the May–November 2019 cropland burned area in the southeastern Anatolia Region of Turkey. Bahşi et al. (2023) estimated cropland burned area through calculating burn severity (difference in normalized burn ratio, dNBR) using Sentinel-2A/B imagery (10–30 m spatial resolution; ∼ 5 d revisit time). Their study estimated 5100 km2 compared to the GloCAB estimates of 5200 km2 (lower limit) and 5800 km2 (upper limit). Given the temporal revisit time of the Sentinel-2 constellation and the propensity for farmers to manipulate their fields shortly after burning (e.g., plowing), it is not surprising that the values reported by Bahşi et al. (2023) are lower than the GloCAB results. Nevertheless, our cropland burned area estimates are very similar and, given the different methodologies (active fire-based versus dNBR-based), lend credibility to these results.
4.2 Spatial distribution and annual time series
Our study found global annual cropland burned area (January 2003–December 2020) ranged between 64 Mha (2018) and 102 Mha (2008), with an average of 81 Mha using our lower-bound estimates compared to an annual average of 32 Mha in the MCD64A1 Collection 6 product (Fig. 4; Table S1 in the Supplement). This 2.7-fold increase in annual average cropland burned area is unsurprising given the known limitations of the MCD64A1 product in cropland regions (e.g., Giglio et al., 2018; Zhang et al., 2022) and the high omission errors associated with small fires. Breaking these results down by crop type highlights the important contribution of winter wheat and maize burning to global annual cropland burned area, and spring wheat as a contributor to the declining trend.
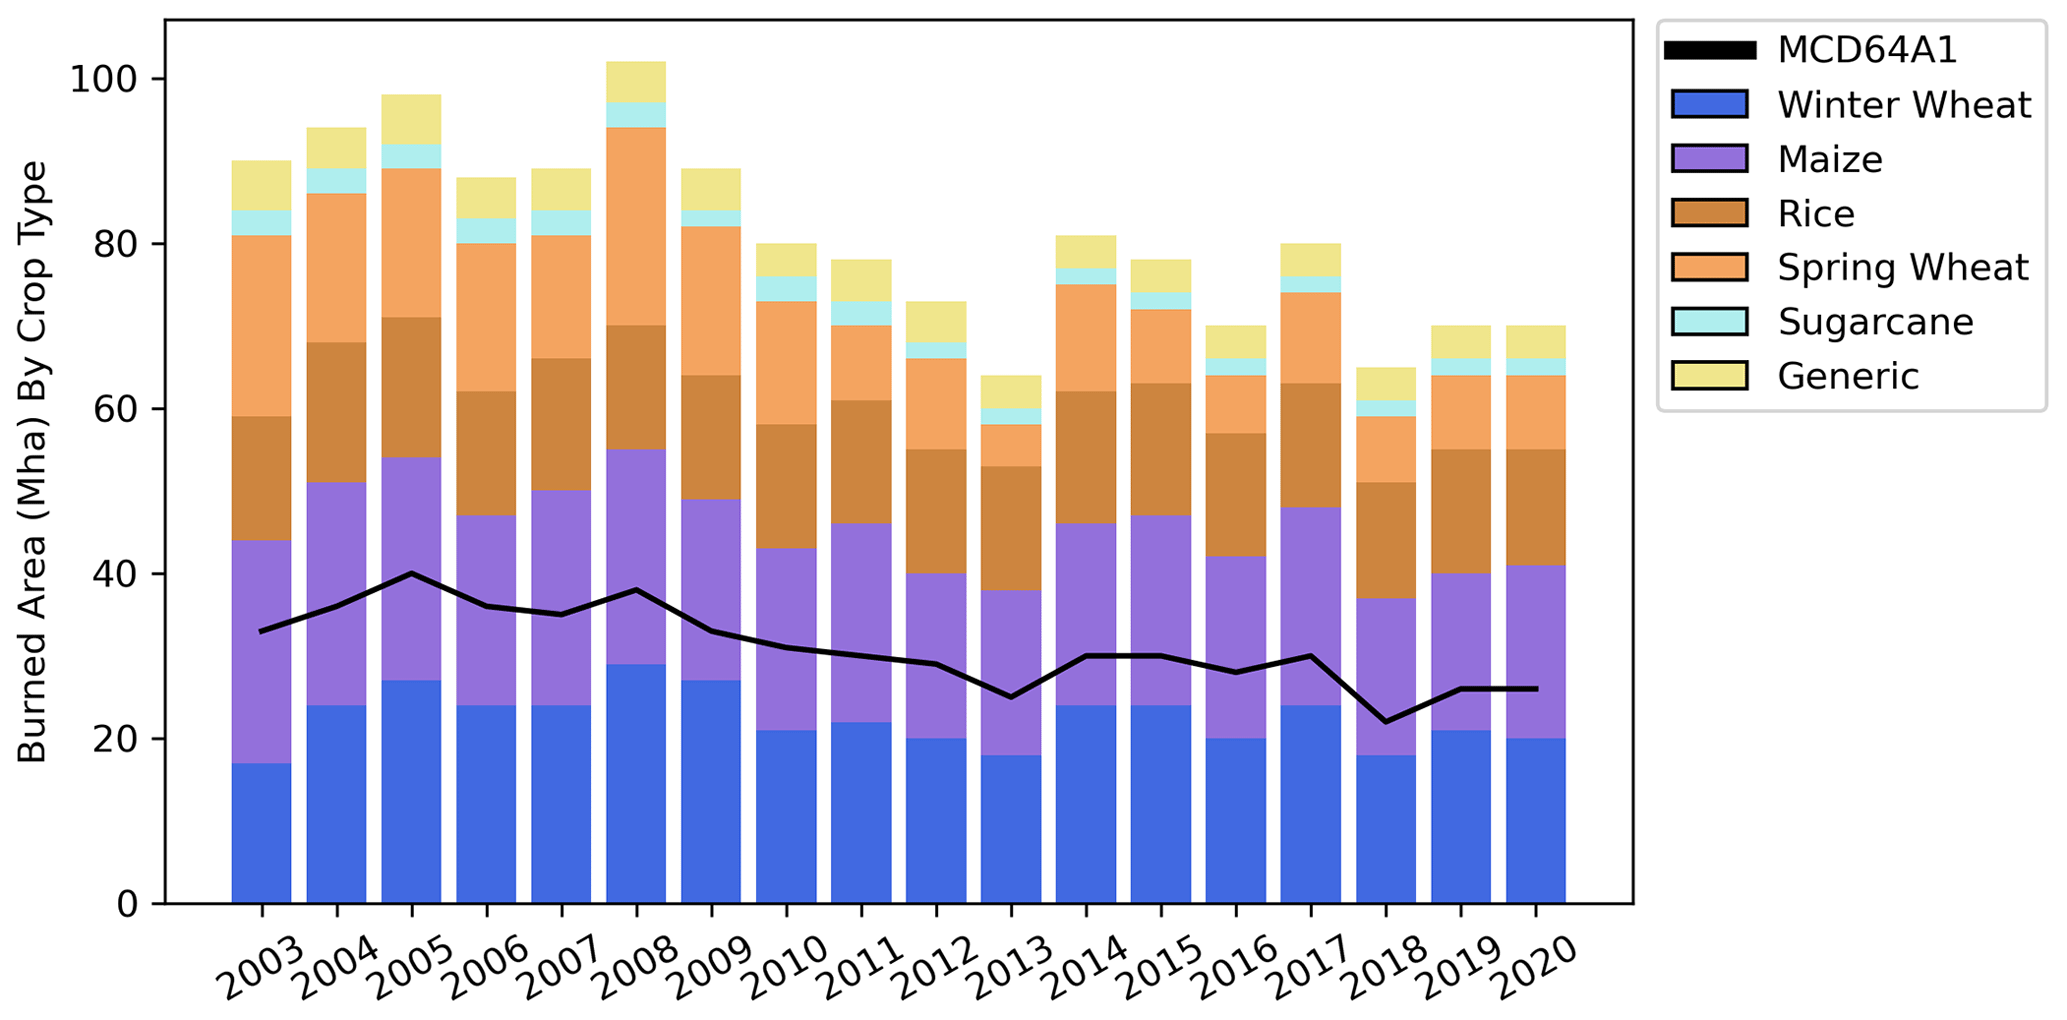
Figure 4Annual burned area (Mha) by global cropland burning fire year (June–May) segmented by crop type and overlaid by MCD64A1 (black line).
Visualizing the annual average burned area (2003–2020) both as a fraction of the cropland area within each 0.25∘ grid cell (Fig. 5) and as an absolute area (Fig. 6) highlights (i) the geographic hot spots of cropland burning, (ii) areas with double-cropping, and (iii) areas where neighboring fields with varying harvest cycles are within the same 0.25∘ grid cell (i.e., fires are recorded in the two crop residue burning seasons but were on different fields). For example, the prevalent wheat and rice crop-residue burning in the double-cropped areas in northern India (e.g., Singh et al., 2020; Sahu et al., 2021), sugarcane burning in Florida and Louisiana, USA (e.g., Hiscox et al., 2015; Sevimoğlu and Rogge, 2019), sugarcane burning in Thailand (e.g., Kumar et al., 2020), and spring wheat burning in central Russia (e.g., McCarty et al., 2012) are all visible. The figures also highlight the prevalence and spatial extent of cropland burning in Ukraine where over 70 % of the land area is associated with sown/cropped fields (Hall et al., 2021a). Since the MCD12Q1 IGBP Class 12 and 14 pixels also include other agricultural landscapes, certain regions (e.g., Africa) will include more fire activity associated with land clearing and wildfires within pastures as opposed to crop-residue burning. A future refinement will include a separate methodology for non-cropped agricultural landscapes.
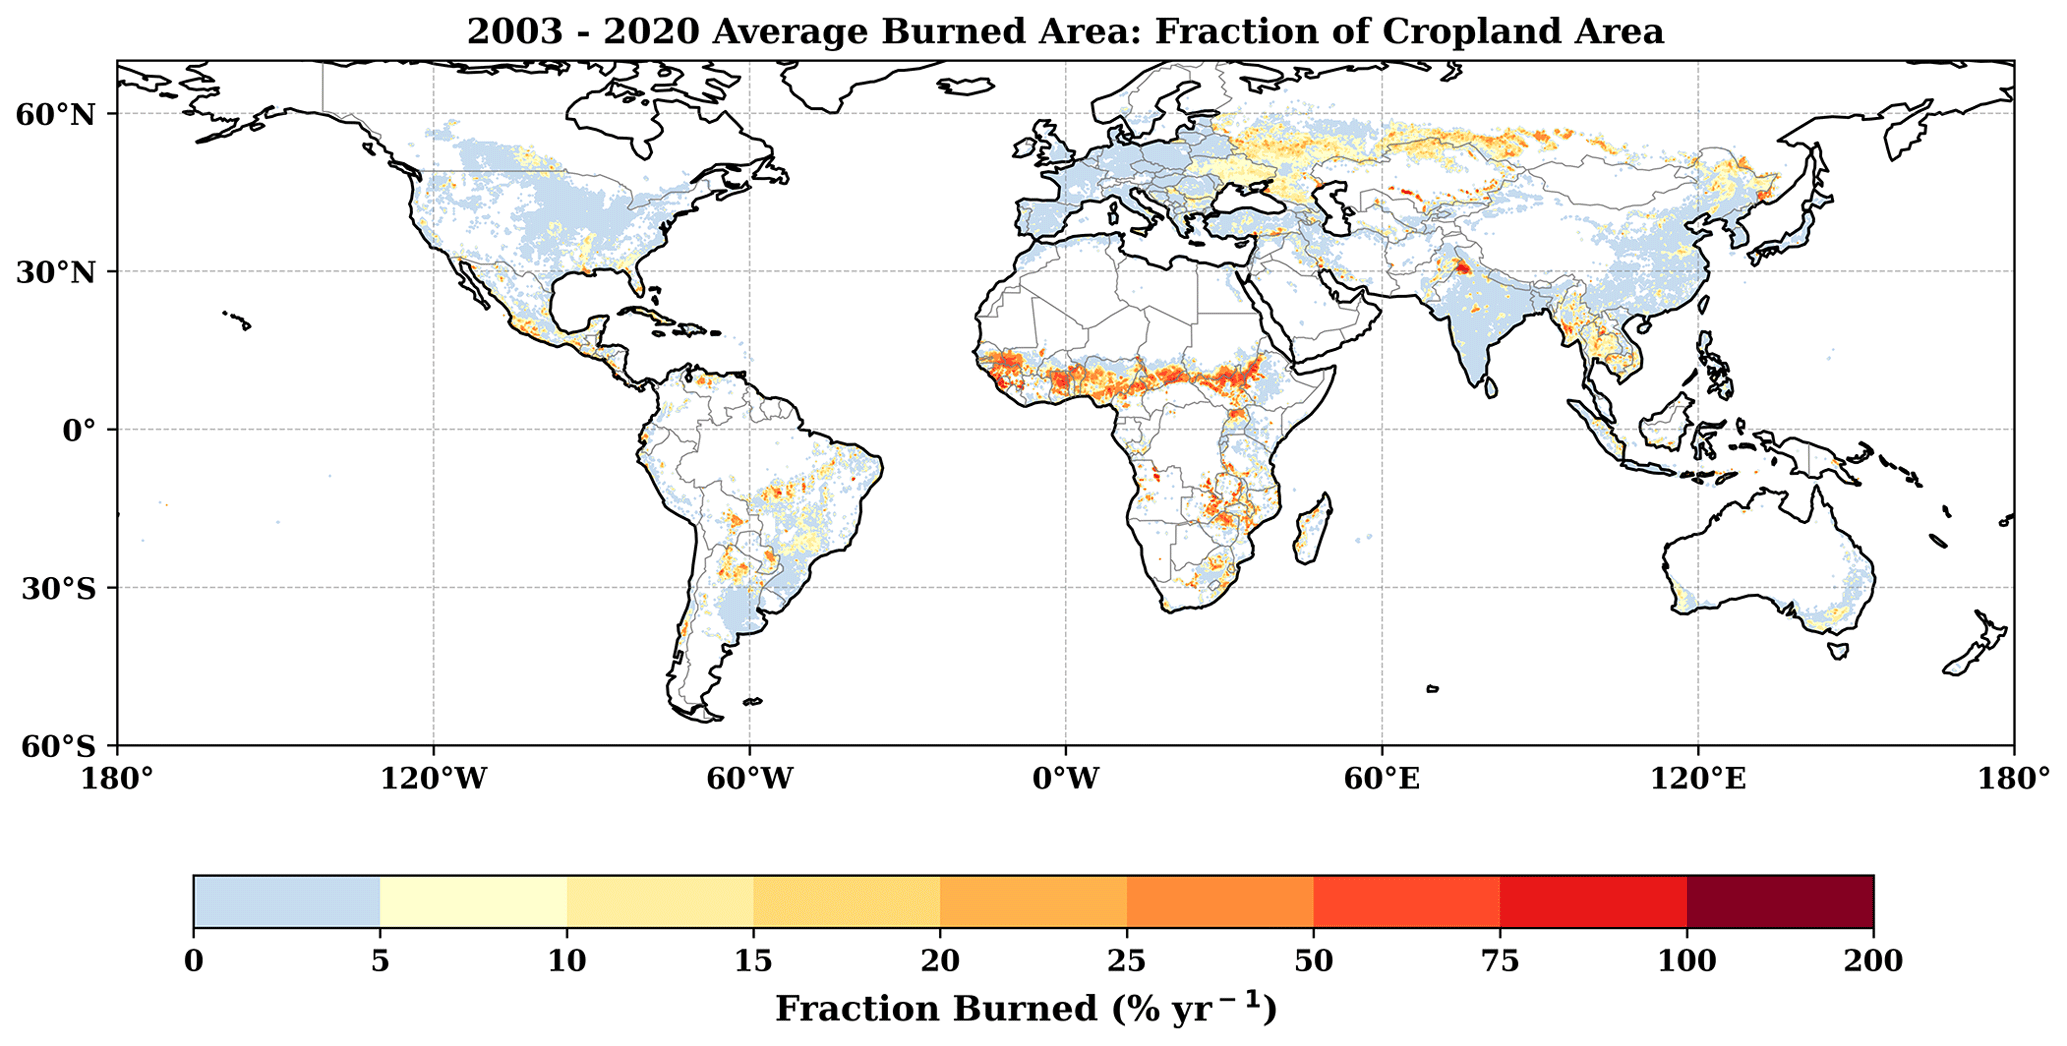
Figure 5Average annual area burned (2003–2020), expressed as the fraction of cropland within each 0.25∘ grid cell that burns each calendar year. Grid cells with more than 100 % cropland burned area are seen within double-cropping regions or within grid cells where neighboring fields are on different harvest cycles.
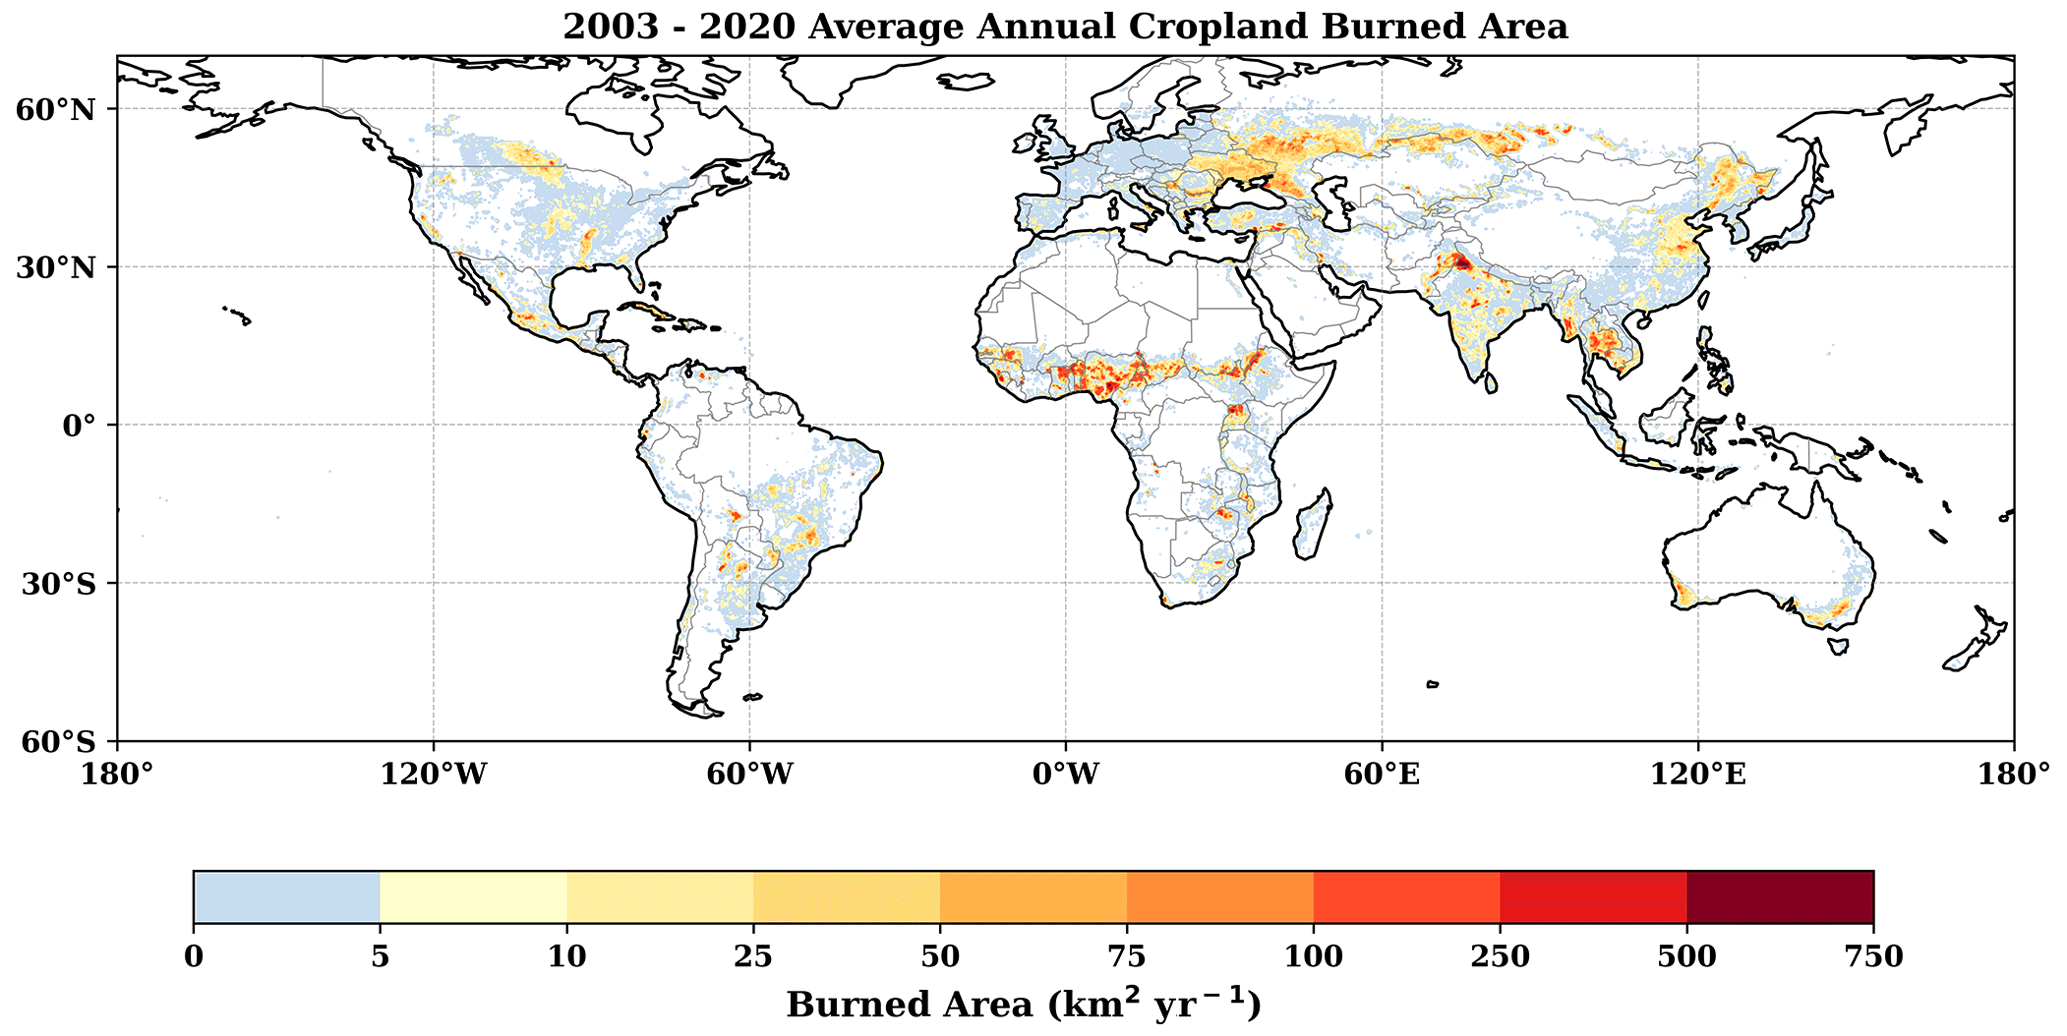
Figure 6Average annual cropland area burned (2003–2020; units: km2 yr−1) per 0.25∘ grid cell.
4.3 Cropland burned area trends, interannual variability, and cloud cover
Analyzing the annual cropland burned area trends requires an understanding of the interannual variability in the timing of the post-harvest and/or pre-planting burning cycles, the magnitudes of the burned area within broad agricultural regions (see Fig. S1 for monthly burned area trends in the GFED regions), as well as the variability and trends in cloud cover over the peak burning months. Given the complexities (e.g., different crop types, burning practices, and local climates) and heterogeneity within the cropland land cover class, we selected a subset of six agricultural regions, including a global extent, representing a range of majority crop types to analyze. For this representative subset, we apply knowledge from a variety of sources including our previous studies (e.g., Hall et al., 2016, 2021a), information gleaned from the 24 manually mapped regions, and scientific and government literature. For each broad agricultural region (and the global estimate) we defined the crop fire year with the month of minimum fire activity indicating the start of the fire year (Giglio et al., 2013). For example, if the month with the least fire activity on average between 2003 and 2020 was September, then the 2003 fire year will run from September 2003 through August 2004. The definition of the cropland fire year will change based on the scale of analysis, and users are therefore encouraged to employ crop fire seasons appropriate for their area of interest. Furthermore, in regions with two distinct cropping cycles, additional trend information can be gleaned by dividing the analysis into 6-month segments – ensuring the two peaks are in the middle of the 6-month window. Finally, only fire years containing all 12 months were used in trend calculations; therefore, some regions contain an extra year of data depending on their monthly burned area distributions.
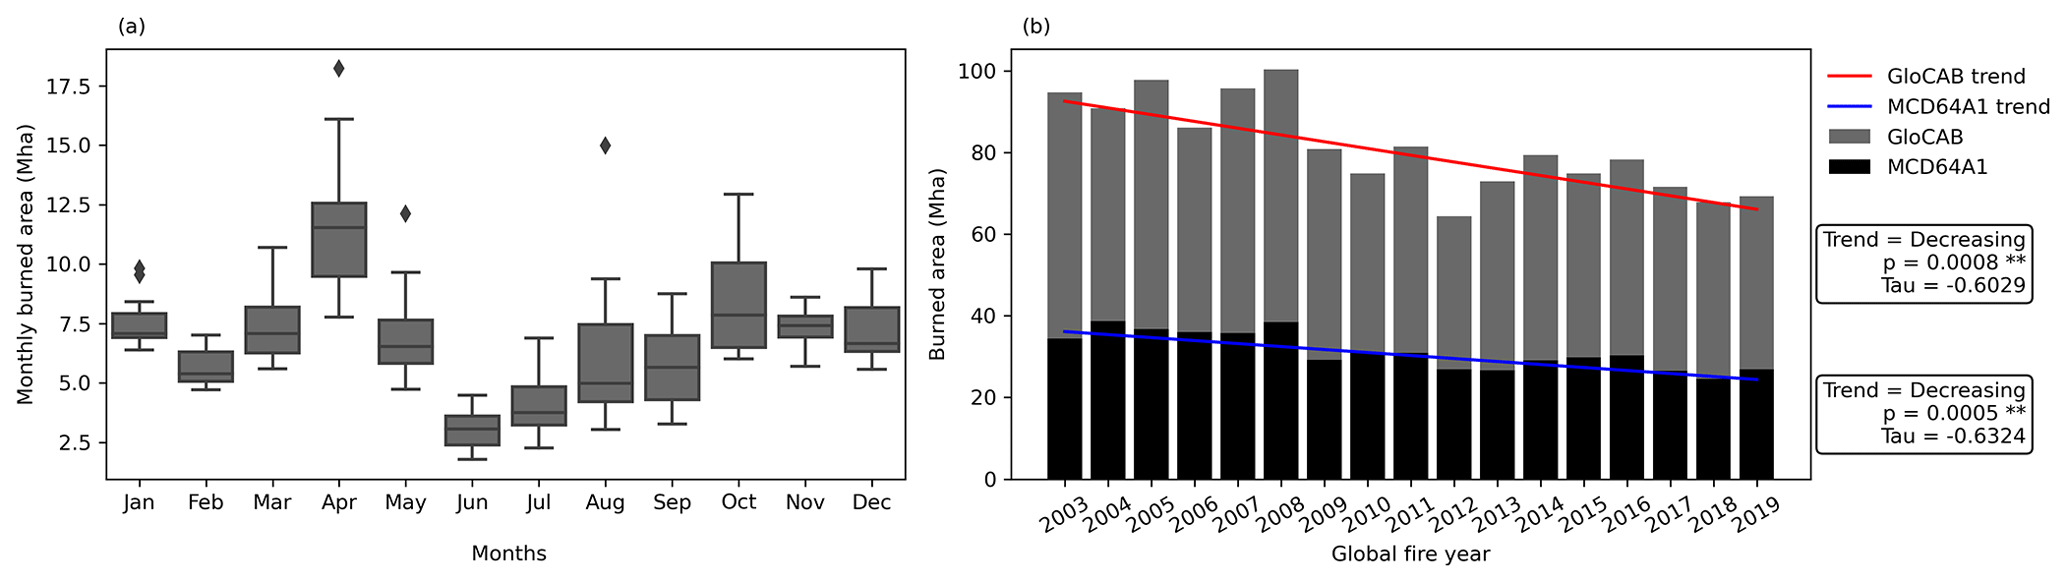
Figure 7(a) Global monthly distribution of cropland burned area between July 2002 and December 2020 (units: Mha). Outliers (diamonds) are defined as monthly burned area values greater than 1.5 times the interquartile range above the upper quartile ( IQR). The monthly median values are represented by the solid line. (b) Global cropland burned area by global fire year (June–May) overlaid with Theil–Sen estimator trend lines with 95 % confidence for this study (gray; red) and MCD64A1 (black; blue). Tau represents the ordinal association between two measured quantities.
Figure 7 shows the global monthly cropland burned area (2003–2020) and the annual fire year (June–May) burned area for the lower-limit (αL-based) estimates, alongside the corresponding burned area reported in the MCD64 burned area product, with associated Theil–Sen estimator trend lines and significance statistics (95 % confidence). Analysis of the autocorrelation function (ACF) plot and the Durbin–Watson statistic (Durbin and Watson, 1950) confirmed the data were not autocorrelated. Despite the difference in the magnitude of the two time series, both products show a statistically significant decreasing trend for fire years 2003 through 2019. Figure S2 highlights the annual global burned area and trends excluding Africa. Typically, Africa accounts for ∼ 70 % of the global burned area within all land cover types (Giglio et al., 2010; Zubkova et al., 2023), which tends to dominate the globally averaged burned area trend. However, within cropland, the burned area in Africa only accounts for 27 % (GFED regions NHAF and SHAF) followed by Central Asia (25 %; GFED region: CEAS). Therefore, removing Africa from the analysis only shows a minor adjustment in the overall burned area trends. Nevertheless, the year-to-year variability in the MCD12Q1 land cover product cropland classes, especially in Africa (e.g., Wei et al., 2020), will have an impact on the burned area trend that is unrelated to the true burned area patterns (e.g., Verburg et al., 2011; Zubkova et al., 2023). Additional uncertainties stem from the overall small field sizes in the regions with the majority of cropland burned area. Furthermore, given the limited availability of global crop-type datasets, this analysis assumes crop types are constant. Therefore, caution is required when analyzing crop-type land-cover-specific burned area trends by also studying the underlying ancillary datasets within their area of interest to ensure any artificial signals are minimized.
Although the globally aggregated trend is consistent with several other broader studies (e.g., Andela et al., 2017; Arora and Melton, 2018) the heterogeneity within cropland regions is lost at the global scale. Therefore, a regional analysis was undertaken highlighting the differing seasonal cycles and overall annual trends within regional cropland areas (Fig. 8). For example, northwest India shows a strong increasing trend and a distinct drop in burned area in the 2019 fire year (August 2019–July 2020), which likely corresponded to a combination of the Covid-19 pandemic and the 2019 financial incentives (INR 2400; USD 32 per acre) imposed by India's Supreme Court to help reduce stubble burning in the northern states (BBC, 2020; Mittal, 2021). By contrast, other regions showed no significant trend. Partitioning the burned area estimates into smaller cropland regions further highlights the difficulty of applying trend lines to these data. For example, the oscillating time series in Ukraine and the abrupt decline in burning in European Russia since 2010 clearly fall outside the domain of a simple linear trend analysis (Fig. 8).
Assessing changes in annual cloud cover fraction provided evidence that none of the regional burned area trends were driven by trends in cloud cover or anomalous cloud cover at the beginning or end of the time series. While not a large effect, variations in cloud cover did contribute to the interannual variability in burned area, e.g., in European Russia (with an annual cloud fraction of 30 % to 60 % during the peak cropland burning months), in 2014 (Fig. 9a, bottom) and 2019 (Fig. 9b, bottom).
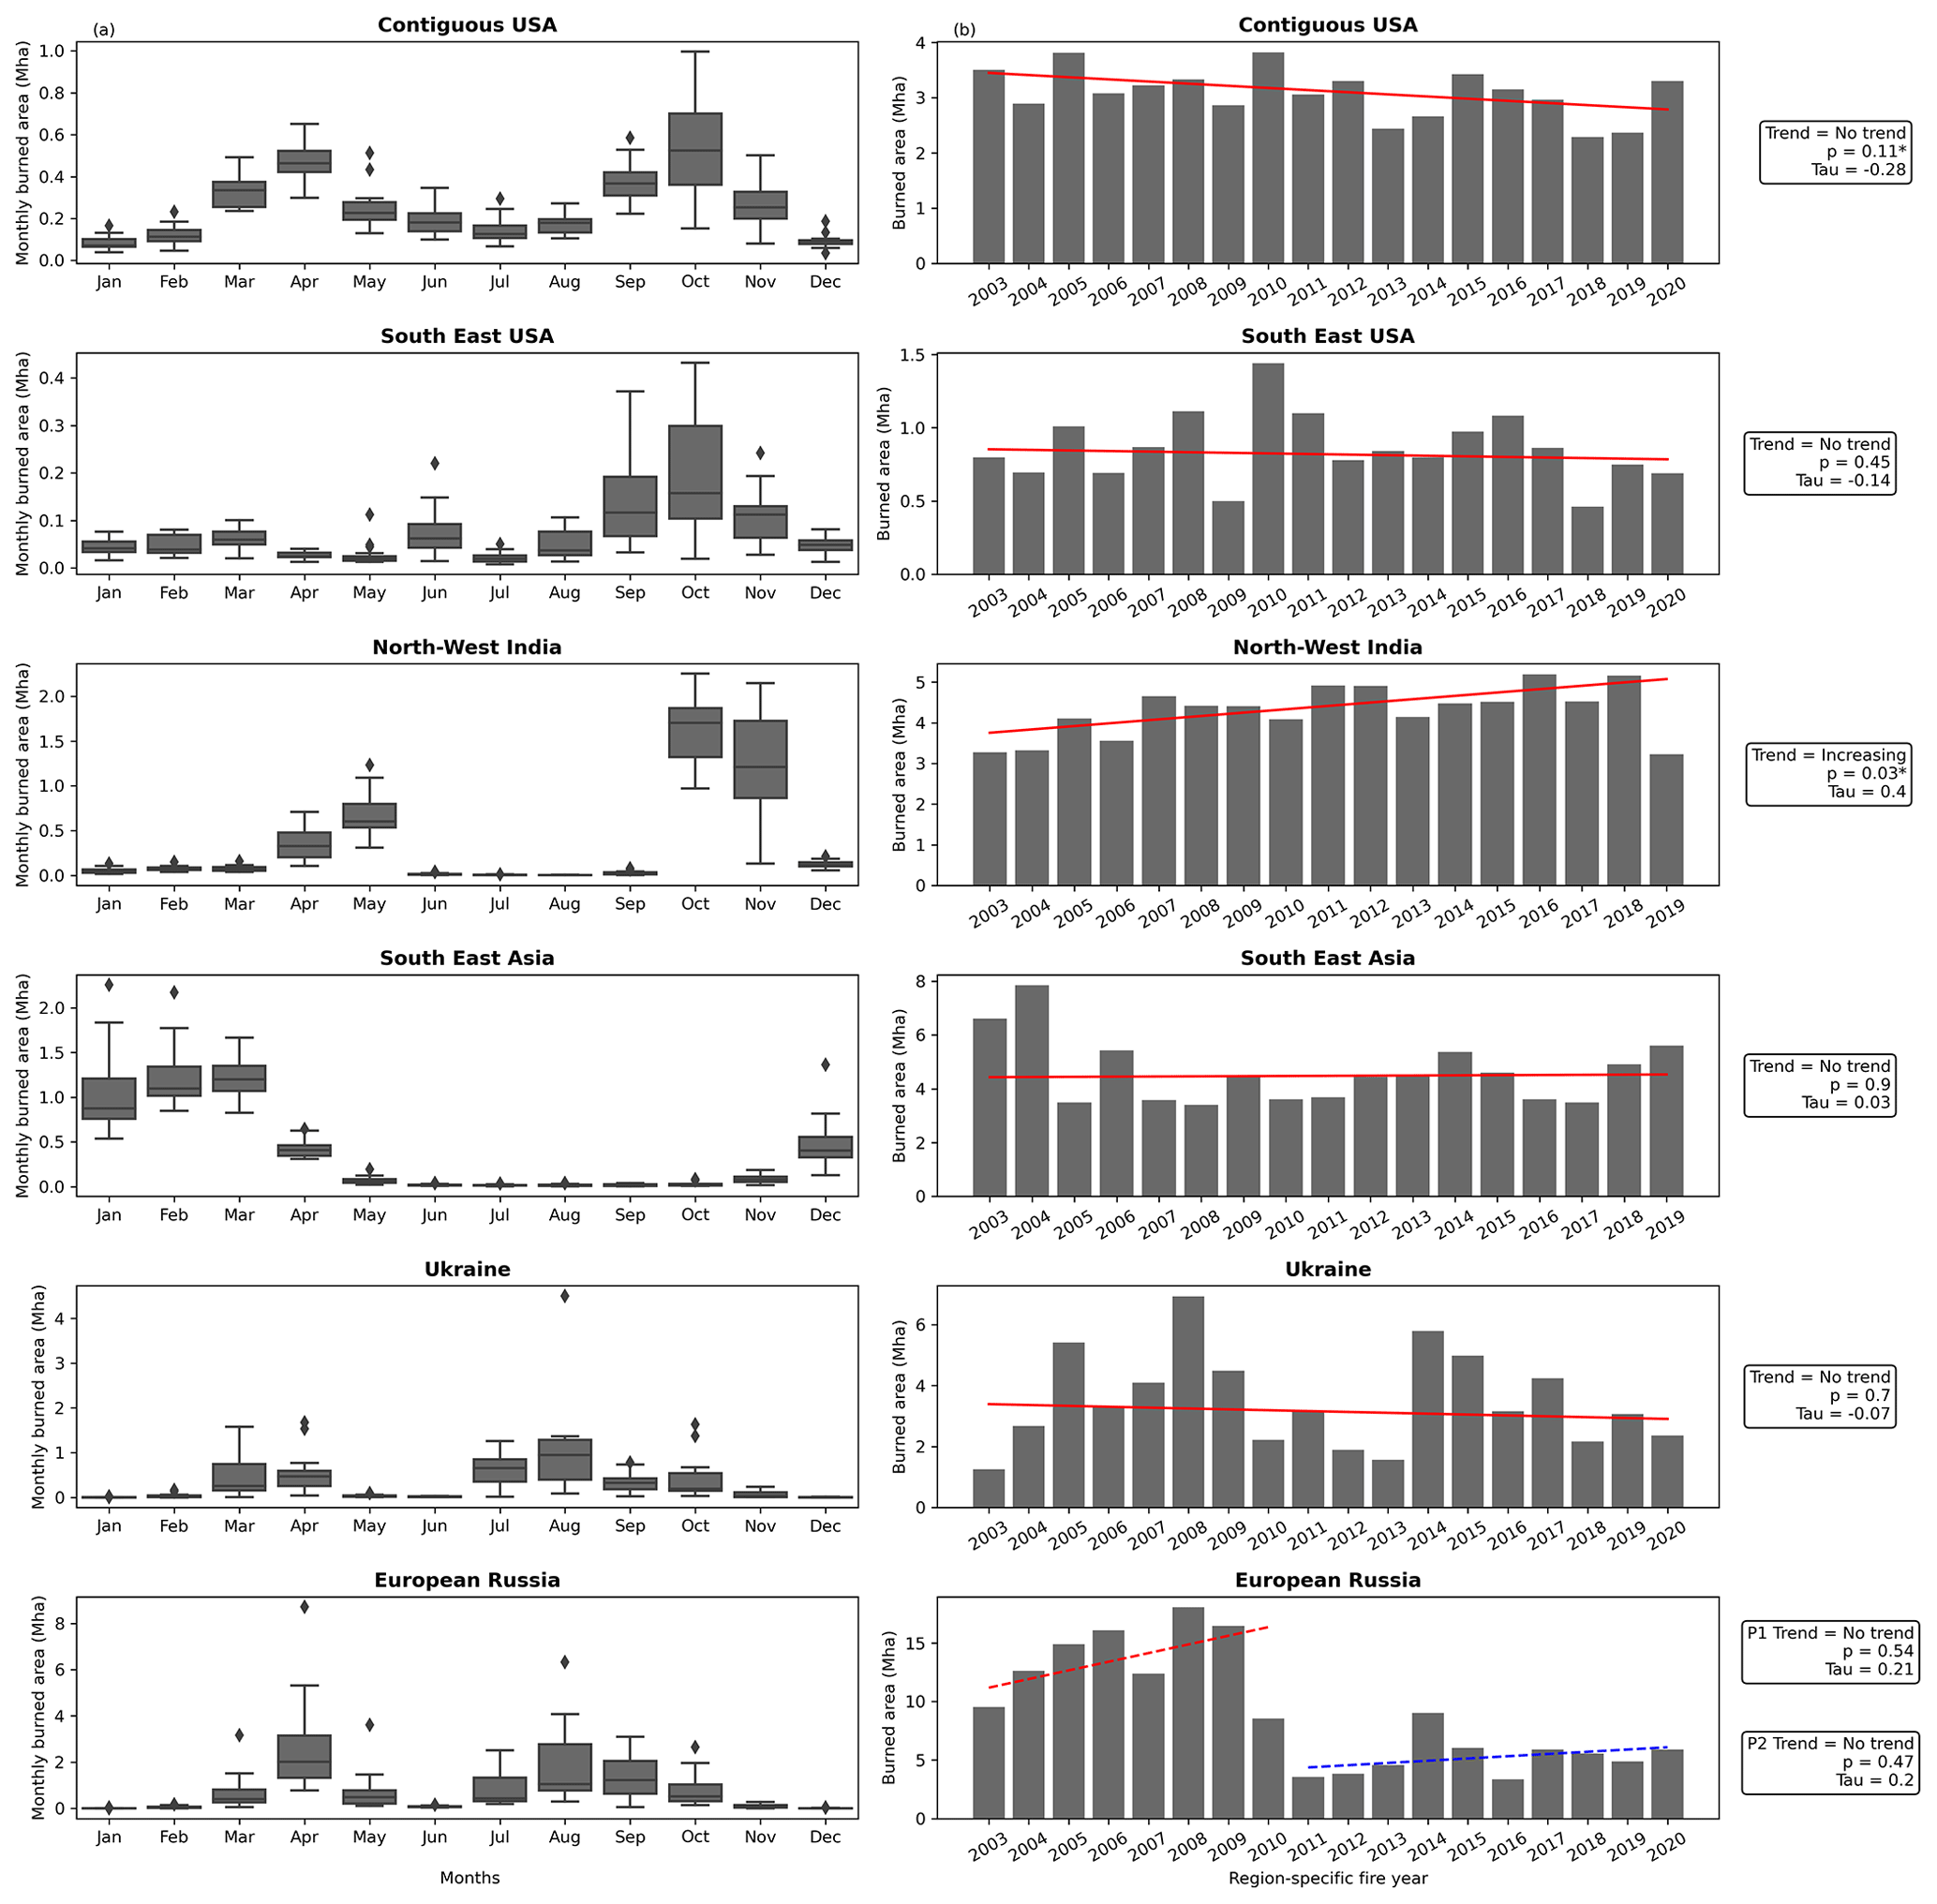
Figure 8(a) Regional cropland monthly burned area (July 2002–December 2020; Mha) and (b) cropland burned area by region-specific fire year, with respective Theil–Sen estimator trend lines with 95 % confidence (red line). Note the difference in vertical-axis scales. European Russia had a distinct change in burned area; therefore, the trend lines were subdivided into two periods: 2003–2010 (P1; dashed red line) and 2011–2020 (P2; dashed blue line).
It is beneficial to subdivide the trend analysis into crop harvest seasons when further information on the burning of predominant crop types (for that time period and geographic location) is warranted. Particular care is required when inferring local patterns with coarse-resolution global products such as GFED and MCD64A1 aggregated to a 0.25∘ climate modeling grid. Figure 9 shows the differing magnitudes, spatial patterns, and trends within the contiguous cropland regions of the United States and European Russia for two periods approximately representing the predominant spring and fall burning seasons: January–June and July–December. It is clear that the “decreasing trend” in European Russia is driven by the distinct change in the summer (predominantly winter wheat) burning season compared to the spring burning season (predominantly spring wheat). This distinct change in burning in 2010 is likely caused by (i) the agricultural machinery deficit between 1990 and 2010, which in turn drove a widespread need to remove crop residue from the fields after harvest prior to 2010 (Sidorenko et al., 2017), (ii) the rise in agro-holdings (i.e., corporate farms) since the early 2000s that led to large parcels of cropped land no longer being burned and instead efficiently managed with new machinery (Rada et al., 2017), and (iii) the widespread administrative and legal action banning open burning (e.g., Decree of the Government of the Russian Federation of 20 November 2015, no. 1213; http://government.ru/docs/20511/, last access: 7 February 2024) after the devastating 2010 fires (Bondur et al., 2020; Loboda et al., 2017). Figure 8 also shows the seasonal interannual variability within the contiguous US summer/fall cropland burned area (predominantly post-harvest burning) compared to the relatively stable burning pattern within the springtime burning seasons (predominantly pre-planting burning).
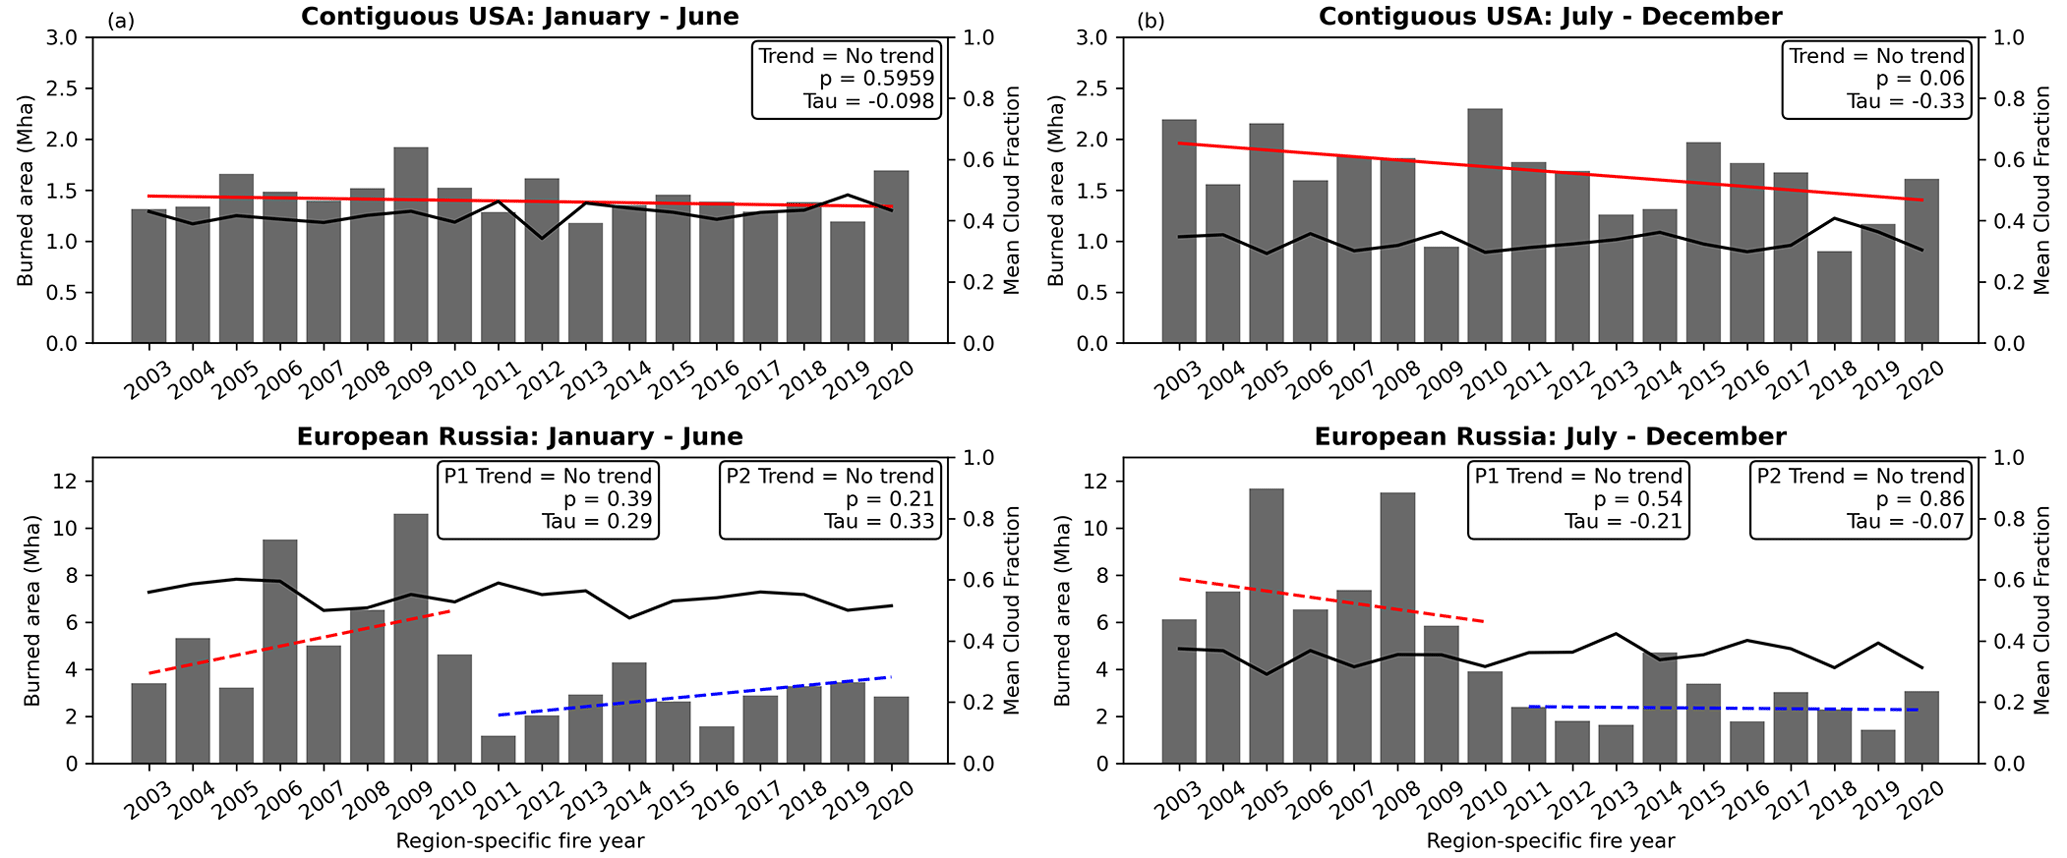
Figure 9(a) January–June and (b) July–December cropland burned area time series (gray bars), burned area trends (both solid and dashed blue and red lines), and burning-season mean cloud fraction (black lines) for the contiguous United States (top) and European Russia (bottom). The fire year for the contiguous United States and European Russia runs from January to December. European Russia had a distinct change in burned area, therefore, the trend lines were subdivided into two periods: 2003–2010 (P1; dashed red line) and 2011–2020 (P2; dashed blue line).
Several caveats and limitations apply to the input datasets and our methodology. First, this study uses static crop-type maps. Higher-resolution, annual crop-type global maps once they become available (e.g., the 30 m Cropland Data Layer for the United States) will improve the identification of cropland areas, including those with either double-cropping or crop-rotation practices. For this initial version, the GEOGLAM crop-type maps (https://cropmonitor.org/, last access: 7 February 2024) were chosen as they are widely used by multiple international humanitarian, government, academic, and research partners and created using the best available data with involvement from local partners in each country (Becker-Reshef et al., 2020; Whitcraft et al., 2019). More accurate and dynamic land-cover data and agricultural-specific maps will help differentiate between field (cropland) and non-field agricultural burning and applying suitable conversion factors and methodologies to each. Further, including a more adaptable partitioning of the crop calendar (i.e., the peak month analysis windows) alongside a more dynamic approach that can adapt to changes in the cropping calendars over time will further refine these results.
Secondly, our results are influenced by the choice of land cover product used as a base cropland extent. While MCD12Q1 was selected since it offers yearly global land cover maps, its coarse resolution might limit the overall accuracy of the estimated cropland burned area, especially in regions where agricultural fields are smaller than MODIS pixel size (500 m). Inconsistencies between cropland extents based on various global land cover products in Africa were reported by Zubkova et al. (2023), demonstrating substantial variations in spatial distribution and year-to-year variability. An analysis of springtime burned area in Russia (Glushkov et al., 2021) also highlighted the variability in burned area by land cover class when comparing three separate global land cover products of varying spatial resolutions. Therefore, the availability of higher-resolution yearly land cover products in the future can enhance the proposed methodology; however, the accuracy of those input products will always be an underlying limitation.
Third, initial analysis found the 24 reference regions did not provide sufficient sampling and required too many assumptions for application to the Terra-only period. Additional cropland burned area reference data are required (created using a consistent methodology that is appropriate for cropland burning) over a broader selection of burnable crop types and geographic domains, particularly in areas with predominantly small (average size within 24 reference regions = 0.37 km2) field sizes. Further, the cropland burned area reference data should also span additional years as farming practices change over time and farmers may alter their daily burn times, which could in turn alter the active fire signal. Unfortunately, high-resolution, daily PlanetScope imagery is only widely available from ∼ 2016, as are Sentinel-2 data, and thus alternative solutions are needed for the earlier years of the MODIS record. Finally, future work will extend the GloCAB dataset to the Terra-only period from November 2000–June 2002.
GloCAB comprises lower (low) and upper (high) cropland burned area estimates per month between July 2002 and December 2020 (Hall et al., 2023). The monthly, 0.25∘ GloCAB burned area (units: km2) data are available as annual GeoTIFF stacks: 12 monthly layers per stack between 2003 and 2020 and 6 layers (July–December) for 2002. The preliminary GloCAB dataset is publicly available on the open repository Zenodo (https://doi.org/10.5281/zenodo.7860452; Hall et al., 2023).
Our new GloCAB dataset provides a global cropland-focused burned area product (0.25∘; monthly time step). GloCAB specifications (0.25∘; monthly time step) were selected to match the forthcoming GFEDv5 product (Chen et al., 2023), as GloCAB will be the source of cropland burned area in the updated GFED product. However, the GloCAB specifications are designed to be useful for other products and applications, and modifications to the methodology can be applied for specific case studies. Using 20 exhaustively mapped field-level reference regions in five countries, the effective burned area per MODIS active fire pixel (α) was calculated for several crop types that are generally associated with burning: winter wheat, spring wheat, maize, rice, sugarcane, and other/generic. Using these active-fire-to-burned-area conversion factors (Table 3), we generated lower (αL) and upper (αH) cropland burned area estimates per month between July 2002 and December 2020. With these data we found the lower-limit global annual cropland burned area (2003–2020) ranged between 64 Mha (2018) and 102 Mha (2008) with an average of 81 Mha compared to an annual average of 32 Mha in the MCD64A1 Collection 6 product. This increase in annual mean burned area compared to MCD64A1 is unsurprising given the GloCAB product is specifically designed for cropland burning. Subdividing by crop type also highlighted the substantial contribution of winter wheat and maize to global cropland burned area. Our analysis also highlighted the heterogeneity within cropland regions and how burned area trends can be impacted depending on the area of interest, while also discussing the impacts of cloud cover on burned area totals.
Finally, our next steps include gathering crop-specific emission factors and combustion efficiencies that will be applied to the monthly majority crop type data layers created in this study. This next step will illuminate the contribution of crop types to emissions, as the proportion of emissions compared to burned area will vary by crop type. Despite the current limitations, this study set out to develop a crop-specific global burned area methodology that was grounded in high-quality reference data gathered for this unique fire type. Although burned area reference datasets have recently become available (e.g., Franquesa et al., 2020), they are either developed for non-cropland fires, or are sporadic/opportunistic based on field work, surveys, etc. (e.g., Liu et al., 2020; Hall et al., 2016) and are therefore not appropriate for this methodology. In general, cropland emissions are severely underestimated, primarily due to the omission errors within burned area products. Understanding the temporal and spatial patterns of emissions can help stakeholders identify regions for focused mitigation efforts; therefore, this global cropland burned area product is the first step toward improving global cropland burning emissions.
The supplement related to this article is available online at: https://doi.org/10.5194/essd-16-867-2024-supplement.
JVH and LG conceptualized the paper. JVH developed the algorithm. FA and JVH created the reference datasets. MZ helped with quality checking. LG and JVH conducted the cloud cover analysis. LG and JTR procured funding. All co-authors contributed to methodology improvements and provided resources for deriving GloCAB. JVH prepared the manuscript with contributions from all the co-authors.
The contact author has declared that none of the authors has any competing interests.
Publisher's note: Copernicus Publications remains neutral with regard to jurisdictional claims made in the text, published maps, institutional affiliations, or any other geographical representation in this paper. While Copernicus Publications makes every effort to include appropriate place names, the final responsibility lies with the authors.
This work was supported by NASA grants 80NSSC18K0619, 80NSSC18K0739, 80NSSC21K1961, 80NSSC21K1657, and 80NSSC18K0179, and United States Department of the Air Force contract FA8810-18-C-0017. Yang Chen and James T. Randerson acknowledge support from NASA's Modeling, Analysis, and Prediction (MAP) program (80NSSC21K1362), SERVIR Applied Sciences Team (80NSSC20K0590), and NASA's Earth Information System (EIS-Fire).
This research has been supported by the National Aeronautics and Space Administration (grant nos. 80NSSC18K0619, 80NSSC18K0739, 80NSSC21K1961, 80NSSC21K1657, 80NSSC18K0179, 80NSSC21K1362, and 80NSSC20K0590) and the Air Force Office of Scientific Research (grant no. FA8810-18-C-0017).
This paper was edited by Francesco N. Tubiello and reviewed by three anonymous referees.
Abera, T. A., Heiskanen, J., Pellikka, P. K. E., Adhikari, H., and Maeda, E. E.: Climatic impacts of bushland to cropland conversion in Eastern Africa, Sci. Total Environ., 717, 137255, https://doi.org/10.1016/j.scitotenv.2020.137255, 2020.
Agarwal, R., Awasthi, A., Singh, N., Mittal, S. K., and Gupta, P. K.: Epidemiological study on healthy subjects affected by agriculture crop-residue burning episodes and its relation with their pulmonary function tests, Int. J. Environ. Heal. R., 23, 281–295, https://https://doi.org/10.1080/09603123.2012.733933, 2013.
Andela, N., Morton, D. C., Giglio, L., Chen, Y., van der Werf, G. R., Kasibhatla, P. S., DeFries, R. S., Collatz, G. J., Hantson, S., Kloster, S., Bachelet, D., Forrest, M., Lasslop, G., Li, F., Mangeon, S., Melton, J. R., Yue, C., and Randerson, J. T.: A human-driven decline in global burned area, Science, 356, 1356–1362, https://https://doi.org/10.1126/science.aal4108, 2017.
Arctic Black Carbon impacting on Climate and Air Pollution (ABC-iCAP). Action 7.1: Mitigate open biomass burning on cropland, https://bc-policy-landscape.amap.no/action/action-7-1-mitigate-open-biomass-burning-on-cropland (last access: 7 February 2024), 2022.
Arora, V. K. and Melton, J. R.: Reduction in global area burned and wildfire emissions since 1930s enhances carbon uptake by land, Nat. Commun., 9, 1326, https://https://doi.org/10.1038/s41467-018-03838-0, 2018.
Bahşi, K., Ustaoğlu, B., Aksoy, S., and Sertel, E.: Estimation of emissions from crop residue burning in Türkiye using remotely sensed data and the Google Earth Engine platform, Geocarto Int., 38, 2157052, https://doi.org/10.1080/10106049.2022.2157052, 2023.
BBC: Stubble burning: Why it continues to smother north India, https://www.bbc.com/news/world-asia-india-54930380 (last access: 7 February 2024), 2023.
Becker-Reshef, I., Justice, C., Barker, B., Humber, M., Rembold, F., Bonifacio, R., Zappacosta, M., Budde, M., Magadzire, T., Shitote, C., Pound, J., Constantino, A., Nakalembe, C., Mwangi, K., Sobue, S., Newby, T., Whitcraft, A., Jarvis, I., and Verdin, J.: Strengthening agricultural decisions in countries at risk of food insecurity: The GEOGLAM Crop Monitor for Early Warning, Remote Sens. Environ., 237, 111553, https://doi.org/10.1016/j.rse.2019.111553, 2020.
Becker-Reshef, I., Barker, B., Whitcraft, A., Oliva, P., Mobley, K., Justice, C., and Sahajpal, R.: Crop Type Maps for Operational Global Agricultural Monitoring, Sci. Data, 10, 172, 2023.
Blickensdörfer, L., Schwieder, M., Pflugmacher, D., Nendel, C., Erasmi, S. and Hostert, P.: Mapping of crop types and crop sequences with combined time series of sentinel-1, sentinel-2 and Landsat 8 data for Germany, Remote Sens. Environ., 269, 112831, https://https://doi.org/10.1016/j.rse.2021.112831, 2022.
Boschetti, L., Roy, D. P., and Justice, C. O.: International Global Burned Area Satellite Product Validation Protocol, Part I – production and standardization of validation reference data, https://lpvs.gsfc.nasa.gov/PDF/BurnedAreaValidationProtocol.pdf (last access: 7 February 2024), 2010.
Boschetti, L., Roy, D. P., Giglio, L., Huang, H., Zubkova, M., and Humber, M. L.: Global validation of the collection 6 MODIS burned area product, Remote Sens. Environ., 235, 111490, https://doi.org/10.1016/j.rse.2019.111490, 2019.
Bondur, V. G., Voronova, O. S., Cherepanova, E. V., Tsidilina, M. N., and Zima, A. L.: Spatiotemporal Analysis of Multi-Year Wildfires and Emissions of Trace Gases and Aerosols in Russia Based on Satellite Data, Izv. Atmos. Ocean. Phys., 12, 1457–1469, https://doi.org/10.1134/s0001433820120348, 2020.
Brink, A. B., Bodart, C., Brodsky, L., Defourney, P., Ernst, C., Donney, F., Lupi, A., and Tuckova, K.: Anthropogenic pressure in East Africa – Monitoring 20 years of land cover changes by means of medium resolution satellite data, Int. J. Appl. Earth Obs. Geoinf., 28, 60–69, https://doi.org/10.1016/j.jag.2013.11.006, 2014.
Chen, Y., Hall, J., van Wees, D., Andela, N., Hantson, S., Giglio, L., van der Werf, G. R., Morton, D. C., and Randerson, J. T.: Multi-decadal trends and variability in burned area from the fifth version of the Global Fire Emissions Database (GFED5), Earth Syst. Sci. Data, 15, 5227–5259, https://doi.org/10.5194/essd-15-5227-2023, 2023.
Durbin, J. and Watson, G. S.: Testing for serial correlation in least squares regression.III, Biometrika, 58, 1–19, https://doi.org/10.1093/biomet/58.1.1, 1971
Franquesa, M., Vanderhoof, M. K., Stavrakoudis, D., Gitas, I. Z., Roteta, E., Padilla, M., and Chuvieco, E.: Development of a standard database of reference sites for validating global burned area products, Earth Syst. Sci. Data, 12, 3229–3246, https://doi.org/10.5194/essd-12-3229-2020, 2020.
Friedlingstein, P., O'Sullivan, M., Jones, M. W., Andrew, R. M., Hauck, J., Olsen, A., Peters, G. P., Peters, W., Pongratz, J., Sitch, S., Le Quéré, C., Canadell, J. G., Ciais, P., Jackson, R. B., Alin, S., Aragão, L. E. O. C., Arneth, A., Arora, V., Bates, N. R., Becker, M., Benoit-Cattin, A., Bittig, H. C., Bopp, L., Bultan, S., Chandra, N., Chevallier, F., Chini, L. P., Evans, W., Florentie, L., Forster, P. M., Gasser, T., Gehlen, M., Gilfillan, D., Gkritzalis, T., Gregor, L., Gruber, N., Harris, I., Hartung, K., Haverd, V., Houghton, R. A., Ilyina, T., Jain, A. K., Joetzjer, E., Kadono, K., Kato, E., Kitidis, V., Korsbakken, J. I., Landschützer, P., Lefèvre, N., Lenton, A., Lienert, S., Liu, Z., Lombardozzi, D., Marland, G., Metzl, N., Munro, D. R., Nabel, J. E. M. S., Nakaoka, S.-I., Niwa, Y., O'Brien, K., Ono, T., Palmer, P. I., Pierrot, D., Poulter, B., Resplandy, L., Robertson, E., Rödenbeck, C., Schwinger, J., Séférian, R., Skjelvan, I., Smith, A. J. P., Sutton, A. J., Tanhua, T., Tans, P. P., Tian, H., Tilbrook, B., van der Werf, G., Vuichard, N., Walker, A. P., Wanninkhof, R., Watson, A. J., Willis, D., Wiltshire, A. J., Yuan, W., Yue, X., and Zaehle, S.: Global Carbon Budget 2020, Earth Syst. Sci. Data, 12, 3269–3340, https://doi.org/10.5194/essd-12-3269-2020, 2020.
Gao, M., Beig, G., Song, S., Zhang, H., Hu, J., Ying, Q., Liang, F., Liu, Y., Wang, H., Lu, X., Zhu, T., Carmichael, G. R., Nielsen, C. P., and McElroy, M. B.: The impact of power generation emissions on ambient PM2.5 pollution and human health in China and India, Environ. Int., 121, 250–259, https://doi.org/10.1016/j.envint.2018.09.015, 2018.
Giglio, L., Descloitres, J., Justice, C. O., and Kaufman, Y. J.: An Enhanced Contextual Fire Detection Algorithm for MODIS, Remote Sens. Environ., 87, 273–282, https://doi.org/10.1016/s0034-4257(03)00184-6, 2003.
Giglio, L., Csiszar, I., and Justice. C.: Global distribution and seasonality of active fires as observed with the Terra and Aqua Moderate Resolution Imaging Spectroradiometer (MODIS) sensors, J. Geophys. Res.-Biogeo., 111, https://doi.org/10.1029/2005JG000142, 2006.
Giglio, L., Randerson, J. T., Van der Werf, G. R., Kasibhatla, P. S., Collatz, G. J., Morton, D. C., and DeFries, R. S.: Assessing variability and long-term trends in burned area by merging multiple satellite fire products, J. Geophys. Res.-Biogeo., 7, 1171–1186, https://doi.org/10.1002/jgrg.20042, 2010.
Giglio, L., Randerson, J. T., and van der Werf, G. R.: Analysis of daily, monthly, and annual burned area using the fourth-generation global fire emissions database (GFED4), J. Geophys. Res.-Biogeo., 118, 317–328, https://doi.org/10.1002/jgrg.20042, 2013.
Giglio, L., Schroeder, W., and Justice, C. O.: The collection 6 MODIS active fire detection algorithm and fire products, Remote Sens. Environ., 178, 31–41, https://doi.org/10.1016/j.rse.2016.02.054, 2016.
Giglio, L., Boschetti, L., Roy, D. P., Humber, M. L., and Justice, C. O.: The Collection 6 MODIS burned area mapping algorithm and product, Remote Sens. Environ., 217, 72–85, https://doi.org/10.1016/j.rse.2018.08.005, 2018.
Glushkov, I., Zhuravleva, I., McCarty, J. L., Komarova, A., Drozdovsky, A., Drozdovskaya, M., Lupachik, V., Yaroshenko, A., Stehman, S. V., and Prishchepov, A.V.: Spring fires in Russia: Results from participatory burned area mapping with Sentinel-2 imagery, Environ. Res. Lett., 16, 125005, https://doi.org/10.1088/1748-9326/ac3287, 2021.
Hall, J. V. and Loboda, T. V.: Quantifying the Potential for Low-Level Transport of Black Carbon Emissions from Cropland Burning in Russia to the Snow-Covered Arctic, Front. Earth Sci., 5, 109, https://doi.org/10.3389/feart.2017.00109, 2017.
Hall, J. and Loboda, T.: Quantifying the variability of potential black carbon transport from cropland burning in Russia driven by atmospheric blocking events, Environ. Res. Lett., 13, 055010, https://doi.org/10.1088/1748-9326/aabf65, 2018.
Hall, J. V., Loboda, T. V., Giglio, L., and McCarty, G. W.: A MODIS-based burned area assessment for Russian croplands: Mapping requirements and challenges, Remote Sens. Environ., 184, 506–521, https://doi.org/10.1016/j.rse.2016.07.022, 2016.
Hall, J. V., Zibtsev, S. V., Giglio, L., Skakun, S., Myroniuk, V., Zhuravel, O., Goldammer, J. G., and Kussul, N.: Environmental and political implications of underestimated cropland burning in Ukraine, Environ. Res. Lett., 16, 064019, https://doi.org/10.1088/1748-9326/abfc04, 2021a.
Hall, J. V., Argueta, F., and Giglio, L.: Validation of MCD64A1 and FireCCI51 cropland burned area mapping in Ukraine, Int. J. Appl. Earth Obs. Geoinf., 102, 102443, https://doi.org/10.1016/j.jag.2021.102443, 2021b.
Hall, J., Argueta, F., and Giglio, L.: Crop Residue Burning Emission Coefficients (Version 1), Zenodo [data set], https://doi.org/10.5281/ZENODO.7013656, 2022.
Hall, J., Argueta, F., Zubkova, M., Chen, Y., Randerson, J., and Giglio, L.: GloCAB: Global Cropland Area Burned (Version 1), Zenodo [data set], https://doi.org/10.5281/zenodo.7860452, 2023.
Hiscox, A. L., Flecher, S., Wang, J. J., and Viator, H. P.: A comparative analysis of potential impact area of common sugar cane burning methods, Atmos. Environ., 106, 154–164, https://doi.org/10.1016/j.atmosenv.2015.02.005, 2015.
International Food Policy Research Institute: Global Spatially-Disaggregated Crop Production Statistics Data for 2010 Version 2.0, Harvard Dataverse [data set], https://doi.org/10.7910/DVN/PRFF8V, 2019.
Jack, B. K., Jayachandran, S., Kala, N., and Pande, R.: Money (Not) to Burn: Payments for Ecosystem Services to Reduce Crop Residue Burning, National Bureau of Economic Research, Working Paper, Working Paper Series, https://doi.org/10.3386/w30690, 2022.
Kong, L., Tang, X., Zhu, J., Wang, Z., Li, J., Wu, H., Wu, Q., Chen, H., Zhu, L., Wang, W., Liu, B., Wang, Q., Chen, D., Pan, Y., Song, T., Li, F., Zheng, H., Jia, G., Lu, M., Wu, L., and Carmichael, G. R.: A 6-year-long (2013–2018) high-resolution air quality reanalysis dataset in China based on the assimilation of surface observations from CNEMC, Earth Syst. Sci. Data, 13, 529–570, https://doi.org/10.5194/essd-13-529-2021, 2021.
Kumar, I., Bandaru, V., Yampracha, S., Sun, L., and Fungtammasan, B.: Limiting rice and sugarcane residue burning in Thailand: Current status, challenges and strategies, J. Environ. Manage., 276, 11228, https://doi.org/10.1016/j.jenvman.2020.111228, 2020.
Lasko, K. and Vadrevu, K.: Improved rice residue burning emissions estimates: Accounting for practice-specific emission factors in air pollution assessments of Vietnam, Environ. Pollut., 236, 795–806, https://doi.org/10.1016/j.envpol.2018.01.098, 2018.
Leal, M. R. L., Galdos, M. V., Scarpare, F. V., Seabra, J. E., Walter, A., and Oliveira, C. O.: Sugarcane straw availability, quality, recovery and energy use: a literature review, Biomass Bioenerg., 53, 11–19, 2013.
Leal, M. R. L., Galdos, M. V., Scarpare, F. V., Seabra, J. E., Walter, A., and Oliveira, C. O.: Sugarcane straw availability, quality, recovery and energy use: A literature review, Biomass Bioenergy, 2021.
Li, Y., Tan, M., and Hao, H.: The impact of global cropland changes on terrestrial ecosystem services value, 1992–2015, J. Geograph. Sci., 29, 323–333, https://doi.org/10.1007/s11442-019-1600-7, 2019.
Lin, H., Feng, X., Fu, T.-M., Tian, H., Ma, Y., Zhang, L., Jacob, D. J., Yantosca, R. M., Sulprizio, M. P., Lundgren, E. W., Zhuang, J., Zhang, Q., Lu, X., Zhang, L., Shen, L., Guo, J., Eastham, S. D., and Keller, C. A.: WRF-GC (v1.0): online coupling of WRF (v3.9.1.1) and GEOS-Chem (v12.2.1) for regional atmospheric chemistry modeling – Part 1: Description of the one-way model, Geosci. Model Dev., 13, 3241–3265, https://doi.org/10.5194/gmd-13-3241-2020, 2020.
Liu, T., Mickley, L. J., Singh, S., Jain, M., DeFries, R. S., and Marlier, M. E.: Crop residue burning practices across north India inferred from household survey data: Bridging gaps in satellite observations, Atmos. Environ., 8, 100091, https://doi.org/10.1016/j.aeaoa.2020.100091, 2020.
Liu, T., Mickley, L. J., Gautam, R., Singh, M. K., DeFries, R. S., and Marlier, M. E.: Detection of delay in post-monsoon agricultural burning across Punjab, India: potential drivers and consequences for air quality, Environ. Res. Lett., 16, 014014, https://doi.org/10.1088/1748-9326/abcc28, 2021.
Lizundia-Loiola, J., Otón, G., Ramo, R. and Chuvieco, E.: A spatio-temporal active-fire clustering approach for global burned area mapping at 250 m from Modis Data, Remote Sens. Environ., 236, 111493, https://https://doi.org/10.1016/j.rse.2019.111493, 2020.
Loboda, T., Krankina, O., Savin, I., Kurbanov, E., and Hall, J.: Land Management and the Impact of the 2010 Extreme Drought Event on the Agricultural and Ecological Systems of European Russia, Land-Cover and Land-Use Changes in Eastern Europe after the Collapse of the Soviet Union in 1991, Publisher NameSpringer, Cham, 173–192, https://doi.org/10.1007/978-3-319-42638-9_8, 2016.
Loboda, T., Krankina, O., Savin, I., Kurbanov, E., and Hall, J.: Land management and the impact of the 2010 extreme drought event on the agricultural and ecological systems of European Russia. Land-Cover and Land-Use Changes in Eastern Europe after the Collapse of the Soviet Union in 1991, 173–192, 2017.
McCarty, J., Justice, C., and Korontzi, S.: Agricultural burning in the Southeastern United States detected by MODIS, Remote Sens. Environ., 108, 151–162, https://doi.org/10.1016/j.rse.2006.03.020, 2007.
McCarty, J. L., Korontzi, S., Justice, C. O., and Loboda, T.: The spatial and temporal distribution of crop residue burning in the contiguous United States, Sci. Total Environ., 407, 5701–5712, https://doi.org/10.1016/j.scitotenv.2009.07.009, 2009.
McCarty, J. L., Ellicott, E. A., Romanenkov, V., Rukhovitch, D., and Koroleva, P.: Multi-year black carbon emissions from cropland burning in the Russian Federation, Atmos. Environ., 63, 223–238, https://doi.org/10.1016/j.atmosenv.2012.08.053, 2012.
Mittal, A. S.: Why Farmers in Delhi's Neighbouring States Burn Stubble Despite Ban, https://www.news18.com/news/opinion/why-farmers-in-delhis-neighbouring-states-burn-stubble-despite-ban-4441712.html (last access: 7 February 2024), 2021.
Pettinari, M. L., Lizundia-Loiola, J., and Chuvieco, E.: ESA CCI ECV Fire Disturbance: D4.2.1 Product User Guide – MODIS, version 1.1, https://climate.esa.int/en/projects/fire/key-documents/ (last access: 7 February 2024), 2021.
Phalke, A., Ozdogan, M., Thenkabail, P., Erickson, T., and Gorelick, N.: Mapping croplands of Europe, Middle East, Russia, and Central Asia using Landsat 30-m data, machine learning algorithms and Google Earth Engine, ISPRS J. Photogramm., 167, 104–122, 2020.
Pryor, S. W., Smithers, J., Lyne, P. and van Antwerpen, R.: Impact of agricultural practices on energy use and greenhouse gas emissions for South African sugarcane production, J. Clean. Product., 141, 137–145, https://doi.org/10.1016/j.jclepro.2016.09.069, 2017.
Rada, N., Liefert, W., Liefert, O., Rada, N., Liefert, W., and Liefert, O.: Productivity Growth and the Revival of Russian Agriculture, Economic Research Report Number 228, https://doi.org/10.22004/AG.ECON.256716, 2017.
Randerson, J. T., van der Werf, G. R., Giglio, L., Collatz, G. J., and Kasibhatla, P. S.: Global Fire Emissions Database, Version 4.1 (GFEDv4), ORNL DAAC [data set], https://doi.org/10.3334/ORNLDAAC/1293, 2018.
Rangel, M. G. L., Henríquez, J. R., Costa, J. A. P., and de Lira Junior, J. C.: An assessment of dispersing pollutants from the pre-harvest burning of sugarcane in rural areas in the northeast of Brazil, Atmos. Environ., 178, 265–281, https://doi.org/10.1016/j.atmosenv.2018.02.006, 2018.
Saggu, G. S., Mittal, S. K., Agarwal, R., and Beig, G.: Epidemiological Study on Respiratory Health of School Children of Rural Sites of Malwa Region (India) During Post-harvest Stubble Burning Events, MAPAN, 33, 281–295, https://doi.org/10.1007/s12647-018-0259-3, 2018.
Sahu, S. K., Mangaraj, P., Beig, G., Samal, A., Chinmay Pradhan, Dash, S., and Tyagi, B.: Quantifying the high resolution seasonal emission of air pollutants from crop residue burning in India, Environ. Pollut., 286, 117165, https://doi.org/10.1016/j.envpol.2021.117165, 2021.
Schroeder, W., Oliva, P., Giglio, L., and Csiszar, I. A.: The New VIIRS 375 m active fire detection data product: Algorithm description and initial assessment, Remote Sens. Environ., 143, 85–96, https://doi.org/10.1016/j.rse.2013.12.008, 2014.
Seiler, W. and Crutzen, P. J.: Estimates of gross and net fluxes of carbon between the biosphere and the atmosphere from biomass burning, Climatic Change, 2, 207–247, https://doi.org/10.1007/BF00137988, 1980.
Sevimoğlu, O. and Rogge, W. F.: Seasonal variations of PM10 – Trace elements, PAHs and Levoglucosan: Rural sugarcane growing area versus coastal urban area in Southeastern Florida, USA. Part II: Elemental concentrations, Particuology, 46, 99–108, https://doi.org/10.1016/j.partic.2019.05.001, 2019.
Singh, T., Biswal, A., Mor, S., Ravindra, K., Singh, V., and Mor, S.: A high-resolution emission inventory of air pollutants from primary crop residue burning over Northern India based on VIIRS thermal anomalies, Environ. Pollut., 266, 115132, https://doi.org/10.1016/j.envpol.2020.115132, 2020.
Sidorenko, S., Trubilin, E., Kolesnikova, E., and Hasegawa, H.: Current situation, issues and trends of mechanization for grain harvesting in the Russian Federation, AMA, Agricultural Mechanization in Asia, Africa and Latin America, 48, 31–35, 2017.
Sulla-Menashe, D. and Friedl, M. A.: User guide to collection 6 MODIS land cover (MCD12Q1 and MCD12C1) product, USGS: Reston, Va, USA, https://lpdaac.usgs.gov/documents/1409/MCD12_User_Guide_V61.pdf (last access: 7 February 2024), 2022.
Tsendbazar, N. E., de Bruin, S., Mora, B., Schouten, L., and Herold, M.: Comparative assessment of thematic accuracy of GLC maps for specific applications using existing reference data, Int. J. Appl. Earth Obs. Geoinf., 44, 124–135, https://doi.org/10.1016/j.jag.2015.08.009, 2016.
United Nations Framework Convention on Climate Change (UNFCCC): Ukraine National Inventory Report, https://unfccc.int/documents/476868 (last access: 7 February 2024), 2022.
U.S. Department of Agriculture (USDA) Agricultural Air Quality Task Force, https://www.nrcs.usda.gov/conservation-basics/natural-resource-concerns/air/usda-agricultural-air-quality-task-force/pre-2005-agricultural-air-quality-research-task-force/aaqtf-agricultural-burning-policy-recommendations (last access: 7 February 2024), 1999.
van der Werf, G. R., Randerson, J. T., Giglio, L., van Leeuwen, T. T., Chen, Y., Rogers, B. M., Mu, M., van Marle, M. J. E., Morton, D. C., Collatz, G. J., Yokelson, R. J., and Kasibhatla, P. S.: Global fire emissions estimates during 1997–2016, Earth Syst. Sci. Data, 9, 697–720, https://doi.org/10.5194/essd-9-697-2017, 2017.
Verburg, P. H., Neumann, K., and Nol, L.: Challenges in using land use and land cover data for global change studies, Glob. Change Biol., 17, 974–989, https://doi.org/10.1111/j.1365-2486.2010.02307.x, 2011.
Wei, Y., Lu, M., Wu, W., and Ru, Y.: Multiple factors influence the consistency of cropland datasets in Africa, Int. J. Appl. Earth Obs. Geoinf., 89, 102087, https://doi.org/10.1016/j.jag.2020.102087, 2020.
Whitcraft, A. K., Becker-Reshef, I., Justice, C. O., Gifford, L., Kavvada, A., and Jarvis, I.: No pixel left behind: Toward integrating Earth Observations for agriculture into the United Nations Sustainable Development Goals framework, Remote Sens. Environ., 235, 111470, https://doi.org/10.1016/j.rse.2019.111470, 2019.
Yevich, R. and Logan, J. A.: An assessment of biofuel use and burning of agricultural waste in the developing world, Global Biogeochem. Cy., 17, 2003.
Zhang, S., Zhao, H., Wu, Z., and Tan, L.: Comparing the Ability of Burned Area Products to Detect Crop Residue Burning in China, Remote Sens., 14, 693, https://doi.org/10.3390/rs14030693, 2022.
Zhang, T., Wooster, M., de Jong, M., and Xu, W.: How Well Does the “Small Fire Boost” Methodology Used within the GFED4.1s Fire Emissions Database Represent the Timing, Location and Magnitude of Agricultural Burning?, Remote Sens., 10, 823, https://doi.org/10.3390/rs10060823, 2018.
Zhou, L., Baker, K. R., Napelenok, S. L., Pouliot, G., Elleman, R., O'Neill, S. M., and Wong, D. C.: Modeling crop residue burning experiments to evaluate smoke emissions and plume transport, Sci. Total Environ., 627, 523–533, 2018.
Zubkova, M., Humber, M. L., and Giglio, L.: Is global burned area declining due to cropland expansion? How much do we know based on remotely sensed data?, Int. J. Remote, 44, 1132–1150, 2023.