the Creative Commons Attribution 4.0 License.
the Creative Commons Attribution 4.0 License.
 | 31 Jan 2024
Reference maps of soil phosphorus for the pan-Amazon region
João Paulo Darela-Filho
Anja Rammig
Katrin Fleischer
Tatiana Reichert
Laynara Figueiredo Lugli
Carlos Alberto Quesada
Luis Carlos Colocho Hurtarte
Mateus Dantas de Paula
David M. Lapola
Phosphorus (P) is recognized as an important driver of terrestrial primary productivity across biomes. Several recent developments in process-based vegetation models aim at the concomitant representation of the carbon (C), nitrogen (N), and P cycles in terrestrial ecosystems, building upon the ecological stoichiometry and the processes that govern nutrient availability in soils. Thus, understanding the spatial distribution of P forms in soil is fundamental to initializing and/or evaluating process-based models that include the biogeochemical cycle of P. One of the major constraints for the large-scale application of these models is the lack of data related to the spatial patterns of the various forms of P present in soils, given the sparse nature of in situ observations. We applied a model selection approach based on random forest regression models trained and tested for the prediction of different P forms (total, available, organic, inorganic, and occluded P) – obtained by the Hedley sequential extraction method. As input for the models, reference soil group and textural properties, geolocation, N and C contents, terrain elevation and slope, soil pH, and mean annual precipitation and temperature from 108 sites of the RAINFOR network were used. The selected models were then applied to predict the target P forms using several spatially explicit datasets containing contiguous estimated values across the area of interest. Here, we present a set of maps depicting the distribution of total, available, organic, inorganic, and occluded P forms in the topsoil profile (0–30 cm) of the pan-Amazon region in the spatial resolution of 5 arcmin. The random forest regression models presented a good level of mean accuracy for the total, available, organic, inorganic, and occluded P forms (77.37 %, 76,86 %, 75.14 %, 68.23 %, and 64.62% respectively). Our results confirm that the mapped area generally has very low total P concentration status, with a clear gradient of soil development and nutrient content. Total N was the most important variable for the prediction of all target P forms and the analysis of partial dependence indicates several features that are also related with soil concentration of all target P forms. We observed that gaps in the data used to train and test the random forest models, especially in the most elevated areas, constitute a problem to the methods applied here. However, most of the area could be mapped with a good level of accuracy. Also, the biases of gridded data used for model prediction are introduced in the P maps. Nonetheless, the final map of total P resembles the expected geographical patterns. Our maps may be useful for the parametrization and evaluation of process-based terrestrial ecosystem models as well as other types of models. Also, they can promote the testing of new hypotheses about the gradient and status of P availability and soil-vegetation feedback in the pan-Amazon region. The reference maps can be downloaded from https://doi.org/10.25824/redu/FROESE (Darela-Filho and Lapola, 2023).
- Article
(6984 KB) - Full-text XML
-
Supplement
(2941 KB) - BibTeX
- EndNote


Phosphorus (P) is one of the main plant macronutrients, and it is known to pose major limitations on the terrestrial primary productivity in the tropics (Wollast et al., 1993, Du et al., 2020; Cunha et al., 2022). In ecosystems with highly weathered soils, such as in the pan-Amazon region (RAISG, 2023), the processes that govern the local readily available P (orthophosphates, i.e. salts and esters of the orthophosphoric acid) in soils, are largely related to the mineralization of organic matter mediated by decomposers (da Silva et al., 2022). In such weathered soils, the readily available P for living organisms, including plants, is only a small fraction of the total P (Quesada et al., 2010; Vitousek et al., 2010; Walker and Syers, 1976), whereas most of the P is chemically bound or adsorbed to other molecules, forming stable organic and inorganic compounds (Buendia et al., 2014; Smeck, 1985). Plants and microorganisms developed several strategies to overcome the lack of available P in these soils, explore less available P pools (Lugli et al., 2020; Reichert et al., 2022; Lambers, 2022, and citations therein), and preserve the acquired P, resulting in a tight cycling and very small leaching (Wilcke et al., 2019).
The different P pools vary in time and respond differentially to environmental conditions; thus, they can act as sinks or sources of available P (Schubert et al., 2020; Helfenstein et al., 2018; Gama-Rodrigues et al., 2014), and the understanding of the processes that govern the cycling of P in these pools is important to the models that aim at simulating the productivity of terrestrial ecosystems. Dynamic global vegetation models (DGVMs) that include the P cycle often rely on maps of soil P for model benchmarking or model initialization. These maps are built upon models of varying complexity that link soil P pools to variables like soil type, soil age, lithology, soil C and N content, and soil texture (e.g. Castanho et al., 2013; Goll et al., 2012; Wang et al., 2010). The global maps of soil P forms created and described by Yang et al. (2013) (available in Yang et al., 2014) were derived from several global soil datasets combined with the current scientific understanding of P transformations during pedogenesis. In this approach, total P content was obtained from estimates of initial rock P content and model-based P loss rates from soil chronosequences. The attribution of each P fraction, from the estimated total P, is based on averaged values of each fraction extracted sequentially in different soil reference groups (Yang et al., 2013). The low number of soil P measurements and the lack of knowledge about the processes controlling P during pedogenesis are the sources of a high level of uncertainty in these global maps (Yang and Post, 2011). Yet, some studies provided evidence that edaphic and climatic factors (He et al., 2021; Gama-Rodrigues et al., 2014) other than reference soil groups can be used to predict the size of the P pools in soils.
Thus, here we aim to overcome the low number of soil P measurements for certain reference soil groups by developing a set of maps of the different P forms for the pan-Amazon region. Firstly, we used a model selection approach to fit, test, and evaluate a set of machine learning regression models using 108 sites with measurements of sequential extraction of soil P and a set of environmental variables that are complementary to the reference soil groups. Finally, we used the selected models to predict the spatial distributions of soil P forms using gridded datasets of the same environmental variables used to fit the random forest (RF) regression models.
2.1 Phosphorus data: the fitting dataset
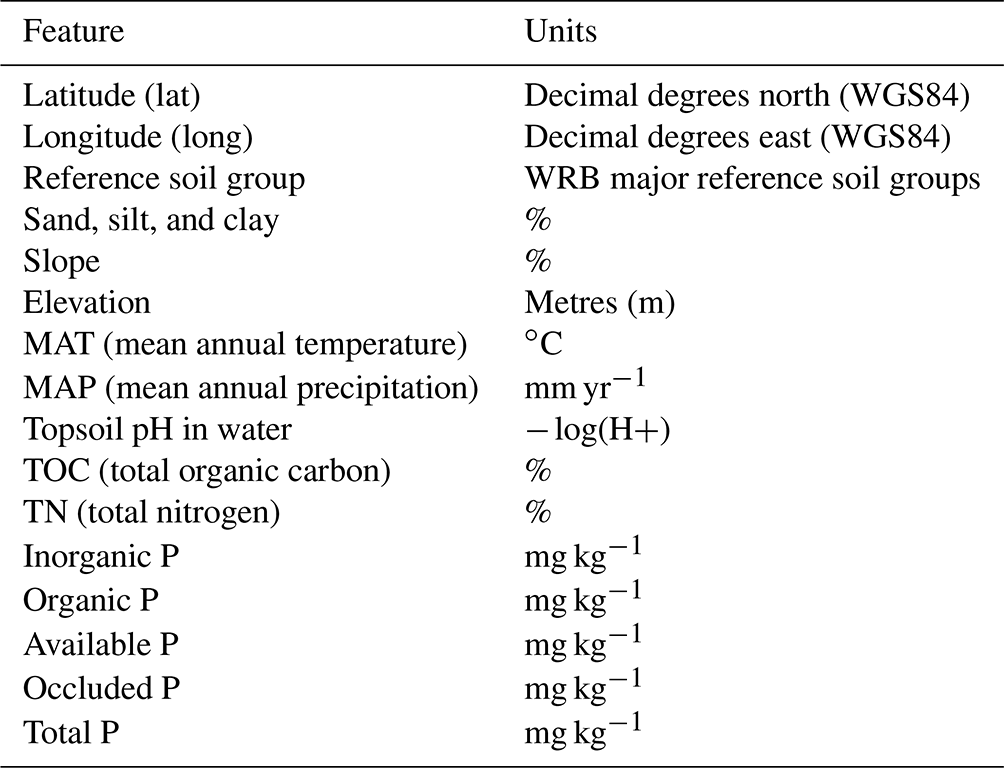
The soil and other environmental measurements at 92 sites selected (Hou et al., 2018) for this study were originally presented in the studies of Quesada et al. (2010) and Lloyd et al. (2015). The soil P measurements and analysis are described and standardized by Quesada et al. (2010) and refer to the 0–30 cm depth of the soil profile. Additionally, here we included 16 unpublished site data from the study of Quesada et al. (2020), resulting in a total of 108 observations (Figs. 1 and S6). All soil samples were collected under the RAINFOR protocol for soil sampling (RAINFOR, 2022). The soil samples were submitted to a sequential P extraction using a Hedley fractionation procedure (Carter and Gregorich, 2007; Hedley and Stewart, 1982). In this dataset, the P fractionation data are complemented by several variables. For this study, soil texture (sand, silt, and clay fraction), C and N content, pH, elevation, reference soil group, mean annual precipitation and temperature, latitude, and longitude were used (Table 1). The calculations of soil attributes, like pH, texture, and C and N contents, are described in Quesada et al. (2010). Elevation and climatic variables were extracted by Quesada et al. (2010, 2020) and Lloyd et al. (2015) from a digital elevation model (Shuttle Radar Topography Mission database – Digital Elevation Model – SRTM-DEM) (Farr et al., 2007) and the WordClim dataset (Fick and Hijmans, 2017), respectively. The slope for all sites in the fitting dataset was calculated using the same digital elevation model (Saatchi, 2013) with 30 arcsec of resolution. The categorical variable reference soil group was transformed into a set of 16 binary variables via one-hot encoding to train the random forest regression models.
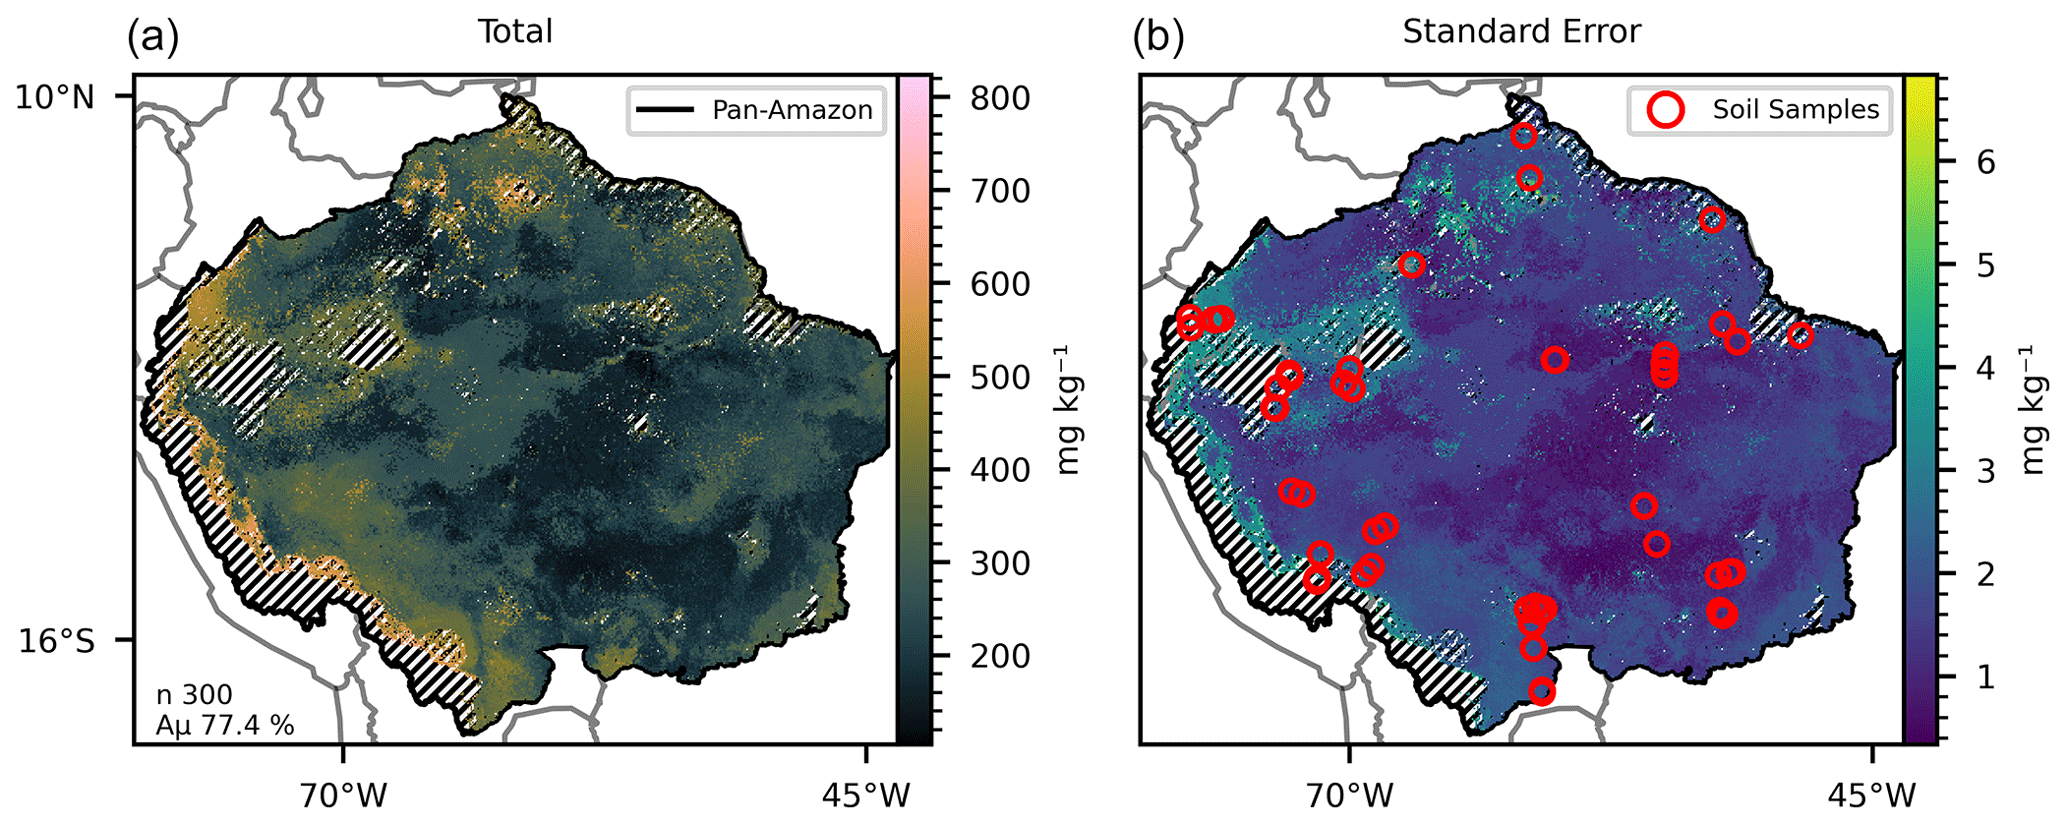
Figure 1(a) Mean total P predicted by 300 selected random forest models with mean accuracy of 77.4 % in the training/testing phase. (b) Standard error of the 300 predicted maps. The hatched areas mark the regions where the dissimilarity index (DI) presented values greater than the sum of the third quartile with the interquartile range. Red circles mark the sites with data collections for the fitting dataset.
Table 1Measured variables used in this study. The P pools sizes are based on the grouping of different fractions sequentially extracted of soil samples (see Table 2). All soil measurements were collected in the 0–30 cm soil profile.
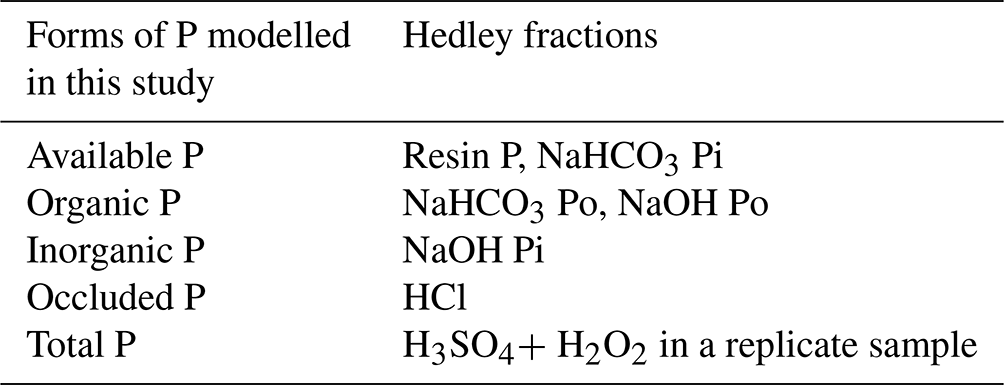
Due to the complex forms in which soil P occurs in soils, sequential chemical extraction methods are commonly used (Hedley and Stewart, 1982), resulting in groupings of “ecosystem-relevant” pools (Gama-Rodrigues et al., 2014; Hou et al., 2018), which we refer to here as P forms. There is ongoing discussion about the interpretation of the P fractions obtained via the sequential extraction methods and no consensus on how to organize this into reservoirs in the ecosystem (Gu and Margenot, 2021; Barrow et al., 2020). Nonetheless, up to now this has been the most commonly used method to determine soil P fractions, and in this study, we considered five P pools or forms based on previous works (Hedley et al., 1982; Yang et al., 2013; Hou et al., 2018).
-
The orthophosphates, and other inorganic forms which can be easily converted into orthophosphates with residence times that vary from minutes to hours (Helfenstein et al., 2020), are classified as available P. This P pool is composed of the resin and NaHCO3 (sodium bicarbonate) inorganic fractions derived from the sequential extraction process.
-
The forms of P resulting from chemical bonds with inorganic compounds that are less but still accessible by plants, i.e. they have mean residence times that vary from days to months (Helfenstein et al., 2020), are classified here as inorganic P; this P pool is composed of the NaOH (sodium hydroxide) inorganic P fraction derived from the sequential extraction method.
-
All the fractions of P related to the organic matter are classified as organic P; this pool is composed of the organic fractions extracted with NaHCO3 and NaOH in the sequential extraction process. The inorganic and organic P pools are accessible by plants via alternative acquisition and mobilization strategies (Lambers, 2022).
-
P linked to primary minerals is the form that is present in the parent lithology. This form of soil P is commonly named primary mineral P and is transformed by weathering, which liberates inorganic P in the soil. Here we assume that the primary mineral P is composed of the fraction extracted with HCl (hydrochloric acid – calcium-bound P) in the sequential fractionation process. The mean residence time of primary mineral P falls into timescales that vary from years to millennia (Helfenstein et al., 2020).
-
There are less accessible forms of P that are tightly bonded or adsorbed to other molecules in soil, organic or inorganic, and, due to the strength of these chemical linkages, only become available to plants at longer timescales and/or with higher costs for mobilization and acquisition (Schubert et al., 2020). These forms are grouped into the pool of occluded P and are represented here by the residual P obtained by Quesada et al. (2010). This residual pool is estimated from the subtraction between total P (presented next) and the sum of all preceding forms (1–4). Both occluded P and primary mineral P are formed by stable compounds that have residence times ranging from years to millennia (Lambers, 2022; Helfenstein et al., 2018).
The total P pool comprises all the forms of P described above and is the total P extracted with acid digestion using a concentrated solution of H2SO4 followed by H2O2 in replicate samples to avoid errors caused by the laboratory procedures (Quesada et al., 2010). The aggregation of P fractions extracted sequentially into P pools to be used in this study is summarized in Table 2.
Table 2Ecological P forms modelled in this study and the respective fractions of P obtained with the methods described in Hedley et al. (1982), Quesada et al. (2010), and Hou et al. (2018). The total P was extracted from a replicate sample using the method of Tiessen and Moir (Carter and Gregorich, 2007). Pi is the inorganic P fraction. Po is the organic P fraction, as in Hou et al. (2018).
The limited number of samples and the spatial gaps in the dataset used for fitting are understandable, considering the mobility challenges in the region. Similarly, the sample collection is temporally heterogeneous due to these constraints, limiting opportunities for repeated sampling over extended periods (Carvalho et al., 2023). The reference maps constructed here are based on the assumption that the size of the P form pools in soils remains stable during sampling. This implies that the transformation of some P forms into others does not significantly alter the size of the P form pools during data collection. Given the geological timescales of P's biogeochemical cycling, we consider this a reasonable assumption. However, understanding the dynamics of P forms in soil falls outside the scope of this study. The complete description of the phosphorus dataset used for model fitting is described in Sect. 2.3.
2.2 Predictive variables for constructing the P maps: the predictive dataset
The predictor data were obtained from two different sources. Mean annual precipitation and temperature (MAP in mm yr−1 and MAT in ∘C) and elevation (metres) were extracted from the WorldClim database (Fick and Hijmans, 2017). Terrain slope (%) was estimated from the elevation data. Soil pH in water, soil texture (sand, silt, and clay, %), total organic C (TOC; %), total N (TN; %), and reference soil groups (World Reference Base, WRB) were obtained from the SoilGrids 2.0 database (Poggio et al., 2021). All spatial raster datasets were downloaded from the sources and used in the resolution of 5 arcmin. While it is possible to obtain the data in a finer resolution, the primary intent of the maps presented here is to parametrize and benchmark land surface models that simulate terrestrial vegetation. Thus, we opted to produce the maps in the resolution of 5 arcmin. In this resolution, the maps can be easily aggregated to satisfy the needs of land surface modelling, at the same time enabling other possible uses of the reference maps that require a higher resolution. To identify the areas, i.e. grid cells, where the predictor data present high multivariate dissimilarity with the observed data, such that the predictive power of the random forest models can be compromised, we calculated the dissimilarity index (DI; Meyer and Pebesma, 2021). The DI denotes the multidimensional dissimilarity of a given predictor grid cell (a spatial grain composed of the data described in this section) in relation to the fitting dataset (the phosphorus dataset, described in the previous section). The DI can assume values equal to or greater than zero. Low values of DI indicate that the given predictor grid cell presents low dissimilarity in relation to the observations in the fitting dataset. We filtered the data, aiming to prevent the random forest models from realizing predictions in areas where the values in the predictive dataset fall outside the range of the variables in the fitting dataset, used to train and test the models. We excluded all grid cells with DI values above the sum of the third quartile with the interquartile range from the figures (Fig. S2). Geospatial raster layers with the DI values and masks with regions excluded in the DI analysis are provided with the reference P maps.
2.3 Random forest models
We employed a model selection approach based on regressions using the random forest algorithm (Breiman, 2001; Cutler et al., 2012). For each target P form (available, organic, inorganic, occluded, and total P), 100 000 random forest regression models were trained and tested using the fitting dataset (Sect. 2.1). We used the Scikit-Learn RandomForestRegressor (Pedregosa et al., 2011). For each random forest model being fitted, 100 decision tree estimators were used. For each model, the phosphorus dataset was randomly split into training and test data (75 % and 25 % of the samples, respectively). During the training and testing, every fitted model and its relative train–test subsets were assigned to a random state, represented by an integer between 0 and 99 999. We chose this selection approach due to the inherent stochasticity in both the train–test split phase and the training of random forest models. In the former, samples from the dataset are randomly assigned to either the training or testing sets. In the latter, stochasticity arises from two factors: (i) bootstrap sampling, where each decision tree is trained on a random sample (with replacement) from the dataset, and (ii) feature randomness during decision tree construction. Unlike standard decision tree construction, which uses the feature that provides the most information gain for a split (or tree branch), random forests build each tree based on a random subset of features from the training data. Therefore, by selecting a group of models from a pool, we can capture the inherent stochasticity in the models while choosing the most accurate ones. As criteria for the selection of random forest models, we adopted an accuracy measure (Eq. 1) based on the mean absolute percentage error (MAPE; De Myttenaere et al., 2016) and a Monte Carlo cross-validation procedure (Stone, 1974; Kuhn and Johnson, 2013) in which the models were cross-validated on 15 random splits of the phosphorus dataset, using the same ratio of the fitting dataset splitting as in the training phase. The metric used to evaluate the model's performance in the cross-validation phase was the coefficient of determination (R2). The cross-validation provides a measure of the generalization power of each selected model over the fitting dataset. For each target variable,i.e. P form, we selected the models with accuracy and cross-validation R2 scores above arbitrarily chosen threshold values based on preliminary evaluations of a thousand random forest regression models for each target variable. The threshold values chosen (Table 3) were defined to enable our model selection to result in a minimal number of models after training the pool of models for each target variable. The selection criteria, the number of selected models for each target variable, the mean accuracy (Aμ), and cross-validation R2 of the selected models are presented in Table 3. The model accuracy is defined as
We calculated two additional model evaluation metrics; the mean absolute error and the coefficient of determination (not to be confused with the cross-validation R2) for each selected model for all P forms. To estimate the importance of the features, also a measure of model sensitivity to the regressor variables, we calculated the mean decrease in accuracy (MDA) for each selected model. The MDA is calculated via permutation where a given selected model is tested several times (120 in our case), with rearrangements (shuffling of a single feature) in the model's respective testing split of the fitting dataset. These rearrangements aim to eliminate the potential relationships between the permutated features and the target variable and estimate how much accuracy is lost in the process. Thus, for a given model, features that show higher values of MDA provide higher predictive power.
Table 3Threshold values for model selection (see the main text, Sect. 2.1), number of selected models, and mean accuracy (Aμ) obtained for each P fraction.
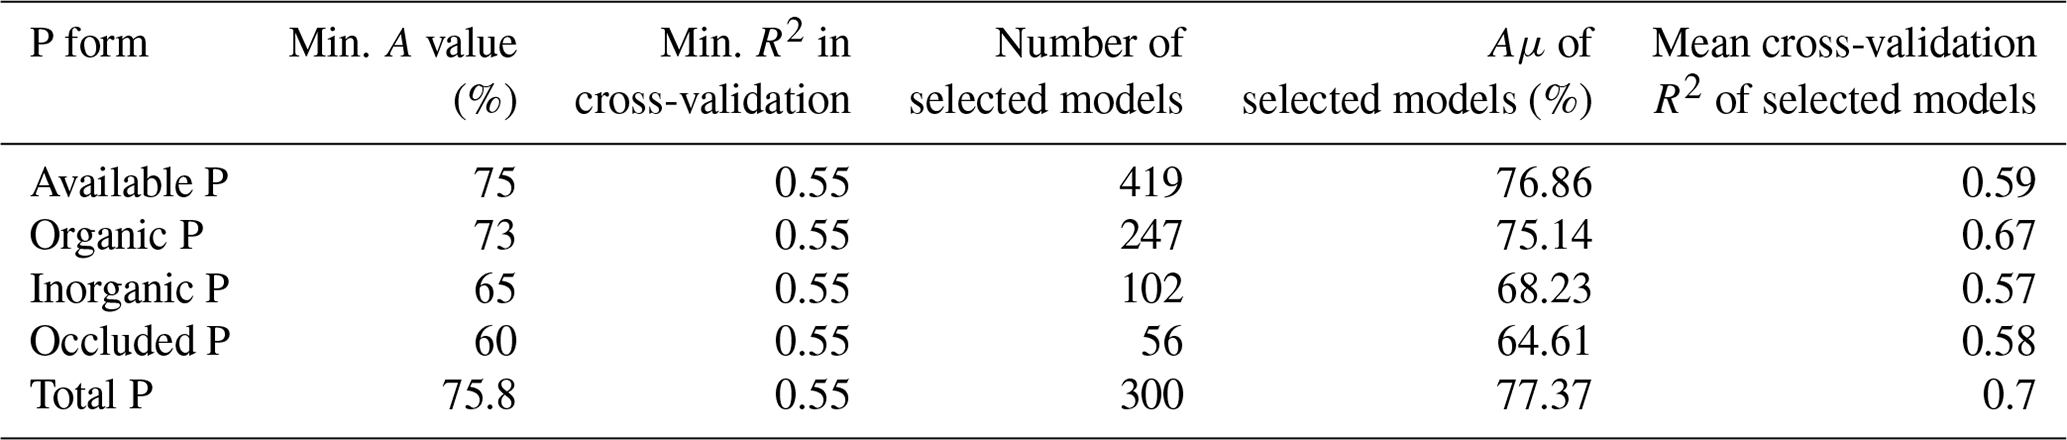
In our model selection approach, the models fitted for the primary mineral phosphorus (P) form demonstrated very low accuracy, with the best cases achieving only 15 %. Consequently, we did not include the primary mineral P form in the initial part of the analysis, which involved model fitting. We attribute this to the extremely low values of calcium-bound P observed in most samples in the fitting dataset. The majority of data in the fitting dataset were collected from sites with old, well-weathered, and acidic soils, characterized by trace amounts of calcium-bound P. Furthermore, we concluded that our set of predictive variables, considering both the geographical context and the distribution of sampled sites, was insufficient to generate an inference model for primary mineral P. To address this issue, we estimated the size of the primary P pool by subtracting the combined total of available, organic, inorganic, and occluded P forms from the estimated total P. We interpret this as an indication that the information from the set of variables in Table 1 is insufficient to generate predictions for the primary P form. It is important to note that the total, available, organic, inorganic, and occluded P forms described in this section were used solely as targets, i.e. response variables, for model fitting purposes.
To identify the effects of the most important input features on the predictions of the random forest models, we calculated the partial dependence (Hastie et al., 2001) and plotted the individual conditional expectation (Goldstein et al., 2014) for the most accurate random forest model selected for each P form. To generate the final maps of the P forms, we grouped the maps predicted by the selected models for each P form via the mean and calculate the standard error (both in mg kg−1). We used the topsoil bulk density from SoilGrids 2.0 (Poggio et al., 2021) to calculate the stocks of each P form in the topsoil (in Pg – petagrams). The steps involved in model training, testing, and selection and the selected models used for the prediction of P forms are summarized in Fig. S1. We compared our final map of total P concentration with the map of He et al. (2021). The observed values of total P in the fitting dataset were compared with the respective predicted values in the corresponding grid cells of the estimated maps via the Pearson correlation coefficient. The maps presented here were coloured using Scientific colour maps version 8.0 (Crameri, 2021; Crameri et al., 2020).
3.1 Descriptive statistics of the datasets
The mean concentration of total P in the fitting dataset across the 108 sites was 284.13 mg kg−1 (Table S1). The primary mineral and occluded forms of P corresponded to 53.61 % of the mean total P concentration, followed by the organic P (27.78 %), inorganic P (11.9 %), and lastly the available P (6.71 %). The descriptive statistics of the features in the fitting dataset are presented in Table S2. The predictive dataset was obtained after the adequation of several well-known spatial datasets covering the area of interest. The descriptive statistics of the features in the predictive dataset are presented in Table S3. The use of the dissimilarity index (DI; Fig. S2) resulted in the exclusion of several grid cells from the predictive dataset (hatched areas in Figs. 1–6). The area covered by the predictive dataset is approximately 8.4 × 10⁶ km2, of which 12.34 % was excluded for the prediction of the total P map. The excluded areas for the final maps of the available, organic, inorganic, and occluded P forms were 14.3 %, 11.7 %, 14 %, and 7.3 % respectively. The excluded areas for each P form overlap in several locations. The intersection of all excluded areas represented 21.5 % of the covered area in the predictive dataset (hatched areas in Fig. 6). The excluded grid cells in the DI analysis have higher values of elevation, slope, TOC, and TN and lower values of MAT when compared with the non-excluded grid cells (Figs. S3 and S4). The predicted values of P forms were consistently higher in the excluded areas (Fig. S4). After the exclusion of the grid cells with high DI values, the distribution of the features in the predictive dataset fell approximately within the distributions of the features in the fitting dataset (Fig. S5). The descriptive statistics of the predictive dataset without the exclusion of the grid cells with high DI values can be found in Table S3.
3.2 Estimated P stocks in the topsoil and the geographical patterns of P pools in the study area
All estimates presented in this section do not consider the excluded areas in the DI analysis. The estimated P form concentrations (Figs. 1–5) are the mean values for each grid cell as predicted by the selected models. The mean values are presented with the standard error. The estimated stock of total P (Fig. 1) is 0.71 Pg P, with a mean concentration of 264.17 mg kg−1 ranging from 104.25 to 823.7 mg kg−1 in the topsoil profile. We found total P concentration above the mean values in the Amazonian foreland basins and in the central area of the western portion of the Amazon rift (the region that divides the Brazilian and Guiana shields), which corresponds approximately to the catchments of the Solimões, Juruá, and Purús rivers at the centre of the study area (Fig. S6). In comparison, the mean total P concentration found in the He et al. (2021) map, over the same area, is 336.6 mg kg−1, ranging from 191.2 to 961.1 mg kg−1. The estimated stock of available P (Fig. 2) is 0.04 Pg P – or 5.6 % of the total P stock, and the estimated mean concentration is 13.84 mg kg−1, ranging from 6.92 to 65.21 mg kg−1. The concentration of available P is lower than the mean in most of the central and north portions of the study area but higher than the mean in the regions under the influence of the orogenic systems in the western, southern, and northern regions, characterized by elevations higher than 600 m (Fig. S6). The stock of organic P (Fig. 3) is 0.16 Pg P (22.5 % of the total P stock). The estimated mean concentration of organic P ranges from 19.6 to 247.18 mg kg−1, with mean values of 59.6 mg kg−1. The estimated stock of inorganic P (Fig. 4) is 0.08 Pg P (11.2 % of the estimated total P stock) with a mean concentration of 29.79 mg kg−1, ranging from 11.63 to 117.18 mg kg−1. The spatial patterns of organic and inorganic P concentrations follow the spatial pattern of the total P concentrations. The estimated stocks of occluded P correspond to 55 % (0.39 Pg P) of the predicted stock of total P, with a mean concentration value of 137.87 mg kg−1 ranging from 54.12 to 319.53 mg kg−1 (Fig. 5). Finally, the estimated stocks of primary mineral correspond to 7 % (0.05 Pg P) of the predicted stock of total P, with a mean concentration value of 21.29 mg kg−1 ranging from 0 to 161 mg kg−1 (Fig. 6).
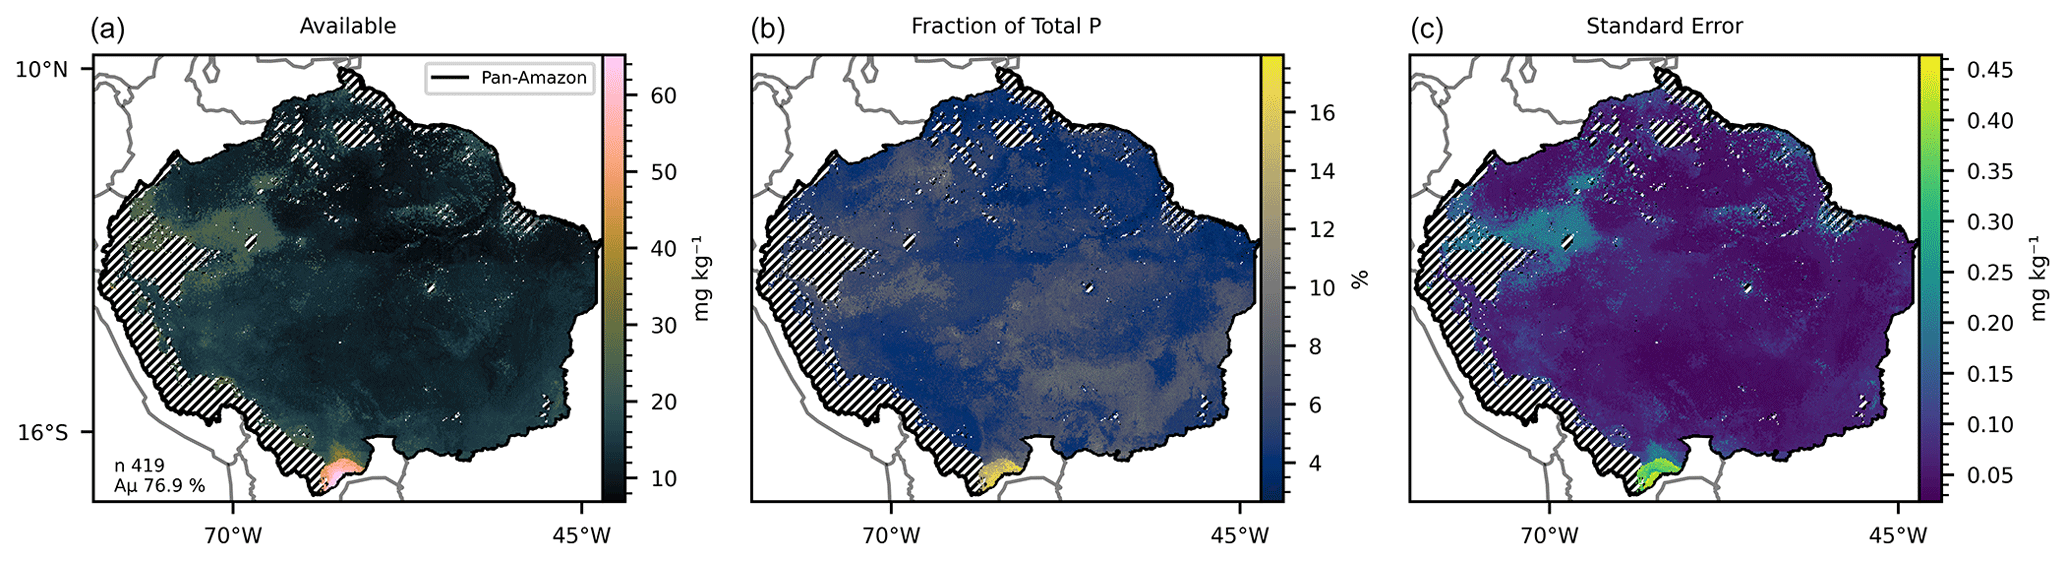
Figure 2(a) Mean available P concentration predicted by the 419 selected random forest models, with a mean accuracy of 76.9 % at the training phase. (b) Fraction of mean available P as percentage of the predicted total P concentration. (c) Standard error of the 419 predicted maps. The hatched areas mark the regions where the dissimilarity index (DI) presented values greater than the sum of the third quartile with the interquartile range.
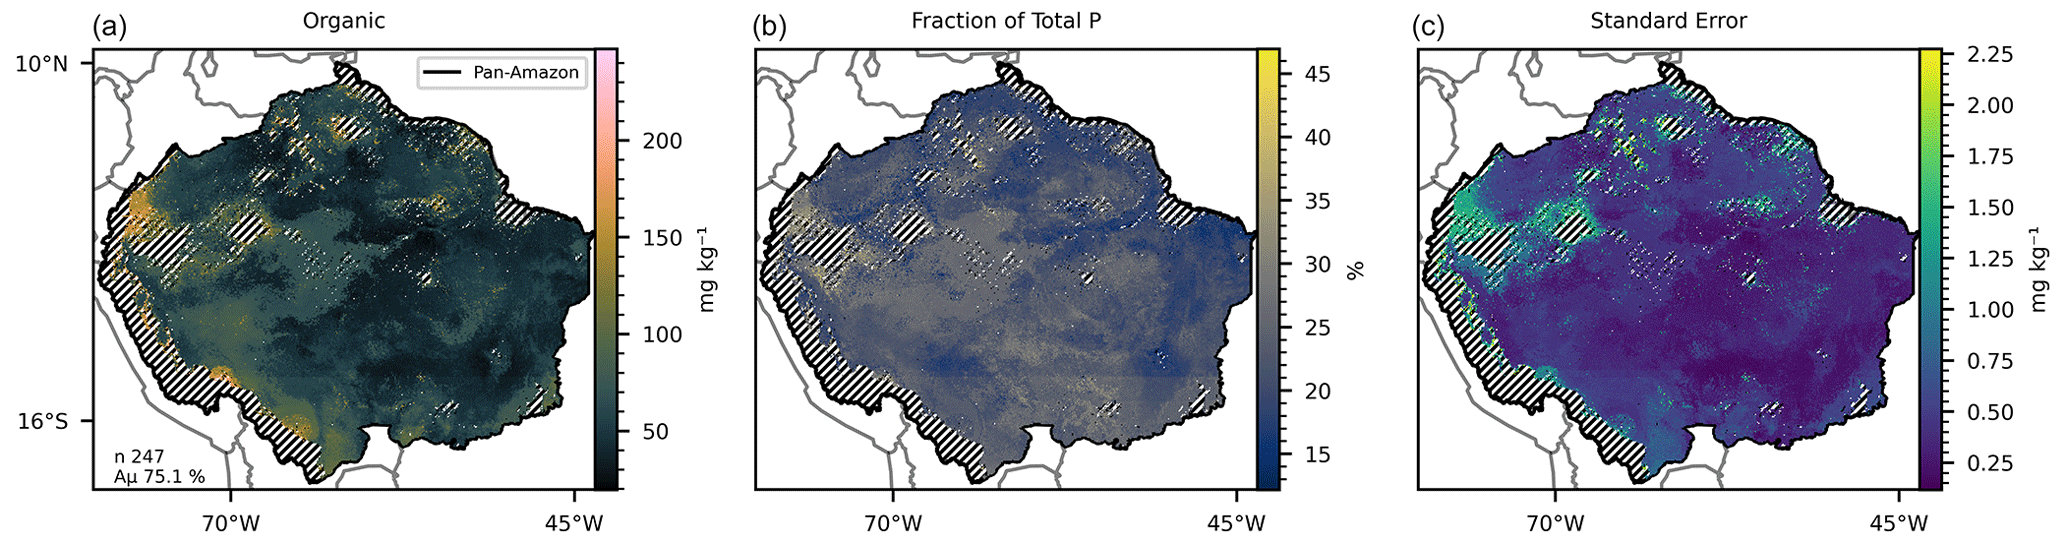
Figure 3(a) Mean organic P predicted by 247 selected random forest models, with a mean accuracy of 75.1 %. (b) Fraction of the mean total P represented by the mean organic P. (c) Standard error of the 247 predicted maps. The hatched areas mark the regions where the dissimilarity index (DI) presented values greater than the sum of the third quartile with the interquartile range.
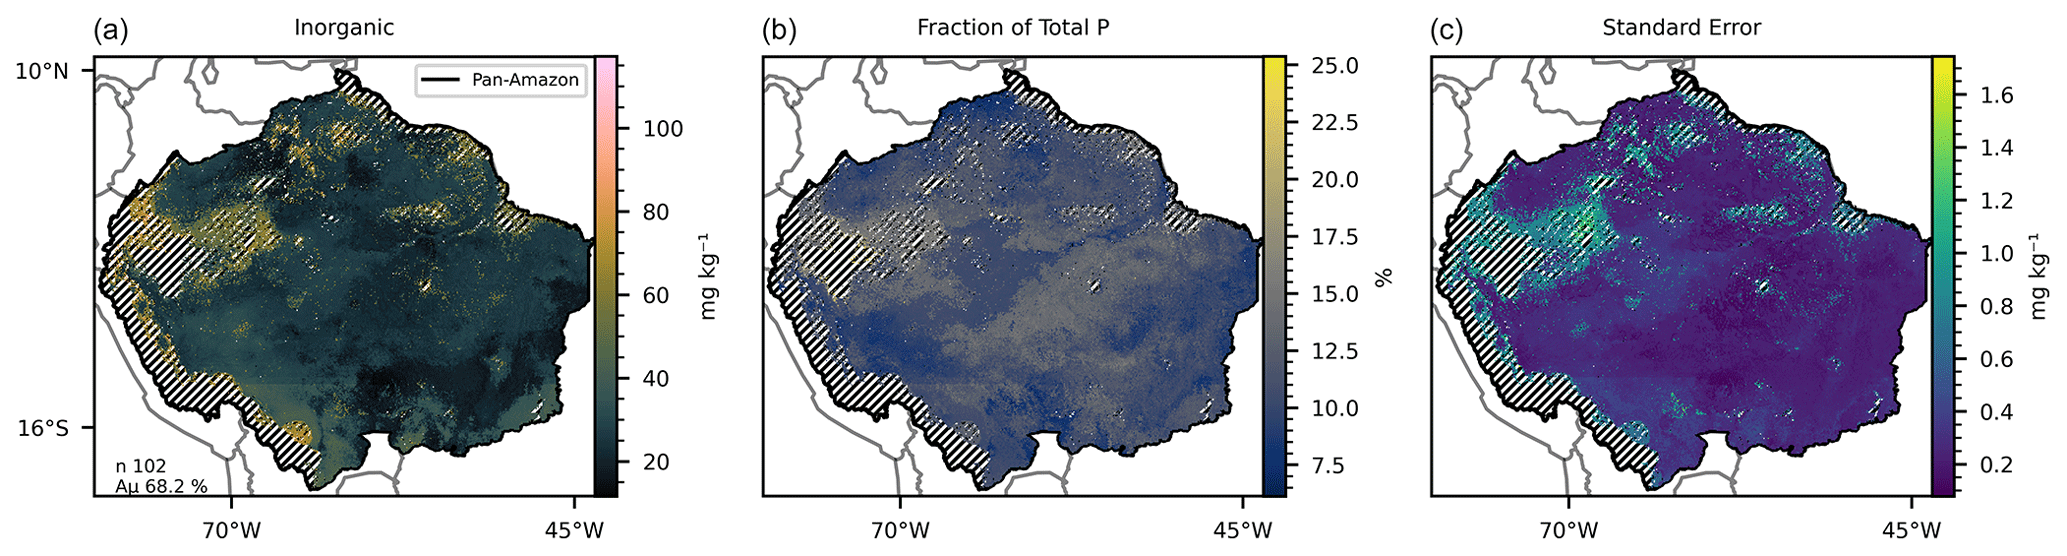
Figure 4(a) Mean inorganic P predicted by 102 selected random forest models, with a mean accuracy of 68.2 % in the training/testing phase. (b) Fraction of the mean total P represented by the mean inorganic P. (c) Standard error of the 102 predicted maps. The hatched areas mark the regions where the dissimilarity index (DI) presented values greater than the sum of the third quartile with the interquartile range.
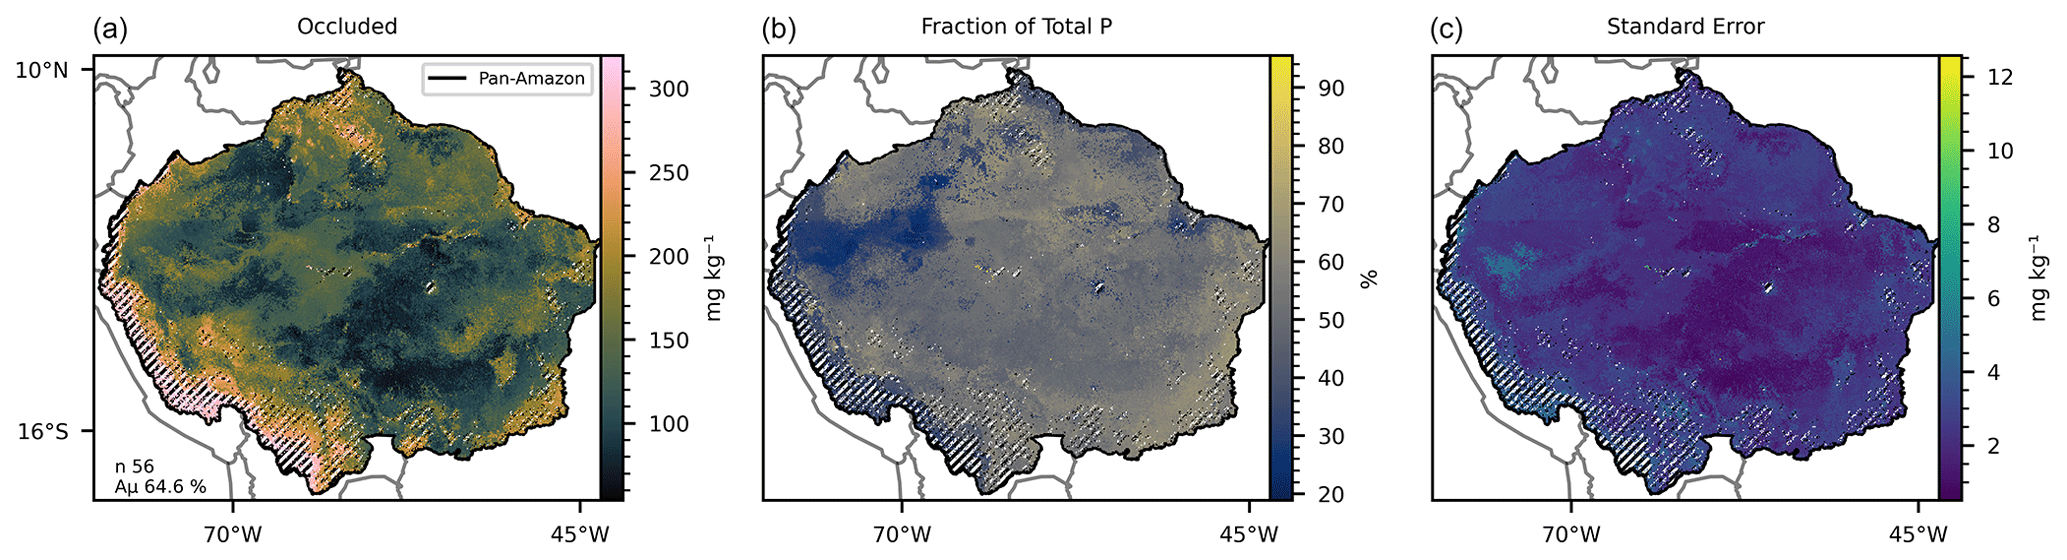
Figure 5(a) Mean occluded P predicted by 56 selected random forest models, with a mean accuracy of 64.6 % in the training/testing phase. (b) Fraction of the mean total P represented by the mean occluded P. (c) Standard error of the 56 predicted maps. The hatched areas mark the regions where the dissimilarity index (DI) presented values greater than the sum of the third quartile with the interquartile range.
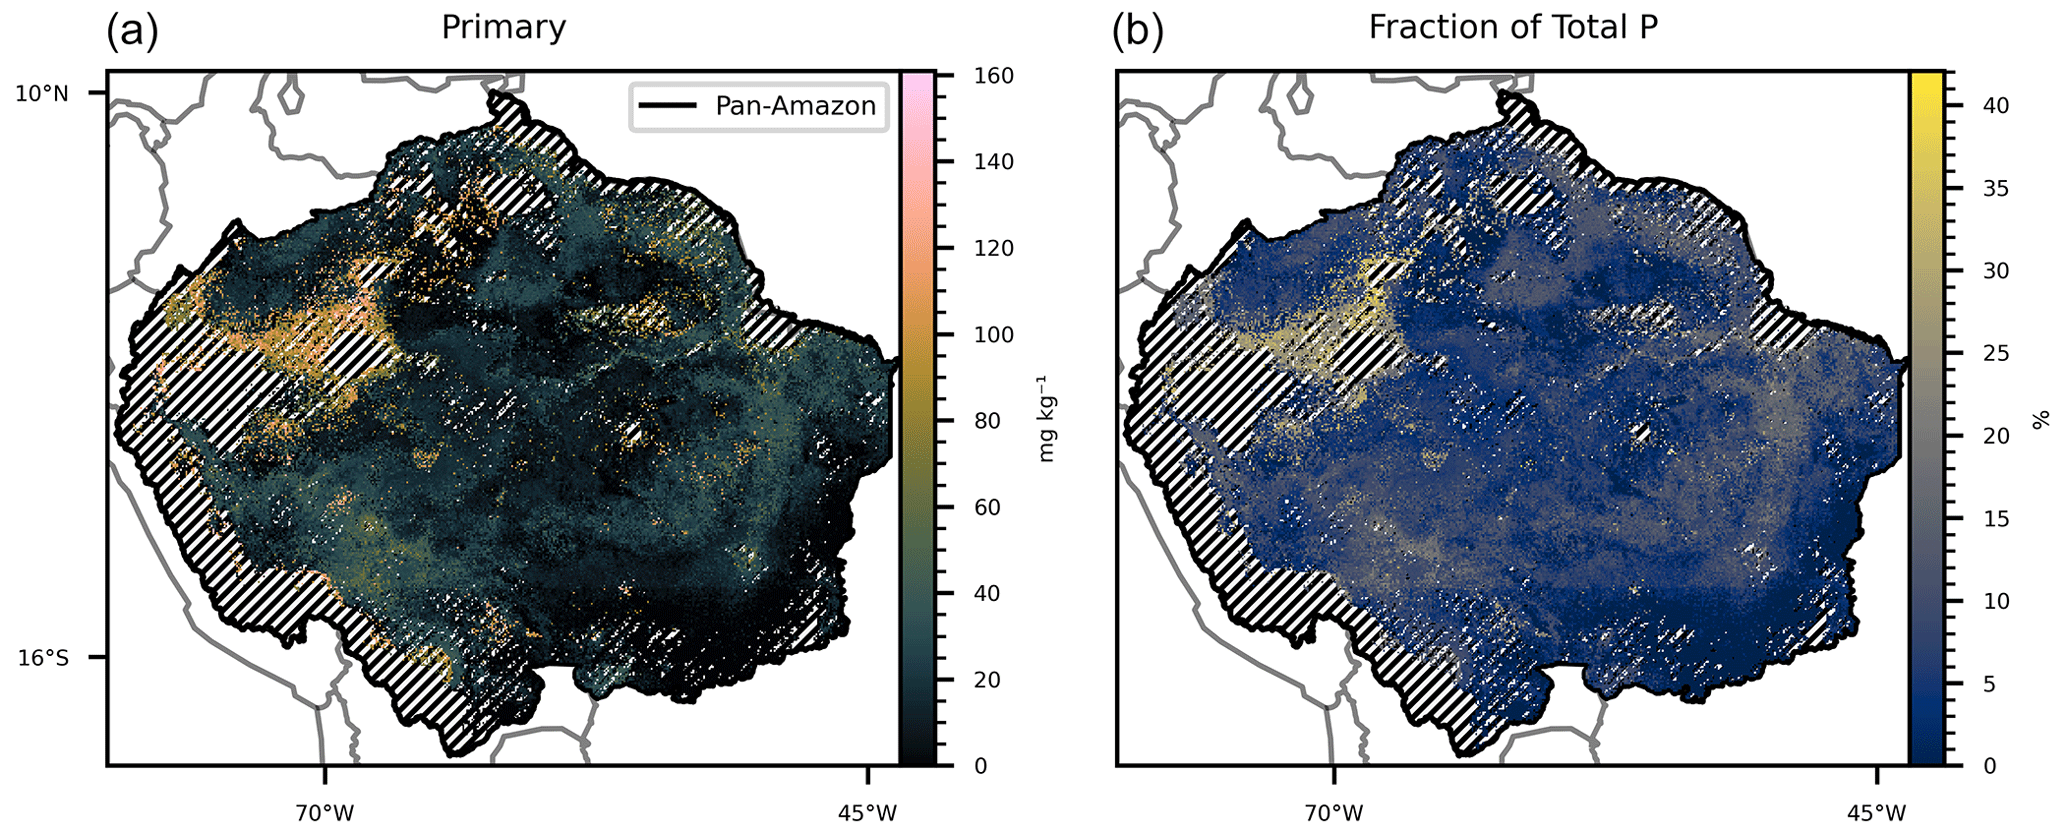
Figure 6(a) Map generated by the subtraction between mean total P and the sum of the remaining predicted P forms. (b) Percentage of the mean total P represented by mineral P, depicted in (a). The hatched areas mark the regions where the dissimilarity index (DI) presented values greater than the sum of the third quartile with the interquartile range in the total, available, organic, inorganic, and occluded P form maps.
3.3 Model performance and relations between predictive features and target P forms
For each modelled P form (total, available, organic, inorganic, and occluded P), several models were selected based on minimum thresholds of accuracy (Eq. 1) and performance in a Monte Carlo cross-validation procedure. Both evaluation metrics were calculated during the training and testing of the random forest regression models with the P (fitting) dataset. We selected 300 models for the prediction of the total P concentration maps (Table 3). The models presented a mean accuracy of 77.37 % (Fig. 1, left panel) with a mean score (R2) of 0.7 in the cross-validation (Fig. S7). The importance score (Fig. 7) shows the features that confer more valuable information and that increase the accuracy of the random forest models in the training/testing phase. Total N has high values of MDA for all target P forms and the highest values for total P. Total N, pH, sand, mean annual temperature, silt, and total organic C were the most important predictive features for the models fitted with total P as target (Fig. 7). Total P presented positive non-linear relations with total N, silt, and total organic C; a non-monotonic relation with pH; and negative non-linear relations with MAT and sand fraction as shown by the partial dependency plots (Fig. S8).
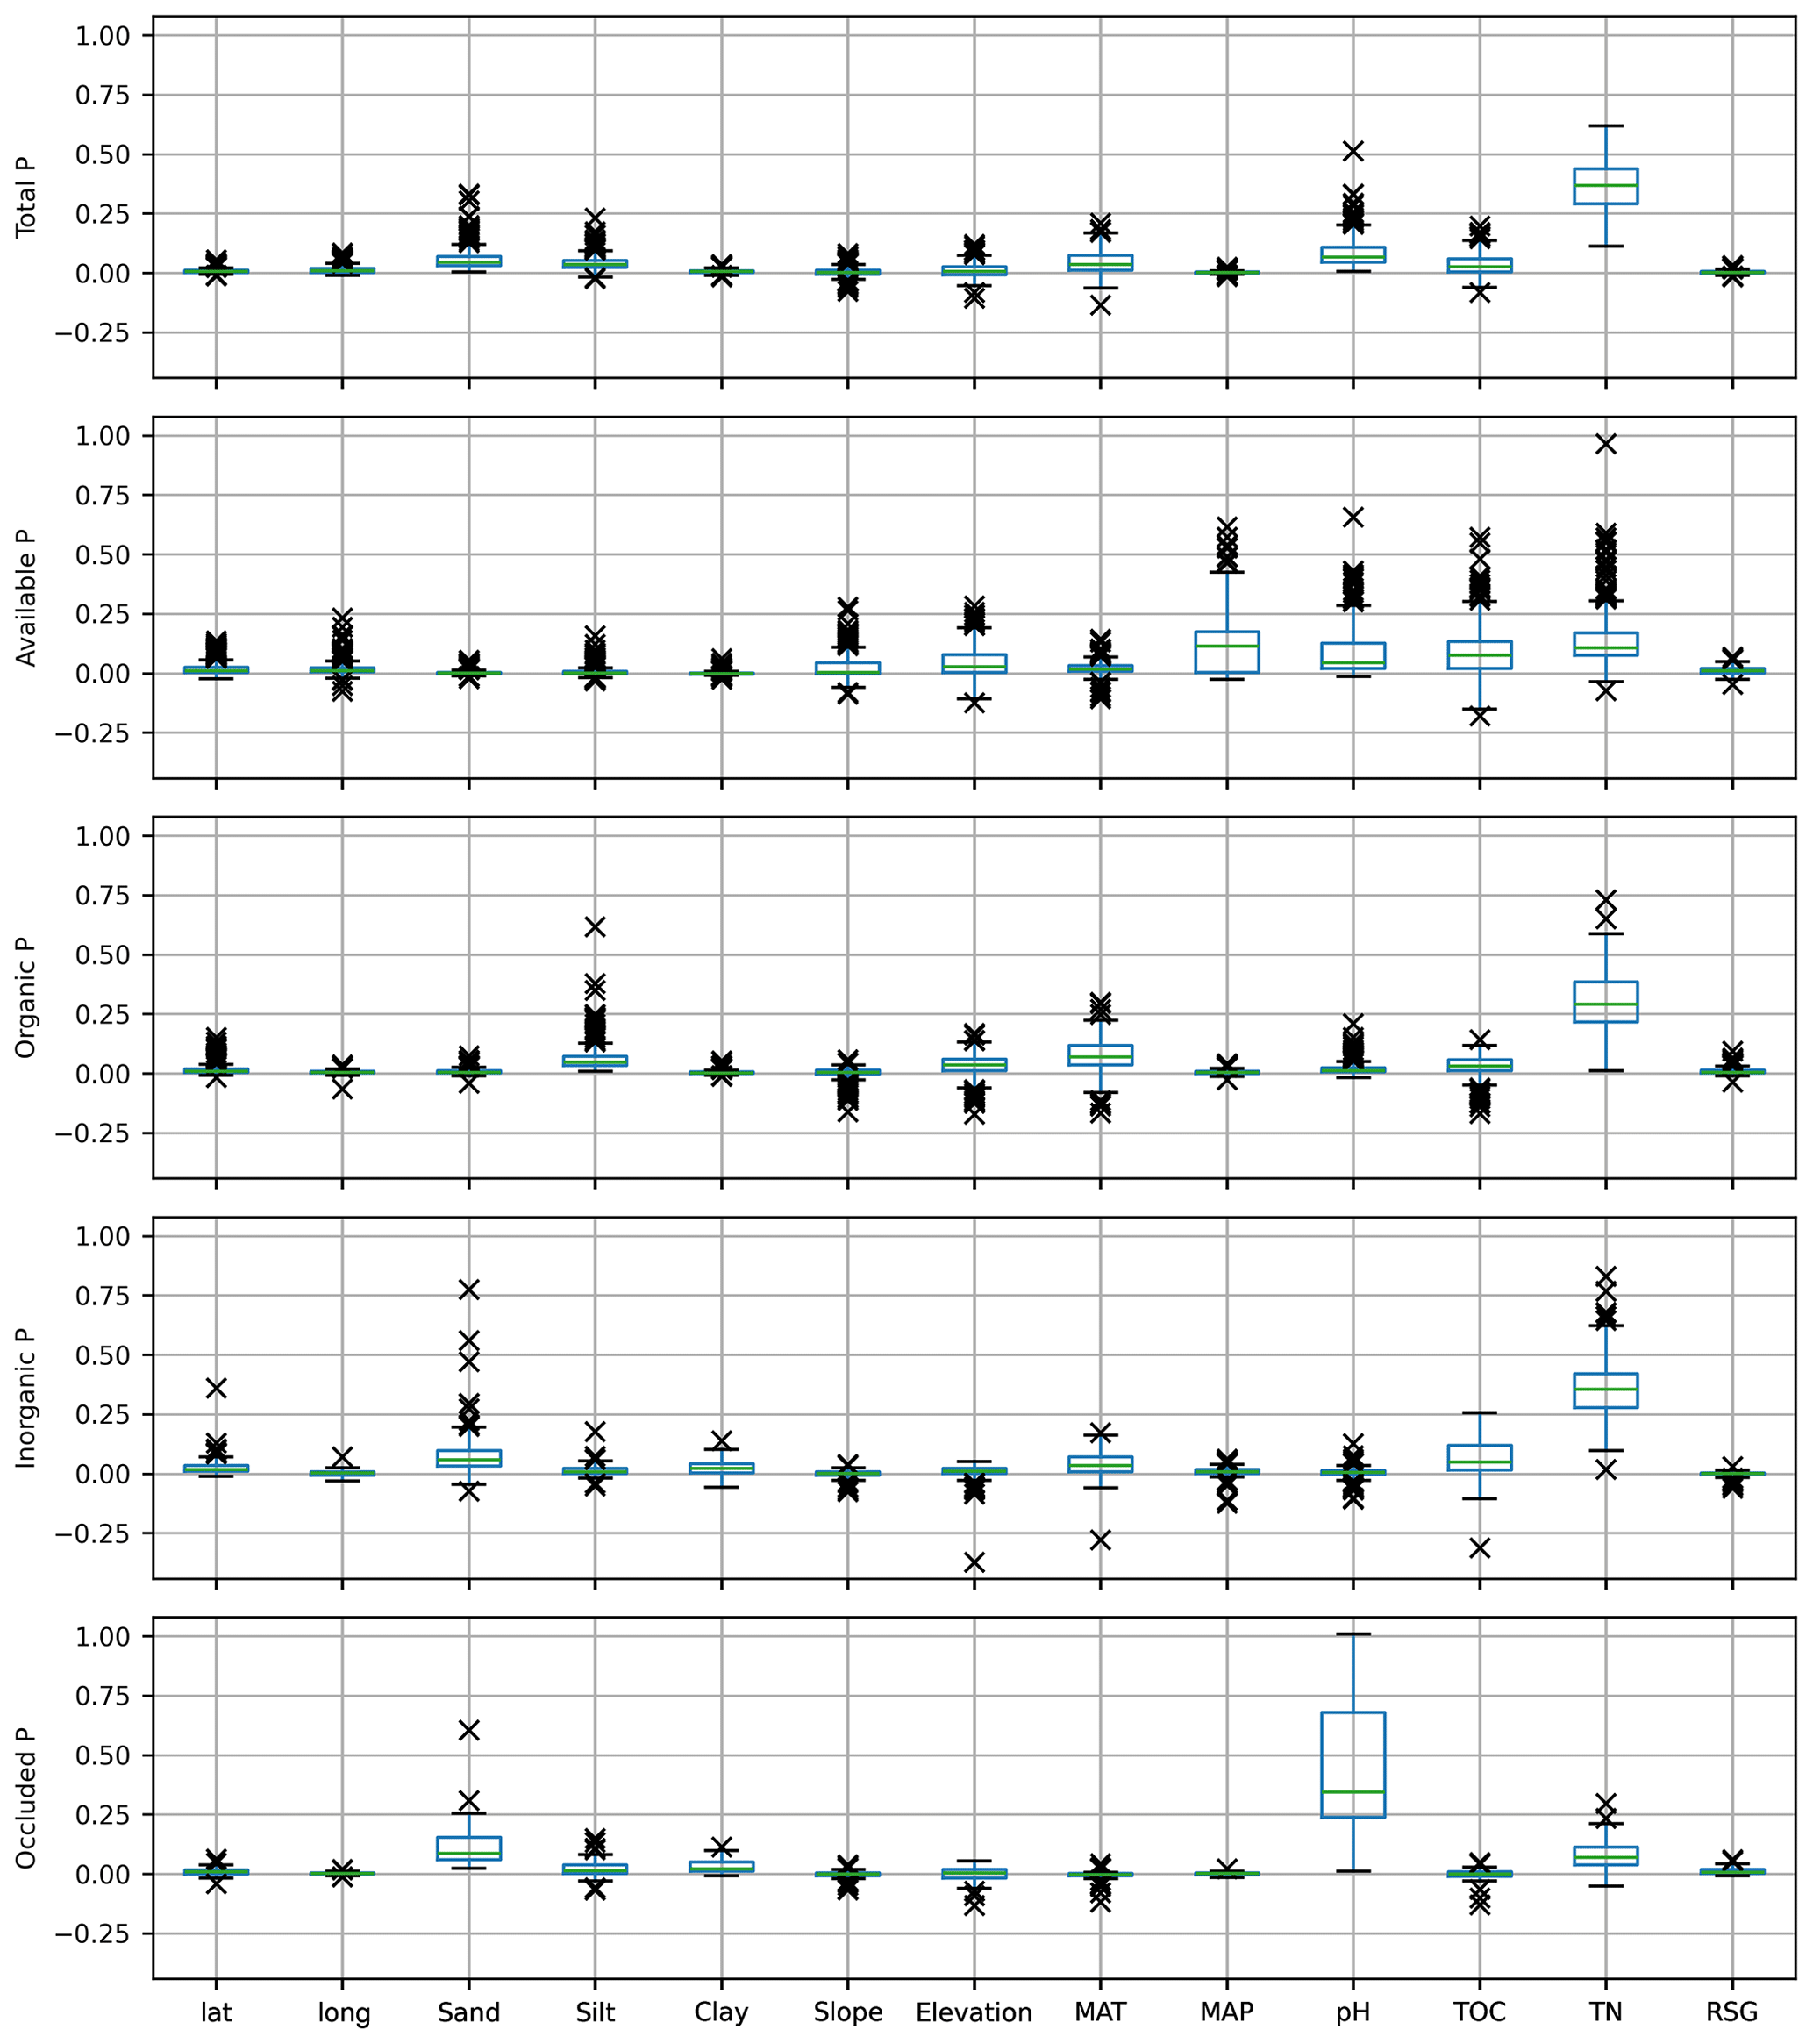
Figure 7Variable's permutation importance – or MDA (mean decrease in accuracy), distribution of means for the set of RF models selected for each P form (Table 3). Positive (negative) values of MDA indicate that the “exclusion” of the variable decreases (increases) the RF model accuracy. Higher values of MDA indicate higher variable importance. Each selected model was permuted 120 times. The internal variability (standard deviation of MDA) of each model is not presented. Abbreviations: TN – total nitrogen, TOC – total organic carbon, MAP/MAT – mean annual precipitation/temperature, lat – latitude, long – longitude, RSG – reference soil group (sum of the mean MDA for all soil classes). See Table 1 for variable units.
The 419 models selected for prediction of the available P (Table 3) presented a mean accuracy of 76.85 % with a score of 0.6 in the cross-validation (Figs. 2 and S9). The variables with higher values of MDA were total N, MAP, total organic C, pH, elevation, and slope (Fig. 7). All the listed variables presented positive non-linear relations with available P apart from MAP, that showed a non-linear relation (Fig. S9). For the prediction of organic P, 247 random forest regression models were selected (Table 3) with a mean accuracy of 75.14 % and cross-validation R2 of 0.67 (Figs. 3 and S10). The variables with higher values of MDA for organic P (Fig. 7), on average, were total N, MAT, silt, elevation, total organic C, and pH. All variables presented positive relations with organic P concentration except MAT (Fig. S12). For the inorganic P form, 102 models with a mean accuracy of 68.23 % and a cross-validation score of 0.58 were selected (Figs. 4 and S13). The variables with higher values of MDA for the inorganic P form were total N, sand, total organic C, MAT, latitude, and clay (Fig. 7). Total N, total organic C, and clay presented positive relations with inorganic P; in contrast, MAT and sand showed negative relations (Fig. S14). For the occluded P form, 56 models were selected and presented a mean accuracy of 64.6 % with a score of 0.58 in the cross-validation (Fig. S15). The most important variables for the prediction of occluded P were pH, sand, TN, clay, silt, and latitude (Fig. 7). Occluded P showed positive non-linear relationships with all those variables with exception of sand (Fig. S16). In our analysis, the reference soil group has very low values of MDA (Figs. 7 and S17), indicating that they are not powering the accuracy of the random forest models and, thus, are not good predictors for P forms in the soil in our statistical approach. The predicted values of total P in our map presented a correlation coefficient of 0.73 (p<0.01) when compared with the observed values in the fitting dataset. For comparison, the map of total P of He et al. (2021) presented a correlation coefficient of 0.36 (p<0.01).
We used soil data sampled in 108 plots of the RAINFOR network in the pan-Amazon region (the fitting dataset) to train, test, and select random forest regression models. The target variables were the concentration of total, available, organic, and inorganic P forms in the topsoil. The predictive features in the fitting dataset were latitude; longitude; sand, silt, and clay fractions; mean annual precipitation and temperature; pH; elevation and slope; total N; total organic C; and reference soil group. Using the selected models and a compiled spatially explicit dataset (5 arcmin lat–long) containing 98 705 grid cells with estimated values of the predictive features found in the fitting dataset, we constructed estimated maps of the target P forms for the pan-Amazon region.
4.1 Soil phosphorus maps
The mean concentration of total P in the fitting dataset (284.13 mg kg−1) shows that the pan-Amazon region is poor in phosphorus when compared with a global mean of 570 mg kg−1 (He et al., 2021). The Amazonian foreland basins (Fig. S6) are marked by relatively higher values of total P. These are Cenozoic sedimentary basins in western Amazon and are under the influence of the ongoing Andean orogenesis uplifting (Val et al., 2021, and citations therein) during the last 1×10⁷ years. The regional atmospheric circulation, influenced by orogenic effects, causes high precipitation rates along the Andes foothills in the western Amazon (Bookhagen and Strecker, 2008). The transport of primary material enriched with P from the Andes foothills through Amazonian foreland basins and through the lowland catchments of the Amazonas, Solimões, Juruá, and Purús rivers in the central Amazon (Solimões and Amazon sedimentary basins, Fig S6) results in a relatively higher total P in these regions (Wittmann at al., 2011; Quesada et al., 2010). In contrast, the sedimentary basins in the lowlands of eastern Amazon are characterized by approximately 2×10⁷ years of tectonic stability under the influence of the weathered crystalline outcrops of the Proterozoic rocks of the Brazilian and Guinan shields (Quesada et al., 2010). The generated map of total P (Fig. 1) resembles the predicted patterns found in the literature (Val et al., 2021) and in comparison with the more recent map of total P (He et al., 2021) our map presented a better correlation coefficient with observed data. However, it is important to note that despite the fact that the dataset used to train our random forest models was a subset of the data used to train and test the random forest model used by He et al. (2021), the latter was trained using global data aiming to the production of a global map, indicating that training models to restricted areas could be important to optimize the accuracy and predictive power. The difference between the predicted map of total P (Fig. 1) and the sum of the compounding P forms (Figs. 2–6) is a proxy for the primary mineral P form (Fig. 7) and shows that the abundance of P-rich primary material is higher in the border between the Andes and the Amazon than in the older soils of the Amazon lowlands due to the high weathering intensity and transport of parental material associated with the environmental conditions. The spatial distribution of the occluded P (Fig. 6), organic P (Fig. 3), and inorganic P (Fig. 4) followed the pattern observed in the total P map (Fig. 1), indicating that the sizes of these P pools are related with the concentration of total P (He et al., 2023).
4.2 Important variables and partial dependence
The analysis presented here showed the dependence of all target P forms, especially total P, on total N (Fig. S8). Considering the theory about the fate of these elements in soils (Walker and Syers, 1976; Lambers et al., 2008), one possible explanation for this observed link comes from the development stage of the soils in the region, that are originated from old lithologies (minimum age >1.5×10⁶ years) and characterized by millions of years of geological stability and continuous weathering (Val et al., 2021), meaning that the younger soils in the fitting dataset are old if compared with volcanic soils in the common chronosequences studied in Hawaii, for example (Crews et al., 1995). Quesada et al. (2010) already identified a positive correlation between total P and total N. In general, higher values of total P concentration and total N were found in the younger reference soil groups in the fitting dataset, with the concentration of both N and P decreasing with soil age, indicating that the correlation between total N and total P could be explained by the gradient of soil particle specific surface area, surface charge densities, and organic matter adsorption (Quesada et al., 2010). Another concurrent explanation could be the possible control of P on N fixation (Reed et al., 2013, but see Wong et al., 2020). On the one hand, for younger and less weathered soils the main source of N is biological fixation, and for P it is weathering and/or deposition of primary minerals rich in P (Lambers, 2022). On the other hand, older and weathered soils are characterized by the continuous loss of N and P and the accumulation of P as occluded forms (Crews et al., 1995), with the organic forms of both elements exerting a strong control on the nutrient availability to plants (da Silva et al., 2022). The predominant low nutritional status of the soils in the fitting dataset and the positive relation between total N and total P indicate that in the very old and weathered soils of the pan-Amazon region, the low availability of P may be a limiting factor for biological N fixation (Liese et al., 2017; Van Langenhove et al., 2021; Zhang et al., 2022).
Besides total N, other variables also presented high values of MDA for the target P forms. The variable pH has high values of MDA for all target P forms with the exception of the inorganic P. The partial dependence of total P on pH (Figs. 7 and S8) indicates a positive relation between pH and total P. This is expected because in the sampled sites, in general, a greater concentration of total P is associated with younger soils that have a higher sum of bases and less exchangeable Al, which in turn are associated with higher pH values (Quesada et al., 2010). Mean annual precipitation presented high values of importance for the prediction of available P (Fig. 6) and a negative relation with available P (Fig. S10). The strong dependence of available P on precipitation is explained by a few sites that are characterized by young soils (Umbrisols and Cambisols) that have an overall greater total P concentration and present MAP lower than 1000 mm yr−1. In these sites, the low precipitation rates can contribute to a low-intensity transport of water-soluble fractions of P. Unsurprisingly, mean annual temperature presented high values of importance for the prediction of organic P (Fig. 6) and a negative correlation with the organic P form (Fig. S12). Temperature is one of the main drivers of organic matter decomposition (Howe and Smith, 2021), and thus, it is reasonable to expect that under lower decomposition rates, the concentrations of P related to organic matter should be relatively higher. The sand fraction presented high values of MDA for the prediction of the inorganic P form (Fig. 6), and the partial dependence analysis (Fig. S14) shows a negative relation between sand fraction and inorganic P. The reduced adsorption capacity in the sandy soils of the fitting dataset can explain the negative relationship with the inorganic P form (Quesada et al., 2010; Osman, 2018). The relations between the target P forms (and the fractional components of the Hedley sequential extraction) and the most important features of the fitting dataset are analysed and discussed extensively in the study of Quesada et al. (2010).
4.3 Uncertainties related to the fitting and predictive datasets
The reference soil groups presented low importance values for predicting the target P forms (Fig. S17). This indicates that the spatial extrapolation of P forms made from Hedley fractionation data based on reference soil groups can lead to a wrong interpretation of the concentrations and proportions of P forms in soils. The low number of observations of Hedley fractionation in different soil types (Yang and Post, 2011) leads to a high coefficient of variation of Hedley P fractions for each reference soil group. Moreover, there are a few soil classes that are under-represented in the fitting dataset (Tables S4 and 1 in Quesada et al., 2011). In general, this is the case for sites with higher elevations characterized by the occurrence of younger soils like Leptosols and Andosols (Table S4). Important intervals in the upper and/or lower ranges of some features related to elevation are absent in the training data, as shown by the dissimilarity index analysis (Fig. S3), reducing the suitable area to predictions using the random forest models. Our random forest regression models presented a good level of accuracy during the training phase. Nonetheless, the results could be improved by a greater number of in situ observations of soil P fractions and other edaphic and climatic variables in the Amazon region, especially in high-elevation areas where observations are lacking, with notable exceptions (Wilcke et al., 2019). The P forms have different residence times ranging from hours to millennia and are subject to a complex set of interactions with biotic, edaphic, and climatic environmental attributes over time. In this scenario, the presented maps can be useful to define initial conditions to dynamic, process-oriented models, for the simulation of P cycling in soils (Helfenstein et al., 2018). Finally, it is important to note that our P maps rely on raster datasets used to predict the P pools, which are subject to their own uncertainties (Poggio et al., 2021). The continuous improvement of these maps is also important to the precision and accuracy of mapping exercises as we present here.
The phosphorus maps for the pan-Amazon region can be downloaded from https://doi.org/10.25824/redu/FROESE (Darela-Filho and Lapola, 2023).
The source code and input data used to produce the maps are available at jpdarela/Reference_phosphorus_maps_pan-Amazon (https://github.com/jpdarela/Reference_phosphorus_maps_pan-Amazon, last access: 26 January 2024; DOI: https://doi.org/10.5281/zenodo.10571880, Darela-Filho, 2024).
The maps presented here provide information about P stocks and their distribution in soils. They are available for developing and evaluating DGVMs that seek to include or improve the representation of P cycling and P limitation on primary productivity in the pan-Amazon region. Additionally, the data presented here can be useful for correlational spatial studies that promote new hypothesis linking P availability and vegetation structure and function that could be tested in the study area. However, caution is needed with regard to the temporal variability of these P forms. Random forests are recognized for their power in prediction exercises; however, the methods to unveil the underlying drivers and mechanisms relating target variables and explanatory features are still under development (Lucas, 2020; Simon et al., 2023). Moreover, the dataset used to fit the random forest models is subject to a lack of observations in elevated regions. Nonetheless, the method applied here to estimate the spatial distribution of P forms in the topsoil of the pan-Amazon region relies on the relationships that maximize the amount of information that each predictive variable (i.e. feature related to the soil P content at the landscape scale) can contribute to the random forest regression models. Thus, our approach can partially overcome the lack of certainty in the Hedley fractionation P form–soil classification relationship by applying a nonparametric method based on statistical learning to predict the P forms in the soils of the pan-Amazon region.
The supplement related to this article is available online at: https://doi.org/10.5194/essd-16-715-2024-supplement.
JPDF, AR, CAQ, DML, KF, LCCH, and TR conceptualized the experiment, and JPDF carried it out. JPDF developed the code and the visualizations. CAQ was responsible for data sampling and curation. JPDF prepared the manuscript with contributions from all co-authors.
The contact author has declared that none of the authors has any competing interests.
Publisher’s note: Copernicus Publications remains neutral with regard to jurisdictional claims made in the text, published maps, institutional affiliations, or any other geographical representation in this paper. While Copernicus Publications makes every effort to include appropriate place names, the final responsibility lies with the authors.
We are thankful to the anonymous reviewers, Andy Krause, Allan Buras, and the members of the Land Surface Atmosphere Interactions group at TUM for the insightful comments on the methods and the manuscript.
This research has been supported by the Fundação de Amparo à Pesquisa do Estado de São Paulo (grant nos. 2015/02537-7, 2017/00005-3, and 2019/08194-5), the Conselho Nacional de Desenvolvimento Científico e Tecnológico (grant no. 309074/2021-5), the Bayerisches Staatsministerium für Wissenschaft und Kunst (Amazon-FLUX), and the International Graduate School of Science and Engineering (grant no. PhosForest).
This paper was edited by Jia Yang and reviewed by two anonymous referees.
Barrow, N. J., Sen, A., Roy, N., and Debnath, A.: The Soil Phosphate Fractionation Fallacy, Plant Soil, 459, 1–11, https://doi.org/10.1007/s11104-020-04476-6, 2020.
Bookhagen, B. and Strecker, M. R.: Orographic Barriers, High-Resolution Trmm Rainfall, and Relief Variations Along the Eastern Andes, Geophys. Res. Lett., 35, L06403, https://doi.org/10.1029/2007gl032011, 2008.
Breiman, L.: Random Forests, Mach. Learn., 45, 5–32, https://doi.org/10.1023/A:1010933404324, 2001.
Buendía, C., Arens, S., Hickler, T., Higgins, S. I., Porada, P., and Kleidon, A.: On the potential vegetation feedbacks that enhance phosphorus availability – insights from a process-based model linking geological and ecological timescales, Biogeosciences, 11, 3661–3683, https://doi.org/10.5194/bg-11-3661-2014, 2014.
Carter, M. R. and Gregorich, E. G. (Eds.): Soil Sampling and Methods of Analysis, 2nd edn., CRC Press, Boca Raton, FL, 1224 pp., https://doi.org/10.1201/9781420005271, 2007.
Carvalho, R. L., Resende, A. F., Barlow, J., Franca, F. M., Moura, M. R., Maciel, R., Alves-Martins, F., Shutt, J., Nunes, C. A., Elias, F., Silveira, J. M., Stegmann, L., Baccaro, F. B., Juen, L., Schietti, J., Aragao, L., Berenguer, E., Castello, L., Costa, F. R. C., Guedes, M. L., Leal, C. G., Lees, A. C., Isaac, V., Nascimento, R. O., Phillips, O. L., Schmidt, F. A., Ter Steege, H., Vaz-de-Mello, F., Venticinque, E. M., Vieira, I. C. G., Zuanon, J., Synergize, C., and Ferreira, J.: Pervasive Gaps in Amazonian Ecological Research, Curr. Biol., 33, 3495–3504, https://doi.org/10.1016/j.cub.2023.06.077, 2023.
Castanho, A. D. A., Coe, M. T., Costa, M. H., Malhi, Y., Galbraith, D., and Quesada, C. A.: Improving simulated Amazon forest biomass and productivity by including spatial variation in biophysical parameters, Biogeosciences, 10, 2255–2272, https://doi.org/10.5194/bg-10-2255-2013, 2013.
Crameri, F.: Scientific Colour Maps, Zenodo [data set], https://doi.org/10.5281/ZENODO.5501399, 2021.
Crameri, F., Shephard, G. E., and Heron, P. J.: The Misuse of Colour in Science Communication, Nat. Commun., 11, 5444, https://doi.org/10.1038/s41467-020-19160-7, 2020.
Crews, T. E., Kitayama, K., Fownes, J. H., Riley, R. H., Herbert, D. A., Muellerdombois, D., and Vitousek, P. M.: Changes in Soil-Phosphorus Fractions and Ecosystem Dynamics across a Long Chronosequence in Hawaii, Ecology, 76, 1407–1424, https://doi.org/10.2307/1938144, 1995.
Cunha, H. F. V., Andersen, K. M., Lugli, L. F., Santana, F. D., Aleixo, I. F., Moraes, A. M., Garcia, S., Di Ponzio, R., Mendoza, E. O., Brum, B., Rosa, J. S., Cordeiro, A. L., Portela, B. T. T., Ribeiro, G., Coelho, S. D., de Souza, S. T., Silva, L. S., Antonieto, F., Pires, M., Salomao, A. C., Miron, A. C., de Assis, R. L., Domingues, T. F., Aragao, L., Meir, P., Camargo, J. L., Manzi, A. O., Nagy, L., Mercado, L. M., Hartley, I. P., and Quesada, C. A.: Direct Evidence for Phosphorus Limitation on Amazon Forest Productivity, Nature, 608, 558–562, https://doi.org/10.1038/s41586-022-05085-2, 2022.
Cutler, A., Cutler, D. R., and Stevens, J. R.: Random Forests, in: Ensemble Machine Learning, edited by: Zhang, C., and Ma, Y., Springer US, 157–175, https://doi.org/10.1007/978-1-4419-9326-7_5, 2012.
Darela-Filho, J. P.: Reference Maps of Soil Phosphorus for the Pan-Amazon Region: Source Code and Input Data, Zenodo [code], https://doi.org/10.5281/zenodo.10571880, 2024.
Darela-Filho, J. P. and Lapola, D. M.: Reference Maps of Soil Phosphorus for the Pan-Amazon Region: Code and Data, REDU – Repositório de Dados de Pesquisa da Unicamp [data set], https://doi.org/10.25824/redu/FROESE, 2023.
da Silva, E. C., da Silva Sales, M. V., Aleixo, S., Gama-Rodrigues, A. C., and Gama-Rodrigues, E. F.: Does Structural Equation Modeling Provide a Holistic View of Phosphorus Acquisition Strategies in Soils of Amazon Forest?, J. Soil Sci. Plant Nut., 22, 3334–3347, https://doi.org/10.1007/s42729-022-00890-0, 2022.
de Myttenaere, A., Golden, B., Le Grand, B., and Rossi, F.: Mean Absolute Percentage Error for Regression Models, Neurocomputing, 192, 38–48, https://doi.org/10.1016/j.neucom.2015.12.114, 2016.
Dijkshoorn, J. A., Huting, J. R. M., and P., T.: Update of the 1:5 Million Soil and Terrain Database for Latin America and the Caribbean (Soterlac; Version 2.0), ISRIC – World Soil Information, Wageningen, https://isric.org/sites/default/files/isric_report_2005_01.pdf (last access: 20 October 2023), 2005.
Du, E. Z., Terrer, C., Pellegrini, A. F. A., Ahlstrom, A., van Lissa, C. J., Zhao, X., Xia, N., Wu, X. H., and Jackson, R. B.: Global Patterns of Terrestrial Nitrogen and Phosphorus Limitation, Nat. Geosci., 13, 221–226, https://doi.org/10.1038/s41561-019-0530-4, 2020.
Farr, T. G., Rosen, P. A., Caro, E., Crippen, R., Duren, R., Hensley, S., Kobrick, M., Paller, M., Rodriguez, E., Roth, L., Seal, D., Shaffer, S., Shimada, J., Umland, J., Werner, M., Oskin, M., Burbank, D., and Alsdorf, D.: The Shuttle Radar Topography Mission, Rev. Geophys., 45, RG2004, https://doi.org/10.1029/2005rg000183, 2007.
Fick, S. E. and Hijmans, R. J.: Worldclim 2: New 1-Km Spatial Resolution Climate Surfaces for Global Land Areas, Int. J. Climatol., 37, 4302–4315, https://doi.org/10.1002/joc.5086, 2017.
Gama-Rodrigues, A. C., Sales, M. V. S., Silva, P. S. D., Comerford, N. B., Cropper, W. P., and Gama-Rodrigues, E. F.: An Exploratory Analysis of Phosphorus Transformations in Tropical Soils Using Structural Equation Modeling, Biogeochemistry, 118, 453–469, https://doi.org/10.1007/s10533-013-9946-x, 2014.
Goldstein, A., Kapelner, A., Bleich, J., and Pitkin, E.: Peeking inside the Black Box: Visualizing Statistical Learning with Plots of Individual Conditional Expectation, arXiv [preprint], https://doi.org/10.48550/arXiv.1309.6392, 20 March 2014.
Goll, D. S., Brovkin, V., Parida, B. R., Reick, C. H., Kattge, J., Reich, P. B., van Bodegom, P. M., and Niinemets, Ü.: Nutrient limitation reduces land carbon uptake in simulations with a model of combined carbon, nitrogen and phosphorus cycling, Biogeosciences, 9, 3547–3569, https://doi.org/10.5194/bg-9-3547-2012, 2012.
Gu, C. H. and Margenot, A. J.: Navigating Limitations and Opportunities of Soil Phosphorus Fractionation, Plant Soil, 459, 13–17, https://doi.org/10.1007/s11104-020-04552-x, 2021.
Hastie, T., Friedman, J., and Tibshirani, R.: The Elements of Statistical Learning, Springer Series in Statistics, Springer, New York, NY, XVI, 536 pp., https://doi.org/10.1007/978-0-387-21606-5, 2001.
He, X., Augusto, L., Goll, D. S., Ringeval, B., Wang, Y., Helfenstein, J., Huang, Y., Yu, K., Wang, Z., Yang, Y., and Hou, E.: Global patterns and drivers of soil total phosphorus concentration, Earth Syst. Sci. Data, 13, 5831–5846, https://doi.org/10.5194/essd-13-5831-2021, 2021.
He, X., Augusto, L., Goll, D. S., Ringeval, B., Wang, Y.-P., Helfenstein, J., Huang, Y., and Hou, E.: Global patterns and drivers of phosphorus fractions in natural soils, Biogeosciences, 20, 4147–4163, https://doi.org/10.5194/bg-20-4147-2023, 2023.
Hedley, M. J. and Stewart, J. W. B.: Method to Measure Microbial Phosphate in Soils, Soil Biol. Biochem., 14, 377–385, https://doi.org/10.1016/0038-0717(82)90009-8, 1982.
Hedley, M. J., Stewart, J. W. B., and Chauhan, B. S.: Changes in Inorganic and Organic Soil-Phosphorus Fractions Induced by Cultivation Practices and by Laboratory Incubations, Soil Sci. Soc. Am. J., 46, 970–976, https://doi.org/10.2136/sssaj1982.03615995004600050017x, 1982.
Helfenstein, J., Tamburini, F., von Sperber, C., Massey, M. S., Pistocchi, C., Chadwick, O. A., Vitousek, P. M., Kretzschmar, R., and Frossard, E.: Combining Spectroscopic and Isotopic Techniques Gives a Dynamic View of Phosphorus Cycling in Soil, Nat. Commun., 9, 3226, https://doi.org/10.1038/s41467-018-05731-2, 2018.
Helfenstein, J., Pistocchi, C., Oberson, A., Tamburini, F., Goll, D. S., and Frossard, E.: Estimates of mean residence times of phosphorus in commonly considered inorganic soil phosphorus pools, Biogeosciences, 17, 441–454, https://doi.org/10.5194/bg-17-441-2020, 2020.
Hou, E., Tan, X., Heenan, M., and Wen, D.: A Global Dataset of Plant Available and Unavailable Phosphorus in Natural Soils Derived by Hedley Method, Sci. Data, 5, 180166, https://doi.org/10.1038/sdata.2018.166, 2018.
Howe, J. A. and Smith, A. P.: The Soil Habitat, in: Principles and Applications of Soil Microbiology, edited by: Gentry, T. J., Fuhrmann, J. J., and Zuberer, D. A., Elsevier, 23–55, https://doi.org/10.1016/b978-0-12-820202-9.00002-2, 2021.
Kuhn, M. and Johnson, K.: Applied Predictive Modeling, 1, Springer, New York, NY, https://doi.org/10.1007/978-1-4614-6849-3, 2013.
Lambers, H.: Phosphorus Acquisition and Utilization in Plants, Annu. Rev. Plant Biol., 73, 17–42, https://doi.org/10.1146/annurev-arplant-102720-125738, 2022.
Lambers, H., Raven, J. A., Shaver, G. R., and Smith, S. E.: Plant Nutrient-Acquisition Strategies Change with Soil Age, Trends Ecol. Evol., 23, 95–103, https://doi.org/10.1016/j.tree.2007.10.008, 2008.
Liese, R., Schulze, J., and Cabeza, R. A.: Nitrate Application or P Deficiency Induce a Decline in Medicago Truncatula N(2)-Fixation by Similar Changes in the Nodule Transcriptome, Sci. Rep., 7, 46264, https://doi.org/10.1038/srep46264, 2017.
Lloyd, J., Domingues, T. F., Schrodt, F., Ishida, F. Y., Feldpausch, T. R., Saiz, G., Quesada, C. A., Schwarz, M., Torello-Raventos, M., Gilpin, M., Marimon, B. S., Marimon-Junior, B. H., Ratter, J. A., Grace, J., Nardoto, G. B., Veenendaal, E., Arroyo, L., Villarroel, D., Killeen, T. J., Steininger, M., and Phillips, O. L.: Edaphic, structural and physiological contrasts across Amazon Basin forest–savanna ecotones suggest a role for potassium as a key modulator of tropical woody vegetation structure and function, Biogeosciences, 12, 6529–6571, https://doi.org/10.5194/bg-12-6529-2015, 2015.
Lucas, T. C. D.: A Translucent Box: Interpretable Machine Learning in Ecology, Ecol. Monogr., 90, e01422, https://doi.org/10.1002/ecm.1422, 2020.
Lugli, L. F., Andersen, K. M., Aragao, L. E. O. C., Cordeiro, A. L., Cunha, H. K. V., Fuchslueger, L., Meir, P., Mercado, L. M., Oblitas, E., Quesada, C. A., Rosa, J. S., Schaap, K. J., Valverde-Barrantes, O., and Hartley, I. P.: Multiple Phosphorus Acquisition Strategies Adopted by Fine Roots in Low-Fertility Soils in Central Amazonia, Plant Soil, 450, 49–63, https://doi.org/10.1007/s11104-019-03963-9, 2020.
Meyer, H. and Pebesma, E.: Predicting into Unknown Space? Estimating the Area of Applicability of Spatial Prediction Models, Methods Ecol. Evol., 12, 1620–1633, https://doi.org/10.1111/2041-210x.13650, 2021.
Osman, K. T.: Sandy Soils, in: Management of Soil Problems, Springer International Publishing, Cham, Switzerland, 37–65, https://doi.org/10.1007/978-3-319-75527-4_3, 2018.
Pedregosa, F., Varoquaux, G., Gramfort, A., Michel, V., Thirion, B., Grisel, O., Blondel, M., Prettenhofer, P., Weiss, R., Dubourg, V., Vanderplas, J., Passos, A., Cournapeau, D., Brucher, M., Perrot, M., and Duchesnay, E.: Scikit-Learn: Machine Learning in Python, J. Mach. Learn. Res., 12, 2825–2830, 2011.
Poggio, L., de Sousa, L. M., Batjes, N. H., Heuvelink, G. B. M., Kempen, B., Ribeiro, E., and Rossiter, D.: SoilGrids 2.0: producing soil information for the globe with quantified spatial uncertainty, SOIL, 7, 217–240, https://doi.org/10.5194/soil-7-217-2021, 2021.
Quesada, C. A., Lloyd, J., Schwarz, M., Patiño, S., Baker, T. R., Czimczik, C., Fyllas, N. M., Martinelli, L., Nardoto, G. B., Schmerler, J., Santos, A. J. B., Hodnett, M. G., Herrera, R., Luizão, F. J., Arneth, A., Lloyd, G., Dezzeo, N., Hilke, I., Kuhlmann, I., Raessler, M., Brand, W. A., Geilmann, H., Moraes Filho, J. O., Carvalho, F. P., Araujo Filho, R. N., Chaves, J. E., Cruz Junior, O. F., Pimentel, T. P., and Paiva, R.: Variations in chemical and physical properties of Amazon forest soils in relation to their genesis, Biogeosciences, 7, 1515–1541, https://doi.org/10.5194/bg-7-1515-2010, 2010.
Quesada, C. A., Lloyd, J., Anderson, L. O., Fyllas, N. M., Schwarz, M., and Czimczik, C. I.: Soils of Amazonia with particular reference to the RAINFOR sites, Biogeosciences, 8, 1415–1440, https://doi.org/10.5194/bg-8-1415-2011, 2011.
Quesada, C. A., Paz, C., Oblitas Mendoza, E., Phillips, O. L., Saiz, G., and Lloyd, J.: Variations in soil chemical and physical properties explain basin-wide Amazon forest soil carbon concentrations, SOIL, 6, 53–88, https://doi.org/10.5194/soil-6-53-2020, 2020.
RAINFOR: Amazon Forest Inventory Network – Manuals, http://rainfor.org/en/manuals/in-the-field, last access: 7 April 2022.
RAISG: Amazon Network of Georeferenced Socio-Environmental Information, https://www.raisg.org/en/about/, last access: 20 October 2023.
Reed, S. C., Cleveland, C. C., and Townsend, A. R.: Relationships among Phosphorus, Molybdenum and Free-Living Nitrogen Fixation in Tropical Rain Forests: Results from Observational and Experimental Analyses, Biogeochemistry, 114, 135–147, https://doi.org/10.1007/s10533-013-9835-3, 2013.
Reichert, T., Rammig, A., Fuchslueger, L., Lugli, L. F., Quesada, C. A., and Fleischer, K.: Plant Phosphorus-Use and -Acquisition Strategies in Amazonia, New Phytol., 234, 1126–1143, https://doi.org/10.1111/nph.17985, 2022.
Saatchi, S. S.: Lba-Eco Lc-15 Srtm30 Digital Elevation Model Data, Amazon Basin: 2000, ORNL DAAC [data set], https://doi.org/10.3334/ORNLDAAC/1181, 2013.
Schubert, S., Steffens, D., and Ashraf, I.: Is Occluded Phosphate Plant-Available?, J. Plant Nutr. Soil Sc., 183, 338–344, https://doi.org/10.1002/jpln.201900402, 2020.
Simon, S. M., Glaum, P., and Valdovinos, F. S.: Interpreting Random Forest Analysis of Ecological Models to Move from Prediction to Explanation, Sci. Rep., 13, 3881, https://doi.org/10.1038/s41598-023-30313-8, 2023.
Smeck, N. E.: Phosphorus Dynamics in Soils and Landscapes, Geoderma, 36, 185–199, https://doi.org/10.1016/0016-7061(85)90001-1, 1985.
Stone, M.: Cross-Validatory Choice and Assessment of Statistical Predictions, J. Roy. Stat. Soc. B Met., 36, 111–133, https://doi.org/10.1111/j.2517-6161.1974.tb00994.x, 1974.
Val, P., Figueiredo, J., Melo, G., Flantua, S. G. A., Quesada, C. A., Fan, Y., Albert, J. S., Guayasamin, J. M., and Hoorn, C.: Geological History and Geodiversity of the Amazon, in: Amazon Assessment Report 2021, edited by: Nobre, C., Encalada, A., Anderson, E., Roca, A. F. H., Bustamante, M., Mena, C., Peña-Claros, M., Poveda, G., Rodriguez, J. P., Saleska, S., Trumbore, S., Val, A. L., Villa, N. L., Abramovay, R., Alencar, A., Rodríguez, A. C., Armenteras, D., Artaxo, P., Athayde, S., Barretto Filho, H. T., Barlow, J., Berenguer, E., Bortolotto, F., Costa, F. A., Costa, M. H., Cuvi, N., Fearnside, P. M., Ferreira, J., Flores, B. M., Frieri, S., Gatti, L. V., Guayasamin, J. M., Hecht, S., Hirota, M., Hoorn, C., Josse, C., Lapola, D. M., Larrea, C., Larrea-Alcazar, D. M., Lehm, A. Z., Malhi, Y., Marengo, J. A., Melack, J., Moraes, R. M., Moutinho, P., Murmis, M. R., Neves, E. G., Paez, B., Painter, L., Ramos, A., Rosero-Peña, M. C., Schmink, M., Sist, P., ter Steege, H., van der Voort, H., Varese, M., and Zapata-Ríos, G.: United Nations Sustainable Development Solutions Network, New York, USA, https://doi.org/10.55161/POFE6241, 2021.
Van Langenhove, L., Depaepe, T., Verryckt, L. T., Vallicrosa, H., Fuchslueger, L., Lugli, L. F., Bréchet, L., Ogaya, R., Llusia, J., Urbina, I., Gargallo-Garriga, A., Grau, O., Richter, A., Penuelas, J., Van Der Straeten, D., and Janssens, I. A.: Impact of Nutrient Additions on Free-Living Nitrogen Fixation in Litter and Soil of Two French-Guianese Lowland Tropical Forests, J. Geophys. Res.-Biogeo., 126, e2020JG006023, https://doi.org/10.1029/2020jg006023, 2021.
Vitousek, P. M., Porder, S., Houlton, B. Z., and Chadwick, O. A.: Terrestrial Phosphorus Limitation: Mechanisms, Implications, and Nitrogen-Phosphorus Interactions, Ecol. Appl., 20, 5–15, https://doi.org/10.1890/08-0127.1, 2010.
Walker, T. W. and Syers, J. K.: Fate of Phosphorus During Pedogenesis, Geoderma, 15, 1–19, https://doi.org/10.1016/0016-7061(76)90066-5, 1976.
Wang, Y. P., Law, R. M., and Pak, B.: A global model of carbon, nitrogen and phosphorus cycles for the terrestrial biosphere, Biogeosciences, 7, 2261–2282, https://doi.org/10.5194/bg-7-2261-2010, 2010.
Wilcke, W., Velescu, A., Leimer, S., Bigalke, M., Boy, J., and Valarezo, C.: Temporal Trends of Phosphorus Cycling in a Tropical Montane Forest in Ecuador During 14 years, J. Geophys. Res.-Biogeo., 124, 1370–1386, https://doi.org/10.1029/2018jg004942, 2019.
Wittmann, H., von Blanckenburg, F., Maurice, L., Guyot, J. L., Filizola, N., and Kubik, P. W.: Sediment Production and Delivery in the Amazon River Basin Quantified by in Situ-Produced Cosmogenic Nuclides and Recent River Loads, Geol. Soc. Am. Bull., 123, 934–950, https://doi.org/10.1130/B30317.1, 2011.
Wollast, R., Mackenzie, F. T., and Chou, L.: Interactions of C, N, P and S Biogeochemical Cycles and Global Change, Nato Asi Series. Series I: Global Environmental Change, Springer, Berlin, Heidelberg, 521 pp., https://doi.org/10.1007/978-3-642-76064-8, 1993.
Wong, M. Y., Neill, C., Marino, R., Silvério, D. V., Brando, P. M., and Howarth, R. W.: Biological Nitrogen Fixation Does Not Replace Nitrogen Losses after Forest Fires in the Southeastern Amazon, Ecosystems, 23, 1037–1055, https://doi.org/10.1007/s10021-019-00453-y, 2020.
Yang, X. and Post, W. M.: Phosphorus transformations as a function of pedogenesis: A synthesis of soil phosphorus data using Hedley fractionation method, Biogeosciences, 8, 2907–2916, https://doi.org/10.5194/bg-8-2907-2011, 2011.
Yang, X., Post, W. M., Thornton, P. E., and Jain, A.: The distribution of soil phosphorus for global biogeochemical modeling, Biogeosciences, 10, 2525–2537, https://doi.org/10.5194/bg-10-2525-2013, 2013.
Yang, X., Post, W. M., Thornton, P. E., and Jain, A. K.: Global Gridded Soil Phosphorus Distribution Maps at 0.5-Degree Resolution, ORNL DAAC [data set], https://doi.org/10.3334/ORNLDAAC/1223, 2014.
Zhang, L. M., Silvano, E., Rihtman, B., Aguilo-Ferretjans, M., Han, B., Shi, W., and Chen, Y.: Biochemical Mechanism of Phosphorus Limitation Impairing Nitrogen Fixation in Diazotrophic Bacterium Klebsiella Variicola, Journal of Sustainable Agriculture and Environment, 1, 108–117, https://doi.org/10.1002/sae2.12024, 2022.