the Creative Commons Attribution 4.0 License.
the Creative Commons Attribution 4.0 License.
3D-GloBFP: the first global three-dimensional building footprint dataset
Yangzi Che
Xuecao Li
Xiaoping Liu
Yuhao Wang
Weilin Liao
Xianwei Zheng
Xucai Zhang
Xiaocong Xu
Qian Shi
Jiajun Zhu
Honghui Zhang
Hua Yuan
Yongjiu Dai
Understanding urban vertical structures, particularly building heights, is essential for examining the intricate interaction between humans and their environment. Such datasets are indispensable for a variety of applications, including climate modeling, energy consumption analysis, and socioeconomic activities. Despite the importance of this information, previous studies have primarily focused on estimating building heights regionally at the grid scale, often resulting in datasets with limited coverage or spatial resolution. This limitation hampers comprehensive global analysis and the ability to generate actionable insights at finer scales. In this study, we developed a global building height map at the building footprint scale by leveraging Earth Observation (EO) datasets and advanced machine learning techniques. Our approach integrated multisource remote-sensing features and building morphology features to develop height estimation models using the extreme gradient boosting (XGBoost) regression method across diverse global regions. This methodology allowed us to estimate the heights of individual buildings worldwide, culminating in the creation of the three-dimensional (3D) Global Building Footprints (3D-GloBFP) dataset for the year 2020. Our evaluation results show that the height estimation models perform exceptionally well at a global scale, with R2 values ranging from 0.66 to 0.96 and root-mean-square errors (RMSEs) ranging from 1.9 to 14.6 m across 33 subregions. Comparisons with other datasets demonstrate that 3D-GloBFP closely matches the distribution and spatial pattern of reference heights. Our derived 3D global building footprint map shows a distinct spatial pattern of building heights across regions, countries, and cities, with building heights gradually decreasing from the city center to the surrounding rural areas. Furthermore, our findings indicate disparities in built-up infrastructure (i.e., building volume) across different countries and cities. China is the country with the most intensive total built-up infrastructure (5.28×10¹¹ m3, accounting for 23.9 % of the global total), followed by the USA (3.90×10¹¹ m3, accounting for 17.6 % of the global total). Shanghai has the largest volume of built-up infrastructure (2.1×10¹⁰ m3) of all representative cities. The derived building-footprint-scale height map (3D-GloBFP) reveals the significant heterogeneity in urban built-up environments, providing valuable insights for studies on urban socioeconomic dynamics and climatology. The 3D-GloBFP dataset is available at https://doi.org/10.5281/zenodo.11319912 (Building height of the Americas, Africa, and Oceania in 3D-GloBFP; Che et al., 2024c), https://doi.org/10.5281/zenodo.11397014 (Building height of Asia in 3D-GloBFP; Che et al., 2024a), and https://doi.org/10.5281/zenodo.11391076 (Building height of Europe in 3D-GloBFP; Che et al., 2024b).
- Article
(13568 KB) - Full-text XML
-
Supplement
(795 KB) - BibTeX
- EndNote
Quantifying the three-dimensional (3D) building structure is essential for understanding human–natural ecosystems and achieving sustainability goals. The World Cities Report 2022 reveals that urban areas already accommodate 55 % of the global population, and this figure is expected to grow to 68 % by 2050 (United Nations Human Settlements Programme, 2022). Against the backdrop of advancing global urbanization, burgeoning populations pose challenges and opportunities with respect to land-use efficiency, making vertical urban growth a critical land-use pattern (Chen et al., 2024, 2020). Various urban functions have also given rise to distinct 3D spatial forms within cities (Demuzere et al., 2022). Specifically, commercial central areas show a dense concentration of high-rise buildings, residential zones are characterized by rows of relatively tall buildings, and urban villages are distinguished by dense clusters of low-rise structures (W. Chen et al., 2023). In this context, the accurate 3D mapping of urban areas is a crucial objective for achieving sustainable and resilient cities. Building height, as the vertical structure of buildings, can depict the urban vertical morphology, which reflects the biophysical and social–economical properties of the cities and supports a variety of urban studies, including climate mitigation, carbon emission, living conditions, and socioeconomic modeling (Pappaccogli et al., 2020; Xu et al., 2021; Shao et al., 2023; Shang et al., 2020). For instance, accurate measurement of building heights is essential for determining the urban underlying surface, serving as critical urban parameters in urban climate models to simulate and understand the climate conditions within urban areas (Sun et al., 2021). Simultaneously, 3D building datasets help assess built-up infrastructure spaces and further contribute to the 2023 Sustainable Development Goals (SDGs) aim of providing adequate, safe, and affordable housing for all (Liu et al., 2024). Moreover, building heights provide demographic insights and help delineate functional zones within cities, thereby enhancing the estimation of energy use and carbon emissions (Ding et al., 2022).
While Earth Observation (EO) data have generally been used in 3D building mapping, the estimation of building height is still limited with respect to either spatial resolution or coverage. High-resolution optical images, synthetic aperture radar (SAR), and airborne light detection and ranging (lidar) products are the commonly used datasets for extracting building height information in the urban domain. High-resolution optical satellite images can provide texture and shadow details within urban areas, which can be applied to building height estimation (Cao and Huang, 2021; Liasis and Stavrou, 2016; P. Chen et al., 2023). However, their accuracy is limited by the quality of images, and their effectiveness is reduced in densely built areas (e.g., central business districts – CBDs) where building shadows are overlaid with other objects (Cai et al., 2023). Alternatively, SAR images can reflect the scattering mechanism of buildings through the backscatter coefficients, which are related to building structure (Koppel et al., 2017). A variety of studies have been carried out using SAR data for built-up height estimation. X. Li et al. (2020b) and Zhou et al. (2022) developed an approach to estimate building height using the dual-polarization information (i.e., vertical–vertical, VV, and vertical–horizontal, VH) from the Sentinel-1 dataset, although the reliability of height estimation at the fine scale (i.e., less than 500 m) is constrained due to the “bounce scattering” effect (X. Li et al., 2020b). Instead, lidar is regarded as the most reliable data source for obtaining building height, as it can directly capture the rooftop coordinates from the returned signal (M. Li et al., 2020; Park and Guldmann, 2019). However, the lidar dataset is scarce and scattered, making it difficult to apply over larger areas (Ma et al., 2023).
Although multisource datasets offer broader coverage of building height estimation, fine-scale (i.e., building-scale) building height datasets are still absent globally resolution, disregarding the spatially explicit heterogeneity of building forms. Current researchers have proposed methods based on digital surface models (DSM) and statistical modeling to estimate building heights, enhancing the coverage of height estimation. Firstly, widely available digital elevation models (DEMs; i.e., ALOS DSM and TanDEM-X) provide information for height estimation. Esch et al. (2022) acquired global building heights at a 90 m resolution by computing the difference between the local maximum and minimum within built-up areas using the SAR-derived TanDEM-X. However, uncertainties may arise in rugged regions (Huang et al., 2022). Additionally, Huang et al. (2022) used slope correction to mitigate slope effects and derive building height in China. However, the 30 m dataset is also affected by a mixed-object problem (i.e., one pixel contains both building and surrounding terrain), which smooths the height edge and consequently increases the inaccuracy of building height estimations (Esch et al., 2022). Secondly, the statistical modeling method can obtain continuous building height estimation at the regional (i.e., national or urban agglomeration) scale by training machine learning models with multiple explanatory features. Frantz et al. (2021) and Wu et al. (2023) integrated Sentinel-1 and Sentinel-2 datasets and extracted the building height based on a machine learning method, confirming the effectiveness of fusing SAR and optical datasets. Arehart et al. (2021) combined various physical morphological features of buildings (e.g., area, compactness, and radius) to derive building heights in the USA, providing evidence of the correlation between morphological features and height. Li et al. (2022) generated a global-scale building height map at a 1 km resolution by utilizing optical, SAR, and auxiliary geospatial data (e.g., gross domestic product and road networks) based on a random forest model. Moreover, Ma et al. (2023) fused height metrics from the Global Ecosystem Dynamics Investigation (GEDI) mission and other explanatory features to obtain the building height in the Yangtze River Delta region at a 150 m resolution. Nevertheless, due to the complexity of urban functions and diverse landscapes, buildings in close spatially proximity may vary significantly with respect to height. As a result, grid-resolution height data (e.g., 1 km) may be insufficient to accurately describe the 3D spatial structure of buildings, leading to a loss of spatial information (L. Li et al., 2024). Moreover, raster datasets tend to blur building boundaries when representing the building shapes, lacking the precision of vector footprints in representing the 3D morphologies of buildings. Notably, there is currently no global dataset that reflects the height of building footprints.
To fill these gaps, we developed the first global dataset at the individual building scale (3D-GloBFP) using open-access multisource datasets based on machine learning methods. The 3D-GloBFP dataset delineates the 3D morphology of each building worldwide, capturing the 3D spatial patterns of buildings in cities of various scales across the world. The specific objectives of this study include the following: (1) integrate and preprocess the multisource remote-sensing datasets and morphology features of building vectors; (2) develop the height estimation model in different subregions; (3) produce a global building-scale height map for 2020, and (4) analyze the built-up infrastructure in global countries and cities. The remainder of this paper describes the adopted datasets (Sect. 2) and the estimation methods (Sect. 3), outlines the results and discussion (Sect. 4), provides the data availability information (Sect. 5), and presents conclusions (Sect. 6).
2.1 Building footprint datasets
We derived the global building footprints using data from Microsoft Building Footprints (Microsoft, 2018) and building boundaries from Shi et al. (2024). The Microsoft Building Footprints dataset provided 1.3 billion global building footprints for the period around the year 2020. This dataset was derived from high-resolution satellite imageries using deep neural networks (DNNs) and polygonization approaches. The derived building footprints in the Microsoft dataset are highly consistent with the boundaries of individual buildings, with an average precision and intersection over union (IoU) of around 95 % and 65 %, respectively. Given that some regions in East Asia (e.g., China, North Korea, and South Korea) were not included in Microsoft Building Footprints, we used building footprints generated by Shi et al. (2024) as an alternative. Shi et al. (2024) extracted these building footprints based on high-resolution imageries using deep learning approaches with stable accuracy in different cities (i.e., the precision and recall in cities exceed 80 %). These two open-source datasets provided a comprehensive global building boundary dataset of sufficient quality to support our research.
2.2 Building height datasets
We collected building footprint data with height information from ONEGEO Map (https://onegeo.co/data/, last access: October 2023), Microsoft Building Footprints (Microsoft, 2018), Baidu Maps (https://map.baidu.com/, last access: May 2019), and EMU Analytics (https://www.emu-analytics.com/, last access: June 2021) to ensure maximum reference building height coverage across all regions globally. ONEGEO Map integrates data from over 40 sources, including OpenStreetMap, the United States Geological Survey (USGS), and Google Open Buildings, offering comprehensive building height records for various regions worldwide. To obtain a more thorough and densely covered reference building height dataset, we supplemented it with the Microsoft dataset in the USA and the Baidu Maps dataset in China. The Microsoft Building Heights information, released in 2018, provides the height of buildings in 44 states, where only a small fraction containing height attributes is located in the city center (i.e., only 2 % of buildings have height records in the state of New York). In addition, the Baidu Maps height dataset provides the height information in individual vector form in the core built-up areas in cities. This height dataset widely covers cities in China (i.e., metropolitan areas, all of the capital provinces, big cities, and some small cities), which helps to ensure the robustness of the model with respect to predicting building heights across the country. For example, the Baidu Maps dataset provides building heights for 603 007 buildings in Beijing, 443 436 buildings in Foshan, and 23 980 buildings in Ganzhou. These data are consistent with the actual building height, with an accuracy of 86.78 % and a mean deviation of approximately 1.02 m, as reported by Liu et al. (2021). We also used the Building Heights dataset from EMU Analytics in England. The EMU Analytics height dataset includes nearly 12 million building footprints, with the building height calculated from 1 m resolution lidar images. Overall, our combined reference height dataset covers most regions worldwide, providing a comparatively reliable training and testing dataset for estimating building heights in various cities and regions globally (Fig. S1 in the Supplement).
2.3 Multisource remote-sensing datasets
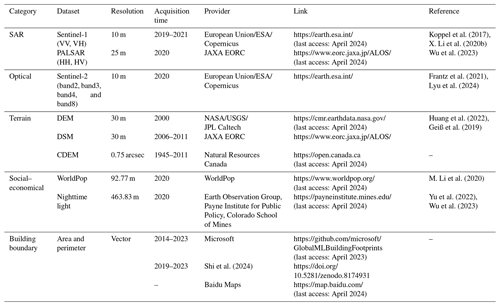
We integrated SAR images, optical images, terrain images, and images reflecting population and socioeconomic activities to estimate building height, benefiting from the wealth of easily accessible imagery provided by Google Earth Engine (GEE; Table 1). To obtain the heights of buildings in 2020, we primarily used the multisource datasets from 2020, supplemented by imagery from adjacent years, to achieve seamless global coverage. The Sentinel-1 mission consists of two polar-orbiting satellites performing C-band SAR imaging, allowing them to acquire images in all weather conditions. We collected the Ground Range Detected (GRD) type high-resolution (10 m) images with dual polarization (i.e., VV and VH) in the Sentinel-1 datasets, as the backscatter coefficients in GRD images are sensitive to surface roughness and can reflect the buildings' structure. We also used variables from optical images (i.e., Sentinel-2) as input for our height estimation model. The Copernicus Sentinel-2 mission includes a constellation of two polar-orbiting satellites, supporting the monitoring of the Earth's surface conditions. We used Band 2 (blue), Band 3 (green), Band 4 (red), and Band 8 (near-infrared) Sentinel-2 data in our model at a 10 m resolution. The radiation of visible bands is correlated with the extent of impervious surfaces and the internal environment within urban domains (Yuan and Bauer, 2007). The near-infrared band can effectively provide information on building heights by reflecting the thermal radiation capability of the surface material. Furthermore, we collected terrain datasets (i.e., the DEM from the Shuttle Radar Topography Mission, SRTM, at a 30 m resolution and the DSM from the Advanced Land Observing Satellite, ALOS, at a 30 m resolution) to represent the physical properties of urban domains. DSM data provide vertical information about surface objects, which is helpful for extracting building heights. Primarily, the difference between DSM and DEM (nDSM) directly reflects the vertical height of surface objects. In addition, we used other datasets to provide auxiliary information on building heights, including the Phased Array type L-band Synthetic Aperture Radar (PALSAR), WorldPop, and the Visible Infrared Imaging Radiometer Suite (VIIRS) Day/Night dataset.
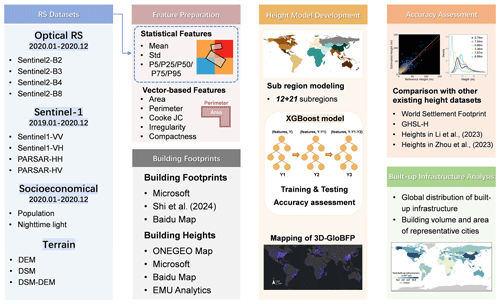
In this study, we estimated the height of individual buildings at a global scale based on multisource remote-sensing datasets and vector-derived datasets (Fig. 1). First, we built a feature collection by integrating the statistical values of remote-sensing datasets and the morphological features of buildings. Second, we developed height models in the 33 subregions based on the extreme gradient boosting (XGBoost) method and assessed the model performance using 10-fold cross-validation. Third, we created a global building height map based on our estimated results. We analyzed the spatial patterns of building heights within cities and compared our building height dataset with other existing global and regional building height products. Finally, we analyzed the built-up infrastructure for countries and representative cities worldwide.
3.1 Feature preparation
We extracted features from multisource datasets (i.e., radar, optical, terrain, social–economic, and vector) as input features for the models, with the help of the GEE platform. First, we preprocessed the input remote-sensing images to ensure high-quality images. We removed pixels with a cloud percentage greater than 20 % to obtain high-quality images and avoided the stripe effect caused by clouds. All images were reprojected to WGS84 and resampled to 10 m. Second, we aggregated remote-sensing images in 2020 to vectors to get statistical information for individual buildings. Datasets from 2019 and 2021 were utilized for supplementation in areas where imagery was missing. We calculated the statistical values (i.e., mean value; standard deviation; and five quantiles, 5 %, 25 %, 50 %, 75 %, and 95 %) of all of the image pixels within each building vector. We created fishnets of different extents with no more than 40 000 buildings in each grid due to calculation memory limitations on GEE. We exported the remote-sensing image attributes for all buildings. Third, we calculated morphology features based on building vectors, which proved effective in height estimation (Arehart et al., 2021). We used five geometry features ranging from simple (i.e., perimeter and area) to complex (i.e., compactness, fractality, and the Cooke JC index) as the input variables of the height estimation model. Compactness, fractality, and the Cooke JC index were identified by building perimeter and area, measuring the complexity of the footprint of buildings (Table 2). Finally, 114 features were calculated as the input features for the height estimation model (Table S1 in the Supplement).
3.2 Height model development
3.2.1 Division of subregions
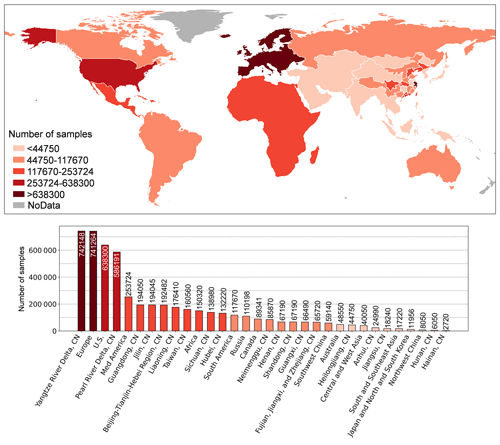
We divided the globe into 33 regions and developed the building height estimation model for each region, considering the nonuniform spatial distribution of samples and the heterogeneous building heights (Fig. 2). Firstly, we divided the globe into 13 regions based on geographic spatial distance and regional development levels to ensure that each region has enough samples to train effective models. For instance, the Central and West Asian countries were considered to be a single region for model training and estimation with 40 040 training samples. However, given China's complex urban 3D structure and significant building heterogeneity (Wu et al., 2023), we further divided China into 21 regions. We built a separate height regression model for each region to ensure the effectiveness of the height estimation. For instance, considering the inadequacy of samples in Northwestern China, we considered the provinces in the northwest as a single region with 8050 training samples for model training. Additionally, we considered the Beijing–Tianjin–Hebei, Yangtze River Delta, and Pearl River Delta urban agglomerations as three separate regions due to the comparable economic levels and population size.
3.2.2 Model development
We used a stratified sampling strategy to select training samples and built the height estimation model with the extreme gradient boosting (XGBoost) regression method. First, we used a stratified sampling strategy to integrate the samples in each subregion. We merged all collected building height samples from each region. In each subregion, we adjusted the number of training samples in each interval according to the height distribution found in Esch et al. (2022), to ensure that the height distribution of the sample set resembles that of each region. Then, we used the XGBoost regression model to train models in the subregions. XGBoost is suitable for the height estimation task due to its capability to handle complex nonlinear relationships and large-scale datasets. The number of training and testing samples was divided using a 9:1 ratio. We used the GridSearchCV method to find the parameters (i.e., learning rate, number of estimators, max depth of trees, and lambda and alpha in the objective function). This method iterates through different parameter combinations and evaluates their performance using cross-validation to determine the optimal model parameters. We finally built 33 XGBoost models in all subregions with different parameters.
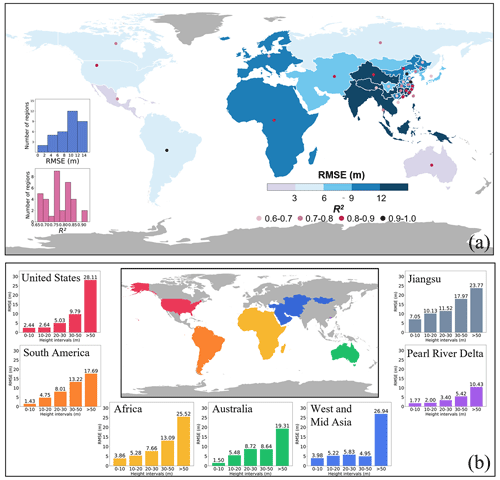
Figure 3Model performance in subregions: (a) R2 and RMSE values of models in the subregions; (b) RMSE values of representative subregions within different height intervals.
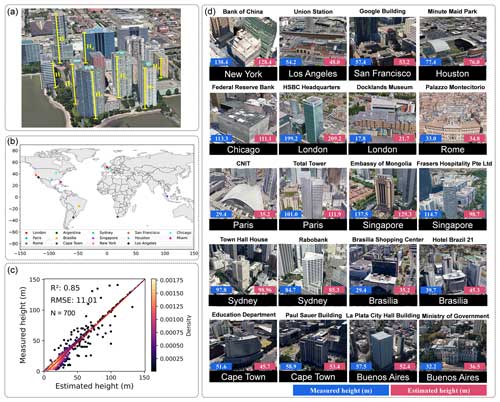
Figure 4Comparison of estimated and interpreted heights using 3D Google Earth Street View images: (a) diagram of the measurement method in Google Earth Pro; (b) distribution of the cities with measured building heights; (c) overall performance of the estimated heights worldwide; (d) the measured and estimated height of individual buildings within cities. Images in panels (a) and (d) are from © Google.
3.3 Accuracy assessment
To evaluate the height estimation models, we carried out the assessments outlined in the following. First, we calculated the R2 and RMSE values in each subregion. We used 10-fold cross-validation to assess the accuracy of the model in each region, with evaluation metrics including the R2 and RMSE of ordinary least squares (OLS) regression. The R2 value evaluates the explanatory ability of variables for the dependent variable (i.e., building height), while the RMSE is used to assess the difference between estimated and reference values. Second, we compared our estimated heights with 700 manually measured building heights in 14 cities from Google Earth Street View. We calculated the R2 and RMSE values between estimated and measured results. Third, we evaluated the accuracy of 3D-GloBFP and four other global datasets, using reference data collected from GIS portals of 17 cities worldwide (Table S2 in the Supplement). The four global height datasets include the World Settlement Footprint (WSF; Esch et al., 2022), the Global Human Settlement Layer building height (GHSL-H; Pesaresi et al., 2021), the height data from Li et al. (2022), and the height data from Zhou et al. (2022) (Table S3 in the Supplement). We compared the spatial distribution of building height within cities. We also aggregated the high-resolution data at a 1 km resolution to align with the low-resolution data by calculating the average height of all buildings located within each grid cell. This approach allows us to compare the differences with the reference data at a consistent resolution across all datasets. Finally, we compared the segments of 3D-GloBFP for the USA, China, and Europe with existing regional datasets (Table S3), given the comparatively more affluent data availability within these three regions. In the USA, we compared our estimated results with two other vector-level datasets from Arehart et al. (2021) and Microsoft (2020), which cover the entire country and have the same scale (i.e., building scale) as our datasets. The reference building heights in the USA were collected from six city government GIS portals as the reference height, including Boston, Louisville, New York, Boulder, Newport News, and Portland. These reference heights are independent datasets that were not used for training. In China, we validated the numerical distribution, coefficients, and spatial patterns of 3D-GloBFP against datasets from Chinese building height (CNBH) data (Wu et al., 2023) and height data from Huang et al. (2022), both of which provide coverage for the entire country. We randomly extracted 20 000 buildings from Baidu Maps (https://ditu.baidu.com, last access: May 2019) within global urban boundaries (GUBs) (X. Li et al., 2020a) as the reference heights (Fig. S2 in the Supplement) that were not used to train the height estimation model. Additionally, in Europe, we contrasted the numerical distribution of building heights from our estimated data with those from WSF, height data from Li et al. (2022), GHSL-H data, and reference data. We aggregated the Urban Atlas Building Height for Europe (https://land.copernicus.eu/en/products/urban-atlas/building-height-2012, last access: June 2021) to a 1 km resolution as the reference height, providing building heights in core urban areas in 870 cities across Europe.
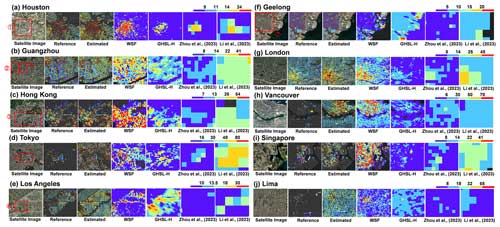
Figure 5Comparison of 3D-GloBFP maps with multiscale building height products in 10 cities across the world: (a) Houston, (b) Guangzhou, (c) Hong Kong, (d) Tokyo, (e) Los Angeles, (f) Geelong, (g) London, (h) Vancouver, (i) Singapore, and (j) Lima. The areas shown using red boxes represent (1) downtown Houston; (2) the CBD of Yuexiu District; (3) Kowloon in Hong Kong; (4) an urban village in Guangzhou; (5) the city center of Tokyo; (6) south of Santa Monica Boulevard, West Hollywood; and (7) northwestern Geelong, respectively. The satellite images are from © Esri, © Maxar, © Earthstar Geographics, and the GIS user community.
3.4 Built-up infrastructure analysis
We analyzed the built-up infrastructure by calculating the total building volume in countries and cities. First, we summed the building volume for each country and created a global distribution map of built-up infrastructure across the world. To quantify each country's contribution to the global built-up infrastructure, we calculated the proportion of each country's total building volume relative to the global total. Next, we focused on the built-up infrastructure in representative cities across various continents worldwide. We analyzed both 3D (i.e., building volume) and 2D (i.e., building area) built-up infrastructure to provide a detailed comparison. Specifically, we compared the total numbers and rankings of 3D and 2D built-up infrastructure across these cities. The boundaries of countries and cities were derived from GADM maps (https://gadm.org/, last access: May 2024). This analysis allowed us to gain a deeper understanding of the spatial distribution characteristics and total volume features of built-up infrastructure in the world.
4.1 Performance of the building height estimation model
The estimated building height showed consistency with the reference building height across all regions of the world (Fig. 3). Across different areas, the R2 value between the estimated and reference building height ranges from 0.66 (i.e., Europe) to 0.96 (South America). The R2 value of around 40 % of regions exceeded 0.80, indicating a similarity between the estimated and reference height. The RMSEs vary significantly across different areas, ranging from 1.92 m (i.e., South America) to 14.60 m (Japan and North and South Korea). A total of 62 % of the RMSEs are less than 10 m, indicating that, in most of the regions, our estimated heights are in agreement with reference heights at the building scale. The estimated heights in five areas are very close to the reference height, with RMSEs of less than 5 m, including the USA (3.35 m), Russia (4.99 m), Central America (2.40 m), Australia (2.23 m), and South America (1.92 m). Additionally, low-rise buildings show less uncertainty compared with high-rise buildings. The RMSEs of low-rise buildings (height<20 m) are generally below 6 m, especially in Western countries such as the USA (2.44 m in the 0–10 m interval and 2.64 m in the 10–20 m interval) and South America (1.43 m in the 0–10 m interval and 4.75 m in the 10–20 m interval). On the contrary, high-rise buildings (height≥20 m) have more significant uncertainties in the estimation results. The coarse resolution of certain remote-sensing datasets (e.g., DSM and Nighttime light) makes it challenging to capture the heterogeneity of the features of super tall buildings, especially in densely built urban cores. Moreover, the height and material of high-rise buildings, as well as the side-looking scene illumination of the Sentinel sensor, can cause complex multipath effects that further impact the accuracy of height estimations (Frantz et al., 2021; Stilla et al., 2003). It is worth noting that the uncertainty in high-rise buildings contributes significantly to the regional RMSE. For instance, in Africa, the overall RMSE is 9.87 m, with high-rise buildings (i.e., ≥50 m) showing an RMSE of 25.52 m, while buildings below 10 m and in the 10–20 m interval have RMSEs of 3.86 and 5.28 m, respectively.
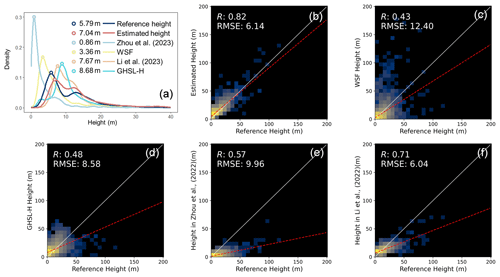
Figure 6Comparison of reference height, 3D-GloBFP, and other existing global products: (a) histogram of reference height, estimated height, and four other existing height products; (b) scatter plot of estimated heights and reference heights; (c) scatter plot of WSF (Esch et al., 2022) and reference heights; (d) scatter plot of GHSL-H (Pesaresi et al., 2021) and reference heights; (e) scatter plot of height data from Zhou et al. (2022) and reference heights; (f) scatter plot of height data from Li et al. (2022) and reference heights. Note that the dashed red lines represent the regression lines fitting the reference heights against the estimated heights for each dataset, whereas the solid white line represents the 1:1 line.
4.2 Comparison with Google Earth building heights
The validation results with interpreted heights from Google Earth Street View images indicated that the estimated results are consistent with the reference heights in the metropolitan cities of countries around the world, particularly for landmark buildings. We manually measured 700 buildings in 14 metropolitan cities across the Northern and Southern Hemisphere regions (e.g., New York, London, Brasilia, and Cape Town) (Fig. 4a and b) and compared these measurements with our estimated heights. The correlation results suggest that our estimated heights show relatively high agreement with measured heights, with an R2 of 0.85 and RMSE of 11.01 m (Fig. 4c). The example landmark buildings (see Fig. 4) further confirm the effectiveness of estimating individual building heights, especially for high-rise buildings with more considerable uncertainty, as mentioned in Sect. 4.1 (Fig. 4d). For instance, for the Federal Reserve Bank of Chicago, with a height of 113.3 m, the difference between estimated and measured height is only 2.2 m.
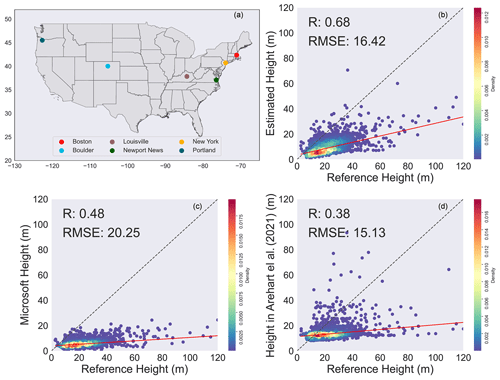
Figure 8Building-scale comparison to Microsoft height data (Microsoft, 2020) and height data from Arehart et al. (2021) for the USA: (a) distribution of cities with a reference building height; (b) scatter plot of estimated heights and reference heights; (c) scatter plot of Microsoft heights (Microsoft, 2020) and reference heights; (d) scatter plot of height from Arehart et al. (2021) and reference heights.
4.3 Comparison with existing building height products
4.3.1 Comparison with global height products
Our estimated building heights provide more detail on urban morphology and show more accurate results compared with the other four existing global datasets (Fig. 5), including WSF (at a 90 m spatial resolution), the Global Human Settlement Layer height (GHSL-H; Pesaresi et al., 2021) (at a 100 m spatial resolution), height data from Zhou et al. (2022) (at a 500 m spatial resolution), and height data from Li et al. (2022) (at a 1 km spatial resolution). First, we mapped the estimated height and the other four datasets and compared them to the ONEGEO Map reference height to evaluate the spatial pattern of building heights. Our estimated building height results show similar spatial patterns to the reference building heights in representative cities around the world. Specifically, the estimated heights are close to the reference height data for high-rise buildings, capturing the high-density building core of the town in the CBDs of various major cities (e.g., downtown Houston, Region 1 in Fig. 5a; the CBD of Yuexiu District in Guangzhou, Region 2 in Fig. 5b; and Kowloon in Hong Kong, Region 3 in Fig. 5c). However, GHSL-H (Pesaresi et al., 2021), height data from Zhou et al. (2022), and height data from Li et al. (2022) can only reflect the vague spatial location of the city center, presenting various degrees of significant underestimations in the specific numerical values of building heights. The underestimation of high-rise buildings and skyscrapers is relatively substantial in GHSL-H (Pesaresi et al., 2021) and height data from Li et al. (2022). Zhou et al. (2022) notably underestimate urban centers, as they include nonbuilding-related impervious surfaces (e.g., streets and parking lots). Furthermore, compared to the WSF dataset, our estimated height can reflect a complex urban landscape with mixed high- and low-rise buildings. For instance, the spatial distribution of our derived dataset is closer to the reference dataset in Kowloon, Hong Kong, while the WSF (Esch et al., 2022) height dataset results in clusters of high-rise buildings. Additionally, our estimated heights are also more consistent with the reference datasets for low-rise-building areas. For low-rise buildings within urban cores, such as the urban villages in Guangzhou (Region 4 in Fig. 5b) and the low-rise structures in Tokyo's city center (Region 5 in Fig. 5d), our data can provide relatively accurate numeric estimations and spatial patterns of their heights. For low-rise buildings in the areas surrounding cities, such as south of Santa Monica Boulevard in West Hollywood, Los Angeles (Region 6 in Fig. 5e), and northwest Geelong (Region 7 in Fig. 5f), our building-scale results can reflect the morphology of these low-rise structures. However, other datasets generally show slight overestimations, especially the estimations by Li et al. (2022). For instance, building heights in northwest Geelong are below 5 m, whereas building heights are between 5 and 10 m in that area according to Li et al. (2022). Furthermore, our estimated heights accurately capture the spatial heterogeneity in the heights of high-rise and low-rise buildings in densely built-up areas. Conversely, the resolution of the other three datasets is insufficient to reflect the spatial heterogeneity of building heights due to the significant differences in building height within each pixel.
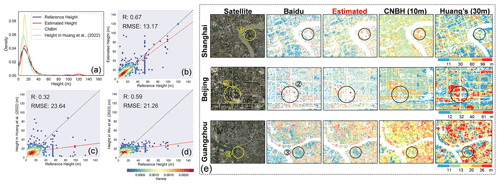
Figure 9Comparison of height data in China from Huang et al. (2022) and Wu et al. (2023): (a) distribution of test points in GUBs; (b) scatter plot of estimated heights and reference heights; (c) scatter plot of height data from Huang et al. (2022) and reference heights; (d) scatter plot of height data from Wu et al. (2023) and reference heights; (e) spatial patterns of building height in Shanghai, Beijing, and Guangzhou. Note that the areas shown in the circles represent (1) the Lujiazui Finance and Trade Zone, (2) the CBD in Chaoyang District, and (3) a community near Tongfu Middle Road. The satellite images are from © Esri, © Maxar, © Earthstar Geographics, and the GIS user community.
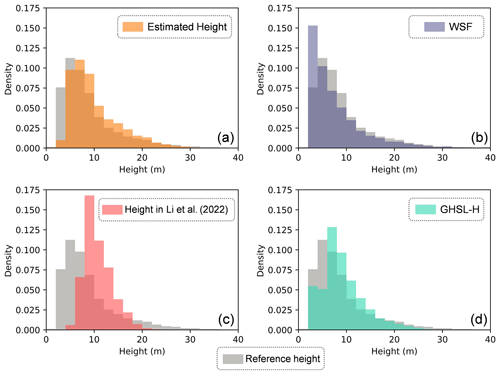
Figure 10Distribution of building height in Europe: (a) 3D-GloBFP; (b) WSF (Esch et al., 2022); (c) height data from Li et al. (2022); (d) GHSL-H (Pesaresi et al., 2021).
Additionally, the height distribution and correlation results also confirm the superiority of our derived datasets in cities across the Northern and Southern Hemisphere regions (Fig. 6). Our results showed a good agreement with the reference dataset, with a peak difference of 1.25 m. Notably, 3D-GloBFP can depict the bimodal distribution of building height. In contrast, other estimation results are mostly unimodal and have some degree of underestimation (i.e., Esch et al., 2022, and Zhou et al., 2022) or overestimation (i.e., Li et al., 2022, and Pesaresi et al., 2021) (Fig. 6a). Moreover, the correlation results indicate that our building height dataset is consistent with the reference height, with an R of 0.82 and an RMSE of 6.14 m (Fig. 6b). Our estimations are closer to the reference dataset across different height intervals. However, all of these datasets show a tendency to overestimate low-rise buildings and underestimate high-rise buildings. Specifically, the WSF (Esch et al., 2022) dataset shows a significant overestimation of low-rise buildings, particularly those under 20 m, with an R of 0.43 and RMSE of 12.40 m (Fig. 6c). GHSL-H (Pesaresi et al., 2021) and height data from Zhou et al. (2022) significantly underestimated the height of high-rise buildings (>50 m), resulting in a deviation of the fitted line from the 1:1 line (Fig. 6d and e). The height dataset in Li et al. (2022) slightly underestimates high-rise buildings, but the underestimation is more severe compared with our estimations (Fig. 6f).
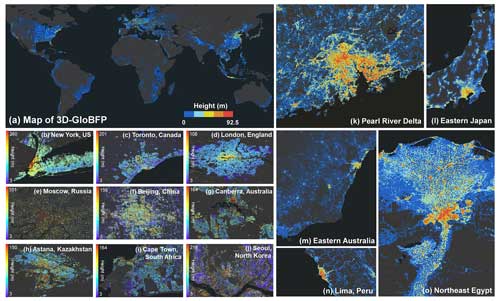
Figure 11Spatial variations in building heights for different world regions: (a) map of 3D-GloBFP; (b–j) large view of representative cities at the building scale; (k–o) large view of representative regions at a 1 km scale. Note that the color scale used in panels (k)–(o) is the same as that shown in panel (a).
4.3.2 Validation in the USA, China, and Europe
Our 3D-GloBFP results showed the most similar numerical distribution patterns to the reference heights across the USA, China, and Europe (Fig. 7). The comparison in the USA indicates that 3D-GloBFP can capture the bimodal distribution of building heights, with peaks at approximately 5 and 12 m. Furthermore, the distribution of 3D-GloBFP in China consists of reference heights, with peaks at 13.39 and 16.13 m, respectively. Moreover, the distribution pattern of 3D-GloBFP in Europe closely resembles the reference height, despite slight overestimations. Conversely, the heights in Li et al. (2022) and GHSL-H (Pesaresi et al., 2021) are generally overestimated with respect to the building heights across these three regions, while the height in WSF (Esch et al., 2022) and the results in Zhou et al. (2022) show a certain underestimation compared with the reference heights.
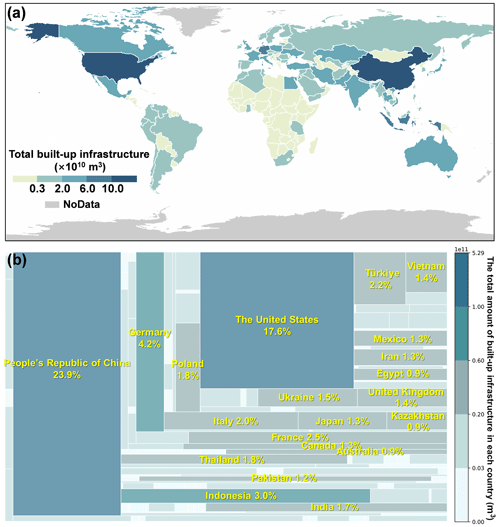
Figure 12Built-up global infrastructure: (a) total built-up infrastructure in each country; (b) proportion of built-up infrastructure in each country.

Figure 13Building volume and area in representative cities: (a) the sum of the building footprint volume; (b) the sum of the building footprint area.
In the respective regional comparisons, we first found that 3D-GloBFP outperforms other building-scale height datasets in the USA. Our derived results can better characterize the building heights than the dataset provided by Microsoft (Microsoft, 2020) and height data from Arehart et al. (2021), with an R of 0.68 and an RMSE of 16.42 m (Fig. 8b). Overall, our estimated heights tend to underestimate building heights, especially for high-rise buildings. However, the underestimation is more evident in Microsoft building heights (Microsoft, 2020) and height data from Arehart et al. (2021), with an R of 0.48 and 0.38, respectively (Fig. 8c and d). The RMSE of height data from Arehart et al. (2021) and the reference height (i.e., 15.13 m) is slightly smaller than in our derived height dataset and reference dataset. Nevertheless, the height data from Arehart et al. (2021) more significantly overestimated the height of low-rise buildings (<8 m) and underestimated the height of high-rise buildings (>40 m). It is worth noting that a higher data resolution (i.e., building scale) often reveals more detail regarding local height variations and urban landscape differences, leading to increased uncertainty.
Second, we observed that 3D-GloBFP is similar to the reference height in terms of distribution and spatial patterns in China. The distribution results demonstrate that 3D-GloBFP more accurately depicts the distribution of building height in China, showing superior consistency with the reference datasets across all height intervals (Fig. 9a). Conversely, CNBH (Wu et al., 2023) and Huang et al. (2022) demonstrate an overall underestimation of building heights, lacking precision with respect to estimating the high-rise buildings in urban centers. Likewise, our derived height dataset shows the closest height values to the reference data among the three datasets, with an R of 0.67 and an RMSE of 13.17 m (Fig. 9b). Notably, our correlation results surpass the datasets of Huang et al. (2022) and Wu et al. (2023), with an R value of 0.32 and 0.59, respectively (Fig. 9c–d). Although all of the uncertainties in the estimated high-rise buildings are relatively more considerable, the heights of Huang et al. (2022) and Wu et al. (2023) showed a more significant difference between estimated and reference heights. The spatial distribution maps further confirm the similarity between our estimated height and the reference height. Our height dataset can capture the spatial distribution and values of high-rise buildings, including landmarks such as the Lujiazui Finance and Trade Zone in Shanghai (Region 1) and the CBD in the Chaoyang District in Beijing (Region 2) (Fig. 9e). In contrast, CNBH (Wu et al., 2023) notably underestimates heights in the CBD areas. While height data from Huang et al. (2022) approximate the spatial patterns in Beijing, they significantly underestimate clustered high-rise buildings in the Lujiazui Finance and Trade Zone in Shanghai. Furthermore, our height dataset can identify the low-rise residential buildings of old urban areas (e.g., buildings near Tongfu Middle Road in Guangzhou; Region 3). Conversely, CNBH (Wu et al., 2023) overestimates the heights of low-rise buildings in old urban areas. The results in Huang et al. (2022) are similar to the reference height in old urban areas. However, the results of Huang et al. (2022) misidentified contiguous taller buildings (20–36 m) around old urban areas as high-rise buildings (>36 m), which may contribute to resolution limitations, resulting in an insufficient recognition of height heterogeneity within complex urban landscapes.
Additionally, the numerical distribution of 3D-GloBFP is more consistent with the reference height than the other three products in Europe (Fig. 10). The distribution of 3D-GloBFP closely resembled that of the reference data, with similar peak values. The reference data show the highest frequency of building heights in the range of 2.5–5 m, while the estimated data indicate the highest frequency of building heights in the range of 5–7.5 m. However, we observed an overestimation of low-rise buildings with 3D-GloBFP in Europe. Moreover, height in Li et al. (2022) and GHSL-H (Pesaresi et al., 2021) show more obvious overestimations. In contrast, WSF (Esch et al., 2022) underestimates buildings with heights larger than approximately 5 m.
4.4 Mapping of global building height
The global building height exhibited a distinct spatial pattern across regions, countries, and within cities (Fig. 11). Our global-coverage height maps indicate that low-rise buildings dominate globally, whereas high-rise buildings are dispersed. Low-rise buildings are commonly found in urban centers and on the outskirts of urban areas across countries and regions, whereas high-rise buildings are predominantly concentrated in relatively developed areas within cities. The building height map suggests a noticeable surface roughness of the built-up environment globally. For instance, in developed regions like eastern China and the eastern USA, there are more high-rise buildings. Meanwhile, in developing regions such as sub-Saharan Africa, building heights are comparatively lower. Our building-scale height maps reveal significant height heterogeneity within the cities. Specifically, high-rise buildings are generally located in the commercial areas of urban centers, with building heights gradually decreasing from the city center toward the surrounding rural areas in a radial pattern.
4.5 Global disparities in built-up infrastructure
4.5.1 Global distribution of built-up infrastructure
Our findings revealed a notably uneven distribution of built-up infrastructure across different countries globally. We calculated the total built-up infrastructure (i.e., a sum of building volume) (Fig. 12a). We determined its global proportion for each country based on 3D-GloBFP (Fig. 12b). We found that developed nations and certain rapidly emerging economies show a more significant proportion of the total volume of built-up infrastructure. In contrast, countries and regions with lower levels of economic development hold relatively lower volumes of built-up infrastructure. The built-up infrastructure in China, the USA, and several European countries significantly surpasses that of other regions, contributing the majority of the global built-up infrastructure. Specifically, China is the country with the largest total built-up infrastructure volume globally (5.28×10¹¹ m3, accounting for 23.9 % of the global total), followed by the USA (3.90×10¹¹ m3, accounting for 17.6 % of the global total). Other countries with significant infrastructure volumes include Germany (9.39×10¹⁰ m3, accounting for 4.2 % of the global total), Indonesia (6.62×10¹⁰ m3, accounting for 3.0 % of the global total), and France (5.66×10¹⁰ m3, accounting for 2.5 % of the global total). The total volume of built-up infrastructure in Africa is relatively low, accounting for a small percentage of the global total (e.g., Angola, 2.53×10⁹ m3, accounting for 0.11 % of the global total; Zimbabwe, 2.10×10⁹ m3, accounting for 0.09 % of the global total; Tanzania, 3.99×10⁹ m3, accounting for 0.18 % of the global total).
4.5.2 Comparison of building volume and area of representative cities
The building volume and area of representative cities varied significantly across different regions worldwide. The disparity in building volume across cities is pronounced (as seen in Fig. 13). For instance, Shanghai in China (2.06×10¹⁰ m3) exhibits a building volume approximately 21 times larger than that in Pyongyang in North Korea (9.85×10⁸ m3). We found that the building volume of Chinese representative cities exceeds that of representative cities elsewhere in the world due to the higher population density and larger administrative divisions in these regions. It is worth noting that, while the building area of Beijing (9.76×10⁸ m2) surpasses that in Shanghai (8.49×10⁸ m2), the building volume in Shanghai (2.1×10¹⁰ m3) is more significant than that in Beijing (1.3×10¹⁰ m3) due to the former's more efficient utilization of vertical urban space, resulting in higher average building heights of 16.7 m in Shanghai compared with 10.0 m in Beijing. In North America, the sum of building areas is similar in representative cities, but New York City has significantly larger building volumes (6.99×10⁹ m3). This disparity can be attributed to the limited and expensive land resources in New York, which promotes the city's adoption of vertical development strategies, particularly in Manhattan, where numerous high-rise buildings are concentrated. Despite having the most extensive building area (7.06×10⁹ m2) among European representative cities, London's overall volume is lower (7.06×10⁹ m3) due to its lower average height, influenced by the abundance of low-rise and historical buildings that occupy significant space within the urban landscape. In contrast, the building volume of representative cities in South America, Africa, and Australia are generally small (e.g., Brazília, Brazil, with a 2.70×10⁸ m3 building volume; Cape Town, South Africa, with a 1.48×10⁹ m3 building volume; Sydney, Australia, with a 3.3×10⁸ m3 building volume).
4.6 Limitations and future work
While this study provides valuable insights, several limitations must be acknowledged. First, the coverage is limited in certain regions, leading to tiled spatial gaps within some countries. These gaps are due to the limited coverage of Microsoft Building Footprints at the time of data creation. As more building footprint datasets become available, we will continue to update and enhance 3D-GloBFP using comprehensive, open-source data. Second, the current version of 3D-GloBFP has the potential to improve height estimation accuracy in regions with sparse height samples (i.e., suburbs in South America). Integrating additional data (i.e., ground survey data and lidar datasets) to create more representative samples can enhance the accuracy of building height estimation. Additionally, the current version of 3D-GloBFP represents building heights of a single year (i.e., 2020), as the model inputs (i.e., multisource datasets) were collected around that time. This temporal limitation restricts the dataset's ability to reflect changes over time. We are also committed to producing 3D building datasets with temporal information to capture the dynamic changes in the urban landscape.
The 3D-GloBFP dataset is available at https://doi.org/10.5281/zenodo.11319912 (Building height of the Americas, Africa, and Oceania in 3D-GloBFP) (Che et al., 2024c), https://doi.org/10.5281/zenodo.11397014 (Building height of Asia in 3D-GloBFP) (Che et al., 2024a), and https://doi.org/10.5281/zenodo.11391076 (Building height of Europe in 3D-GloBFP) (Che et al., 2024b). The dataset is stored in shapefile format with the building height in the attribute table.
In this study, we released a global building height dataset at the individual building scale, providing detailed building footprint information along with heights. Initially, we developed 33 height estimation models based on integrated multisource remote-sensing and building morphology features. Next, we assessed the model performance and the dataset quality via cross-validation with other existing national and regional building height datasets. Our results showed that the derived height dataset has a high agreement with reference data in regions worldwide, with the models' R2 values ranging from 0.66 to 0.96 and RMSE values ranging from 1.9 to 14.6 m. Moreover, estimated results are consistent with the measured height in Google Earth Street View images, with an R2 of 0.85. Our estimated heights also show a numerical distribution and spatial patterns that are more similar to the reference heights than other existing datasets. Next, we provided a seamless building height map globally. The detailed building height map reveals the distinct landscape heterogeneity within global cities: high-rise buildings are typically located in city centers, with heights gradually decreasing toward rural areas. Finally, we analyzed the built-up infrastructure in countries and cities by summarizing the total building volume. The results reveal a significant variation in the built-up infrastructure distribution across countries, with developed nations and certain emerging economies holding a larger proportion. Furthermore, substantial disparities in both 3D and 2D built-up infrastructure are evident across representative cities worldwide, influenced by factors such as different development stages and patterns.
The 3D-GloBFP map is the first individual building height dataset to depict the most detailed building 3D morphology worldwide, offering great potential to support studies ranging from macroscale global analyses to microscale investigations within urban areas. Our developed dataset provides precise height information and serves as the base input for urban analysis and simulations, such as climate modeling (He et al., 2019), population simulation (Zhao et al., 2021), building function classification (Zheng et al., 2024), and disaster assessments (Hossain and Meng, 2020). Moreover, our dataset also contributes to studies on the interaction between human society and ecosystems (Zhong et al., 2021; Rodriguez Mendez et al., 2024; Güneralp et al., 2017; Arehart et al., 2022), such as urban heat island (UHI) assessment (Y. Li et al., 2020), carbon footprint accounting (C. Z. Li et al., 2024), building shade studies (Watanabe et al., 2014), and building stock analysis (Frantz et al., 2023). These studies can further contribute to addressing critical environmental challenges related to urbanization, thereby promoting the achievement of sustainable development.
The supplement related to this article is available online at: https://doi.org/10.5194/essd-16-5357-2024-supplement.
XiL and XuL designed the research. YC and XuL were responsible for the experimental design, performed the experiments, and wrote the original manuscript. YC and YW organized the dataset. QS and JZ provided data. All authors reviewed and revised the manuscript.
At least one of the (co-)authors is a member of the editorial board of Earth System Science Data. The peer-review process was guided by an independent editor, and the authors also have no other competing interests to declare.
Publisher's note: Copernicus Publications remains neutral with regard to jurisdictional claims made in the text, published maps, institutional affiliations, or any other geographical representation in this paper. While Copernicus Publications makes every effort to include appropriate place names, the final responsibility lies with the authors.
The authors gratefully acknowledge the creation and provision of the Building Footprint dataset by Microsoft, the building height dataset by Baidu Maps, the ONEGEO Map by ONEGEO GmbH, and the Emu Analytics Building Heights dataset.
This research has been supported by the National Natural Science Foundation of China (grant nos. 42225107 and 42471513).
This paper was edited by Yuanzhi Yao and reviewed by three anonymous referees.
Arehart, J., Pomponi, F., D'Amico, B., and Srubar III, W.: A new estimate of building floor space in North America, Environ. Sci. Technol., 55, 5161–5170, https://doi.org/10.1021/acs.est.0c05081, 2021.
Arehart, J. H., Pomponi, F., D'Amico, B., and Srubar, W. V.: Structural material demand and associated embodied carbon emissions of the United States building stock: 2020–2100, Resour. Conserv. Recy., 186, 106583, https://doi.org/10.1016/j.resconrec.2022.106583, 2022.
Basaraner, M. and Cetinkaya, S.: Performance of shape indices and classification schemes for characterising perceptual shape complexity of building footprints in GIS, Int. J. Geogr. Inf. Sci., 31, 1952–1977, https://doi.org/10.1080/13658816.2017.1346257, 2017.
Cai, B., Shao, Z., Huang, X., Zhou, X., and Fang, S.: Deep learning-based building height mapping using Sentinel-1 and Sentinel-2 data, Int. J. Appl. Earth Obs., 122, 103399, https://doi.org/10.1016/j.jag.2023.103399, 2023.
Cao, Y. and Huang, X.: A deep learning method for building height estimation using high-resolution multi-view imagery over urban areas: A case study of 42 Chinese cities, Remote Sens. Environ., 264, 112590, https://doi.org/10.1016/j.rse.2021.112590, 2021.
Che, Y., Li, X., Liu, X., Wang, Y., Liao, W., Zheng, X., Zhang, X., Xu, X., Shi, Q., Zhu, J., Yuan, H., and Dai, Y.: Building height of Asia in 3D-GloBFP [data set], https://doi.org/10.5281/zenodo.11397014, 2024a.
Che, Y., Li, X., Liu, X., Wang, Y., Liao, W., Zheng, X., Zhang, X., Xu, X., Shi, Q., Zhu, J., Yuan, H., and Dai, Y.: Building height of Europe in 3D-GloBFP [data set], https://doi.org/10.5281/zenodo.11391076, 2024b.
Che, Y., Li, X., Liu, X., Wang, Y., Liao, W., Zheng, X., Zhang, X., Xu, X., Shi, Q., Zhu, J., Zhang, H., Yuan, H., and Dai, Y.: Building height of the Americas, Africa, and Oceania in 3D-GloBFP [data set], https://doi.org/10.5281/zenodo.11319912, 2024c.
Chen, G., Li, X., Liu, X., Chen, Y., Liang, X., Leng, J., Xu, X., Liao, W., Qiu, Y. A., Wu, Q., and Huang, K.: Global projections of future urban land expansion under shared socioeconomic pathways, Nat. Commun., 11, 537, https://doi.org/10.1038/s41467-020-14386-x, 2020.
Chen, G., Zhou, Y., Voogt, J. A., and Stokes, E. C.: Remote sensing of diverse urban environments: From the single city to multiple cities, Remote Sens. Environ., 305, 114108, https://doi.org/10.1016/j.rse.2024.114108, 2024.
Chen, P., Huang, H., Liu, J., Wang, J., Liu, C., Zhang, N., Su, M., and Zhang, D.: Leveraging Chinese GaoFen-7 imagery for high-resolution building height estimation in multiple cities, Remote Sens. Environ., 298, 113802, https://doi.org/10.1016/j.rse.2023.113802, 2023.
Chen, W., Zhou, Y., Stokes, E. C., and Zhang, X.: Large-scale urban building function mapping by integrating multi-source web-based geospatial data, Geo-spatial Information Science, 26, 1–15, https://doi.org/10.1080/10095020.2023.2264342, 2023.
Demuzere, M., Kittner, J., Martilli, A., Mills, G., Moede, C., Stewart, I. D., van Vliet, J., and Bechtel, B.: A global map of local climate zones to support earth system modelling and urban-scale environmental science, Earth Syst. Sci. Data, 14, 3835–3873, https://doi.org/10.5194/essd-14-3835-2022, 2022.
Ding, G., Guo, J., Pueppke, S. G., Yi, J., Ou, M., Ou, W., and Tao, Y.: The influence of urban form compactness on CO2 emissions and its threshold effect: Evidence from cities in China, J. Environ. Manage., 322, 116032, 2022.
Esch, T., Brzoska, E., Dech, S., Leutner, B., Palacios-Lopez, D., Metz-Marconcini, A., Marconcini, M., Roth, A., and Zeidler, J.: World Settlement Footprint 3D – A first three-dimensional survey of the global building stock, Remote Sens. Environ., 270, 112877, https://doi.org/10.1016/j.rse.2021.112877, 2022.
Frantz, D., Schug, F., Okujeni, A., Navacchi, C., Wagner, W., van der Linden, S., and Hostert, P.: National-scale mapping of building height using Sentinel-1 and Sentinel-2 time series, Remote Sens. Environ., 252, 112128, https://doi.org/10.1016/j.rse.2020.112128, 2021.
Frantz, D., Schug, F., Wiedenhofer, D., Baumgart, A., Virág, D., Cooper, S., Gómez-Medina, C., Lehmann, F., Udelhoven, T., van der Linden, S., Hostert, P., and Haberl, H.: Unveiling patterns in human dominated landscapes through mapping the mass of US built structures, Nat. Commun., 14, 8014, https://doi.org/10.1038/s41467-023-43755-5, 2023.
Geiß, C., Leichtle, T., Wurm, M., Pelizari, P. A., Standfuß, I., Zhu, X. X., So, E., Siedentop, S., Esch, T., and Taubenböck, H.: Large-Area Characterization of Urban Morphology – Mapping of Built-Up Height and Density Using TanDEM-X and Sentinel-2 Data, IEEE J. Sel. Top. Appl., 12, 2912–2927, https://doi.org/10.1109/JSTARS.2019.2917755, 2019.
Güneralp, B., Zhou, Y., Ürge-Vorsatz, D., Gupta, M., Yu, S., Patel, P. L., Fragkias, M., Li, X., and Seto, K. C.: Global scenarios of urban density and its impacts on building energy use through 2050, P. Natl. Acad. Sci. USA, 114, 8945–8950, https://doi.org/10.1073/pnas.1606035114, 2017.
He, X., Li, Y., Wang, X., Chen, L., Yu, B., Zhang, Y., and Miao, S.: High-resolution dataset of urban canopy parameters for Beijing and its application to the integrated WRF/Urban modelling system, J. Clean. Prod., 208, 373–383, https://doi.org/10.1016/j.jclepro.2018.10.086, 2019.
Hossain, M. K. and Meng, Q.: A fine-scale spatial analytics of the assessment and mapping of buildings and population at different risk levels of urban flood, Land Use Policy, 99, 104829, https://doi.org/10.1016/j.landusepol.2020.104829, 2020.
Huang, H., Chen, P., Xu, X., Liu, C., Wang, J., Liu, C., Clinton, N., and Gong, P.: Estimating building height in China from ALOS AW3D30, ISPRS J. Photogramm., 185, 146–157, https://doi.org/10.1016/j.isprsjprs.2022.01.022, 2022.
Koppel, K., Zalite, K., Voormansik, K., and Jagdhuber, T.: Sensitivity of Sentinel-1 backscatter to characteristics of buildings, Int. J. Remote Sens., 38, 6298–6318, https://doi.org/10.1080/01431161.2017.1353160, 2017.
Kouskoulas, V. and Koehn, E.: Predesign Cost-Estimation Function for Buildings, J. Construct. Div.-ASCE, 100, 589–604, https://doi.org/10.1061/JCCEAZ.0000461, 1974.
Li, C. Z., Tam, V. W. Y., Lai, X., Zhou, Y., and Guo, S.: Carbon footprint accounting of prefabricated buildings: A circular economy perspective, Build. Environ., 258, 111602, https://doi.org/10.1016/j.buildenv.2024.111602, 2024.
Li, L., Bisht, G., Hao, D., and Leung, L. R.: Global 1 km land surface parameters for kilometer-scale Earth system modeling, Earth Syst. Sci. Data, 16, 2007–2032, https://doi.org/10.5194/essd-16-2007-2024, 2024.
Li, M., Koks, E., Taubenböck, H., and van Vliet, J.: Continental-scale mapping and analysis of 3D building structure, Remote Sens. Environ., 245, 111859, https://doi.org/10.1016/j.rse.2020.111859, 2020.
Li, M., Wang, Y., Rosier, J. F., Verburg, P. H., and van Vliet, J.: Global maps of 3D built-up patterns for urban morphological analysis, Int. J. Appl. Earth Obs., 114, 103048, https://doi.org/10.1016/j.jag.2022.103048, 2022.
Li, W., Goodchild, M. F., and Church, R.: An efficient measure of compactness for two-dimensional shapes and its application in regionalization problems, Int. J. Geogr. Inf. Sci., 27, 1227–1250, https://doi.org/10.1080/13658816.2012.752093, 2013.
Li, X., Gong, P., Zhou, Y., Wang, J., Bai, Y., Chen, B., Hu, T., Xiao, Y., Xu, B., Yang, J., Liu, X., Cai, W., Huang, H., Wu, T., Wang, X., Lin, P., Li, X., Chen, J., He, C., Li, X., Yu, L., Clinton, N., and Zhu, Z.: Mapping global urban boundaries from the global artificial impervious area (GAIA) data, Environ. Res. Lett., 15, 094044, https://doi.org/10.1088/1748-9326/ab9be3, 2020a.
Li, X., Zhou, Y., Gong, P., Seto, K. C., and Clinton, N.: Developing a method to estimate building height from Sentinel-1 data, Remote Sens. Environ., 240, 111705, https://doi.org/10.1016/j.rse.2020.111705, 2020b.
Li, Y., Schubert, S., Kropp, J. P., and Rybski, D.: On the influence of density and morphology on the Urban Heat Island intensity, Nat. Commun., 11, 2647, https://doi.org/10.1038/s41467-020-16461-9, 2020.
Liasis, G. and Stavrou, S.: Satellite images analysis for shadow detection and building height estimation, ISPRS J. Photogramm., 119, 437–450, https://doi.org/10.1016/j.isprsjprs.2016.07.006, 2016.
Liu, M., Ma, J., Zhou, R., Li, C., Li, D., and Hu, Y.: High-resolution mapping of mainland China's urban floor area, Landscape Urban Plan., 214, 104187, https://doi.org/10.1016/j.landurbplan.2021.104187, 2021.
Liu, X., Wu, X., Li, X., Xu, X., Liao, W., Jiao, L., Zeng, Z., Chen, G., and Li, X.: Global Mapping of Three-Dimensional (3D) Urban Structures Reveals Escalating Utilization in the Vertical Dimension and Pronounced Building Space Inequality, Engineering, in press, https://doi.org/10.1016/j.eng.2024.01.025, 2024.
Lyu, S., Ji, C., Liu, Z., Tang, H., Zhang, L., and Yang, X.: Four seasonal composite Sentinel-2 images for the large-scale estimation of the number of stories in each individual building, Remote Sens. Environ., 303, 114017, https://doi.org/10.1016/j.rse.2024.114017, 2024.
Ma, X., Zheng, G., Chi, X., Yang, L., Geng, Q., Li, J., and Qiao, Y.: Mapping fine-scale building heights in urban agglomeration with spaceborne lidar, Remote Sens. Environ., 285, 113392, https://doi.org/10.1016/j.rse.2022.113392, 2023.
Microsoft: US Building Footprints, https://wiki.openstreetmap.org/wiki/Microsoft_Building_Footprint_Data#March_2017_Release (last access: May 2021), 2018.
Microsoft: Worldwide building footprints derived from satellite imagery, GitHub, https://github.com/microsoft/GlobalMLBuildingFootprints/tree/main (last access: April 2023), 2020.
Pappaccogli, G., Giovannini, L., Zardi, D., and Martilli, A.: Sensitivity analysis of urban microclimatic conditions and building energy consumption on urban parameters by means of idealized numerical simulations, Urban Climate, 34, 100677, https://doi.org/10.1016/j.uclim.2020.100677, 2020.
Park, Y. and Guldmann, J.-M.: Creating 3D city models with building footprints and LIDAR point cloud classification: A machine learning approach, Comput. Environ. Urban, 75, 76–89, https://doi.org/10.1016/j.compenvurbsys.2019.01.004, 2019.
Pesaresi, M., Corbane, C., Ren, C., and Edward, N.: Generalized Vertical Components of built-up areas from global Digital Elevation Models by multi-scale linear regression modelling, PLOS ONE, 16, e0244478, https://doi.org/10.1371/journal.pone.0244478, 2021.
Rodriguez Mendez, Q., Fuss, S., Lück, S., and Creutzig, F.: Assessing global urban CO2 removal, Nature Cities, 1, 413–423, https://doi.org/10.1038/s44284-024-00069-x, 2024.
Shang, S., Du, S., Du, S., and Zhu, S.: Estimating building-scale population using multi-source spatial data, Cities, 111, 103002, https://doi.org/10.1016/j.cities.2020.103002, 2020.
Shao, L., Liao, W., Li, P., Luo, M., Xiong, X., and Liu, X.: Drivers of global surface urban heat islands: Surface property, climate background, and 2D/3D urban morphologies, Build. Environ., 242, 110581, https://doi.org/10.1016/j.buildenv.2023.110581, 2023.
Shi, Q., Zhu, J., Liu, Z., Guo, H., Gao, S., Liu, M., Liu, Z., and Liu, X.: The Last Puzzle of Global Building Footprints – Mapping 280 Million Buildings in East Asia Based on VHR Images, Journal of Remote Sensing, 4, 0138, https://doi.org/10.34133/remotesensing.0138, 2024.
Stilla, U., Soergel, U., and Thoennessen, U.: Potential and limits of InSAR data for building reconstruction in built-up areas, ISPRS J. Photogramm., 58, 113–123, https://doi.org/10.1016/S0924-2716(03)00021-2, 2003.
Sun, Y., Zhang, N., Miao, S., Kong, F., Zhang, Y., and Li, N.: Urban Morphological Parameters of the Main Cities in China and Their Application in the WRF Model, J. Adv. Model. Earth Sy., 13, e2020MS002382, https://doi.org/10.1029/2020MS002382, 2021.
United Nations Human Settlements Programme: World Cities Report 2022: Envisaging the Future of Cities, Nairobi, ISBN 978-92-1-132894-3, 2022.
Watanabe, S., Nagano, K., Ishii, J., and Horikoshi, T.: Evaluation of outdoor thermal comfort in sunlight, building shade, and pergola shade during summer in a humid subtropical region, Build. Environ., 82, 556-565, https://doi.org/10.1016/j.buildenv.2014.10.002, 2014.
Wu, W.-B., Ma, J., Banzhaf, E., Meadows, M. E., Yu, Z.-W., Guo, F.-X., Sengupta, D., Cai, X.-X., and Zhao, B.: A first Chinese building height estimate at 10 m resolution (CNBH-10 m) using multi-source earth observations and machine learning, Remote Sens. Environ., 291, 113578, https://doi.org/10.1016/j.rse.2023.113578, 2023.
Xu, X., Ou, J., Liu, P., Liu, X., and Zhang, H.: Investigating the impacts of three-dimensional spatial structures on CO2 emissions at the urban scale, Sci. Total Environ., 762, 143096, https://doi.org/10.1016/j.scitotenv.2020.143096, 2021.
Yu, G., Xie, Z., Xuecao, L., Wang, Y., Huang, J., and Yao, X.: The Potential of 3D Building Height Data to Characterize Socioeconomic, Remote Sens., 14, 2087, https://doi.org/10.3390/rs14092087, 2022.
Yuan, F. and Bauer, M. E.: Comparison of impervious surface area and normalized difference vegetation index as indicators of surface urban heat island effects in Landsat imagery, Remote Sens. Environ., 106, 375–386, https://doi.org/10.1016/j.rse.2006.09.003, 2007.
Zhao, X., Zhou, Y., Chen, W., Li, X., Li, X., and Li, D.: Mapping hourly population dynamics using remotely sensed and geospatial data: a case study in Beijing, China, GISci. Remote Sens., 58, 717–732, https://doi.org/10.1080/15481603.2021.1935128, 2021.
Zheng, Y., Zhang, X., Ou, J., and Liu, X.: Identifying building function using multisource data: A case study of China's three major urban agglomerations, Sustain. Cities Soc., 108, 105498, https://doi.org/10.1016/j.scs.2024.105498, 2024.
Zhong, X., Hu, M., Deetman, S., Steubing, B., Lin, H. X., Hernandez, G. A., Harpprecht, C., Zhang, C., Tukker, A., and Behrens, P.: Global greenhouse gas emissions from residential and commercial building materials and mitigation strategies to 2060, Nat. Commun., 12, 6126, https://doi.org/10.1038/s41467-021-26212-z, 2021.
Zhou, Y., Li, X., Chen, W., Meng, L., Wu, Q., Gong, P., and Seto, K. C.: Satellite mapping of urban built-up heights reveals extreme infrastructure gaps and inequalities in the Global South, P. Natl. Acad. Sci. USA, 119, e2214813119, https://doi.org/10.1073/pnas.2214813119, 2022.


