the Creative Commons Attribution 4.0 License.
the Creative Commons Attribution 4.0 License.
 | 22 Jan 2024
A global FAOSTAT reference database of cropland nutrient budgets and nutrient use efficiency (1961–2020): nitrogen, phosphorus and potassium
Cameron I. Ludemann
Nathan Wanner
Pauline Chivenge
Achim Dobermann
Rasmus Einarsson
Patricio Grassini
Armelle Gruere
Kevin Jackson
Luis Lassaletta
Federico Maggi
Griffiths Obli-Laryea
Martin K. van Ittersum
Srishti Vishwakarma
Xin Zhang
Francesco N. Tubiello
Nutrient budgets help to identify the excess or insufficient use of fertilizers and other nutrient sources in agriculture. They allow for the calculation of indicators, such as the nutrient balance (surplus if positive or deficit if negative) and nutrient use efficiency, that help to monitor agricultural productivity and sustainability across the world. We present a global database of country-level budget estimates for nitrogen (N), phosphorus (P) and potassium (K) on cropland. The database, disseminated in FAOSTAT, is meant to provide a global reference, synthesizing and continuously updating the state of the art on this topic. The database covers 205 countries and territories, as well as regional and global aggregates, for the period from 1961 to 2020. Results highlight the wide range in nutrient use and nutrient use efficiencies across geographic regions, nutrients, and time. The average N balance on global cropland has remained fairly steady at about 50–55 kg ha−1 yr−1 during the past 15 years, despite increasing N inputs. Regional trends, however, show recent average N surpluses that range from a low of about 10 kg N ha−1 yr−1 in Africa to more than 90 kg N ha−1 yr−1 in Asia. Encouragingly, average global cropland N use efficiency decreased from about 59 % in 1961 to a low of 43 % in 1988, but it has risen since then to a level of 55 %. Phosphorus deficits are mainly found in Africa, whereas potassium deficits occur in Africa and the Americas. This study introduces improvements over previous work in relation to the key nutrient coefficients affecting nutrient budgets and nutrient use efficiency estimates, especially with respect to nutrient removal in crop products, manure nutrient content, atmospheric deposition and crop biological N fixation rates. We conclude by discussing future research directions and highlighting the need to align statistical definitions across research groups as well as to further refine plant and livestock coefficients and expand estimates to all agricultural land, including nutrient flows in meadows and pastures. Further information is available from https://doi.org/10.5061/dryad.hx3ffbgkh (Ludemann et al., 2023b) as well as the FAOSTAT database (https://www.fao.org/faostat/en/#data/ESB; FAO, 2022a) and is updated annually.
- Article
(5892 KB) - Full-text XML
-
Supplement
(1076 KB) - BibTeX
- EndNote


Nutrient budgets quantify nutrient flows in agriculture and are widely used to quantify the productivity and resource use efficiency of agricultural systems. The nutrient balance (defined as the difference between nutrient inputs and productive outputs: termed a surplus if positive and a deficit if negative) is an indicator of the excess or insufficient use of nutrients from fertilizers and other sources in crop production. Nutrient surpluses threaten environmental quality, particularly with regard to water and air quality, climate change, and biodiversity loss (Zhang et al., 2021; FAO, 2022b). On the other hand, nutrient deficits or nutrient surpluses close to zero could indicate soil nutrient mining, potentially decreasing soil health over time. Imbalanced crop nutrition endangers the productivity and sustainability of agriculture. Comparable data on soil nutrient budgets and related indicators of nutrient use efficiency are therefore useful tools to assess and monitor agricultural performance and may support the 2030 Sustainable Development Goals indicators (Tubiello et al., 2021; Zhang et al., 2021; FAO, 2022b; Quan et al., 2021). Time series data showing temporal changes are essential to monitor progress toward nutrient-related goals (Zhang et al., 2021). Some nutrient budget time series with a global scope have been published; however, to the authors knowledge, they have been heavily biased toward N (Zhang et al., 2015; Conant et al., 2013; Lassaletta et al., 2014; Mueller et al., 2012; Bouwman et al., 2017; FAO, 2021; Bodirsky et al., 2012; Bouwman et al., 2013; Lassaletta et al., 2016; Lu and Tian, 2017; Nishina et al., 2017; Zhang et al., 2017), few have been published for P and no time series has been published for K, meaning that no studies or datasets have integrated all three nutrients into a long-term nutrient budget database.
Data presented in this work focus on partial nutrient budgets (referred to herein as nutrient budgets) and related nutrient use efficiencies on cropland. The term “partial” is used here to indicate that what is computed herein is in fact a partial nutrient budget in which specific nutrient losses such as gaseous emissions, leaching or runoff are not explicitly accounted for. In other words, such losses are embedded in the overall nutrient budget estimates, whereas a “complete” nutrient budget would explicitly include specific estimates of the different losses. Cropland is the sum of arable land and permanent crops, including areas left fallow or cultivated with temporary pastures within crop rotations but excluding permanent meadows and pastures (FAO, 2022d). We see two main rationales for estimating nutrient budgets on cropland. First, cropland is typically where nutrient flows and related environmental impacts are the highest; therefore, cropland budgets and derived indicators such as the surplus are more likely to capture potential pollution hotspots (West et al., 2014). Second, permanent meadows and pastures present some particular methodological challenges, primarily due to the lack of global data on productivity and biological N fixation (Tubiello et al., 2023; Schils et al., 2013).
Data presented here build on previous work on estimating national- to global-scale nutrient budgets (or important components of nutrient budgets) over time (Bodirsky et al., 2012; Bouwman et al., 2017, 2013; Conant et al., 2013; Einarsson et al., 2020, 2021; FAO, 2021; Herridge et al., 2022; IFA, 2022a; Kremer, 2013; Lassaletta et al., 2014; Lu and Tian, 2017; Ludemann et al., 2022a; Mueller et al., 2012; Nishina et al., 2017; Oenema et al., 2003; Peoples et al., 2021; Vishwakarma et al., 2023; Zhang et al., 2015, 2021; Zou et al., 2022). This study adds additional refinements – such as new estimates of synthetic fertilizer inputs, the fraction of fertilizer applied to cropland, manure, N deposition, biological N fixation and nutrients removed in harvested crops (see Sect. 2). The new data are made freely available to users worldwide for N, P and K budgets, budget components, and nutrient use efficiencies, covering 205 countries and territories for the period from 1961 to 2020 (FAO, 2022a). In our view, the resulting dataset represents the most complete dataset to date on the subject matter, serving as a reference for additional refinements by the scientific community.
The cropland nutrient budget (CNB) was developed for N, P and K data for all areas of cropland as an FAO land use category (FAO, 2022a, d) at the country level. The nutrient budget inputs on cropland considered in this work included the application of synthetic fertilizer (SF) (also referred to as “chemical fertilizer” or “mineral fertilizer”), manure from livestock, N inputs through biological N fixation and the atmospheric N deposition. The nutrient budget outputs were the nutrients removed via crop harvest. The nutrient budget balance was calculated as the difference between inputs and outputs (surplus if positive or deficit if negative). Nutrient use efficiency was computed as the nutrient outputs as a percentage of nutrient inputs.
The nutrient balance for country i, nutrient j and year y was computed as the sum of inputs: SF multiplied by the fraction of fertilizer applied to cropland (CF), manure applied to cropland soils (MAS), atmospheric deposition (AD; only for N), and biological N fixation (BF; only for N) minus crop removal (CR), which represents the outputs in the CNB (Eq. 1).
Data were computed as both total nutrients and as per area of cropland per year. Collection and analysis of each of these CNB components are described in more detail in the following sections.
2.1 Cropland area
Cropland area defines the scope of the estimations made in this work. Here, cropland is defined, per the FAO land use category for the collection of country data (https://www.fao.org/statistics/data-collection/en/, last access: 5 November 2023), as follows: “land used for cultivation of temporary and permanent crops in rotation with fallow, meadows and pastures within cycles of up to five years”. It is important to underscore that the land use term “cropland” generally encompasses more area than the corresponding term used in remote sensing and biophysical modeling, which largely refers only to land areas planted or harvested with annual crops (Tubiello et al., 2023). Identifying flows on cropland as a land use category allows for clear operational definitions of what is within the scope with regards to CNB data at the country level in line with FAO reporting. At the same time, it generates significant uncertainty in the associated quantities, as discussed below.
2.2 Cropland nutrient budget components
Information on SF inputs was sourced from data on agricultural use from both FAOSTAT (FAOSTAT, 2022) and IFASTAT (IFASTAT, 2022), taking the mean value of the two data sources when both were available. The individual datasets have been shown to be rather equivalent (FAO, 2022b); therefore, in a reference database, the choice was on a consolidated dataset from both sources. All SF values were converted to elemental quantities of nutrients based on a mass proportion composition conversion of 0.436 kg of elemental P per kilogram of P2O5 and 0.83 kg of elemental K per kilogram of K2O. Where necessary, all other inputs and outputs were converted to quantities of elemental nutrients using these conversion factors.
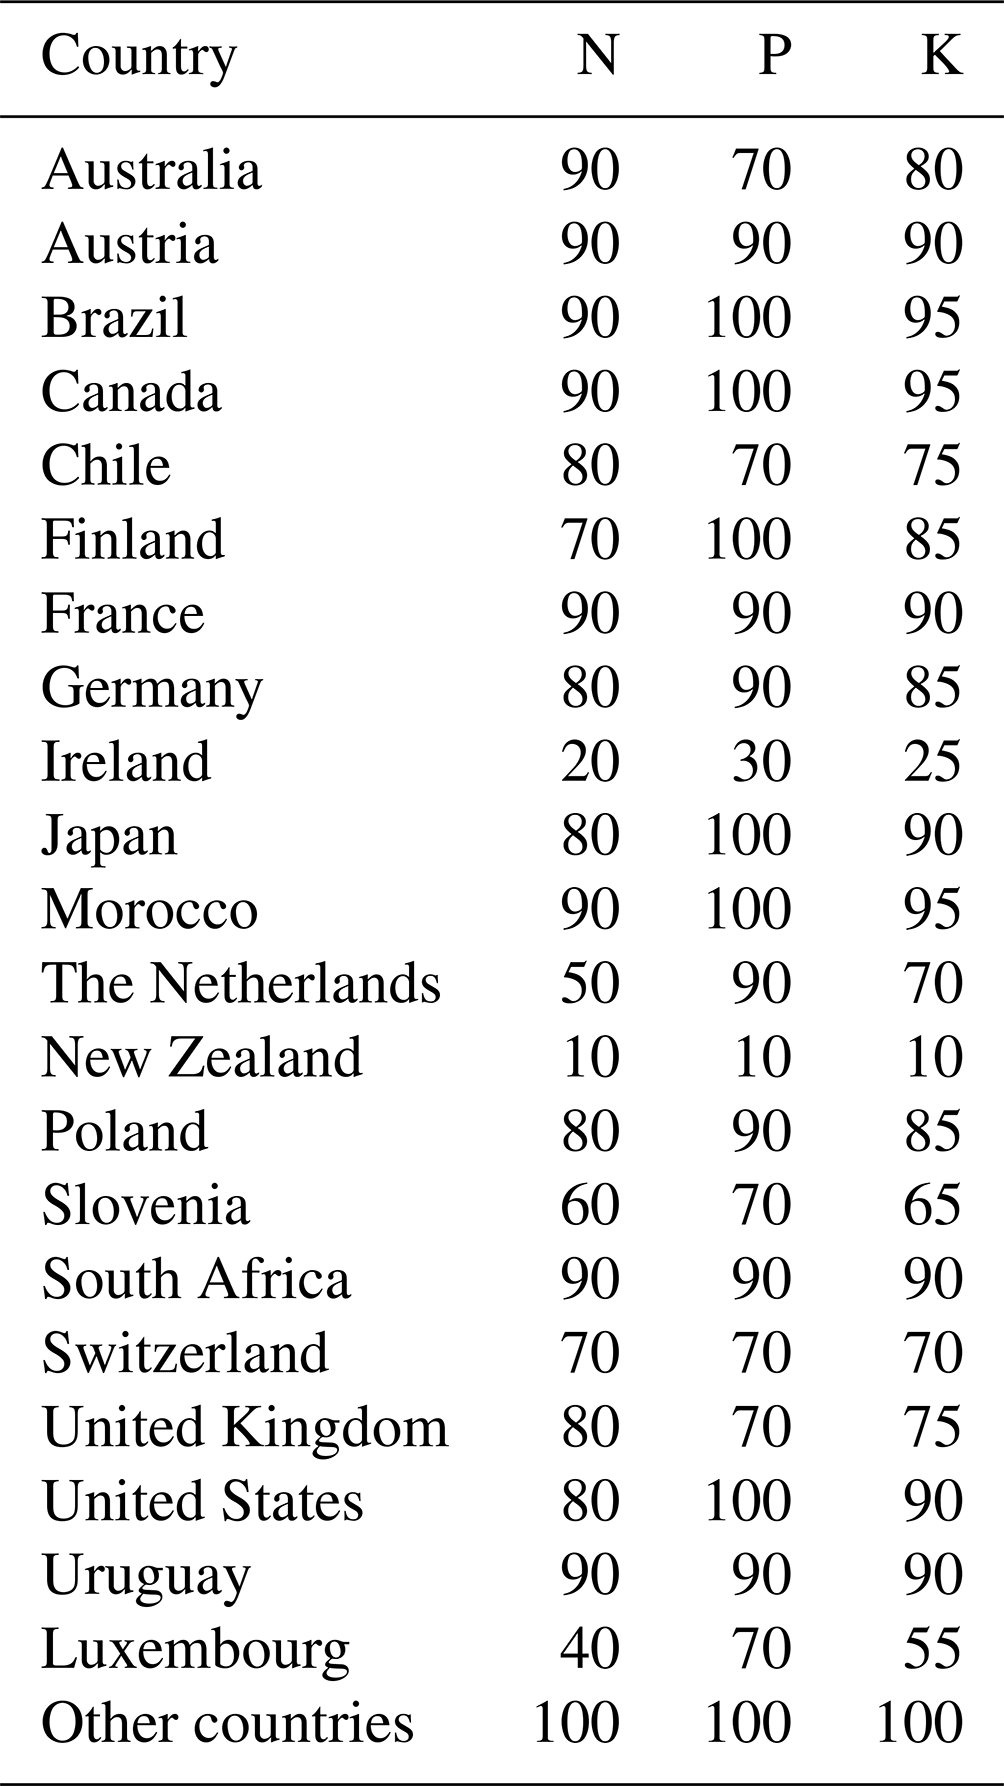
Importantly, both FAO and IFA data refer to fertilizer use in agriculture generally, while actual amounts used specifically on cropland are not systematically estimated. The fraction of fertilizer applied to cropland (CF) was therefore needed to determine inputs for the CNB developed in this work. For the majority of countries, due to a lack of specific information, default cropland fraction estimates of 100 % were used for N, P and K, thereby assuming that all fertilizers were applied on cropland area. At the same time, we were able to identify 21 countries for which reasonable evidence is available to support specific values of CF for N (Table 1). CF for major crops by country were first estimated for N considering estimates derived from four sources (Zhang et al., 2021; Einarsson et al., 2021; Ludemann et al., 2022a; FAO, 2022a). The 21 countries with new CF estimates were selected based on relatively stringent criteria, namely, (1) if a given country had reported CF estimates for N from IFA and/or FAO, (2) if selected CF estimates for N use were significantly lower than 100 % and (3) if CF estimates were in general good agreement across these various sources. In addition, for two countries, Ireland and New Zealand, we used the CF values communicated by the country directly to FAO as its part of statistical data collection. Conversely, default CF values (of 100 %) were used for countries for which (1) there was lack of sufficient data, (2) reported estimates were close to 100 % (e.g., >90 %) or (3) disagreement existed in reported values from our available sources. For countries with recommended updates, CF for P was based on reported values by Zou et al. (2022). The CF values for K were calculated as averages of the N and P coefficients. Further clarification of the derivation and screening of CF estimates is included in Sect. S1 in the Supplement.
Table 1Percentages (%) of total nitrogen (N), phosphorus (P) and potassium (K) fertilizers used in agriculture and applied to cropland for the listed countries for the years from 1961 to 2020. These percentages were also used to apportion nutrients from manure from livestock in agriculture to cropland.
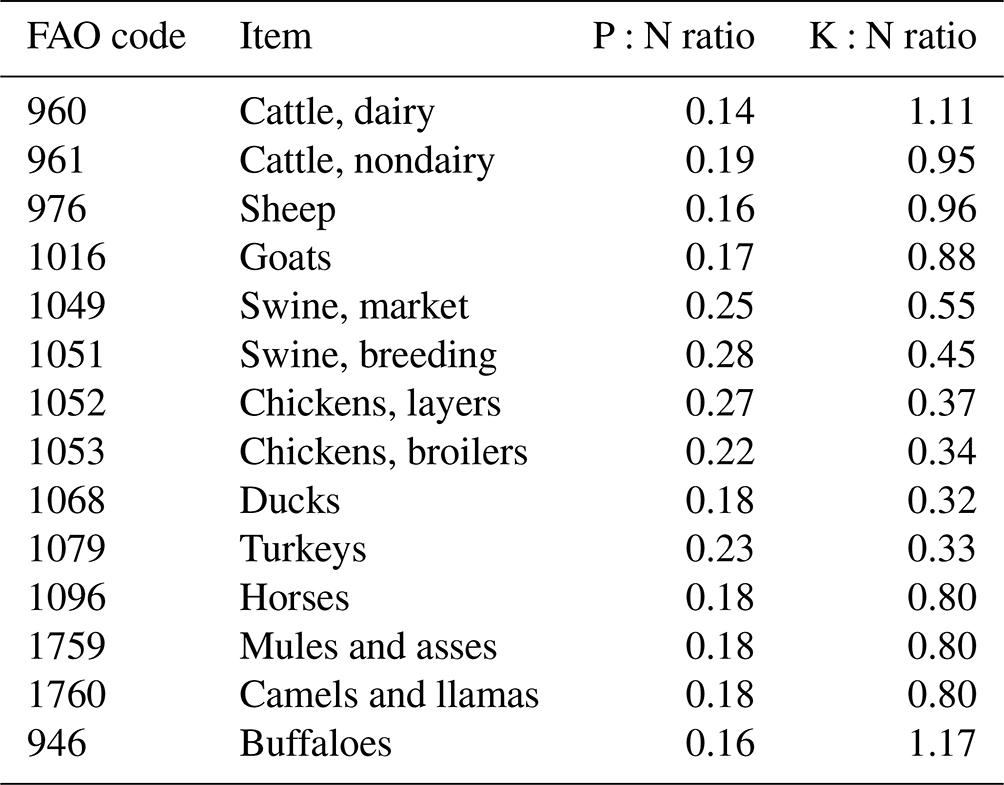
Organic N inputs were limited to livestock manure applied to cropland soils (MAS). MAS was estimated as N from treated manure in manure management systems applied to soil following the IPCC Guidelines for National Greenhouse Gas Emission Inventories at Tier 1 (e.g., FAO, 2022c). The associated P and K quantities were subsequently estimated using published P:N and K:N conversion ratios (Statistics Netherlands, 2012; Sheldrick et al., 2003) (Table 2). The N, P and K nutrients from manure from livestock were apportioned to cropland based on the same CF values shown in Table 1.
Table 2Phosphorus (P) and potassium (K) to N ratios in livestock manure.
Atmospheric deposition (AD) refers to N inputs from the atmosphere as dry and wet N deposition, considering both the reduced and oxidized forms; this information was derived from a review of existing methods and related data sources for national-scale data, as described in Vishwakarma et al. (2023). Of the four datasets for AD, the product comprising Land-Use Harmonization (LUH2; Hurtt et al., 2020), Wang et al. (2019), Shang et al. (2019) and Wang et al. (2017) data were used in the CNB. The flows of P and K through atmospheric deposition are generally negligible (Einarsson et al., 2020) and were, therefore, not included in the CNB.
Biological fixation (BF) of N by grain legume crops was estimated using a yield-dependent and regionally specific model presented by Peoples et al. (2021) and Herridge et al. (2022). This model was based on statistical regressions for eight categories of grain legumes: chickpea, common bean, faba bean, groundnut, lupin, pigeon pea, soybean and other. For soybean, the model further distinguishes Brazil, Europe and the rest of the world. The model assumes a nonlinear dependence of the BF rate on crop yield and, therefore, in contrast to earlier publications, does not lead to fixed ratios between the harvest area and BF. Further details on these models are included in Sect. S2. Forage legumes were not accounted for due to the lack of production data (see Sect. 2.3.1 below). For non-legume crops, BF was estimated using fixed global per-hectare coefficients of 25 kg N ha−1 yr−1 for rice and sugarcane (see Sect. S2 for a detailed explanation). With the exception of rice and sugarcane, N fixation from free-living N-fixing bacteria in other crops was not included in the CNB. The source code (in R and Python) and detailed output for the BF estimates are freely available (Einarsson, 2023b, a).
Crop removal (CR) rates were calculated using crop nutrient removal coefficients multiplied by crop production statistics. The crop production data were taken from FAOSTAT (FAO, 2022e). Crop nutrient removal coefficients from Sect. S3, which were derived from a meta-analysis described by Ludemann et al. (2023a), were used to estimate total crop nutrient removal. Crop species that did not have specific crop nutrient concentration values from Ludemann et al. (2023a) (version date 7 March 2023) were gap-filled using weighted-average nutrient concentrations of the crop species in the same “Item Group” using the 2014 harvested-area values as weighting factors. The source code for standardizing and analyzing the CR data in R was published separately by Ludemann (2022) and Ludemann et al. (2023a).
The same aforementioned coefficients for all of the CNB components were applied to each year across the full time series.
2.3 Data limitations and uncertainty
2.3.1 Scope
The nutrient budgets presented here refer to the FAO cropland area (as defined in Sect. 2.1) but also acknowledge that there is substantial uncertainty in cropland area measurement and a variety of definitions across various relevant land cover products (Tubiello et al., 2023). The world's cropland area used in the present study was taken from FAOSTAT (FAO, 2022e) and was 1.562×10⁹ ha for 2020. This compares well to the 1.215×10⁹–2.002×10⁹ ha range and ∼25 % relative uncertainty in cropland area recently estimated by Tubiello et al. (2023) (Table 3, Sect. S4). In addition, the CNB excludes crops with no production data in FAOSTAT (FAO, 2022e); these include forage crops such as alfalfa, clover and grass–clover mixtures. Exclusion of these crops likely leads to a substantial underestimation of cropland nutrient removal and, in some cases, cropland biological N fixation in countries where forage legumes are major components of cropland, such as Australia, Argentina, several European countries (Einarsson et al., 2021), New Zealand and the United States of America (Lassaletta et al., 2014). Another cause of uncertainty in the CNB arises from how the parameters were estimated, as is described in the next section.
Table 3Estimates of relative uncertainty (expressed as the coefficient of variation, CV, %) in key items and affected components of the cropland nutrient budget (CNB) using 2020 data. Details on each contributing item and component are included in Sect. S4.
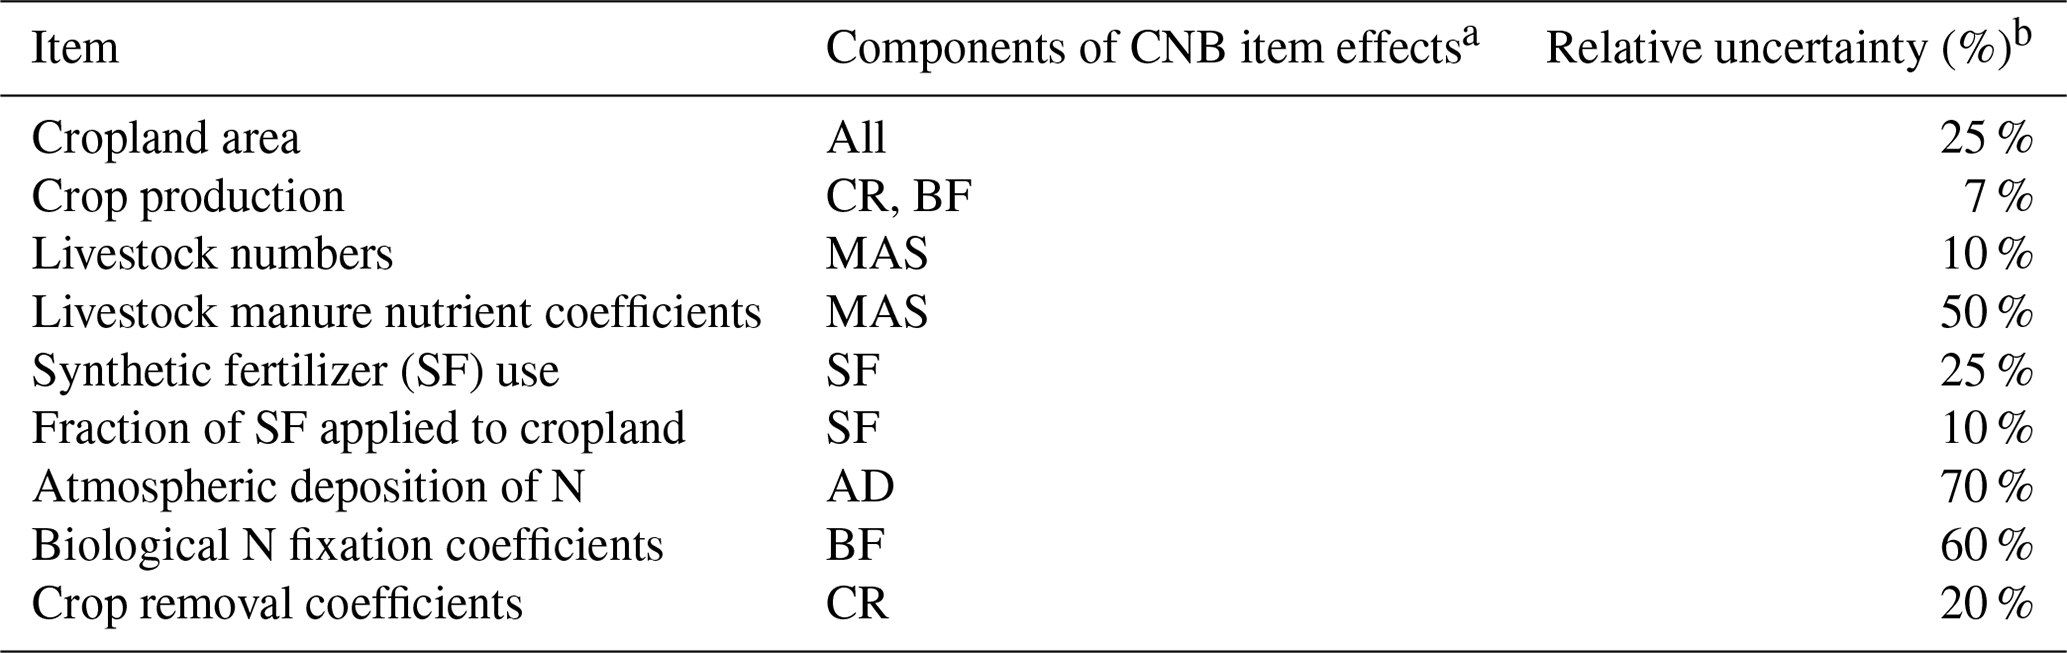
a Components of the cropland nutrient budget (CNB) include the following: synthetic fertilizer (SF), fraction of SF applied to cropland (CF), manure applied to soil (MAS), atmospheric deposition (AD), biological fixation (BF) and crop removal (CR). b Uncertainty was expressed as the coefficient of variation to 2 significant figures.
2.3.2 Uncertainty
Nutrient budgets tend to have large uncertainties (Lesschen et al., 2007; Zhang et al., 2020; Pathak et al., 2010). However, in general, there appears to be more certainty in the direction (e.g., is it a negative or positive balance) and its evolution in time for a given country than in the magnitude of nutrient balances. For example, where multiple studies estimated the N, P and K balances for Burkina Faso, there was good concordance (90 % showing same direction) with respect to whether there was a deficit or surplus (Lesschen et al., 2007). However, the coefficient of variation in these estimates of nutrient balances in Burkina Faso made by the various researchers was 27 % for N, 167 % for P and 115 % for K (Lesschen et al., 2007). At a global level, estimates of the quantity of N surplus also have great uncertainty. This is evidenced by the more than 50 % differences in the estimated N surplus quantity depending on whose estimate is used, as analyzed by Zhang et al. (2021).
Each contributing item of the CNB has varying levels of uncertainty, with N deposition having the greatest relative uncertainty (CV of ∼70 %) and crop production having the least uncertainty (CV of ∼7 %) (Table 3). At the same time, N deposition is a small contributor to the overall N budget, with values across the world (as a mean) being less than 10 kg N ha−1 yr−1, so that its contribution to overall uncertainty is also small (Sect. S4). Conversely, items expected to contribute substantially to the overall CNB include SF use and coefficients for estimating crop nutrient removal. These items had similar (∼20 %–25 %) uncertainty (Sect. S4). The preceding estimates of uncertainty used data that best represented the nutrient component (e.g., CV % values for maize, rice, soybeans and wheat were used to represent uncertainty in crop nutrient removal, as these crops make up the majority of total grain production worldwide) following IPCC (2006). It is important to note that there could be greater uncertainties associated with items that were not included in this assessment due to a lack of data and/or because items were deemed to make a minor contribution to the overall CNB.
While cropland area has a reasonable 25 % estimate of uncertainty, this value does not elucidate the challenges involved with quantifying the nutrient inputs and outputs from this category of land. Three main issues arise in the current CNB: (1) it is assumed that the same CF values for SF are used to apportion nutrients from manure from livestock to cropland, (2) no nutrient outputs from the herbage removed from some of the categories of cropland (e.g., temporary meadows and pasture or silage maize) are accounted for and (3) the exchange of manure between countries is not accounted for. The Netherlands is an example of a country extremely affected by the limitations of the current methodology. Much of the manure from the dairy sector in the Netherlands is applied on-farm to areas of land growing maize for silage or temporary or permanent meadows and pastures. However, the proportion of manure applied to cropland may not correspond to the CF values estimated for SF. There is uncertainty in these estimates. In addition, none of the nutrients removed as herbage from the maize for silage or grazed or mown temporary meadows or pastures are included in the total estimate of nutrient outputs. Further, the Netherlands exports 10 % of its manure from livestock to other countries.
Better accounting for N outputs from herbage removed in the Dutch “maize for silage” scenario, “temporary meadows and pastures” scenario or both scenarios combined was estimated to increase the nitrogen use efficiency (NUE) from the original 30 % in the CNB to 58 %, 50 % and 77 %, respectively (Sect. S5). Conversely, accounting for exports of manure from the Netherlands to neighboring countries was shown to increase the NUE from 30 % to 32 % (Sect. S5). While the Netherlands is an extreme case, other countries with a substantial number of livestock and substantial areas of meadows and pastures or fodder crops like maize for silage (e.g., Ireland, Denmark and New Zealand) could also be affected, albeit to a lesser degree (Sect. S5). It must also be noted that the aforementioned scenarios do not account for the confounding effect of manure applied to permanent meadows and pastures, and this could also substantially effect estimates of nutrient surplus and the NUE.
2.3.3 Possible future improvements
Apart from improving the accuracy and granularity of components that already exist in the CNB, there are several options for future developments of this database.
As highlighted in Sects. 2.3.2 and S5, the area of fodder and forage crops in a country can have a substantial effect on nutrient budgets and estimates of nutrient use efficiency. Including estimates of nutrients removed as fodder and forage crops will therefore allow for a fairer comparison between countries for indicators included in the CNB.
An important future development of the CNB is to more explicitly account for changes in soil nutrient stocks, which are currently “hidden” in the estimated surpluses or deficits. However, this will be difficult given the dynamic and stochastic characteristics of soil system processes (Cobo et al., 2010).
Including results at a sub-country and crop-specific level is a further area of development. Issues with apportioning fertilizer and manure to different land use classes or crops will need to be overcome to succeed in spatially disaggregating nutrient budgets and also to accurately estimate separate nutrient budgets for cropland and permanent meadows and pastures. While data on SF use by crops are available at a global scale (Ludemann et al., 2022a), estimation of quantities of manure applied to each crop requires suitable survey data that do not yet exist globally. Management of manure during housing and storage before it is applied to cropland also varies spatially and temporally. This can have a substantial effect on the concentrations of nutrients in manure (Statistics Netherlands, 2012), leading to uncertainty in the quantities of nutrients applied as manure. In addition, use of the same value for the fraction of N fertilizer applied to cropland as that used for the fraction of livestock manure applied to cropland introduces uncertainty in the overall CNB estimates. As described in Sect. S5, this assumption may not hold for every country. Introduction of country-specific fractions representing the proportion of manure from livestock that is applied to cropland will be an important improvement in future iterations of the CNB.
The current database does not include estimates of nutrients removed as crop residues, nor are the nutrient concentrations of crop products used in the current database country-specific (see Sect. S3). Progress is being made toward improved predictions of a crop harvest index that can be used to determine the quantities of crop residues based on the quantities of crop products (Ludemann et al., 2022b). However, no studies with a global scale are available to indicate the proportion of crop residues removed from the land at harvest. This will require the extensive collection of survey information to get more relevant crop- and country-specific values. For improved estimates of nutrients removed as crop products, open databases (http://www.cropnutrientdata.net, last access: 2 October 2023; Ludemann et al., 2023a) and prediction models are being developed to support country- and sub-country-specific nutrient concentrations of these crop components. As country- and crop-specific coefficients (Tier 2 or Tier 3 level) are developed, these can be included in future iterations of the CNB.
Some nutrient inputs currently excluded from the CNB (e.g., nutrients in irrigation water and nutrients in composted crop residues or human manure) could be included in the future, especially in countries where these constitute a significant contribution to overall inputs (Serra et al., 2023).
Finally, with new capabilities becoming available from the spatialization of aggregated data to georeferenced grids, the current version and future updates of the database distributed here can provide local-scale information on specific geographic regions – information that is generally associated with lower uncertainty, specifically in countries with a large surface area where only small portions are used for agriculture.
3.1 Global and regional estimates
Global CNB surpluses (i.e., greater nutrient inputs than outputs) were recorded for all three plant nutrients in 2020, with nutrient loading of N, P and K progressively increasing over the 1961–2020 period, except for K across all cropland since 1961 (which decreased by 20 %) (Table 4; Fig. 1a, b). On a per-hectare basis N, P and K nutrient surpluses changed by 320 %, 110 % and −27 %, respectively, from 1961 to 2020 (Table 5).
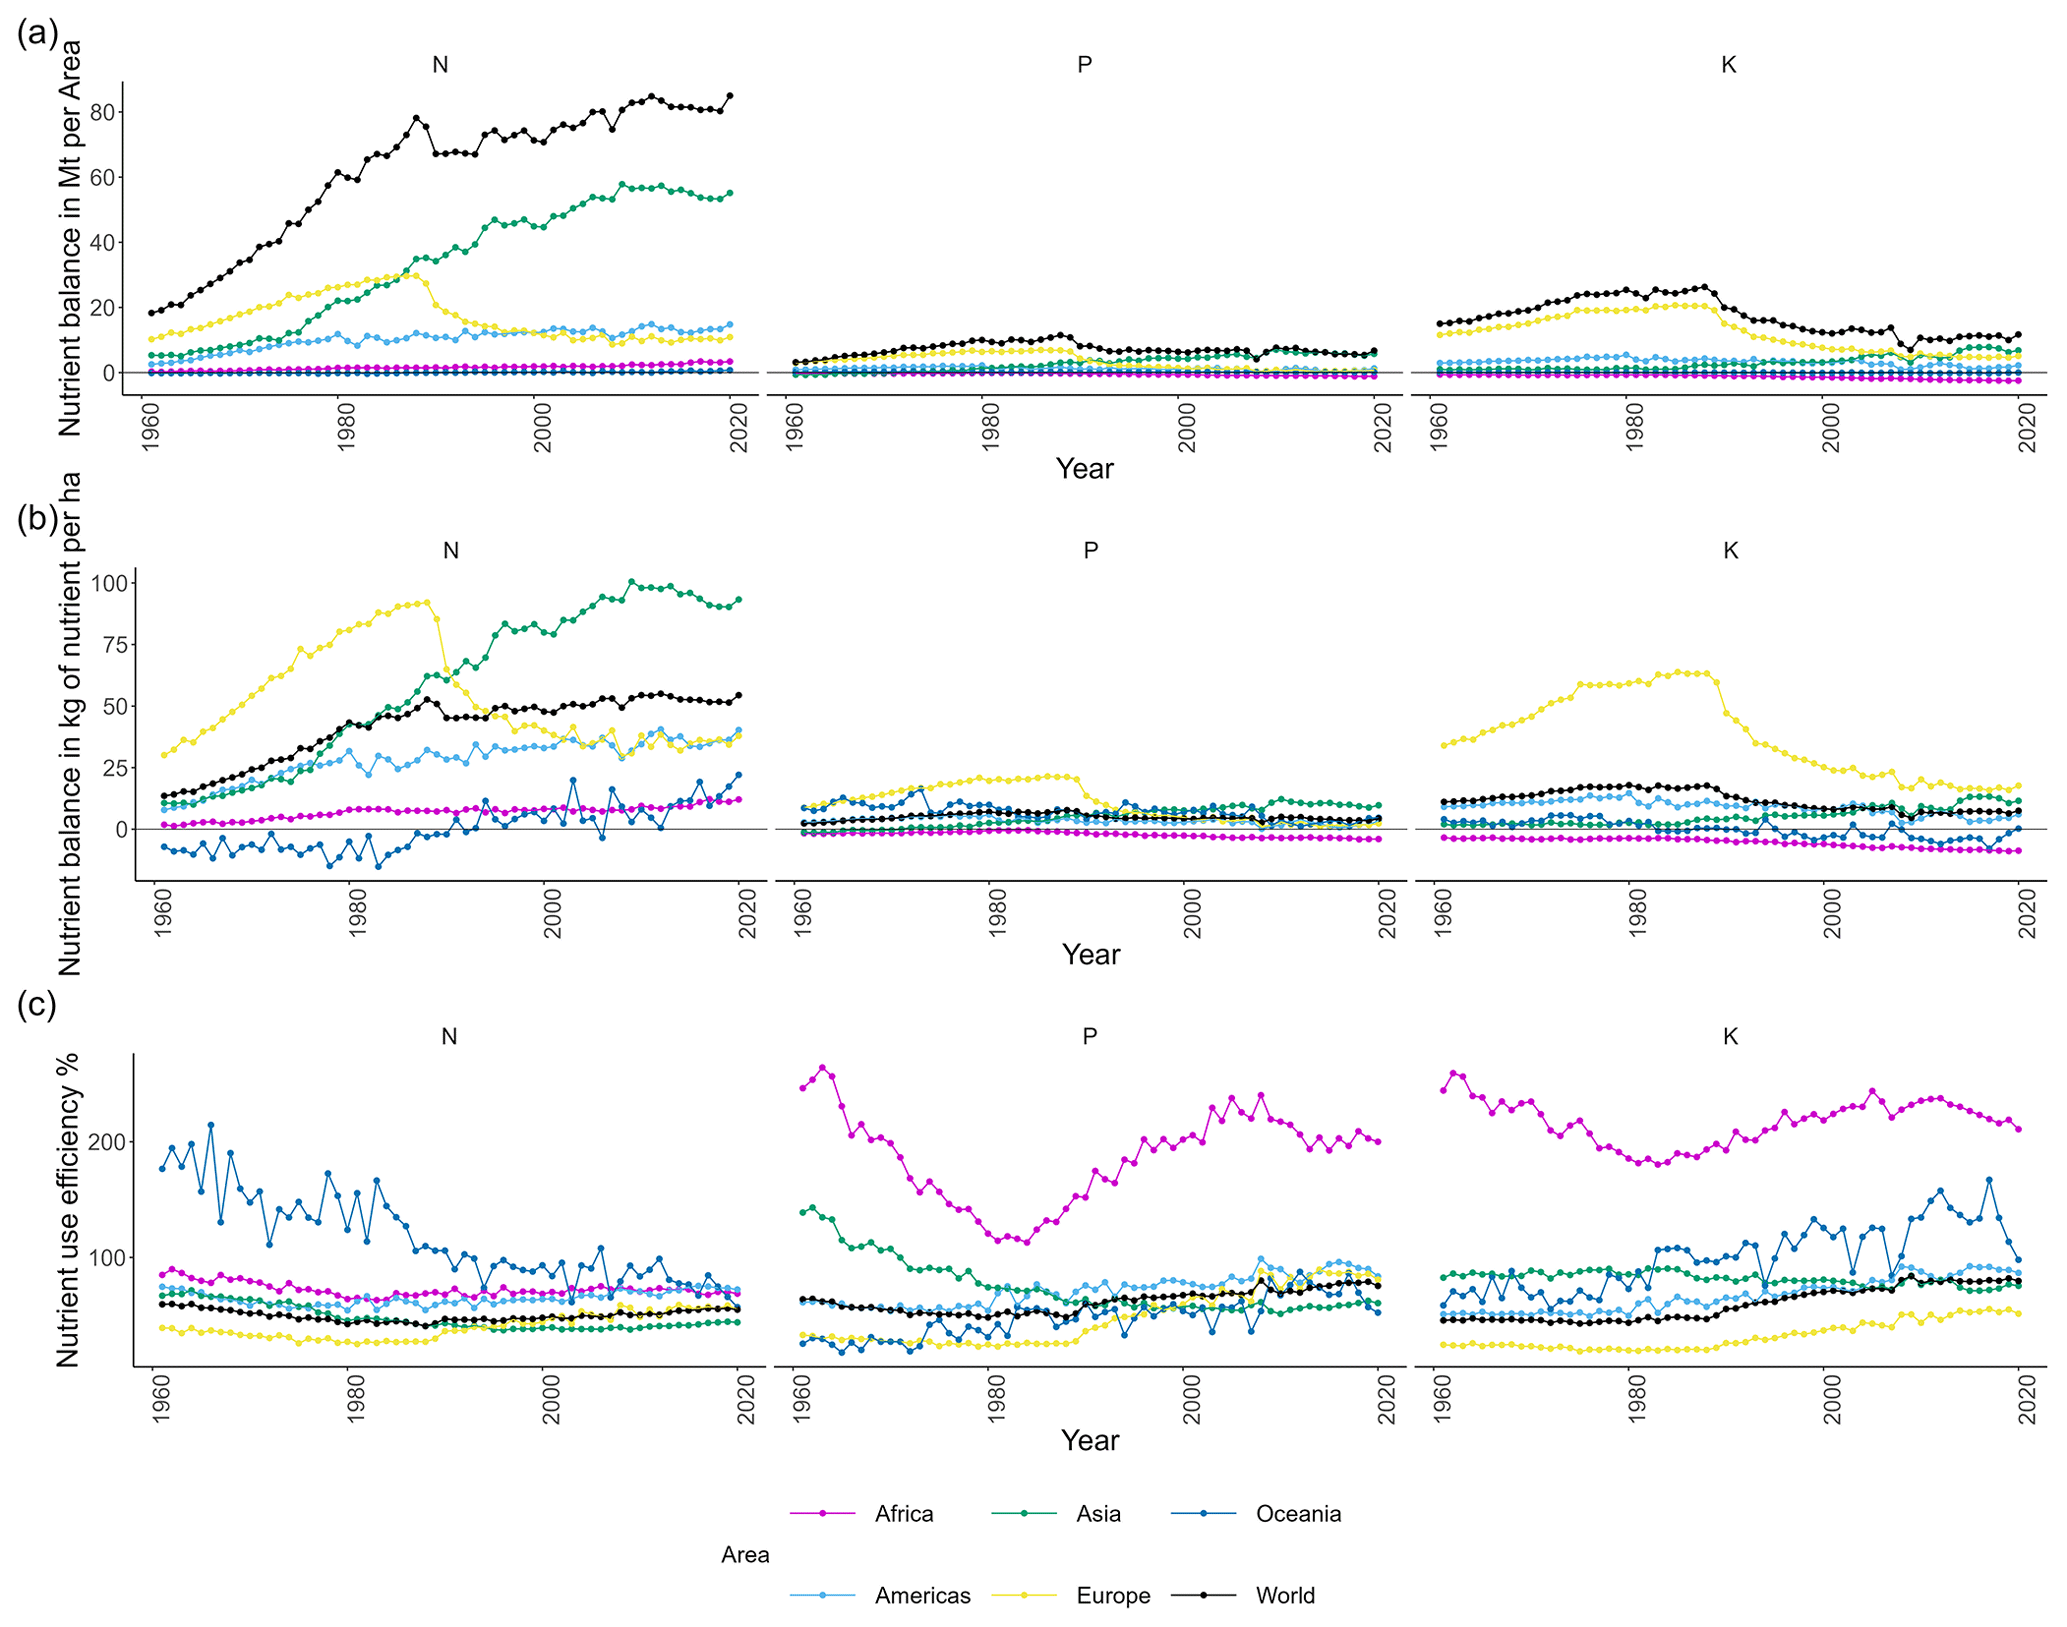
Figure 1The annual cropland nutrient balances (surpluses if positive or deficits if negative) in millions of tonnes (Mt) of nutrient per FAO area (a), in kilograms of nutrient per hectare (b) and with respect to the overall nutrient use efficiency percentage (c) for different FAO areas of the world for nitrogen (N), elemental phosphorus (P) and elemental potassium (K) from 1961 to 2020.
The greatest contributor to nutrient inputs in 2020 was SF, followed by biological N fixation for N and manure applied to the soil for P and K (Table 4). The greatest change in any input or output of nutrients (between 1961 and 2020) was the increase in use of SF, with changes of 1000 %, 370 % and 380 % estimated for N, P and K, respectively. In 1961, the main nutrient inputs were from livestock manures for all three plant nutrients. With the increase in SF use came a decrease in the relative importance of manure as a source of total N inputs. N inputs from manure went from contributing ∼38 % of the total N inputs in 1961 to ∼14 % in 2020 (Table 4). Over the same period, SF went from contributing 22 % of total N inputs to 58 % (Table 4).
The greatest absolute increases in global N balances were estimated between 1961 and 1988 (Fig. 1a, b), followed by a short-term decrease and then by a less marked increase over the last 3 decades until 2020. At the same time, there was a decreasing trend in N use efficiency from an overall value of 59 % in 1961 to 55 % in 2020 (Fig. 1c). In contrast, the P and K use efficiencies increased over the same period, in particular since the 1980s, from 64 % to 75 % for P and from 46 % to 80 % for K (Fig. 1c). Note that the nutrient use efficiency tends to become higher than 100 % when nutrient inputs are very low; this requires careful interpretation. It may either point to undesirable soil nutrient mining, e.g., in Africa where inputs have been historically low (Vitousek et al., 2009), or to some targeted (desired) soil depletion, e.g., in parts of northwestern Europe where excessive historical inputs of P have led to environmental problems (Einarsson et al., 2020).
The absolute values for the nutrient surplus of N (on a total and per-hectare basis) were consistently greater than values of P and K surpluses across the 1961–2020 period (Fig. 1a, b). K surpluses were consistently greater than P surpluses across the same period (Fig. 1a).
Table 4Global cropland nutrient balances and use efficiencies for nitrogen (N), phosphorus (P) and potassium (K), by component, for the years 1961 and 2020 (million tonnes). Values are rounded to 2 significant figures. Soil nutrient balance is defined as nutrient inputs minus nutrient outputs, while nutrient use efficiency is defined as nutrient outputs as a percentage of nutrient inputs.
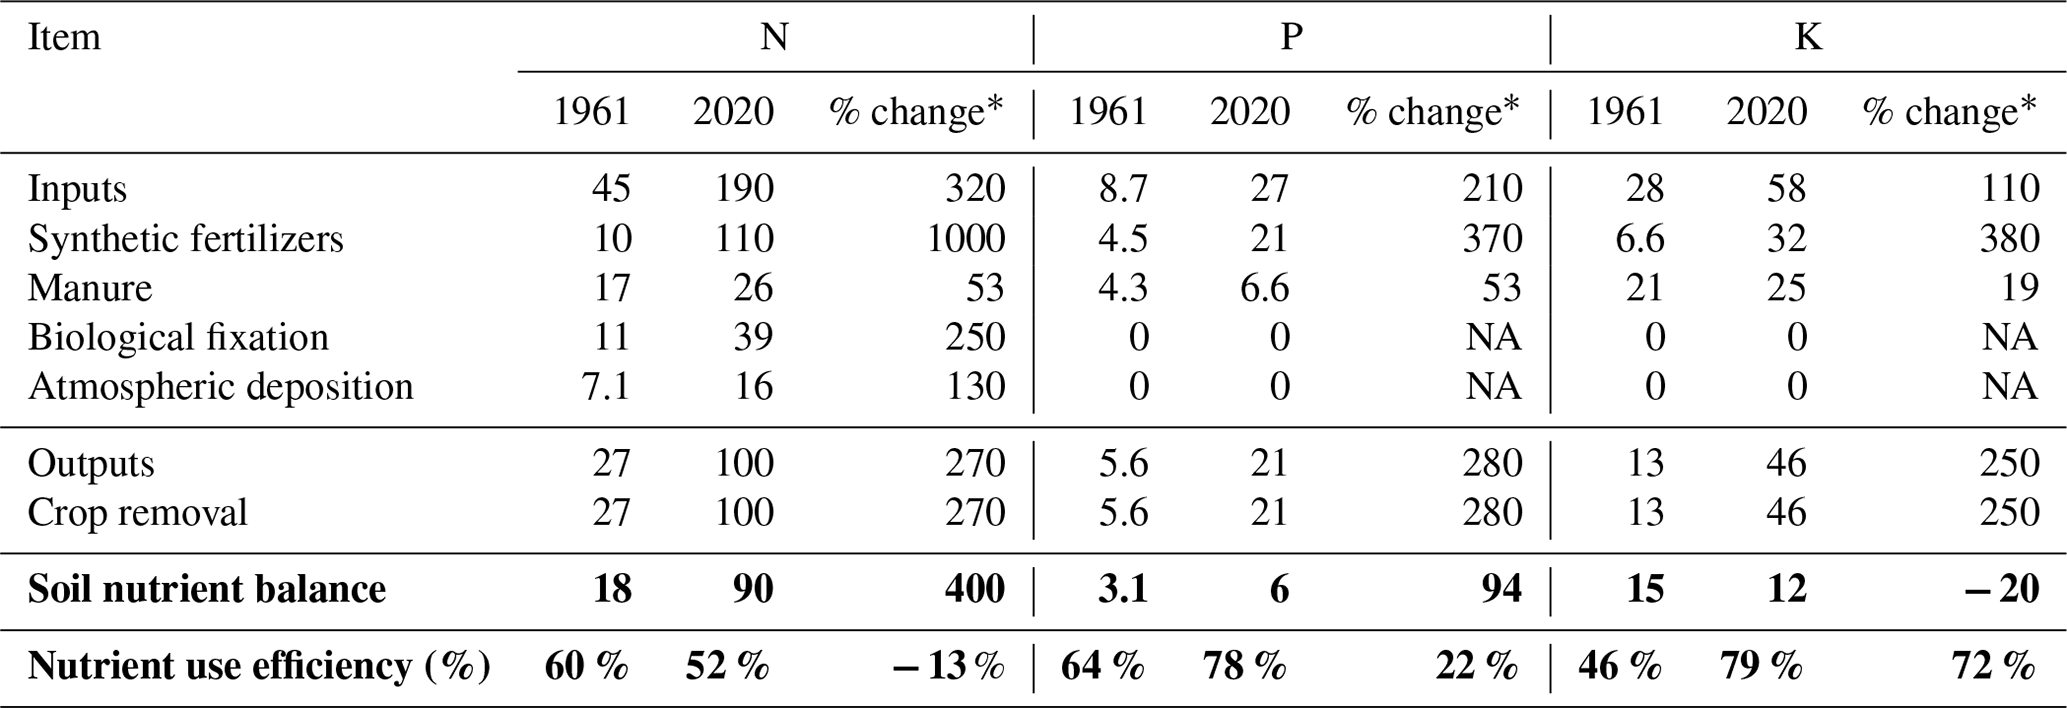
* Percentage difference between the 2020 and the 1961 values over the 1961 value. NA: not available.
Table 5Global cropland nutrient balances of nitrogen (N), phosphorus (P) and potassium (K), total and by component, for 1961 and 2020 (kg ha−1). Values are rounded to 2 significant figures. Soil nutrient balance is defined as nutrient inputs minus nutrient outputs.
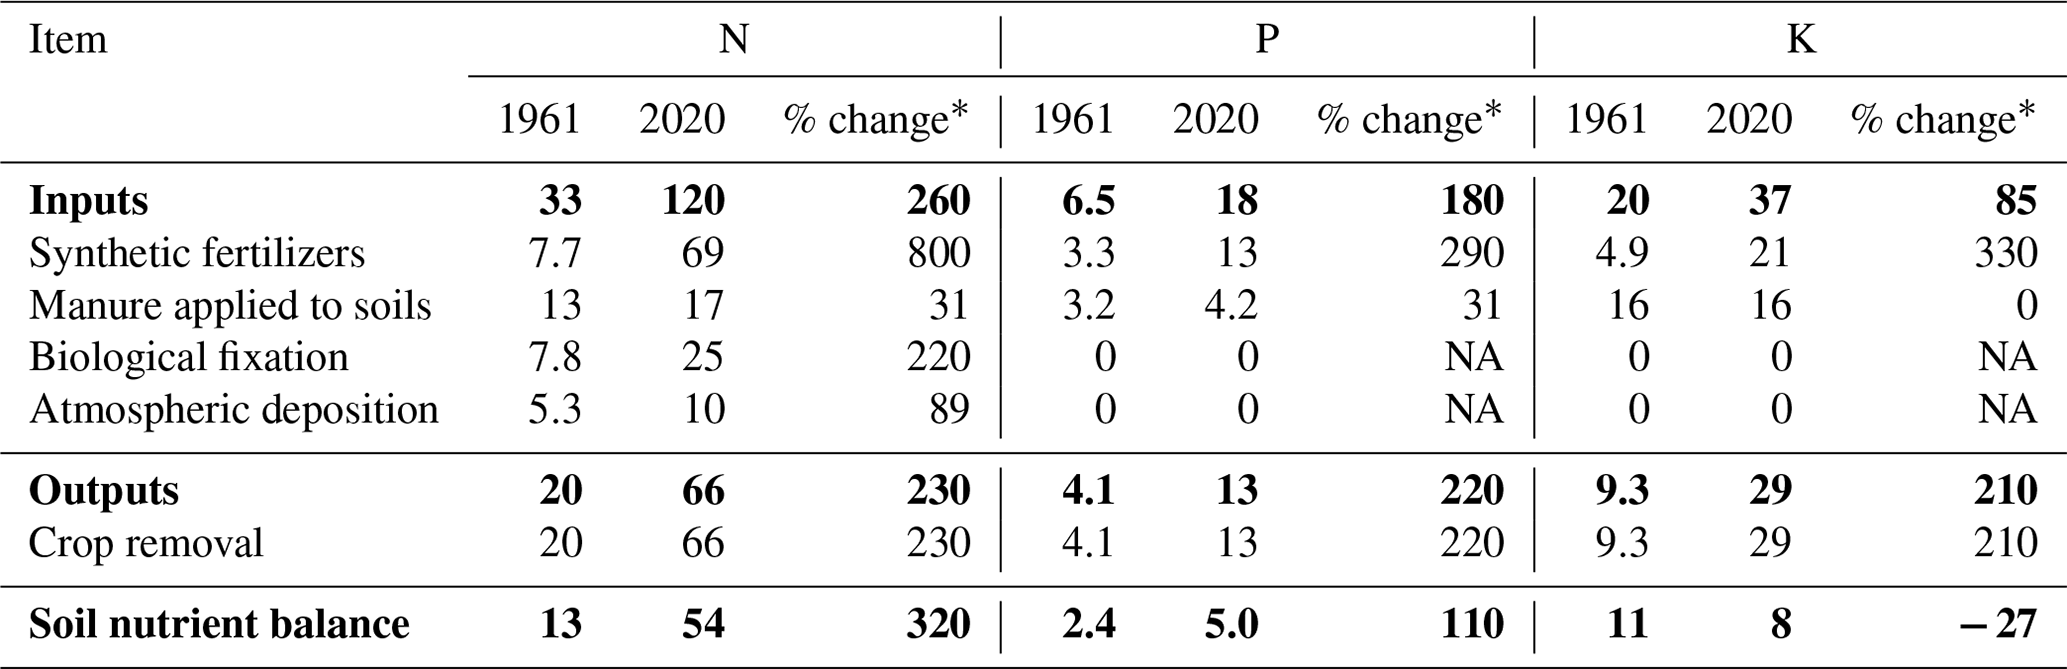
* Percentage difference between the 2020 and the 1961 values over the 1961 value. NA: not available.
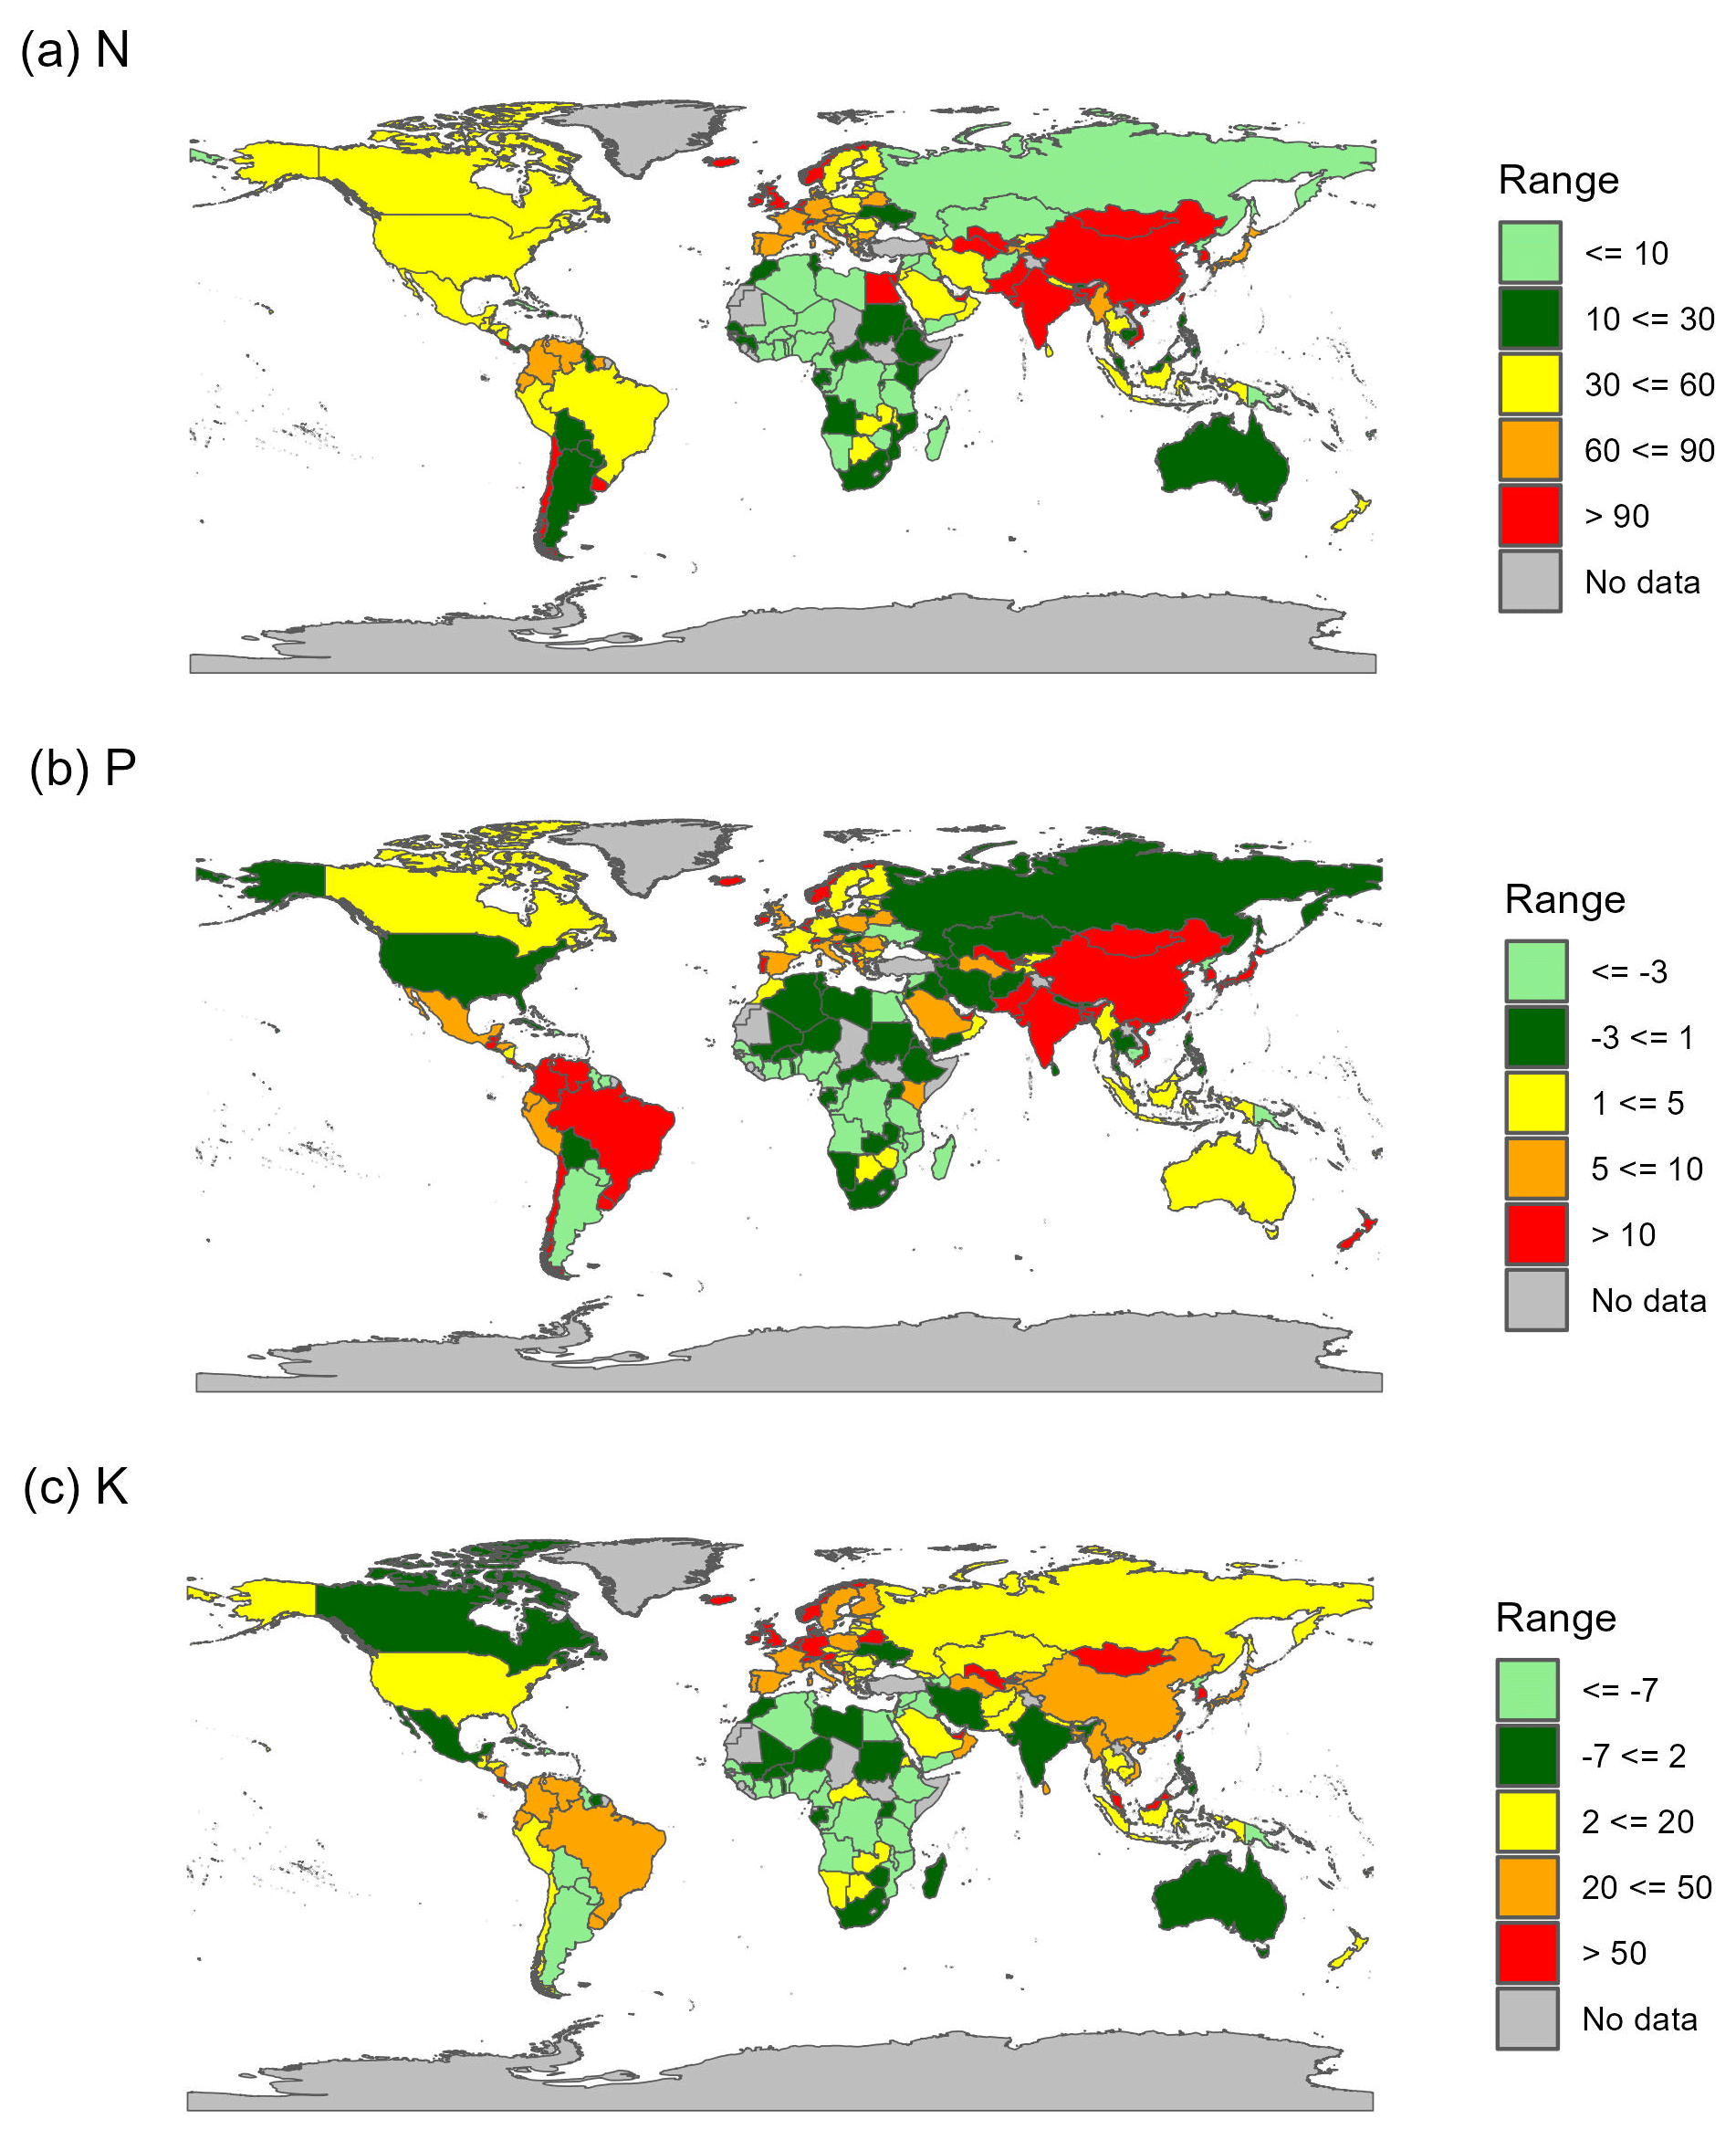
Figure 2Cropland nutrient balances (in kilograms of nutrient per hectare per year) for different areas of the world for (a) nitrogen (N), (b) elemental phosphorus (P) and (c) elemental potassium (K) for 2020. Colors are based on quantiles estimated to 2 significant figures. There is considerable uncertainty associated with these data; please refer to Sect. 2.3.2 for more details. The boundaries and names shown and the designations used on these maps do not imply the expression of any opinion whatsoever on the part of FAO concerning the legal status of any country, territory, city or area; its authorities; nor the delimitation of its frontiers and boundaries. Dashed lines on maps represent approximate border lines for which there may not yet be full agreement. The final boundary between Sudan and South Sudan has not yet been determined. The dotted line represents the approximate location of the Line of Control in Jammu and Kashmir agreed upon by India and Pakistan. The final status of Jammu and Kashmir has not yet been agreed upon by the parties.
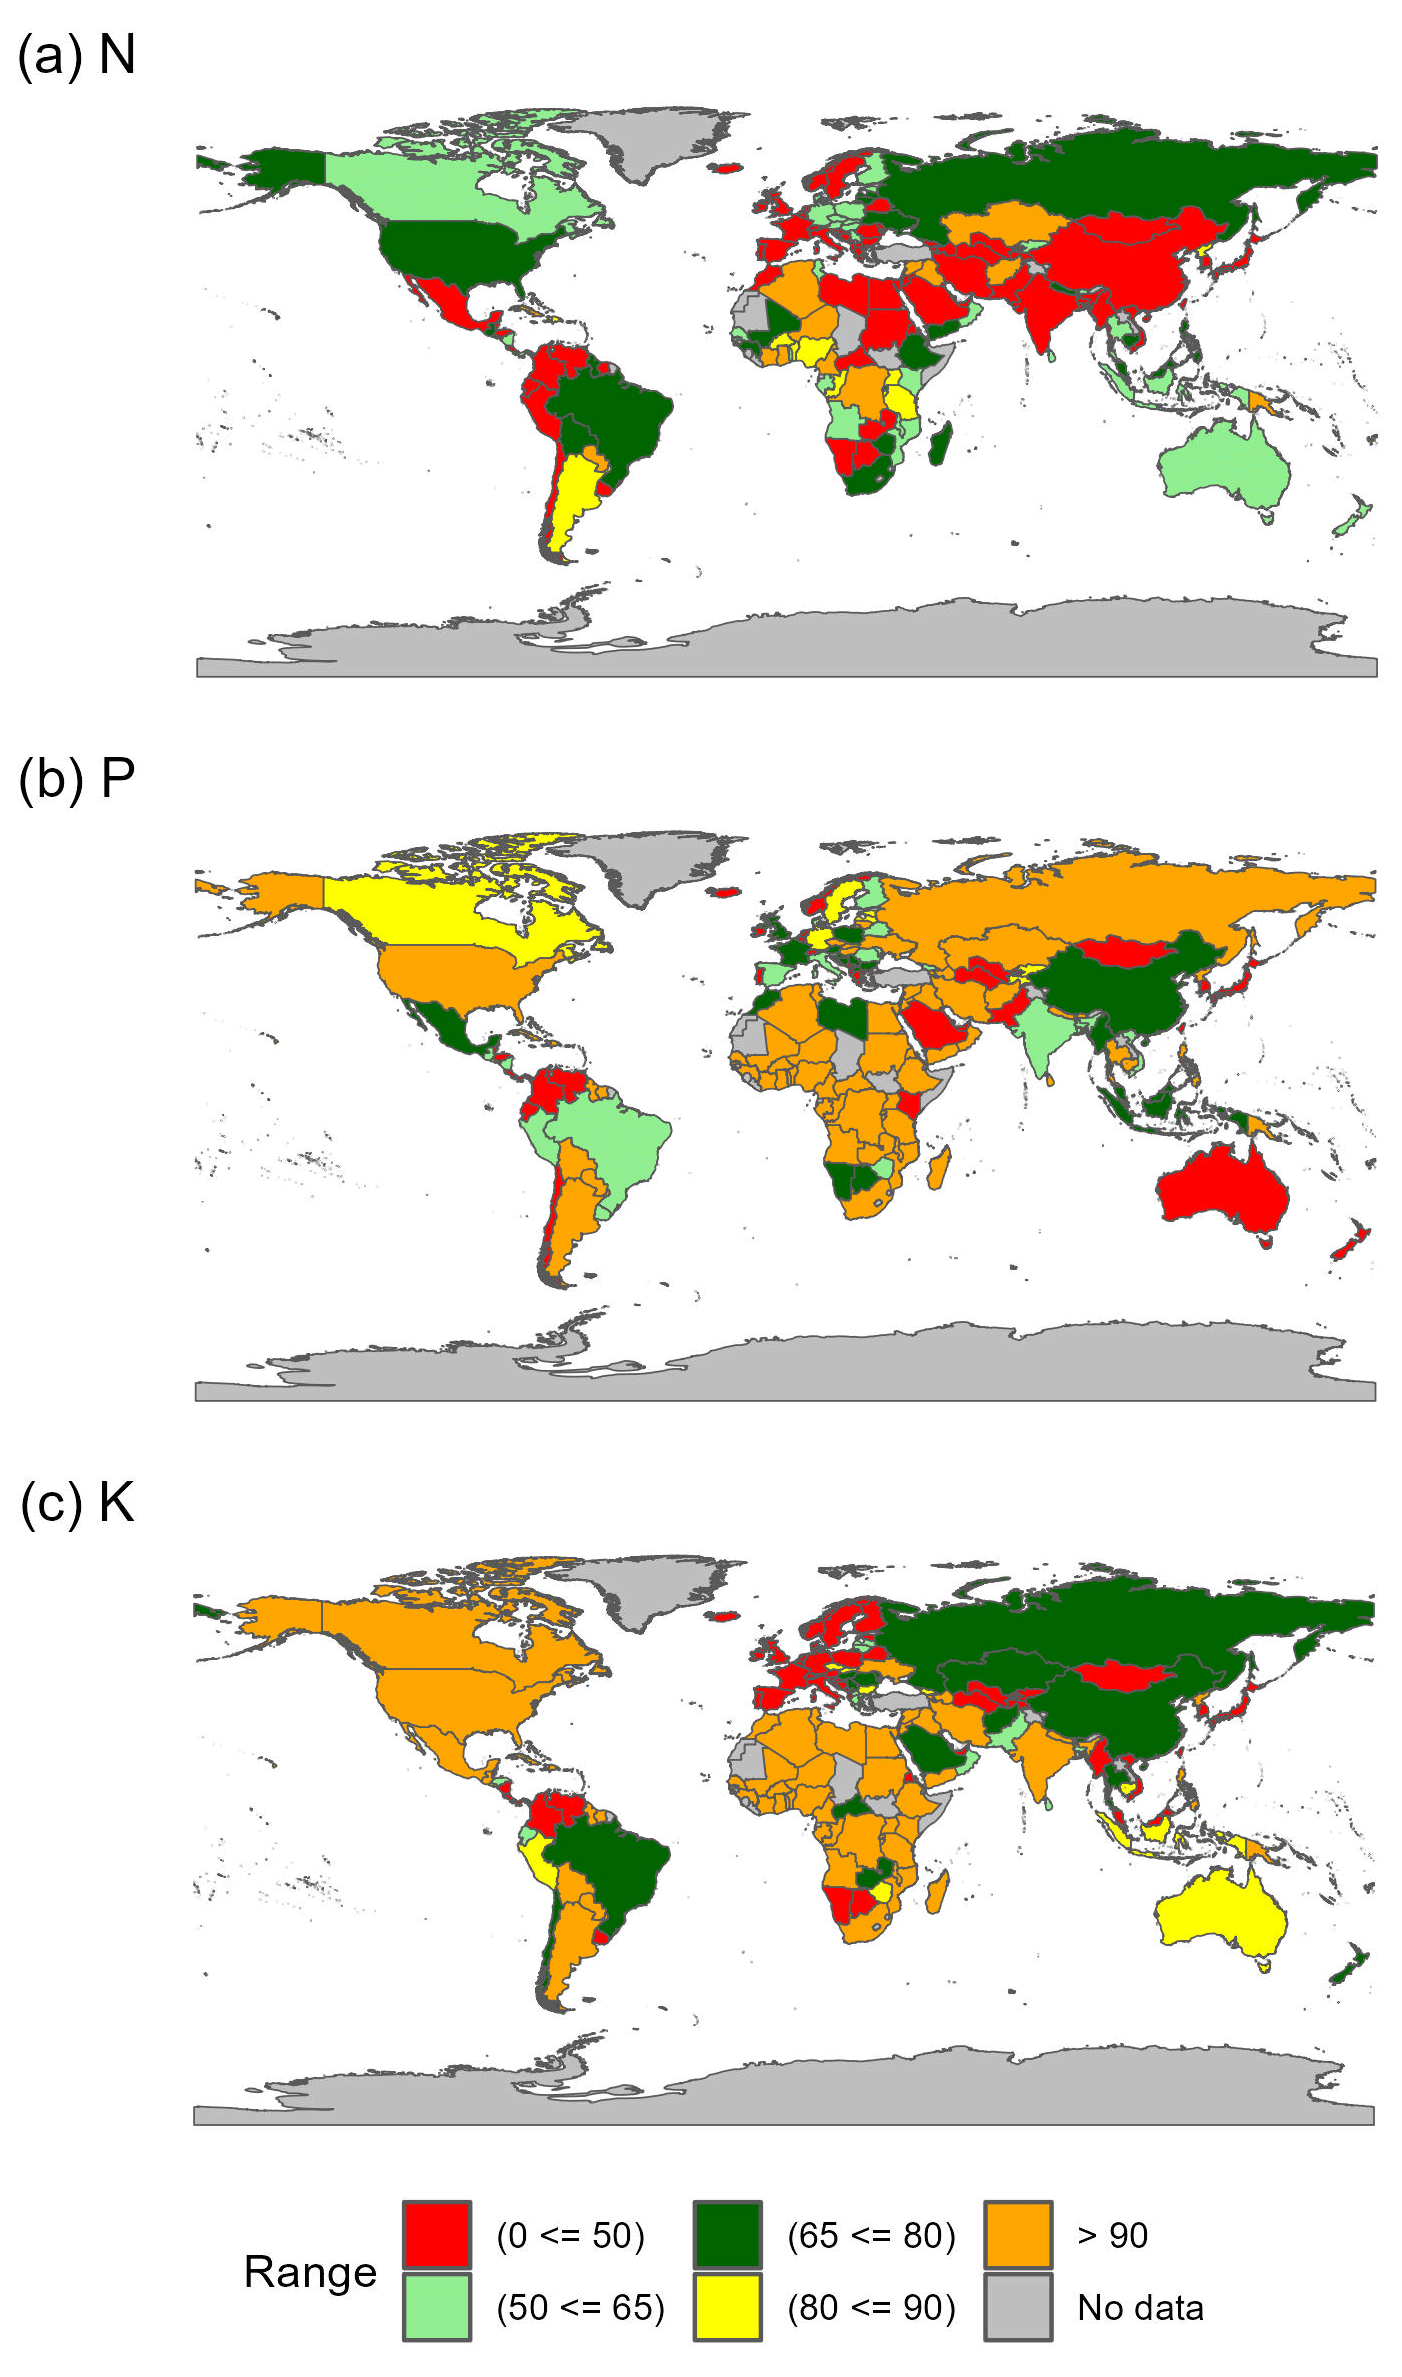
Figure 3Cropland nutrient use efficiency (in percent) for different areas of the world for (a) nitrogen (N), (b) elemental phosphorus (P) and (c) elemental potassium (K) for 2020. There is considerable uncertainty associated with these data; please refer to Sect. 2.3.2 for more details. The boundaries and names shown and the designations used on these maps do not imply the expression of any opinion whatsoever on the part of FAO concerning the legal status of any country, territory, city or area; its authorities; nor the delimitation of its frontiers and boundaries. Dashed lines on maps represent approximate border lines for which there may not yet be full agreement. The final boundary between Sudan and South Sudan has not yet been determined. The dotted line represents the approximate location of the Line of Control in Jammu and Kashmir agreed upon by India and Pakistan. The final status of Jammu and Kashmir has not yet been agreed upon by the parties. Nutrient use efficiency ranges were based on values suggested by the EU Nitrogen Expert Panel (2016).
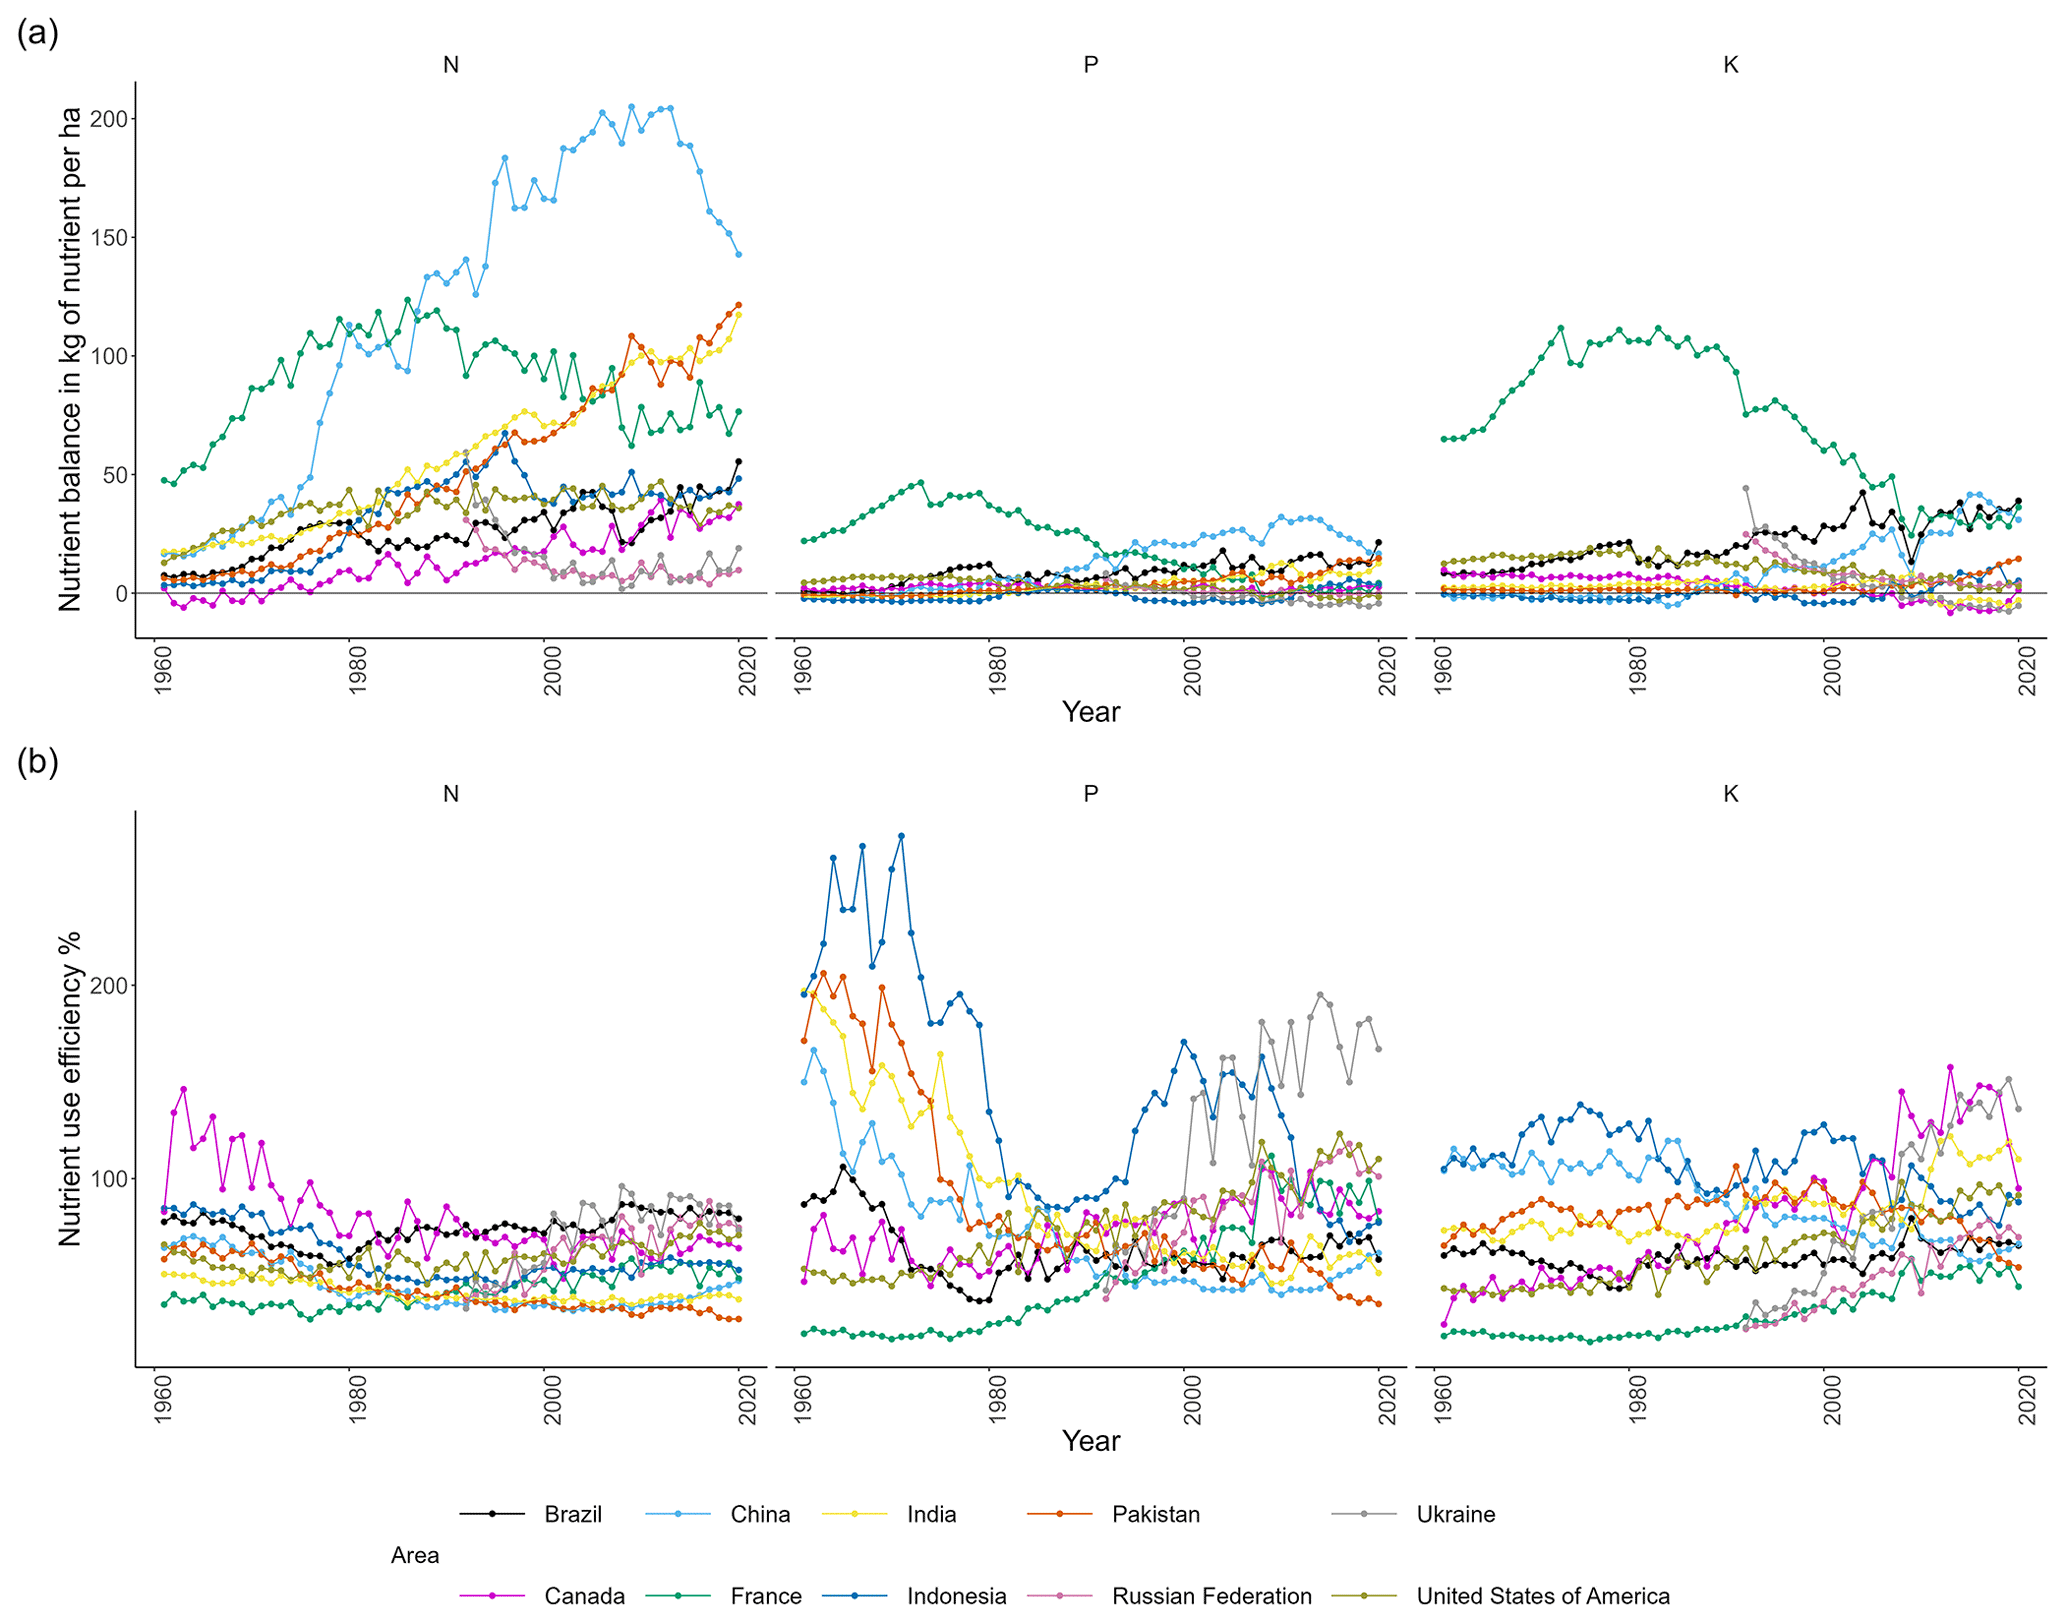
Figure 4The annual (a) cropland nutrient balances (surplus if positive and deficit if negative) in kilograms of nutrient per hectare and (b) overall nutrient use efficiency percentage for the top 10 countries (based on the greatest national nitrogen (N) fertilizer consumption in 2020) for N, elemental phosphorus (P), and elemental potassium (K) for 2020.
3.2 Country estimates
There was large heterogeneity in CNB values by country in 2020 (Fig. 2). Countries with N, P or K deficits or surpluses greater than the upper (80th) quantile are highlighted using red in Fig. 2, those with values between the 60th and 80th quantile are highlighted using orange, those with values between the 40th and 60th quantile are highlighted using yellow, those between the 20th and 40th quantile are highlighted using dark green, and those below the 20th quantile are highlighted using light green. Countries in Africa had cropland N surpluses of less than 40 kg ha−1 yr−1 (with the exception of Egypt with 200 kg ha−1 yr−1). Most European countries had N surpluses of between 40 and 80 kg N ha−1 yr−1, whereas some of the largest values were found in Asia. For instance, China and India had average N surpluses of 140 kg and 120 kg N ha−1 yr−1, respectively (Fig. 2). The total number of countries with negative N, P and K surpluses (nutrient deficits) was 14, 64 and 59 in 2020, respectively. It is important to note that extreme values for some countries may represent errors in the data collected for those countries (such as the SF use quantities), rather than (or in addition to) actual differences in agronomic performance. Maps of the total N, P and K inputs and outputs are available in Sect. S6.
In terms of nutrient use efficiency for 2020, the total number of countries with a nutrient use efficiency greater than 100 % was 14, 64 and 59 for N, P and K, respectively (Fig. 3). The total number of countries with a nutrient use efficiency of less than 50 % was 80, 44, and 59 for N, P and K, respectively. Combining information from Figs. 2 and 3, some countries show differences between their status for the nutrient balance and nutrient use efficiency. N in Kazakhstan, for example, is ranked lower in terms of the N balance (a deficit of 3 kg ha−1 yr−1), whereas it is ranked highly in terms of N use efficiency (a NUE of 120 %), indicating a risk of soil mining. Note, however, that orange colors in Fig. 3 (efficiencies exceeding 90 %) may be desirable in regions that have historically received large P or K applications that are causing environmental problems. Therefore, it is important to account for this context when evaluating the NUE of a specific country in the CNB.
Of the “top 10 countries” ranked based on the quantity of synthetic N fertilizer used per country in 2020, four were in Asia (China, India, Pakistan and Indonesia) (Fig. 4). Of these top 10 countries, France had the greatest N, P and K surpluses per hectare between 1961 and 1986 (with a surplus of ∼110 kg N ha−1 yr−1 in 1986) (Fig. 4a). After this point, the per-hectare N surpluses in China became greater than those in France. By 1995 and 2014, China started to have a greater P and K surplus than France: surpluses of 21 kg P ha−1 yr−1 and 35 kg K ha−1 yr−1 in China, respectively (Fig. 4a). There were generally negative trends in the N use efficiency for the top 10 countries over the 1961 to 2000 period, after which there was an overall stabilization of annual values (Fig. 4b). Exceptions to this negative trend for N were for Brazil and Ukraine, potentially caused by greater harvested areas of N-fixing soybeans. There was a greater range in P and K use efficiency over time compared with N use efficiency (Fig. 4b), with countries such as Indonesia having a greater than 200 % P use efficiency and greater than 100 % K use efficiency in some years between 1961 and 1980.
3.3 Major trends
Globally, the major trends seen in this analysis include the general increase in nutrient inputs and outputs of N, P and K during the period from 1961 to 2020, reflecting the increased scale and intensity of food production in most countries over the same period. The relative larger increase in the growth of inputs vs. outputs has concurrently resulted in greater nutrient surpluses for N and P, whereas K surpluses have decreased. This indicates that more emphasis has been placed globally on inputs of N and P compared with K, relative to removed nutrients. Many soils still have substantial native K resources, and the returns on investment for the application of K on cropland are often less than those obtained from applying N and P. Insufficient understanding of how deficient soils are in available K relative to other nutrients may also play a role.
Within the 1961 to 2020 time period, the fastest increase in annual N, P and K surpluses occurred between 1961 and 1988. This was followed by a fall in surpluses that was followed by relatively stable (for N) or declining trends in (P and K) balances on a total and per-hectare basis. The decline in fertilizer consumption the late 1980s/early 1990s was most likely caused by the breakup of the former Soviet Union and political changes in much of eastern Europe (FAO, 2022b). At the same time, there was also growing awareness of the environmental effects of unsustainable agricultural management practices in other parts of the world (Cassou, 2018). For example, in the late 1980s, the European Union (EU) started implementing policies that reduced direct payments, while there was an increase in payments linked to environmental objectives (Cassou, 2018). As a result, the EU N, P and K surpluses have decreased over the last 3 decades. For instance, the EU was estimated to have had respective decreases of about 40 %, 80 % and 60 % for N, P and K surpluses on a per-hectare basis. These tendencies initially impacted global trends, although they have been progressively counterbalanced by increasing surpluses in major countries such as China, India, Pakistan and Brazil, largely due to substantial increases in SF use in recent decades. For instance, the application rates in China, India, Pakistan and Brazil increased by 230 % (as a mean across countries and across N, P and K) between 1990 and 2020, and N, P and K surpluses increased by nearly 300 % (as a mean across those countries) over the same period.
3.4 Comparisons with previous studies
The general trends in N inputs, outputs, balances and use efficiencies over time in the present study were broadly consistent with estimates from previous studies (Fig. 5a, b, c and d, respectively), with some exceptions. Over the 1961 to 2020 period, estimates of N inputs from the current study were “mid-range” compared with the other studies (Fig. 5a), but N outputs were generally greater than those estimated from other studies (Fig. 5b). This resulted in estimates of N balances over time that were mid-range compared with other studies (Fig. 5c) as well as N use efficiencies that were generally greater than estimates from other studies (Fig. 5d). Multiple factors could have contributed to the inter-study variation in indicators shown in Fig. 5. Firstly, FAOSTAT crop production and fertilizer data have been updated since the previous studies were published. Any changes in historic crop production and fertilizer input data will contribute to differences in estimates of total N outputs and N inputs, respectively. To put this into context, Zhang et al. (2021) indicated that the FAOSTAT value for China's N fertilizer use was 10×106 t yr−1 lower based on the 2017 version of the data compared with the 2000 version. In addition, variation in estimates of the N concentration of the crop product for each crop species between studies will result in variation in the estimated N outputs. A summary of existing parameters of N content by crop type has shown large divergence among studies (Zhang et al., 2020), and some studies also do not account for the N content in the crop types that have limited data. Taking advantage of existing data, the present study developed and used gap-filled crop product nutrient concentrations, but future research is needed to improve the availability and quality of such data.
Table 6Comparison (of mean annual application) of manure nitrogen (N), elemental phosphorus (P) and elemental potassium (K) to cropland (in millions of tonnes, Mt) in China for the period from 2005 to 2014 using data from the current study and from Zhang et al. (2023).
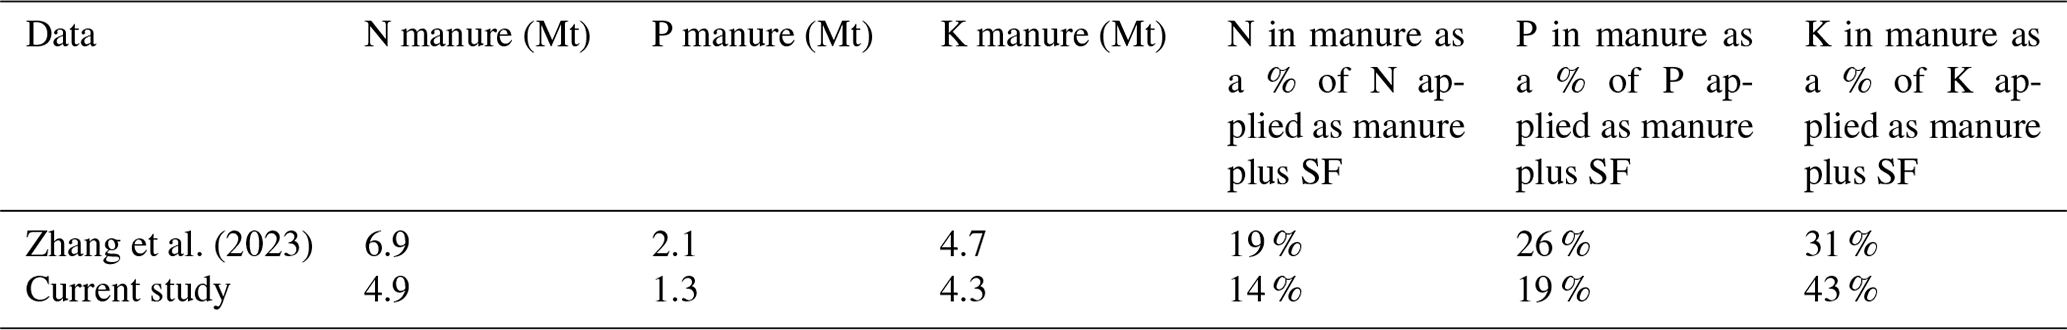
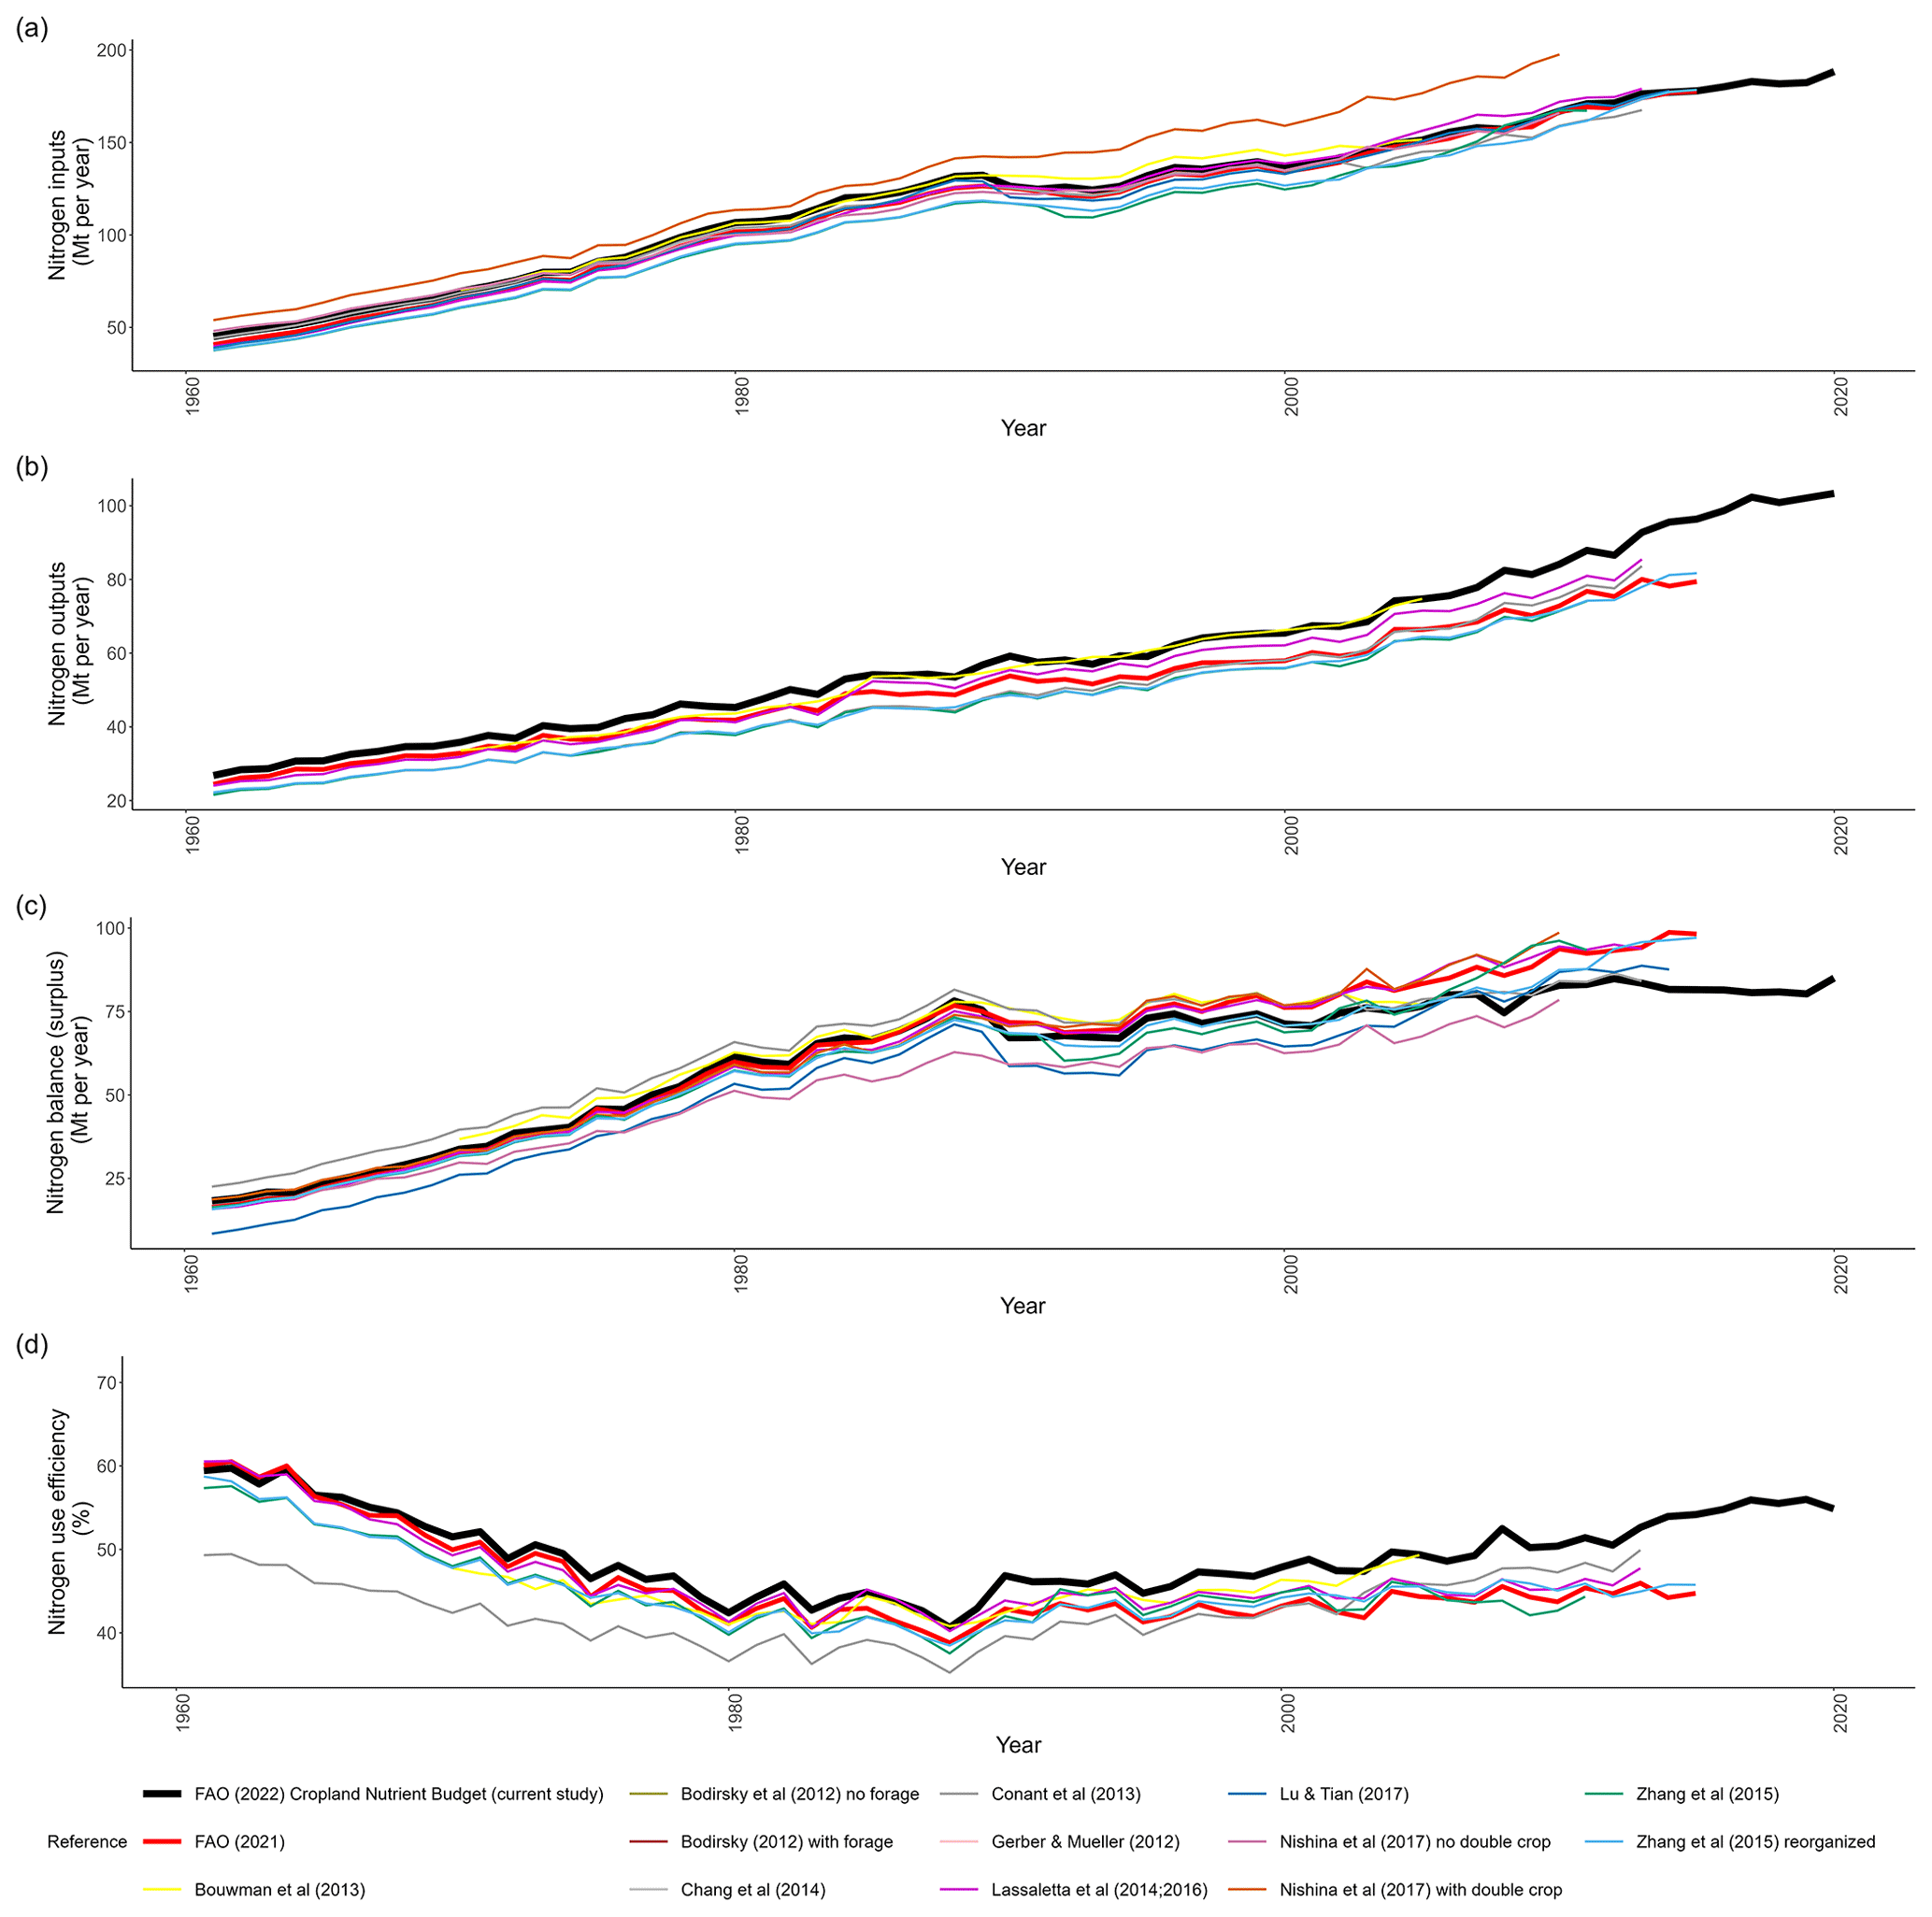
Figure 5Comparisons of global cropland nitrogen (a) inputs, (b) outputs, (c) surplus and (d) nitrogen use efficiency for 1961–2020 according to various estimates. Non-FAO data (Zhang et al., 2015; Conant et al., 2013; Lassaletta et al., 2014; Mueller et al., 2012; FAO, 2021; Bodirsky et al., 2012; Bouwman et al., 2013; Lassaletta et al., 2016; Lu and Tian, 2017; Nishina et al., 2017) were sourced from Zhang et al. (2021).
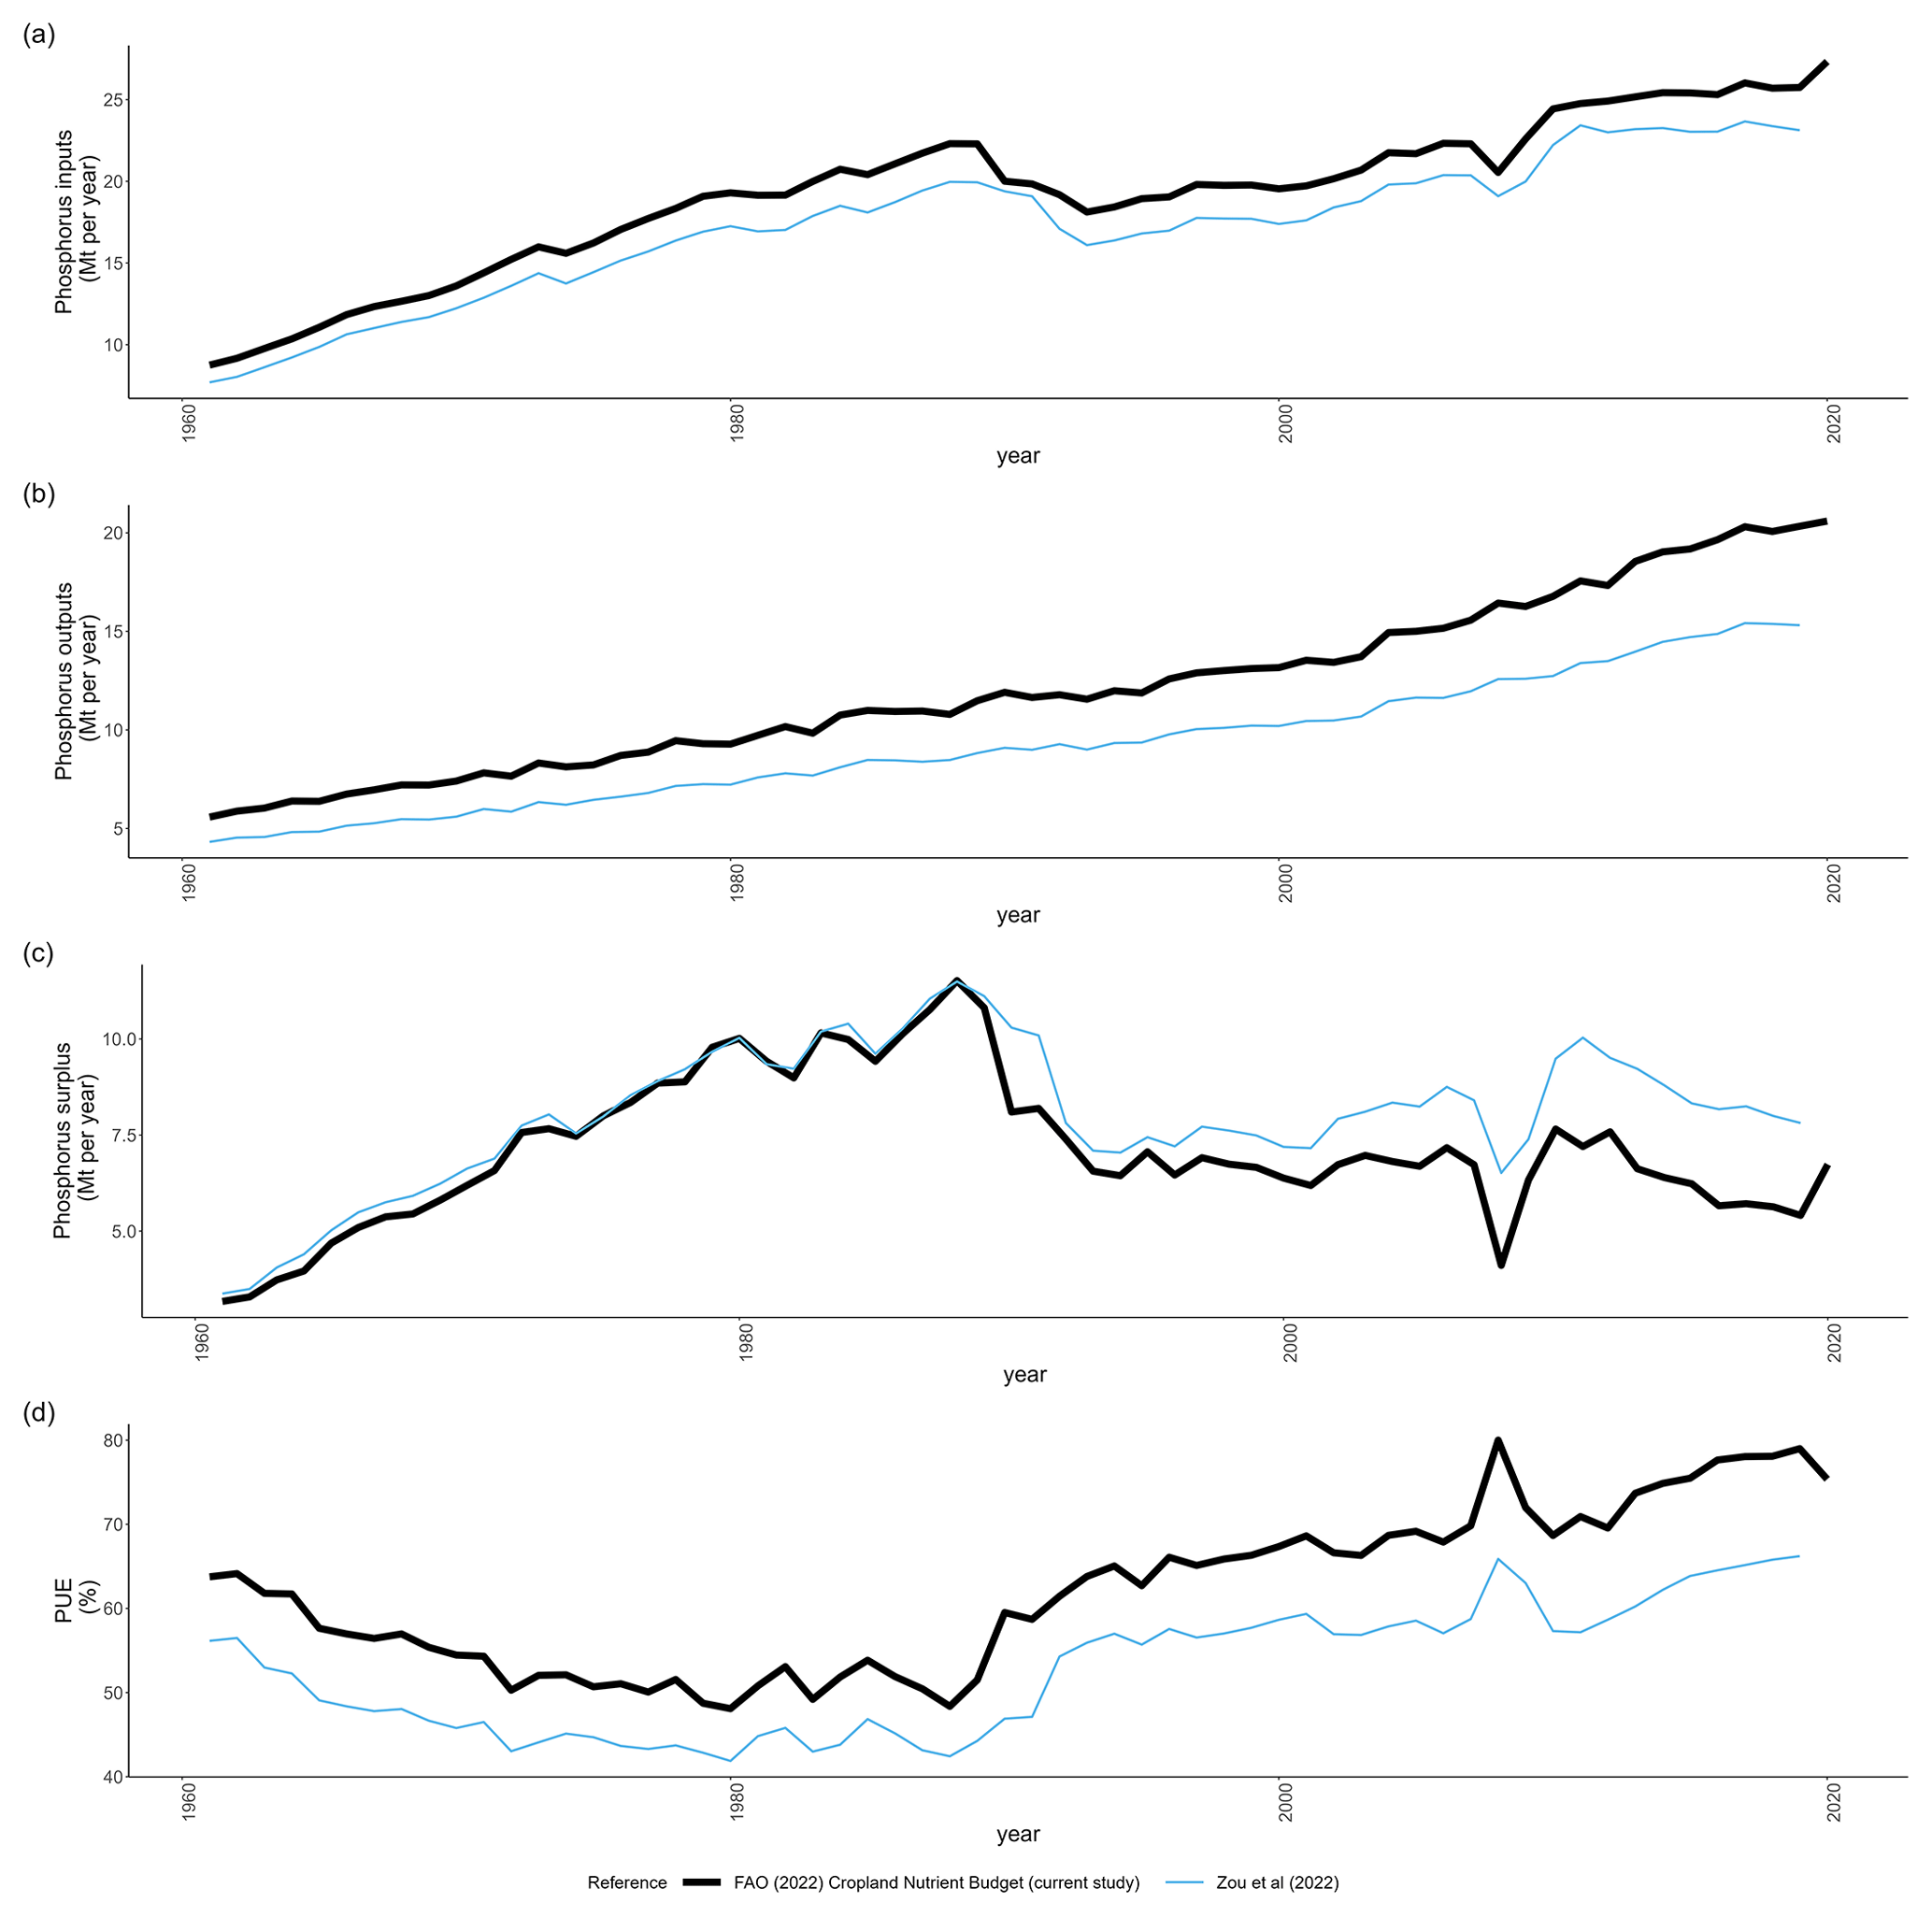
Figure 6Comparison of global cropland phosphorus (a) inputs, (b) outputs, (c) surplus and (d) phosphorus use efficiency for 1961–2020 from this study and from Zou et al. (2022).
Notwithstanding the potential sources of difference in absolute estimates, all previous studies estimated the fastest increase in N surpluses between 1961 and around 1988, a drop in N surpluses for a few years, and a subsequent less steep increase until 2020 (Fig. 5c). N use efficiency decreased from 1961 until around 1988, followed by an increase in N use efficiency until 2020. Similar trends over time predicted by the various models in Fig. 5 may be attributed to the fact that many of the models used similar sources of data. For example, 5 of the 10 other models included in Fig. 5 used FAOSTAT cropland area data, 8 of the 10 used FAOSTAT fertilizer use data and at least 4 of the 10 used FAOSTAT crop production data. Many of the models included in Fig. 5 used similar sources of data; therefore, the variation in the overall N balance values will not fully account for the variation and uncertainty in estimates of key parameters. As described in Sect. 2.1, some of the most important parameters for estimating CNB at a country and global level did not have excessively high uncertainty (e.g., cropland area CV % of ∼25 %, crop production CV % of ∼7 % and fertilizer use and crop removal CV % of ∼20 %). Parameters with the most uncertainty (e.g., N deposition with a CV % of ∼70 %) contributed only a small amount to the total N balance (<10 kg N ha−1 yr−1 on average across the world). This highlights the importance of focusing on refining estimates of the four most influential parameters used in the CNB, namely, cropland areas, crop production quantities, fertilizer use and crop nutrient coefficients.
Estimates of the current study for total N, P and K applied as manure in China were generally less than those estimated using farmer survey data across the same period by Zhang et al. (2023) (Table 6). Consequently, manure N and P as a percentage of N and P applied as manure plus SF from the current study were less than those estimated by Zhang et al. (2023). Manure K as a percentage of K applied as manure plus SF from the current study was greater than that estimated by Zhang et al. (2023). The scale of the variation in values between the two studies shown in Table 6 is not surprising given the known uncertainties in the estimates of manure and SF application rates for China (Ludemann et al., 2022a). New datasets like those from Zhang et al. (2023) will be evaluated regarding how well they may improve the CNB and, when found useful, will be incorporated into future iterations of the FAOSTAT data product.
The general trends in P inputs, outputs, balances (surpluses and deficits) and use efficiencies over time in the present study were broadly consistent with estimates from Zou et al. (2022) (Fig. 6a, b, c and d, respectively). However, P inputs and outputs and the phosphorus use efficiency (PUE) estimated in the current study were generally greater than those estimated by Zou et al. (2022). Concurrently, the P surplus was estimated as being less in the current study than in Zou et al. (2022), and the difference in estimates increased after 1990 and especially after 2008, when the Zou et al. (2022) estimates became substantially greater than our current estimates.
Zou et al. (2022) used the same FAO (2022d) areas of cropland and fertilizer input values as those used in the current study, indicating that crop P removal is the main contributor with respect to these differences in values. Estimates of the concentration of P in crop products used in the present study were generally greater than those used by Zou et al. (2022). This explains why crop P removal (outputs) and PUE in the present study are greater than those estimated by Zou et al. (2022). For example, of the major crops in the current study, rice, soybeans and maize had 12 %, 30 % and 18 % greater P concentrations than those reported in Zou et al. (2022). Concentrations of P in wheat and barley in the current study were estimated as being 4 % and 2 % less than those used by Zou et al. (2022).
A reason that the estimates of P inputs by Zou et al. (2022) are less than those in the current study is that Zou et al. (2022) used a different method to assign the fraction of total fertilizer used in agriculture to cropland. Zou et al. (2022) assumed that the fractions of P fertilizer used for cropland are the same as the fractions of N fertilizer used for cropland, following Zhang et al. (2015). In addition, the FAO has updated its fertilizer input data since the Zou et al. (2022) study was published. This may also have contributed to these differences in P inputs.
The CNB data presented in this study cover the period from 1961 to 2020 at the country level, with aggregates made at the regional and global scales. These data are available from https://doi.org/10.5061/dryad.hx3ffbgkh (Ludemann et al., 2023b) and from the FAOSTAT cropland nutrient budget database (https://www.fao.org/faostat/en/#data/ESB, FAO, 2022a). The R code used to create the tables and figures in this article can be accessed via the following Zenodo repository: https://doi.org/10.5281/zenodo.10491879 (Ludemann, 2023).
Further information on the derivation of cropland fraction estimates for N, including our analytical code, can be accessed via the following Zenodo repository: https://doi.org/10.5281/zenodo.10511851 (Jackson, 2024).
A new reference database of cropland nutrient budgets has been detailed in this paper. The data are available in FAOSTAT for the time period from 1961 to 2020, with plans for annual updates and continuous methodological improvements. Insights gained from these data include the quantification of the hotspot areas from which there may be a surplus or insufficiency of N, P or K nutrients. For example, all world regions apart from Oceania and Africa showed some, to substantial, N surpluses until 2020. This is a reflection of the broader trend toward greater SF N use over that period. However, there were P and K deficits for Africa and K deficits for the Americas during the same period. Over time, Europe's relative importance in terms of the overall contribution to N balances was surpassed by Asia (in particular China) in the 1980s. Increasing trends in N surpluses have also been shown in other studies, albeit with considerable variation in the absolute values each year due to differences in the model setups and sources of data used. Our estimated trends in the NUE over time broadly aligned with other studies, except that our NUE values were generally greater than those from other studies. This was a consequence of our estimated N outputs being greater than those of other studies. While there was considerable uncertainty (∼72 % expressed as a CV) associated with some contributing components to the CNB calculation in the present study, the components with most uncertainty generally had the least influence on the overall CNB values. The most influential parameters with respect to the estimates of CNB included cropland area, crop production, fertilizer use and crop removal coefficients; therefore, these factors should be prioritized for improved accuracy in the future. It is also important to note that limitations regarding the availability of data could have a substantial effect on estimates of overall nutrient balance or nutrient use efficiency for cropland for some countries. This is especially important in relation to how nutrients (from fertilizers and manure) are assigned to areas of forage and fodder crops and the nutrient offtake from these crops as well as in relation to exports of manure from livestock to other countries and manure application to permanent meadows and pastures. Therefore, further refinements will be an ongoing area of development in future iterations of the FAO CNB.
The supplement related to this article is available online at: https://doi.org/10.5194/essd-16-525-2024-supplement.
CIL collated the manure and crop nutrient removal coefficients, performed the analysis of data, and wrote the manuscript. NW, GOL and FNT developed the UN FAO cropland budget (https://www.fao.org/faostat/en/#data/ESB, last access: 5 November 2022), performed the analysis of data and wrote the manuscript. SV analyzed the N deposition data and wrote the N deposition section (Sect. 2.2). RE analyzed the biological N fixation data and wrote the biological N fixation in Sect. 2.2. AG analyzed the fertilizer use data. KJ and XZ analyzed the fraction of N fertilizer applied to cropland data.
All authors were part of a UN FAO cropland nutrient budget steering group that determined how the database was developed. They also all edited and approved the final article for submission.
At least one of the (co-)authors is a member of the editorial board of Earth System Science Data. The peer-review process was guided by an independent editor. Achim Dobermann and Cameron I. Ludemann received financial support from the International Fertilizer Association.
Publisher's note: Copernicus Publications remains neutral with regard to jurisdictional claims made in the text, published maps, institutional affiliations, or any other geographical representation in this paper. While Copernicus Publications makes every effort to include appropriate place names, the final responsibility lies with the authors. Regarding the maps used in this paper, please note that Figs. 2 and 3 contain disputed territories.
Achim Dobermann and Cameron I. Ludemann received financial support from the International Fertilizer Association. Luis Lassaletta received funding from the Spanish Ministry of Science, Innovation and Universities within the framework of the AgroSceNA-UP project (PID2019-107972RB-I00). Kevin Jackson received financial support from the Food and Agriculture Organization. Francesco N. Tubiello and Nathan Wanner received funding from the Swiss Federal Office of Agriculture to FAO Statistics Division, which made this work possible.
This paper was edited by Zhen Yu and reviewed by Peiyu Cao and one anonymous referee.
Bodirsky, B. L., Popp, A., Weindl, I., Dietrich, J. P., Rolinski, S., Scheiffele, L., Schmitz, C., and Lotze-Campen, H.: N2O emissions from the global agricultural nitrogen cycle – current state and future scenarios, Biogeosciences, 9, 4169–4197, https://doi.org/10.5194/bg-9-4169-2012, 2012.
Bouwman, A. F., Beusen, A. H. W., Lassaletta, L., van Apeldoorn, D. F., van Grinsven, H. J. M., Zhang, J., and Ittersum van, M. K.: Lessons from temporal and spatial patterns in global use of N and P fertilizer on cropland, Sci. Rep.-UK, 7, 40366, https://doi.org/10.1038/srep40366, 2017.
Bouwman, L., Klein Goldewijk, K., van der Hoek, K. W., Beusen, A. H., van Vuuren, D. P., Willems, J., Rufino, M. C., and Stehfest, E.: Exploring global changes in nitrogen and phosphorus cycles in agriculture induced by livestock production over the 1900–2050 period, P. Natl. Acad. Sci. USA, 110, 20882–20887, 2013.
Cassou, E.: The greening of farm support programs: international experiences with agricultural subsidy reform, The World Bank, 68, https://documents1.worldbank.org/curated/en/827371554284501 204/pdf/The-Greening-of-Farm-Support-Programs-International-Experiences-with-Agricultural-Subsidy-Reform.pdf (last access: 10 October 2023), 2018.
Cobo, J. G., Dercon, G., and Cadisch, G.: Nutrient balances in African land use systems across different spatial scales: A review of approaches, challenges and progress, Agricult. Ecosyst. Environ., 136, 1–15, https://doi.org/10.1016/j.agee.2009.11.006, 2010.
Conant, R. T., Berdanier, A. B., and Grace, P. R.: Patterns and trends in nitrogen use and nitrogen recovery efficiency in world agriculture, Global Biogeochem. Cycles, 27, 558–566, https://doi.org/10.1002/gbc.20053, 2013.
Einarsson, R.: Biological nitrogen fixation in cropland (v1.3), Zenodo [data set], https://doi.org/10.5281/zenodo.7133340, 2023a.
Einarsson, R.: Source code for estimation of cropland biological nitrogen fixation (v1.3), Zenodo [code], https://doi.org/10.5281/zenodo.7133336, 2023b.
Einarsson, R., Pitulia, D., and Cederberg, C.: Subnational nutrient budgets to monitor environmental risks in EU agriculture: calculating phosphorus budgets for 243 EU28 regions using public data, Nutrient Cycling in Agroecosystems, https://doi.org/10.1007/s10705-020-10064-y, 2020.
Einarsson, R., Sanz-Cobeña, A., Aguilera, E., Billen, G., Garnier, J., van Grinsven, H., and Lassaletta, L.: Crop production and nitrogen use in European cropland and grassland 1961–2013, Sci. Data, 8, 1–30, https://doi.org/10.1038/s41597-021-01061-z, 2021.
EU Nitrogen Expert Panel: Nitrogen Use Efficiency (NUE) – an indicator for the utilization of nitrogen in agriculture and food systems, Wageningen University, Alterra, PO Box 47, 6700 Wageningen, the Netherlands, 2016.
FAO: Soil Nutrient Budget. Global, regional and country trends 1961–2018, FAOSTAT Analytical Brief Series No 20, FAO, Rome, 13, 2021.
FAO: Cropland nutrient budget, https://www.fao.org/faostat/en/#data/ESB (last access: 5 November 2022), 2022a.
FAO: Cropland nutrient budget: Gobal, regional and country trends, 1961–2020, FAOSTAT analytical brief no. 52, edited by: d'Ortigue, O. L., Gnetti, C., and Gordon, A., FAO, Rome, 14, https://www.fao.org/3/cc2904en/cc2904en.pdf (last access: 1 December 2022), 2022b.
FAO: FAOSTAT Domain manure Applied to Soils. Methodological note, release October 2022, FAO,, Rome, Italy, 5, https://fenixservices.fao.org/faostat/static/documents/GU/GU_e.pdf (last access: 1 November 2022), 2022c.
FAO: Land use statistics and indicators. Global, regional and country trends- 2000–2020. Analytical brief no. 48, FAO, Rome, https://www.fao.org/3/cc0963en/cc0963en.pdf (last access: 27 March 2023), 15, 2022d.
FAOSTAT: https://www.fao.org/faostat/en/#data (last access: 10 October 2022), 2022.
Herridge, D. F., Giller, K. E., Jensen, E. S., and Peoples, M. B.: Quantifying country-to-global scale nitrogen fixation for grain legumes II. Coefficients, templates and estimates for soybean, groundnut and pulses, Plant Soil, 474, 1–15, https://doi.org/10.1007/s11104-021-05166-7, 2022.
Hurtt, G. C., Chini, L., Sahajpal, R., Frolking, S., Bodirsky, B. L., Calvin, K., Doelman, J. C., Fisk, J., Fujimori, S., Klein Goldewijk, K., Hasegawa, T., Havlik, P., Heinimann, A., Humpenöder, F., Jungclaus, J., Kaplan, J. O., Kennedy, J., Krisztin, T., Lawrence, D., Lawrence, P., Ma, L., Mertz, O., Pongratz, J., Popp, A., Poulter, B., Riahi, K., Shevliakova, E., Stehfest, E., Thornton, P., Tubiello, F. N., van Vuuren, D. P., and Zhang, X.: Harmonization of global land use change and management for the period 850–2100 (LUH2) for CMIP6, Geosci. Model Dev., 13, 5425–5464, https://doi.org/10.5194/gmd-13-5425-2020, 2020.
IFA: Fertilizer use by crop and country for the 2017–2018 period, 45, https://www.ifastat.org/consumption/fertilizer-use-by-crop (last access: 1 November 2022), 2022.
IFASTAT Fertilizer consumption: https://www.ifastat.org/databases/plant-nutrition, last access: 16 February 2022.
IPCC: Chapter 3: Uncertainties, IPCC, 66, https://www.ipcc-nggip.iges.or.jp/public/2006gl/pdf/1_Volume1/V1_3_Ch3_Uncertainties.pdf (last access: 1 September 2023), 2006.
Jackson, K.: KEJackson-94/Fr_Crop_Estimates: Methods for derivation of cropland fraction estimates as used in the FAOSTAT Cropland Nutrient Budget database (v1.0), Zenodo [code], https://doi.org/10.5281/zenodo.10511851, 2024.
Kremer, A. M.: Methodology and Handbook Eurostat/OECD: Nutrient Budgets, EU27, Norway and Switzerland, 112, https://ec.europa.eu/eurostat/documents/2393397/2518760/Nutrient_Budgets_Handbook_%28CPSA_AE_109%29_corrected3.pdf/4a3647de-da73-4d23-b94b-e2b23844dc31 (last access: 26 July 2022), 2013.
Lassaletta, L., Billen, G., Grizzetti, B., Juliette, A., and Garnier, J.: 50 year trends in nitrogen use efficiency of world cropping systems: The relationship between yield and nitrogen input to cropland, Environ. Res. Lett., 9, 105011, https://doi.org/10.1088/1748-9326/9/10/105011, 2014.
Lassaletta, L., Billen, G., Garnier, J., Bouwman, L., Velazquez, E., Mueller, N. D., and Gerber, J. S.: Nitrogen use in the global food system: past trends and future trajectories of agronomic performance, pollution, trade, and dietary demand, Environ. Res. Lett., 11, 095007, https://doi.org/10.1088/1748-9326/11/9/095007, 2016.
Lesschen, J. P., Stoorvogel, J. J., Smaling, E. M. A., Heuvelink, G. B. M., and Veldkamp, A.: A spatially explicit methodology to quantify soil nutrient balances and their uncertainties at the national level, Nutrient Cycling in Agroecosystems, 78, 111–131, https://doi.org/10.1007/s10705-006-9078-y, 2007.
Lu, C. and Tian, H.: Global nitrogen and phosphorus fertilizer use for agriculture production in the past half century: shifted hot spots and nutrient imbalance, Earth Syst. Sci. Data, 9, 181–192, https://doi.org/10.5194/essd-9-181-2017, 2017.
Ludemann, C.: ludemannc/fao_cnb: FAO cropland nutrient budget analysis (v1.0), Zenodo [code], https://doi.org/10.5281/zenodo.10491880, 2024.
Ludemann, C. I.: Tier 1 and 2 crop nutrient coefficients, Zenodo [code], https://doi.org/10.5281/zenodo.10492448 [code], 2022.
Ludemann, C. I., Gruere, A., Heffer, P., and Dobermann, A.: Global data on fertilizer use by crop and by country, Sci. Data, 9, 1–8, https://doi.org/10.1038/s41597-022-01592-z 2022a.
Ludemann, C. I., Hijbeek, R., van Loon, M. P., Murrell, T. S., Dobermann, A., and van Ittersum, M. K.: Estimating maize harvest index and nitrogen concentrations in grain and residue using globally available data, Field Crops Res., 284, 1–25, https://doi.org/10.1016/j.fcr.2022.108578, 2022b.
Ludemann, C. I., Hijbeek, R., van Loon, M., Murrell, S. T., Dobermann, A., and van Ittersum, M. K.: Global data on crop nutrient concentration and harvest indices, Dryad [data set], https://doi.org/10.5061/dryad.n2z34tn0x, 2023a.
Ludemann, C. I., Wanner, N., Chivenge, P., Dobermann, A., Einarsson, R., Grassini, P., Gruere, A., Jackson, K., Lassaletta, L., Maggi, F., Obli-Laryea, G., van Ittersum, M. K., Vishwakarma, S., Zhang, X., and Tubiello, F.: Data from: A global reference database in FAOSTAT of cropland nutrient budgets and nutrient use efficiency: Nitrogen, phosphorus and potassium, 1961–2020 [data set], https://doi.org/10.5061/dryad.hx3ffbgkh, 2023b.
Mueller, N. D., Gerber, J. S., Johnston, M., Ray, D. K., Ramankutty, N., and Foley, J. A.: Closing yield gaps through nutrient and water management, Nature, 490, 254–257, https://doi.org/10.1038/nature11420, 2012.
Nishina, K., Ito, A., Hanasaki, N., and Hayashi, S.: Reconstruction of spatially detailed global map of NH and NO application in synthetic nitrogen fertilizer, Earth Syst. Sci. Data, 9, 149–162, https://doi.org/10.5194/essd-9-149-2017, 2017.
Oenema, O., Kros, H., and de Vries, W.: Approaches and uncertainties in nutrient budgets: implications for nutrient management and environmental policies, Eur. J. Agron., 20, 3–16, https://doi.org/10.1016/S1161-0301(03)00067-4, 2003.
Pathak, H., Mohanty, S., Jain, N., and Bhatia, A.: Nitrogen, phosphorus, and potassium budgets in Indian agriculture, Nutrient Cycling in Agroecosystems, 86, 287–299, https://doi.org/10.1007/s10705-009-9292-5, 2010.
Peoples, M. B., Giller, K. E., Jensen, E. S., and Herridge, D. F.: Quantifying country-to-global scale nitrogen fixation for grain legumes: I. Reliance on nitrogen fixation of soybean, groundnut and pulses, Plant Soil, 469, 1–14, https://doi.org/10.1007/s11104-021-05167-6, 2021.
Quan, Z., Zhang, X., Fang, Y., and Davidson, E. A.: Different quantification approaches for nitrogen use efficiency lead to divergent estimates with varying advantages, Nature Food, 2, 241–245, https://doi.org/10.1038/s43016-021-00263-3, 2021.
Schils, R., Velthof, G., Mucher, S., Hazeu, G., Oenema, O., de Wit, A., and A., S.: Methods to estimate grassland production and biological fixation, Alterra, Wageningen, Netherlands, 77, https://ec.europa.eu/eurostat/documents/2393397/8259002/Grassland_2014_Task+2.pdf/42873c7f-dfdf-49ca-b2ef-7c7b5bcabfc8 (last access: 1 September 2023), 2013.
Serra, J., Marques-dos-Santos, C., Marinheiro, J., Aguilera, E., Lassaletta, L., Sanz-Cobeña, A., Garnier, J., Billen, G., de Vries, W., Dalgaard, T., Hutchings, N., and do Rosário Cameira, M.: Nitrogen inputs by irrigation is a missing link in the agricultural nitrogen cycle and related policies in Europe, Sci. Total Environ., 889, 164249, https://doi.org/10.1016/j.scitotenv.2023.164249, 2023.
Shang, Z., Zhou, F., Smith, P., Saikawa, E., Ciais, P., Chang, J., Tian, H., Del Grosso, S. J., Ito, A., Chen, M., Wang, Q., Bo, Y., Cui, X., Castaldi, S., Juszczak, R., Kasimir, Å., Magliulo, V., Medinets, S., Medinets, V., Rees, R. M., Wohlfahrt, G., and Sabbatini, S.: Weakened growth of cropland-N(2) O emissions in China associated with nationwide policy interventions, Glob. Chang. Biol., 25, 3706–3719, https://doi.org/10.1111/gcb.14741, 2019.
Sheldrick, W., Keith Syers, J., and Lingard, J.: Contribution of livestock excreta to nutrient balances, Nutrient Cycling in Agroecosystems, 66, 119–131, https://doi.org/10.1023/A:1023944131188, 2003.
Statistics Netherlands: Standardised calculation methods for animal manure and nutrients: Standard data 1990–2008, 2012.
Tubiello, F. N., Wanner, N., Asprooth, L., Mueller, M., Ignaciuk, A., Khan, A. A., and Rosero Moncayo, J.: Measuring progress towards sustainable agriculture. FAO Statistics Working Paper 21-24, FAO, Rome, 48, http://www.fao.org/documents/card/en/c/cb4549en (last access: 11 May 2021), 2021.
Tubiello, F. N., Conchedda, G., Casse, L., Pengyu, H., Zhongxin, C., De Santis, G., Fritz, S., and Muchoney, D.: Measuring the world's cropland area, Nature Food, 4, 30–32, https://doi.org/10.1038/s43016-022-00667-9, 2023.
Vishwakarma, S., Zhang, X., Dobermann, A., Heffer, P., and Zhou, F.: Global nitrogen deposition inputs to cropland at national scale from 1961 to 2020, Sci. Data, 10, 488, https://doi.org/10.1038/s41597-023-02385-8, 2023.
Vitousek, P. M., Naylor, R., Crews, T., David, M. B., Drinkwater, L. E., Holland, E., Johnes, P. J., Katzenberger, J., Martinelli, L. A., Matson, P. A., Nziguheba, G., Ojima, D., Palm, C. A., Robertson, G. P., Sanchez, P. A., Townsend, A. R., and Zhang, F. S.: Nutrient Imbalances in Agricultural Development, Science, 324, 1519–1520, https://doi.org/10.1126/science.1170261, 2009.
Wang, Q., Zhou, F., Shang, Z., Ciais, P., Winiwarter, W., Jackson, R. B., Tubiello, F. N., Janssens-Maenhout, G., Tian, H., Cui, X., Canadell, J. G., Piao, S., and Tao, S.: Data-driven estimates of global nitrous oxide emissions from croplands, Nat. Sci. Rev., 7, 441–452, https://doi.org/10.1093/nsr/nwz087, 2019.
Wang, R., Goll, D., Balkanski, Y., Hauglustaine, D., Boucher, O., Ciais, P., Janssens, I., Penuelas, J., Guenet, B., Sardans, J., Bopp, L., Vuichard, N., Zhou, F., Li, B., Piao, S., Peng, S., Huang, Y., and Tao, S.: Global forest carbon uptake due to nitrogen and phosphorus deposition from 1850 to 2100, Glob. Chang. Biol., 23, 4854–4872, https://doi.org/10.1111/gcb.13766, 2017.
West, P. C., Gerber, J. S., Engstrom, P. M., Mueller, N. D., Brauman, K. A., Carlson, K. M., Cassidy, E. S., Johnston, M., MacDonald, G. K., Ray, D. K., and Siebert, S.: Leverage points for improving global food security and the environment, Science, 345, 325–328, https://doi.org/10.1126/science.1246067, 2014.
Zhang, Q., Chu, Y., Yin, Y., Ying, H., Zhang, F., and Cui, Z.: Comprehensive assessment of the utilization of manure in China's croplands based on national farmer survey data, Sci. Data, 10, 223, https://doi.org/10.1038/s41597-023-02154-7, 2023.
Zhang, G. L., Beusen, A. H. W., Van Apeldoorn, D. F., Mogollón, J. M., Yu, C., and Bouwman, A. F.: Spatiotemporal patterns of paddy rice croplands in China and India from 2000 to 2015, Sci. Total Environ., 579, 82–92, https://doi.org/10.1016/j.scitotenv.2016.10.223, 2017.
Zhang, X., Davidson, E., Mauzerall, D., Searchinger, T., Dumas, P., and Shen, Y.: Managing nitrogen for sustainable development, Nature, 528, 51–59, https://doi.org/10.1038/nature15743, 2015.
Zhang, X., Davidson, E. A., Zou, T., Lassaletta, L., Quan, Z., Li, T., and Zhang, W.: Quantifying Nutrient Budgets for Sustainable Nutrient Management, Glob. Biogeochem. Cycles, 34, e2018GB006060, https://doi.org/10.1029/2018gb006060, 2020.
Zhang, X., Zou, T., Lassaletta, L., Mueller, N. D., Tubiello, F., Lisk, M. D., Lu, C., Conant, R. T., Dorich, C. D., Gerber, J., Tian, H., Bruulsema, T., McClellan-Maaz, T., Nishina, K., Leon, B., Bodirsky, L. B., Popp, A., Bouwman, L., Beusen, A., Chang, J., Havlík, P., Leclère, D., Canadell, J. G., Jackson, R. B., Billen, G., Heffer, P., Wanner, N., Zhang, W., and Davidson, E. A.: Quantification of global and national nitrogen budgets for crop production, Nature Food, 2, 529–540, https://doi.org/10.1038/s43016-021-00318-5, 2021.
Zou, T., Zhang, X., and Davidson, E. A.: Global trends of cropland phosphorus use and sustainability challenges, Nature, 611, 81–87, https://doi.org/10.1038/s41586-022-05220-z, 2022.