the Creative Commons Attribution 4.0 License.
the Creative Commons Attribution 4.0 License.
 | 12 Sep 2024
Glaciological and meteorological monitoring at Long Term Ecological Research (LTER) sites Mullwitzkees and Venedigerkees, Austria, 2006–2022
Bernd Seiser
Martin Stocker-Waldhuber
Anna Baldo
Marcela Violeta Lauria
Andrea Fischer
Glaciers in the Alps are losing mass at unprecedented and accelerating rates. Monitoring of glacier mass change as well as relevant atmospheric parameters plays an important role in improving understanding of local and downstream impacts. We present sub-seasonal, seasonal, and annual glaciological mass balance data and meteorological observations from Mullwitzkees and Venedigerkees, two glacier monitoring sites in the Hohe Tauern range of the Austrian Alps. Ablation stake networks were established on Mullwitzkees in 2006/07 and on Venedigerkees in 2011/12. Monitoring is ongoing. In addition to stake readings at sub-seasonal intervals, accumulation measurements (snow pits and probing) are carried out seasonally. The glaciological dataset consists of sub-seasonal floating-date measurements as well as fixed-date seasonal and annual values. The fixed-date glacier-wide mass balance was derived from annual point mass balance values. Automatic weather stations measuring standard meteorological parameters were installed near Mullwitzkees and Venedigerkees in 2020 and 2019, respectively. Meteorological data are provided in 10 min intervals. Uncertainties in individual point mass balance measurements were computed following the approach of the Swiss Glacier Monitoring (GLAMOS) programme, taking into account estimated density and reading errors. The sub-seasonal mass balance records highlight shorter-term variability in mass loss and the linkage with meteorological conditions. The most negative annual point mass balance recorded in the period of record was −5.8 ± 0.66 m w.e. at an elevation of 2536 m on Venedigerkees, and 2022 stands out as the most negative mass balance year to date in both time series, particularly at higher elevations. The cumulative specific mass balances (glacier-wide) over the period of record were −14.68 m w.e. at Mullwitzkees and −8.79 m w.e. at Venedigerkees. Data are available in the PANGAEA publication series and the associated datasets. The main publication series are updated annually. The Mullwitzkees mass balance datasets can be found in Stocker-Waldhuber et al. (2016) (https://doi.org/10.1594/PANGAEA.965660) and Stocker-Waldhuber et al. (2024d) (https://doi.org/10.1594/PANGAEA.965719). The Venedigerkees data can be found in Seiser and Fischer (2016) (https://doi.org/10.1594/PANGAEA.965648) and Seiser et al. (2024d) (https://doi.org/10.1594/PANGAEA.965729).
- Article
(10350 KB) - Full-text XML
-
Supplement
(872 KB) - BibTeX
- EndNote


Environmental monitoring in data-sparse high-mountain areas is essential for assessing changing natural and human systems under ongoing and accelerating climate change (Collins et al., 2011; Costa et al., 2016; Bojinski et al., 2014; Gaiser et al., 2020; Zemp et al., 2021). The mountain cryosphere is an integral part of the overall mountain environment and is strongly linked to atmospheric processes, which drive cryospheric changes in the short term as well as on climatological timescales (Hock and Huss, 2021). Glacier mass change in turn is an important climate indicator and drives hydrological change across spatial scales, from locally shifting runoff regimes in single catchments to global sea level rise (Huss and Hock, 2018; Zemp et al., 2019). As an essential climate variable (ECV, Bojinski et al., 2014), glacier mass balance is commonly incorporated into environmental monitoring programmes in mountain areas alongside related meteorological parameters (Collins, 2022). The glacier-wide and elevation zone mass balance data of Mullwitzkees (MWK) and Venedigerkees (VK) have been partially described in overview publications related to glacier monitoring in Austria (Fischer et al., 2014; Stocker-Waldhuber et al., 2015; Hansche et al., 2023) and in non-peer-reviewed reports submitted annually to the respective funding agencies (accessible through the PANGAEA publication series: Stocker-Waldhuber et al., 2016, and Seiser and Fischer, 2016). Intermediate and point data have not been published or described previously.
Measuring glacier surface mass balance via the glaciological method, i.e. with ablation stakes and snow pits, coring, or probing to quantify snow accumulation, has a long tradition due to the relative simplicity of the method (Cogley et al., 2011; Zemp et al., 2015; Fischer et al., 2018). Standardized mass balance observations are collected and compiled by the World Glacier Monitoring Service (Zemp et al., 2023), often in the form of seasonal or annual glacier-wide mass balance, which is spatially interpolated or extrapolated from point measurements (Østrem and Brugman, 1991; Cogley et al., 2011). Various systems for defining the respective measurement periods are in use, and the duration of a mass balance season or year may adhere to fixed dates (start and end of the hydrological year), floating dates, or stratigraphic notations (Cogley et al., 2011). Depending on the measurement system, temporal extrapolation is required in addition to spatial extrapolation to arrive at seasonal or annual glacier-wide mass balance from point measurements acquired at discrete moments in time and space.
Point mass balance data form the basis of glacier-wide mass balance estimates (e.g. Østrem and Brugman, 1991; Cogley et al., 2011; Geibel et al., 2022). Preserving all collected data with appropriate metadata at the greatest possible spatial and temporal resolution is essential for potential future reanalysis and homogenization of time series (Zemp et al., 2013). Additionally, point mass balance data can support calibration and validation of mass balance models (Schaefli and Huss, 2011). Sub-seasonal observations improve understanding of short-term mass changes, e.g. due to extreme events like heat waves (Cremona et al., 2023), and contribute to the improved quantification of relationships between atmospheric parameters and mass change (Vincent et al., 2017), particularly when combined with meteorological observations.
In Austria, 13 glaciers (including MWK and VK) were the subject of systematic mass balance monitoring as of the 2021/22 season (Hansche et al., 2023). Measurements at eight additional glaciers have been conducted in the past but were discontinued. Hansche et al. (2023) provide an overview of current glacier monitoring programmes in Austria, listing the coordinating organizations and funding agencies for each site. Spatially aggregated glacier-wide mass balance from all current Austrian monitoring sites can be accessed through the WGMS database (WGMS, 2023). Point mass balance has typically not been published along with the glacier-wide data.
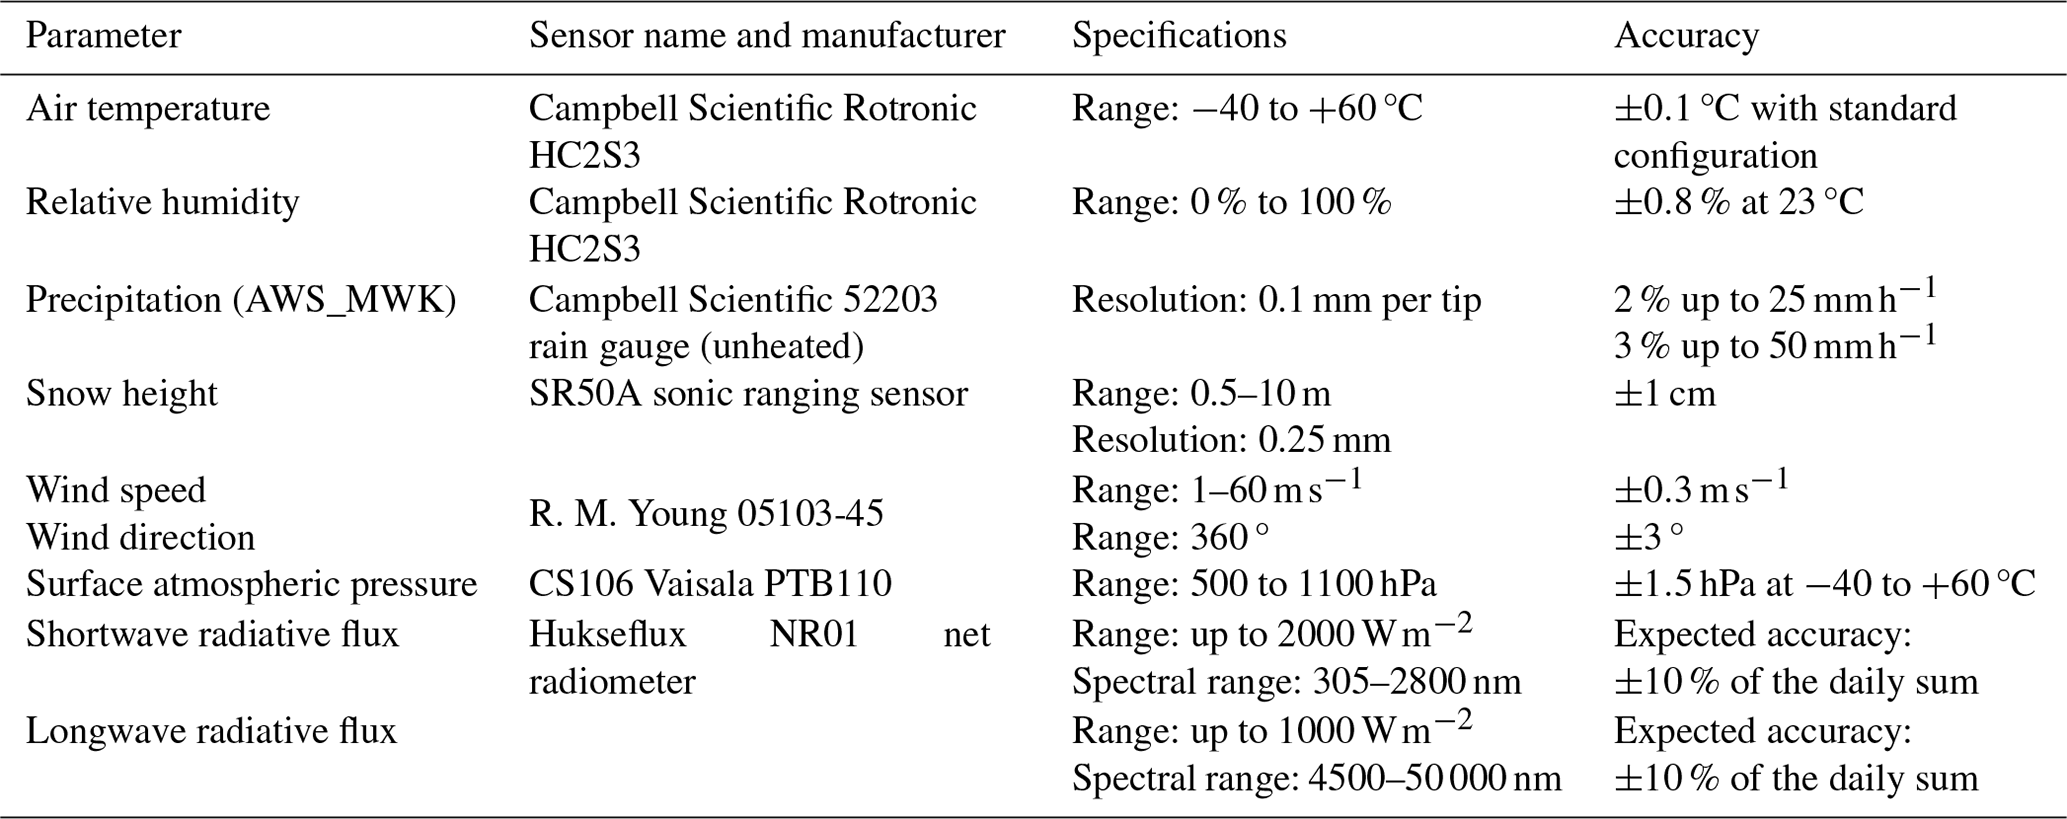
In this publication, we present glaciological and meteorological data from MWK and VK, two glaciers in the Hohe Tauern range of the Austrian Alps. Both sites are part of the Long Term Ecological Research programme (LTER, Collins, 2022). We focus on a comprehensive compilation of the sub-seasonal point mass balance data available from MWK and VK. In the interest of comparability with other datasets, we follow the approach of the Swiss Glacier Monitoring (GLAMOS) programme regarding data structure, metadata parameters, and uncertainty assessments (GLAMOS, 2021; Geibel et al., 2022). In addition to the sub-seasonal mass balance data, we include winter and annual fixed-date mass balance at the respective measurement points as well as extrapolated to elevation zones and the glacier scale. For the most recent 3–4 years of the periods of record, the glaciological data are complemented by records of temperature, humidity, atmospheric pressure, wind, radiation, and precipitation parameters from two automatic weather stations (AWSs) located at distances of approximately 500 and 800 m from MWK and VK, respectively.
2.1 Study sites
MWK and VK are temperate, winter-accumulation-type glaciers in the core zone of Hohe Tauern National Park (HTNP). HTNP is Austria's largest national park and is shared by the states of Salzburg, Tyrol, and Carinthia. About one-third of all Austrian glaciers (337 glaciers, Fischer et al., 2015a) are located within the boundaries of HTNP. MWK and VK are situated in the western section of HTNP in the Venediger Range, the mountain group around Großvenediger (3657 m, Fig. 1). Großvenediger and VK are also within a Natura 2000 protected area as per the European Union Habitats Directive (European Commission and Directorate-General for Environment and Sundseth, 2012, 2015).
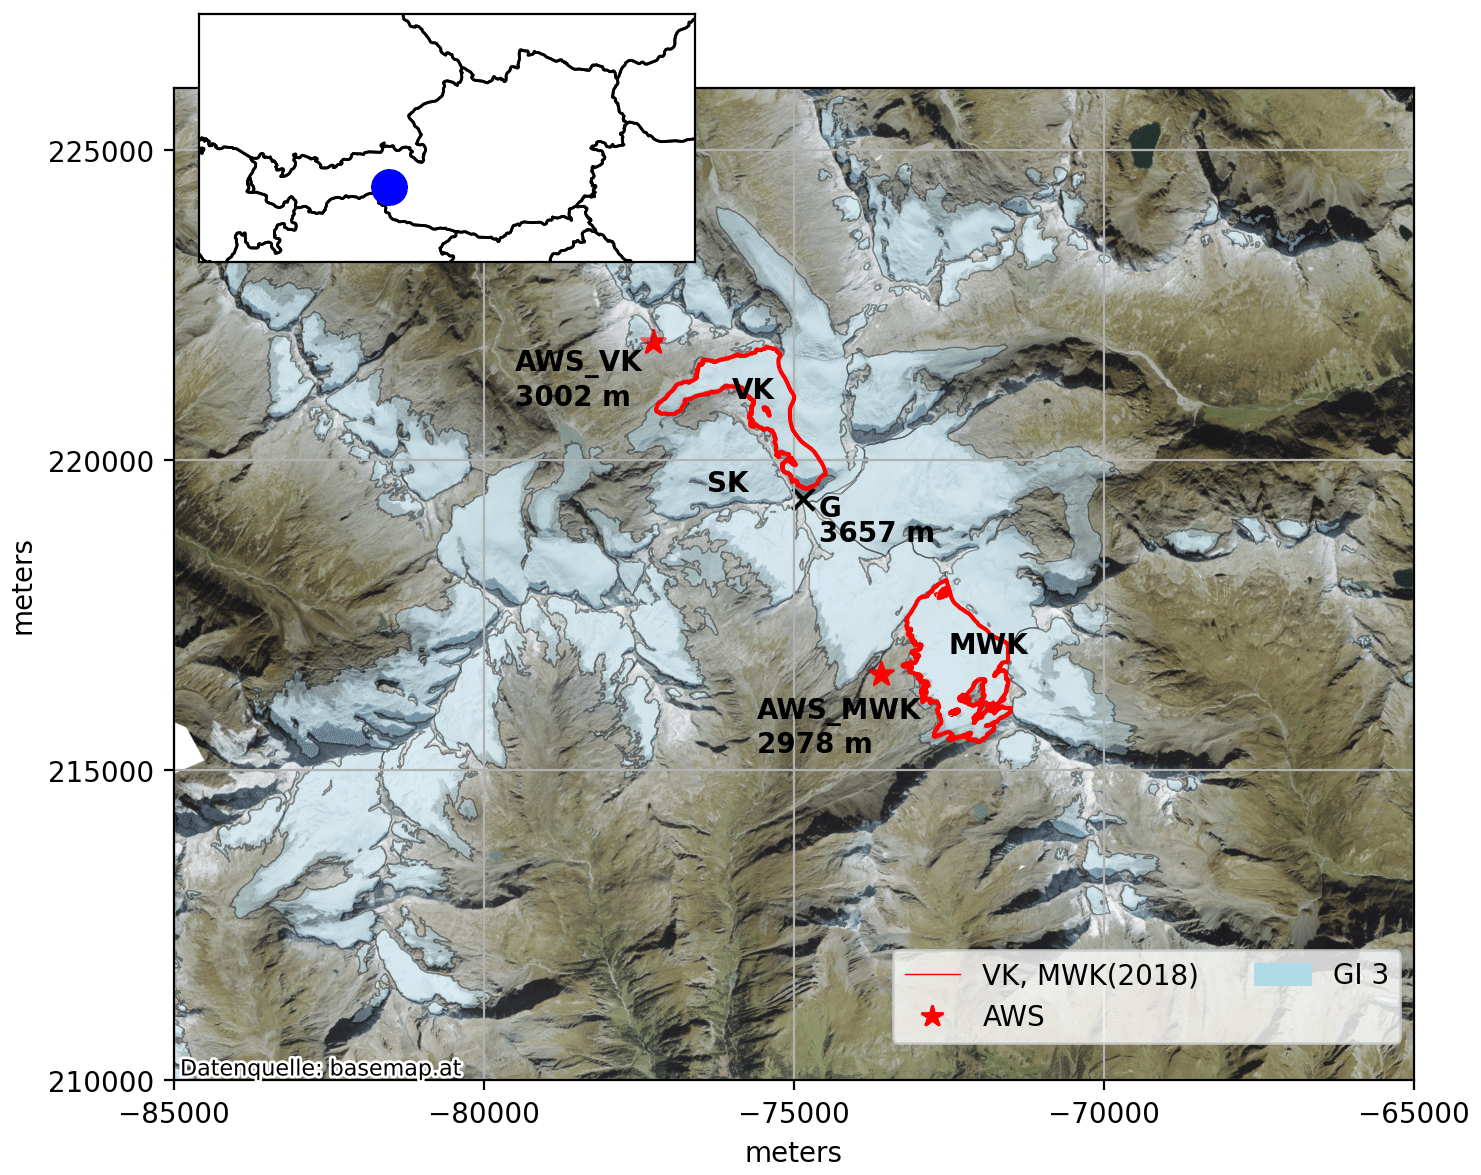
Figure 1Glaciers in the Venediger range (outlines: third Austrian glacier inventory, 2009, Fischer et al., 2015a). Outlines of Venedigerkees (VK) and Mullwitzkees (MWK) for 2018 in red. Stars mark the two automatic weather stations with the respective elevations. SK: Sulzbacherkees. G: Großvenediger. “x” marks the summit. Background: https://basemap.at (last access: 3 September 2024). The inset shows the locations of the study sites in Austria. Coordinate reference system: MGI / Austria GK Central (EPSG:31255).
MWK is on the Tyrolean side of Großvenediger about 3 km south-east of the summit. The upper part is also known as Äußeres Mullwitzkees, while the lower part is known as Zettalunitzkees. We use the name “Mullwitzkees” to include both parts. MWK can be classified as a plateau glacier and as a valley glacier. The flat and wide uppermost regions of the glacier above around 3150 m are considered the plateau part of the glacier. This part is confined by the ridge of the Hohe Zaun summit (3450 m) and an ice divide at around 3200 m to the neighbouring glaciers Schlatenkees to the north and Frosnitzkees to the east. Below 3150 m, the glacier steepens until it ends in a small, narrow, and by now relatively short glacier tongue. In 2018, MWK covered an area of 2.56 km2 and an elevation range from 2730 to 3400 m. MWK is predominantly south-facing and located on the southern side of the main Alpine divide. The watershed drains locally into the Dorferbach, subsequently into the Isel and Drava rivers, and eventually into the Danube River. Ice thickness surveys carried out in the context of the second Austrian Glacier Inventory (GI) indicated that the glacier is relatively thin, with ice thickness values of about 50–70 m at the time of measurement in 2003 (Fischer and Kuhn, 2013; Fischer et al., 2015c). The thickest ice is found in the central part of the plateau. Ice thickness decreases towards the highest elevations of the glacier. Rock outcrops have recently appeared in this area, confirming the limited ice thickness. MWK borders Rainerkees to the west, Schlatenkees to the north, and Frosnitzkees to the east. The glacier boundaries are defined by the respective ice divides.
Mass balance measurements at MWK began in 2006 as part of wider hydrological and glaciological monitoring efforts by HTNP and the Department for Hydrology of the State of Tyrol (HD Tyrol, Hydrographischer Dienst der Abteilung Wasserwirtschaft, Amt der Tiroler Landesregierung). HTNP and HD fund the monitoring programme. Runoff is measured by HD Tyrol in the Dorferbach and is available through the data platform ehyd (212233, Hinterbichl (Mühle)/Dorferbach, https://ehyd.gv.at/, last access: 3 September 2024). An AWS was installed near MWK in August 2020.
VK is a valley glacier extending from 2503 to 3400 m over an area of 1.82 km2 in 2018. The main section of the accumulation zone is directly below the summit ridge of Großvenediger, in the state of Salzburg. The upper part of the glacier is north-facing. The tongue turns to the west and south-west below about 2900 m. VK is a former tributary of Obersulzbachkees, which has retreated strongly in recent years and has disintegrated into multiple individual glaciers (2009, Third Austrian Glacier Inventory, GI3; Fischer et al., 2015a, b). After VK became disconnected from Obersulzbachkees, the name “Venedigerkees” was established for the easternmost remaining glacier, while the part directly north of the summit has since been called “Sulzbacherkees” (SK). VK and SK remained connected by a narrow band of debris-covered dead ice for some time after the main, clean ice tongues became separated. Hence, the exact timing of the definitive disconnection is hard to determine but likely occurred between 2016 and 2018. Initially, three ablation stakes were maintained on the tongue of SK in addition to the stake network on VK, but this has been abandoned due to the rapid retreat of SK. VK has a long ice divide with Untersulzbachkees to the east and drains into the Obersulzbach valley and subsequently into the Salzach, Inn, and Danube rivers.
The mass balance monitoring programme at VK began in 2012 and is funded by the Department for Hydrology of the State of Salzburg (HD Salzburg, Hydrographischer Dienst des Landes Salzburg). Runoff is measured by HD Salzburg in the Obersulzbach and is available through the data platform ehyd (203893, Kees/Obersulzbach, https://ehyd.gv.at/, last access: 3 September 2024). Since August 2019, an AWS near VK has been used to monitor meteorological parameters in addition to mass balance.
2.2 Glaciological parameters
2.2.1 Point mass balance
To measure accumulation, snow depth and stratigraphic bulk density (measurements of approximately 20 cm layers averaged over the depth of the snow pit) from the snow surface to the firn or ice horizon were measured at three to four snow pits at each glacier in spring. Snow depth at other locations was measured by probing. The water equivalent value at the probing locations was computed based on the probed depth and the density measurements at the snow pits. The accumulation surveys were carried out as close as possible to 30 April, the mid-point of the hydrological year and the fixed date for winter mass balance.
To measure ice ablation, networks of ablation stakes were installed at MWK in 2006 and at VK in 2012. The number of stake locations per glacier ranged from 10 to 17 at MWK and from 13 to 16 at VK during the respective time series. For initial installation as well as ongoing monitoring, wooden ablation stakes were drilled 6–12 m into the ice with a steam drill. The height change of the stakes was measured at irregular intervals throughout the ablation season. Ice ablation at the stakes was obtained by multiplying the height change by an assumed ice density of 900 kg m−3 (Cogley et al., 2011).
In autumn, the final stake readings of each season took place as close as possible to 30 September, the end of the hydrological year. Snow pits were dug and density was measured at the same pit locations as in spring if snow remained at these locations. Probing was similarly carried out if snow was present.
Each stake reading and snow pit measurement provides an intermediate mass balance observation for the period between the measurement date and the date of the last known value for the location. We derived a fixed-date annual and seasonal point mass balance at each measurement location (Kaser et al., 2003; Cogley et al., 2011). That is, the closest observations to the end of the hydrological year (30 September) and the end of the accumulation season (30 April) are extrapolated to the respective fixed dates. The temporal extrapolation is informed by meteorological data such as snowfall between the measurement and the fixed date. In case of snow accumulation between the date of the last measurements and the fixed date, snow water equivalent (SWE) is estimated and accounted for in the annual fixed-date value. Similarly, SWE gained or lost between the spring snow survey and the spring season fixed date is estimated to derive the fixed-date winter point mass balance. The seasonal and annual fixed-date point mass balance values are given in water equivalent units (mm w.e.). The first ablation measurement period of a given hydrological year begins at the start of that hydrological year (1 October) and refers to the fixed-date ablation reading of that date.
Locations of stakes, snow pits, and snow depth probes were measured with a handheld GPS device. For the stakes, GPS coordinates were not recorded during every reading, and the latest GPS measurement in each hydrological year is considered that year's location for the respective stake. The elevations of the measurement locations were not recorded in the field and were extracted from digital elevation models (DEMs) based on the coordinates of the stakes. The respective DEMs were acquired in 2008 for MWK and in 2012 for VK. Throughout the period of record, the positions of the individual stakes changed due to ice movement and occasionally due to repositioning during maintenance activities. Repositioning of stakes was avoided as much as possible. Reasons for repositioning were mostly related to newly formed crevasses or area loss. That is, stakes were moved away from crevasses or the ice edge to maintain safe access and representative measurement locations.
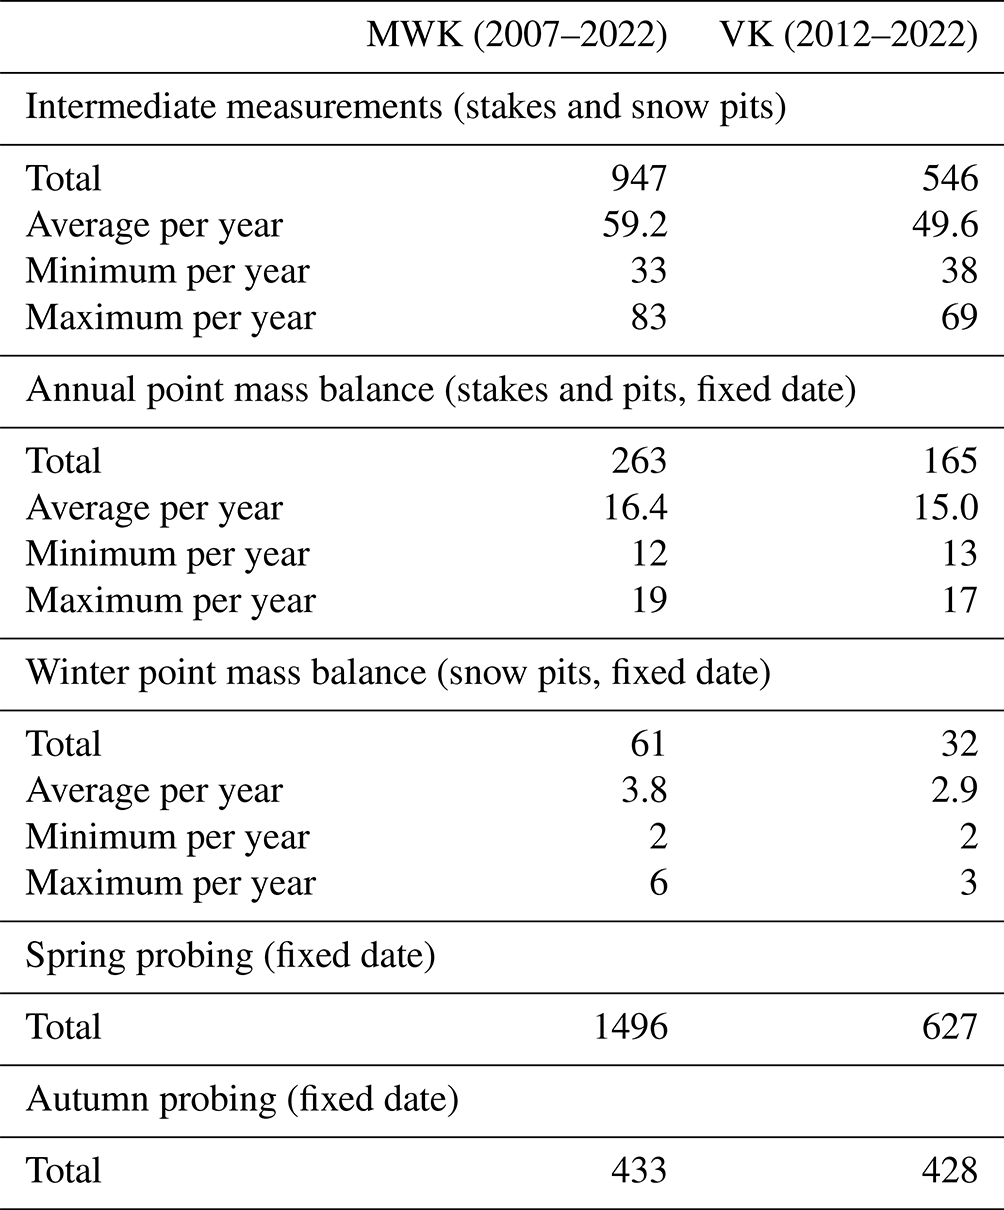
In the following, observations of height changes of the ice surface and the corresponding ablation values between consecutive readings as well as observations of snow height are referred to as intermediate measurements (Geibel et al., 2022). Annual and seasonal (winter season) measurements refer to values derived from cumulative intermediate measurements and extrapolated temporally to fixed dates. The intermediate data files contain the intermediate measurements acquired on variable dates. The annual and seasonal data files contain point mass balance values extrapolated to fixed dates from the closest available measurement dates and can be considered a derivative product of the intermediate files. Table 1 shows the total and average numbers of the different measurement types available for each site.
Table 1Number of total intermediate and annual ablation stake and snow pit measurements available for MWK and VK, together with the yearly averages and ranges for intermediate, annual, and winter point mass balance measurements and the number of probing locations.
In the interest of comparability and compatibility with mass balance data from other sites, the point mass balance data and metadata were formatted to be consistent with the structure introduced in detail by Geibel et al. (2022) and applied in the Swiss GLAMOS programme (GLAMOS, 2021). We adhere to their quality flags as closely as possible for our intermediate dataset and use the respective assigned errors as given in Geibel et al. (2022) and the documentation of the associated data publication (GLAMOS, 2021), unless otherwise stated. For the intermediate data, the following quality flags were applied:
-
Date quality. The start and end dates of each period are known for ablation measurements at the stake locations (flag 0). In some cases, measurements were carried out on 2 consecutive days, and the exact date on which specific stakes were surveyed was not recorded. In these instances, the second date is stated and the date is still considered known. For snow surveys in spring (probing and snow pits), the true start date of the measurement period (i.e. the start of seasonal snow accumulation) is unknown but is estimated as the start of the hydrological year in adherence with the fixed-date system. Therefore, 1 October of the previous year is entered as the start date of the period and the date quality flag is set to “estimated/unknown” (flag 3). Snow surveys in autumn may include snow that fell during the previous accumulation season and/or new snow that fell recently. The start date is considered “unknown” and is flagged accordingly without an estimated start date. Following GLAMOS (2021), the error associated with estimated or unknown dates is assumed to be elevation-dependent, with 36 cm between 1500 and 2500 m, 31 cm between 2500 and 3000 m, and 22 cm above 3000 m. This error contributes to the reading uncertainty.
-
Position quality. For most stake measurements in our dataset, the position was estimated from previous measurements and was flagged as such (flag 4). When the date of the GPS data point is known, as is usually the case for snow pit and probe data, the “position quality” flag is adjusted accordingly. This error does not contribute to the reading uncertainty (Geibel et al., 2022).
-
Density quality. Ice density is assumed to be 900 kg m−3 (flag 1, error: 2 % of the mass balance). Snow density is measured at snow pit locations (flag 2, error: 5 % of the mass balance). This error contributes to the mass balance uncertainty.
-
Measurement quality. Set to “typical uncertainty for the specific method” (flag 1, error: 0).
-
Measurement type. The intermediate dataset contains ablation stake readings (flag 1, 5 cm type error) and snow pit data (flag 2, 10 cm type error). The measurement type is always known. This error contributes to the reading uncertainty.
-
Special cases. The winter balance for 2011/12 at VK was reconstructed in spring 2012/13 by digging snow pits to the previous year's firn horizon. The respective snow pit values are flagged with measurement quality flag 5 for “reconstructed value”.
For fixed-date values (annual and winter balance), the quality flags and associated uncertainties were adjusted as follows to account for fixed vs. floating dates:
-
Date quality. The dates are considered known (start, mid-point, and end of the hydrological year).
-
Position quality. The positions of the measurement points were estimated from previous measurements and flagged as such (flag 4).
-
Density quality. The annual fixed-date density and the derived SWE values at the stakes are based on a combination of ice density and fresh snow at the stake locations and are flagged accordingly (flag 5). The associated error is set to 10 % of the mass balance (mm w.e.). For winter and autumn snow pit data, the density flag is set to “Density of snow estimated from nearby measurement” (flag 3, 8 % of the mass balance). For snow probing measurements, the density was estimated from the snow pit data and was also set to “Density of snow estimated from nearby measurement”.
-
Measurement quality. For all fixed-date values, the measurement quality flag is set to 5, with an associated quality error of 30 cm that contributes to the reading uncertainty. This is the equivalent of the quality flag “reconstructed value (other reason)” in the system employed by GLAMOS (2021). The intention is to indicate that fixed-date values were temporally interpolated or extrapolated (“reconstructed”) from intermediate values.
-
Measurement type and probing. In addition to stakes and snow pits (as in the intermediate dataset), the fixed-date dataset includes a separate file with snow depth probing data. The measurement type is set to 3 for these data points, with an associated 15 cm type error. Note that this data type and this flag differ from the GLAMOS system. The probe data are only available as water equivalent values extrapolated from the date of measurement to the fixed date. Records of the raw data (snow depth on the day of measurement) were not kept. Probe data have an additional flag that indicates whether or not the water equivalent value of a given probe data point is within ±100 mm w.e. of the spatially integrated mass balance value at the probing location. This aims to identify probe data that are not representative of the winter or annual point mass balance. For the annual data, values flagged as not representative are typically due to new snow that fell shortly prior to the measurement in the ablation zone. During spring surveys it is often challenging to definitively identify the previous year's firn horizon by probing. In addition to the spatial inhomogeneity of snow depth, probe data may have systematic biases in a given year due to e.g. ice lenses in the snowpack that cannot be penetrated with the probe.
Following Geibel et al. (2022), the uncertainty of each reading (σr) is then assumed to be
where σdate is the date uncertainty, σtype is the measurement type uncertainty, and σmqual is the measurement quality uncertainty. The mass balance (b) uncertainty is
σdensity is given as a percentage of the mass balance and hence is multiplied by b. We refer to Geibel et al. (2022) for a more detailed discussion of the reasoning behind the uncertainty assessment and the limitations of this approach, both of which can also be applied to our dataset. A particular point to bear in mind is that stated values for the various uncertainty components are estimated based on previous studies or experience in the field rather than quantitatively determined.
Due to the temporal extrapolation required to derive fixed-date values (annual and winter mass balance) from intermediate measurements, uncertainties for the fixed-date values are higher than for the intermediate readings. This is reflected predominantly in the measurement quality flag and the associated uncertainties as well as in the density quality flag and density uncertainty for the stake data. This is a “one-size-fits-all” approach that does not account for the size of the temporal gap between the fixed date and closest floating date or for the meteorological conditions affecting ablation and/or accumulation for the duration of said gap. We consider the resulting uncertainty to be a first-order estimate useful for a comparison of the fixed-date values with the intermediate data. A more detailed assessment of the uncertainties introduced by the temporal extrapolation is needed for future work.
2.2.2 Glacier area
Tables 2 and 3 list the years for which glacier outlines from MWK and VK are available as well as the underlying data sources and references. For MWK, previously unpublished outlines for 2012, 2015, 2018, and 2022 mapped from orthophotos are made available as part of this publication. For VK, previously unpublished outlines for 2012 and 2018 are made available. All outlines generated as part of the monitoring programmes were mapped to be consistent with GI3 (Fischer et al., 2015a). See Figs. 2 and 3 for overview maps of the outlines as well as of the stake and snow pit monitoring networks. Due to ice flow and occasional repositioning of stakes, measurement locations vary slightly over the years.
Fischer et al. (2015b); Groß and Patzelt (2015)Patzelt (1980, 2013); Groß (1987)Eder et al. (2000); Lambrecht and Kuhn (2007); Kuhn et al. (2012, 2013)Fischer et al. (2015a)Buckel and Otto (2018)Table 2Glacier outlines and DEM for MWK with the respective data sources. ∗ marks data used for spatial extrapolation of the glacier-wide and elevation zone mass balances from point data.
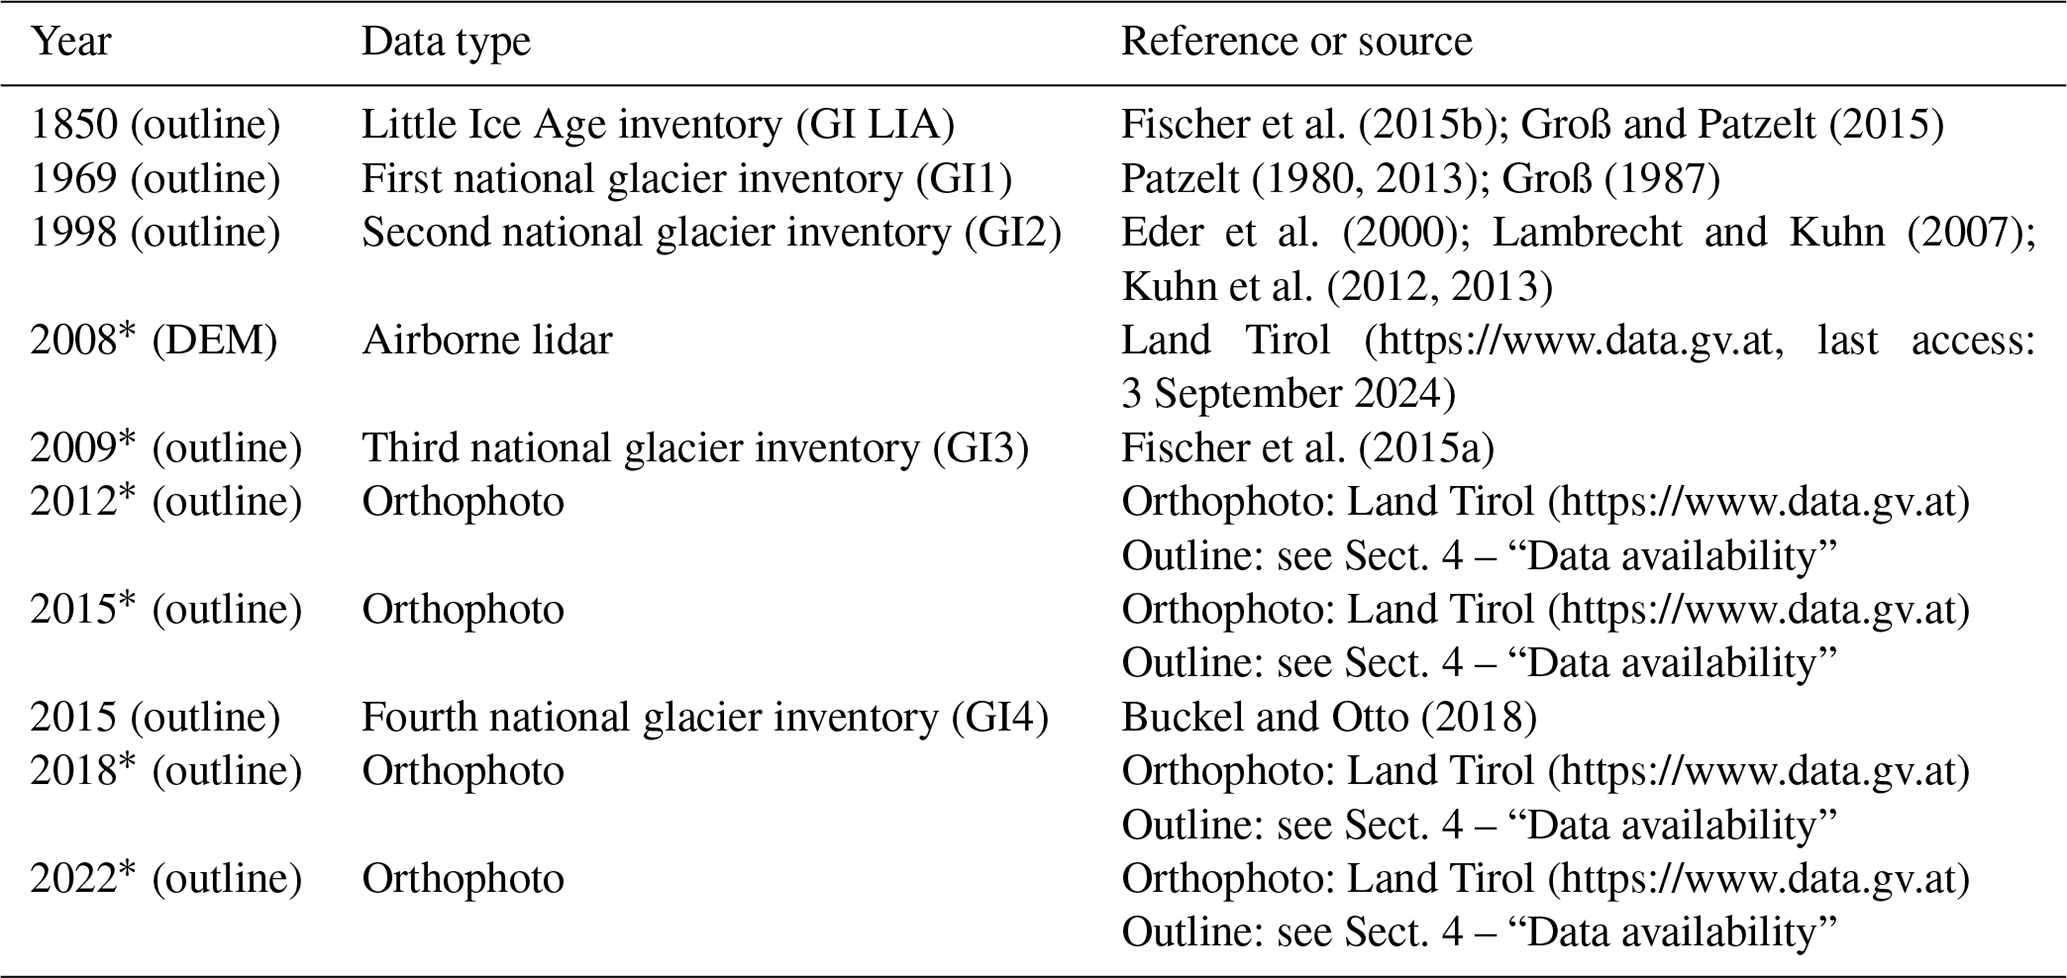
Table 3Glacier outlines and DEM for VK with the respective data sources. ∗ marks data used for spatial extrapolation of the glacier-wide and elevation zone mass balances from point data.
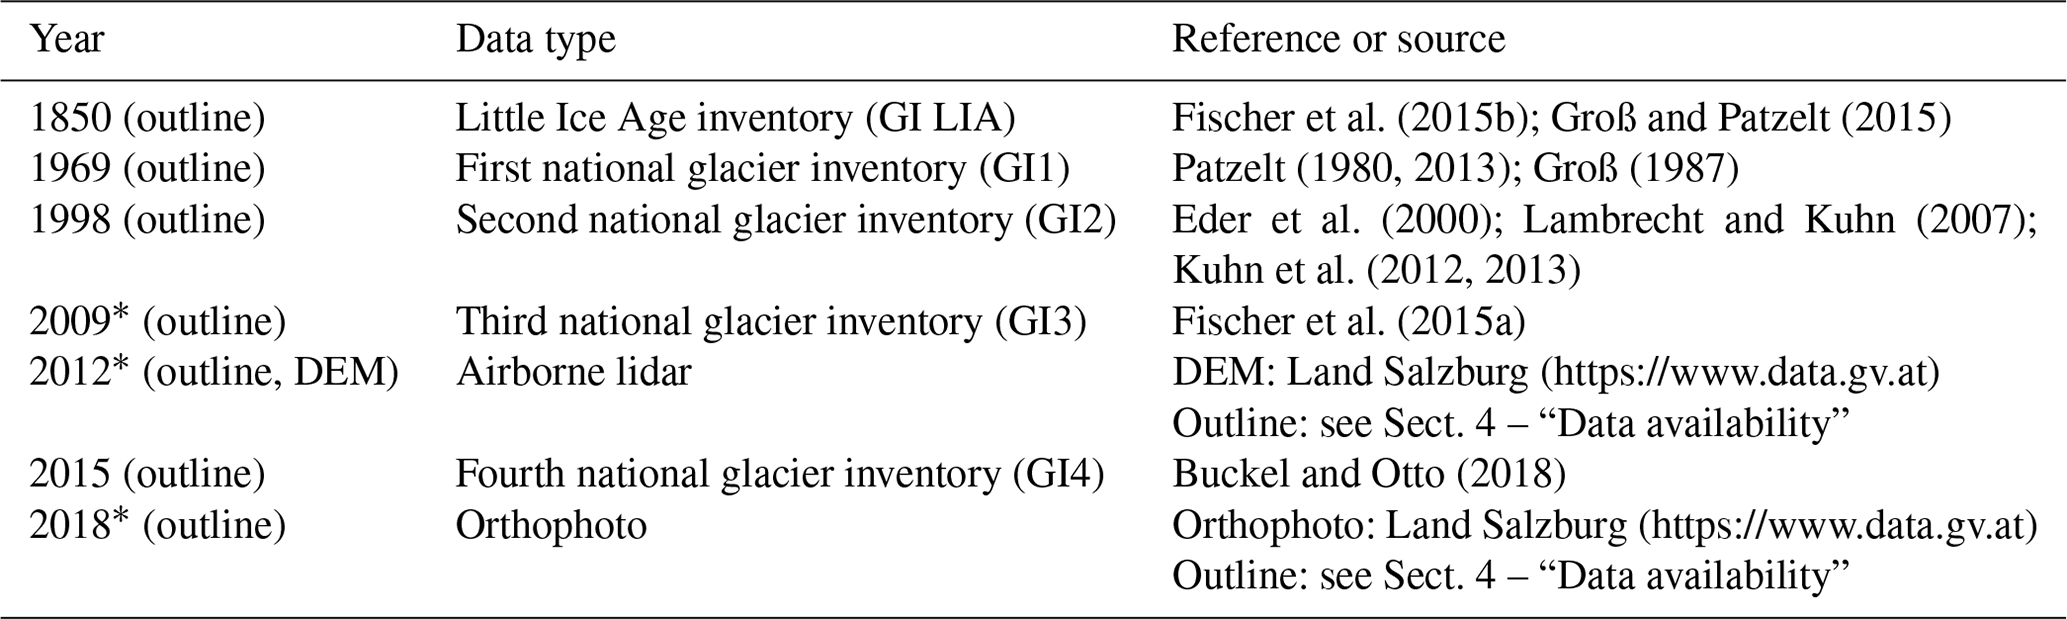
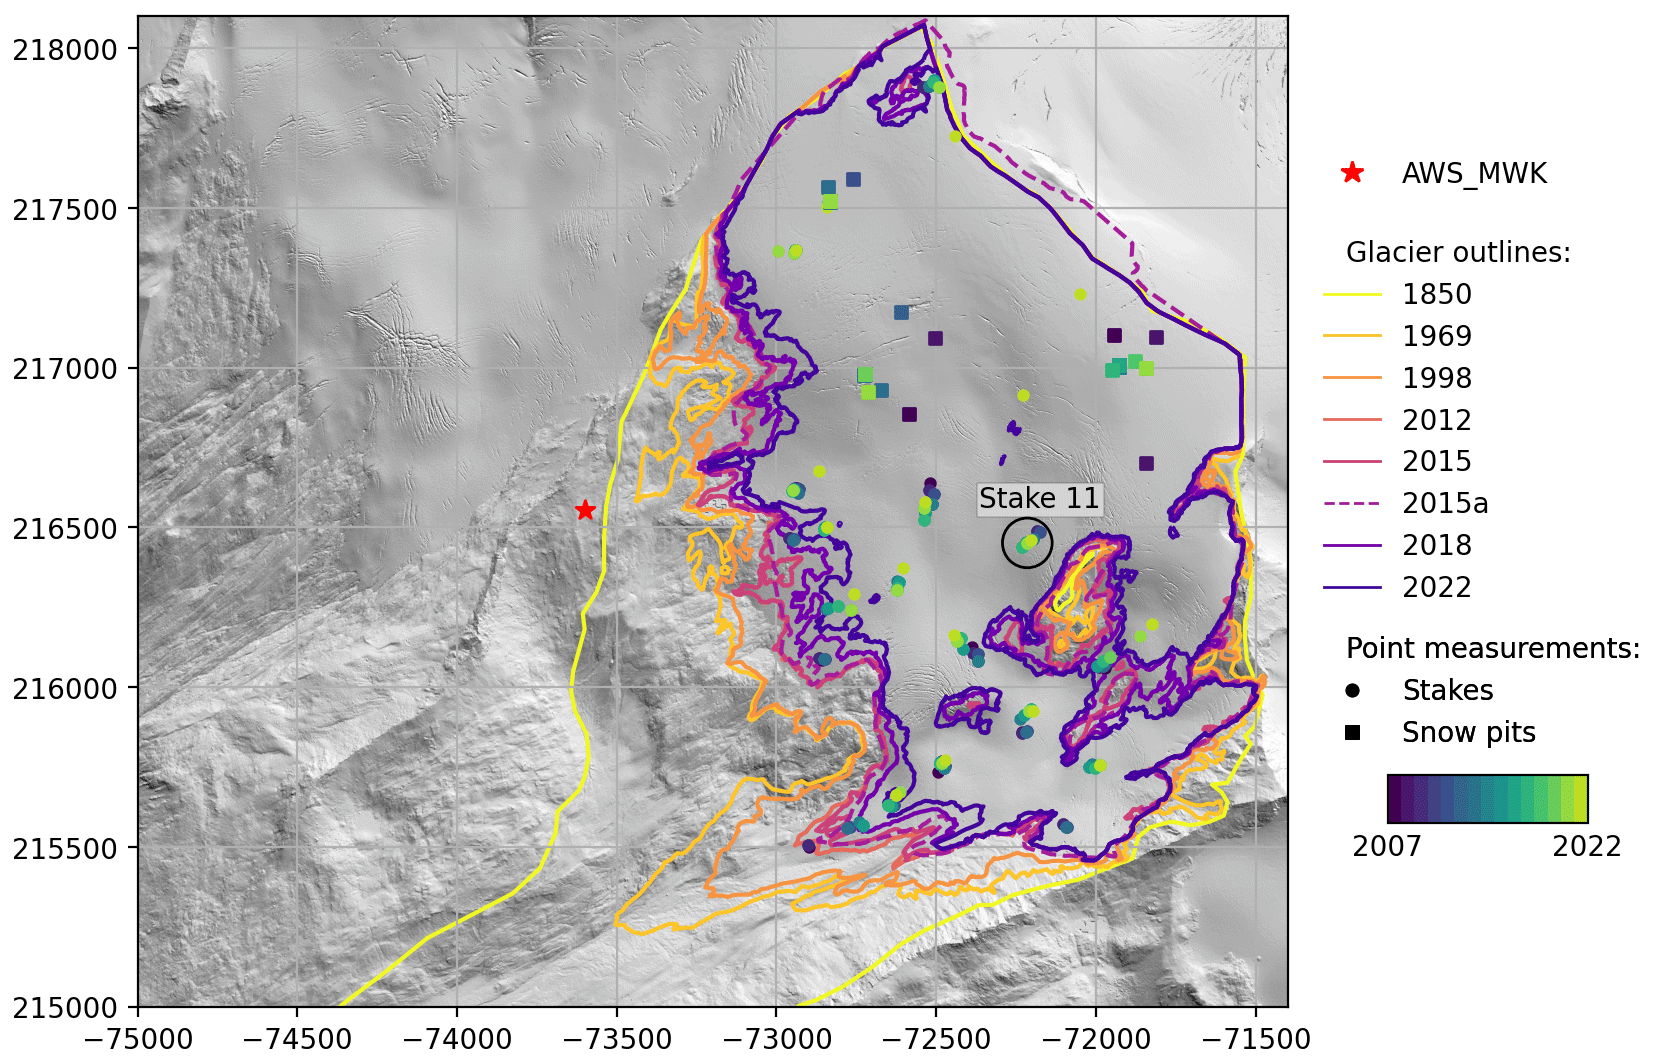
Figure 2Overview of the monitoring network at MWK. Glacier outlines: see Table 2; 2015a (dashed line) corresponds to GI4 (Buckel and Otto, 2018). Locations of stakes and snow pits with annual mass balance data are shown colour-coded by years. Coordinate reference system: MGI/Austria GK Central (EPSG:31255), grid in metres. Intermediate measurements for Stake 11 are shown in Fig. 5. Background: hillshade of the 2008 DEM.
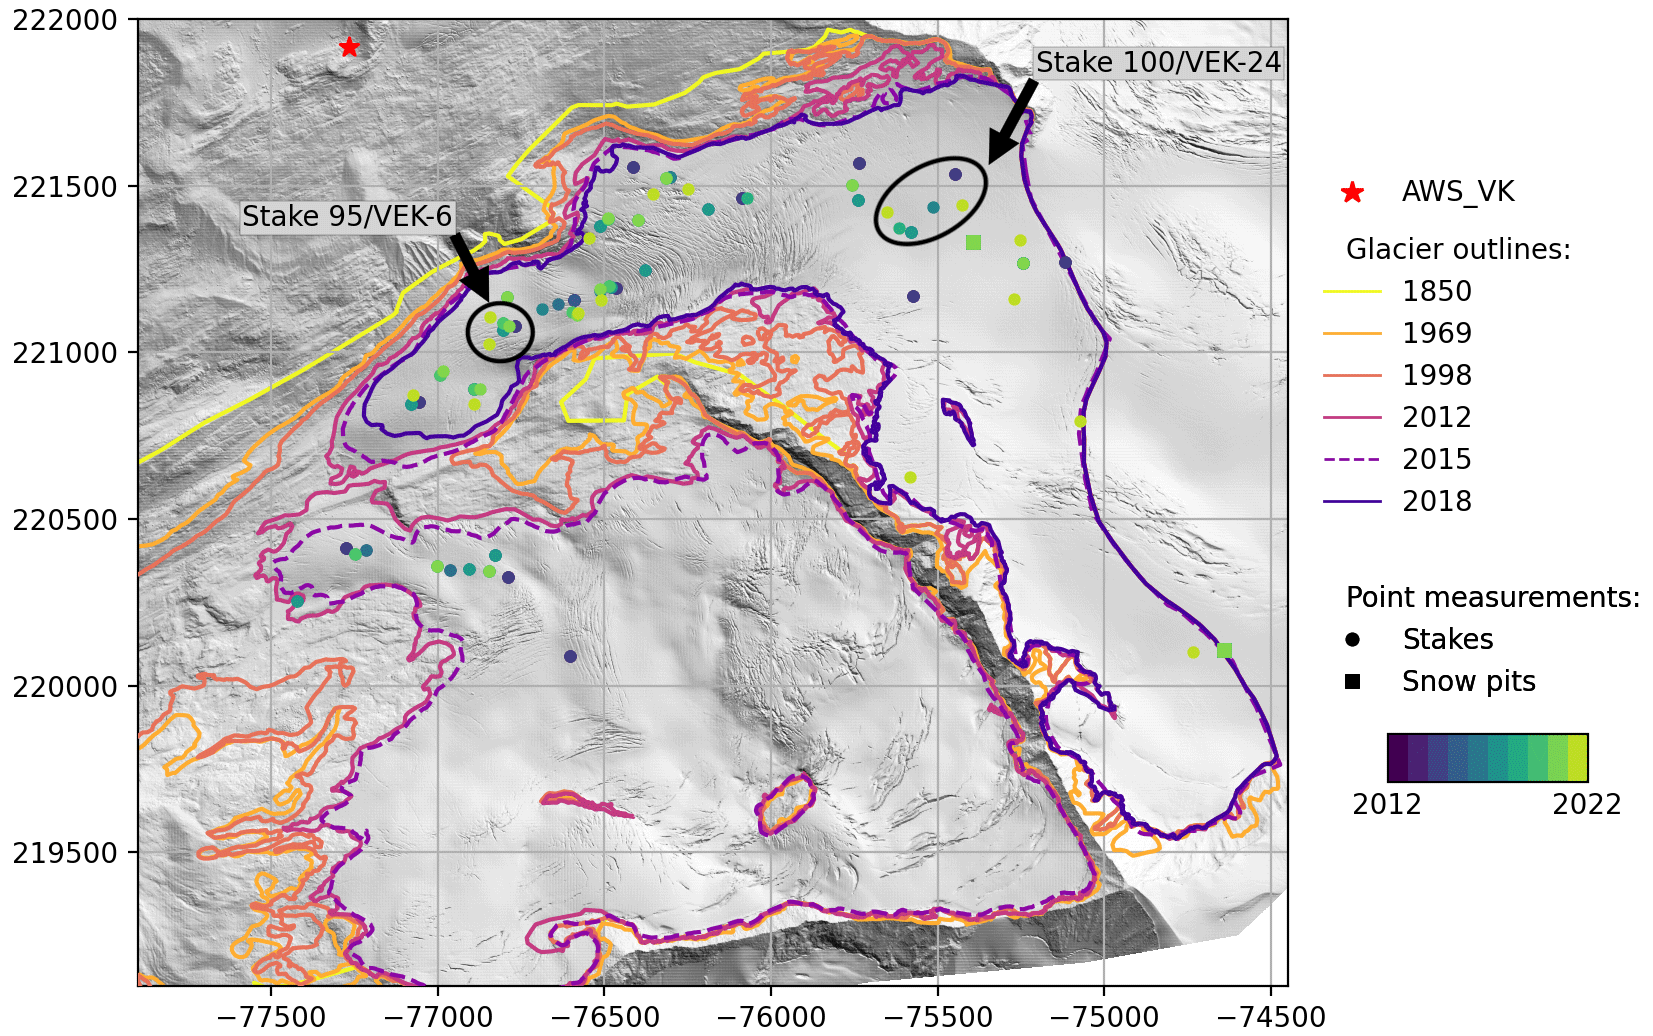
Figure 3Overview of the monitoring network at VK. Glacier outlines: see Table 2; 2015 (dashed line) corresponds to GI4 (Buckel and Otto, 2018). Note that, for 2018, only the VK outline is shown as Sulzbacherkees was not mapped. Locations of stakes and snow pits with annual mass balance data are shown colour-coded by years. Coordinate reference system: MGI/Austria GK Central (EPSG:31255), grid in metres. Figure 5 shows intermediate measurements for Stake 95/VEK-6 and Stake 100/VEK-24. Background: hillshade of the 2012 DEM.
2.2.3 Glacier-wide mass balance
Glacier-wide mass balance was derived from the point measurements based on manual interpolation between the fixed-date annual point measurements and extrapolation to unmeasured areas. The mapping of contour lines with equal mass balance (Østrem and Brugman, 1991) generally assumes linear gradients between measurement points and is additionally informed by expert knowledge of small-scale topography as well as photographs and satellite imagery that show snowmelt patterns. At VK, three automatic cameras take pictures of different sectors of the glacier multiple times per day. The imagery is used to assess snowline and ablation progression and contributes to the spatial extrapolation of mass balance to the glacier scale.
The elevation of the glacier terminus and the elevation zones used for the glacier-wide mass balance product refer to the 2008 DEM for MWK and the 2012 DEM for VK, together with the most recent glacier outline that was available in a given measurement year (Tables 2 and 3).
At VK, the 2009 outline from the third national inventory (GI3, Fischer et al., 2015a) was adapted to reflect the separation of VK and SK and was used for the mass balance until 2014. From 2014 to 2018, a new outline generated from the 2012 DEM was in use. The most recent VK outline is based on a high-resolution orthophoto from 2018.
At MWK, the GI2 outline was adapted based on photos and differential GPS measurements for the mass balance seasons 2007/08–2009/10. For 2011/12–2014/15, the GI3 outline was used. Outlines for the years 2012, 2015, 2018, and 2022 were mapped based on orthophotos as they became available.
To derive mass balance per elevation zone, the vector maps of interpolated glacier-wide mass balance were integrated over each elevation zone. The equilibrium line altitude (ELA) is defined as the zero crossing of the vertical (elevation zone) profile of the specific mass balance (Cogley et al., 2011). The accumulation and ablation area (Sc, Sa) are, respectively, defined by the line of 0 mm w.e. in the glacier-wide mass balance map and the most recent glacier outline. The total and specific mass balances in the accumulation and ablation area (Bc, Ba, ba, bc) are similarly delineated based on the 0 mm w.e. contour line.
The spatially integrated glacier-wide mass balance derived from point data is prone to systematic errors due to e.g. tilt and floating of stakes, local accumulation from avalanches, undersampling or non-representative sampling of certain areas, errors associated with the extrapolation method, and more. These errors accumulate for cumulative mass balance time series (Thibert et al., 2008; Zemp et al., 2013, and references therein). Unlike automatic or semi-automatic methods for spatial integration of point mass balance, the contour line method allows incorporation of expert knowledge related to mass-balance-relevant processes such as regular avalanche input in certain areas, wind drift, or the influence of crevasses. On the other hand, the method is to some degree subjective and dependent on the interpretations and specific knowledge of the observer drawing the contours.
Quantitative uncertainty assessment of glacier-wide mass balance and detection of potential biases related to systematic errors require an independent dataset, typically of geodetic mass balance (e.g. Huss et al., 2009; Zemp et al., 2013). Only one high-resolution DEM is available for the period of record of glaciological measurements at MWK and VK, respectively. Hence, the glaciological datasets have not been compared to or validated against geodetic mass balance. We acknowledge that this is a limitation of the presented dataset. Reanalysis of the glacier-wide time series is planned as soon as suitable new DEMs become available.
2.2.4 Glaciological parameters – data format and access
The monitoring programmes at MWK and VK are ongoing and the related data publications are “living documents” that are added to as new data become available. The glacier-wide fixed-date annual mass balance as well as the corresponding elevation zone data are available as tabular data via the World Glacier Monitoring Service (WGMS) Fluctuations of Glaciers (FOG) database (WGMS, 2023). New data are added with each new iteration of the FOG database published by the WGMS and typically have a temporal lag of two hydrological seasons.
Additionally, multiple data publication series are maintained for MWK and VK on the PANGAEA data platform. In the PANGAEA data ecosystem, publication series are “parent publications” that can have multiple associated “child” datasets, which are each issued a separate DOI linked to the “parent DOI” of the publication series in a relational database. The DOI of the publication series leads to a landing page where all associated datasets are listed and linked to.
The initial PANGAEA publication series entries for MWK (Stocker-Waldhuber et al., 2016) and VK (Seiser and Fischer, 2016) were created in 2016. Data for each new measurement season have since been added sequentially as a single year of tabular data. Further publication series for MWK and VK are listed in Table 6. Point mass balance data were uploaded to the respective publication series in tabular format for the period of record (Seiser et al., 2024d). Additional data for the coming years will be added as new entries. Publication series are available for glacier-wide mass balance, glacier outlines, point mass balance, and meteorological data at MWK and VK, respectively. See Sect. 4 and Table 6 for references and DOI numbers.
The datasets in the publication series are curated by the authors of the data publications and the PANGAEA editing team to ensure consistent formatting and correct integration into the relational database of PANGAEA. The annual associated datasets can be cited individually or as part of the publication series. For example, the mass balance maps of VK for 2021/22 are referred to on PANGAEA as “Seiser, B. et al. (2024): Glacier mass balance of Venedigerkees, Austria, 2022. (2024), in: Seiser, B.; et al. (2024): Glacier mass balance of Venedigerkees, 2011/12 et seq.”. This dataset contains shapefiles of winter and annual mass balance and elevation zones for the 2021/22 season.
We note that there are various possible approaches to the challenge of timely and user-friendly publication of citable datasets from ongoing monitoring, which produces a range of data products at annual and sub-annual frequencies. For MWK and VK, the time series of glacier-wide and elevation zone mass balance can be extracted from the WGMS FOG database as a single table. The PANGAEA publication series approach allows for more flexibility when adding datasets as they become available in varying formats and reduces the temporal lag of new data being published. Tabular publication series, e.g. of annual and elevation zone mass balance, can be bulk-downloaded through the publication series landing page and then merged to obtain a time series for the period of record. For users wanting direct access to tabular, aggregated summary data for the period of record with the option of easily comparing MWK or VK with different sites, we recommend access through the WGMS FOG database. For users interested in a larger variety of data and data formats specifically for MWK and VK, we recommend the respective PANGAEA publication series and the associated datasets.
2.3 Meteorological parameters
Standard meteorological parameters (Table 5) are measured at two AWSs located at distances of about 500 m from MWK and 800 m from VK. Subsets of current data can be viewed online through the data portal Lawis.at, where the stations are named “Defreggerhaus” and “Keeskogel Südgrat”, respectively. For the sake of clarity, we use “AWS_MWK” and “AWS_VK” in the following to refer to the AWSs near MWK (Defreggerhaus) and VK (Keeskogel Südgrat). AWS_MWK was established on 10 August 2020 and is located at 2978 m at 47.0839° N, 12.3634° E. The AWS tower is mounted in a relatively sheltered, flat area near Defreggerhaus, a mountain hut. AWS_MWK did not initially include radiation sensors. These were added on 21 September 2021. Snow height is available from 1 July 2019 to 2 June 2022. AWS_VK was established on 19 September 2019 at 3002 m at 47.1317° N, 12.3142° E. It is situated on a wind-exposed rock outcrop. Snow height is available from 1 July 2020 to 28 June 2022. Sensor specifications and related information are provided in Table 4. Both stations use a Campbell Scientific CR3000 data logger.
Table 5Percentage of data flagged as erroneous for each parameter from the start of the respective station record up to 31 October 2023. ∗ Precipitation is flagged for low temperatures when the records of the unheated precipitation gauge are considered unreliable.
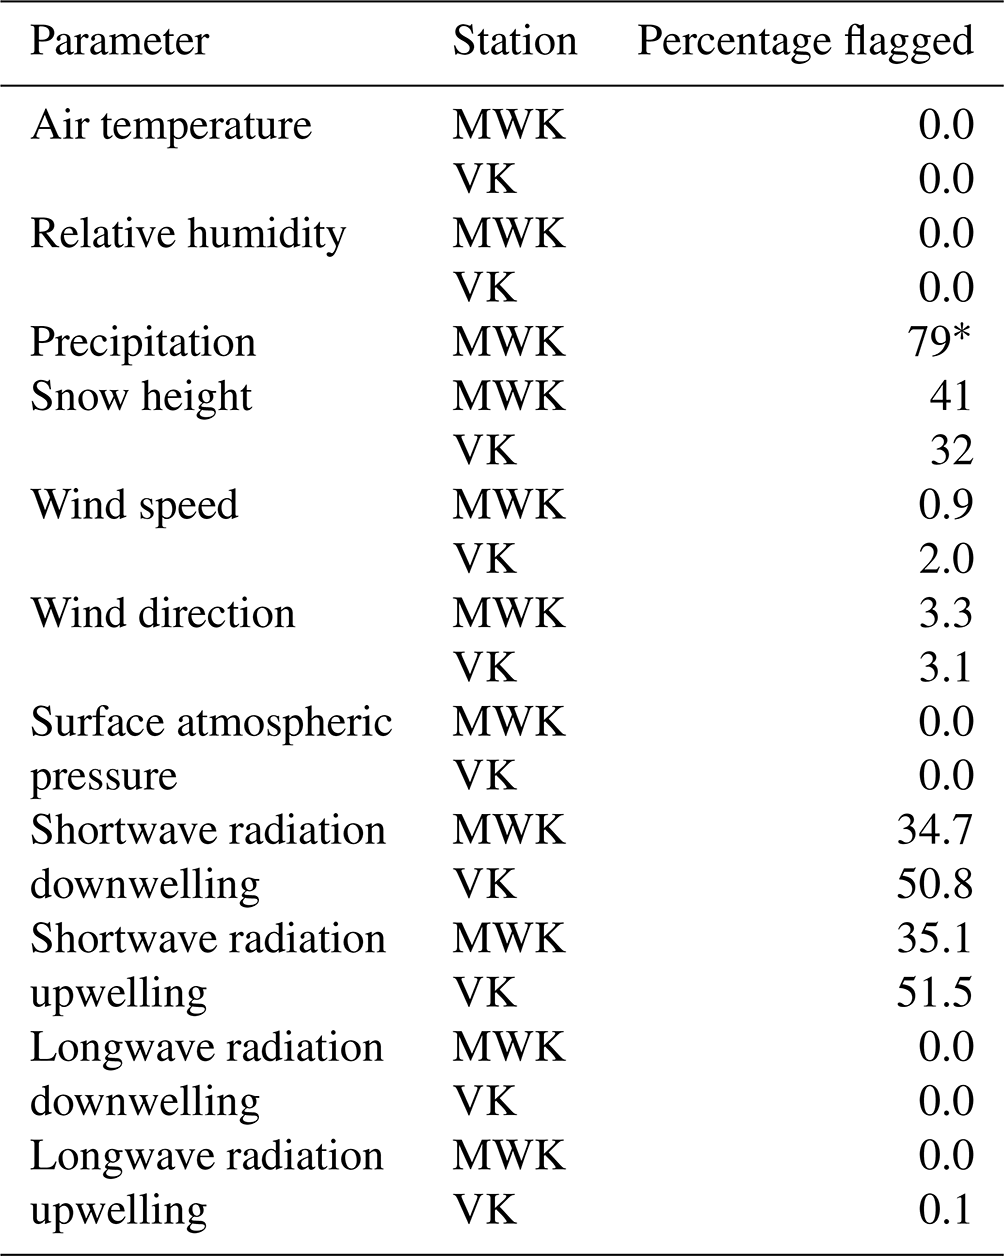
For basic quality control, the data were scanned for data gaps and error values outside the given sensor range as well as for battery voltage below critical values for the operation of the data logger. Additional processing steps and quality flags were applied as follows. Table 5 indicates the percentage of missing or erroneous data identified for each parameter. Derived data products as presented in this publication, such as aggregated values for daily and monthly statistics, were computed without interpolation of gaps unless otherwise stated. All times in this paper are UTC unless otherwise stated.
The meteorological records are available as raw, uncorrected data and in a quality-controlled version with quality flags at 10 min intervals as logged by the station (PANGAEA publication series: Stocker-Waldhuber et al., 2024c; Seiser et al., 2024c).
2.3.1 Wind speed and direction
To account for possible riming effects in the wind speed and direction measurements, data were flagged as erroneous if the wind speed was 0 m s−1 for more than 1 h or if the wind direction did not change within a defined threshold for three or more consecutive measurements. The threshold was set to 3 ° based on the sensor resolution given by the manufacturer. Wind speed for gusts was not given an extra riming flag. The riming flags for the 10 min averages can be applied to the gust values if needed.
2.3.2 Radiation
Four-component radiation is measured at both AWSs (shortwave incoming and outgoing/reflected, longwave incoming and outgoing). The radiometers were calibrated on 3 September 2018 and 23 May 2017 for AWS_MWK and AWS_VKm, respectively, with corresponding sensitivities at the time of calibration of and V W−1 m2. Longwave (LW) radiation is corrected with the sensor temperature so that
where LW_Cor is the corrected radiation value, LW is the measured 10 min average of incoming or outgoing longwave radiation, Tsensor is the 10 min average sensor temperature in Kelvin (logged as “NR01K_Avg” in the data files), and σ is the Stefan–Boltzmann constant. No quality flags were set for longwave radiation aside from basic outlier and gap detection.
Shortwave (SW) radiation was flagged if the value for outgoing radiation was greater than the value for incoming radiation. This predominantly occurs when the Sun is below the horizon. Daytime occurrences are relatively rare but also present in the dataset, particularly in winter. This might occur due to site-specific geometric or topographic effects (e.g. reflection effects or the Sun shining into the down-facing sensor at low Sun angles), hoar frost or rime on the sensor, or sensor drift. The total percentages of flagged SW values are about 35 % at AWS_MWK and about 50 % at AWS_VK (Table 5). Considering only daytime hours, around 6 %–7 % of the data have flags for SW outgoing > SW incoming.
2.3.3 Snow height and precipitation
Both stations are equipped with ultrasonic sensors to measure snow height. The distance value measured by the sensors is corrected with air temperature so that
and
where Dist_Cor is the corrected distance value in metres, Dist_Avg is the 10 min mean as logged at the station, Tair_Avg is the 10 min mean air temperature, h_s is the height of the sensor above the ground, and snow_h is the snow height. Negative values were flagged as errors. Due to a substantial amount of noise and outliers in the data, any value where the difference from the subsequent value is greater than 2 cm was flagged to indicate that it should be treated with caution. In a second filtering step, the difference of each remaining value from the 48 h running mean was computed and values more than 15 cm higher or lower than the mean were additionally flagged. The negative-value flag accounts for most of the flagged percentage value given in Table 5. The remaining flags make up about 5 % of the total at AWS_VK and 15 % at AWS_MWK, which has more frequent occurrences of flags for a large difference between consecutive data points. A comparison of outlier-filtered snow depth data and the complete, unfiltered dataset is shown in Figs. S1 and S2 in the Supplement. At both stations, the ultrasound sensors failed after approximately two seasons of operations, with some prior deterioration of data quality. Sensor replacements are planned for the 2023/24 season. The location of AWS_VK is very wind-exposed, and snow rarely accumulates in the immediate vicinity of the station. Accordingly, the snow height data from AWS_VK are not representative of the surrounding area. AWS_MWK is in a more sheltered location where snow accumulates and builds a seasonal snowpack.
At AWS_MWK, an unheated precipitation gauge is used to measure precipitation. These data are considered reliable only for liquid precipitation and under the assumption that the gauge is not affected by rime or snow cover, i.e. for rain in the warmer seasons. As a first-order filter, precipitation data are flagged as unreliable when air temperature is between 0 and 4 °C and as erroneous when air temperature is below freezing. This results in almost 80 % of the data being flagged for low-temperature criteria (Table 5).
3.1 Glaciological parameters
3.1.1 Intermediate measurements
The intermediate datasets contain stake readings throughout the summer seasons and snow pit data for the spring and autumn surveys. The VK dataset contains readings for three ablation stakes at the neighbouring SK in addition to the stakes at VK. In total, the VK intermediate dataset contains measurements for 32 spring snow pits, 17 autumn snow pits, and 497 intermediate stake readings. The MWK intermediate dataset contains 61 spring snow pit measurements, 37 autumn pits, and 849 stake readings.
The median number of days between the spring survey and the fixed date (30 April) is 11 d at VK and 6 d at MWK. In autumn, the median difference is 5 d at VK and 8 d at MWK. Ablation stake readings typically begin in late June or July once the seasonal snow cover has mostly melted and are carried out in irregular intervals depending on the conditions (Fig. 4a). The corrections applied to floating-date spring and end-of-season surveys to arrive at corresponding fixed-date values have a range of roughly −600 to +400 mm w.e. and correlate broadly with the number of days between the floating and fixed dates (Fig. 4b). The mass balance error associated with the different data types is lowest for the intermediate readings of stake data (Fig. 4c). Compared to the stake readings, intermediate snow pit data have a higher uncertainty associated with the method of the measurement as well as more variation in density and higher density uncertainty. Uncertainty values for the intermediate measurements are in a similar range to those found by Geibel et al. (2022).
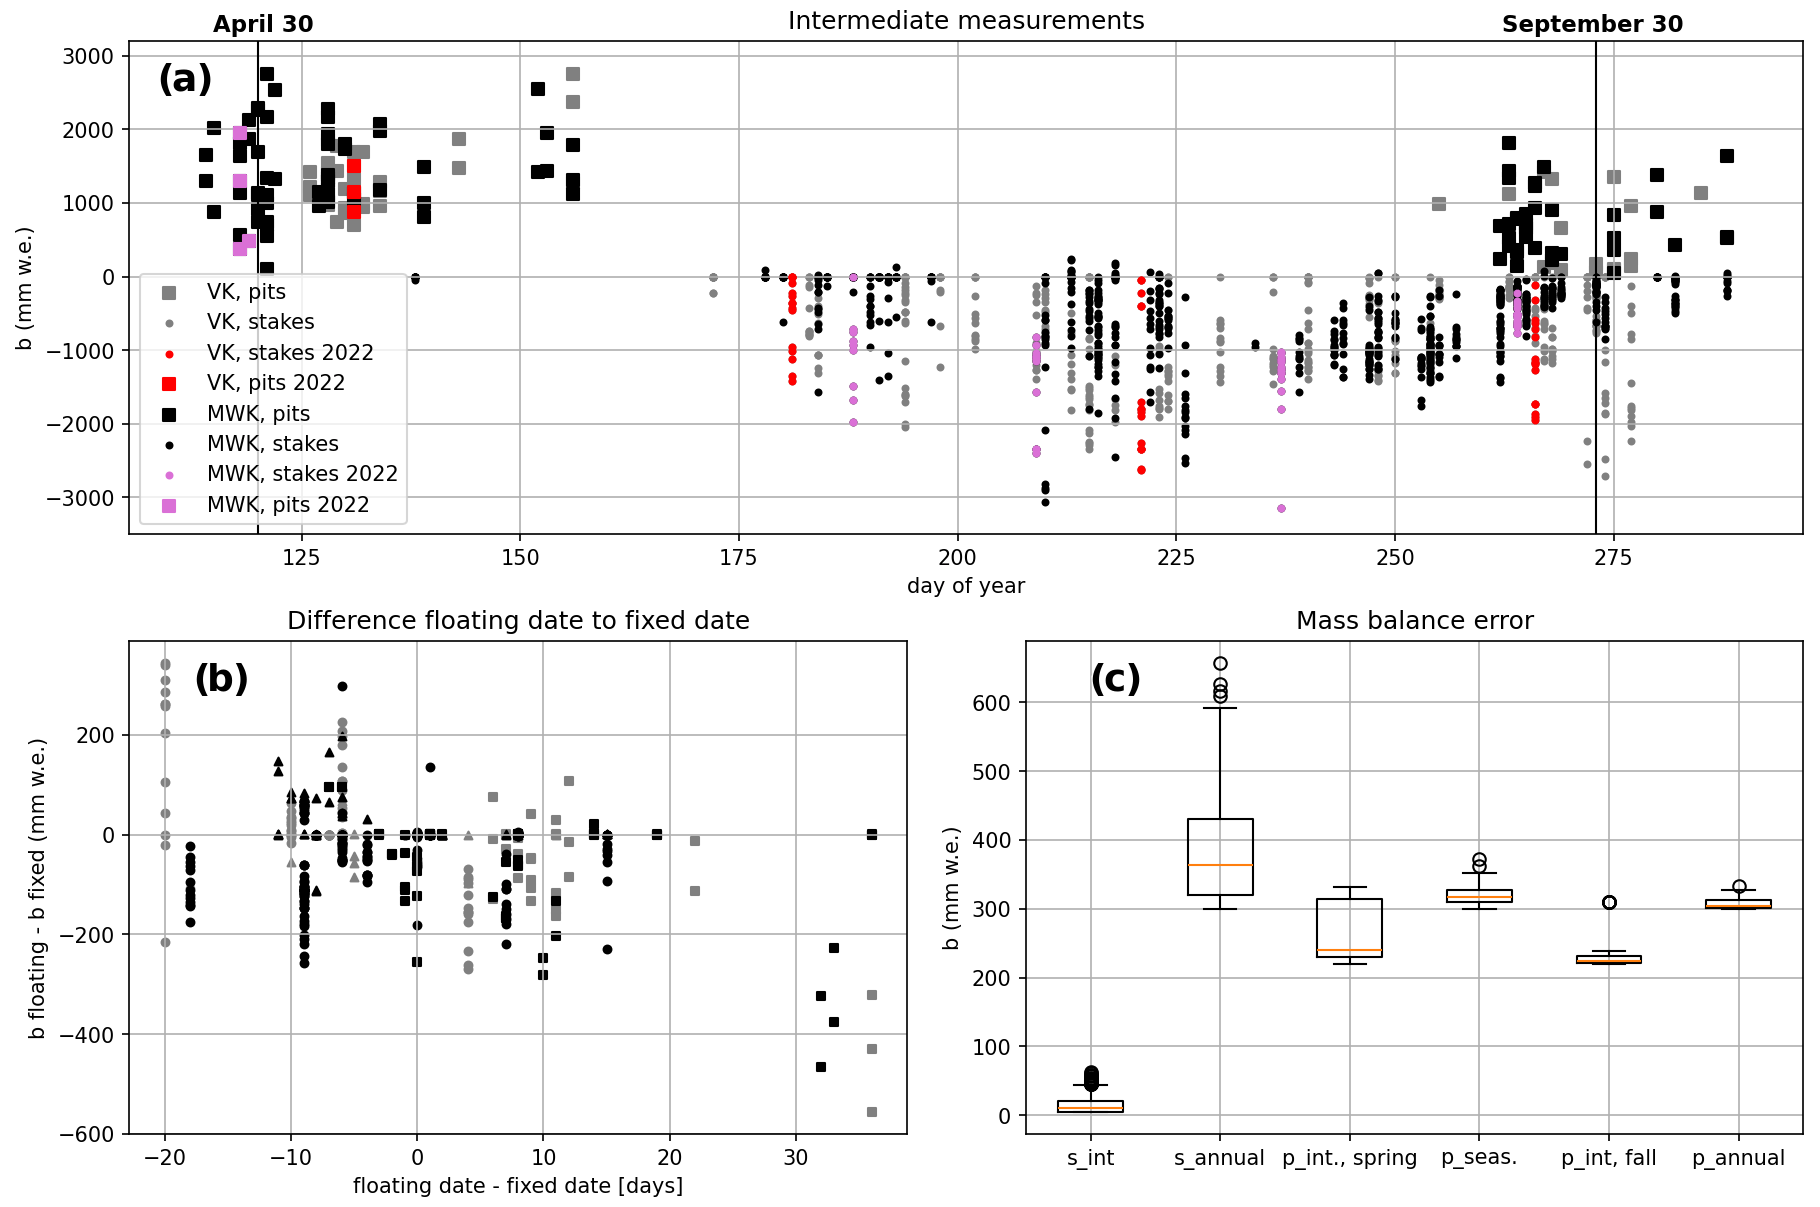
Figure 4(a) Intermediate mass balance measurements (pits and stakes) at both sites plotted against the day of the year (all years of the time series). The black vertical lines indicate 30 April (day of year 120) and 30 September (day of year 273) in non-leap years. Positive stake readings were recorded in some cases at MWK to indicate the formation of superimposed ice at the stake. Zero values indicate that the stake was snow-covered during the measurement period and that no ablation took place. Data for the 2022 mass balance year are highlighted in red. No autumn snow pits were dug in 2022 since no snow remained at the pit locations. (b) Difference of floating-date and fixed-date mass balance values for the spring and autumn snow pits and the stake readings closest to the autumn fixed dates. Positive values on the x axis mean that the floating-date measurement took place after the corresponding fixed date. Positive values on the y axis mean that b (floating date) > b (fixed date). (c) Mass balance error for intermediate stake readings (s_int), annual fixed-date stake values (s_annual), floating-date spring snow pit data (p_int, spring), fixed-date winter values at the snow pit locations (p_seas), floating-date autumn snow pit data (p_int, autumn), and fixed-date annual values at the snow pit locations (p_annual).
Figure 5 shows cumulative ablation at the selected stakes (see Figs. 2 and 3 for the stake positions) to illustrate the sub-seasonal resolution of the intermediate stake data. The figure highlights the range of ablation rates and the length of the ablation season at different stakes as well as interannual variations at each stake; 2022 stands out as an exceptional year, particularly at higher elevations. VK Stake 95 (Fig. 5a) is a relatively low-elevation stake on the tongue of VK (elevation VK Stake 95: 2583–2595 m). Here, the overall ice loss of summer 2022 and the seasonal progression are comparable to 2015, another very negative year. VK Stake 100 (Fig. 5b) and MWK Stake 11 (Fig. 5c) are at higher elevations (VK Stake 100: 2855–2882 m; MWK Stake 11: 3027–3055 m), and ablation begins 1 to 2 months later than at VK Stake 95 in most years of the time series. At these stakes, 2022 was unprecedented in the time series in terms of the total ablation as well as the length of the ablation season.
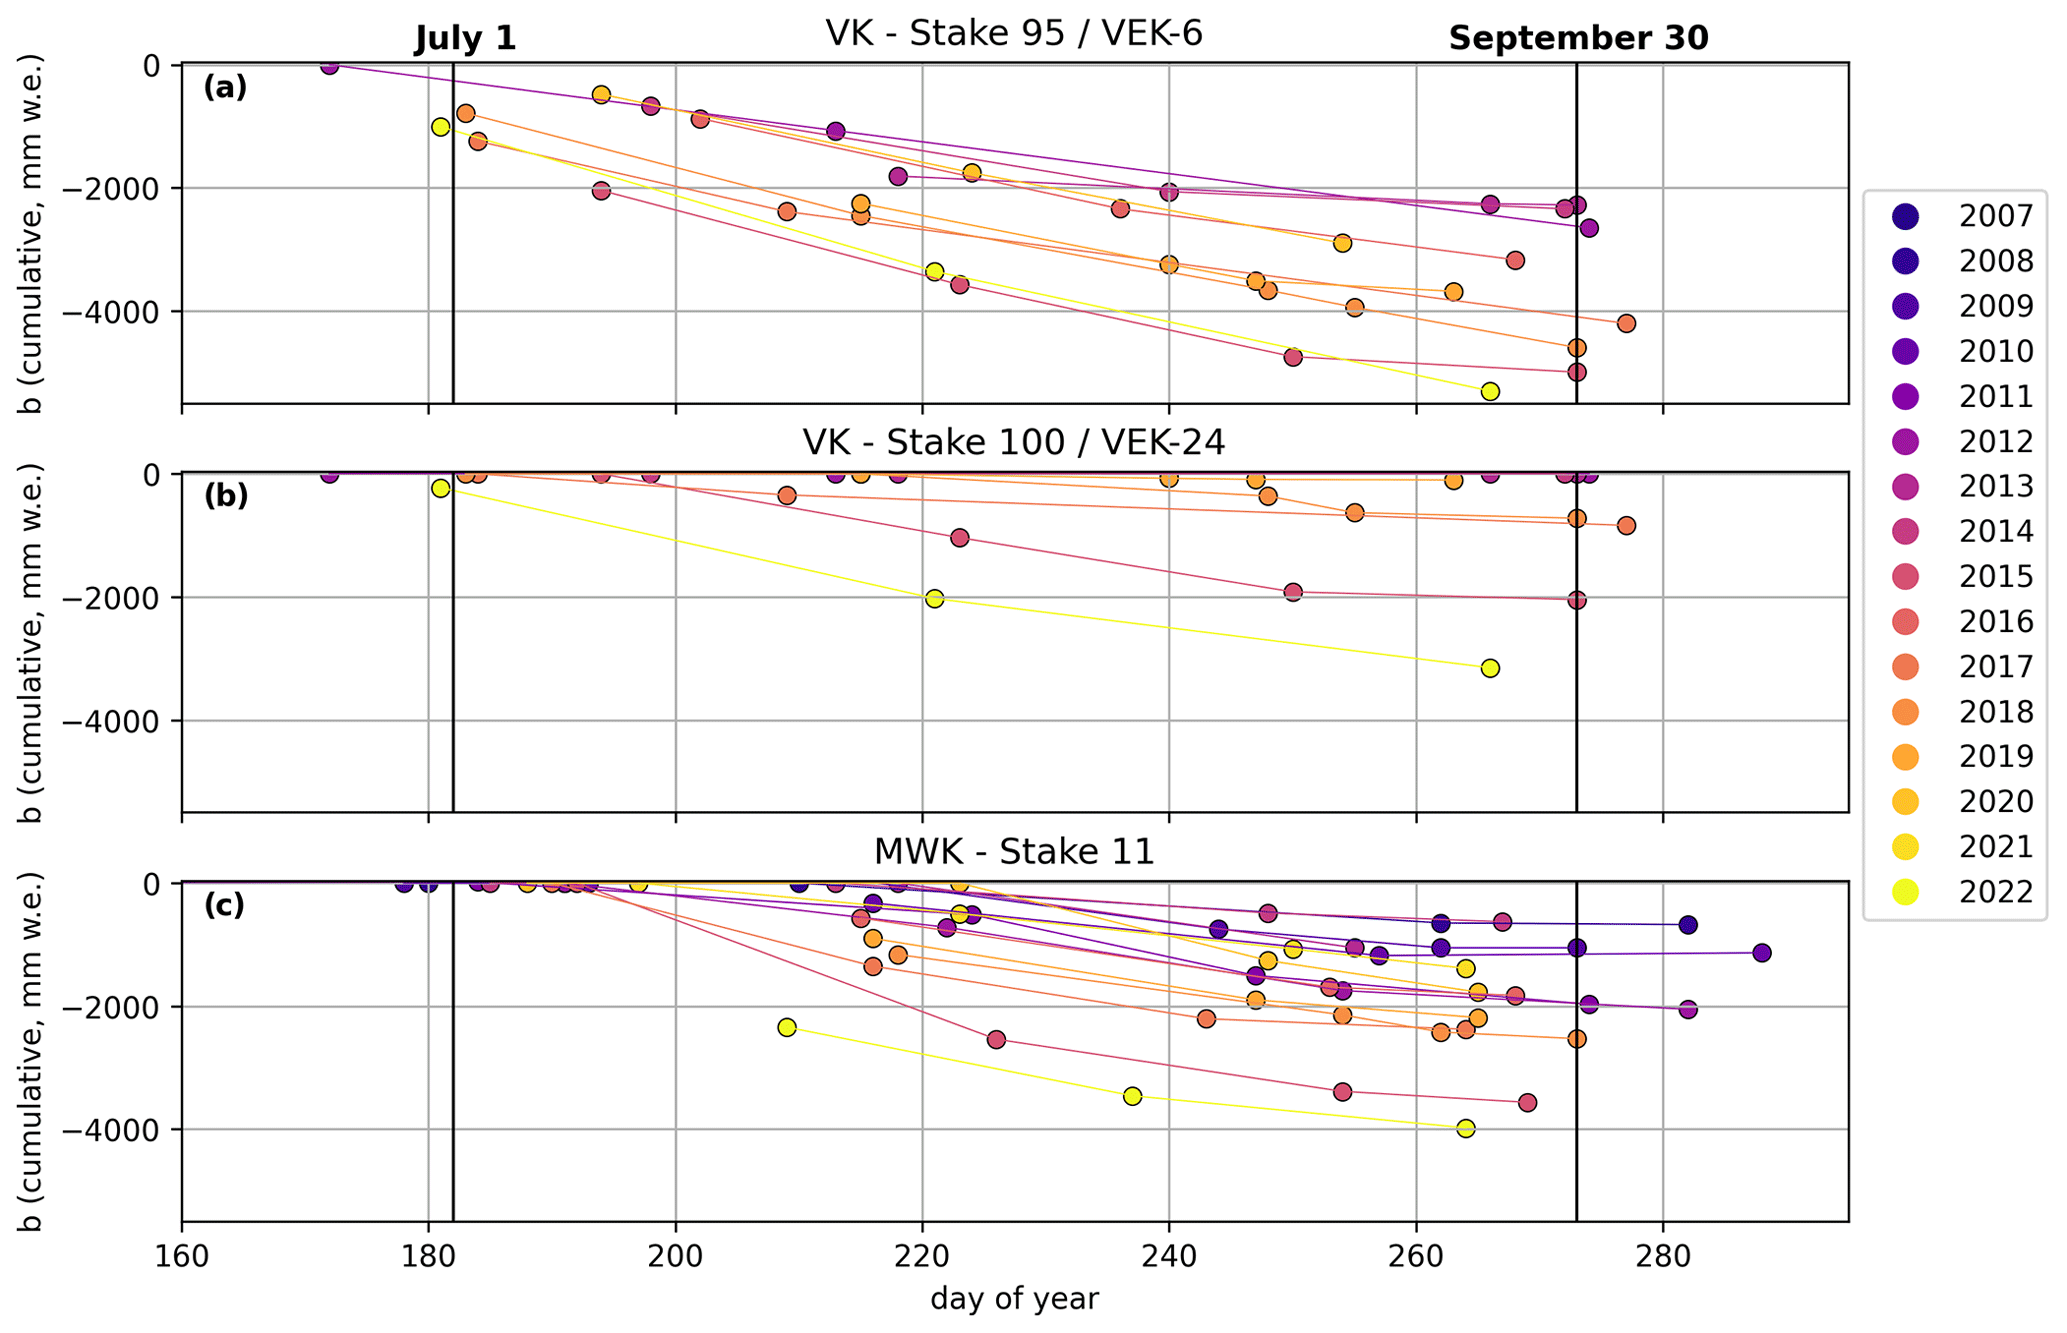
Figure 5Intermediate cumulative mass balance at three selected stakes plotted against the day of year of the respective measurements. Minimum (maximum) elevation of VK Stake 95 (panel a, later renamed VEK-6) throughout the time series: 2583 m (2595 m). Minimum (maximum) elevation of VK Stake 100 (panel b, later renamed VEK-24): 2855 m (2882 m). Minimum (maximum) elevation of MWK Stake 11 (panel c): 3027 m (3055 m). The black vertical lines mark 1 July (day of year 182) and 30 September (day of year 273).
3.1.2 Annual and winter point mass balance and spatial integration
Counting ablation stakes and autumn snow pits, the number of annual fixed-date point mass balance data points varies between 12 and 20 per year at MWK and between 13 and 17 at VK (including the stakes at SK). The fixed-date data have higher mass balance errors than the intermediate measurements due to the added uncertainties in the density and measurement quality components of Eqs. (1) and (2). The density uncertainty is given relative to the mass balance, and hence the overall mass balance error is higher when the absolute magnitude of b is large. The fixed-date point mass balance data have higher mass balance errors than the intermediate data. The mass balance error is typically in the range of the ±30 cm “measurement quality” error added to account for the temporal extrapolation (Fig. 4c).
The most negative annual point mass balance of the VK time series was recorded at an elevation of 2536 m in 2022 with −5841 ± 657 mm w.e. At MWK, the most negative value of the time series was measured at 2728 m in 2012 with −4878 ± 573 mm w.e. The respective ablation stake was no longer operational during the very negative summer of 2022 due to the loss of glacier area at this elevation. In 2022, the lowest ablation stake of the MWK monitoring network was located at 2807 m and recorded an annual point mass balance of −4533 ± 544 mm w.e. Figure 6 shows the winter (panels a and b) and annual (panels c and d) fixed-date point mass balance for all ablation stakes and snow pits.
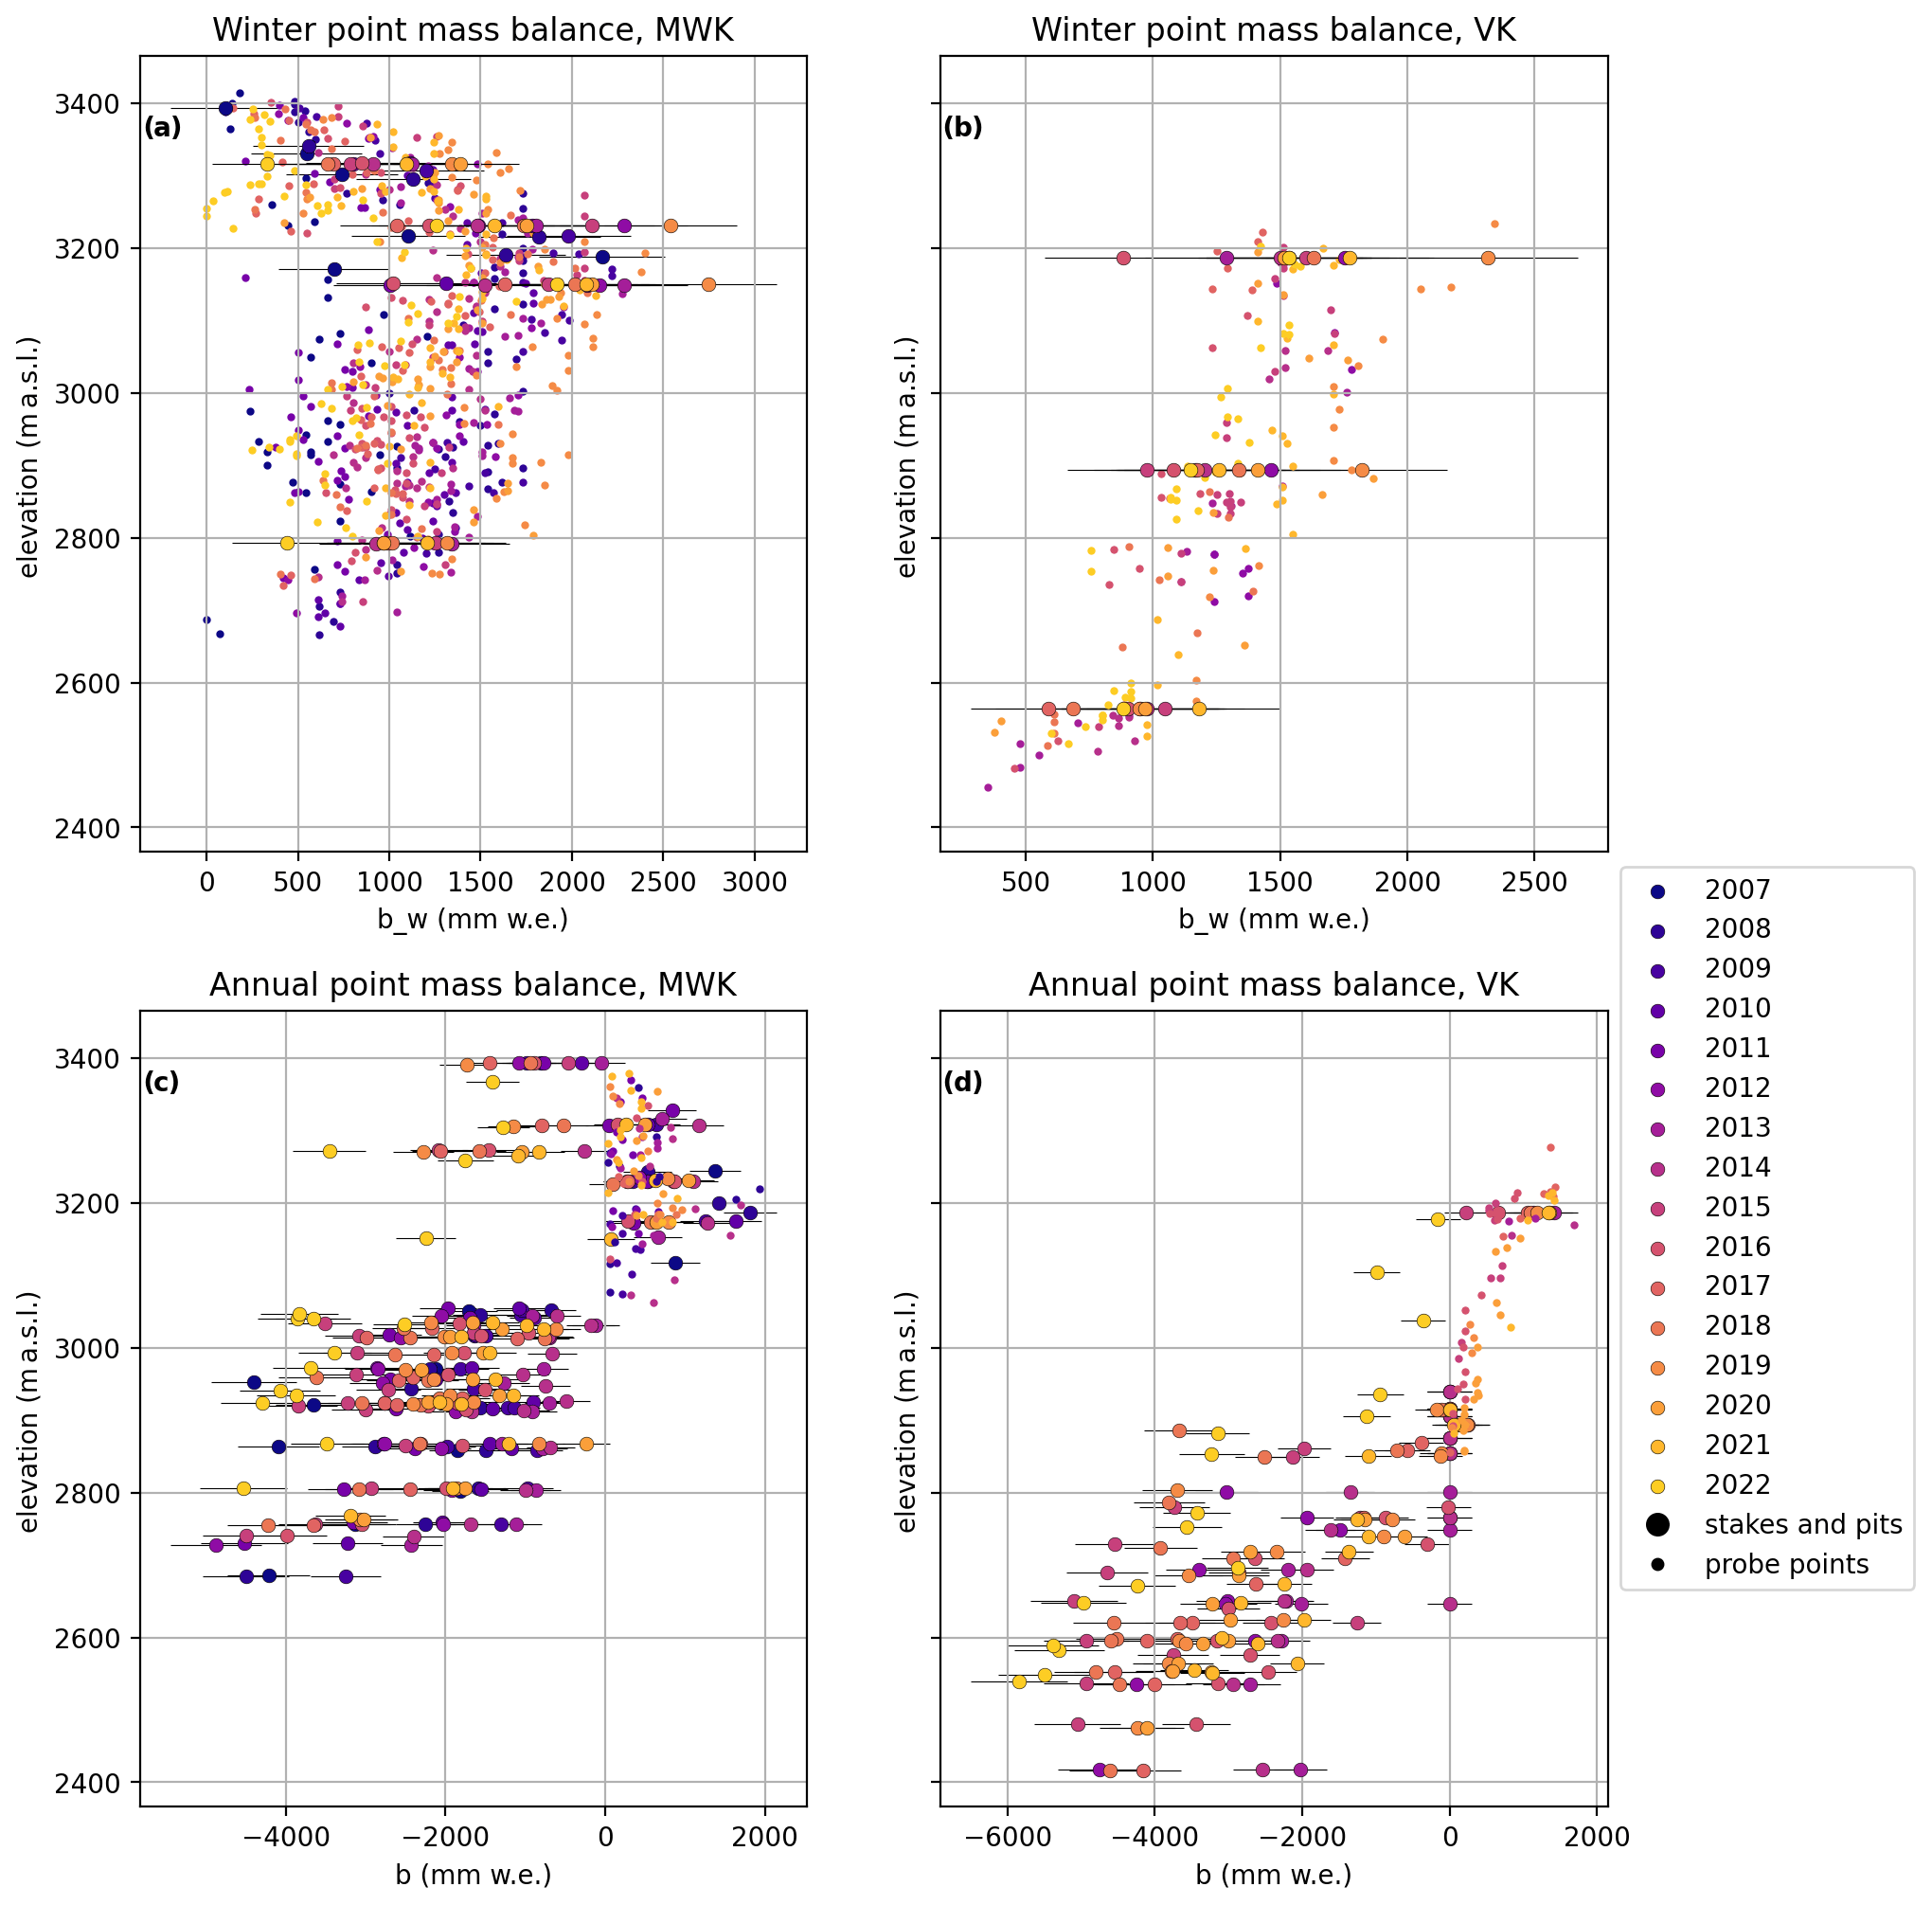
Figure 6Winter (a, b) and annual (c, d) point mass balances vs. the elevation of the measurement point, colour-coded by year for MWK (a, c) and VK (b, d). The mass balance error for stakes and snow pits is shown as the thin black lines. The small circles show the probe data used to inform the spatial integration of the point mass balance data to the glacier scale for both the winter and annual mass balances. Error bars for the probing points are not plotted for the sake of readability. The probing error is given in the data file and is computed from a 30 cm quality error for the fixed-date interpolation, the type error, and the density error.
Accumulation is typically measured at three snow pit locations at VK and four at MWK; 2022 was the first year in which no snow remained in autumn at the snow pit locations at either glacier, and hence no accumulation was measured. Winter mass balance tends to increase with elevation at VK (Fig. 6b), while MWK (Fig. 6a) has a non-linear mass balance gradient with maximum accumulation slightly below the summit region. This curve in the gradient is less pronounced but is also evident in the annual point mass balance data (Fig. 6c).
In addition to the fixed-date stake and snow pit point mass balance, Fig. 6 shows depth probing data within ±100 mm w.e. of the spatially integrated mass balance value for the given elevation zone for the spring and annual surveys, respectively. This represents only a relatively small fraction of the total probe points in the datasets, highlighting the challenges of the method and the importance of a high density of measurement points for capturing spatial variability. It is difficult to assess the uncertainties and errors of the snow probing data without additional information on the conditions during the measurement campaigns. Values flagged as not being in agreement with the annual elevation zone mass balance are often measurements of fresh snow depth and, hence, do not represent the annual mass balance. These data are used as additional information informing the extrapolation from the point scale to the elevation zones and glacier-wide mass balance. For the winter mass balance, snow depth probing aims to identify the previous year's firn horizon. Definitive identification of this horizon can be hampered by e.g. ice lenses in the snowpack. We include the probing datasets for the sake of completeness and transparency and encourage any potential users of these data to interpret them with caution.
Glacier-wide mass balance was derived from a minimum (maximum) of 12 (19) fixed-date point mass balance values at MWK and 13 (17) at VK, respectively. At VK, annual mass balance increases monotonically with elevation in most years, with some variation of patterns in the accumulation zone near the ice divide with Untersulzbachkees. As with the point mass balance data, 2022 stands out as an extremely negative year. Figures 7 and 8 show the manually drawn contour lines of mass balance and the resulting spatial pattern of fixed-date annual and winter mass balance as well as the fixed-date point mass balance data for each year and glacier. The magnitude of ablation in 2022 as well as the spatial patterns in the lower section of the glacier were broadly comparable to 2015 and 2018, while ablation in the upper sections (previously the accumulation area) was unprecedented in the period of record.
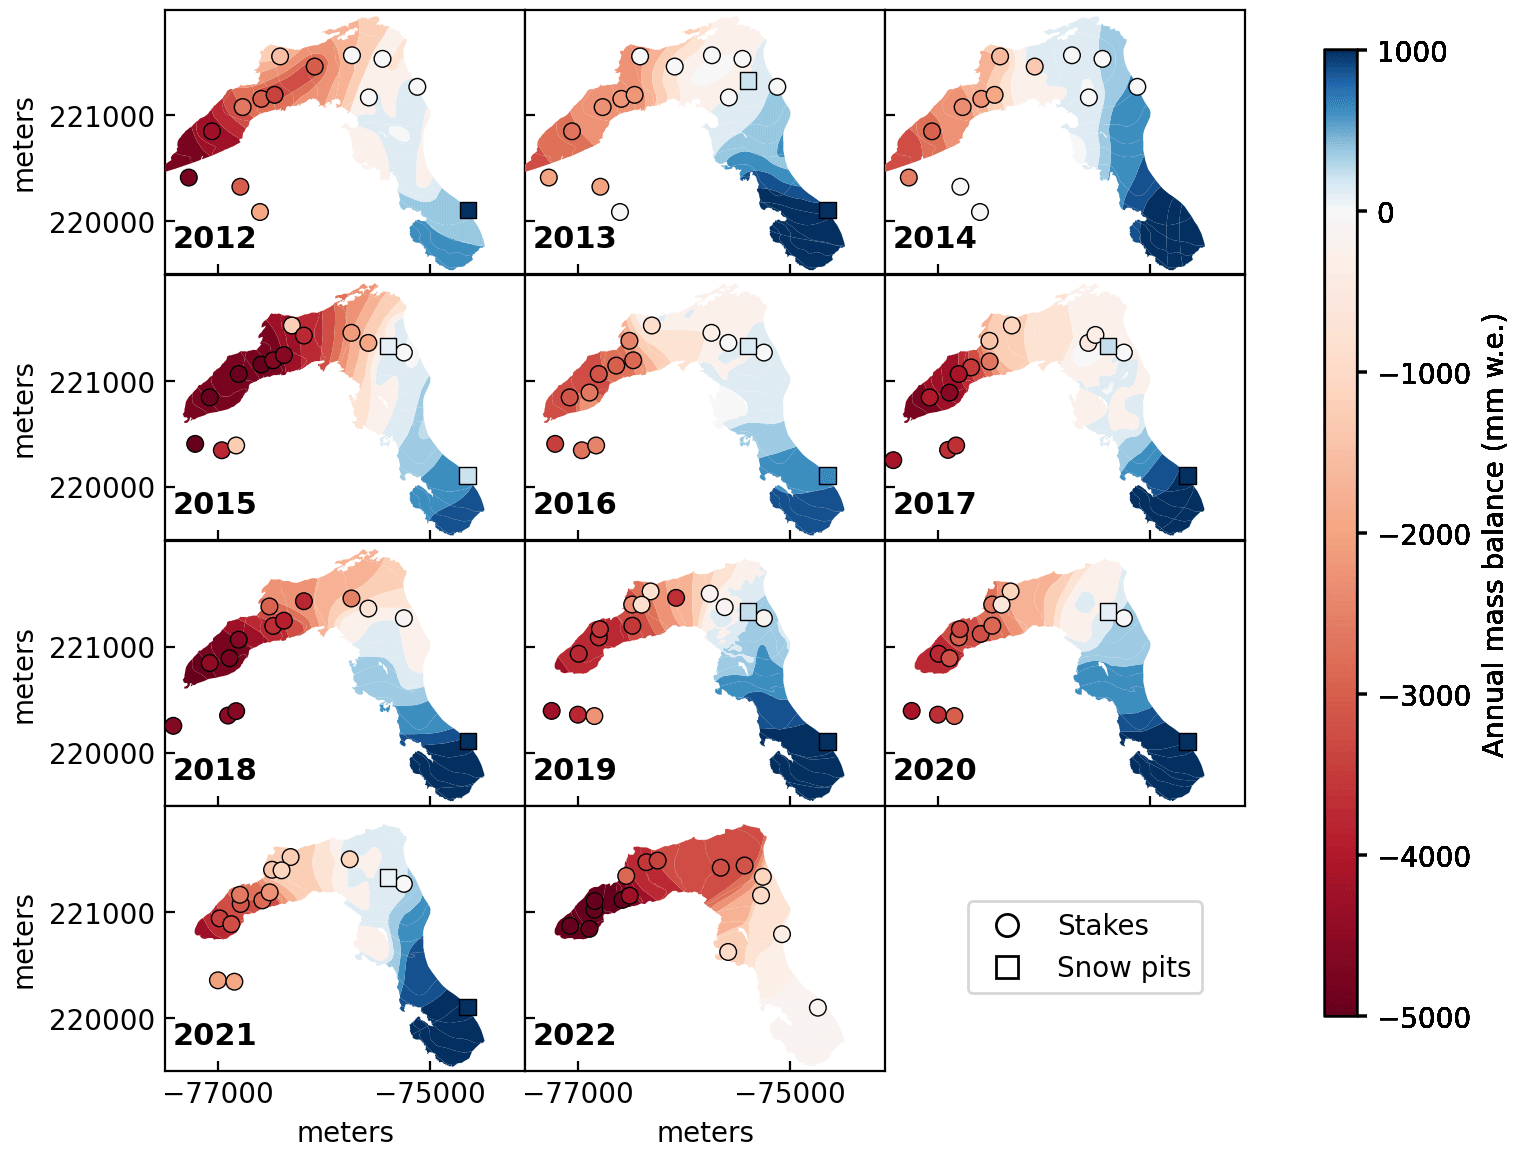
Figure 7Annual fixed-date point and elevation zone mass balance at VK, derived from contour lines of mass balance drawn at 250 mm w.e. intervals for positive values and 500 mm w.e. intervals for negative values. The colour scale is homogenized in the graphic for a consistent visualization, and the datasets contain the original contours. Circles: ablation stakes. Squares: snow pits. Coordinate reference system: MGI / Austria GK Central (EPSG:31255).
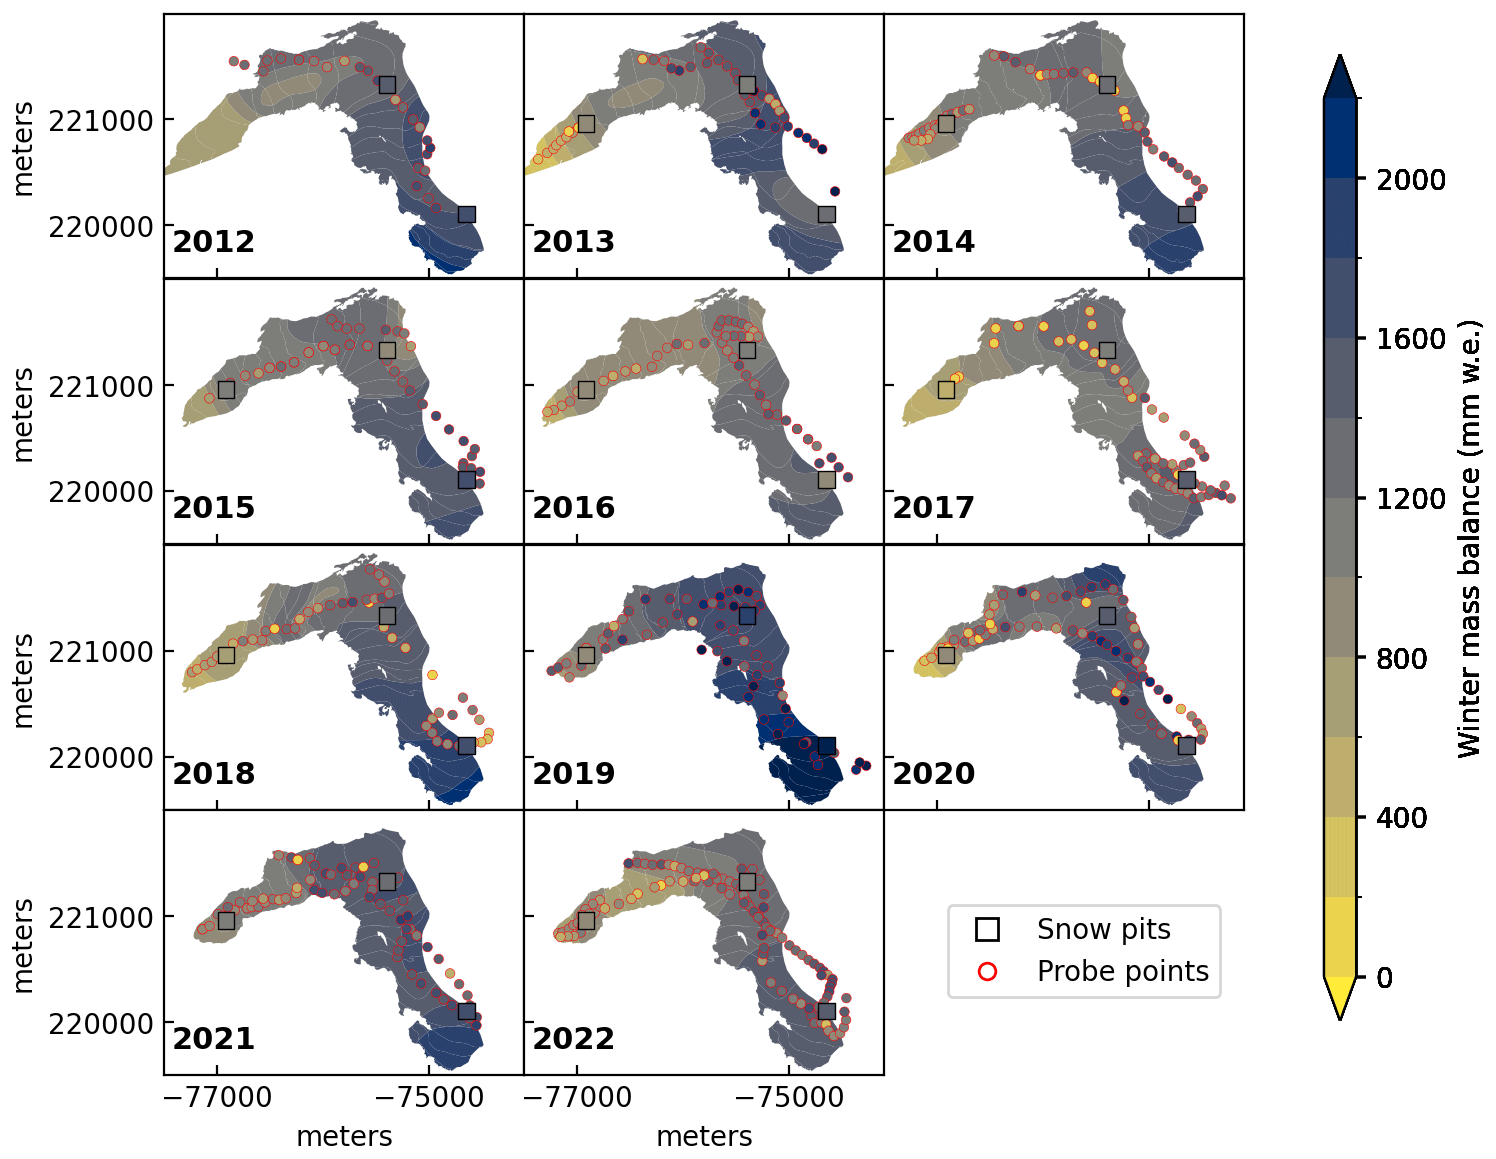
Figure 8Winter fixed-date point and elevation zone mass balance at VK, derived from contour lines of mass balance drawn at intervals of 200 mm w.e. Squares: snow pits. Small circles with red outlines: snow depth probing points. Coordinate reference system: MGI / Austria GK Central (EPSG:31255).
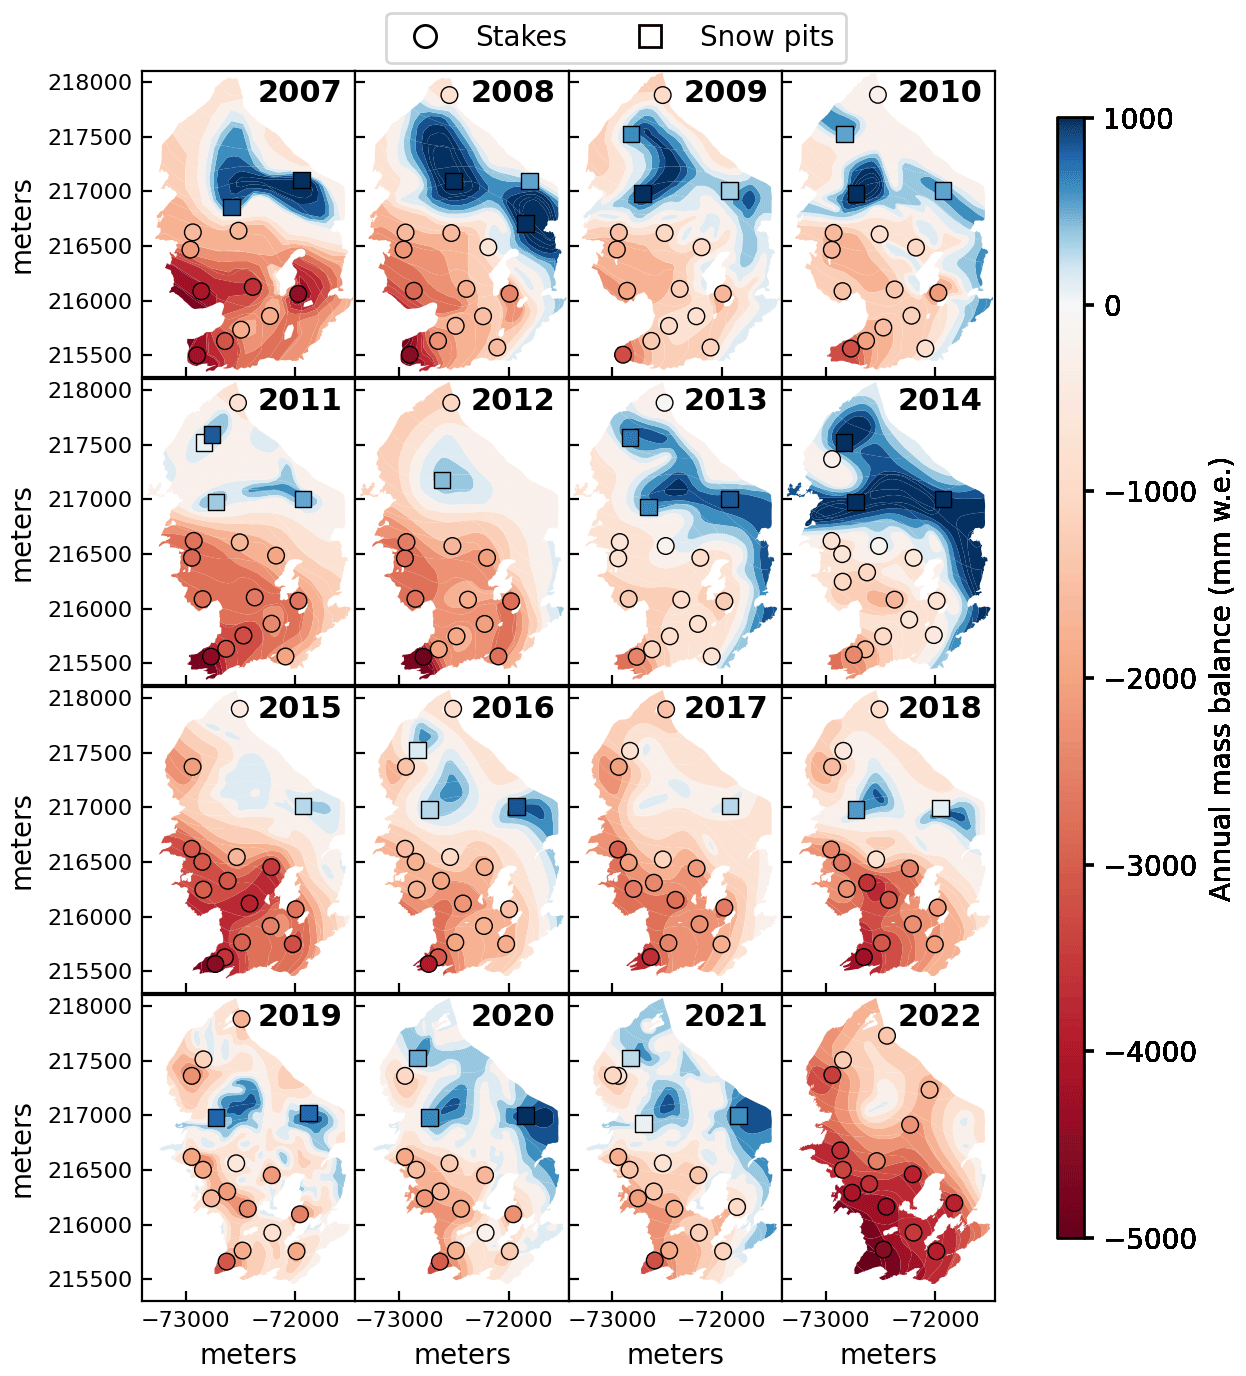
Figure 9Annual fixed-date point and elevation zone mass balance at MWK, derived from contour lines of mass balance drawn at 250 mm w.e. intervals for positive values and 500 mm w.e. intervals for negative values. The colour scale is homogenized in the graphic for a consistent visualization, and the datasets contain the original contours. Circles: ablation stakes. Squares: snow pits. Coordinate reference system: MGI / Austria GK Central (EPSG:31255).
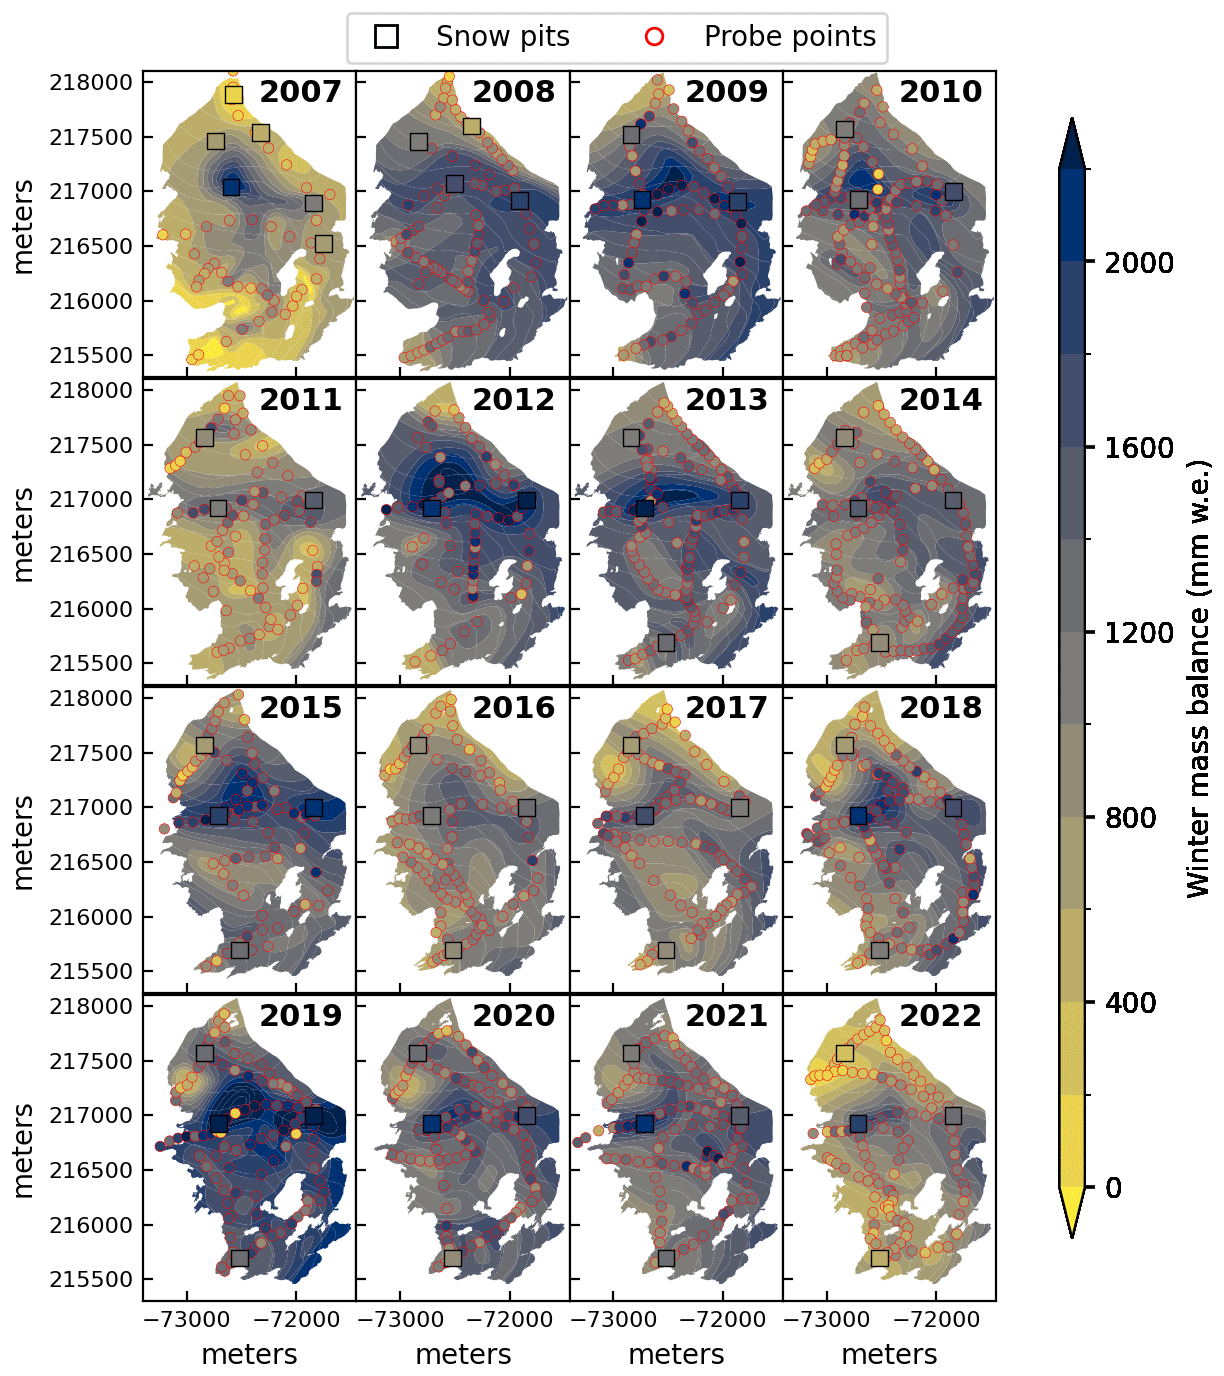
Figure 10Winter fixed-date point and elevation zone mass balance at MWK, derived from contour lines of mass balance drawn at intervals of 200 mm w.e. Squares: snow pits. Small circles with red outlines: snow depth probing points. Coordinate reference system: MGI / Austria GK Central (EPSG:31255).
At MWK, the spatial patterns in the contour line maps (Figs. 9 and 10, same method as for VK) provide additional insights into the curved mass balance gradient apparent in the point-scale data. Accumulation is typically greatest in an elevation band slightly below the highest sector of the glacier. Within this elevation band there are two distinct zones that tend to show the highest winter and annual accumulation (in 2022: the least ablation). These patterns are related to wind deposition and erosion of snow. Like at VK, the ablation in the upper regions of MWK in 2022 was unprecedented for the time series.
Comparing point mass balance data with the extrapolated mass balance map derived from the contour lines, it is apparent that point values generally match the spatially integrated values, but there are exceptions in both directions (point value greater than the spatially extrapolated value or less than the spatially extrapolated value). At VK, two to three stakes in the mid-section of the tongue have less negative values than the spatially integrated value, e.g. in 2015, 2019, and 2020. This is related to reduced ablation due to snow input from avalanches at these stake locations and constitutes a known bias that is manually corrected for when drawing the contour lines.
3.1.3 Glacier-wide annual and winter mass balance
The cumulative specific mass balance of MWK over the period of record (2007–2022) is −14.68 m w.e. (Fig. 11c). This amounts to about 16 m of ice loss in total or about 1 m of ice loss per year averaged over the entire glacier area. A slightly positive glacier-wide annual mass balance was recorded in 2013/14 (b: 117 mm w.e., Fig. 11a). All other years of the time series were characterized by mass loss. The most negative season to date was 2021/22 with a specific mass balance of −2449 mm w.e.
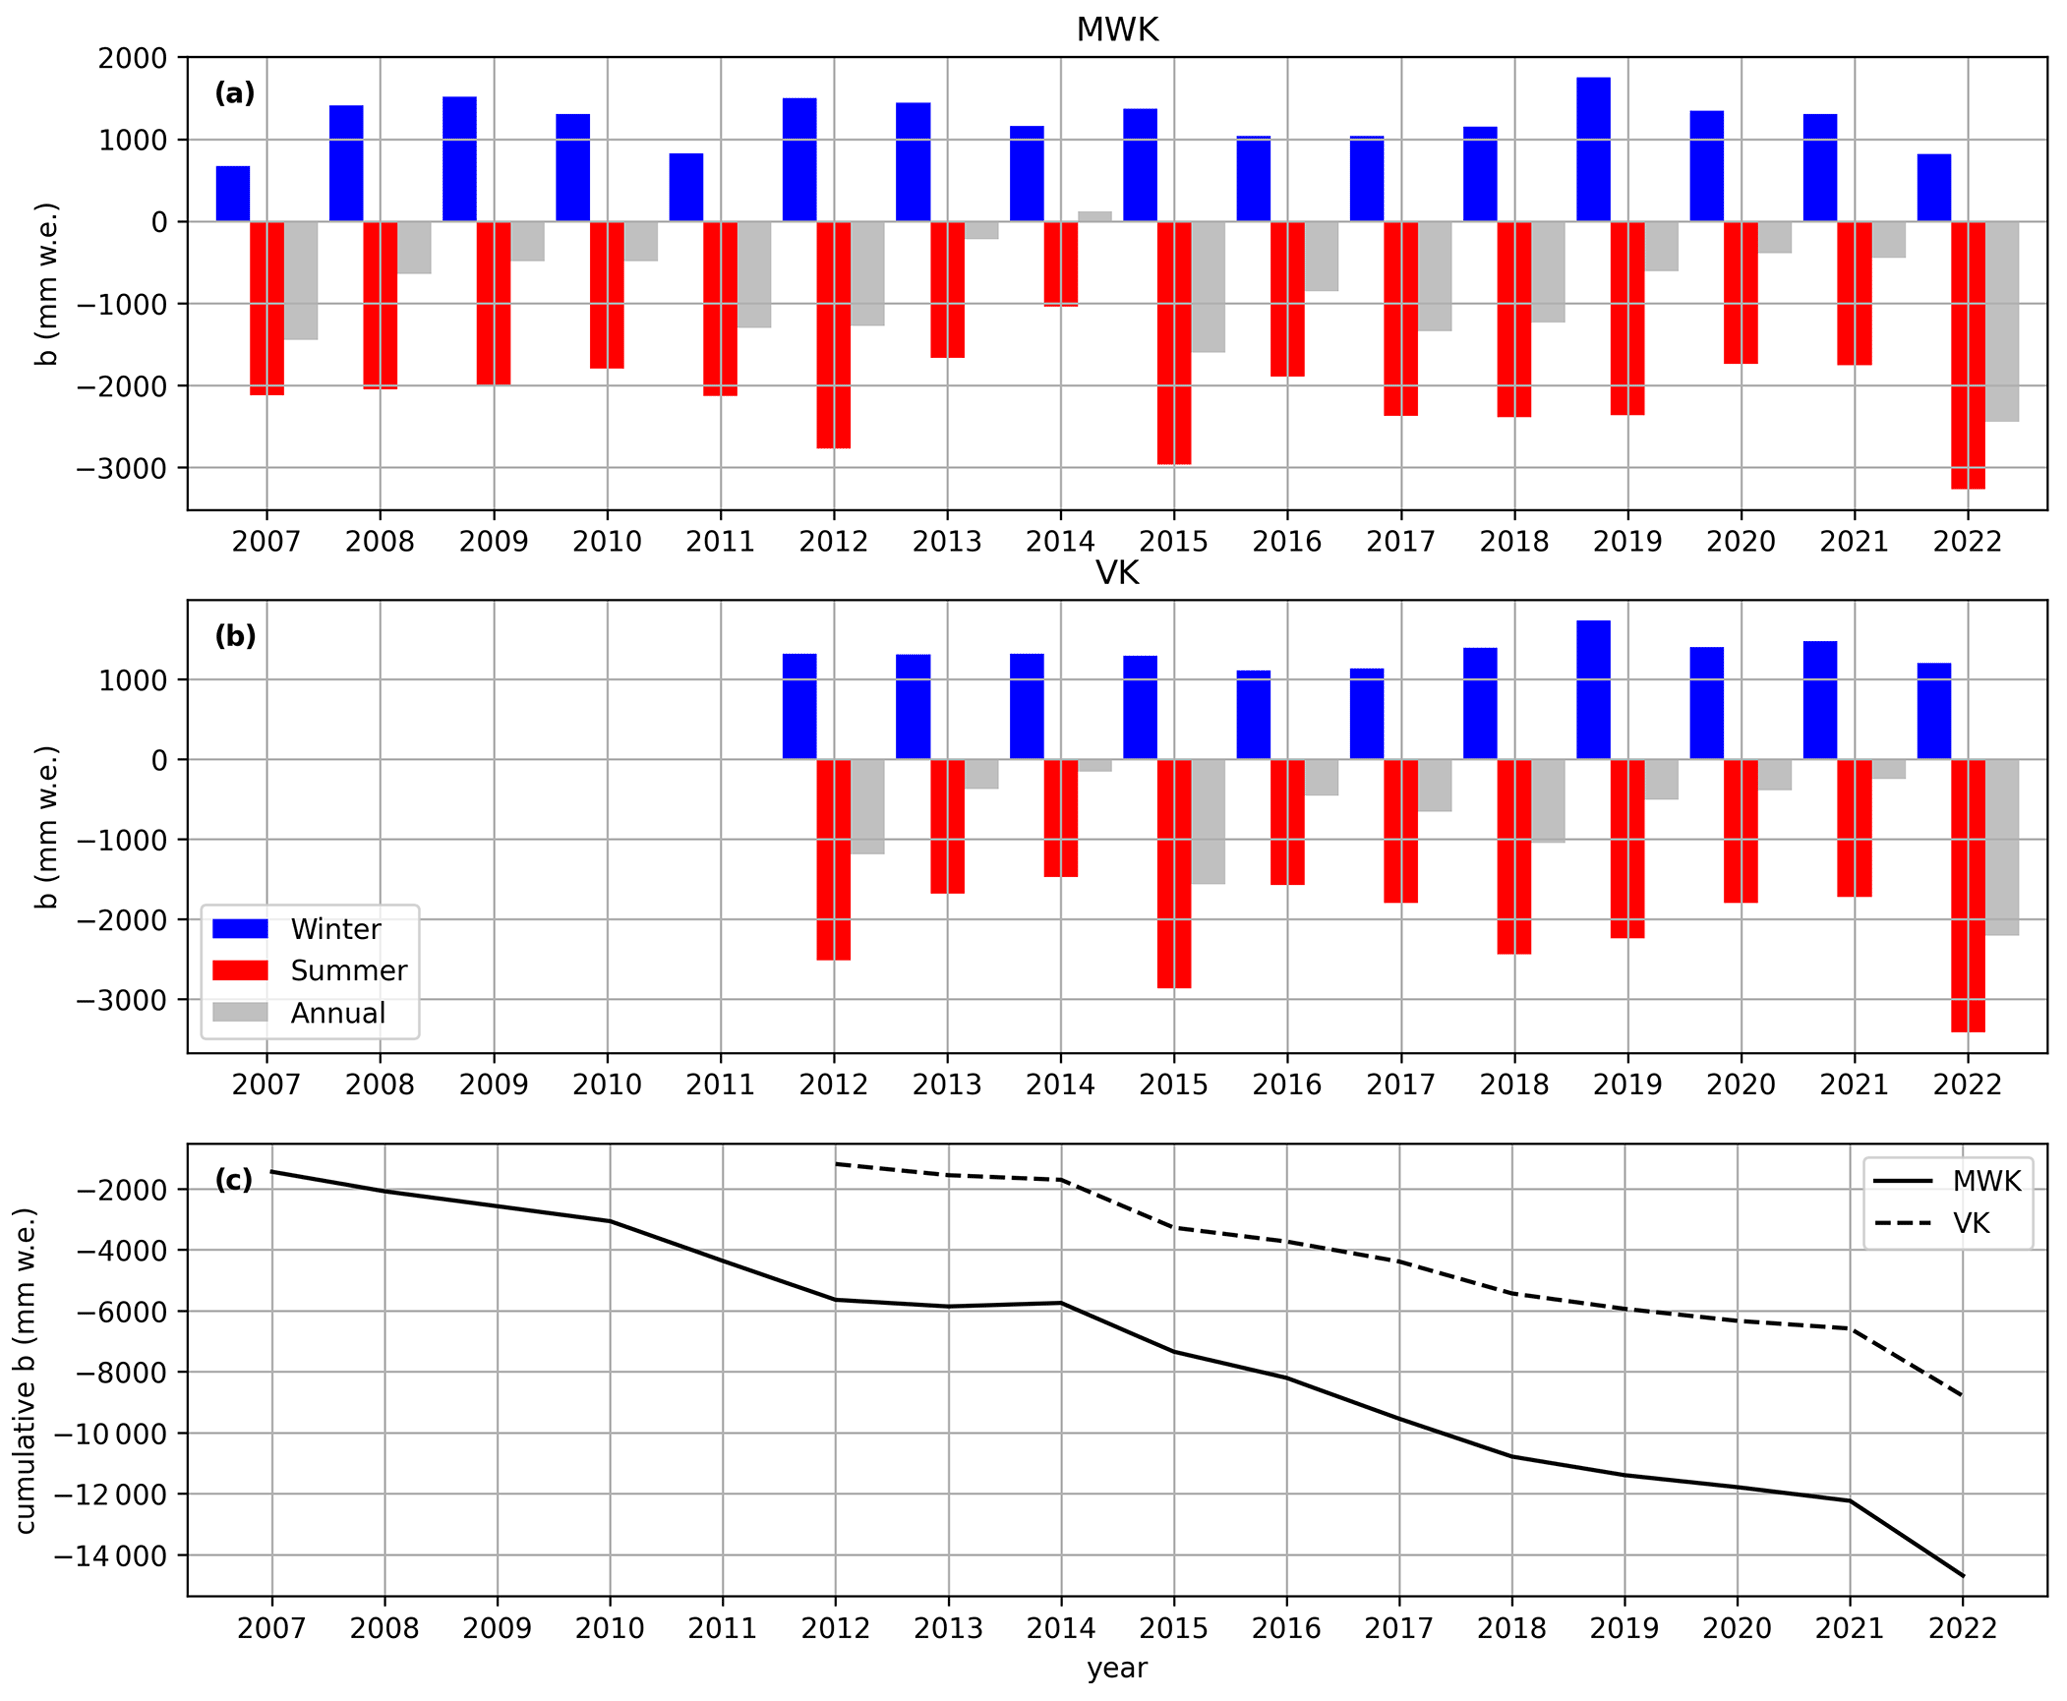
Figure 11Seasonal (winter, summer) and annual glacier-wide specific mass balance at MWK (panel a) and VK (panel b). Panel (c) shows the cumulative specific mass balance at MWK and VK.
The shorter time series of VK (2012–2022) shows a cumulative specific mass balance of −8.79 m w.e., i.e. not quite 10 m of ice loss (Fig. 11c). All years of the time series had a negative annual mass balance (Fig. 11b). The 2013/14 season was the least negative of the time series with mm w.e. Like at MWK, the greatest losses were recorded in 2021/22 with mm w.e.
The standard deviations of b are 645 and 639 mm w.e. at MWK and VK, respectively. The annual variability of the winter mass balance is considerably lower at both sites, with standard deviations of 292 and 171 mm w.e., respectively. At MWK, 2006/07 had the lowest specific winter mass balance (bw) of the time series with 674 mm w.e., followed by 2021/22 with 816 mm w.e. At VK, bw was lowest in 2015/16, with 1116 mm w.e. The largest winter accumulation was recorded in 2018/19 at MWK (bw=1751 mm w.e.) and in 2016/17 at VK (bw=1735 mm w.e.).
Figures 12 and 13 show seasonal and annual mass balance by elevation zones for both sites. At VK, the highest-elevation zones generally see the greatest winter accumulation and the lowest summer and annual ablation, as in the point data and the contour line maps. In contrast, at MWK, the greatest winter snow accumulation is usually found about 200–300 m below the highest sections of the glacier due to local wind drift and deposition patterns. Annual and summer ablations show similarly curved gradients with higher loss rates in the uppermost elevation zone (3400–3450) than between approximately 3100 and 3200 m.
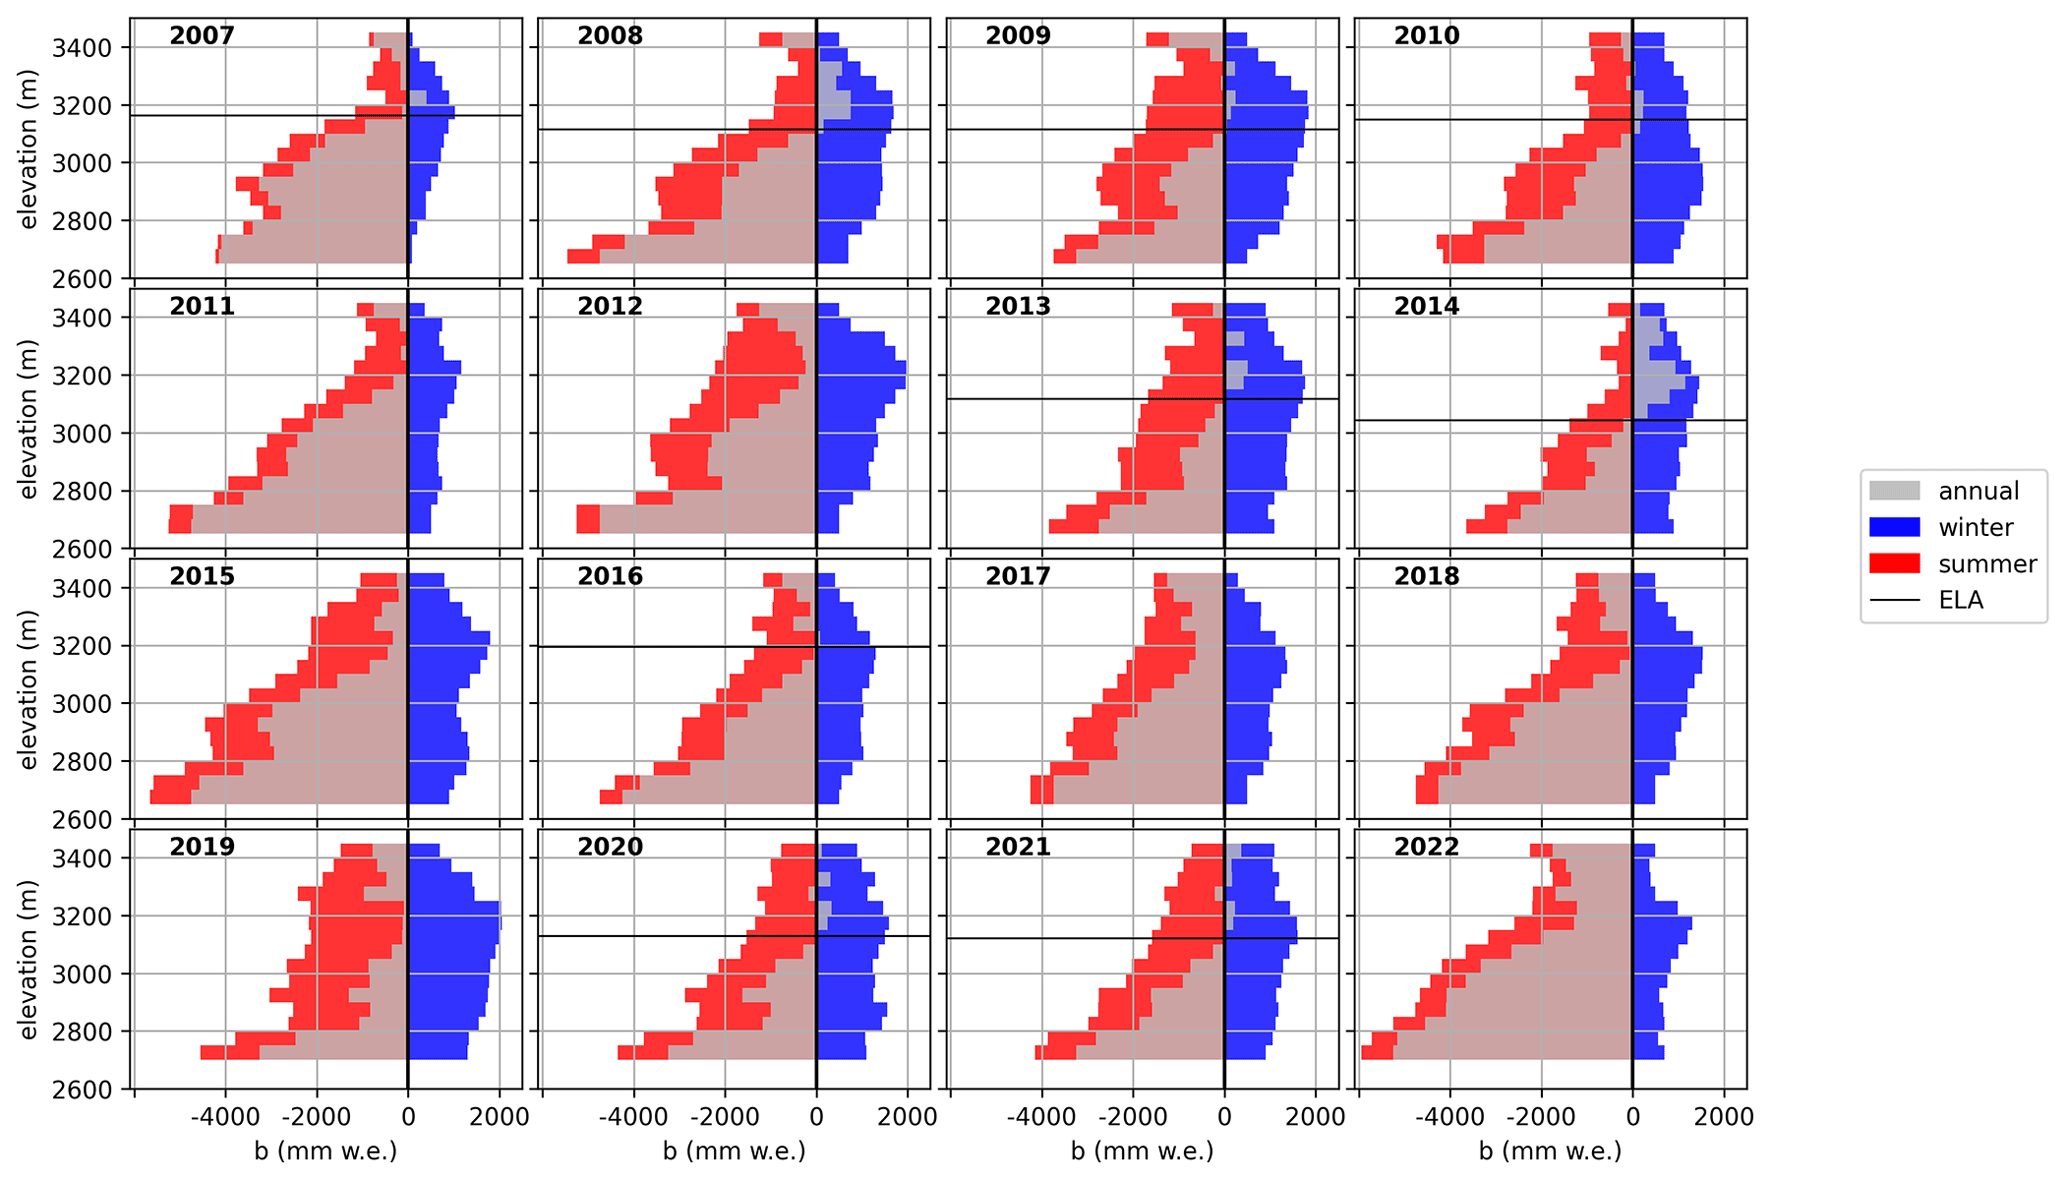
Figure 12Annual and seasonal fixed-date specific mass balance per 50 m elevation zones at MWK (2007–2022). Horizontal lines indicate the equilibrium line altitude (ELA); ELA is not plotted when it is above the summit elevation.
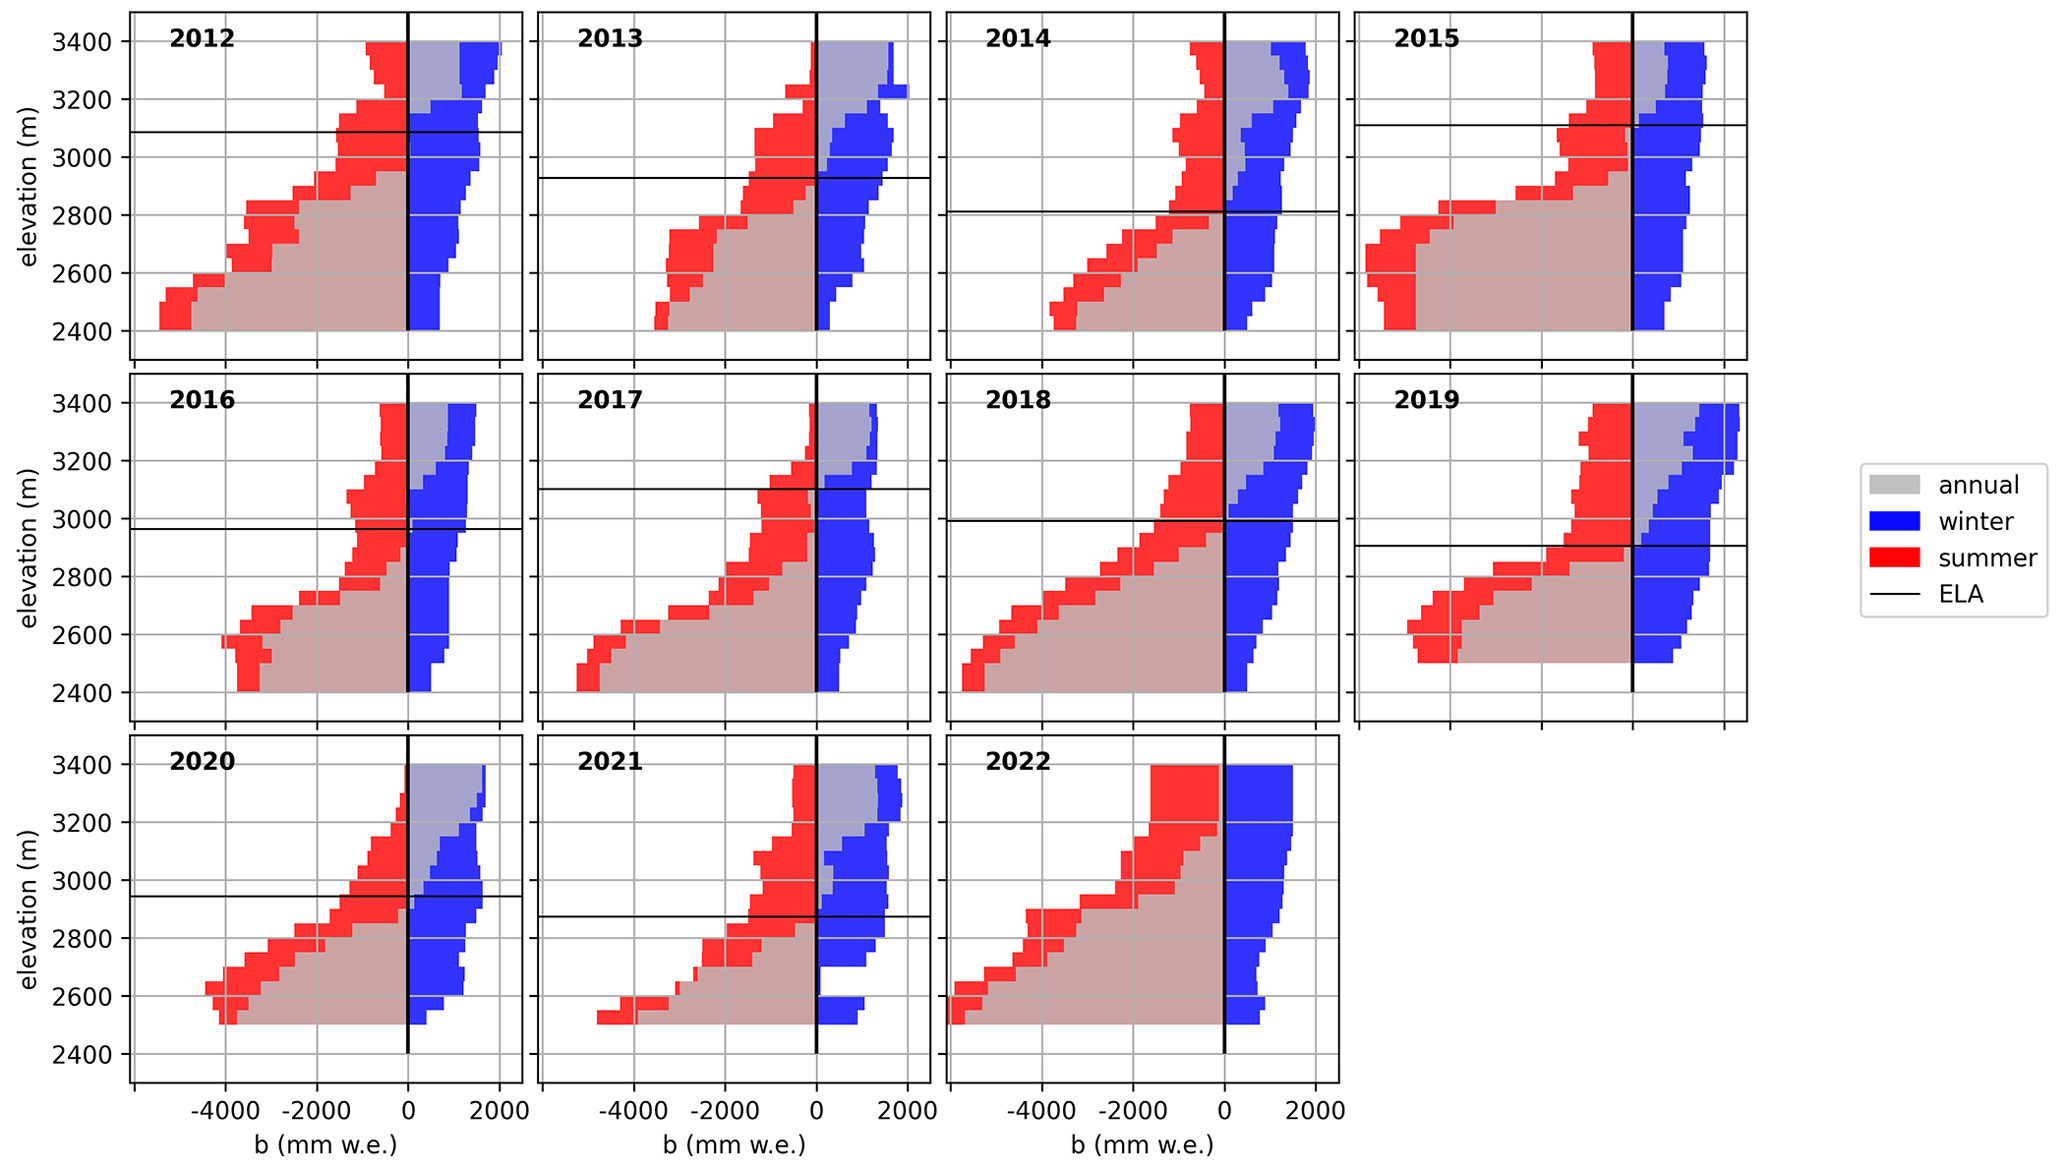
Figure 13Annual and seasonal fixed-date specific mass balance per 50 m elevation zones at VK (2012–2022). Horizontal lines indicate the ELA; ELA is not plotted when it is above the summit elevation.
3.2 Meteorological parameters
The AWS datasets show seasonal and diurnal variations of temperature, humidity, radiation, and other measured parameters, in line with expectations for the station locations and elevations (Figs. 14 and 15). January and December are the coldest months at both sites. July and August are the warmest months on average. The mean daily high temperatures in July are 7.4 °C at AWS_MWK and 5.8 °C at AWS_VK. The mean daily temperature amplitude is also highest in the summer months, reaching 3.8 °C in June at AWS_MWK and 2.3 °C in July and August at AWS_VK. Considering the monthly mean temperatures (Table S1 in the Supplement), September 2023 stands out as exceptionally warm. September was the warmest month of the year in 2023. The all-time highest and lowest temperatures measured at AWS_MWK were 15.9 °C on 22 August 2023 (13:20 UTC) and −23.82 °C on 14 February 2021 (06:30 UTC), respectively. At AWS_VK, the corresponding values were 15.02 °C on 6 September 2023 (11:40 UTC) and −23.86 °C on 11 December 2022 (20:40 UTC).
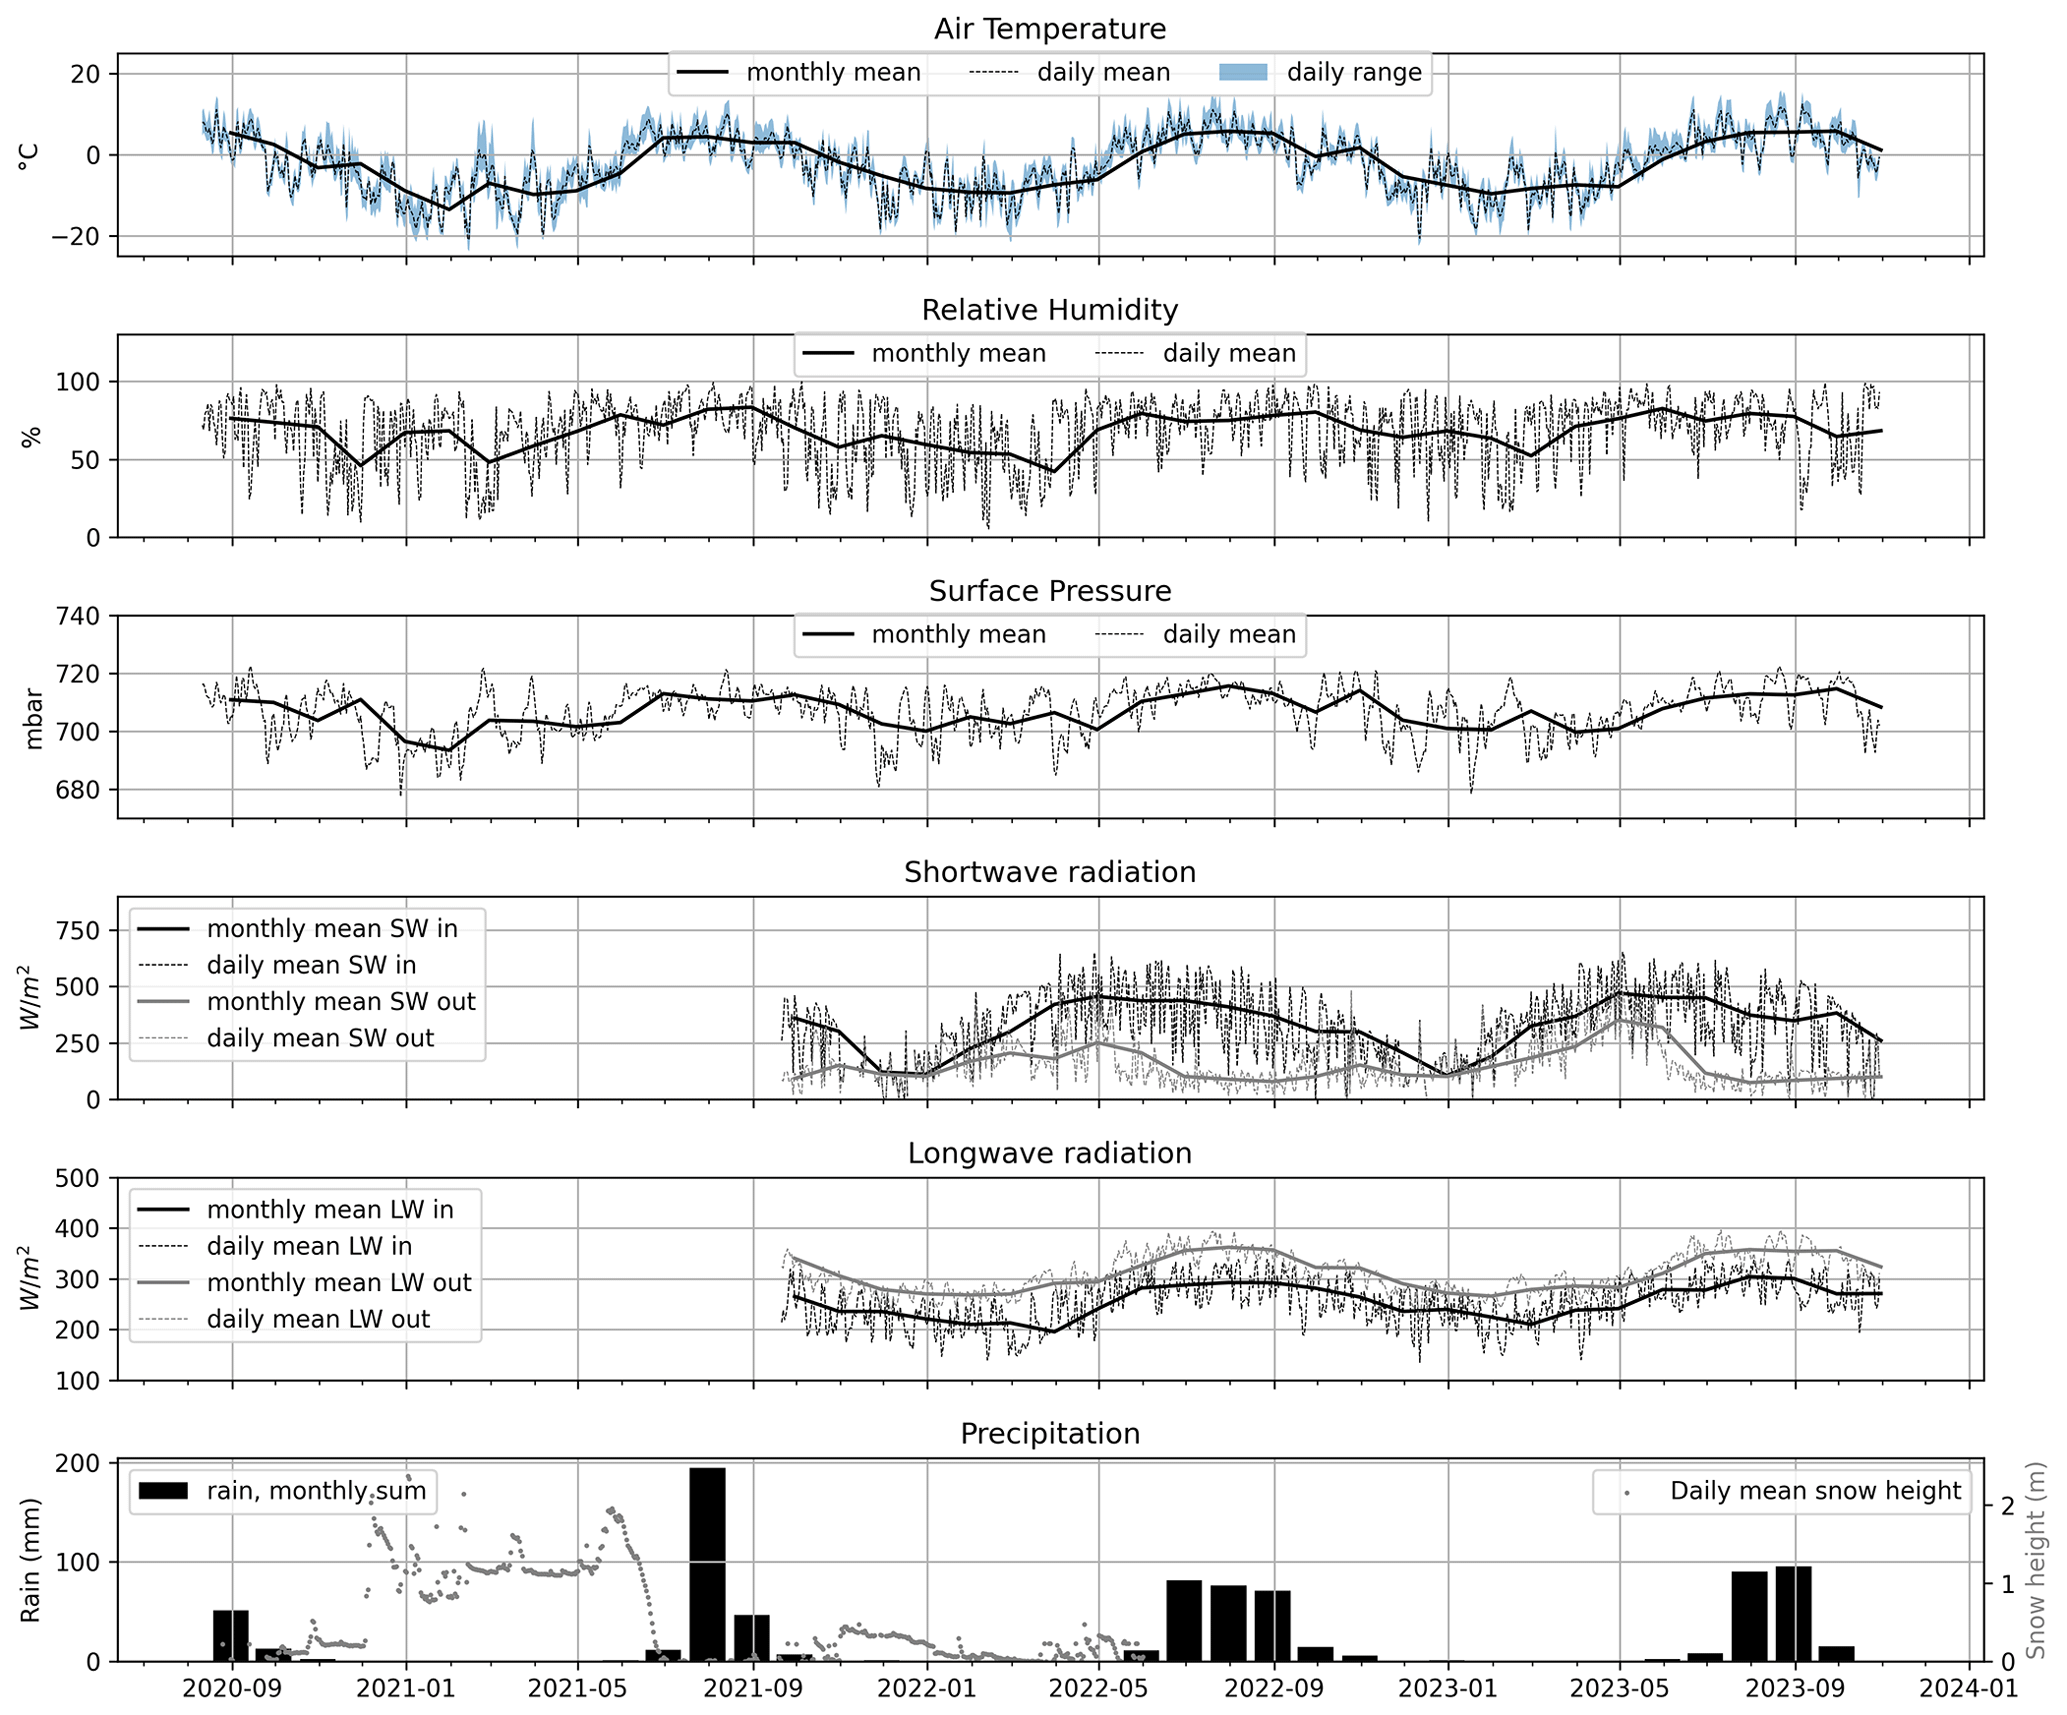
Figure 14Daily and monthly averages for air temperature, relative humidity, surface air pressure, shortwave and longwave incoming and outgoing radiation, snow depth, and rain (unheated precipitation gauge) for the period of record at AWS_MWK. Tick marks on the x axis indicate the start of the respective months.
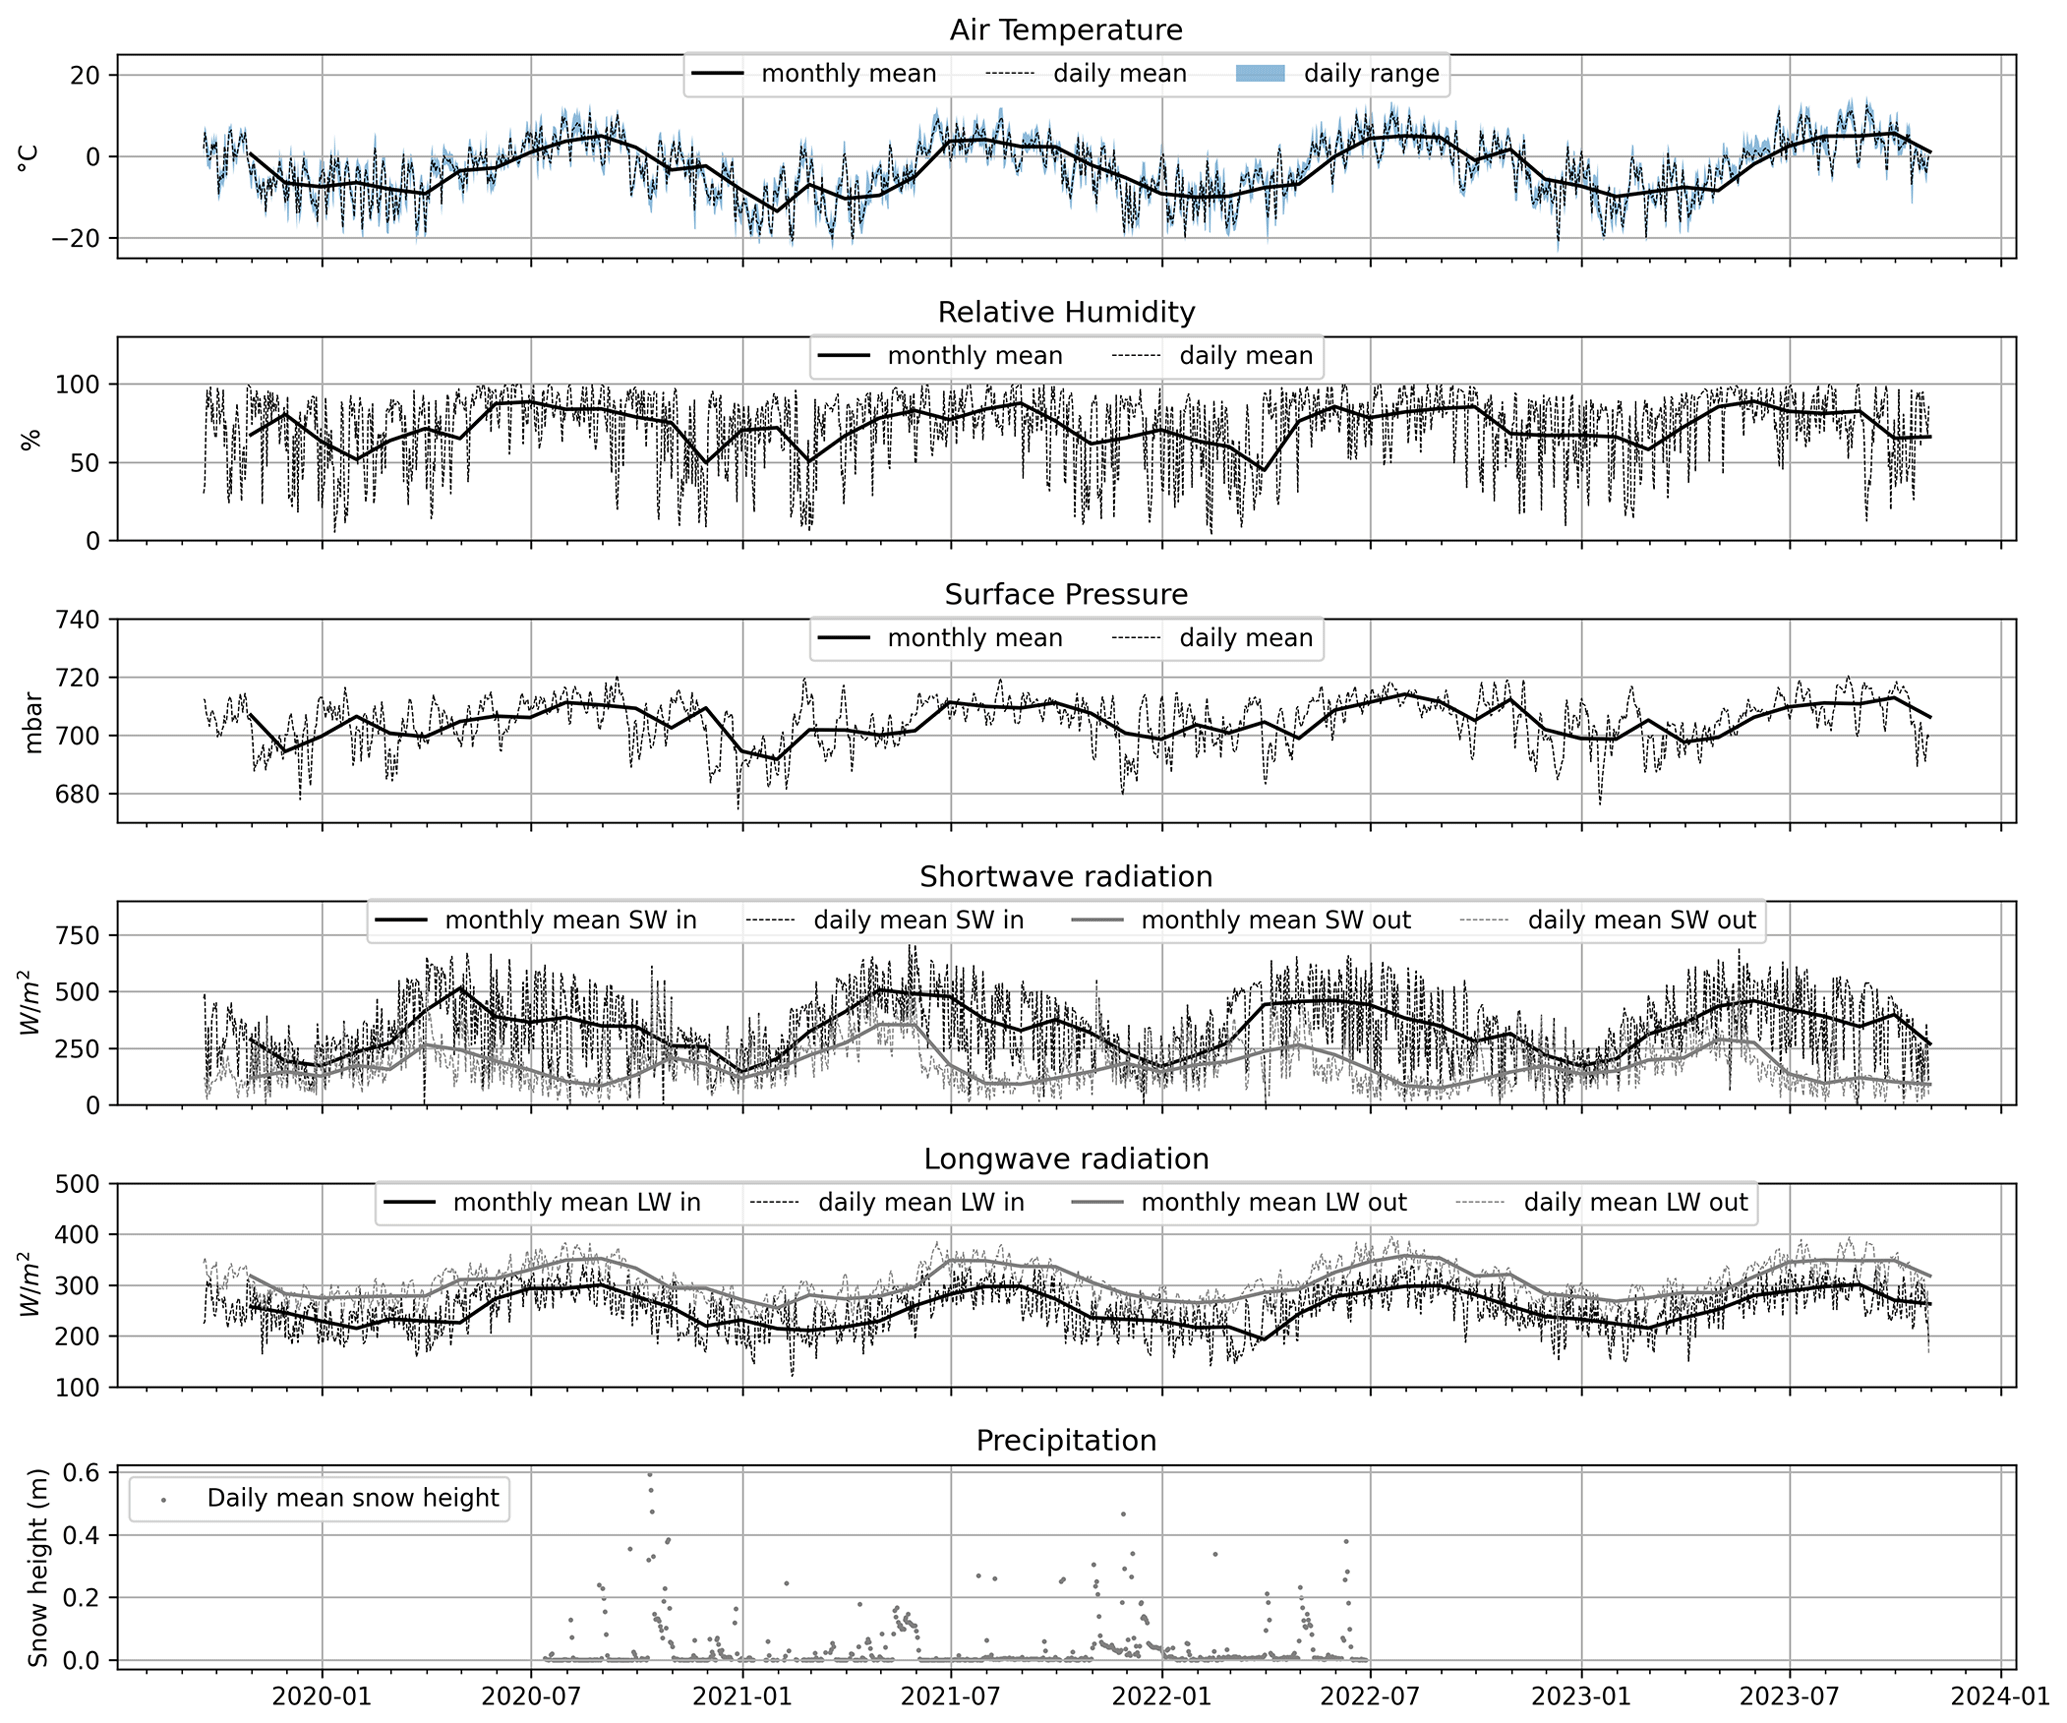
Figure 15Daily and monthly averages for air temperature, relative humidity, surface air pressure, shortwave and longwave incoming and outgoing radiation, and snow depth for the period of record at AWS_VK. Tick marks on the x axis indicate the start of the respective months.
Wind blows predominantly from SSW or NNE at AWS_MWK, with higher wind speeds typically occurring in NNE cases. At AWS_VK, the main wind direction is NW–W (Fig. S3 in the Supplement). The highest 10 min gust speeds of the station record were 28.02 m s−1 (direction 32.6°) on 5 January 2022 at AWS_MWK and 34.55 m s−1 (292.9°) on 3 February 2020 at AWS_VK, respectively. At AWS_MWK, the highest 10 min average wind (23.96 m s−1) speed occurred at the same time as the gust record. At AWS_VK, the highest 10 min average was recorded on 27 February 2020 at 26.17 m s−1.
Snow height measurements were hampered by sensor failures (Figs. S1 and S2) and are available only for the winter seasons of 2020–2021 and 2021–2022. In 2020–2021, the ground at AWS_MWK (Fig. 14) was snow-covered from about October to June, with maximum snow heights of close to 2 m in May. Snowmelt began in early June and proceeded rapidly. The 2021–2022 snow season was very dry in comparison to 2020–2021. The snowpack began building in October but never consistently grew to more than about 0.5 m. Snow depth dropped to near zero in March before late-spring snowfalls brought a renewed increase. The 2021–2022 snow season ended in late May.
Figure 14 shows monthly precipitation sums as recorded by the unheated rain gauge at AWS_MWK when the air temperature was > 4 °C, i.e. likely to have been rain. August 2021 stands out as the wettest month of the station time series by a large margin, with a monthly sum of almost 400 mm. Most “warm” precipitation as defined by the aforementioned temperature threshold occurs between July and October, with considerable interannual variation in the length of the “warm precipitation season”.
The precipitation and snow depth data clearly have limitations related to the characteristics of the instrumentation (unheated rain gauge, snow height sensor problems, and the wind-exposed location at VK) and need to be carefully evaluated for any further use. We present the raw data as well as a version with preliminary quality control flags to allow application-specific adaptation as needed. Documentation of future sensor changes and additional data will be published with the current datasets as this becomes available.
In addition to systematic errors and uncertainties inherent to the sensors and measurement system, local and site-specific weather phenomena should be kept in mind in further analyses. For example, wind direction as recorded at AWS_MWK shows a SSW–NNE dipole (Fig. S3). Southerly wind directions at the station can occur during larger-scale northerly flow due to the formation of a lee rotor that affects conditions at MWK and AWS_MWK. At VK, wind speed and direction are also strongly affected by the surrounding topography, as is common for AWSs in mountainous terrain.
Stocker-Waldhuber et al. (2024a)Stocker-Waldhuber et al. (2024b)Stocker-Waldhuber et al. (2024d)Stocker-Waldhuber et al. (2024c)Stocker-Waldhuber et al. (2016)Seiser et al. (2024a)Seiser et al. (2024b)Seiser et al. (2024d)Seiser et al. (2024c)Seiser and Fischer (2016)Table 6Data publication series made available as part of this study. New data are added each season as they become available. The DOI of the publication series leads to a landing page that lists all the associated datasets.
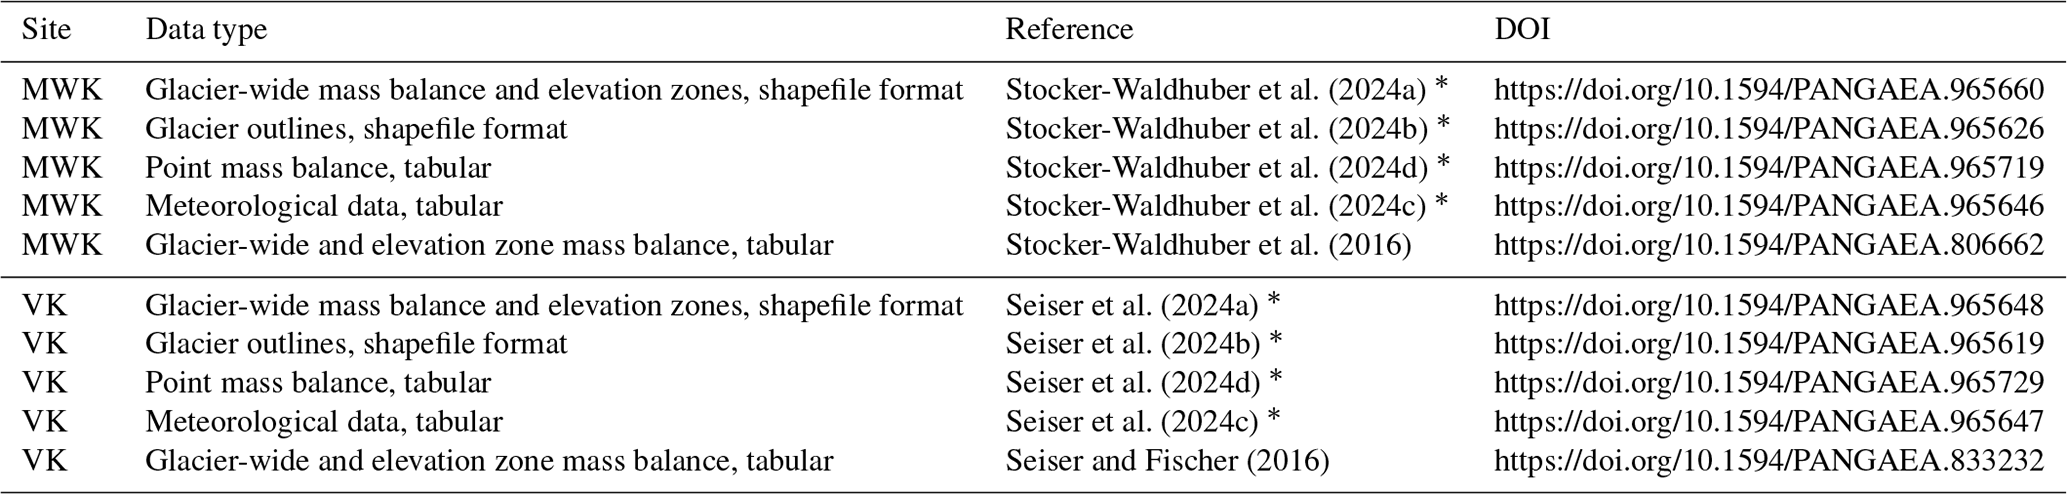
∗ denotes previously unpublished data made available as part of this study.
Glaciological and meteorological data are uploaded to the PANGAEA repository (https://www.pangaea.de, last access: 3 September 2024) each year and added to the publication series listed in Table 6.
Glacier-wide and elevation zone mass balance is also available through the WGMS database (WGMS, 2023) (https://doi.org/10.5904/wgms-fog-2023-09).
The code to process the glaciological and meteorological data and produce the figures in this publication is available at https://github.com/LeaHartl/MWKVK_processing (last access: 3 September 2024) and https://doi.org/10.5281/zenodo.13633766 (Hartl, 2024).
Glacier change in the Alps is accelerating (Zemp et al., 2019; Sommer et al., 2020; Hugonnet et al., 2021). The monitoring networks at VK and MWK have already been adapted to account for some of the challenges this poses, mainly by extending the stake network into the former accumulation zones as firn area is lost. To ensure that the observing system can capture processes of progressing deglaciation, further adaptations will be needed in the coming years. Moving forward, a key aspect will be to more comprehensively account for changes to glacier area and elevation and to incorporate the respective data into the mass balance monitoring system. At present, area change is mapped in approximate 3- to 6-year intervals and only one high-resolution DEM is available per site. The frequency of glacier area mapping should be increased to capture the rapid emergence of rock outcrops in the thin upper section of MWK and the changing glacier tongue of VK. Multi-temporal DEMs are essential for tracking elevation changes and are a necessary requirement for a quantitative uncertainty assessment of glacier-wide mass balance. Reanalysis of the mass balance time series based on calibration and validation with geodetic mass balance (Zemp et al., 2013) is urgently needed and will become increasingly important as potential existing inhomogeneities in the time series accumulate and new issues arise, e.g. due to rapid area change. Time series reanalysis and homogenization are planned as soon as new DEMs can be acquired.
Calibration of glaciological glacier-wide mass balance with geodetic mass balance can address the biases and uncertainties inherent to spatial extrapolation from point mass balance. Temporal extrapolation from floating to fixed dates is another source of considerable uncertainty that is difficult to quantify. Recent years have shown that ablation at VK and MWK is not necessarily limited to May through to September and can extend well into October. The fixed-date system has historically been the standard for glacier mass balance monitoring in Austria. However, as climatic conditions continue to change, temporal reanalysis of mass balance time series or adaptation of the measurement periods to a lengthened ablation season may become increasingly important for capturing the actual seasonality of ablation and accumulation at the sites. Preserving intermediate mass balance measurements at the best available resolution along with key meteorological parameters is central to such efforts. While the fixed-date system allows for comparison with historical data, the floating-date system and frequent sub-seasonal measurements have the advantage of reducing extrapolation uncertainties.
Sub-seasonal observations and modelling of mass balance help quantify short-term fluctuations of runoff and the associated changes in catchment hydrology and ecosystem impacts. The glacier monitoring programmes of MWK and VK are located within HTNP and complemented by additional long-term monitoring and ecosystem research (Schütz and Füreder, 2018; Körner et al., 2020). The sites offer the possibility of observing ecological consequences of accelerated glacier retreat in a protected area, i.e. excluding direct anthropogenic influences by changing land use (Huemer, 2011).
The presented data expand upon the previously available time series of glacier-wide mass balance at MWK and VK by adding annual and intermediate floating-date point data. We second the points made by Geibel et al. (2022) regarding the importance of “rescuing” the frequently unpublished point data and comprehensive metadata documentation. The floating-date point data are the basis for the spatial extrapolation to the glacier scale and, hence, a required component for future reanalysis and more detailed uncertainty assessments. Similarly, ensuring that records of intermediate and floating-date data are kept in addition to the historically more common fixed-date values enables greater flexibility to adapt data analysis procedures to changing season lengths. Comprehensive documentation of glaciological field observations and consistent data and metadata formats are essential for the preservation of historic time series and for the quantification of future glacier change.
The supplement related to this article is available online at: https://doi.org/10.5194/essd-16-4077-2024-supplement.
All the authors contributed to the data collection and field work. BS and MSW coordinated the mass balance measurements at VK and MWK, respectively. AF was the principal investigator for the mass balance programmes at both sites. BS, MSW, and LH processed the mass balance data. AB, MVL, and LH processed the AWS data. LH produced the visualizations and statistics and wrote the paper with input from all the co-authors.
The contact author has declared that none of the authors has any competing interests.
Publisher's note: Copernicus Publications remains neutral with regard to jurisdictional claims made in the text, published maps, institutional affiliations, or any other geographical representation in this paper. While Copernicus Publications makes every effort to include appropriate place names, the final responsibility lies with the authors.
We thank the Verein Gletscher Klima and the numerous volunteer fieldwork helpers who make the mass balance surveys possible. We are also very grateful for the support provided over the years by the teams of Kürsinger Hütte, Defregger Haus, and Johannis Hütte. Their support is invaluable. Matthias Huss (GLAMOS) provided generous advice on data structure and handling of uncertainties. Stefanie Schumacher and the PANGAEA team have supported our data publication process for many years. Mauri Pelto, one anonymous reviewer, and the editor Baptiste Vandecrux provided valuable comments. Thank you.
The monitoring programmes are funded by Hohe Tauern National Park, the Hydrographischer Dienst der Abteilung Wasserwirtschaft des Amtes der Tiroler Landesregierung, and the Hydrographischer Dienst des Landes Salzburg. The Dr. Anton Oelzelt-Newin'sche Foundation of the Austrian Academy of Science funded additional instrumentation and repairs of the two weather stations. The completion of this paper was funded by the Austrian Academy of Sciences and the Austrian Federal Ministry of Education, Science and Research as part of the initiative “Earth System Sciences Research Programme”.
This paper was edited by Baptiste Vandecrux and reviewed by Mauri Pelto and one anonymous referee.
Bojinski, S., Verstraete, M., Peterson, T. C., Richter, C., Simmons, A., and Zemp, M.: The concept of essential climate variables in support of climate research, applications, and policy, B. Am. Meteorol. Soc., 95, 1431–1443, 2014. a, b
Buckel, J. and Otto, J.-C.: The Austrian Glacier Inventory GI 4 (2015) in ArcGis (shapefile) format, PANGAEA [data set], https://doi.org/10.1594/PANGAEA.887415, 2018. a, b, c, d
Cogley, J. G., Hock, R., Rasmussen, L. A., Arendt, A. A., Bauder, A., Braithwaite, R. J., Jansson, P., Kaser, G., Möller, M., Nicholson, L., and Zemp, M.: Glossary of Glacier Mass Balance and Related Terms, IHP-VII Technical Documents in Hydrology No. 86, IACS Contribution No. 2, UNESCO-IHP, Paris, https://doi.org/10.5167/uzh-53475, 2011. a, b, c, d, e, f, g
Collins, S. L.: Climate Change and Long-Term Ecological Research, BioScience, 72, 803–803, 2022. a, b
Collins, S. L., Carpenter, S. R., Swinton, S. M., Orenstein, D. E., Childers, D. L., Gragson, T. L., Grimm, N. B., Grove, J. M., Harlan, S. L., Kaye, J. P., Knapp, A. K., Kofinas, G. P., Magnuson, J. J., McDowell, W. H., Melack, J. M., Ogden, L. A., Robertson, G. P., Smith, M. D., and Whitmer, A. C.: An integrated conceptual framework for long-term social–ecological research, Front. Ecol. Environ., 9, 351–357, https://doi.org/10.1890/100068, 2011. a
Costa, L., Hildén, M., Kropp, J., Böttcher, K., Fronzek, S., Swart, R., Otto, J., McCormick, N., Radojevic, M., Lückenkötter, J., Keup-Thiel, E., Luojus, K., Singh, T., Pöyry, J., Sanchez, E., and Juckes, M.: Reports of the Finnish Environment Institute, ISBN 78-952-11-4650-3, https://helda.helsinki.fi/items/d6271d30-1fff-4849-aab7-86cfa7744cfe (last access: 3 September 2024), 41, 2016. a
Cremona, A., Huss, M., Landmann, J. M., Borner, J., and Farinotti, D.: European heat waves 2022: contribution to extreme glacier melt in Switzerland inferred from automated ablation readings, The Cryosphere, 17, 1895–1912, https://doi.org/10.5194/tc-17-1895-2023, 2023. a
Eder, K., Würländer, R., and Rentsch, H.: Digital photogrammetry for the new glacier inventory of Austria, Int. Arch. Photogramm., 33, 254–261, 2000. a, b
European Commission and Directorate-General for Environment and Sundseth, K.: The Habitats Directive – Celebrating 20 years of protecting biodiversity in Europe, Publications Office, https://doi.org/10.2779/15019, 2012. a
European Commission and Directorate-General for Environment and Sundseth, K.: The EU birds and habitats directives – For nature and people in Europe, Publications Office, https://doi.org/10.2779/49288, 2015. a
Fischer, A. and Kuhn, M.: Ground-penetrating radar measurements of 64 Austrian glaciers between 1995 and 2010, Ann. Glaciol., 54, 179–188, 2013. a
Fischer, A., Stocker-Waldhuber, M., Seiser, B., Hynek, B., and Slupetzky, H.: Glaciological monitoring in Hohe Tauern National Park, eco.mont, 6, 49–56, 2014. a
Fischer, A., Seiser, B., Stocker-Waldhuber, M., and Abermann, J.: The Austrian Glacier Inventory GI 3, 2006, in ArcGIS (shapefile) format, PANGAEA [data set], https://doi.org/10.1594/PANGAEA.844985, 2015a. a, b, c, d, e, f, g
Fischer, A., Seiser, B., Stocker Waldhuber, M., Mitterer, C., and Abermann, J.: Tracing glacier changes in Austria from the Little Ice Age to the present using a lidar-based high-resolution glacier inventory in Austria, The Cryosphere, 9, 753–766, https://doi.org/10.5194/tc-9-753-2015, 2015b. a, b, c
Fischer, A., Span, N., Kuhn, M., Helfricht, K., Stocker-Waldhuber, M., Seiser, B., Massimo, M., and Butschek, M.: Ground-penetrating radar (GPR) point measurements of ice thickness in Austria, PANGAEA [data set], https://doi.org/10.1594/PANGAEA.849497, 2015c. a
Fischer, A., Patzelt, G., Achrainer, M., Groß, G., Lieb, G., Kellerer-Pirklbauer, A., and Bendler, G.: Gletscher im Wandel: 125 Jahre Gletschermessdienst des Alpenvereins, Springer Spektrum, https://doi.org/10.1007/978-3-662-55540-8, 2018. a
Gaiser, E. E., Bell, D. M., Castorani, M. C. N., Childers, D. L., Groffman, P. M., Jackson, C. R., Kominoski, J. S., Peters, D. P. C., Pickett, S. T. A., Ripplinger, J., and Zinnert, J. C.: Long-term ecological research and evolving frameworks of disturbance ecology, BioScience, 70, 141–156, https://doi.org/10.1093/biosci/biz162, 2020. a
Geibel, L., Huss, M., Kurzböck, C., Hodel, E., Bauder, A., and Farinotti, D.: Rescue and homogenization of 140 years of glacier mass balance data in Switzerland, Earth Syst. Sci. Data, 14, 3293–3312, https://doi.org/10.5194/essd-14-3293-2022, 2022. a, b, c, d, e, f, g, h, i, j
GLAMOS: Swiss Glacier Point Mass Balance Observations (release 2021), Glacier Monitoring Switzerland [data set], https://doi.org/10.18750/massbalance.point.2021.r2021, 2021. a, b, c, d, e
Groß, G.: Der Flächenverlust der Gletscher in Österreich 1850–1920–1969, Zeitschrift für Gletscherkunde und Glazialgeologie, 23, 131–141, 1987. a, b
Groß, G. and Patzelt, G.: The Austrian Glacier Inventory for the Little Ice Age Maximum (GI LIA) in ArcGIS (shapefile) format, PANGAEA [data set], https://doi.org/10.1594/PANGAEA.844987, 2015. a, b
Hansche, I., Fischer, A., Greilinger, M., Hartl, L., Hartmeyer, I., Helfricht, K., Hynek, B., Jank, N., Kainz, M., Kaufmann, V., Kellerer-Pirklbauer, A., Lieb, G., Mayer, C., Neureiter, A., Prinz, R., Reingruber, K., Reisenhofer, S., Riedl, C., Seiser, B., Stocker-Waldhuber, M., Strudl, M., Zagel, B., Zechmeister, T., and Schöner, W.: KryoMon. AT – Kryosphären Monitoring Österreich: 2021/22 Kryosphärenbericht Nr. 1, https://doi.org/10.25364/402.2023.1, 2023. a, b, c
Hartl, L.: LeaHartl/MWKVK_processing: MWK and VK processing V0.1 (v0.1), Zenodo [code], https://doi.org/10.5281/zenodo.13633766, 2024. a
Hock, R. and Huss, M.: Glaciers and climate change, in: Climate Change, edited by: Letche, T. M., Elsevier, 157–176, https://doi.org/10.1016/B978-0-12-821575-3.00009-8, 2021. a
Huemer, P.: Pseudo-endemism and cryptic diversity in Lepidoptera–case studies from the Alps and the Abruzzi, Journal on Protected Mountain Areas Research and Management, 3, 11–18, 2011. a
Hugonnet, R., McNabb, R. E., Menounos, B., Nuth, C., Girod, L.,Farinotti, D., Huss, M., Dussaillant, I., Brun, F., and Kääb, A.: Accelerated global glacier mass loss in the early twenty-first century, Nature, 592, 726–731, 2021. a
Huss, M. and Hock, R.: Global-scale hydrological response to future glacier mass loss, Nat. Clim. Change, 8, 135–140, 2018. a
Huss, M., Bauder, A., and Funk, M.: Homogenization of long-term mass-balance time series, Ann. Glaciol., 50, 198–206, 2009. a
Kaser, G., Fountain, A., Jansson, P., Heucke, E., and Knaus, M.: A manual for monitoring the mass balance of mountain glaciers, vol. 137, Unesco Paris, SC.2003/WS/4, https://unesdoc.unesco.org/ark:/48223/pf0000129593 (last access: 3 September 2024), 2003. a
Körner, C., Tappeiner, U., Newesely, C., Wittmann, H., Eberl, T., Kaiser, R., Meyer, E., Grube, M., Fernández Mendoza, F., Füreder, L., Niedrist, G. H., Daim, A., Lieb, G., Kellerer-Pirklbauer, A., Wickham, S., Petermann, J., and Berninger, U.-G.: Langzeitmonitoring von Ökosystemprozessen im Nationalpark Hohe Tauern, Synthese der Startphase 2016–2018, Verlag der Österreichischen Akademie der Wissenschaften, https://doi.org/10.1553/GCP_LZM_NPHT_Synthese, 2020. a
Kuhn, M., Lambrecht, A., Abermann, J., Patzelt, G., and Groß, G.: The Austrian glaciers 1998 and 1969, area and volume changes, Zeitschrift für Gletscherkunde und Glazialgeologie, 43/44, 3–107, 2012. a, b
Kuhn, M., Lambrecht, A., and Abermann, J.: Austrian glacier inventory 1998 (GI II), PANGAEA [data set], https://doi.org/10.1594/PANGAEA.809196, 2013. a, b
Lambrecht, A. and Kuhn, M.: Glacier changes in the Austrian Alps during the last three decades, derived from the new Austrian glacier inventory, Ann. Glaciol., 46, 177–184, https://doi.org/10.3189/172756407782871341, 2007. a, b
Østrem, G. and Brugman, M.: Mass balance measurement techniques, A manual for field and office work, Environment Canada, Saskatoon, ISBN 0-662-19000-9, 1991. a, b, c
Patzelt, G.: The Austrian glacier inventory: status and first results, IAHS-AISH P., 126, 181–183, 1980. a, b
Patzelt, G.: Austrian glacier inventory 1969 (GI I), PANGAEA [data set], https://doi.org/10.1594/PANGAEA.807098, 2013. a, b
Schaefli, B. and Huss, M.: Integrating point glacier mass balance observations into hydrologic model identification, Hydrol. Earth Syst. Sci., 15, 1227–1241, https://doi.org/10.5194/hess-15-1227-2011, 2011. a
Schütz, S. A. and Füreder, L.: Unexpected patterns of chironomid larval size in an extreme environment: a highly glaciated, alpine stream, Hydrobiologia, 820, 49–63, 2018. a
Seiser, B. and Fischer, A.: Glacier mass balances and elevation zones of Venedigerkees, Hohe Tauern, Austria, 2011/2012 et seq., PANGAEA [data set], https://doi.org/10.1594/PANGAEA.833232, 2016. a, b, c, d
Seiser, B., Stocker-Waldhuber, M., Hartl, L., Baldo, A., Lauria, M. V., and Fischer, A.: Glacier mass balance of Venedigerkees, 2011/12 et seq., PANGAEA [data set], https://doi.org/10.1594/PANGAEA.965648, 2024a. a
Seiser, B., Stocker-Waldhuber, M., Hartl, L., Baldo, A., Lauria, M. V., and Fischer, A.: Glacier outlines of Venedigerkees, Austria, 2012 et seq., PANGAEA [data set], https://doi.org/10.1594/PANGAEA.965619, 2024b. a
Seiser, B., Stocker-Waldhuber, M., Hartl, L., Baldo, A., Lauria, M. V., and Fischer, A.: Meteorological monitoring at LTER sites Venedigerkees, 2019 et seq., PANGAEA [data set], https://doi.org/10.1594/PANGAEA.965647, 2024c. a, b
Seiser, B., Stocker-Waldhuber, M., Hartl, L., Baldo, A., Lauria, M. V., and Fischer, A.: Point mass balance of Venedigerkees, Austria, 2011/12 et seq., PANGAEA [data set], https://doi.org/10.1594/PANGAEA.965729, 2024d. a, b, c
Sommer, C., Malz, P., Seehaus, T. C., Lippl, S., Zemp, M., and Braun, M. H.: Rapid glacier retreat and downwasting throughout the European Alps in the early 21st century, Nat. Commun., 11, 3209, https://doi.org/10.1038/s41467-020-16818-0, 2020. a
Stocker-Waldhuber, M., Helfricht, K., Hartl, A., and Fischer, A.: Glacier surface mass balance 2006–2014 on Mullwitzkees and Hallstätter gletscher, Zeitschrift für Gletscherkunde und Glazialgeologie, 47, 101–119, 2015. a
Stocker-Waldhuber, M., Fischer, A., and Kuhn, M.: Glacier mass balances and elevation zones of Mullwitzkees, Hohe Tauern, Austria, 2006/2007 et seq., PANGAEA [data set], https://doi.org/10.1594/PANGAEA.806662, 2016. a, b, c, d
Stocker-Waldhuber, M., Seiser, B., Hartl, L., Baldo, A., Lauria, M. V., and Fischer, A.: Glacier mass balance of Mullwitzkees, 2006/07 et seq., PANGAEA [data set], https://doi.org/10.1594/PANGAEA.965660, 2024a. a
Stocker-Waldhuber, M., Seiser, B., Hartl, L., Baldo, A., Lauria, M. V., and Fischer, A.: Glacier outlines of Mullwitzkees, Austria, 2012 et seq., PANGAEA [data set], https://doi.org/10.1594/PANGAEA.965626, 2024b. a
Stocker-Waldhuber, M., Seiser, B., Hartl, L., Baldo, A., Lauria, M. V., and Fischer, A.: Meteorological monitoring at LTER sites Mullwitzkees, 2020 et seq., PANGAEA [data set], https://doi.org/10.1594/PANGAEA.965646, 2024c. a, b
Stocker-Waldhuber, M., Seiser, B., Hartl, L., Baldo, A., Lauria, M. V., and Fischer, A.: Point mass balance of Mullwitzkees, Austria, 2006/07 et seq., PANGAEA [data set], https://doi.org/10.1594/PANGAEA.965719, 2024d. a, b
Thibert, E., Blanc, R., Vincent, C., and Eckert, N.: Glaciological and volumetric mass-balance measurements: error analysis over 51 years for Glacier de Sarennes, French Alps, J. Glaciol., 54, 522–532, 2008. a
Vincent, C., Fischer, A., Mayer, C., Bauder, A., Galos, S. P., Funk, M., Thibert, E., Six, D., Braun, L., and Huss, M.: Common climatic signal from glaciers in the European Alps over the last 50 years, Geophys. Res. Lett., 44, 1376–1383, https://doi.org/10.1002/2016gl072094, 2017. a
WGMS: Fluctuations of Glaciers Database, World Glacier Monitoring Service (WGMS) [data set], https://doi.org/10.5904/wgms-fog-2023-09, 2023. a, b, c
Zemp, M., Thibert, E., Huss, M., Stumm, D., Rolstad Denby, C., Nuth, C., Nussbaumer, S. U., Moholdt, G., Mercer, A., Mayer, C., Joerg, P. C., Jansson, P., Hynek, B., Fischer, A., Escher-Vetter, H., Elvehøy, H., and Andreassen, L. M.: Reanalysing glacier mass balance measurement series, The Cryosphere, 7, 1227–1245, https://doi.org/10.5194/tc-7-1227-2013, 2013. a, b, c, d
Zemp, M., Frey, H., Gärtner-Roer, I., Nussbaumer, S. U., Hoelzle, M., Paul, F., Haeberli, W., Denzinger, F., Ahlstrøm, A. P., Anderson, B., Bajracharya, S., Baroni, C., Braun, L. N., Cáceres, B. E., Casassa, G., Cobos, G., Dávila, L. R., Delgado Granados, H., Demuth, M. N., Espizua, L., Fischer, A., Fujita, K., Gadek, B., Ghazanfar, A., Hagen, J. O., Holmlund, P., Karimi, N., Li, Z., Pelto, M., Pitte, P., Popovnin, V. V., Portocarrero, C. A., Prinz, R., Sangewar, C. V., Severskiy, I., Sigurđsson, O., Soruco, A., Usubaliev, R., and Vincent, C.: Historically unprecedented global glacier decline in the early 21st century, J. Glaciol., 61, 745–762, 2015. a
Zemp, M., Huss, M., Thibert, E., Eckert, N., McNabb, R., Huber, J., Barandun, M., Machguth, H., Nussbaumer, S. U., Gärtner-Roer, I., Thomson, L., Paul, F., Maussion, F., Kutuzov, S., and Cogley, J. G.: Global glacier mass changes and their contributions to sea-level rise from 1961 to 2016, Nature, 568, 382–386, 2019. a, b
Zemp, M., Eggleston, S., Míguez, B. M., Oakley, T., Rea, A., Robbez, M., and Tassone, C.: The status of the global climate observing system 2021: The GCOS status report, https://doi.org/10.5167/uzh-213734, 2021. a
Zemp, M., Gärtner-Roer, I., Nussbaumer, S. U., Welty, E. Z., Dussaillant, I., and Bannwart, J.: Global Glacier Change Bulletin No. 5 (2020–2021), ISC (WDS) / IUGG (IACS) / UNEP / UNESCO / WMO, World Glacier Monitoring Service, Zurich, Switzerland, https://doi.org/10.5167/uzh-239577, 2023. a