the Creative Commons Attribution 4.0 License.
the Creative Commons Attribution 4.0 License.
 | 10 Jul 2024
ChinaSoyArea10m: a dataset of soybean-planting areas with a spatial resolution of 10 m across China from 2017 to 2021
Qinghang Mei
Zhao Zhang
Jichong Han
Jie Song
Jinwei Dong
Huaqing Wu
Fulu Tao
Soybean, an essential food crop, has witnessed a steady rise in demand in recent years. There is a lack of high-resolution annual maps depicting soybean-planting areas in China, despite China being the world's largest consumer and fourth-largest producer of soybean. To address this gap, we developed the novel Regional Adaptation Spectra-Phenology Integration method (RASP) based on Sentinel-2 remote sensing images from the Google Earth Engine (GEE) platform. We utilized various auxiliary data (e.g., cropland layer, detailed phenology observations) to select the specific spectra and indices that differentiate soybeans most effectively from other crops across various regions. These features were then input for an unsupervised classifier (K-means), and the most likely type was determined by a cluster assignment method based on dynamic time warping (DTW). For the first time, we generated a dataset of soybean-planting areas across China, with a high spatial resolution of 10 m, spanning from 2017 to 2021 (ChinaSoyArea10m). The R2 values between the mapping results and the census data at both the county and prefecture levels were consistently around 0.85 in 2017–2020. Moreover, the overall accuracy of the mapping results at the field level in 2017, 2018, and 2019 was 77.08 %, 85.16 %, and 86.77 %, respectively. Consistency with census data was improved at the county level (R2 increased from 0.53 to 0.84) compared to the existing 10 m crop-type maps in Northeast China (Crop Data Layer, CDL) based on field samples and supervised classification methods. ChinaSoyArea10m is very spatially consistent with the two existing datasets (CDL and GLAD (Global Land Analysis and Discovery) maize–soybean map). ChinaSoyArea10m provides important information for sustainable soybean production and management as well as agricultural system modeling and optimization. ChinaSoyArea10m can be downloaded from an open-data repository (DOI: https://doi.org/10.5281/zenodo.10071427, Mei et al., 2023).
- Article
(11072 KB) - Full-text XML
-
Supplement
(992 KB) - BibTeX
- EndNote


Soybean, one of the most important crops around the world, plays an important role in diet and livestock breeding (Hartman et al., 2011). As the global demand for protein and meat increases, China's demand for soybeans keeps rising nowadays. In the past decade, China has on average accounted for over 30 % of the world's total soybean consumption (Liu and Fan, 2021). Despite being the fourth-largest producer of soybeans after Brazil, the United States, and Argentina, China's self-sufficiency rate is low (FAOSTAT, 2023; Wang et al., 2023). Given the rapid growth in demand and the shortages of domestic supply due to lower yield and self-sufficiency, mapping soybean-planting areas across China is crucial for sustainable soybean production and management (Cui and Shoemaker, 2018; Liu et al., 2021).
Soybean-planting areas in some regions of China were mapped in previous studies (You et al., 2021; Huang et al., 2022; Chen et al., 2023), but long-term soybean maps over all major producing areas in China have not been available. A decision tree method based on phenological and NIR reflectance differences was applied in the state of Parana in Brazil to produce corn–soybean maps with a resolution of 500 m (Zhong et al., 2016). However, this study was limited to one state and a simple planting pattern (including soybeans and corn only) at a medium resolution. The field size in China is generally small, and 500 m resolution maps will inevitably bring a pixel-mixing problem (Lowder et al., 2016). More recently, 20-year soybean–corn maps with 30 m resolution across the US Midwest were generated by collecting a large number of samples and using green chlorophyll vegetation index (GCVI) time series features, which is a large-scale, high-precision soybean mapping attempt (Wang et al., 2020). Similarly, high-precision soybean maps in China were also made by collecting major crop samples and utilizing spectral reflectance and vegetation index characteristics for 2017–2019 in Northeast China (You et al., 2021). Some studies have utilized unique canopy water content and chlorophyll content to produce soybean maps in the three provinces of Northeast China from 2017 to 2021 (Huang et al., 2022). Other studies made laudable efforts to craft a comprehensive national maize–soybean map for China in 2019 by combining field data and regression estimators (Li et al., 2023). However, these studies were confined to some degree because of the specific region or a single year, despite prior attempts to accurately map soybean cultivation areas. Long-term annual soybean maps over mainly planting areas in China with a higher spatial resolution have not been available so far.
Mapping crops by remote sensing can be categorized by four methods: (1) classifying supervision based on a large number of field samples or high-quality training labels (Song et al., 2017; You et al., 2021; Shangguan et al., 2022; Li et al., 2023); (2) developing some composite indexes based on feature bands and determining the binary classification using appropriate thresholds (Huang et al., 2022; Chen et al., 2023; Zhou et al., 2023); (3) segmenting thresholds based on prior knowledge such as phenology or spectra (Zhong et al., 2016); and (4) combining unsupervised classification with cluster assignment (Wang et al., 2019; You et al., 2023). Supervision classification methods rely heavily on ground samples, while the second and third methods are both based on reliable and accurate thresholds. However, mapping soybean with these methods was mainly applied in small areas, with very few covering a larger region. Because of sufficient field samples, supervision classification can achieve maps with a higher accuracy, which is a relatively mature method used widely. However, collecting sufficient field samples is extremely time-, money-, and labor-consuming and unsuitable for long-term years over larger areas (Luo et al., 2022). Furthermore, the threshold-based methods (the second and third ones) have been applied to large areas; however, determining the thresholds will inevitably bring significant uncertainty, especially for areas with high heterogeneity in climate, environment, and planting patterns. Thus, these methods show low reproducibility, further hindering their application across diverse geographic areas. As for mapping soybean, it is still a big challenge due to their similar growth characteristics to many other summer crops (Wang et al., 2020; Di Tommaso et al., 2021). The thresholds that work well in some areas did not perform well in other areas (Graesser and Ramankutty, 2017; Guo et al., 2018). These limitations restrict accurate soybean map availability, especially over large regions in China. Given the challenges of collecting sufficient field samples over larger regions and the limited adaptability to environmental variations of the threshold-based method, previous studies did not achieve multiyear, high-resolution soybean maps nationwide.
Along this line, the adaptive classification approach tailored to distinct areas, i.e., method (4), is highly effective for accurately mapping crops over a larger region. Such unsupervised classification can effectively address the above issues such as insufficient samples and limited spatial scalability by training classifiers separately in different areas (Ma et al., 2020; Wang et al., 2022). Remarkable successes have been achieved when applying the approach to the United States in mapping soybean and maize (Wang et al., 2019). Due to the different climatic and environmental conditions, together with huge differences in cultivating patterns over various areas, crop phenological information has become an important reference for crop classification. For example, the phenological observations at the agricultural meteorological stations were employed as a reference to detect the critical phenological dates of pixels through inflexion- and threshold-based methods, thereby generating planting areas for three major crops in China with R2 greater than 0.8 compared to county statistics (Luo et al., 2020). The time-weighted dynamic time warping method based on the similarity of phenological curves of the Normalized Difference Vegetation Index (NDVI) has successfully estimated the planting area of maize in China, with provincial averages for producer and user accuracies at 0.76 and 0.82, respectively (Shen et al., 2022). Phenologically based vertical transmit horizontal receive (VH) polarized time series accurately captured temporal characteristics of soybeans and thus were used as an unsupervised classifier to map the seasonal soybeans, achieving an overall accuracy of over 80 % in Ujjain district (Kumari et al., 2019). By integrating an unsupervised classification's regional scalability with specific local soybean growth signs from phenological data, we fully leverage soybean's characteristic spectra and vegetation indices during key growth periods across different areas. By training the local unsupervised classifier to accommodate the crop growth variability across regions and by avoiding extensive jobs in collecting samples, the approach provides an effective solution for regional adaptive large-area crop mapping.
The main objectives of this study are (1) to develop a novel framework to map a soybean-planting area over a larger region, (2) to test the generalization ability of the framework and assess the accuracy of maps at different levels, and (3) to provide a new data product of a soybean-planting area across mainly planting areas in China for multiple years with a high spatial resolution.
2.1 Study area
We selected 14 major soybean-producing provinces (including Chongqing Municipality) as the study area, which covers over 90 % of the total planting area in China (National Bureau of Statistics of China, 2024) (Fig. 1). The soybean-planting areas were classified into four agroecological zones (AEZs) based on their diverse geographical environment and planting habits, including the Northeast single-cropping ecoregion (NE, Zone I), Huang–Huai–Hai double-cropping ecoregion (HH, Zone II), Middle–Lower Yangtze River double-cropping ecoregion (MLY, Zone III), and Southwest double-cropping ecoregion (SW, Zone IV) (Wang and Gai, 2002). In particular, Zone I and Zone II are the main soybean producers in China, accounting for more than 70 % of the national soybean-planting area.

Figure 1The study area including 14 provinces (including Chongqing Municipality) and the spatial distribution of ground samples and reference points across China in (a) 2019, (b) 2017, and (c) 2018. The 14 provinces include Heilongjiang, eastern Inner Mongolia, Anhui, Henan, eastern Sichuan, Jilin, Hubei, Guizhou, Jiangsu, Yunnan, Shandong, Shaanxi, Shanxi, and Chongqing. Stars, triangles, and dots represent the locations of soybean agricultural meteorological stations (AMSs), ground samples, and reference points, respectively.
2.2 Data
2.2.1 Remote sensing data
We used Sentinel-2A/B Multi-Spectral Instrument (MSI) Level-1C top-of-atmosphere (TOA) reflectance data during 2017–2021 (https://developers.google.com/earth-engine/datasets/catalog/COPERNICUS_S2, last access: 10 September 2023). Because of the longer-term coverage of Sentinel-2 Level-1C TOA reflectance data and the nearly identical spectral profile time series extracted from both products, we opt to use Level-1C products instead of Level-2A products, considering that TOA images fully meet the crop classification requirements (You and Dong, 2020; Han et al., 2021; Luo et al., 2022). Sentinel-2 sensors provide observations of 13 spectral bands at 10 m or 20 m resolution. The red-edge bands and short-wave infrared bands equipped with Sentinel-2 play a great role in enhancing the accuracy of crop classification (Luo et al., 2021; Marshall et al., 2022). In addition, the S2 cloud probability dataset provided by the official can identify cloud pollution areas and can be used for cloud removal processing.
2.2.2 In situ phenological observations
The soybean phenology observations in the study area from 2017 to 2020 were obtained from 76 agricultural meteorological stations (AMSs) governed by the China Meteorological Administration (CMA) (https://data.cma.cn/, last access: 15 May 2022). Phenology information on each AMS is observed on alternate days or once a day, and key phenological events such as sowing, emergence, three-true-leaves, branching, flowering, podding, full seeding, and maturity are noted by technicians as ensuring accuracy. We defined the period from sowing to flowering as the vegetative growth period (VGP) and the period from flowering to maturity as the reproductive growth period (RGP) of soybeans (Gong et al., 2021). In the cases of missing observations for a specific year, we inserted the average of the two closest observations before and after the year. For instance, if there were missing data of the flowering date in 2017, we filled them with the average of flowering records in 2016 and 2018 at the same station.
2.2.3 Cropland data
The Global Land Analysis and Discovery (GLAD) cropland product with a 30 m resolution in China was used as a cropland mask (https://glad.umd.edu/dataset/croplands, last access: 10 September 2023) (Potapov et al., 2022). The crop layer was conducted every 4 years from 2000 to 2019. We used the file for the 2016–2019 interval, which is closest to the study years. GLAD's overall accuracy of pixel-wise validation is 0.88 in China, consistent with the census data. The accuracy of the product is higher than that of similar products, making it reliable for crop mapping (Zhang et al., 2022).
2.2.4 Census data and ground samples
To determine the number of clusters at the prefecture level and validate the accuracy of the soybean maps at the county (2017–2018) or prefecture (2019–2020) levels, we utilized agricultural census data obtained from the statistical yearbook of each county or province by accessing the National Bureau of Statistics of China (http://www.stats.gov.cn/, last accessed: 8 June 2023).
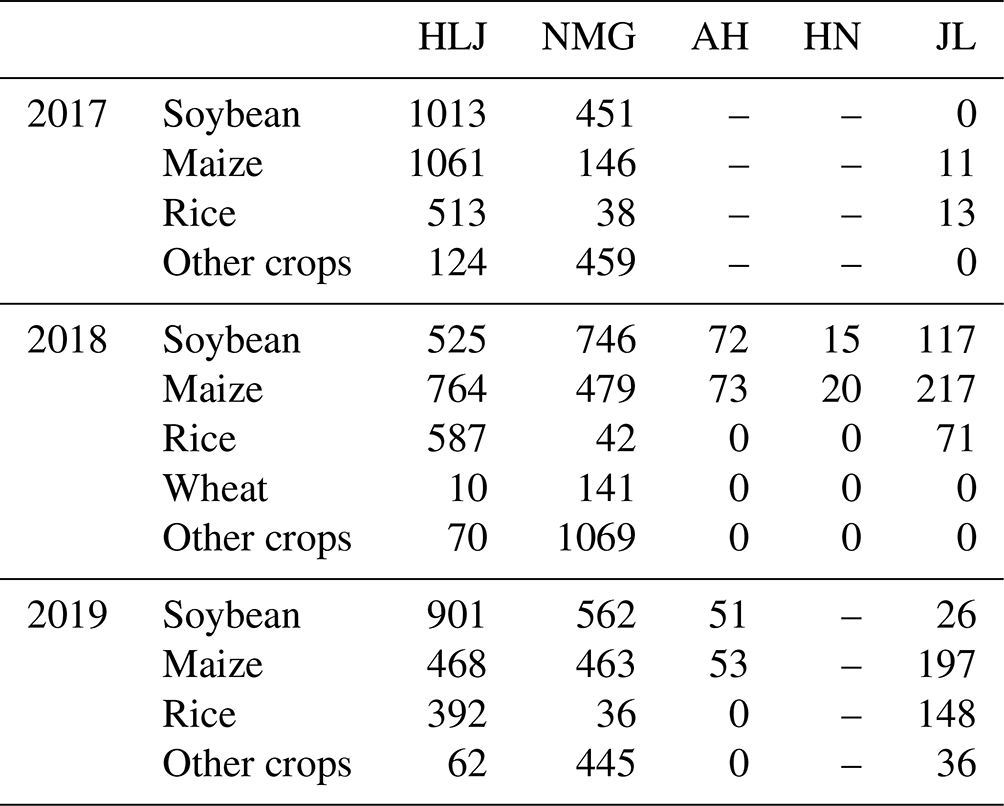
We used both ground samples and reference points based on available datasets to determine soybean standard curves and to assess the reliability of the soybean maps (Fig. 1). All the points were randomly divided into a 3:7 ratio for standard curve calculation and accuracy validation, respectively (Dong et al., 2020). We collected ground samples from field surveys from 2017 to 2019 in Heilongjiang (HLJ), Inner Mongolia (NMG), Anhui (AH), Henan (HN), and Jilin (JL), which account for more than 70 % of the country's total soybean-planting area (Table 1). Crop types (soybean, maize, rice, wheat, others) and other land cover types were recorded. To ensure the impartiality of verification results, we only selected crop samples for validation. In provinces without ground samples, we manually selected reference points on large soybean plots based on the GLAD (https://glad.earthengine.app/view/china-crop-map, last access: 8 March 2024) soybean layer. The criteria selected are (1) a location in large plots, (2) a false color composite image (R: NIR, G: SWIR2, B: SWIR1) at the peak of the growing season (Song et al., 2017; You and Dong, 2020), and (3) phenological characteristics similar to local observations. Additionally, the reference points of maize, single-cropping rice, and double-cropping rice in 2019 were selected based on the GLAD maize layer, a high-resolution single-season rice map (https://doi.org/10.57760/sciencedb.06963, Shen et al., 2023b), and a double-season rice map (https://doi.org/10.12199/nesdc.ecodb.rs.2022.012, Pan and Yuan, 2022) with the same principle to explore the spectral characteristics of crops in each subzone of the studied areas. The overall accuracy of all the available maps in 2019 is above 85 % (Pan et al., 2021; Li et al., 2023; Shen et al., 2023a).
2.2.5 Existing products
We utilized the crop map Crop Data Layer (CDL) of Northeast China from 2017 to 2019 (https://figshare.com/articles/figure/The_10-m_crop_type_maps_in_Northeast_China_during_2017-2019/13090442, last access: 10 September 2023) for consistency comparison with census data and the 2019 GLAD maize–soybean map as a reference for spatial detail comparison with ChinaSoyArea10m. The CDL is a 10 m resolution crop map dataset of Northeast China from 2017 to 2019 that was created using Sentinel-2 key spectral bands and vegetation indices, multiyear field samples, and random forest classifiers (You et al., 2021). The maps include three crop types: rice, maize, and soybeans. The GLAD maize–soybean map is a national classification map for 2019 that was produced using random forests, based on field surveys and area estimates (Li et al., 2023). The agreement (R2) between GLAD and the statistics is higher than 0.9, and the overall mapping accuracy is greater than 90 %, making it a reliable reference for comparing spatial details. We extracted the soybean layers from all the existing products.
2.3 Methods
Mapping soybean consists of three main steps (Fig. 2): data processing, soybean mapping, and accuracy assessment. It is important to note that the Regional Adaption Spectra-Phenology Integration (RASP) soybean mapping strategy involves several key steps, including potential area identification, feature selection, unsupervised learning, and cluster assignment. Finally, we conducted multiple comparisons between our soybean products with others, including census data, ground samples, and existing datasets, to evaluate the accuracy of our data product.
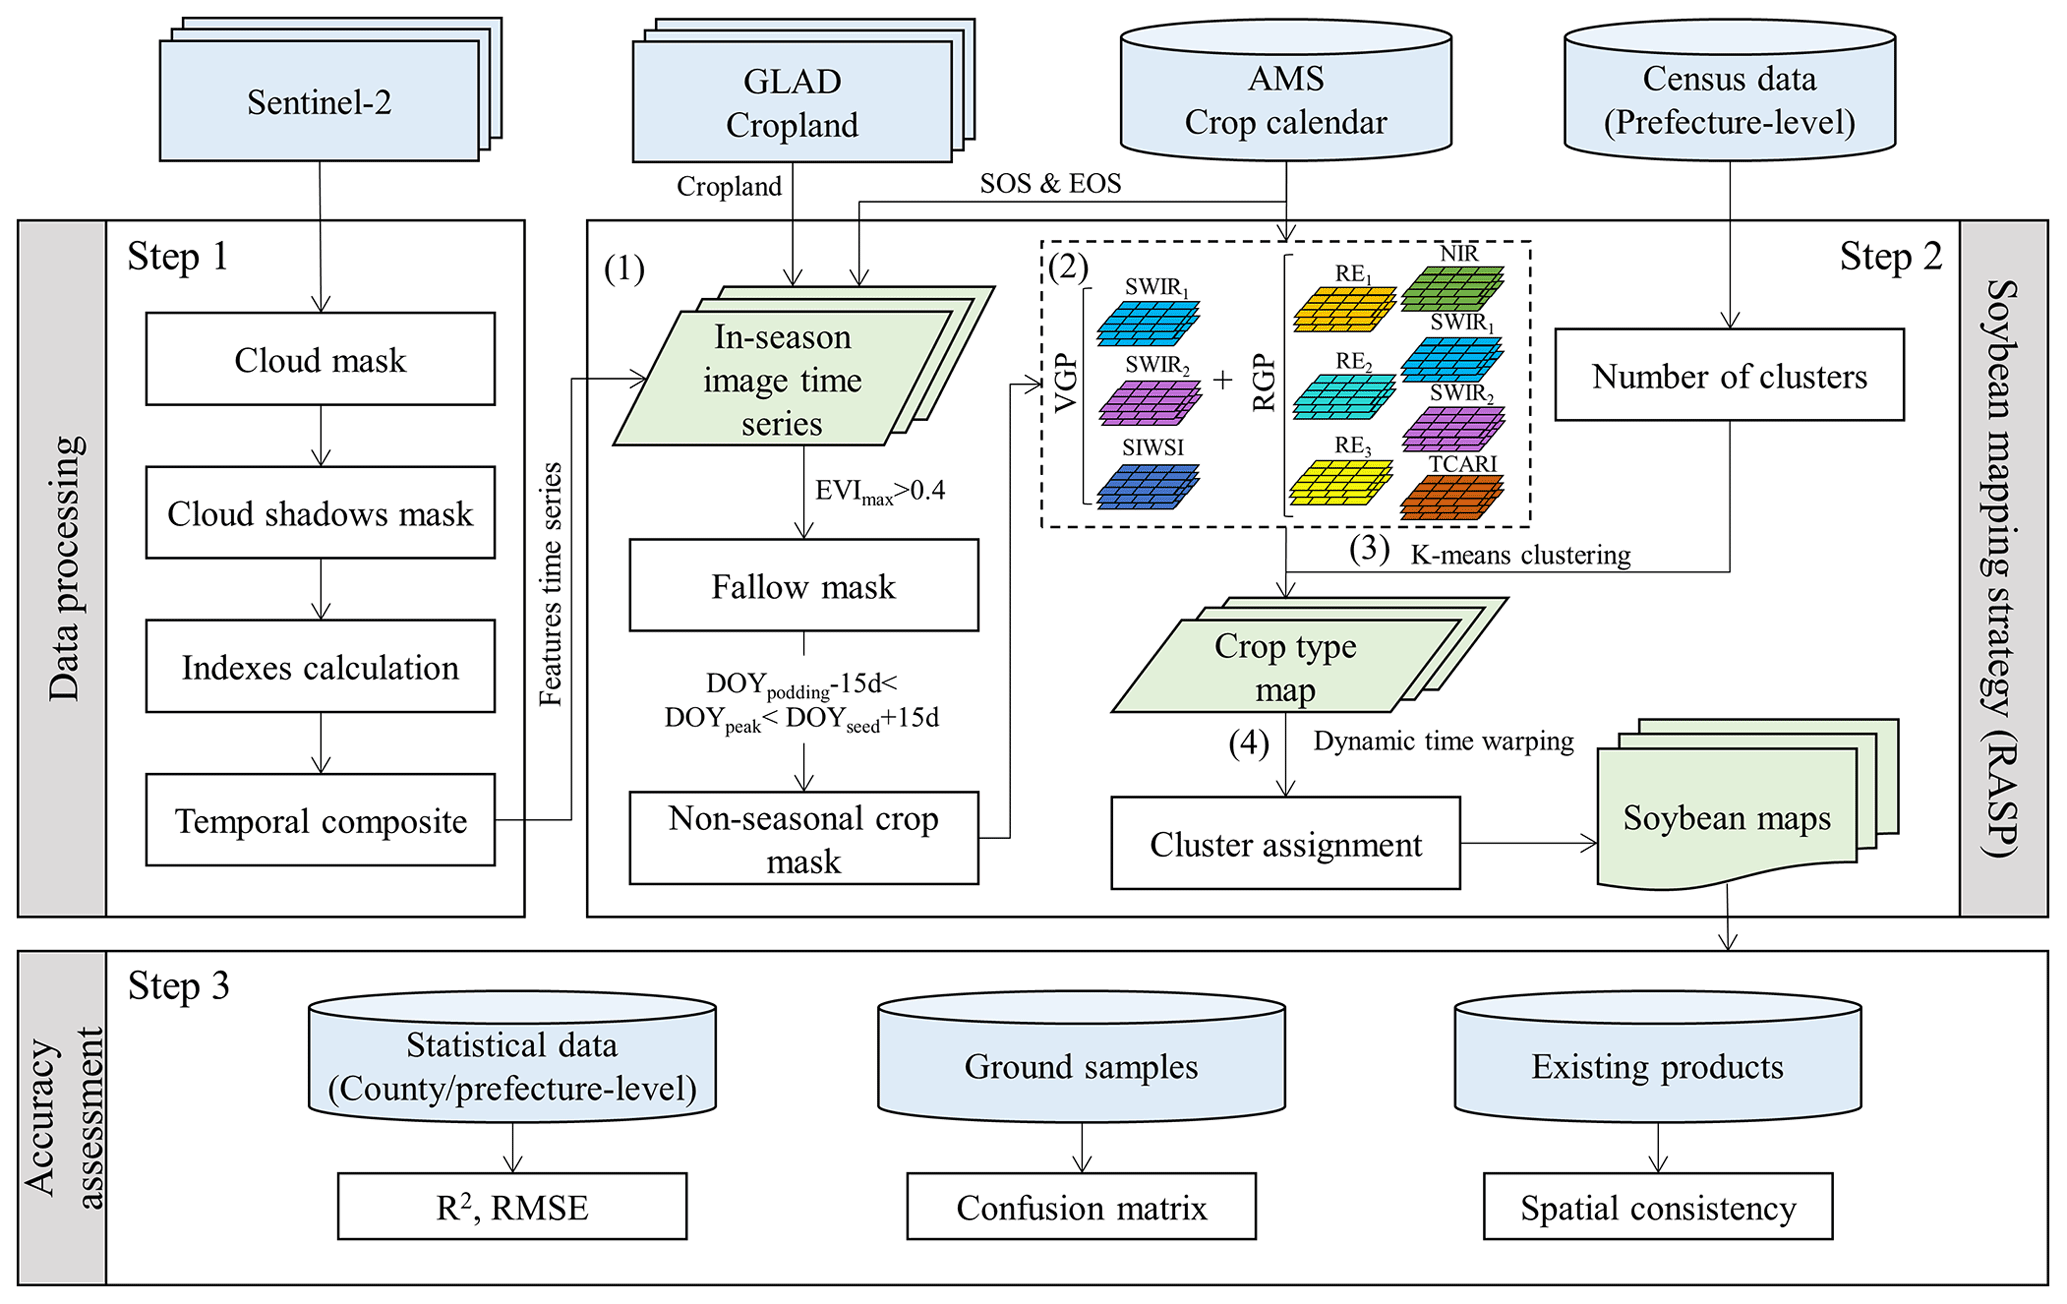
Figure 2The Regional Adaption Spectra-Phenology Integration methodology for retrieving the soybean-planting area. AMS: agricultural meteorological station; DOYpodding: podding date recorded by the nearest AMS; EVI: Enhanced Vegetation Index; DOYpeak: date when the EVI reached its peak; DOYseed: full-seed date recorded by the nearest AMS; SOS: start of the growing season; EOS: end of the growing season; SWIR1: Short-wave infrared band1; SWIR2: Short-wave infrared band2; SIWSI: Short-wave Infrared Water Stress Index; RE1: Red Edge band 1; RE2: Red Edge band 2; RE3: Red Edge band 3; NIR: near-infrared band; TCARI: Transformed Chlorophyll Absorption in Reflectance Index; VGP: vegetative growing period; RGP: reproductive growing season.
2.3.1 Data processing
We employed the simple cloud score algorithm (Oreopoulos et al., 2011), the QA60 band, the cirrus band, and the cloud probability dataset to identify cloud masks. The following isolated cloud masks are created: (1) cloud and cirrus identified by the QA60 band, (2) cirrus identified by the cirrus band in Level-1C products, (3) pixels with a cloud score of less than 0.9, and (4) pixels with a cloud probability of more than 70. Each algorithm has its own strengths and limitations. For example, the QA60 band removes a large number of thin cirrus clouds while ignoring small clouds with thicker resolution, and the fixed threshold values of cloud score and cloud probability may introduce uncertainties. Therefore, we masked the pixels identified as clouds by at least two methods to achieve better cloud removal effects. Then, we used the temporal dark outlier mask (TDOM) method to eliminate cloud shadows (Housman et al., 2018). We calculated the SIWSI and TCARI based on the Sentinel-2 image set processed above (see Sect. 2.3.2, “Feature selection”). To fill the data gaps caused by cloud removal and smooth anomalies, the Sentinel-2 time series was reconstructed by the moving median composite method, resulting in a 10 d interval composite time series. We set the half-window size for the moving median methods to 10 d considering the 5 d revisit cycle of Sentinel-2 and computational efficiency. In areas with notably limited clear observations, a gap-filling method was conducted on the composite time series. This method involves substituting any given observation with the median value from three neighboring observations (i.e., previous, current, and subsequent observations) to maximize the continuity and completeness of the time series.
2.3.2 RASP soybean mapping strategy
-
Potential area identification. To minimize the impact from non-croplands, we firstly determined the potential cropping areas by masking the GLAD cropland layer over the study area. Sentinel-2 images within the growing season were extracted by taking the sowing date and harvesting date recorded at the nearest agricultural meteorological station (AMS) as the start and end dates of the growing season, respectively. Based on the cropland extracted, we filtered out the pixels exhibiting an Enhanced Vegetation Index (EVI) maximum value during the growing season of less than 0.4 to remove fallow land according to the analysis of ground samples (Fig. S1) and previous studies, which found that almost all the crops had maximum EVI values above 0.4 (Li et al., 2014; Zhang et al., 2017; Han et al., 2022). The EVI is a vegetation index with high sensitivity in biomass:
where ρNIR, ρRed, and ρBlue represent the reflectance of the NIR (835.1 nm (S2A)/833 nm (S2B)), red (664.5 nm (S2A)/665 nm (S2B)), and blue (496.6 nm (S2A)/492.1 nm (S2B)), respectively.
The greenest period of soybean typically occurs between the podding date and the full-seed date, with a difference of more than 1 month from the peak date of nonseasonal crops, such as wheat (Fig. 4a). We obtained the phenological observations recorded by the nearest AMS as a reference and set the restricted time window from 15 d before the podding date (DOYpodding) to 15 d after the full-seed date (DOYseed) (Fig. 3). We generated the potential area by eliminating pixels whose EVI maximum occurs outside the given time window because the phenological difference of soybeans in adjacent areas generally does not exceed 1 month. Moreover, the impacts of cloud-covered pixels appearing in the proposed period are minimized since we have reconstructed the original EVI time series.
-
Feature selection. By exploring the spectral characteristics of crop field samples, we identified reflectance bands and vegetation indices that are significantly associated with soybeans but that are different from other crops. We selected six bands and two spectral indices for crop mapping, including the NIR band, Red Edge band 1 (RE1), Red Edge band 2 (RE2), Red Edge band 3 (RE3), Short Wave Infrared band 1 (SWIR1), Short Wave Infrared band 2 (SWIR2), Shortwave Infrared Water Stress Index (SIWSI), and Transformed Chlorophyll Absorption in Reflectance Index (TCARI). The SIWSI is an indicator of canopy water content that reflects soil moisture variations and canopy water stress better than the Normalized Difference Vegetation Index (NDVI) (Fensholt and Sandholt, 2003; Olsen et al., 2015). TCARI is an indicator which is sensitive to chlorophyll concentration (Sobejano-Paz et al., 2020). The two spectral indices were calculated as follows:
where ρSWIR1, ρNIR, ρVRE1, ρRed, and ρGreen represent the reflectance of the Short Wave Infrared band1 (SWIR1, 1613.7 nm (S2A)/1610.4 nm (S2B)), NIR (835.1 nm (S2A)/833 nm (S2B)), Red Edge 1 (VRE1, 703.9 nm (S2A)/703.8 nm (S2B)), red (664.5 nm (S2A)/665 nm (S2B)), and green (560 nm (S2A)/559 nm (S2B)), respectively.
During the early growing season of soybean (∼ DOY 120–190 in Zone I), the flooding signal of rice was obvious due to the transplanting period. This resulted in a significantly lower SWIR reflectance and SIWSI for rice compared to those of soybean (Fig. 4f–h). SWIR bands and SIWSI during the vegetative growing period (VGP) of soybean can effectively distinguish dryland crops (such as soybean and maize) from paddy crops (such as rice).
Soybean has a lower water content during the middle and later growing seasons (∼ DOY 190–220 in Zone I) than maize, resulting in higher reflectivity in SWIR bands (Fig. 4b, f, g) (Chen et al., 2005). It has been demonstrated that SWIR and red-edge bands can effectively differentiate between soybean and maize (Fig. 4c–g) (Zhong et al., 2016; You and Dong, 2020; J. Liu et al., 2018). Additionally, the chlorophyll content of soybean in the middle- and late-growth periods was lower than that of maize, leading to significantly higher TCARI values. Meanwhile, the timing of TCARI reaching saturation significantly differs between soybean, rice, and wheat (Fig. 4i). All these spectral–phenological characteristics are also applicable to soybeans planted in other subzones (Figs. S2–S4). Based on these findings, we selected NIR, red-edge bands, short-wave infrared bands, and the TCARI during the soybean RGP as key features.
-
Unsupervised learning. We utilized the K-means algorithm to classify potential area data by using the wekaKMeans Clusterer provided by Google Earth Engine (GEE). The m samples are divided into k clusters by alternately assigning samples to the nearest cluster centroid measured by the Euclidean distance or the Manhattan distance and updating the cluster centroid to the mean of the samples assigned to the cluster. This approach had been widely used in land cover classification and crop mapping (Xiong et al., 2017; Wang et al., 2019). We used the detailed phenological records at AMSs to identify soybean growth periods and selected the spectra and vegetation indices within specific growth periods (VGP, RGP) as input features. The classifier was trained individually on each prefecture based on the number of clusters of k input. The cluster number k is defined as the number of “major crops” that constitute 95 % of the total area for seasonal crops (including rice, maize, soybean, cotton, peanuts, sesame, sweet potato, and sorghum) according to prefecture-level statistics, plus one for “other crops”.
-
Cluster assignment. To identify the most likely cluster that represents soybean, we randomly selected 100 points per cluster and extracted feature series. We then used the dynamic time warping (DTW) method to measure the similarity between each cluster's eight features involved in classification and the soybean standard curves. We averaged the data of 30 % of the samples in each subzone to establish the standard curves, reducing the impact of regional phenological variations. The time coverage of Zones I–IV was set to April–September, May–October, June–October, and August–November, respectively, which corresponds to the soybean-growing season. The cluster with the minimal average of eight DTW values was identified as the soybean cluster. DTW is a flexible algorithm that allows for deviations in time between two sequences, and it calculates the minimum distance between them by finding misalignment matches between elements. This approach is widely used in land cover and crop identification due to its ability to handle time distortions associated with seasonal changes (Guan et al., 2016; Dong et al., 2020).
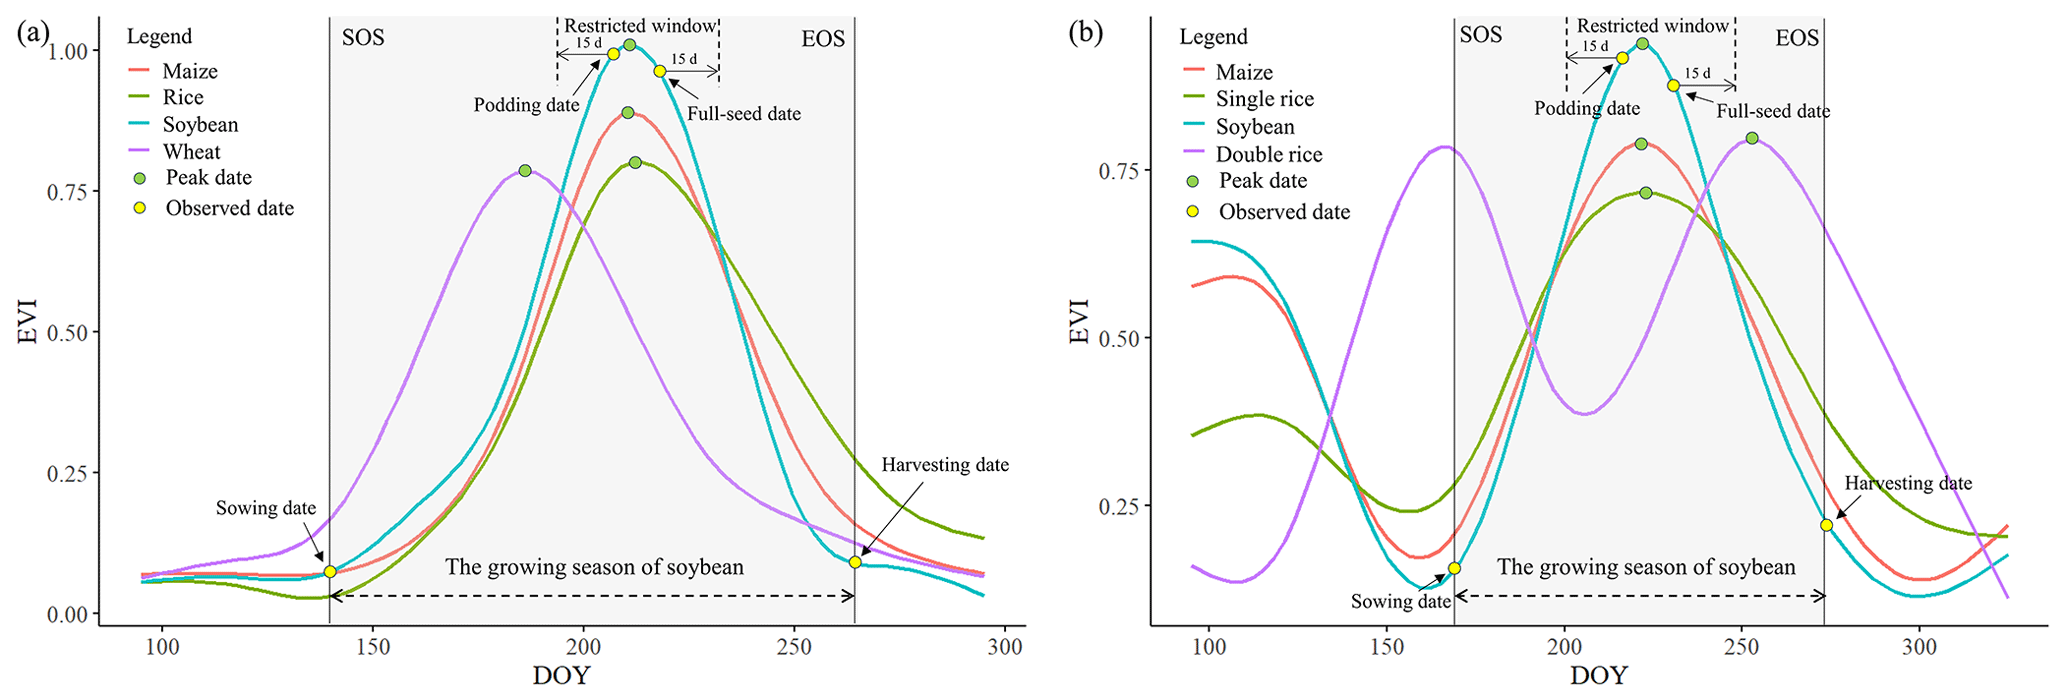
Figure 3Schematic diagram of seasonal crop identification for (a) single- and (b) double-cropping systems.

Figure 4Temporal profiles of (a)–(i) major crops in Northeast China and (j) key soybean phenological periods by region based on ground samples. Lines depict the mean values of different crops, and shaded areas depict error bars with 1 positive or negative standard deviation. The number at the bottom represents the key phenological periods of soybean: 1 – sowing, 2 – flowering, 3 – seed-filling, and 4 – maturity.
2.3.3 Accuracy assessment
To assess the accuracy of the soybean maps we generated, we validated and compared the results using (1) county- and prefecture-level census data, (2) ground samples, and (3) existing products. Since the county-level statistics after 2019 were not fully collected, we used the county-level statistics for 2017–2018 and the prefecture-level statistics for 2019–2020 to calculate the R2 and RMSE of the mapped area with the following equations:
where si and yi are the statistical and mapped soybean areas for the county (prefecture) i, is the average statistical area, and n represents the total number of counties (prefectures). We calculated the local crop-mapping area based on the Universal Transverse Mercator (UTM) projection corresponding to the location of the province.
We also used ground samples during 2017–2019 to verify the authenticity of the soybean maps. Confusion matrices were calculated as follows:
where Ni is the number of correctly identified validation samples of class i, Ri is the number of ground validation samples of class i, Ci is the number of validation samples classified as class i, Ci is the number of validation samples classified as class i, Nc is the total number of correctly identified validation samples, and A is the total number of validation samples. PA, UA, and OA represent the producer accuracy, user accuracy, and overall accuracy, respectively.
To ensure that the products are accurate not only in quantity but also in space, we further compared ChinaSoyArea10m with existing products in detail space.
3.1 Accuracy assessment
We utilized the available census data from 2017 to 2020 (at the county level in 2017–2018 and the prefecture level in 2019–2020) to verify the accuracy of the soybean maps across the entire studied area. The annual ChinaSoyArea10m is consistent with the census data (R2>0.8), with R2 values of 0.84, 0.85, 0.82, and 0.86 for 2017, 2018, 2019, and 2020, respectively (Fig. 5). These results demonstrate that our RASP method is interannually robust and can accurately capture the annual dynamics of soybean-planting areas. The scattered points are generally distributed around the 1:1 line, without large overestimations or underestimations. However, the areas are overestimated for counties with planting areas <20 kha or prefectures with planting areas <100 kha (Fig. 5). This uncertainty, particularly overestimation, could be caused by the low proportion of soybean cultivation. If maize or other same-season crops are planted in a much higher proportion than soybeans there, distinctly recognizing soybeans (as a less prevalent crop) as a separate category will be a big challenge for classifiers, consequently resulting in misclassified clusters, including maize or other crops.
The mapping accuracy in Zone I closely matched county-level statistics, showing high consistency (R2=0.86). Zones II–IV also demonstrated reasonable agreement (R2=0.50–0.69) despite relatively lower accuracy due to the scarcer planted areas (Fig. S5). No significant trend deviation from statistics was indicated for the mapping area in Zone I, with slight overestimations for Zones II and III and underestimations for Zone IV (Fig. S5). These accuracy variations are acceptable given the challenges in accurately identifying soybeans in regions where they are planted less prevalently. Specifically, maize is more dominant than soybean in Zone II, while Zone III is characterized by diverse crops and complex planting patterns. Underestimation in Zone IV is possibly due to fewer clear observations in the southwest. Nevertheless, the overall accuracy across the zones is acceptable.
ChinaSoyArea10m is consistent with census data compared to the existing product (CDL) (You et al., 2021), using both the county level in 2018 and the prefecture level in 2019 (Fig. 6). The CDL's results are consistent with census data at the prefecture scale, with more overestimations at the county level (Fig. 6), implying that the comparison at a finer scale would reveal more details. ChinaSoyArea10m is consistent with statistics at both levels (R2∼0.85), with R2 increases of 0.31 compared with the CDL at the county level (Fig. 6a).
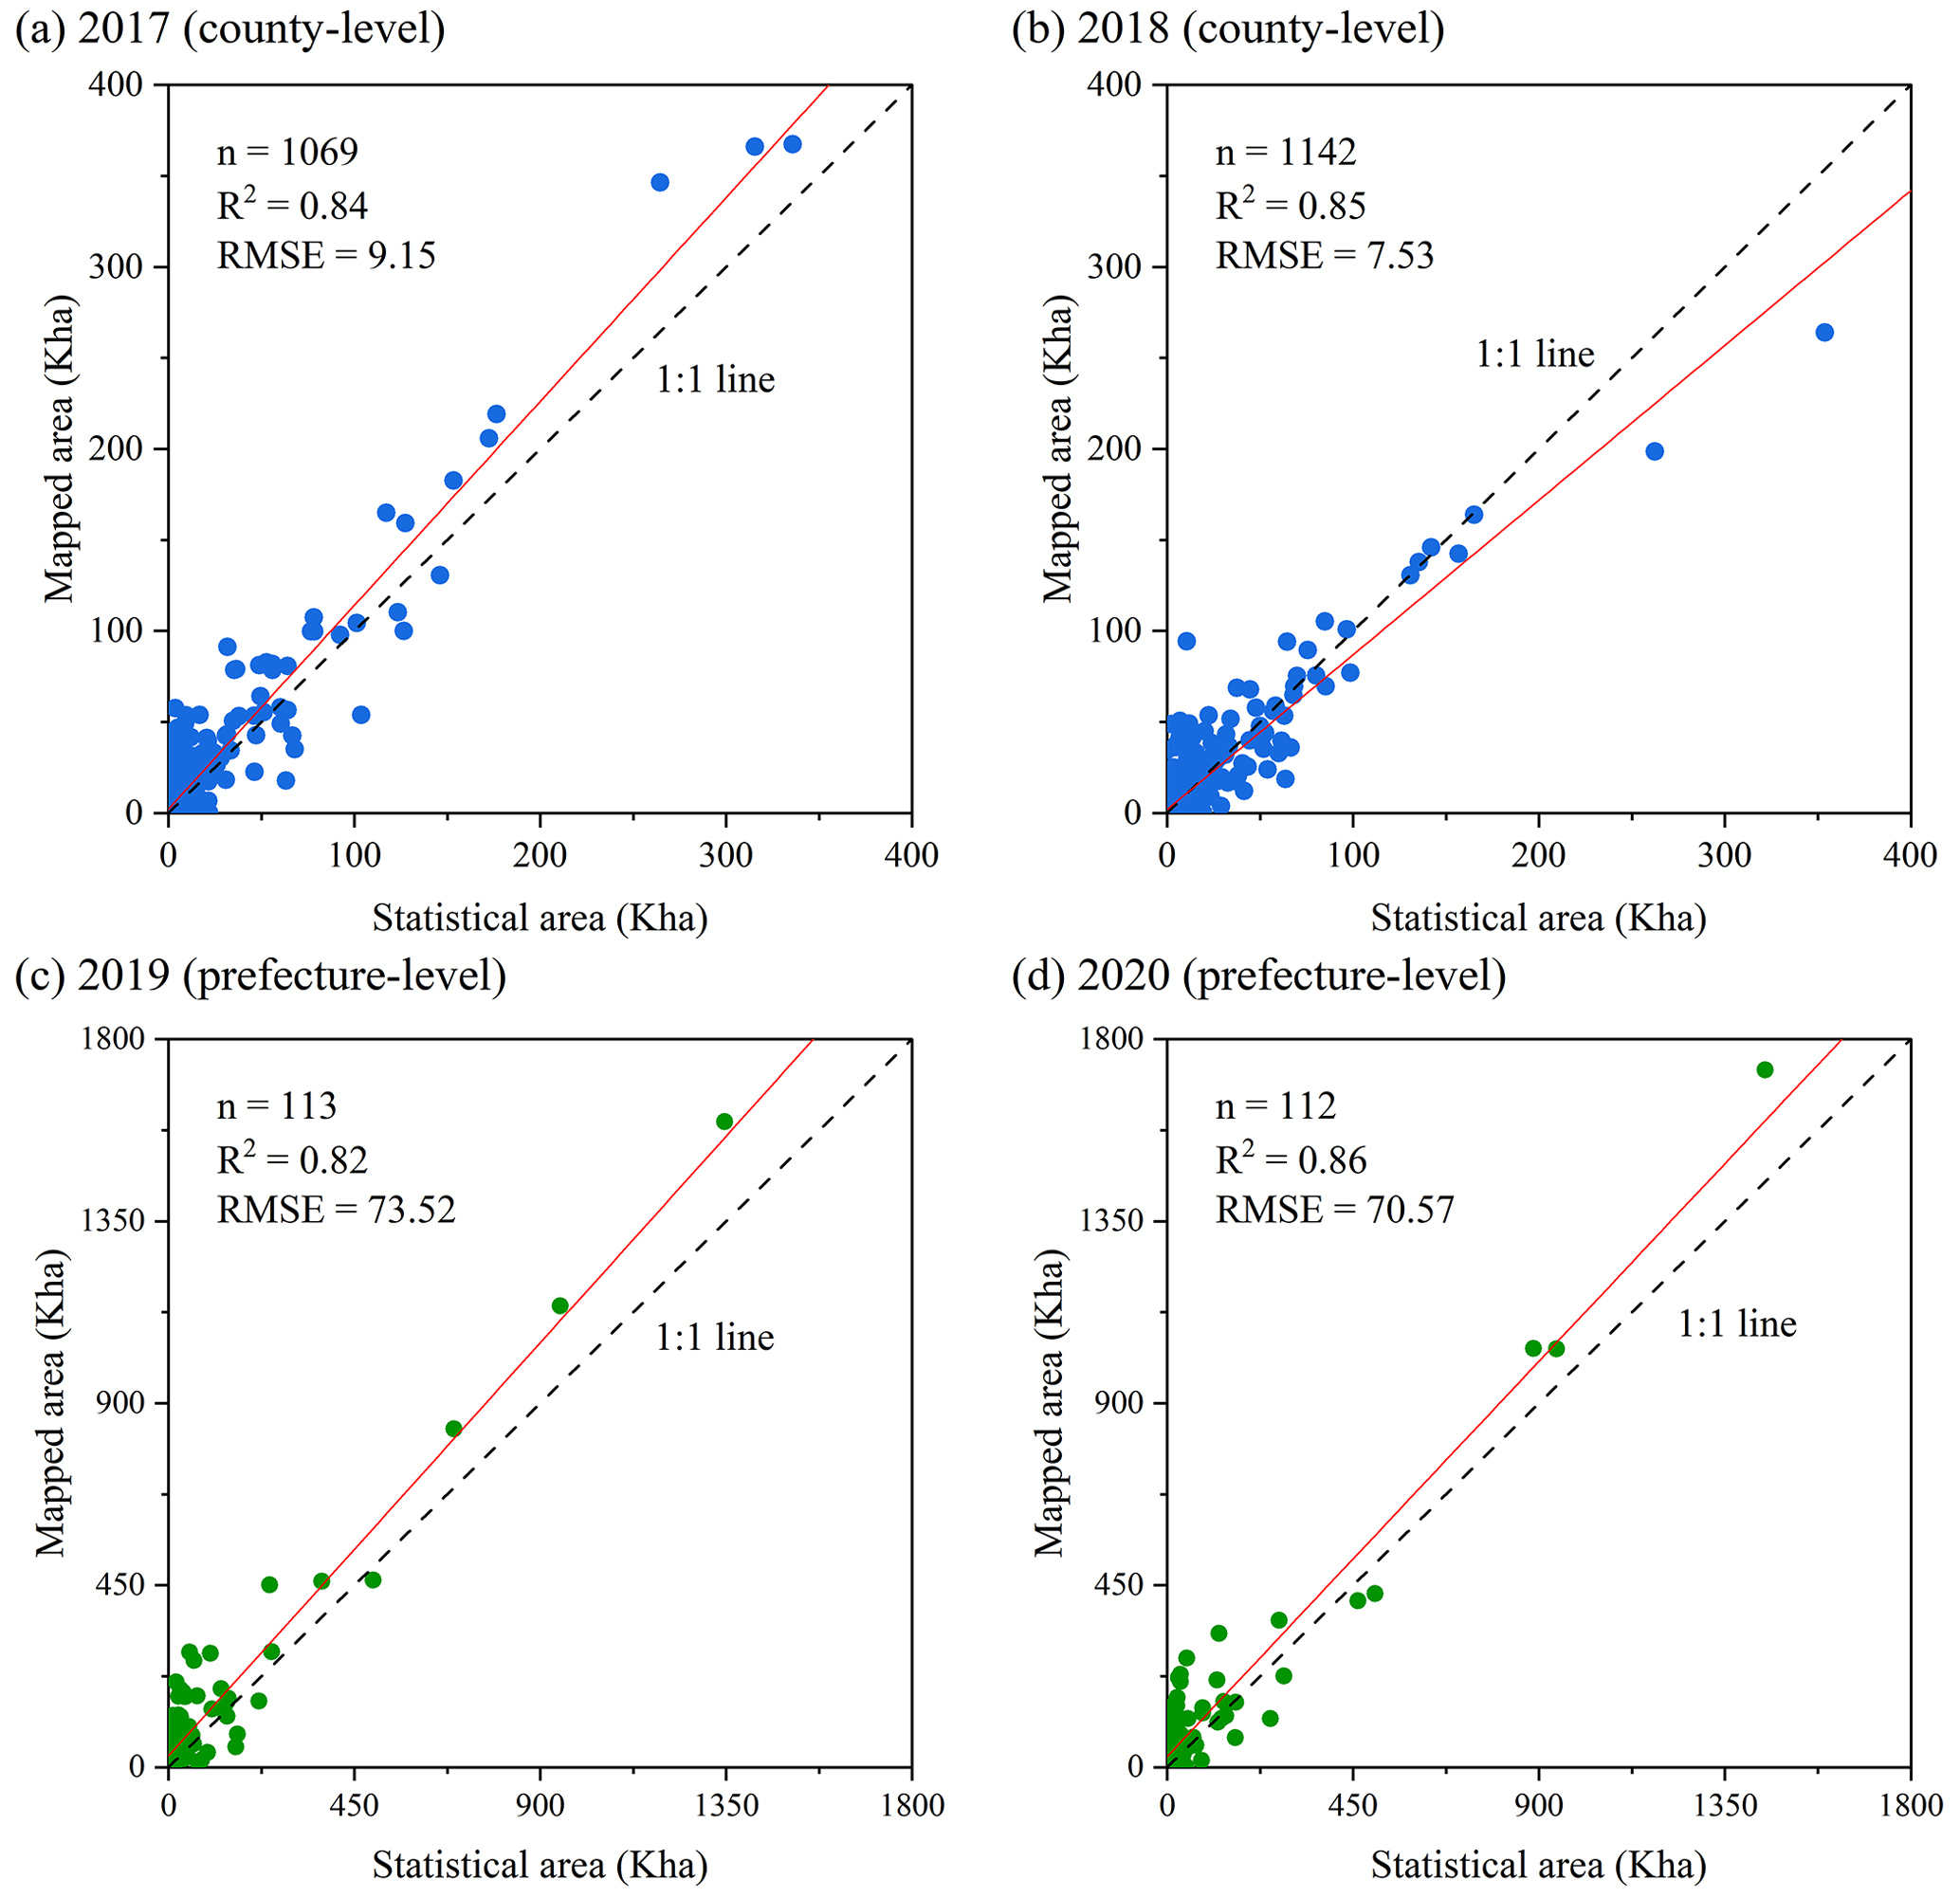
Figure 5Comparison of soybean areas with statistics in (a) 2017 at the county level, (b) 2018 at the county level, (c) 2019 at the prefecture level, and (d) 2020 at the prefecture level.

Figure 6Comparison of soybean areas of ChinaSoyArea10m and the CDL with statistics in (a) 2018 at the county level and (b) 2019 at the prefecture level.
Furthermore, we used ground samples in 2017–2019 to validate the reliability of the soybean maps. Since the soybean-planting area maps are 0–1 binary images, we categorized the ground samples into soybean and non-soybean (maize, rice, wheat, and other crops). The verification results based on ground samples indicated that the overall accuracy of soybean maps during 2017–2019 was in the range of 77.08 % to 86.77 %. The F1 scores of soybeans increased from 2017 to 2019 (0.69, 0.75, and 0.84, respectively) (Table 2). The variance in accuracy among years could be attributed to the quality of Sentinel-2 images, which had been indicated in previous studies (Liu et al., 2020; Han et al., 2021). The overall accuracy for each subzone in 2019 varied from 83.58 % to 90.67 % (Table S1). Specifically, Zone I demonstrated the highest producer accuracy for soybean at 88.31 %, in line with its high consistency with statistics. Zone III achieved the highest overall accuracy at 90.67 %, attributed to its superior user accuracy for soybean, indicating fewer misclassifications and effective differentiation from non-soybean crops (Table S1). The producer's accuracy in Zone IV was relatively lower at 63.89 %, possibly due to the limited samples, high heterogeneity, and fewer clear observations (Table S1).
Table 2Confusion matrix of the soybean maps during 2017–2019.
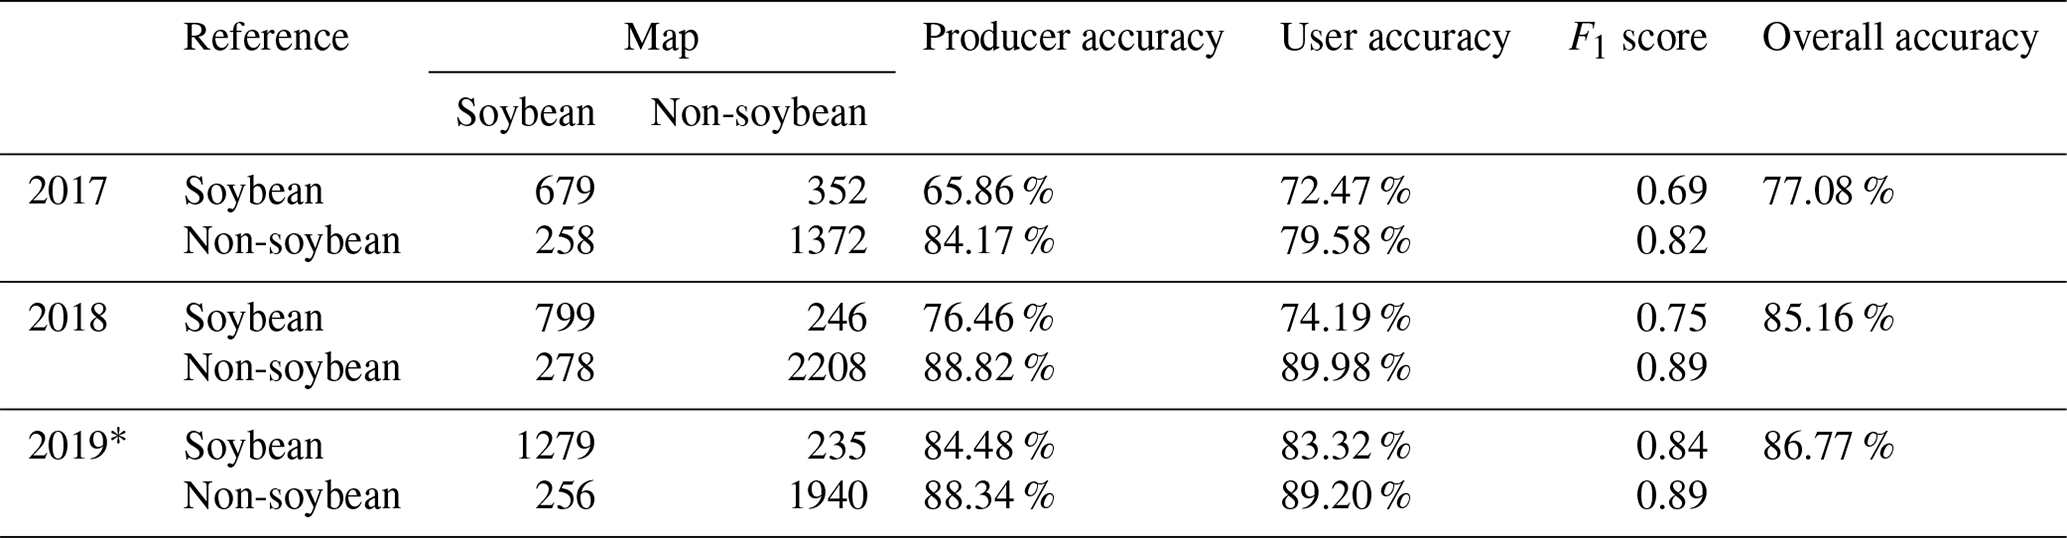
* Including ground samples and nationwide reference points based on existing datasets.
3.2 Spatial distributions of soybean-planting areas
Based on the soybean maps, we further analyzed the spatial patterns of soybean distribution in China during 2017–2021. There have been small changes in the spatial distribution of soybean in China in recent years (Figs. 7–8). Several hotspots were obviously observed in Heilongjiang Province, eastern Inner Mongolia, and northern Anhui, especially for eastern Inner Mongolia and western Heilongjiang, extensively and densely distributed by soybean fields (Fig. 8b–c). In Region II, soybean was planted at a larger scale, mainly concentrated in northern Anhui (Fig. 8d) and extensively distributed in Henan and Shandong (Fig. 8e). Soybeans in other provinces of Regions II, III, and IV had a scattered distribution, especially in the southwestern mountainous region (Fig. 8f–h).
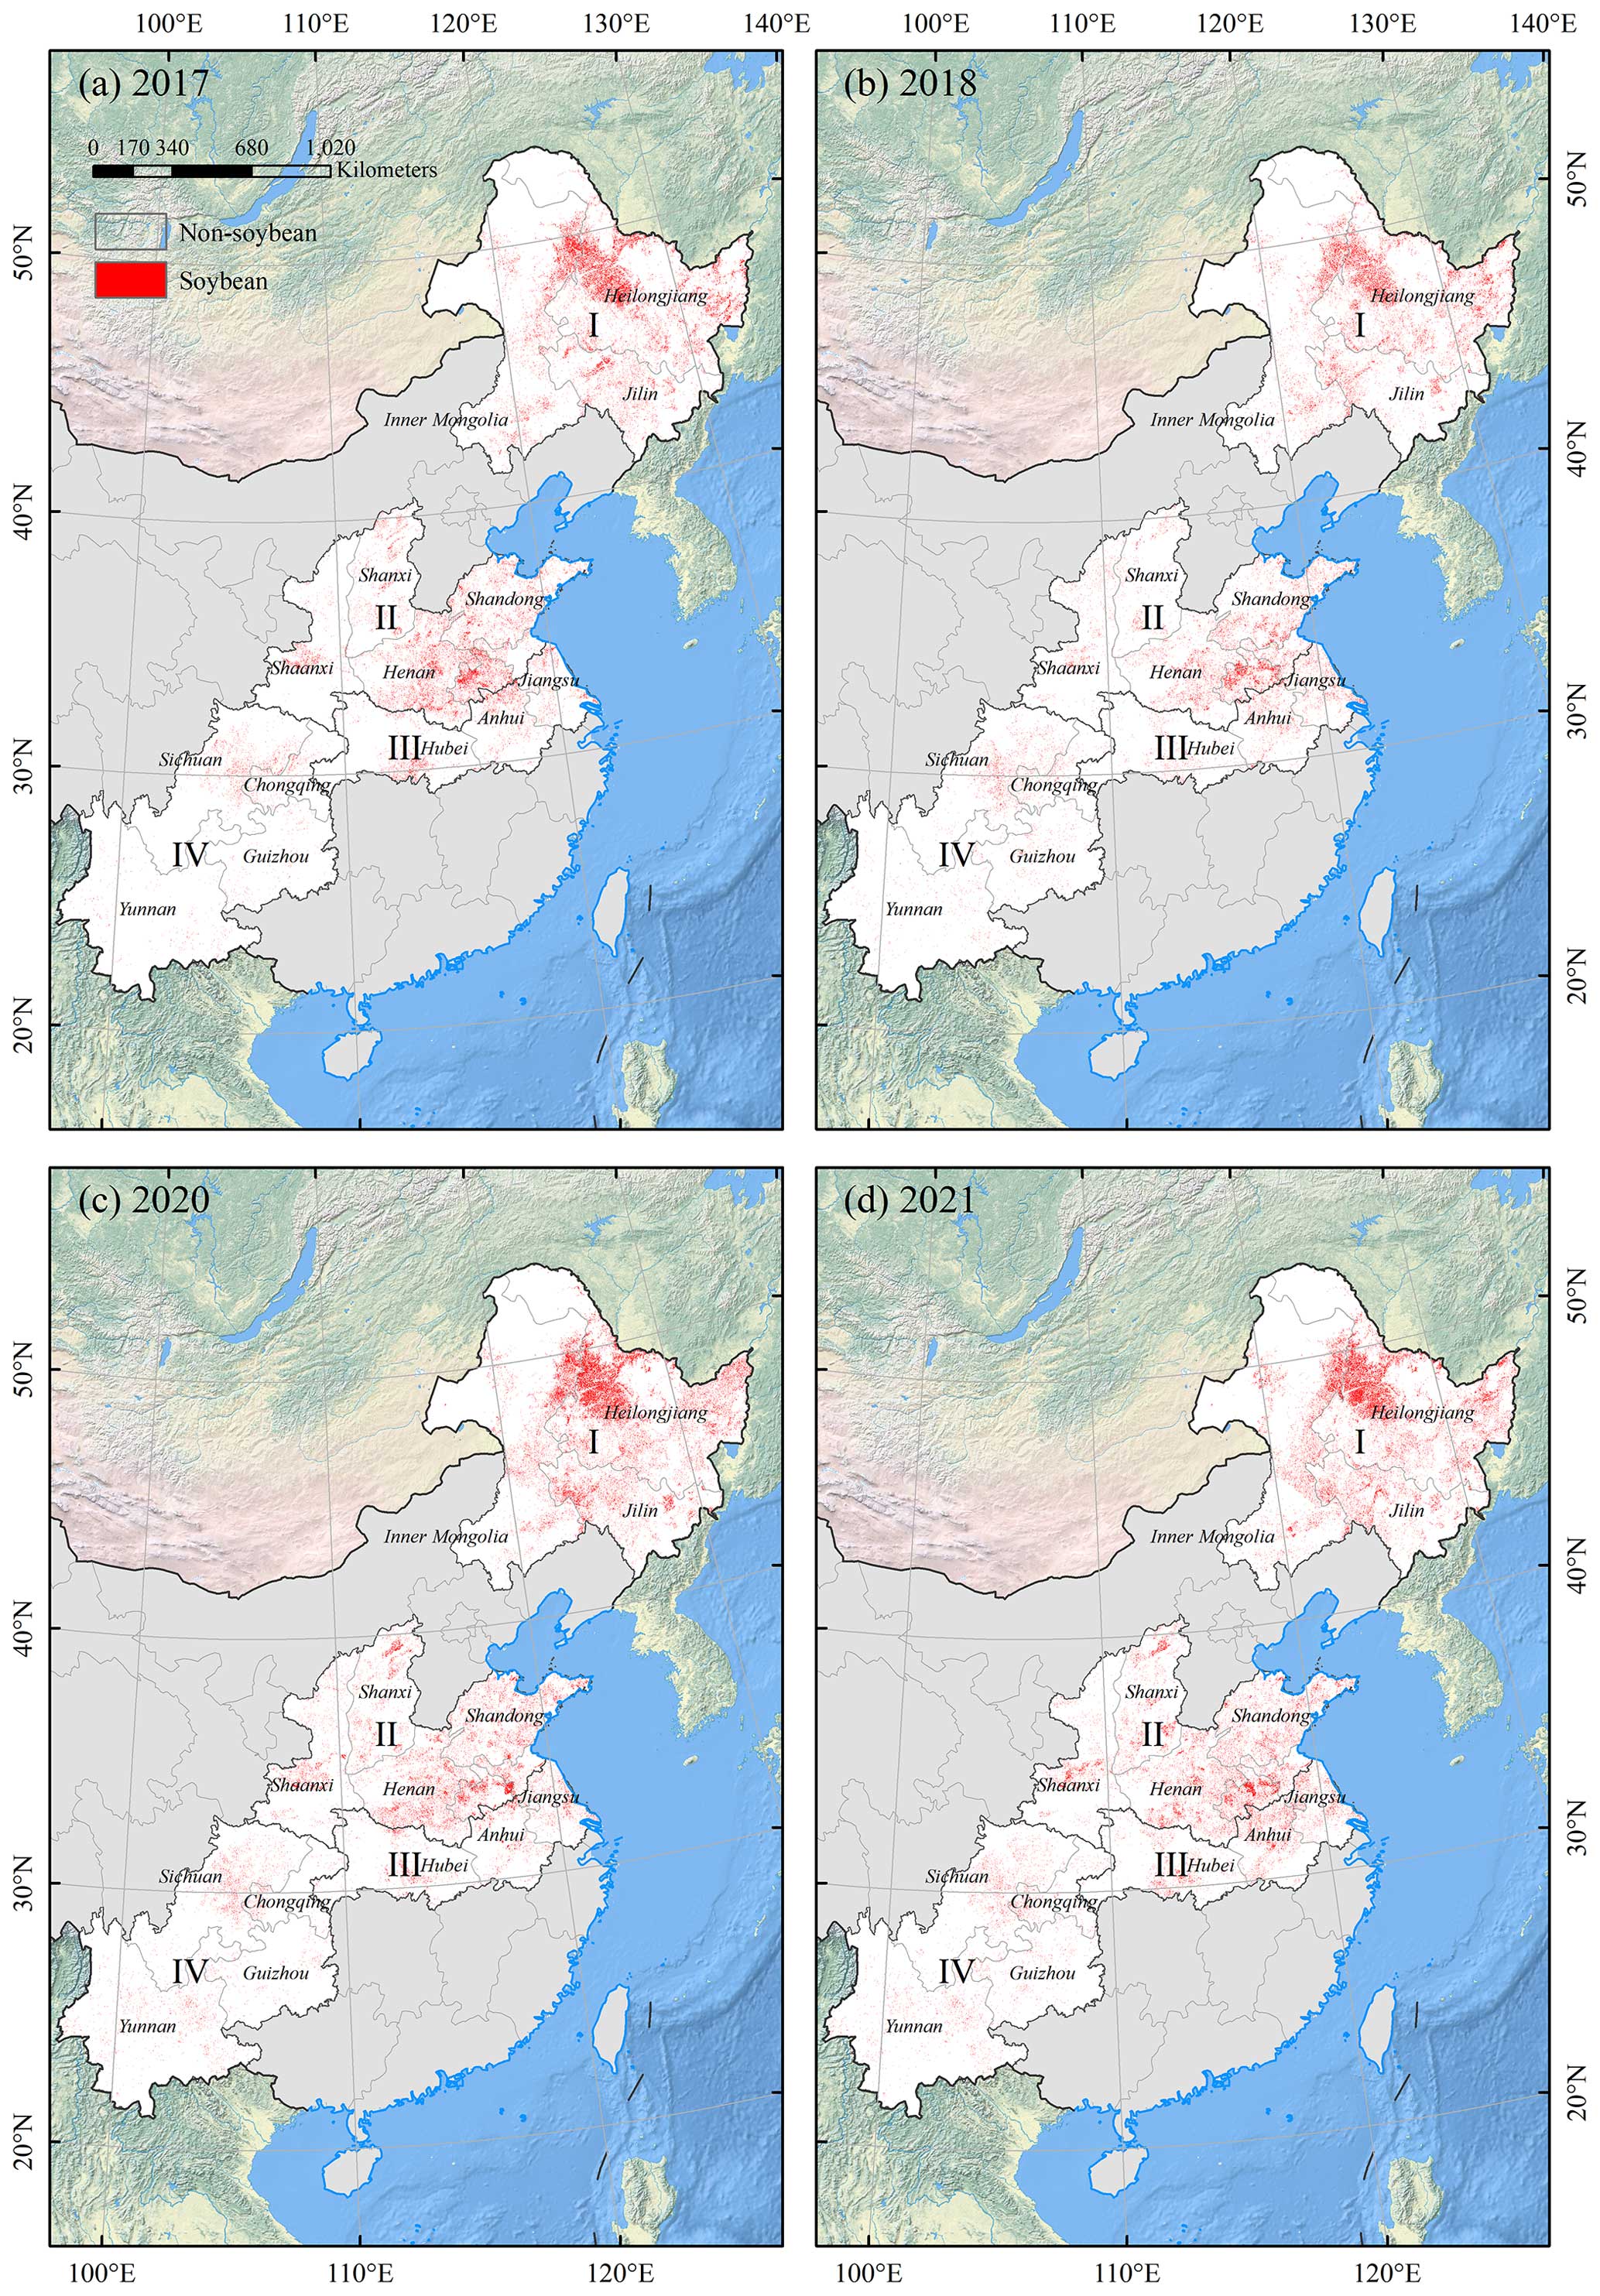
Figure 7Spatial distribution of soybean areas at 10 m resolution across China in (a) 2017, (b) 2018, (c) 2020, and (d) 2021.
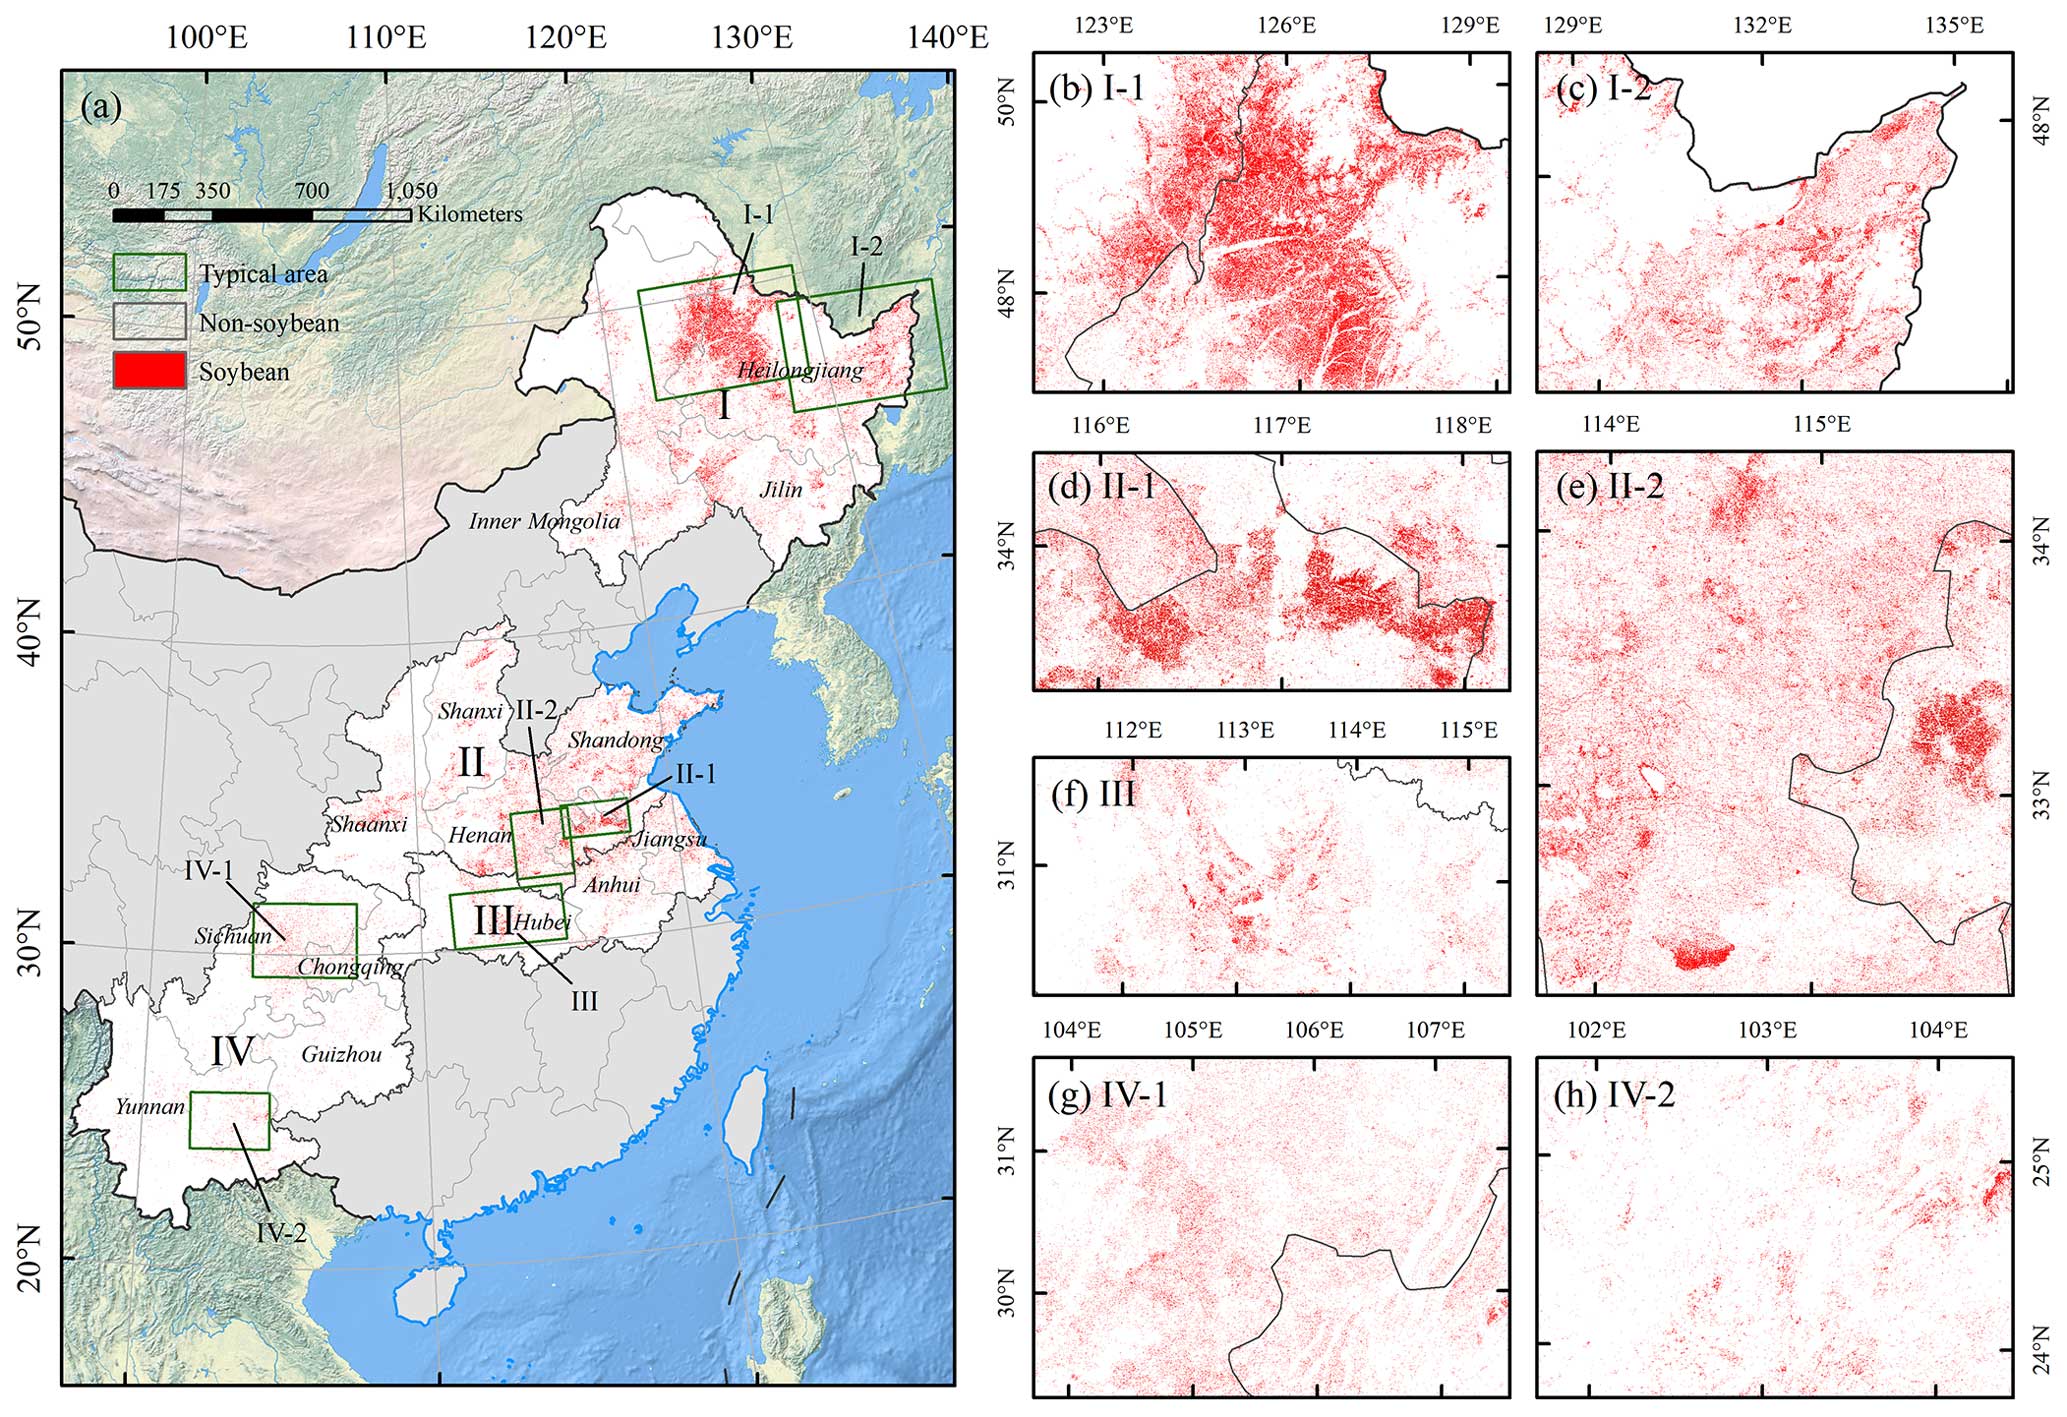
Figure 8Spatial distribution of soybean areas at 10 m resolution across China (a) and zoom-in maps of each region (b–h) in 2019.
To further compare soybean maps in detail, we compared ChinaSoyArea10m with the GLAD maize–soybean map and CDL data products in space. The GLAD product is a 10 m resolution maize–soybean map of China in 2019, and its R2 values with provincial and prefecture statistics were reported to be 0.93 and 0.94 (Li et al., 2023). Arable land near waterbodies is often misclassified as soybean plots by the CDL, which did not occur with GLAD and ChinaSoyArea10m, implying that other crop types are possibly misclassified as soybeans by the CDL (Fig. 9a1–d1). As for the second case (Fig. 9a2), our extraction results are similar to those of GLAD, while small plots failed to be identified by the CDL (Fig. 9a2–d2). In areas where planted banded soybeans are less concentrated, the CDL tended to overestimate the soybean area (Fig. 9a3–d3), further substantiating the above limitations (Fig. 6). Conversely, our mapping results behaved similarly to GLAD (Fig. 9a3–d3). The overall accuracy of the GLAD map based on pure samples reaches 95.4 % (Li et al., 2023), so GLAD can be regarded as a reliable reference. From the three cases, therefore, ChinaSoyArea10m behaved more similarly to GLAD than the CDL, indicated by less underestimation, less overestimation, and higher accuracy of details.
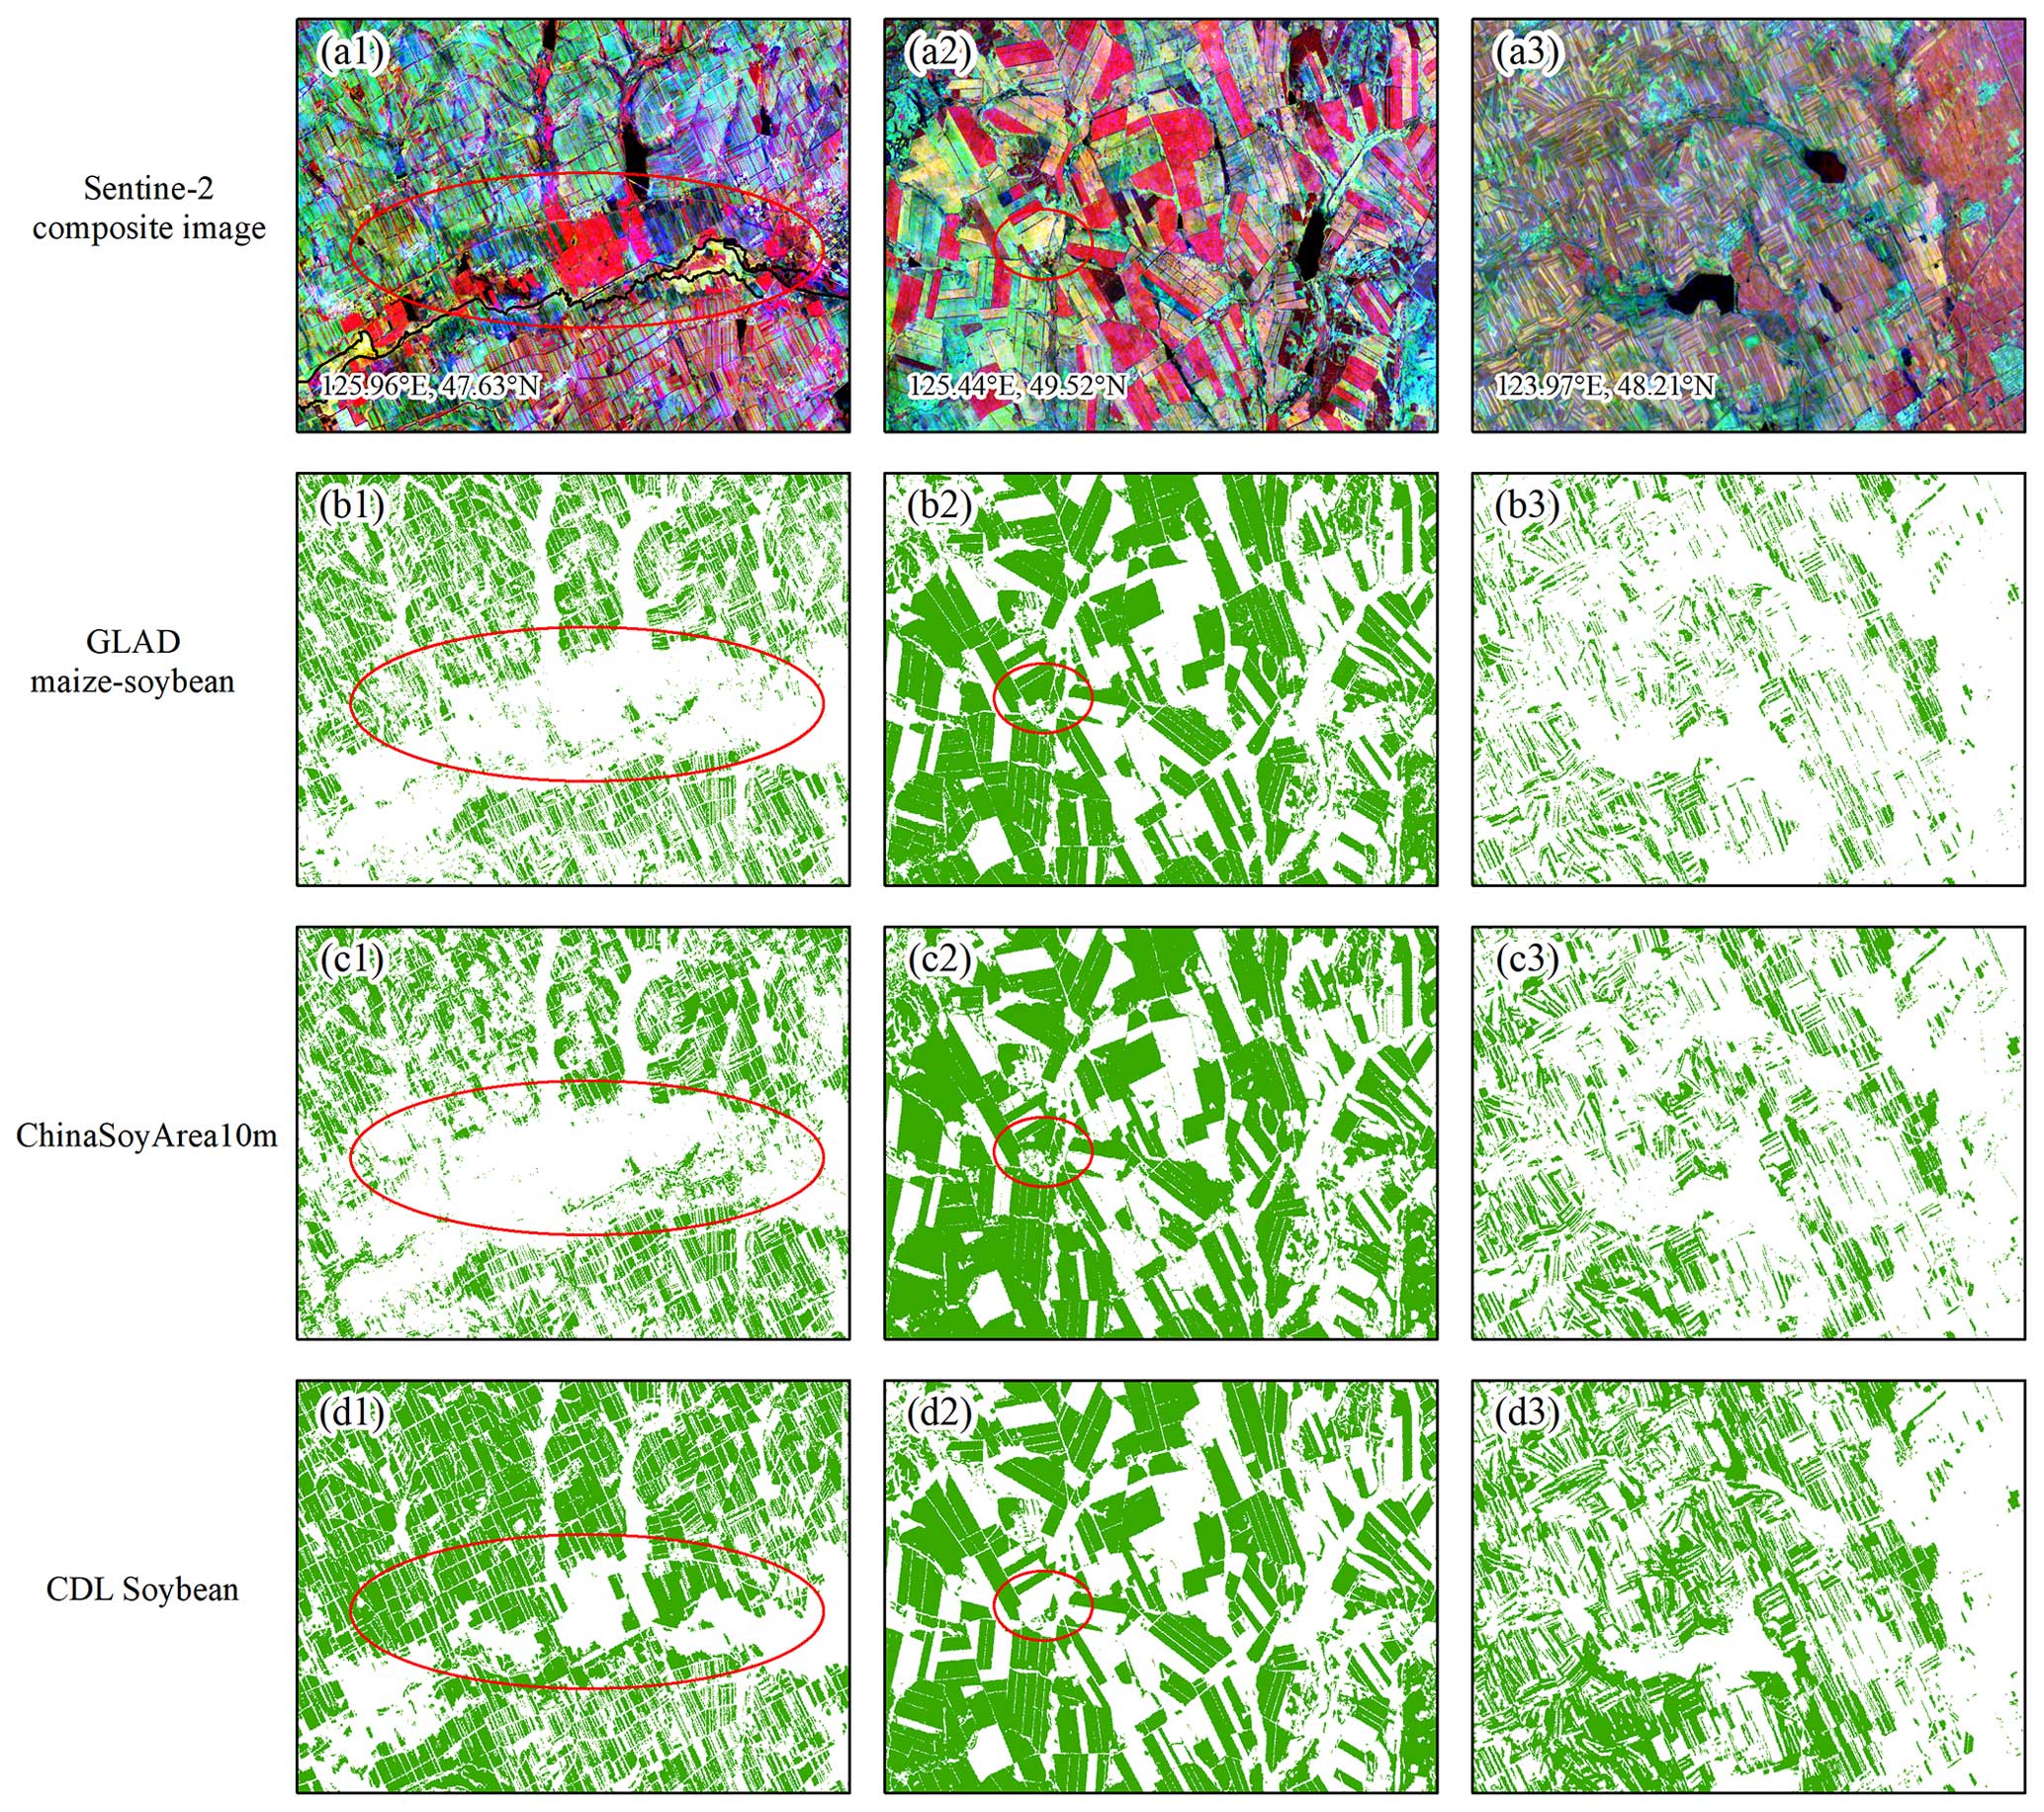
Figure 9Visual comparison of our soybean maps and existing products in typical regions in 2019: (a1–a3) RGB composite images comprise NIR (Band 8), SWIR 2 (Band 12), and SWIR 1 (Band 11) from Sentinel-2 median composite images during the peak growth period of soybean. (b1–b3) Soybean layer extracted from the GLAD maize–soybean map. (c1–c3) ChinaSoyArea10m map. (d1–d3) Soybean layer extracted from the CDL.
4.1 Our advantages and potential applicability
We proposed a new framework (RASP) to identify the annual dynamic of soybean-planting areas over larger regions and produced the longer-term series of soybean maps (ChinaSoyArea10m) across mainly planting areas in China from 2017 to 2021 for the first time. The accuracy of ChinaSoyArea10m is acceptable (R2∼0.85) at both the county and prefecture levels, with a relatively lower R2 than GLAD (R2=0.93 at the prefecture level) but higher than CDL (R2=0.53 at the county level). Compared with existing products, ChinaSoyArea10m accurately depicts soybean with more spatial and temporal details as well.
The methodology developed for identifying soybean-planting areas indicates several notable strengths that make it an attractive option for wide application. Firstly, it operates independently, without extensive ground samples required. The conventional supervised approaches like random forest (RF) and long short-term memory (LSTM) depend on quantities of observations, with much money, time, and labor consumed. In this context, both the transferable learning model and our RASP methods (combining unsupervised learning with statistics) indeed provide huge potential for crop mapping. However, transferable models are suitable for areas or years with similar cropping patterns. In areas with diverse and complex cropping patterns, it is a challenge to apply the supervised model trained in limited areas or limited years to others (Wang et al., 2019; Ma et al., 2020). In contrast, our strategy leverages a specific, pre-existing set of samples to stably differentiate soybean characteristics from other crops, which can accurately map annual dynamics without updated requirements in annual samples. Consequently, this method significantly weakens limitations in crop classification during years without specific samples, enabling consistent and continual crop mapping.
Another key advantage of our spectra-phenology integration approach is its quick applicability over larger areas, coupled with excellent spatial scalability. It can self-adapt to different environments by considering phenology information. Compared to methods that rely on composite indicators and specific thresholds, our approach simplifies the requirements for inputs and experienced judgments. The only inputs required are the phenological information on soybeans and the number of other primary crops during the same growing season in the targeted area. This allows us to classify crops swiftly and efficiently without additional inputs for background knowledge or setting complex thresholds. The input of phenological information in each prefecture enhanced the zonal adaptive assessment of soybean growth status across various areas, thereby facilitating crop classification. This innovative approach ensures its applicability to other soybean-producing areas, showcasing its potential for broader implementation.
4.2 The uncertainty from image quality
The method we proposed (RASP) is strongly dependent on remote sensing images and subregional unsupervised classification by considering the bands and vegetation indices, which are all sensitive to the unique characteristics of soybeans. Therefore, the accuracy of soybean maps is inevitably associated with the quality of remote sensing images. By using ground samples to validate the mapping results, we found that the accuracy of 2017 is lower than that of 2018 and 2019, with an overall accuracy of less than 80 % (Table 2).
We extracted cloud-free images in different regions during the soybean-growing season and calculated the monthly average number of clear observations. In general, the monthly averages of clear observations in the Northeast region and the Huang–Huai–Hai region (Zone I and Zone II) are relatively higher than the southern zones (Zone III and Zone IV) (Fig. 10a2–e2). In areas with quite lower clear observations, despite a gap-filling method being used to generate complete 10 d composite time series, higher uncertainty is inevitable. The gap-filling time series might contain duplicate values, which cannot accurately reflect the crop growth process in reality. Obviously, the total number of images available in 2017 over the study areas was significantly lower than those of other years, because the second satellite (Sentinel-2B) only commenced operations and started providing data after March 2017 (Fig. 10a1–e1). Removing the cloudy pixels left even fewer clear images available (upper layer vs. lower layer in Fig. 10). During the growing season, the average number of clear observations per month was zero to two in partial regions, lower than the requirements of the 10 d time series composite we mentioned in Sect. 2.3.1. This might explain the lower user accuracy of soybean in Zone IV compared to the other subzones (Table S1) and the low overall accuracy based on sample verification in 2017 (Table 2).
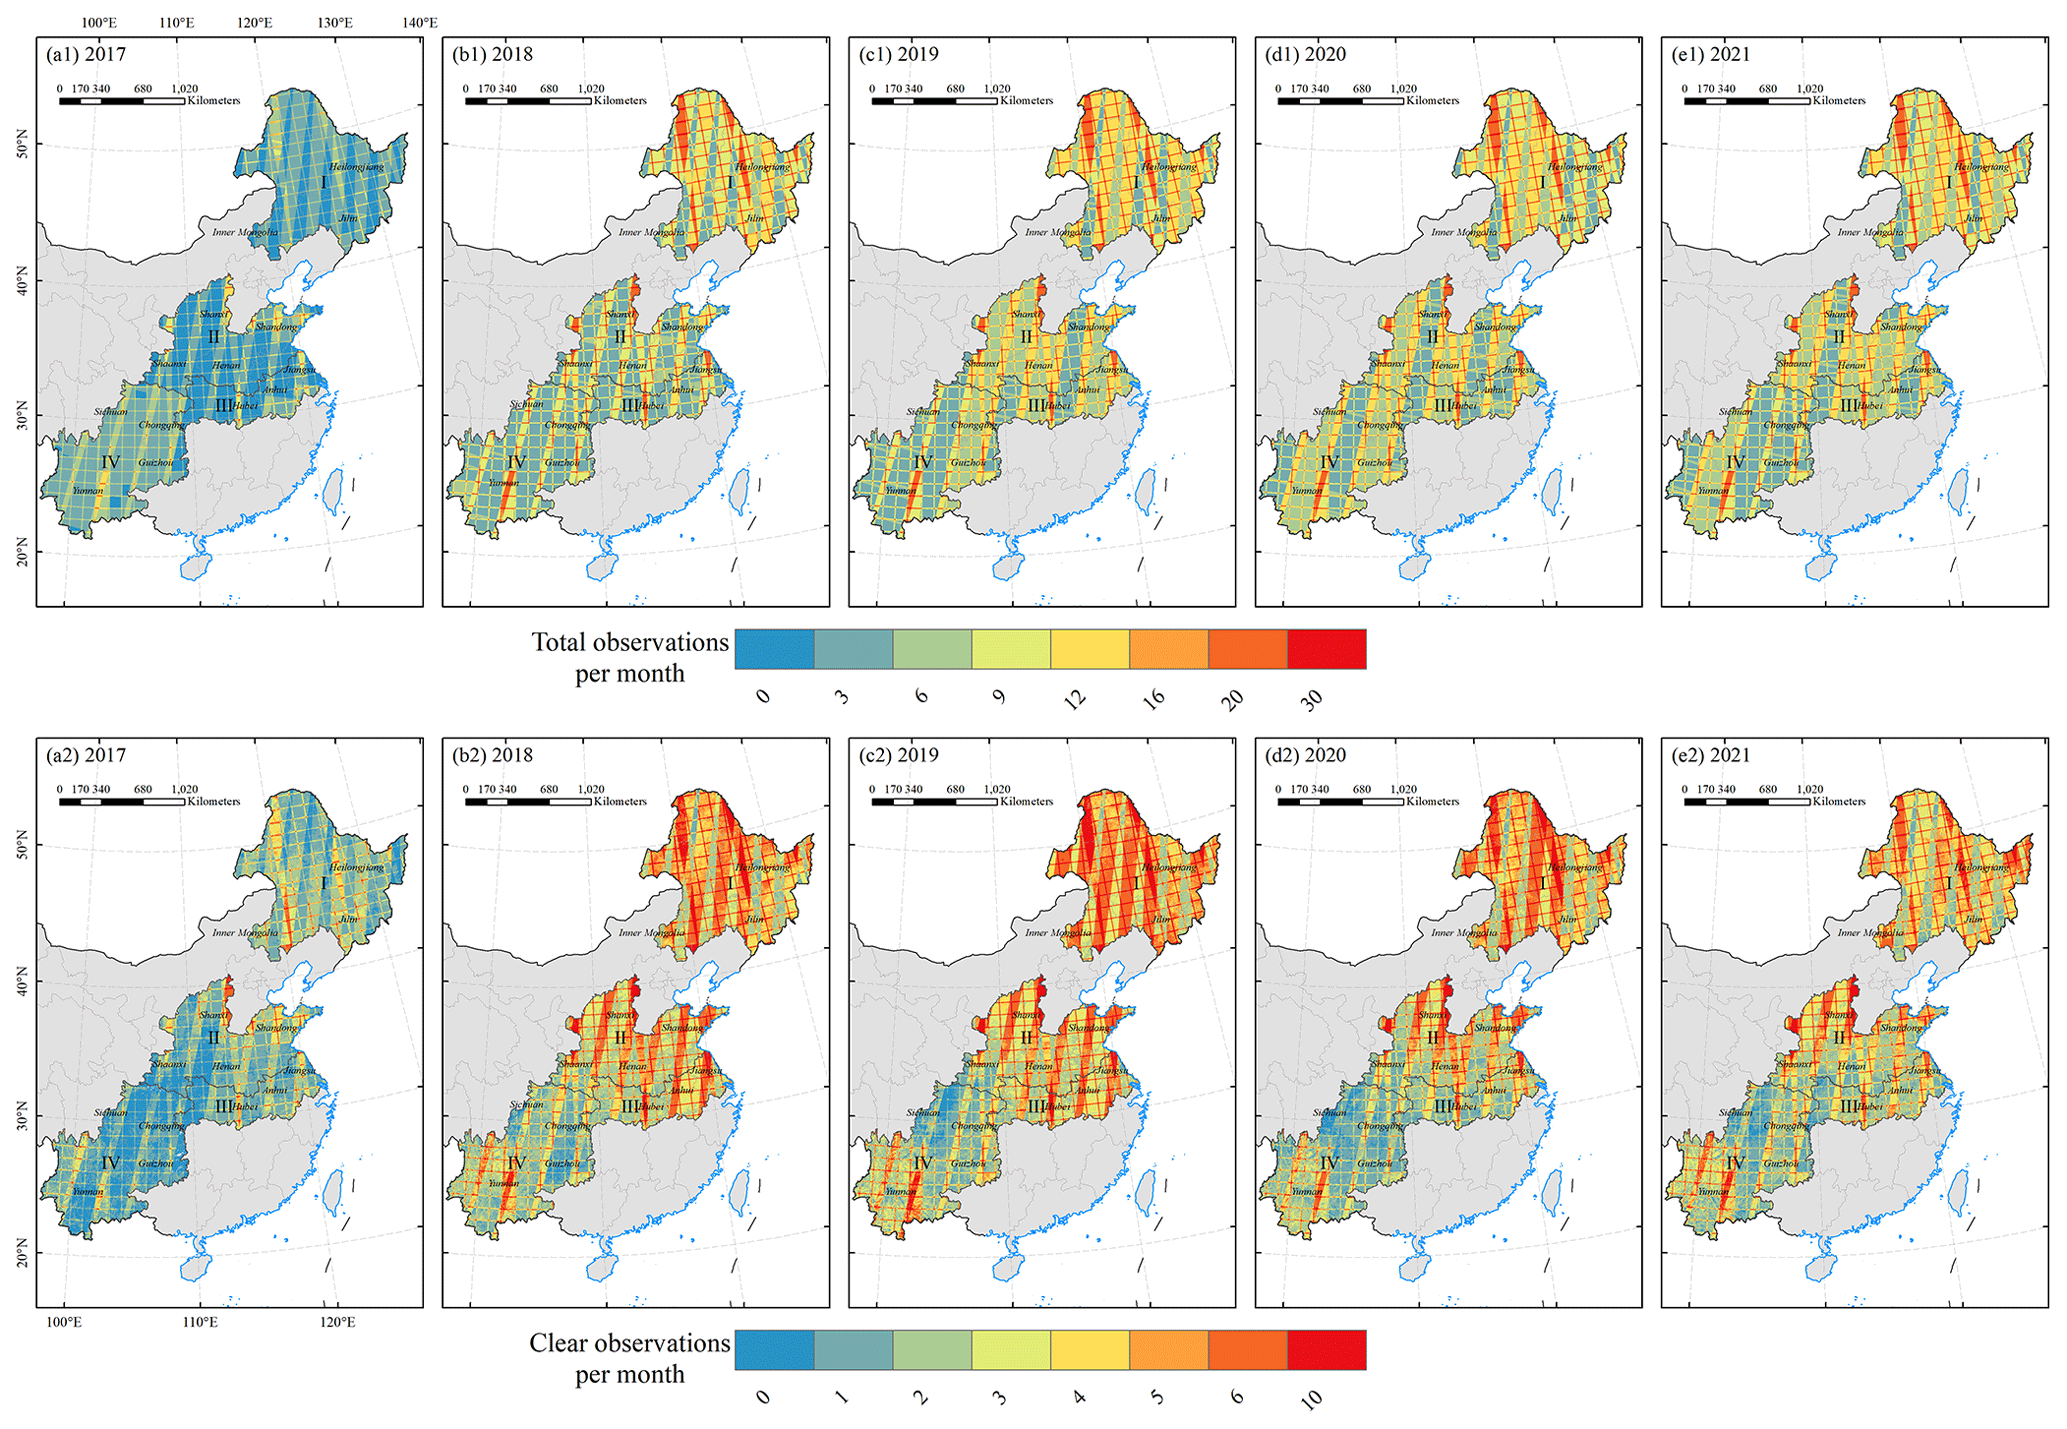
Figure 10Total (a1–e1) and clear (a2–e2) observations per month during the soybean-growing season.
4.3 Limitations in small-scale planting areas
Validation based on statistics shows that ChinaSoyArea10m reached a high consistency (R2∼0.85) across China. However, in areas with soybean sparsely planted, the consistency is lower than that in densely planted areas, with more overestimations observed in the sparse areas. Such overestimations are caused by the limitations of the unsupervised classification algorithm. K-means has difficulty in accurately capturing small plots of crops in a complex cropping system, although it can make up for the shortage of crop mapping in some areas with limited training samples (Kwak and Park, 2022). Studies have proved that the classifier is inferior where the dominant crop phenotypes are similar and crop diversity is higher (Wang et al., 2019; Konduri et al., 2020). Therefore, the classifier is challenged in areas where soybean is not the dominant type due to the small plot size and spectral overlap between different crops (Chabalala et al., 2022). In South China, cropland plots are typically small (<0.04 ha in most regions) and crop diversity is high. The growth periods of soybean, peanut, potato, and maize are similar, dominantly indicated by a mixed planting pattern, which has contributed to the low accuracy of non-main soybean-producing areas in South China (Liu et al., 2020). Additionally, soybeans are intercropped with maize or other crops in some areas where the strip width is less than 1 m (Yang et al., 2014; Du et al., 2018). This planting pattern will introduce the mixed-pixel problem as well against the background of 10 m resolution crop mapping.
The lower accuracy in a sparsely planted soybean area could be explained by the characteristics of a K-means algorithm. A K-means algorithm is developed to minimize the distance between each point within a cluster and the cluster's centroid. When the sample size in a particular category substantially exceeds those of others, the algorithm might preferentially optimize the cohesion of the larger category and would neglect accurate clustering for smaller categories (Tan et al., 2016). The effectiveness of K-means classification is highly dependent on the selection of initial clustering centers. In scenarios of unbalanced categories, randomly selected initial centers might inadequately represent minor categories, resulting in inaccurate results (Tan et al., 2016). Additionally, K-means assumes that each cluster is spherical; therefore, it does not perform well when clusters are nonspherical and uneven in size and density. Hence, in areas with unbalanced crop categories, the algorithm faces challenges in precisely assigning each crop to a corresponding cluster (Tan et al., 2016; Wang et al., 2019).
Our regional adaptive large-area crop-mapping method in the future will further be improved by the following. (1) Classification at a finer scale by specifying a more precise number of target clusters can reduce spatial heterogeneity, emphasize the relative importance of non-dominant categories, and consequently increase classification accuracy (Li and Yang, 2017). (2) Optimizing data preprocessing methods: outliers can interrupt classification because the unsupervised methods are highly sensitive to anomalies (Raykov et al., 2016; Wang et al., 2019). Therefore, eliminating outliers can further improve the classification validity. In addition, since K-means weights all dimensions equally, minimizing the features' correlation and reducing irrelevant variables are also important means of enhancing the classification effect (Hastie et al., 2009). (3) Improving algorithm performance: a variety of algorithms have been proposed to address the inherent defects of K-means (Ahmed et al., 2020), such as by optimizing the initial clustering center (e.g., K-means), weighting classes (e.g., weighted K-means), and nonspherical clustering assumptions (e.g., DBSCAN, spectral clustering) (Ester et al., 1996; Bach and Jordan, 2003; Kerdprasop et al., 2005; Arthur and Vassilvitskii, 2006). The improved algorithms will address the issues of complex and highly diverse crop classification to some degree (Li et al., 2022; Rivera et al., 2022). (4) Better postprocessing of data: misclassification of field ridges and image speckles is inevitable when mapping crops over large areas. With the progress of computing power, auxiliary data and image processing algorithms can further eliminate these issues (H. Liu et al., 2018; Li and Qu, 2019; Hamano et al., 2023). We are sure that integrating cloud computing platforms with advanced algorithms will provide substantial potential for accurate crop identification, covering larger areas in the future.
The soybean-planting area product for China during 2017–2021 (ChinaSoyArea10m) is available at https://doi.org/10.5281/zenodo.10071427 (Mei et al., 2023). We encourage users to independently verify data products for special study areas before using them.
In this study, the Regional Adaption Spectra-Phenology Integration (RASP) method on a large scale was developed and utilized to generate soybean-planting area maps for major producing regions in China from 2017 to 2021. By utilizing Sentinel-2 images, spectral features and vegetation indices that best distinguish soybeans were extracted and input into an unsupervised classifier in each prefecture. The DTW method was then employed to identify the soybean distribution. RASP does not rely on many ground samples and considers the soybean phenology in various planting areas, suggesting a potential way for long-term crop mapping over larger regions. Verification results demonstrated a high consistency between the mapping results and the census data at the county or prefecture level (all >0.82), with overall accuracies of field samples reaching 77.08 %–86.77 %. These findings confirm the reliability of ChinaSoyArea10m. Our data products fill the gap in regional long-term soybean maps in China and provide important information for sustainable soybean production and management, agricultural system modeling, and optimization.
The supplement related to this article is available online at: https://doi.org/10.5194/essd-16-3213-2024-supplement.
ZZ and FT conceived this study. QM, JH, and JD collected the datasets. QM implemented the research and wrote the original draft of the paper. All the authors discussed the results and revised the manuscript.
The contact author has declared that none of the authors has any competing interests.
Publisher's note: Copernicus Publications remains neutral with regard to jurisdictional claims made in the text, published maps, institutional affiliations, or any other geographical representation in this paper. While Copernicus Publications makes every effort to include appropriate place names, the final responsibility lies with the authors. Regarding the maps used in this paper, please note that Figs. 1, 7, 8, and 10 contain disputed territories.
The authors would like to thank the editors and anonymous reviewers for their valuable comments.
This research has been supported by the National Key Research and Development Program of China (grant no. 2020YFA0608201) and the National Natural Science Foundation of China (grant nos. 42061144003 and 41977405).
This paper was edited by Hao Shi and reviewed by four anonymous referees.
Ahmed, M., Seraj, R., and Islam, S. M. S.: The k-means Algorithm: A Comprehensive Survey and Performance Evaluation, Electronics, 9, 1295, https://doi.org/10.3390/electronics9081295, 2020.
Arthur, D. and Vassilvitskii, S.: k-means++: The advantages of careful seeding, Stanford InfoLab Technical Report, No. 2006-13, Stanford University, http://ilpubs.stanford.edu:8090/778/ (last access: 3 July 2024), 2006.
Bach, F. and Jordan, M.: Learning Spectral Clustering, in: Advances in Neural Information Processing Systems, Proceedings of the 16th International Conference on Neural Information Processing Systems (NIPS 2003), Vancouver, Canada, 9–12 December 2003, MIT Press, https://proceedings.neurips.cc/paper_files/paper/2003/file/d04863f100d59b3eb688a11f95b0ae60-Paper.pdf (last access: 3 July 2024), 2003.
Chabalala, Y., Adam, E., and Ali, K. A.: Machine Learning Classification of Fused Sentinel-1 and Sentinel-2 Image Data towards Mapping Fruit Plantations in Highly Heterogenous Landscapes, Remote Sens., 14, 2621, https://doi.org/10.3390/rs14112621, 2022.
Chen, D., Huang, J., and Jackson, T. J.: Vegetation water content estimation for corn and soybeans using spectral indices derived from MODIS near- and short-wave infrared bands, Remote Sens. Environ., 98, 225–236, https://doi.org/10.1016/j.rse.2005.07.008, 2005.
Chen, H., Li, H., Liu, Z., Zhang, C., Zhang, S., and Atkinson, P. M.: A novel Greenness and Water Content Composite Index (GWCCI) for soybean mapping from single remotely sensed multispectral images, Remote Sens. Environ., 295, 113679, https://doi.org/10.1016/j.rse.2023.113679, 2023.
Cui, K. and Shoemaker, S. P.: A look at food security in China, npj Sci. Food, 2, 4, https://doi.org/10.1038/s41538-018-0012-x, 2018.
Di Tommaso, S., Wang, S., and Lobell, D. B.: Combining GEDI and Sentinel-2 for wall-to-wall mapping of tall and short crops, Environ. Res. Lett., 16, 125002, https://doi.org/10.1088/1748-9326/ac358c, 2021.
Dong, J., Fu, Y., Wang, J., Tian, H., Fu, S., Niu, Z., Han, W., Zheng, Y., Huang, J., and Yuan, W.: Early-season mapping of winter wheat in China based on Landsat and Sentinel images, Earth Syst. Sci. Data, 12, 3081–3095, https://doi.org/10.5194/essd-12-3081-2020, 2020.
Du, J., Han, T., Gai, J., Yong, T., Sun, X., Wang, X., Yang, F., Liu, J., Shu, K., Liu, W., and Yang, W.: Maize-soybean strip intercropping: Achieved a balance between high productivity and sustainability, J. Integr. Agric., 17, 747–754, https://doi.org/10.1016/S2095-3119(17)61789-1, 2018.
Ester, M., Kriegel, H.-P., Sander, J., and Xu, X.: A density-based algorithm for discovering clusters in large spatial databases with noise, KDD, Portland, Oregon, USA, 2–4 August 1996, 226–231, https://cdn.aaai.org/KDD/1996/KDD96-037.pdf (last access: 3 July 2024), 1996.
FAOSTAT: Countries by commodity, https://www.fao.org/faostat/en/#rankings/countries_by_commodity, last access: 10 October 2023.
Fensholt, R. and Sandholt, I.: Derivation of a shortwave infrared water stress index from MODIS near- and shortwave infrared data in a semiarid environment, Remote Sens. Environ., 87, 111–121, https://doi.org/10.1016/j.rse.2003.07.002, 2003.
Gong, L., Tian, B., Li, Y., and Wu, S.: Phenological Changes of Soybean in Response to Climate Conditions in Frigid Region in China over the Past Decades, Int. J. Plant Prod., 15, 363–375, https://doi.org/10.1007/s42106-021-00145-5, 2021.
Graesser, J. and Ramankutty, N.: Detection of cropland field parcels from Landsat imagery, Remote Sens. Environ., 201, 165–180, https://doi.org/10.1016/j.rse.2017.08.027, 2017.
Guan, X., Huang, C., Liu, G., Meng, X., and Liu, Q.: Mapping Rice Cropping Systems in Vietnam Using an NDVI-Based Time-Series Similarity Measurement Based on DTW Distance, Remote Sens., 8, 19, https://doi.org/10.3390/rs8010019, 2016.
Guo, W., Ren, J., Liu, X., Chen, Z., Wu, S., and Pan, H.: Winter wheat mapping with globally optimized threshold under total quantity constraint of statistical data, J. Remote Sens., 22, 1023–1041, https://doi.org/10.11834/jrs.20187468, 2018.
Hamano, M., Shiozawa, S., Yamamoto, S., Suzuki, N., Kitaki, Y., and Watanabe, O.: Development of a method for detecting the planting and ridge areas in paddy fields using AI, GIS, and precise DEM, Precision Agric, 24, 1862–1888, https://doi.org/10.1007/s11119-023-10021-z, 2023.
Han, J., Zhang, Z., Luo, Y., Cao, J., Zhang, L., Zhang, J., and Li, Z.: The RapeseedMap10 database: annual maps of rapeseed at a spatial resolution of 10 m based on multi-source data, Earth Syst. Sci. Data, 13, 2857–2874, https://doi.org/10.5194/essd-13-2857-2021, 2021.
Han, J., Zhang, Z., Luo, Y., Cao, J., Zhang, L., Zhuang, H., Cheng, F., Zhang, J., and Tao, F.: Annual paddy rice planting area and cropping intensity datasets and their dynamics in the Asian monsoon region from 2000 to 2020, Agric. Syst., 200, 103437, https://doi.org/10.1016/j.agsy.2022.103437, 2022.
Hartman, G. L., West, E. D., and Herman, T. K.: Crops that feed the World 2. Soybean – worldwide production, use, and constraints caused by pathogens and pests, Food Secur., 3, 5–17, https://doi.org/10.1007/s12571-010-0108-x, 2011.
Hastie, T., Tibshirani, R., Friedman, J. H., and Friedman, J. H.: The elements of statistical learning: data mining, inference, and prediction, Springer, ISBN 978-1-4899-0519-2, ISBN 978-0-387-21606-5 (eBook), https://doi.org/10.1007/978-0-387-21606-5, 2009.
Housman, I. W., Chastain, R. A., and Finco, M. V.: An Evaluation of Forest Health Insect and Disease Survey Data and Satellite-Based Remote Sensing Forest Change Detection Methods: Case Studies in the United States, Remote Sens., 10, 1184, https://doi.org/10.3390/rs10081184, 2018.
Huang, Y., Qiu, B., Chen, C., Zhu, X., Wu, W., Jiang, F., Lin, D., and Peng, Y.: Automated soybean mapping based on canopy water content and chlorophyll content using Sentinel-2 images, Int. J. Appl. Earth Obs., 109, 102801, https://doi.org/10.1016/j.jag.2022.102801, 2022.
Kerdprasop, K., Kerdprasop, N., and Sattayatham, P.: Weighted K-means for density-biased clustering, in: International conference on data warehousing and knowledge discovery, Copenhagen, Denmark, 22–26 August 2005, 488–497, https://doi.org/10.1007/11546849_48, 2005.
Konduri, V. S., Kumar, J., Hargrove, W. W., Hoffman, F. M., and Ganguly, A. R.: Mapping crops within the growing season across the United States, Remote Sens. Environ., 251, 112048, https://doi.org/10.1016/j.rse.2020.112048, 2020.
Kumari, M., Murthy, C. S., Pandey, V., and Bairagi, G. D.: Soybean Cropland Mapping Using Multi-Temporal Sentinel-1 Data, Int. Arch. Photogramm. Remote Sens. Spatial Inf. Sci., XLII-3/W6, 109–114, https://doi.org/10.5194/isprs-archives-XLII-3-W6-109-2019, 2019.
Kwak, G.-H. and Park, N.-W.: Unsupervised Domain Adaptation with Adversarial Self-Training for Crop Classification Using Remote Sensing Images, Remote Sens., 14, 4639, https://doi.org/10.3390/rs14184639, 2022.
Li, B. and Yang, L.: Clustering accuracy analysis of building area in high spatial resolution remote sensing images based on k-means algorithm, in: 2017 2nd International Conference on Frontiers of Sensors Technologies (ICFST), 2017 2nd International Conference on Frontiers of Sensors Technologies (ICFST), Shenzhen, China, 14–16 April 2017, 174–178, https://doi.org/10.1109/ICFST.2017.8210497, 2017.
Li, H., Song, X.-P., Hansen, M. C., Becker-Reshef, I., Adusei, B., Pickering, J., Wang, L., Wang, L., Lin, Z., Zalles, V., Potapov, P., Stehman, S. V., and Justice, C.: Development of a 10-m resolution maize and soybean map over China: Matching satellite-based crop classification with sample-based area estimation, Remote Sens. Environ., 294, 113623, https://doi.org/10.1016/j.rse.2023.113623, 2023.
Li, L., Friedl, M. A., Xin, Q., Gray, J., Pan, Y., and Frolking, S.: Mapping Crop Cycles in China Using MODIS-EVI Time Series, Remote Sens., 6, 2473–2493, https://doi.org/10.3390/rs6032473, 2014.
Li, T., Johansen, K., and McCabe, M. F.: A machine learning approach for identifying and delineating agricultural fields and their multi-temporal dynamics using three decades of Landsat data, ISPRS J. Photogramm. Remote Sens., 186, 83–101, https://doi.org/10.1016/j.isprsjprs.2022.02.002, 2022.
Li, Y. and Qu, H.: LSD and Skeleton Extraction Combined with Farmland Ridge Detection, in: Advances in Intelligent, Interactive Systems and Applications, Cham, 446–453, https://doi.org/10.1007/978-3-030-02804-6_59, 2019.
Liu, H., Zhang, J., Pan, Y., Shuai, G., Zhu, X., and Zhu, S.: An Efficient Approach Based on UAV Orthographic Imagery to Map Paddy With Support of Field-Level Canopy Height From Point Cloud Data, IEEE J. Sel. Top. Appl. Earth Obs. Remote Sens., 11, 2034–2046, https://doi.org/10.1109/JSTARS.2018.2829218, 2018.
Liu, J., Wang, L., Yang, F., Yao, B., and Yang, L.: Recognition ability of red edge and short wave infrared spectrum on maize and soybean, Chinese Agricultural Science Bulletin, 34, 120–129, 2018 (in Chinese).
Liu, L., Xiao, X., Qin, Y., Wang, J., Xu, X., Hu, Y., and Qiao, Z.: Mapping cropping intensity in China using time series Landsat and Sentinel-2 images and Google Earth Engine, Remote Sens. Environ., 239, 111624, https://doi.org/10.1016/j.rse.2019.111624, 2020.
Liu, M. and Fan, Q.: Study on the Current Situation and Problems of Soybean Consumption, Production and Import in China, Grain Science And Technology And Economy, 46, 28–35, https://doi.org/10.16465/j.gste.cn431252ts.20210606, 2021 (in Chinese).
Liu, Z., Ying, H., Chen, M., Bai, J., Xue, Y., Yin, Y., Batchelor, W. D., Yang, Y., Bai, Z., Du, M., Guo, Y., Zhang, Q., Cui, Z., Zhang, F., and Dou, Z.: Optimization of China's maize and soy production can ensure feed sufficiency at lower nitrogen and carbon footprints, Nat. Food, 2, 426–433, https://doi.org/10.1038/s43016-021-00300-1, 2021.
Lowder, S. K., Skoet, J., and Raney, T.: The Number, Size, and Distribution of Farms, Smallholder Farms, and Family Farms Worldwide, World Dev., 87, 16–29, https://doi.org/10.1016/j.worlddev.2015.10.041, 2016.
Luo, C., Liu, H., Lu, L., Liu, Z., Kong, F., and Zhang, X.: Monthly composites from Sentinel-1 and Sentinel-2 images for regional major crop mapping with Google Earth Engine, J. Integr. Agr., 20, 1944–1957, https://doi.org/10.1016/S2095-3119(20)63329-9, 2021.
Luo, Y., Zhang, Z., Li, Z., Chen, Y., Zhang, L., Cao, J., and Tao, F.: Identifying the spatiotemporal changes of annual harvesting areas for three staple crops in China by integrating multi-data sources, Environ. Res. Lett., 15, 074003, https://doi.org/10.1088/1748-9326/ab80f0, 2020.
Luo, Y., Zhang, Z., Zhang, L., Han, J., Cao, J., and Zhang, J.: Developing High-Resolution Crop Maps for Major Crops in the European Union Based on Transductive Transfer Learning and Limited Ground Data, Remote Sens., 14, 1809, https://doi.org/10.3390/rs14081809, 2022.
Ma, Z., Liu, Z., Zhao, Y., Zhang, L., Liu, D., Ren, T., Zhang, X., and Li, S.: An Unsupervised Crop Classification Method Based on Principal Components Isometric Binning, ISPRS Int. J. Geo-Inf., 9, 648, https://doi.org/10.3390/ijgi9110648, 2020.
Marshall, M., Belgiu, M., Boschetti, M., Pepe, M., Stein, A., and Nelson, A.: Field-level crop yield estimation with PRISMA and Sentinel-2, ISPRS J. Photogramm. Remote Sens., 187, 191–210, https://doi.org/10.1016/j.isprsjprs.2022.03.008, 2022.
Mei, Q., Zhang, Z., Han, J., Song, J., Dong, J., Wu, H., Xu, J., and Tao, F.: ChinaSoyArea10m: a dataset of soybean planting areas with a spatial resolution of 10 m across China from 2017 to 2021 (V1), Zenodo [data set], https://doi.org/10.5281/zenodo.10071427, 2023.
National Bureau of Statistics of China: National Data, https://data.stats.gov.cn/english/, last access: 6 July 2024.
Olsen, J. L., Stisen, S., Proud, S. R., and Fensholt, R.: Evaluating EO-based canopy water stress from seasonally detrended NDVI and SIWSI with modeled evapotranspiration in the Senegal River Basin, Remote Sens. Environ., 159, 57–69, https://doi.org/10.1016/j.rse.2014.11.029, 2015.
Oreopoulos, L., Wilson, M. J., and Várnai, T.: Implementation on Landsat Data of a Simple Cloud-Mask Algorithm Developed for MODIS Land Bands, IEEE Geosci. Remote. Sens. Lett., 8, 597–601, https://doi.org/10.1109/LGRS.2010.2095409, 2011.
Pan, B. and Yuan, W.: Dataset of 10-meter resolution planting distribution of double-season rice in China from 2016 to 2020, National Ecosystem Research Network Data Center [data set], https://doi.org/10.12199/nesdc.ecodb.rs.2022.012, 2022 (in Chinese).
Pan, B., Zheng, Y., Shen, R., Ye, T., Zhao, W., Dong, J., Ma, H., and Yuan, W.: High Resolution Distribution Dataset of Double-Season Paddy Rice in China, Remote Sens., 13, 4609, https://doi.org/10.3390/rs13224609, 2021.
Potapov, P., Turubanova, S., Hansen, M. C., Tyukavina, A., Zalles, V., Khan, A., Song, X.-P., Pickens, A., Shen, Q., and Cortez, J.: Global maps of cropland extent and change show accelerated cropland expansion in the twenty-first century, Nat. Food, 3, 19–28, https://doi.org/10.1038/s43016-021-00429-z, 2022.
Raykov, Y. P., Boukouvalas, A., Baig, F., and Little, M. A.: What to Do When K-Means Clustering Fails: A Simple yet Principled Alternative Algorithm, PLOS ONE, 11, e0162259, https://doi.org/10.1371/journal.pone.0162259, 2016.
Rivera, A. J., Pérez-Godoy, M. D., Elizondo, D., Deka, L., and del Jesus, M. J.: Analysis of clustering methods for crop type mapping using satellite imagery, Neurocomputing, 492, 91–106, https://doi.org/10.1016/j.neucom.2022.04.002, 2022.
Shangguan, Y., Li, X., Lin, Y., Deng, J., and Yu, L.: Mapping spatial-temporal nationwide soybean planting area in Argentina using Google Earth Engine, Int. J. Remote Sens., 43, 1724–1748, https://doi.org/10.1080/01431161.2022.2049913, 2022.
Shen, R., Dong, J., Yuan, W., Han, W., Ye, T., and Zhao, W.: A 30 m Resolution Distribution Map of Maize for China Based on Landsat and Sentinel Images, J. Remote Sens., 2022, 2022/9846712, https://doi.org/10.34133/2022/9846712, 2022.
Shen, R., Pan, B., Peng, Q., Dong, J., Chen, X., Zhang, X., Ye, T., Huang, J., and Yuan, W.: High-resolution distribution maps of single-season rice in China from 2017 to 2022, Earth Syst. Sci. Data, 15, 3203–3222, https://doi.org/10.5194/essd-15-3203-2023, 2023a.
Shen, R., Pan, B., Peng, Q.,Dong, J., Chen, X., Zhang X., Ye, T., Huang, J., and Yuan, W.: High-resolution distribution maps of single-season rice in China from 2017 to 2022, Science Data Bank [data set], https://doi.org/10.57760/sciencedb.06963, 2023b.
Sobejano-Paz, V., Mikkelsen, T. N., Baum, A., Mo, X., Liu, S., Köppl, C. J., Johnson, M. S., Gulyas, L., and García, M.: Hyperspectral and Thermal Sensing of Stomatal Conductance, Transpiration, and Photosynthesis for Soybean and Maize under Drought, Remote Sens., 12, 3182, https://doi.org/10.3390/rs12193182, 2020.
Song, X.-P., Potapov, P. V., Krylov, A., King, L., Di Bella, C. M., Hudson, A., Khan, A., Adusei, B., Stehman, S. V., and Hansen, M. C.: National-scale soybean mapping and area estimation in the United States using medium resolution satellite imagery and field survey, Remote Sens. Environ., 190, 383–395, https://doi.org/10.1016/j.rse.2017.01.008, 2017.
Tan, P.-N., Steinbach, M., and Kumar, V.: Introduction to data mining, Pearson Education India, ISBN 978-93-325-8605-5, 2016.
Wang, S., Azzari, G., and Lobell, D. B.: Crop type mapping without field-level labels: Random forest transfer and unsupervised clustering techniques, Remote Sens. Environ., 222, 303–317, https://doi.org/10.1016/j.rse.2018.12.026, 2019.
Wang, S., Di Tommaso, S., Deines, J. M., and Lobell, D. B.: Mapping twenty years of corn and soybean across the US Midwest using the Landsat archive, Sci. Data, 7, 307, https://doi.org/10.1038/s41597-020-00646-4, 2020.
Wang, Y. and Gai, J.: Study on the ecological regions of soybean in China II – Ecological environment and representative varieties, Chinese Journal of Applied Ecology, 71–75, 2002 (in Chinese).
Wang, Y., Feng, L., Sun, W., Zhang, Z., Zhang, H., Yang, G., and Meng, X.: Exploring the potential of multi-source unsupervised domain adaptation in crop mapping using Sentinel-2 images, Gisci. Remote Sens., 59, 2247–2265, https://doi.org/10.1080/15481603.2022.2156123, 2022.
Wang, Y., Ling, X., Ma, C., Liu, C., Zhang, W., Huang, J., Peng, S., and Deng, N.: Can China get out of soy dilemma? A yield gap analysis of soybean in China, Agron. Sustain. Dev., 43, 47, https://doi.org/10.1007/s13593-023-00897-6, 2023.
Xiong, J., Thenkabail, P. S., Gumma, M. K., Teluguntla, P., Poehnelt, J., Congalton, R. G., Yadav, K., and Thau, D.: Automated cropland mapping of continental Africa using Google Earth Engine cloud computing, ISPRS J. Photogramm. Remote Sens., 126, 225–244, https://doi.org/10.1016/j.isprsjprs.2017.01.019, 2017.
Yang, F., Huang, S., Gao, R., Liu, W., Yong, T., Wang, X., Wu, X., and Yang, W.: Growth of soybean seedlings in relay strip intercropping systems in relation to light quantity and red:far-red ratio, Field Crops Res., 155, 245–253, https://doi.org/10.1016/j.fcr.2013.08.011, 2014.
You, N. and Dong, J.: Examining earliest identifiable timing of crops using all available Sentinel imagery and Google Earth Engine, ISPRS J. Photogramm. Remote Sens., 161, 109–123, https://doi.org/10.1016/j.isprsjprs.2020.01.001, 2020.
You, N., Dong, J., Huang, J., Du, G., Zhang, G., He, Y., Yang, T., Di, Y., and Xiao, X.: The 10-m crop type maps in Northeast China during 2017–2019, Sci. Data, 8, 41, https://doi.org/10.1038/s41597-021-00827-9, 2021.
You, N., Dong, J., Li, J., Huang, J., and Jin, Z.: Rapid early-season maize mapping without crop labels, Remote Sens. Environ., 290, 113496, https://doi.org/10.1016/j.rse.2023.113496, 2023.
Zhang, C., Dong, J., and Ge, Q.: Quantifying the accuracies of six 30 m cropland datasets over China: A comparison and evaluation analysis, Comput. Electron. Agr., 197, 106946, https://doi.org/10.1016/j.compag.2022.106946, 2022.
Zhang, G., Xiao, X., Biradar, C. M., Dong, J., Qin, Y., Menarguez, M. A., Zhou, Y., Zhang, Y., Jin, C., Wang, J., Doughty, R. B., Ding, M., and Moore, B.: Spatiotemporal patterns of paddy rice croplands in China and India from 2000 to 2015, Sci. Total Environ., 579, 82–92, https://doi.org/10.1016/j.scitotenv.2016.10.223, 2017.
Zhong, L., Hu, L., Yu, L., Gong, P., and Biging, G. S.: Automated mapping of soybean and corn using phenology, ISPRS J. Photogramm. Remote Sens., 119, 151–164, https://doi.org/10.1016/j.isprsjprs.2016.05.014, 2016.
Zhou, W., Wei, H., Chen, Y., Zhang, X., Hu, J., Cai, Z., Yang, J., Hu, Q., Xiong, H., Yin, G., and Xu, B.: Monitoring intra-annual and interannual variability in spatial distribution of plastic-mulched citrus in cloudy and rainy areas using multisource remote sensing data, Eur. J. Agron., 151, 126981, https://doi.org/10.1016/j.eja.2023.126981, 2023.