the Creative Commons Attribution 4.0 License.
the Creative Commons Attribution 4.0 License.
 | 20 Jun 2024
Map of forest tree species for Poland based on Sentinel-2 data
Ewa Grabska-Szwagrzyk
Dirk Tiede
Martin Sudmanns
Jacek Kozak
Accurate information on forest tree species composition is vital for various scientific applications, as well as for forest inventory and management purposes. Country-wide, detailed species maps are a valuable resource for environmental management, conservation, research, and planning. Here, we performed the classification of 16 dominant tree species and genera in Poland using time series of Sentinel-2 imagery. To generate comprehensive spectral–temporal information, we created Sentinel-2 seasonal aggregations known as spectral–temporal metrics (STMs) within the Google Earth Engine (GEE). STMs were computed for short periods of 15–30 d during spring, summer, and autumn, covering multi-annual observations from 2018 to 2021. The Polish Forest Data Bank served as reference data, and, to obtain robust samples with pure stands only, the data were validated through automated and visual inspection based on very-high-resolution orthoimagery, resulting in 4500 polygons serving as training and test data. The forest mask was derived from available land cover datasets in GEE, namely the ESA WorldCover and Dynamic World dataset. Additionally, we incorporated various topographic and climatic variables from GEE to enhance classification accuracy. The random forest algorithm was employed for the classification process, and an area-adjusted accuracy assessment was conducted through cross-validation and test datasets. The results demonstrate that the country-wide forest stand species mapping achieved an accuracy exceeding 80 %; however, this varies greatly depending on species, region, and observation frequency. We provide freely accessible resources, including the forest tree species map and training and test data: https://doi.org/10.5281/zenodo.10180469 (Grabska-Szwagrzyk, 2023a).
- Article
(8979 KB) - Full-text XML
- BibTeX
- EndNote


Information on forest tree species composition is essential for many scientific applications, as well as for forest inventory and management purposes, such as estimating timber volume, modelling biodiversity, conservation, monitoring disturbances, or carbon and biomass estimation (Hanewinkel et al., 2013; Loiselle et al., 2003; Gillis et al., 2005; Boisvenue and White, 2019). In recent times, the use of remote sensing data has greatly improved forest monitoring and management. One such powerful source of data is the Sentinel-2 mission, which offers high-resolution and frequent data for mapping tree species. While Sentinel-2 data have been increasingly employed for mapping species composition, most studies focus on smaller regional scales (Immitzer et al., 2016; Puletti et al., 2018; Karasiak et al., 2017; Persson et al., 2018; Grabska et al., 2019; Immitzer et al., 2019; Hościło and Lewandowska, 2019; Bolyn et al., 2018; Grabska et al., 2020; Lechner et al., 2022; Shirazinejad et al., 2022; Axelsson et al., 2021; Wessel et al., 2018; Melnyk et al., 2023) or classify broad forest classes and/or species groups over larger regions (Waser et al., 2021; Breidenbach et al., 2021; Schindler et al., 2021; Rüetschi et al., 2021). For larger areas, distinguishing tree species has been performed with the use of Landsat (Turlej et al., 2022; Bonannella et al., 2022). Furthermore, continent-scale studies have utilized high-resolution hyperspectral and field data to develop models for tree species classification, evaluating both general and site-specific models (Marconi et al., 2022). At the national scale, Sentinel-2 time series were successfully used to map seven dominant tree species in Germany (Welle et al., 2022) and to map larch plantations in Wales (Punalekar et al., 2021). In studying the tree species composition of larger regions, additional environmental variables – for instance, topographic predictors – have been found to improve classification accuracy (Waser et al., 2021; Grabska et al., 2020; Ye et al., 2021). Other auxiliary variables include climatic variables (Hermosilla et al., 2022), soils (Hemmerling et al., 2021), phenological metrics (Kollert et al., 2021; Hermosilla et al., 2022), spectral indices (Schindler et al., 2021; Ye et al., 2021; Hemmerling et al., 2021; Praticò et al., 2021), and textural metrics (Ye et al., 2021; Hemmerling et al., 2021).
Still, the accurate mapping of forest tree species with remote sensing data remains a challenge (Fassnacht et al., 2024). In particular, studying species composition in large areas presents significant problems, such as generating good-quality predictors from satellite imagery (Grabska et al., 2020). The frequent cloud cover or topographic effects in mountainous regions may limit the number of cloud-free observations or disturb the surface reflectance values (Schindler et al., 2021). Additionally, larger areas exhibit greater environmental variability, including variations in topography, climate, and phenology, which can significantly impact species classification accuracy. The optimal image acquisition dates which are crucial in improved species recognition (Grabska et al., 2019; Immitzer et al., 2019) may substantially differ between regions. Another challenge in large-scale classification is the limited availability of reference data, especially for less common species (Zeug et al., 2019), leading to poorer performance for underrepresented species (Hemmerling et al., 2021; Marconi et al., 2022; Ahlswede et al., 2023). Finally, species classification for large regions requires handling high-volume spatial datasets, which may be difficult to process using locally installed, monolithic software. Google Earth Engine (GEE), the freely accessible (for research purposes) cloud-based platform, enables parallel processing of large spatial datasets (Tamiminia et al., 2020; Gorelick et al., 2017). GEE provides access to entire, pre-processed Sentinel-2 collections and other environmental datasets, as well as tools for processing and classification (Tamiminia et al., 2020). Previous studies have demonstrated the potential and versatility of GEE in forest classification, emphasizing its role in addressing the challenges encountered in large-scale mapping (Forstmaier et al., 2020; Chen et al., 2017; Praticò et al., 2021). Different approaches have been used to produce seamless and cloud-free satellite composites for mapping tree species composition, with multiple studies emphasizing the importance of a multi-temporal approach for accurate tree species classification (Immitzer et al., 2019; Grabska et al., 2019; Hościło and Lewandowska, 2019; Persson et al., 2018; Kollert et al., 2021). However, there are variations in optimal timing for different seasons, and applying a single seamless image composition at a country-wide scale is not feasible. Thus, researchers often employ temporal aggregations such as spectral–temporal metrics (STMs) calculated for a season, year, or multi-annual periods.
Here, we present a classification of 16 forest tree species and genera for the entire area of Poland. Given the availability of several years of Sentinel-2 imagery, we propose, based on our previous findings (Grabska et al., 2020, 2019), a novel approach that utilizes short-period (15–30 d) seasonal STMs using mean values derived from multiple years. This strategy aims to focus on critical periods characterized by dynamic phenological changes while avoiding gaps in imagery that are commonly encountered when using single-year data. We used GEE for pre-processing and classification of the Sentinel-2 time series, along with additional environmental variables.
2.1 Study area
Poland's forests cover an area exceeding 9×10⁶ ha – 9.265×10⁶ ha according to the Central Statistical Office (31 December 2021) or 9.464×10⁶ ha according to the standard adopted for international assessments, taking into account land related to forest management (Zajączkowski et al., 2022). This accounts for approximately 30 % of the country's total land area (Fig. 1). In terms of ownership, public forests hold the majority share at 80.7 % (with 76.9 % of forests being managed by the State Forests, 2 % belonging to National Parks, and 1.8 % being constituted by commune properties and others), followed by private forests at around 19.3 %. The dominant species is the Scots pine (Pinus sylvestris), covering 58.5 % of the forested area across all ownership types according to the National Forest Inventory (NFI) reports (Biuro Urządzania Lasu i Geodezji Leśnej, 2022). The second most prevalent genus is Quercus, primarily Robur and Pedunculate species, accounting for 8.0 %. Birch (Betula pendula) represents 6.8 %, and alder species (Alnus spp.) represent 5.7 % of tree species. In the mountainous regions in southern Poland, Norway spruce (Picea abies), silver fir (Abies alba), and common beech (Fagus sylvatica) are the most common species, covering 5.3 %, 3.3 %, and 6.2 %, respectively. It is worth noting that European larch (Larix decidua) shares are usually not reported separately but in combination with pine species. Still, larch is also among the prevalent species in Poland – based on data from the Polish Forest Data Bank (FDB), the share of larch in Poland's State Forests land property is approximately 2 %.
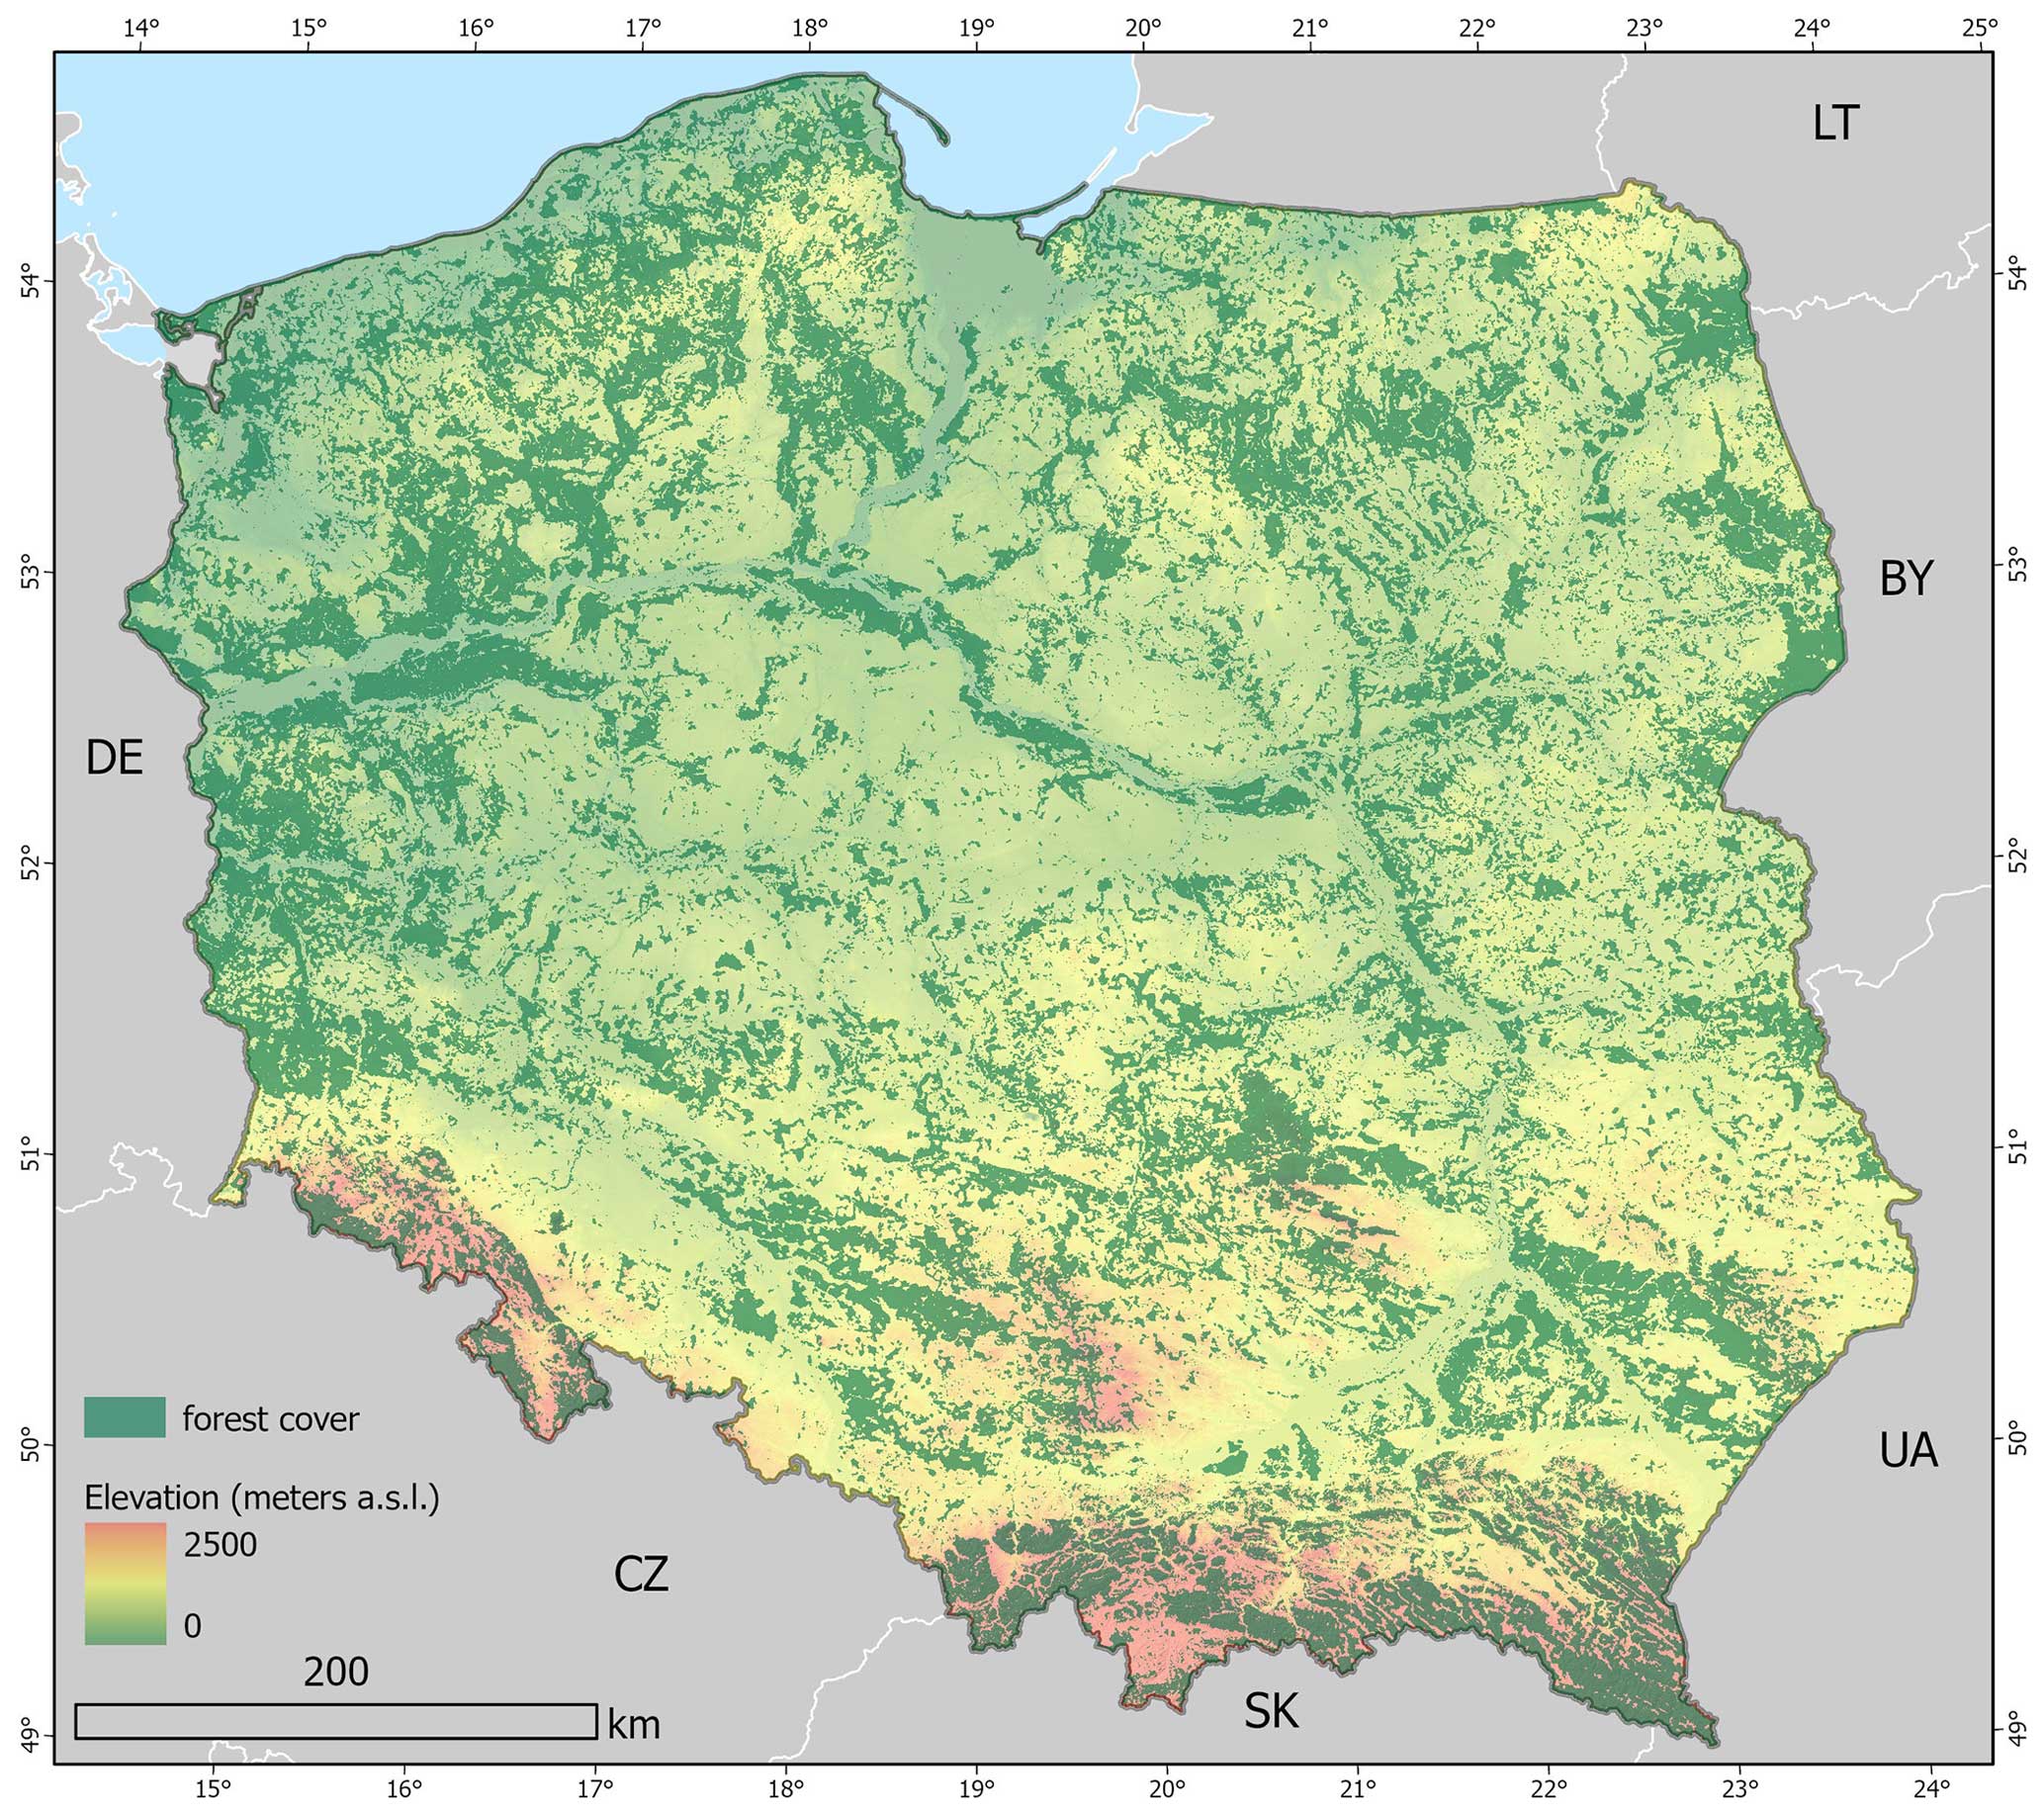
Figure 1Forest cover in Poland elevation from EU-DEM; forest mask derived in this study.
2.2 Workflow
We developed an approach to classify 16 tree species in Poland using Sentinel-2 time series within the GEE platform. The Polish FDB was used as reference data for training, validation, and test samples. We created four seasonal STMs (means) from multi-annual observations (2018–2021), performed pre-processing in GEE, and clipped them to the forest mask derived from existing land cover datasets. Classification involved the random forest (RF) classifier with a 10-fold cross-validation technique, and accuracy metrics were computed using test samples. To handle class imbalances, we implemented two strategies: proportional and disproportional allocation. Additionally, we compared the accuracy between areas influenced by overlapping and non-overlapping Sentinel-2 orbits.
2.3 Reference data processing
The reference data were gathered from the publicly accessible FDB, in which forest management units (forest stands) are represented by polygons. Each polygon contains information on the species share, expressed by values ranging from 1 to 10, with 10 indicating homogenous coverage by a particular species. Nonetheless, the precise spatial distribution of these species within the polygons remains uncertain. In addition, the FDB does not cover private forests.
Table 1Classes and species classified in our study with the number of reference polygons and pixels.
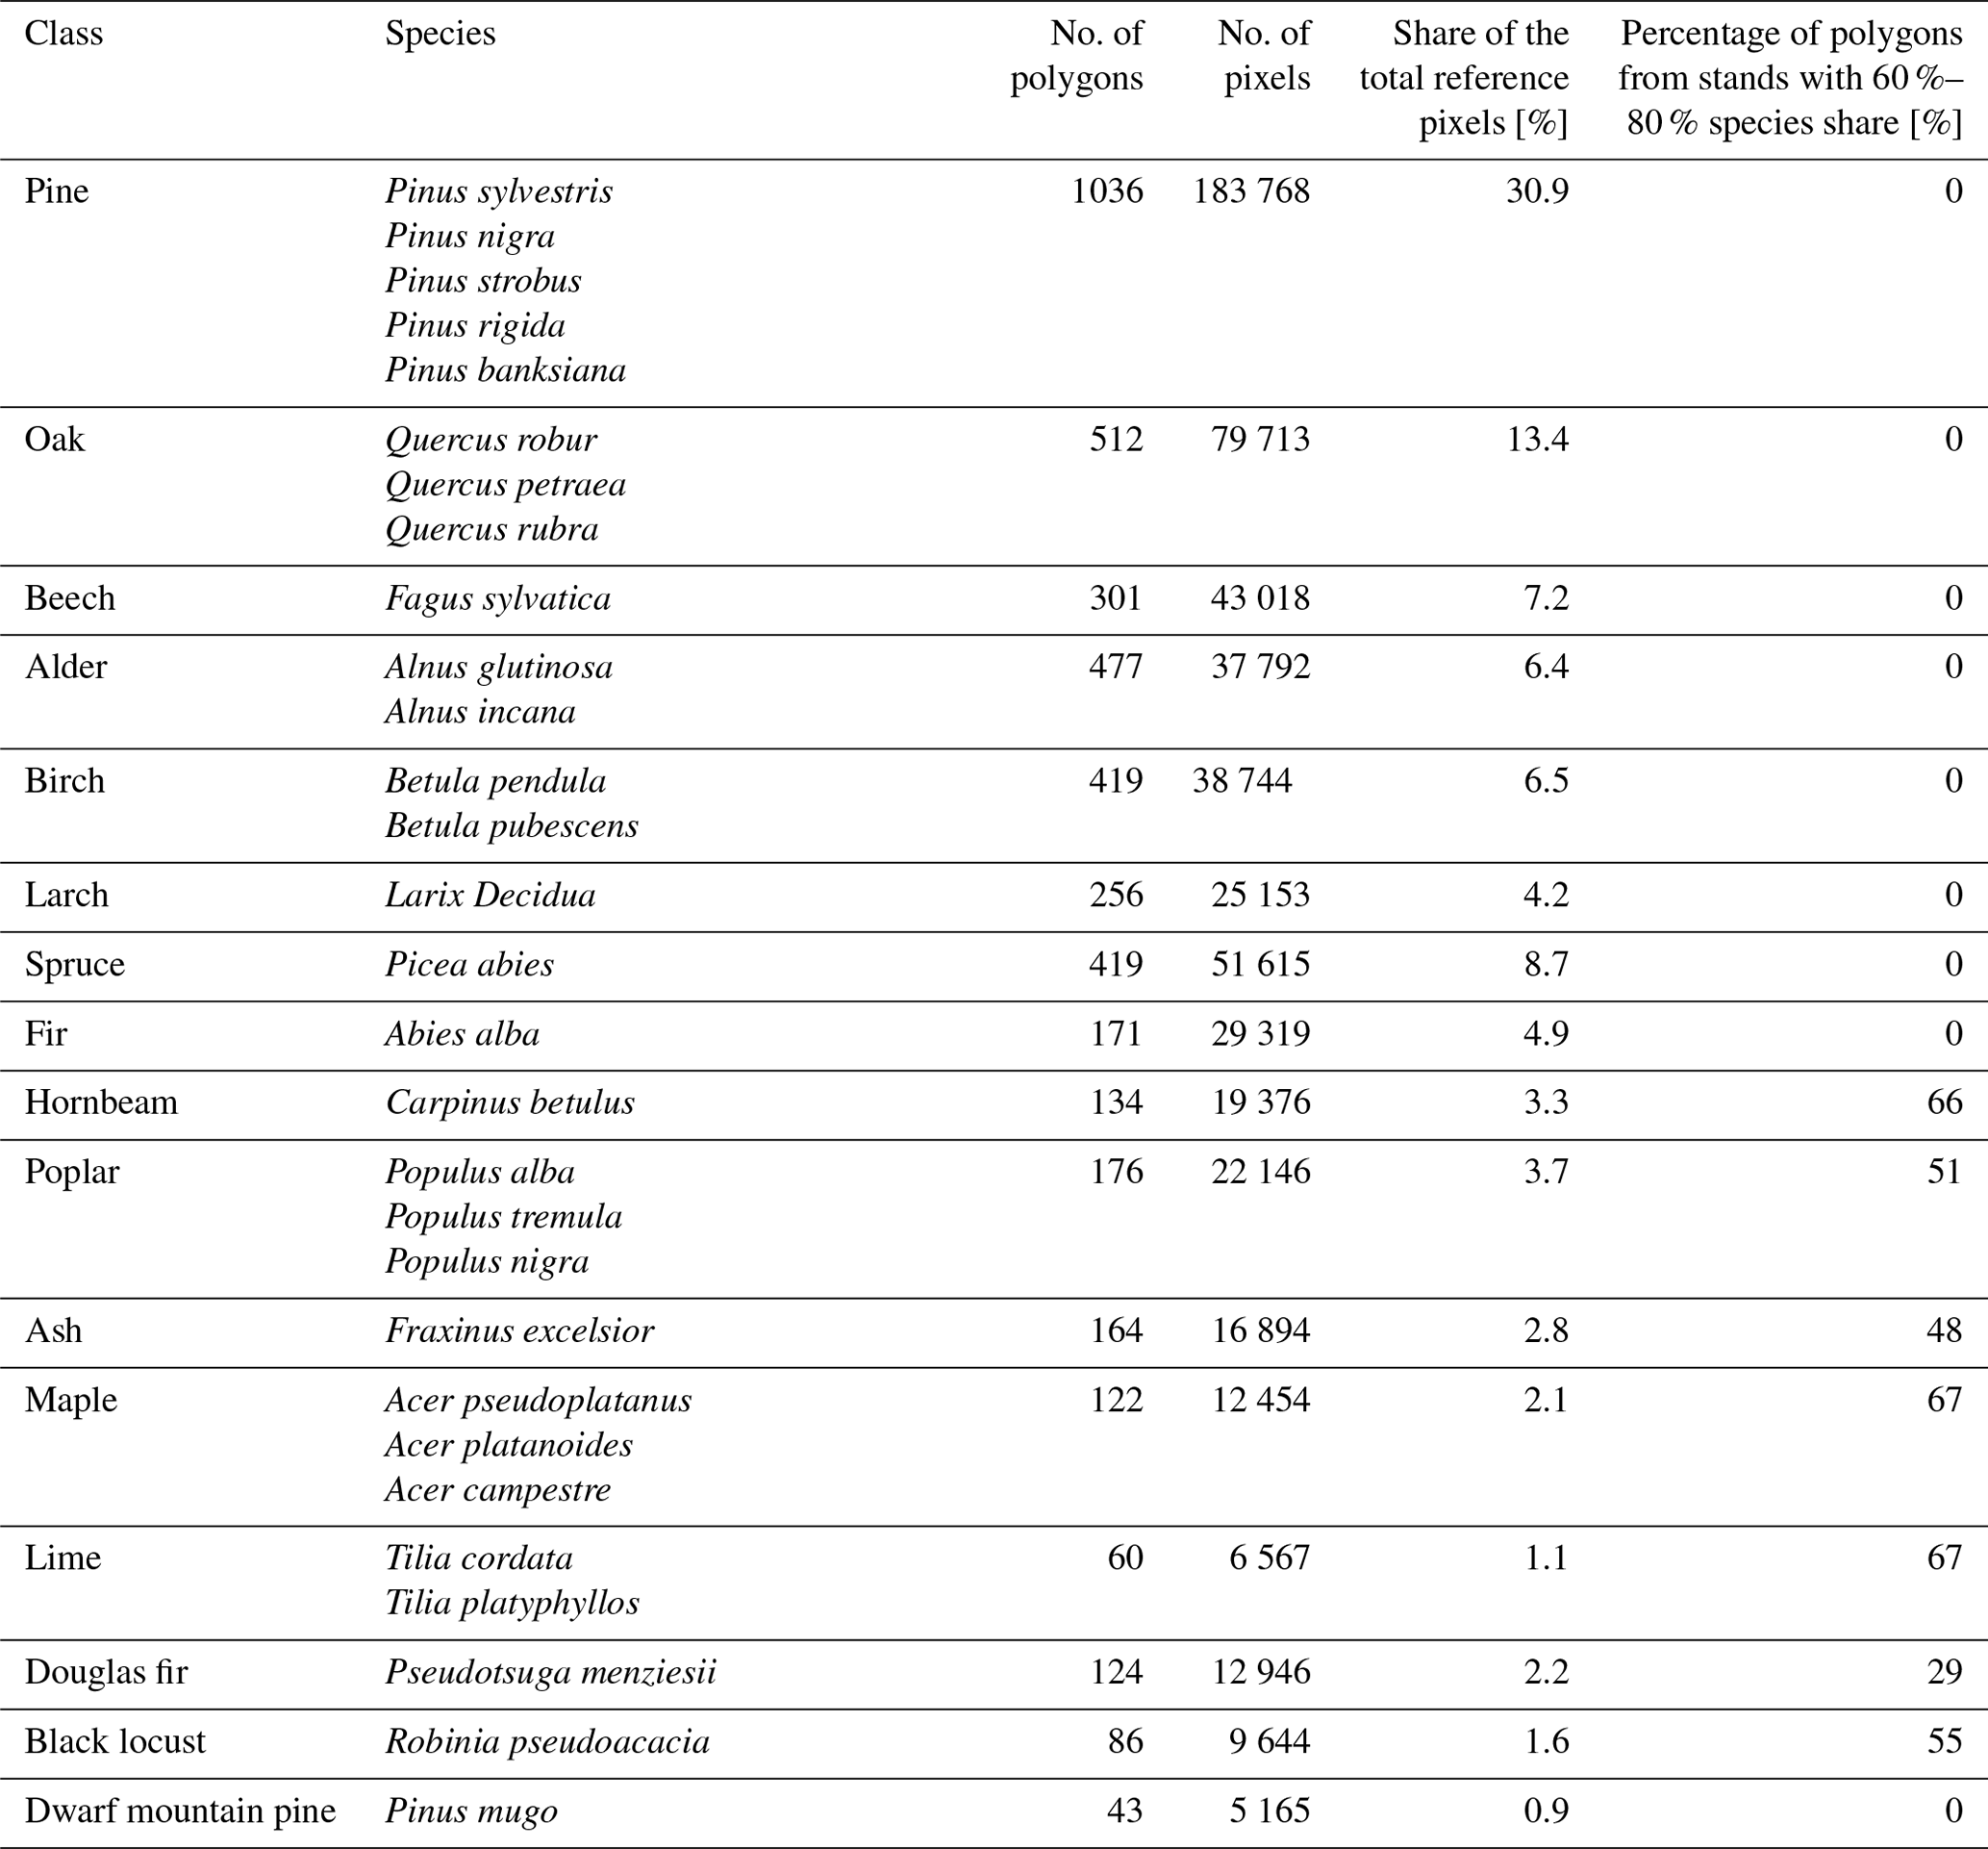
From the FDB, polygons representing pure stands with a single-species dominance of 90 % or more and with trees older than 10 years were selected. However, due to frequency of some species in Polish forests, we used other thresholds and additional conditions. Given the large number of reference stands of Scots pine, we randomly chose 10 % of pure stands with 100 % share of this species; however, other pine species uncommon in Poland underwent the same processing procedures as other examined species. On the other hand, due to an insufficient number of reference samples for less common species such as poplar (Populus spp.), black locust (Robinia pseudoacacia), hornbeam (Carpinus betulus), ash (Fraxinus excelsior), maple (Acer spp.), lime (Tilia sp.), and Douglas fir (Pseudotsuga menziesii), additional FDB stands with a 60 %–80 % share of these species were included. The next step involved precise adjustments of reference samples to the actual forest mask derived from two available land cover datasets in GEE; i.e. any samples or their parts falling outside of forest mask were removed. Specifically, we utilized the ESA WorldCover 2021 product (ESA/WorldCover/v200; (Zanaga et al., 2022) selecting only value 10 (i.e. tree cover), and the Dynamic World dataset (GOOGLE/DYNAMICWORLD/V1, (Brown et al., 2022), calculated from summer 2021 imagery and aggregated to the mean, with a tree probability threshold set at 0.6. Both datasets were employed, and, based on our tests, the ESA WorldCover product tends to overestimate forests in certain areas, while the Dynamic World dataset, generated dynamically from available Sentinel-2 observations, may be prone to errors due to frequent cloud cover. In the next step, image segmentation on the Sentinel-2 STM was performed (harmonized level-2A data; COPERNICUS/S2_SR_HARMONIZED) utilizing mean values from summer 2021. This segmentation process was carried out using a simple non-iterative clustering (SNIC; (Achanta and Süsstrunk, 2017)) algorithm in GEE, limited to the previously selected FDB stands within the forest mask area, with the aim of delineating spectrally homogeneous patches. Segments obtained in this step were intersected with the FDB stands, and for further processing, only segments larger than 0.5 ha that encompassed more than 60 % of the stands were selected. Subsequently, the resulting segments were visually checked using very-high-resolution orthoimagery.
Finally, 4500 polygons were obtained, representing 16 species and genera (Table 1). They were divided into training (2999 – corresponding to approx. 400 000 training pixels) and test polygons (1501). The training data were further divided into training (90 %) and validation (10 %), and 10-fold cross-validation was employed to calibrate the model. The examples of reference samples for each examined class are illustrated in Fig. 2.
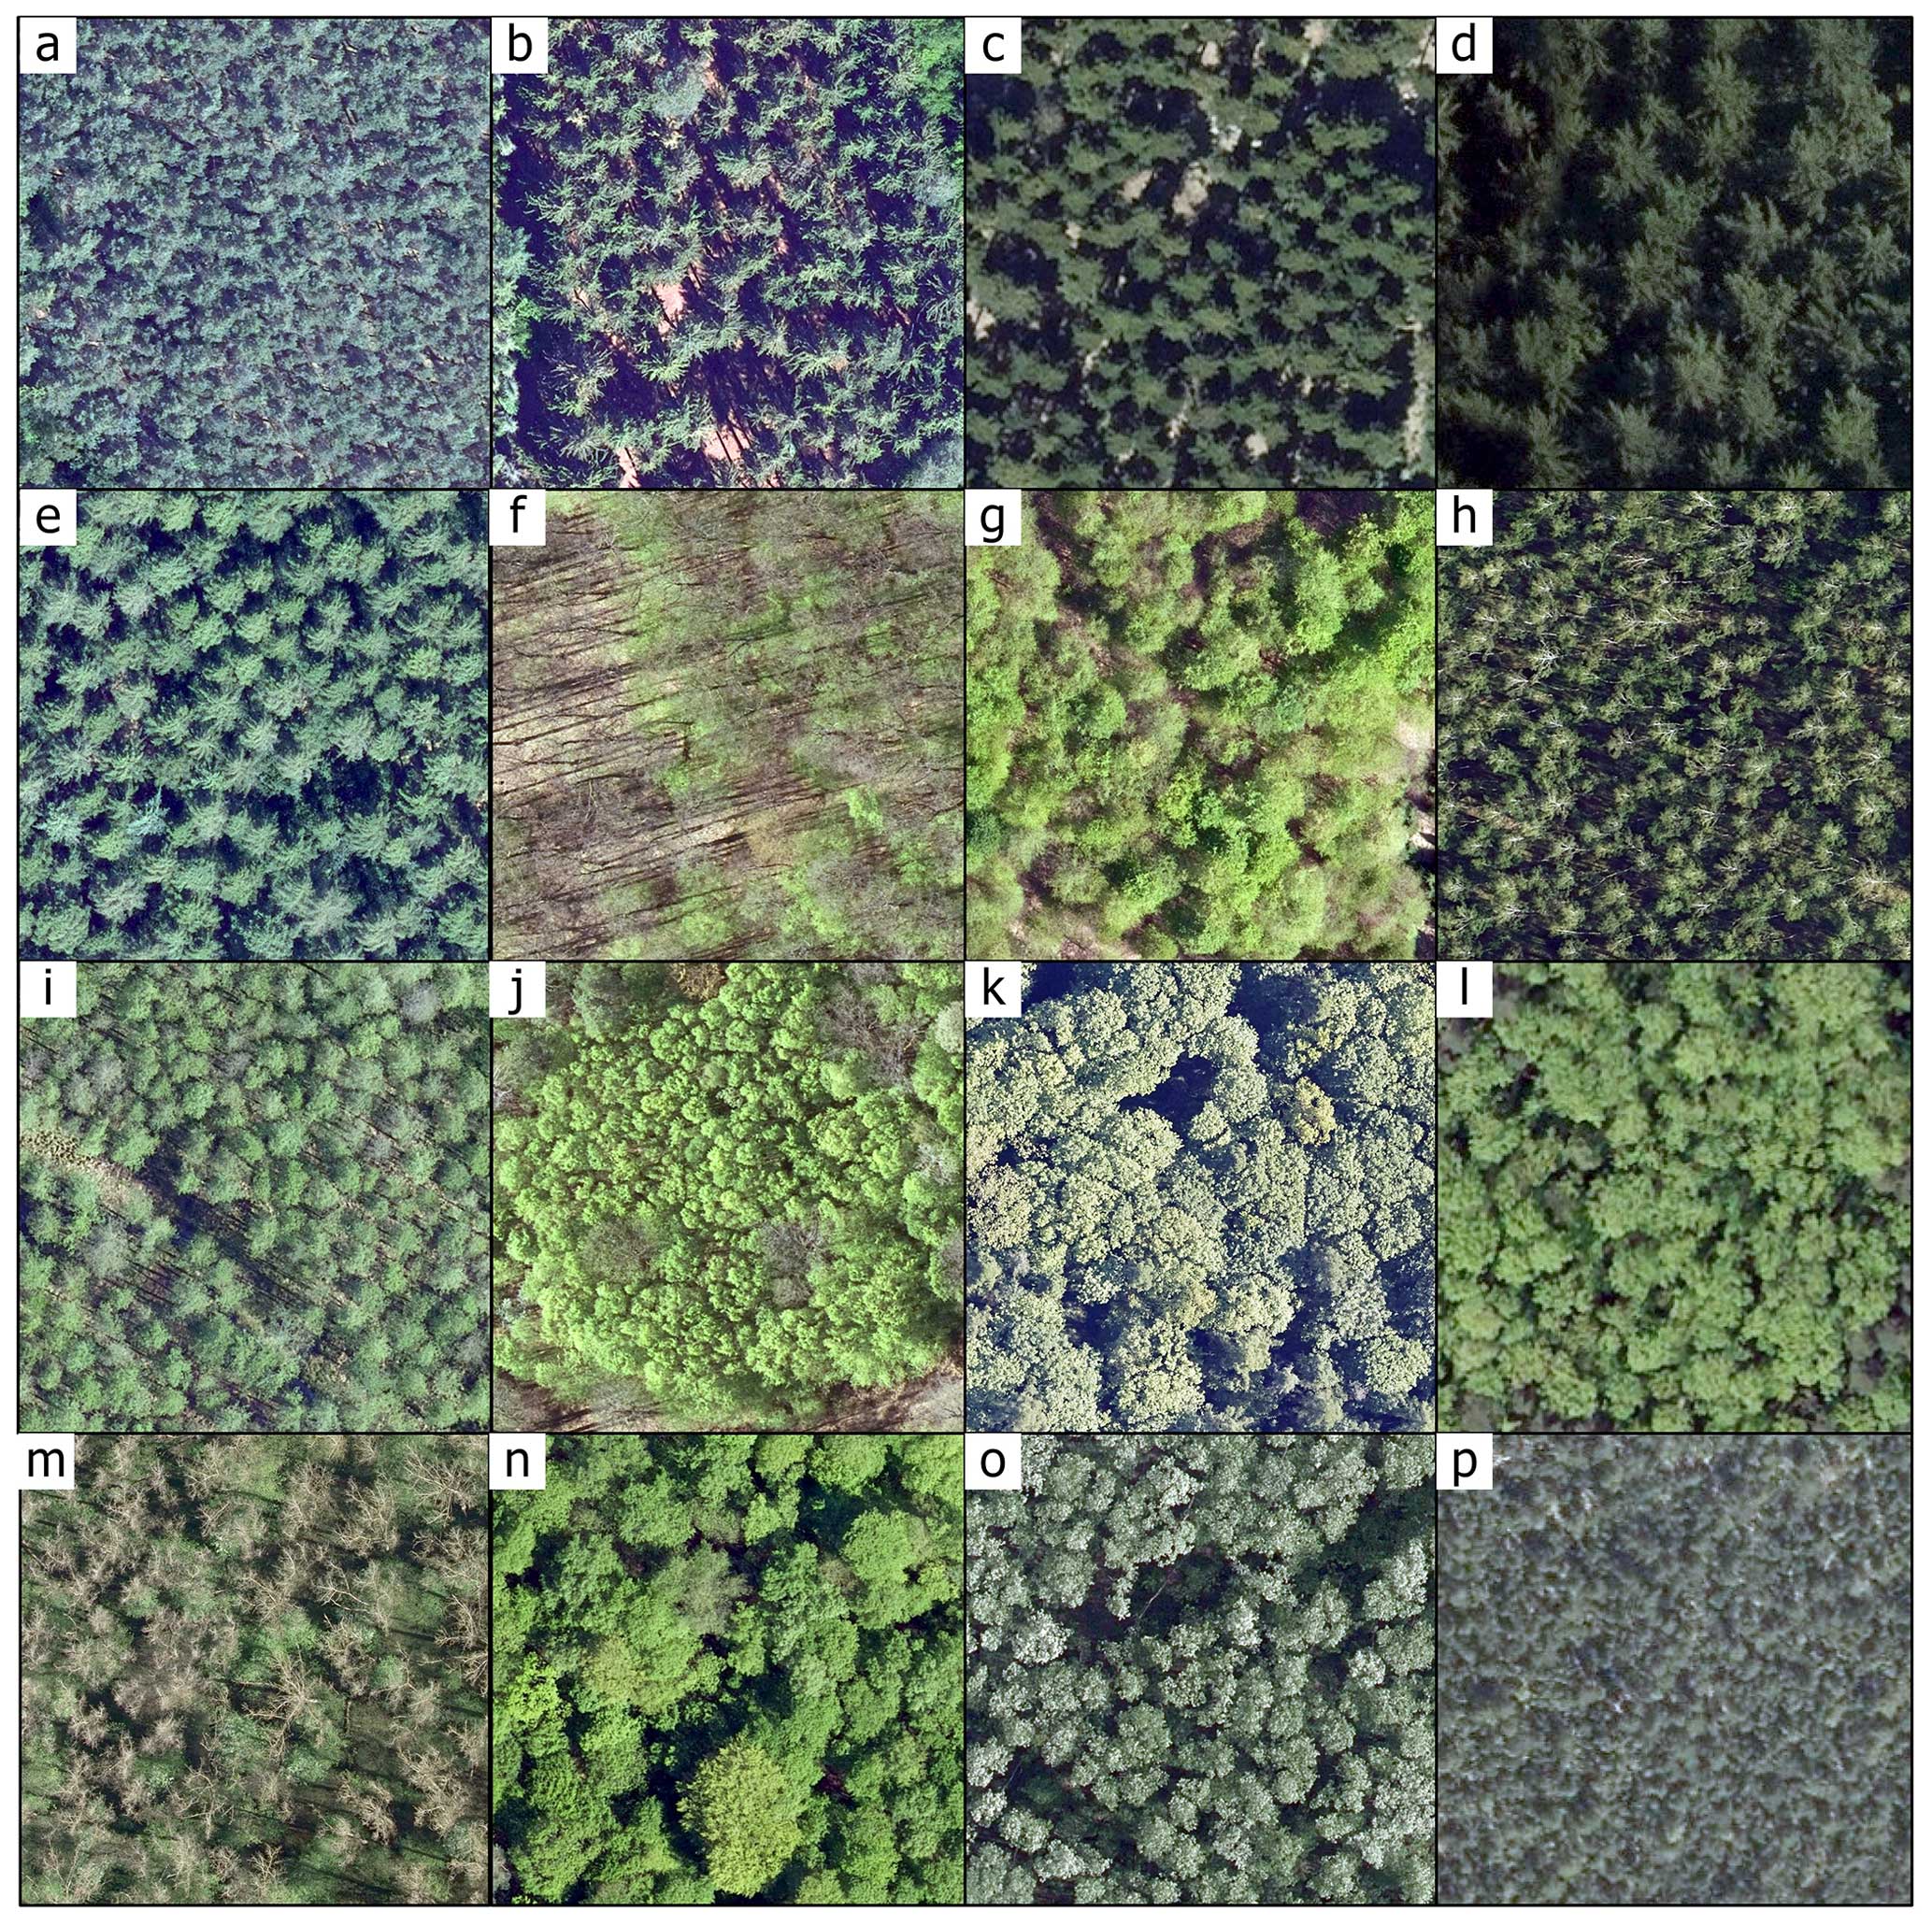
Figure 2Examples of reference samples for each analysed tree species and genera (shown using very-high-resolution spring orthoimagery), shown using very-high-resolution orthoimagery: (a) pine, (b) spruce, (c) fir, (d) Douglas fir, (e) larch, (f) oak, (g) beech, (h) birch, (i) alder, (j) hornbeam, (k) maple, (l) ash, (m) poplar, (n) lime, (o) black locust, (p) dwarf mountain pine. Orthoimagery is openly available from the Polish Geoportal (https://mapy.geoportal.gov.pl/, last access: 14 June 2024; Head Office of Geodesy and Cartography).
2.4 Satellite imagery processing and additional variables
Regarding satellite imagery predictors, numerous studies have demonstrated the significance of a multi-temporal approach in accurately distinguishing tree species (Immitzer et al., 2019; Grabska et al., 2019; Hościło and Lewandowska, 2019; Persson et al., 2018; Kollert et al., 2021). For instance, our previous study on species classification in a smaller area highlighted the optimal timing for distinguishing forests tree species in temperate zones, which varies during the spring and autumn seasons (Grabska et al., 2019). At a national scale, however, applying a single seamless image composition for the entire growing season is impractical. While seasonal STMs can provide important phenological information (Müller et al., 2015), areas with frequent cloud cover may still experience difficulties in acquiring high-quality observations for all needed temporal time steps (Grabska et al., 2020). Different approaches to calculate Sentinel-2 based STMs were employed, such as utilizing seasonal metrics calculated over 2 to 4 months (Praticò et al., 2021) or testing long-term, seasonal, and monthly composites (Nasiri et al., 2023).
Here, we employed seasonal Sentinel-2 (L2A) spectral–temporal metrics (STMs) calculated in GEE for four periods: (1) the second half of April, (2) May, (3) June–July, and (4) October for the years 2018–2021. For each, one seasonal STM from multi-annual observations was calculated. The specific periods for each season and year are provided in Table 2. They were selected based on findings from our previous studies (Grabska et al., 2019, 2020; Grabska-Szwagrzyk and Tymińska-Czabańska, 2024). The spring imagery was chosen to capture the greening-up phase, while autumn imagery was selected to represent the period when leaves undergo colour changes. Furthermore, we decided to include two spring STMs, one for early spring and one for late spring, as our previous study revealed significant differences among deciduous species in this period. For instance, at a smaller site, there was an 8–18 d gap between early-leafing species like larch and birch and late-leafing species like alder and oak (Grabska-Szwagrzyk and Tymińska-Czabańska, 2024). Moreover, we included a summer STM as it represents a relatively stable and certain period and allows us to utilize a greater number of images. In the previous study on forest tree species classification in the Polish Carpathians, bands from July STMs were among the most important variables (Grabska et al., 2020). The dates were slightly modified due to meteorological conditions and, therefore, phenology variations in particular years, as well as missing observations in some cases (Table 2).
All available Sentinel-2 images from the harmonized level-2A collection captured during these periods and with cloud cover below 40 % were pre-processed, including cloud, cloud shadow, and dark-pixel masking based on the Sentinel-2 cloud probability dataset (based on the Sentinel2-cloud detector; see https://github.com/sentinel-hub/sentinel2-cloud-detector, last access: 14 June 2024), also available in GEE (COPERNICUS/S2_CLOUD_PROBABILITY, Skakun et al., 2022). The number of clear observations for each period varied, largely due to cloud cover, as well as overlapping Sentinel-2 orbits (Fig. 3).
The pre-processed imagery was then clipped to match the actual forest mask, ensuring that only relevant areas were considered for analysis. In addition, the normalized difference vegetation index (NDVI) was calculated to mitigate the potential impact of disturbances on the obtained results and to remove recent clear cuts, ensuring that only areas with healthy vegetation were considered. Specifically, based on tests, the pixels with NDVI values below 0.6 from the summer 2021 STM were excluded from the analysis (Fig. 4). The final step included calculating mean reflectance values for each pixel and for each specific season based on the seamless Sentinel-2 imagery.
Additional variables for classification included environmental datasets available in GEE. They included elevation data (reprocessed 30 m SRTM data: NASA/NASADEM_HGT/001, NASA JPL, 2020), WorldClim variables (WORLDCLIM/V1/BIO, Hijmans et al., 2005), temperature and precipitation (bio1, bio12, bio17), soils (OpenLandMap/SOL/SOL_GRTGROUP_USDA-SOILTAX_C/v01, Hengl and Nauman, 2018), and Terra Climate (IDAHO_EPSCOR/TERRACLIMATE, Abatzoglou et al., 2018) maximum air temperature for 2018 (see Table A1 in the Appendix).
Table 2Periods of Sentinel-2 imagery used in analysis.
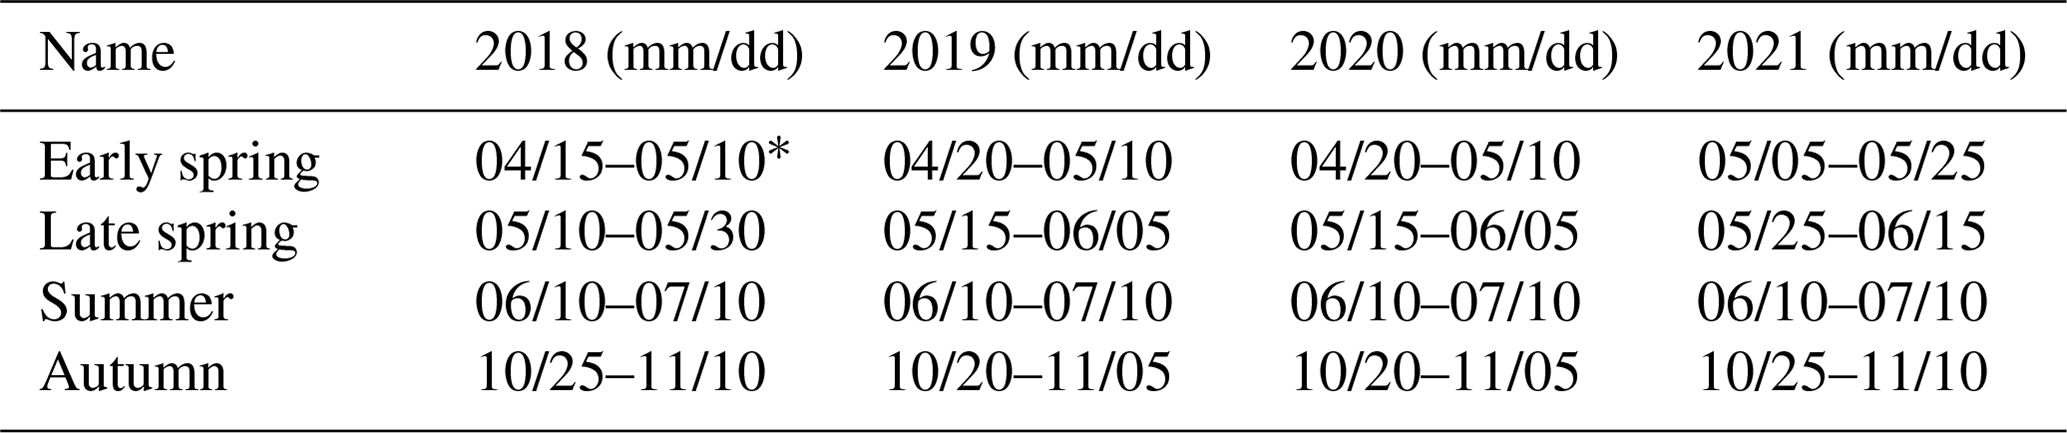
* Period increased due to insufficient observations.
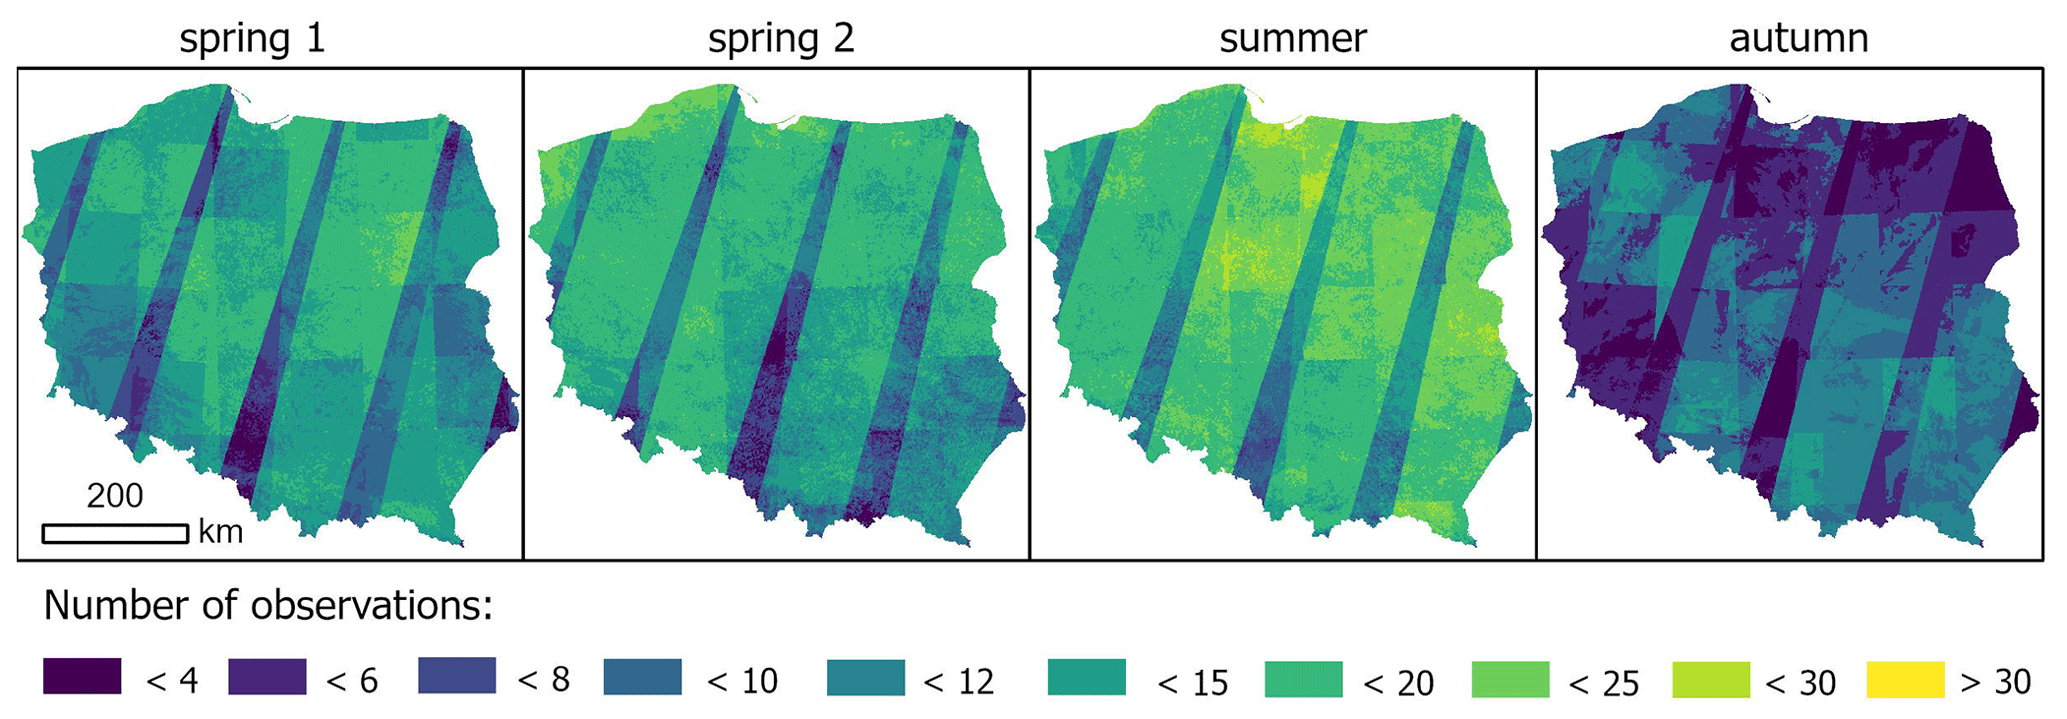
Figure 3Number of cloud-free observations in the analysed periods, combined for all years.
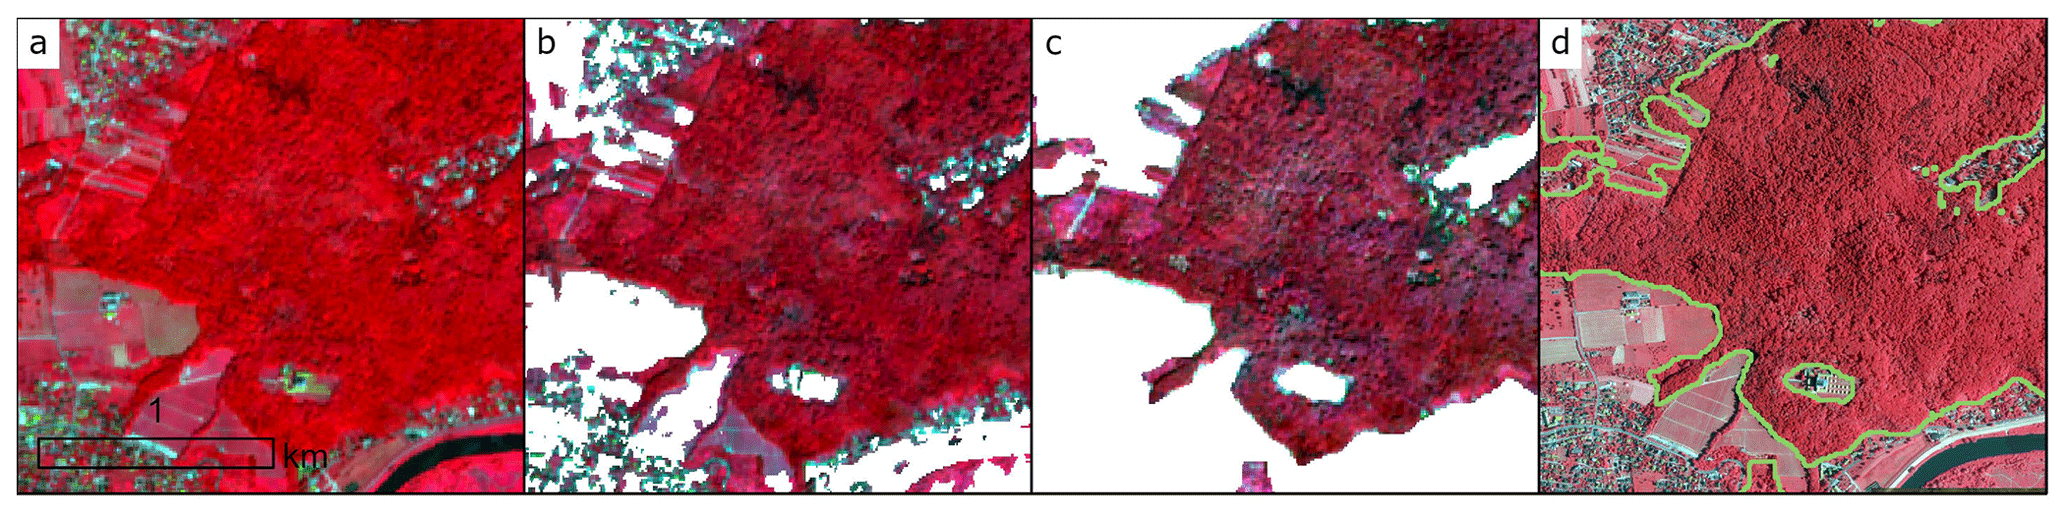
Figure 4Procedure for obtaining the forest mask used in this study for the example of part of Kraków, southern Poland: (a) Sentinel-2 image (near-infrared, visible red, visible green), (b) Sentinel-2 clipped to ESA WorldCover v200 dataset extracted tree cover class; (c) Sentinel-2 clipped to ESA WorldCover, Dynamic World, and NDVI thresholding; (d) high-resolution colour infrared (CIR) orthoimage with borders of the calculated forest mask.
2.5 Classification and accuracy assessment
Classification for the entire area of Poland was performed using approx. 400 000 sample pixels, employing a 10-fold cross-validation technique. An RF classifier (Breiman, 2001) was used within the GEE, with the number of trees set to 200. This algorithm was chosen because it is reported to be insensitive to overfitting and outliers in training samples (Belgiu and Drăgu, 2016). Moreover, RF is commonly used in vegetation mapping studies for large areas (Rüetschi et al., 2021; Hermosilla et al., 2022). Among the classification algorithms available in GEE, RF has been reported to be less computationally intensive than support vector machine (SVM) (Bonannella et al., 2022) and to outperform other algorithms (Praticò et al., 2021). Accuracy assessment included the estimation of area-adjusted confusion matrices; producer's accuracy (PA); user's accuracy (UA); F1 score, which is a weighted harmonic mean of UA and PA; and overall accuracy (OA). For this task, 1501 test polygons (see Sect. 2.3) were utilized. To ensure the robustness of the accuracy assessment, a stratified random sampling approach based on species was adopted, as recommended by Olofsson et al. (2014) and based on our previous research (Grabska et al., 2020). Furthermore, we tested the disproportional allocation approach which is commonly employed when dealing with substantial class imbalances (Marconi et al., 2022; Maxwell et al., 2018; Jackson and Adam, 2021).
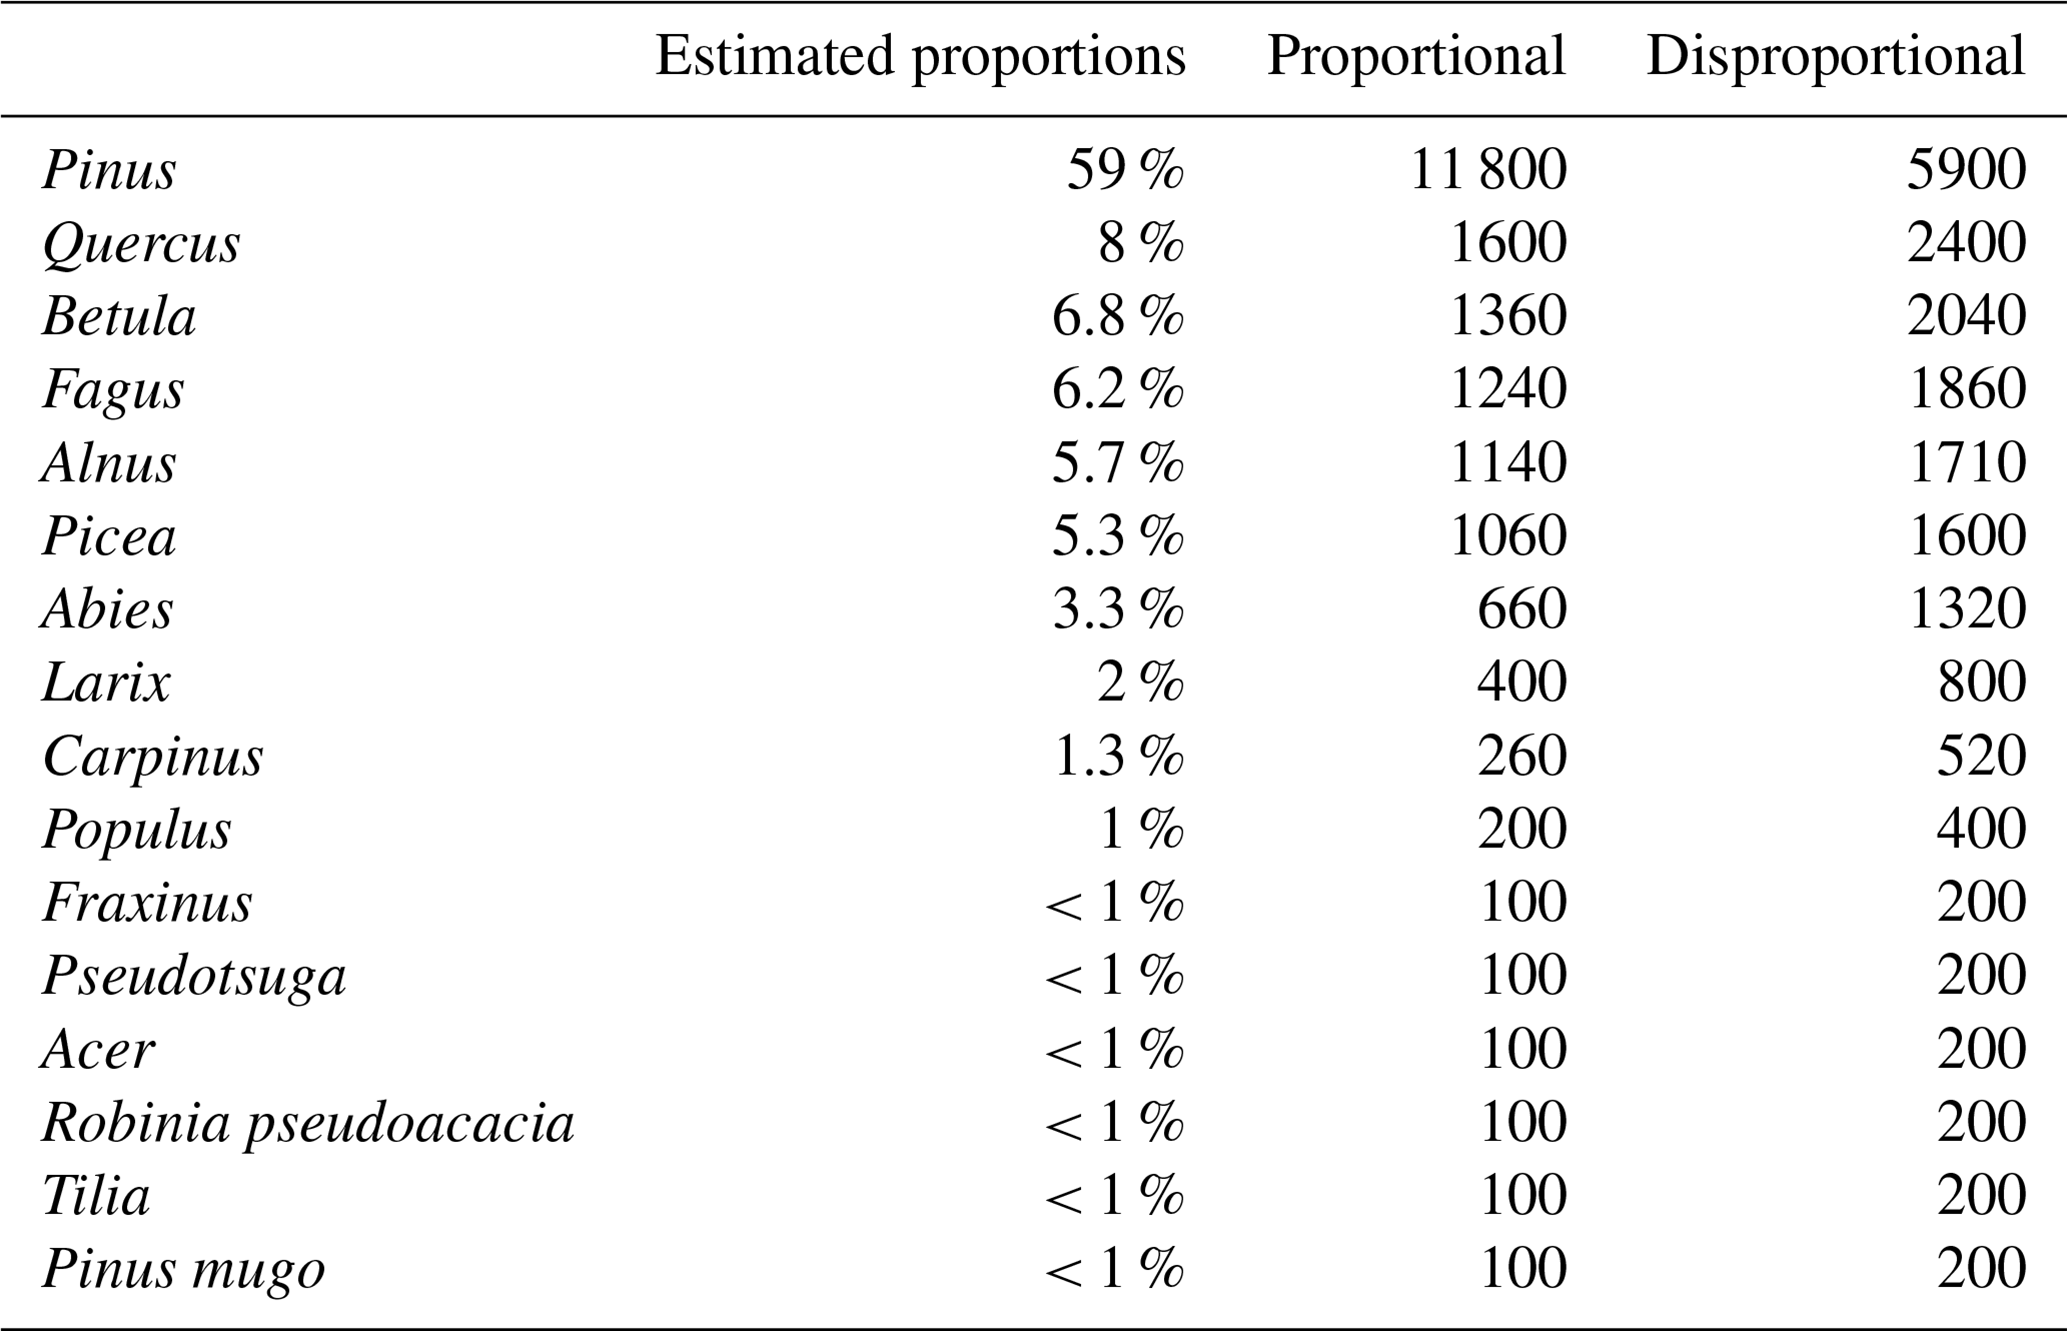
In recognition of class imbalance, a 2-fold strategy was implemented. The first approach involved proportional allocation, while the second approach involved a disproportional dataset. The sample size for less common species was increased through oversampling, whereas undersampling was employed for the most common class, Pinus. In both approaches, the size of the sample was approximately 20 000 pixels (see Table A2 in the Appendix), and a minimum sampling distance of 20 m was used. Finally, regarding the significant differences in the number of observations between Sentinel-2 orbit overlapping and non-overlapping areas, further analyses were conducted to evaluate the impact of observation frequency on accuracy. This included the calculation of OA separately for overlapping and non-overlapping areas in both sampling approaches.
3.1 Overall accuracy of the tree species maps and variable importance
On average, the classification process yielded high OA, achieving values of approximately 80 % or higher. Employing a 10-fold cross-validation, the average OA was equal to 83.3 %, ranging between 79.3 % and 84.9 %. Subsequently, the species map with the best performance in terms of OA from the initial step was validated with approximately 20 000 pixels using two approaches: proportional and disproportional. The proportional approach demonstrated an OA of 89.6 %, while, in the disproportional approach, a lower accuracy of 84 % was achieved. This decline in accuracy when transitioning from proportional to disproportional sample allocation is reasonable as more samples represent less common species, usually under-performing compared to the most common ones.
OA varied between regions with overlapping and non-overlapping Sentinel-2 orbits. The following OAs were obtained: 86.7 % for non-overlapping areas and 90.1 % for overlapping area using proportional allocation and 83.8 % and 84.1 % using disproportional allocation, respectively. Although the difference using disproportional allocation seems to be low, the limited number of clear observations may increase the uncertainty of estimations (Schindler et al., 2021). In studies which utilize Landsat imagery, the number of clear observations plays a vital role in classification accuracy improvement (Turlej et al., 2022). Furthermore, in mapping large areas, accuracy metrics are not expected to be uniform in space due to high species and environmental diversity. Examples of selected regions with low and high accuracies are illustrated in Fig. 5. Numerous environmental and forest-related factors can impact the results. For example, heterogeneous forest structures with high diversity terms of age and species (Fig. 5a) result in misclassifications and require further examination and addressing. Also, misclassification occurs more often in the mountainous areas, particularly in the Carpathian forests due to higher species and environmental diversity and topography effects (Fig. 5b). High accuracy is observed in areas featuring a combination of various species but comprising pure stands with a similar forest structure (Fig. 5c), as well as in locations where dense black locust stands are present (Fig. 5d).
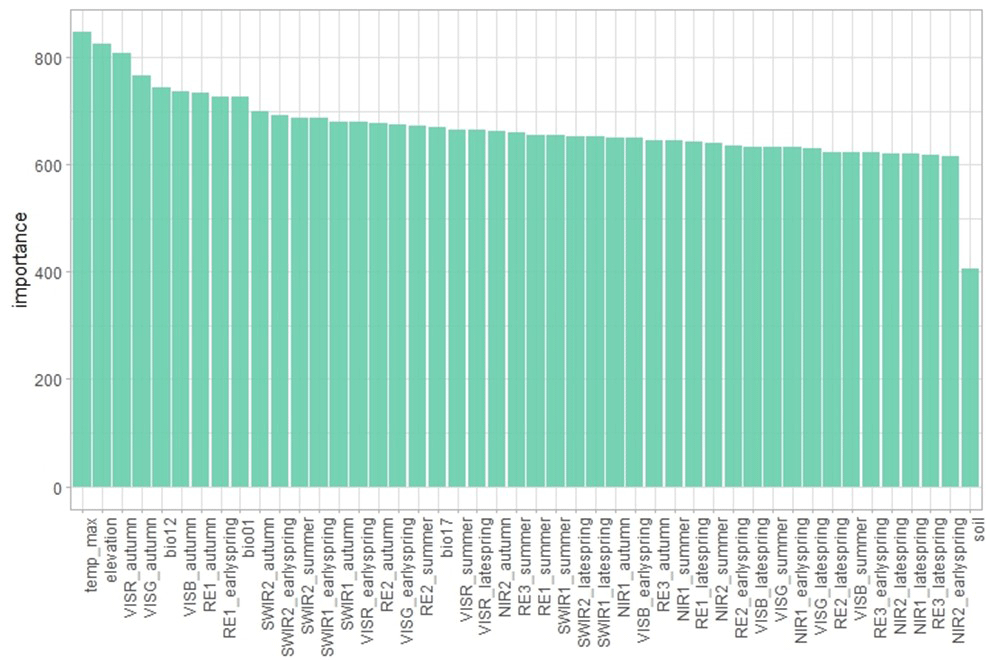
The variable importance analysis (see Fig. A1 in the Appendix) revealed the highest contributions from environmental variables such as maximum temperature, annual precipitation, mean annual temperatures, and elevation, similarly to findings in other studies for large areas (Hermosilla et al., 2022). Among the periods used to calculate STMs, bands from autumn appeared to be the most highly ranked, followed by early-spring bands. Notably, visible, red-edge, and short-wave infrared (SWIR) bands showed stronger importance. On the other hand, the soil dataset exhibited notably lower importance compared to other predictors despite previous reports showing soils to be more significant than climatic variables in temperate tree species distribution (Walthert and Meier, 2017). However, it is important to note that these findings may vary across regions and may be scale-dependent, and more detailed soil information could enhance the accuracy of the results.
3.2 Tree species distribution and accuracy
The obtained map of forest tree species and genera reveals the share and spatial distribution of forests in Poland. Pine-dominated stands are the most common, accounting for 47.5 % of the total forest cover in the country. Several other common species prevalent across Polish forests are birch occupying, 11.7 % of the forested areas, along with alder at 9 %, beech at 8.1 %, and oak at 7.2 %. Other common species include spruce (3.7 %) and fir (2.8 %), predominantly occurring in mountainous areas in southern Poland. Additionally, larch-dominated stands are relatively common (3.6 %), along with ash (1.7 %), hornbeam (1.1 %), and poplar (1 %). Several other species each hold a share of less than 1 % in the overall forest composition, including Douglas fir, maple, and black locust. Lastly, lime and dwarf mountain pine have a more marginal presence in the obtained map.
The comparison of the results with official statistics shows some discrepancies. Firstly, the share of pine in our map is underestimated by more than 10 percentage points, which may result from several factors. One possible reason is the misclassification of pine as spruce or other coniferous trees, which account for 0.65 % of the reference data, particularly in mountainous regions. Additionally, the share of pine has been decreasing in recent years due to shifts in forest management practices, such as the transition from monocultures to stands with more diversified species composition (Tomaś and Jagodziński, 2019). Furthermore, pine has been susceptible to disturbances in recent years, which may have led to misclassifications (Hemmerling et al., 2021). Another species with a lower share in our map than what is reported is spruce (3.6 % vs. 5.3 %), which, in recent years, has been exposed to significant disturbances and dieback, particularly in the western Carpathian mountains and Białowieża forest (Grodzki, 2010; Bałazy, 2020; Kamińska et al., 2021). Consequently, the share of spruce is also decreasing. On the other hand, certain species like alder and birch are seemingly more common than in the official reports. The larger share of birch may be attributed to the fact that this species is common on abandoned agricultural land, and it is also regarded to be a pioneer and successional species (Hynynen et al., 2010). The area analysed in our study might include former agricultural lands where forest succession takes place, a process that is very common in different parts of Poland (Shahbandeh et al., 2022; Kolecka et al., 2017; Zgłobicki et al., 2020; Majchrowska, 2013). However, abandoned areas with forest succession are not included in the official reporting for forests. Also, while very young forests have been excluded from our analysis, the visual inspection indicates frequent misclassifications of younger stands covered with broad-leaved trees as alder, which may be one of the reasons for its overestimation.
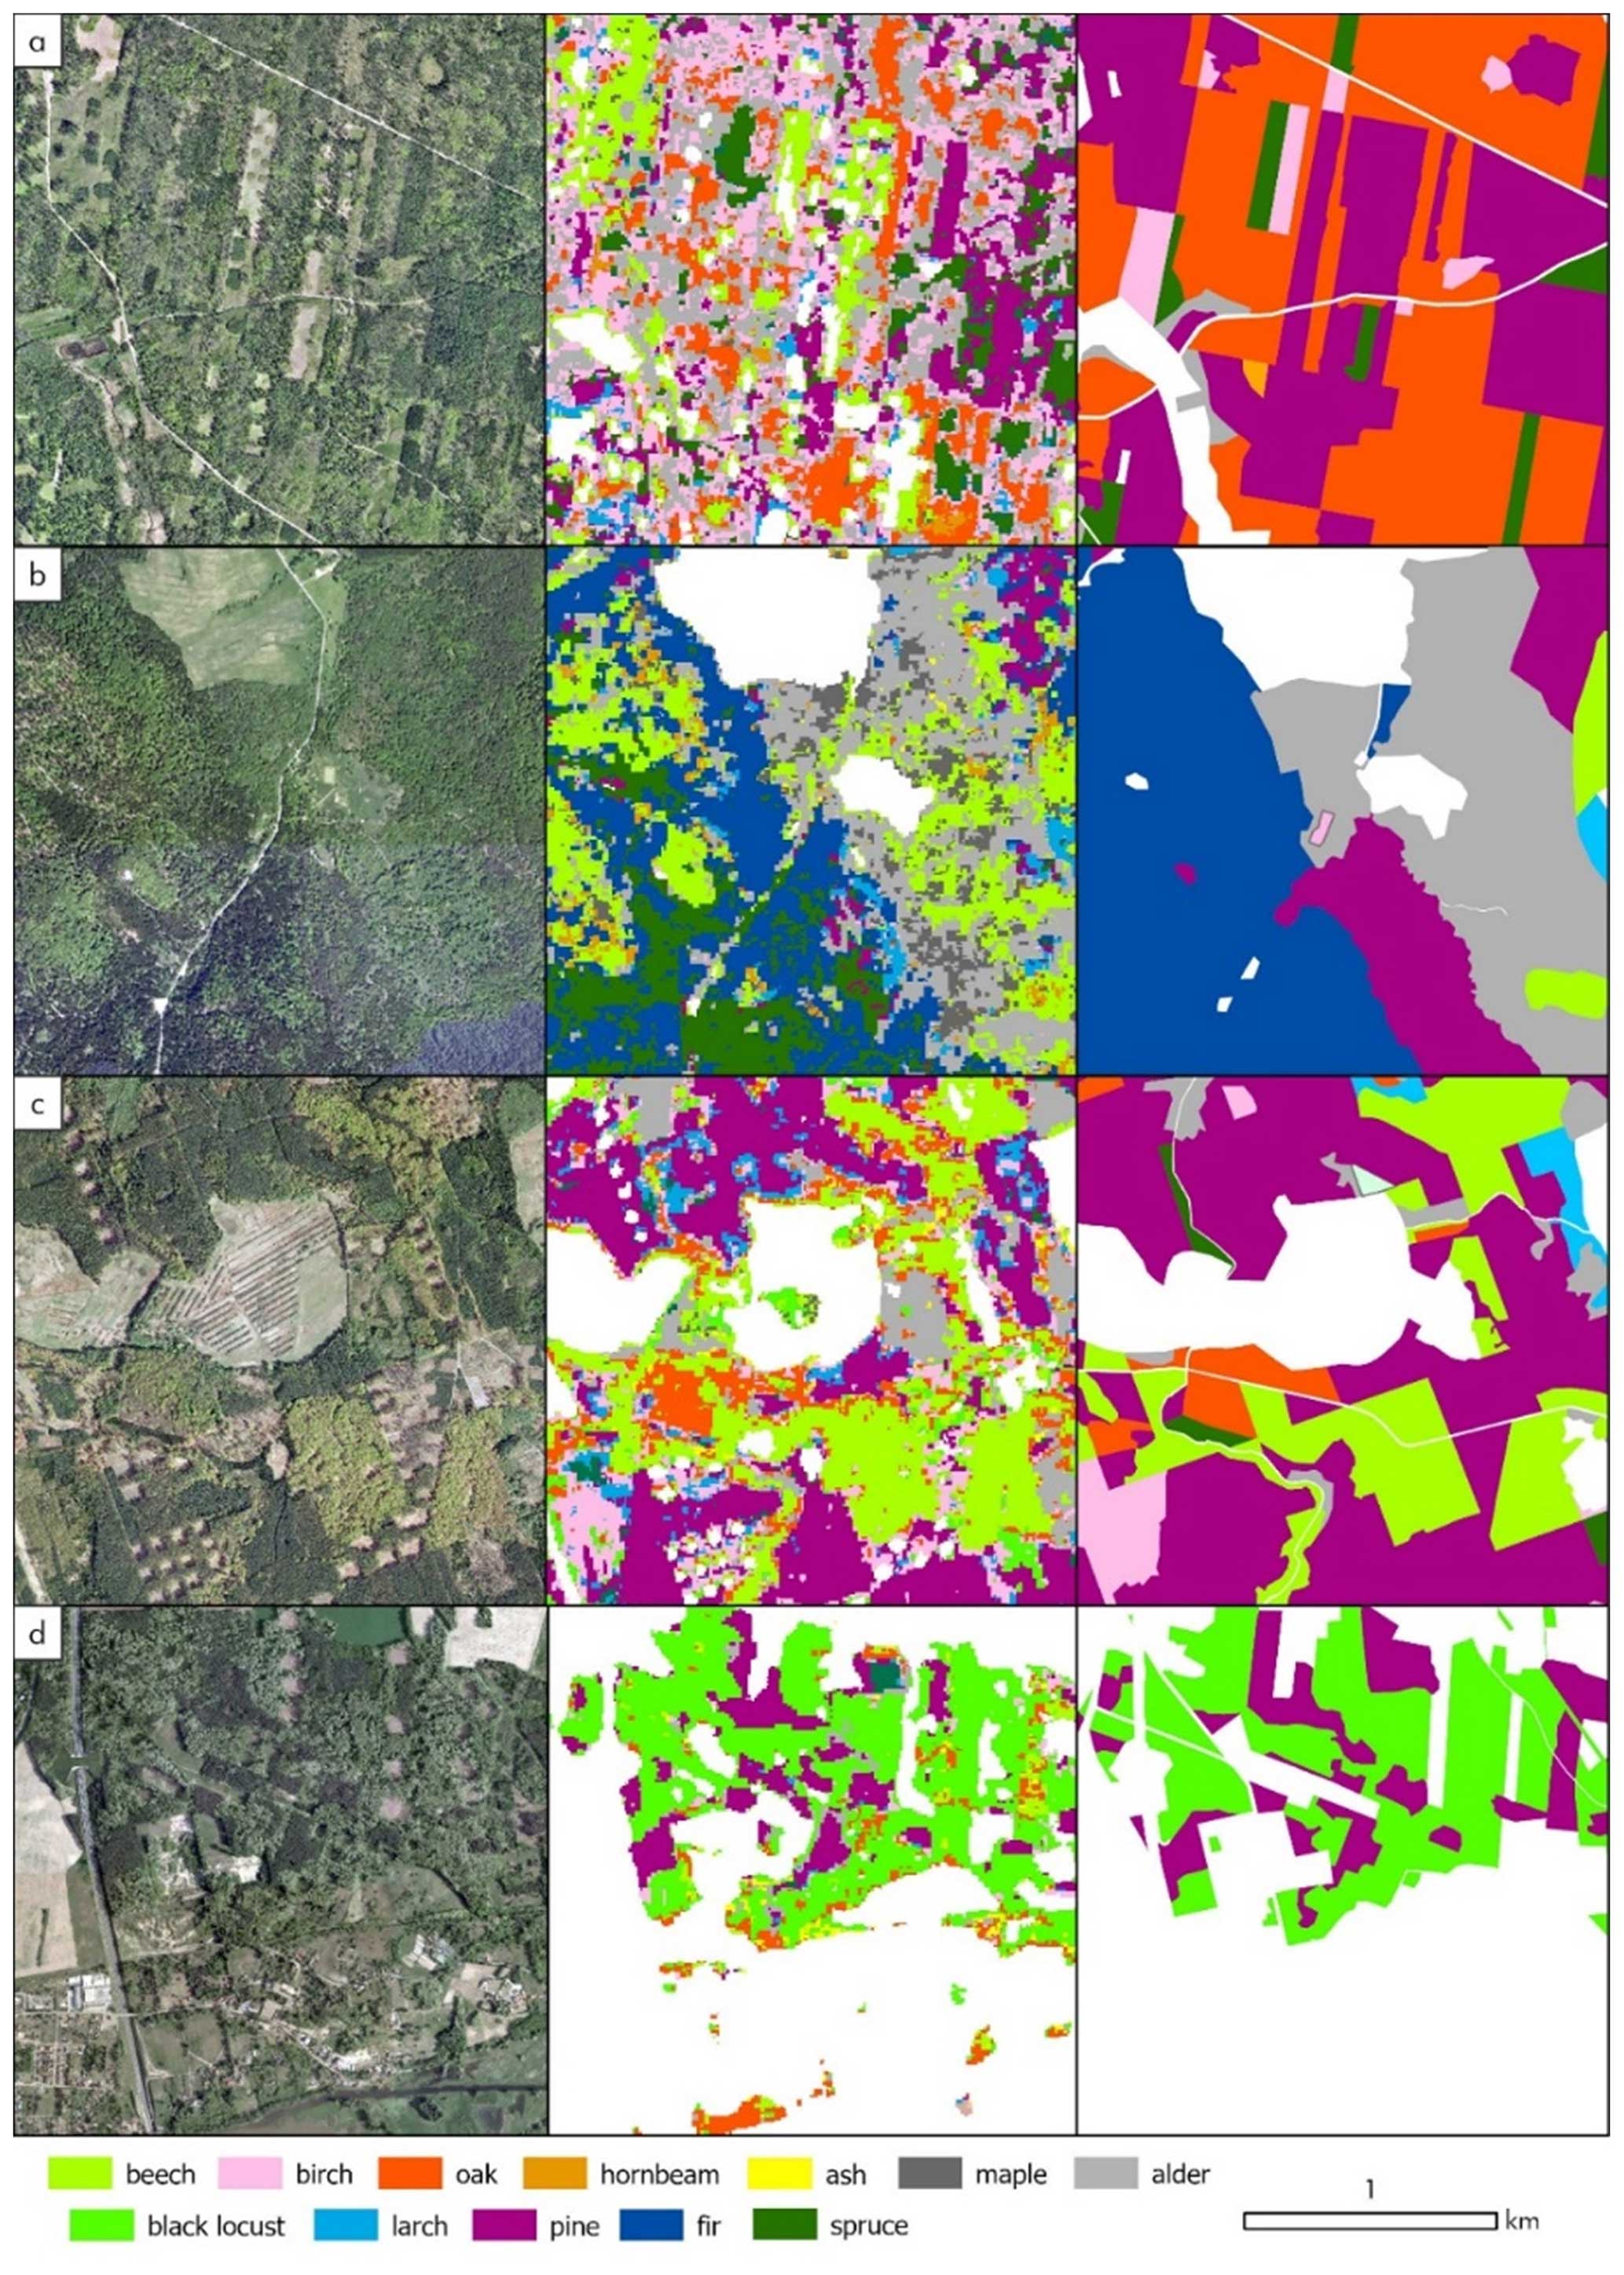
Figure 5Examples of classification (middle) compared with high-resolution orthoimagery (left) and dominant species from the Forest Data Bank (right): (a) Czarna Białostocka Forest District, NE Poland lowlands; (b) Baligród Forest District, SE Poland, Bieszczady Mountains; (c) Kłodawa Forest District, NW Poland lowlands; (d) Sulechów Forest District, W Poland lowlands. Orthoimagery is openly available from the Polish Geoportal (https://mapy.geoportal.gov.pl/, last access: 14 June 2024; Head Office of Geodesy and Cartography).
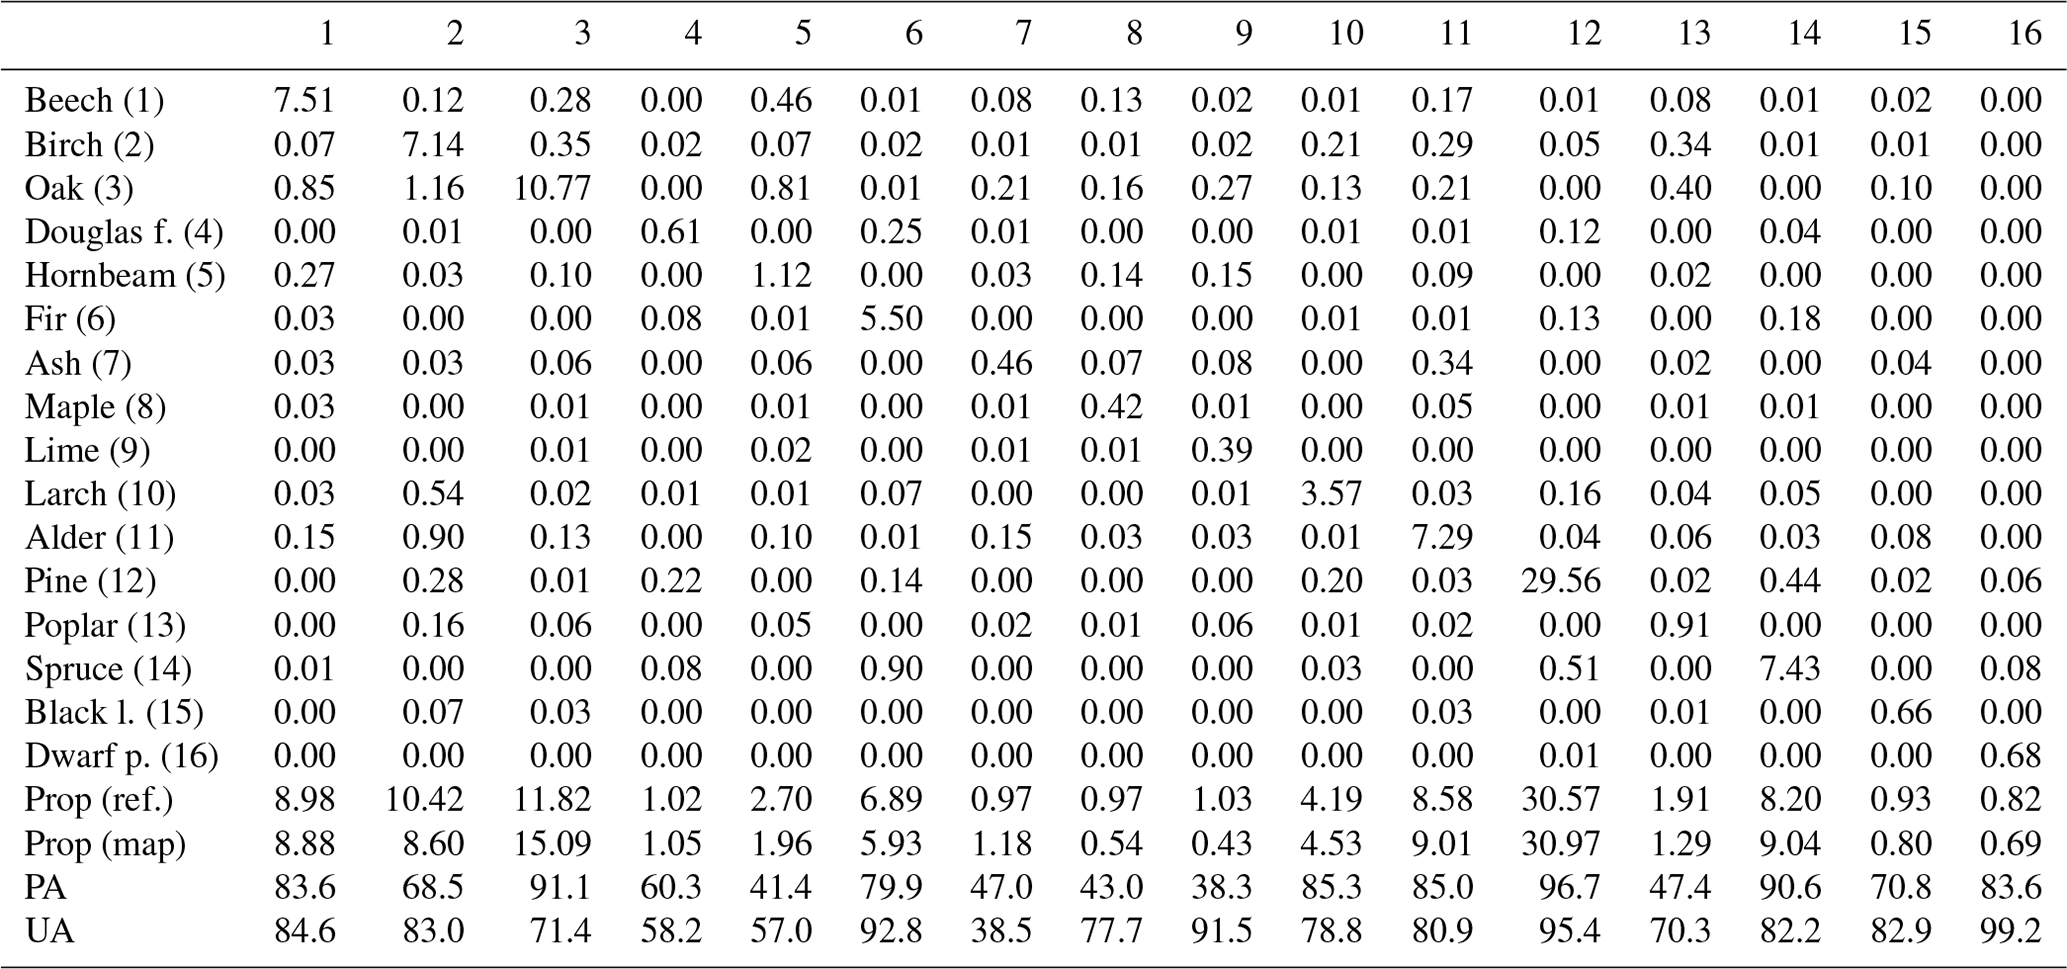
In terms of species accuracy, the most abundant species in Poland, pine, was classified with the highest accuracy, exceeding a 90 % F1 score (Fig. 6). Other species demonstrating an F1 score of 80 % or higher included dwarf mountain pine, alder, beech, fir, spruce, oak, and larch. With the exception of dwarf pine mountain, these species are common in forests of Poland. On the other hand, the classification of poplar, Douglas fir, maple, lime, hornbeam, and ash revealed relatively poor accuracy levels below 60 %. Surprisingly, rare species such as black locust achieved high classification accuracy around 75 %. The confusion matrix reveals the frequent misclassifications (Table 3). Typically, broad-leaved species such as ash, hornbeam, and lime are misclassified – ash and lime are misclassified as oak, and hornbeam is misclassified as oak and beech species, while coniferous Douglas fir is misclassified as pine. Similarly, in the study of Hemmerling et al. (2021), a less common species classified with relatively high accuracy was black locust. This is a result of its unique spectral–temporal properties as, usually, it leaves out later than other broad-leaved species, and it is characterized by late-spring flowering (Rusňák et al., 2022; Somodi et al., 2012). This is a promising result, taking into account the invasiveness of this non-native species in Europe (Richardson and Rejmánek, 2011). The visual inspection also indicates that frequent misclassifications include younger stands, such as oak, misclassified as other broad-leaved species, e.g. alder. Importantly, the age structure within the examined species differs largely (based on the FDB), with average values between approx. 50 years for birch, larch, and alder; around 70 years for spruce and pine; and above 80 years for beech, oak, and fir. The species classification in young forests, characterized by the spectral characteristics different than the mature ones, is challenging. Finally, not all species occurring in Poland were classified.
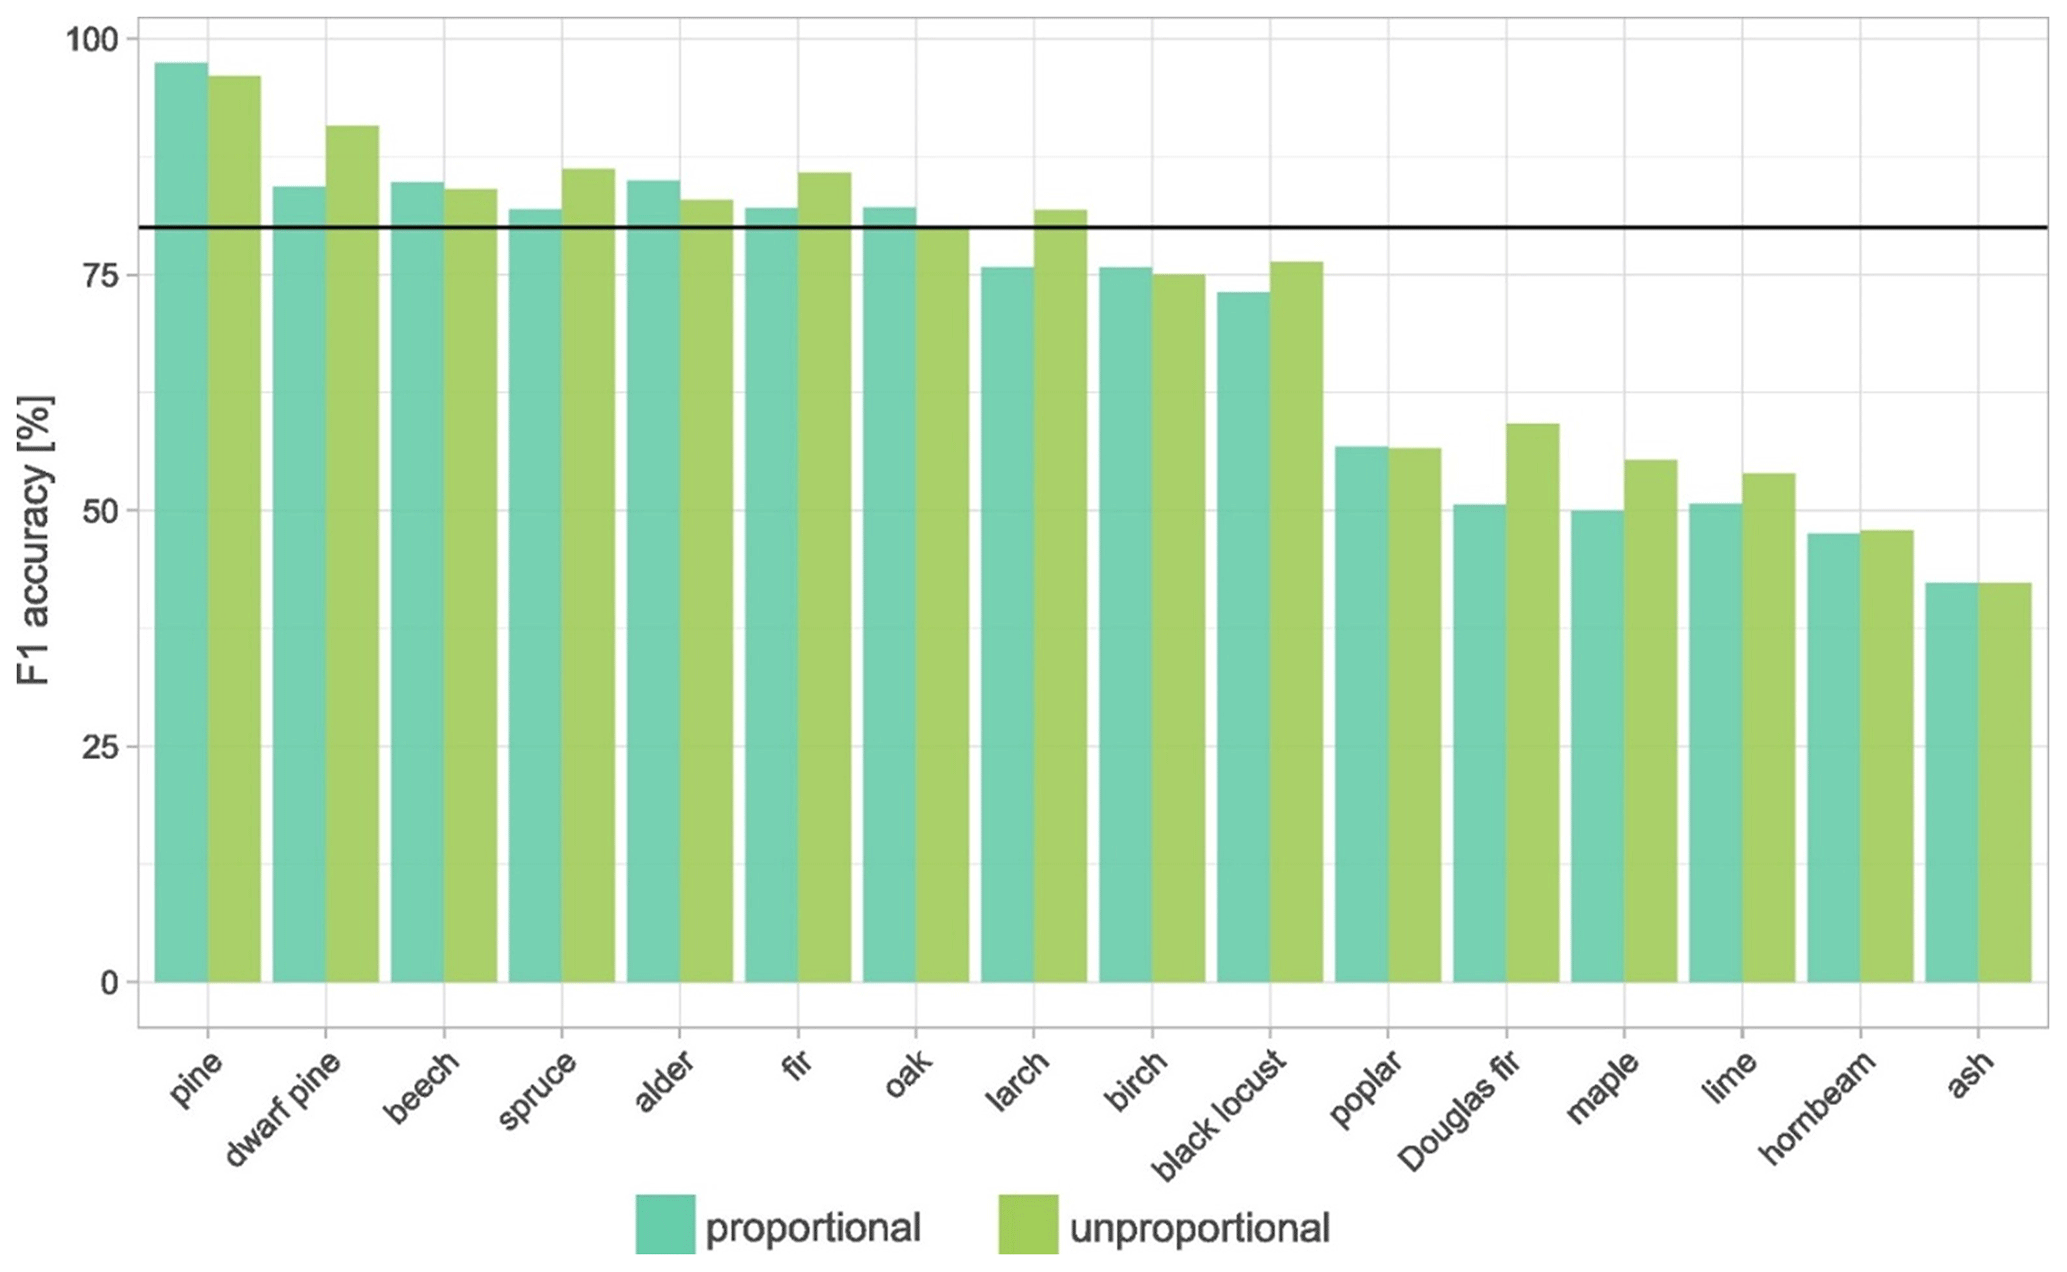
Figure 6F1 score for 16 analysed species using two approaches: proportional sample allocation and disproportional allocation, with down-sampling of pine and oversampling of other classes.
Table 3Area-adjusted confusion matrix for the disproportional sample allocation (populated by estimated proportions of area).
3.3 Limitations in large-area species mapping and proposed solutions
In the country-wide or other large-extent mapping cases, there are several challenges and limitations. Larger regions are often characterized by higher diversity in terms of species and environmental conditions. Certain species occur only in spatially limited areas – for example, in Poland, silver fir is typical for the mountain areas only, while oaks and hornbeams tend to occur more often in the lowlands. In addition, due to the variability in meteorological conditions, the optimal period for the classification of specific species may differ largely among regions, particularly during the spring, when processes of leaf unfolding take place, and autumn, when leaf colouring occurs. Furthermore, these optimal periods may vary from year to year due to variations in spring temperatures and other meteorological conditions (Grabska-Szwagrzyk and Tymińska-Czabańska, 2024). Future research should also consider specific periods of imagery acquisition when aiming to distinguish different species, i.e. covering periods when particular species exhibit the highest phenological variations. It would be profitable to use multiple autumn (e.g. early and late autumn) STMs; however, this is very challenging due to the insufficient number of clear observations during this time of the year.
One solution may be the division of the study area into smaller regions – in country-wide or other large-extent mapping of species composition, the subdivision into smaller parts may play an important role (this may also be due to the computational power), similarly to the study by Pazúr et al. (2022) or Hermosilla et al. (2022). However, another question arises regarding how to define the optimal borders of smaller regions to achieve higher accuracy in the obtained map, which is rarely discussed in studies focused on remote-sensing-based classification.
Another methodological challenge is the underrepresentation of clear observations in some regions. In this study, we employed short-period seasonal STMs from Sentinel-2 time series rather than one seasonal mean as the information from specific periods of the growing season is crucial in distinguishing species. In the calculation of seasonal means, multi-annual observations were used; still, for some regions, the underrepresentation of clear observations occurs. This may have a significant impact on map accuracy in regions of lower observation frequency. In the case of Poland, this is particularly observed in the places where two orbits do not overlap, specifically in autumn (Fig. 3). This issue should be addressed in studies on species classification for larger regions using Sentinel-2 or similar satellite constellations.
As a result of the above-mentioned factors, the design of robust training, test, and validation datasets is challenging. Finally, in certain regions, such as privately owned forests or lands not officially reported to be forests (e.g. successional forests that have emerged on previously abandoned agricultural lands), there are no reference data available. These areas tend to exhibit greater complexity, making the task of assessing the classification accuracy particularly demanding.
We provide freely accessible resources including, the forest tree species map and training and validation data: https://doi.org/10.5281/zenodo.10180469 (Grabska-Szwagrzyk, 2023a). The map can be explored online: https://ee-aweaksbarg.projects.earthengine.app/view/speciesmappl (Grabska-Szwagrzyk, 2023b).
We have obtained the first national-scale forest tree species map for Poland, achieving an accuracy exceeding 80 %. This was accomplished through a novel approach that involved the calculation of Sentinel-2 seasonal STMs spanning multiple years. The resulting map is an important dataset for both forest management and the scientific community, facilitating tasks like modelling biodiversity and monitoring non-native and invasive species. It can enhance our understanding of forest ecosystems and support more informed and precise forestry and conservation efforts. Unlike other existing data sources, such as the FDB, which primarily provide information about the share of species within forest stands, this new map offers a view of tree species distribution at a finer scale. Furthermore, our map provides a unique advantage over traditional forest inventories like the NFI, which offers point-based data rather than a continuous spatial representation of species distribution.
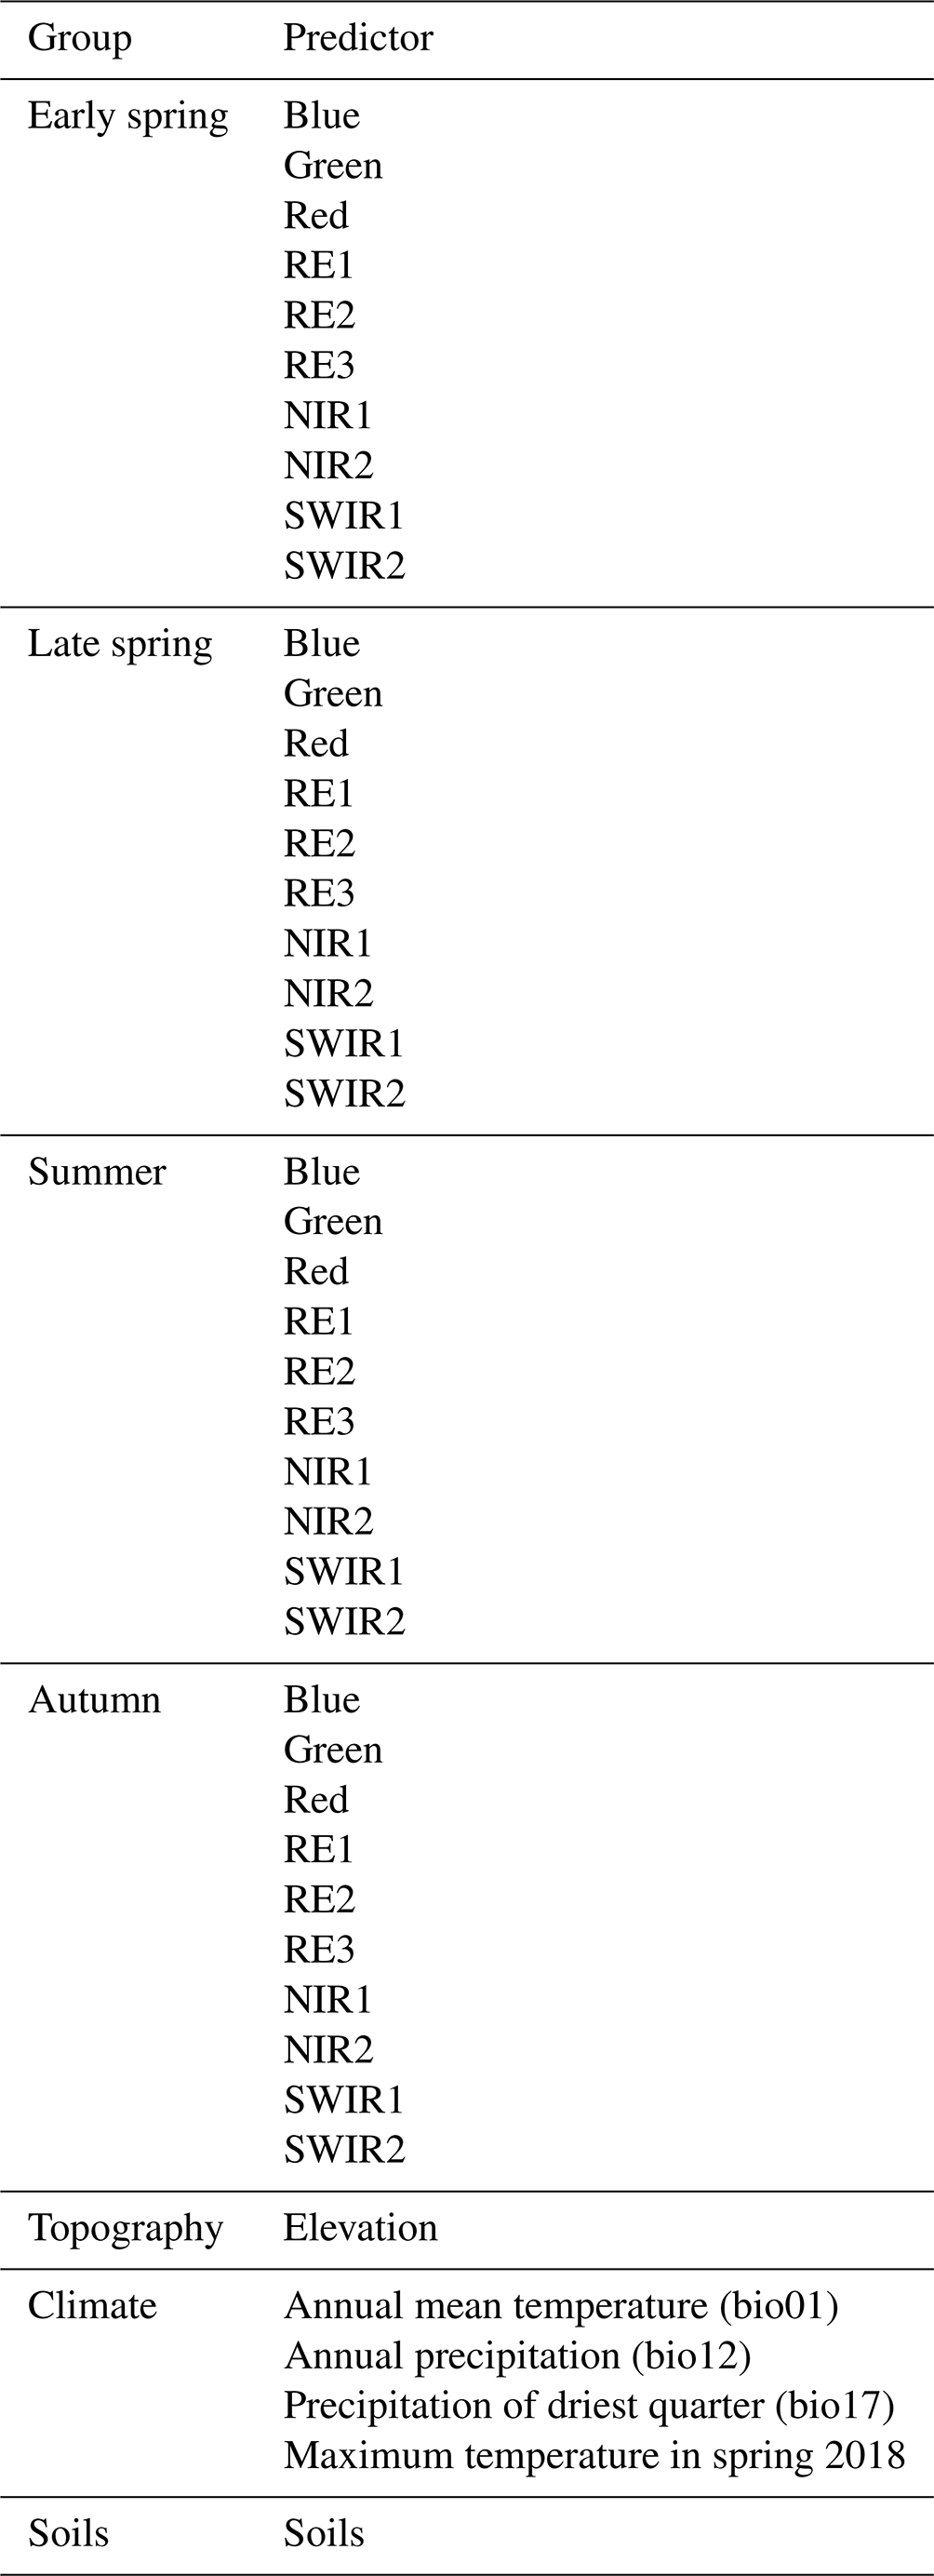
Table A2Number of test pixels for accuracy assessment using two approaches: proportional and disproportional.
EGS, DT, and MS conceptualised the study and designed the methodology; EGS processed the data; EGS wrote the manuscript; DT, MS, and JK edited and revised the manuscript.
The contact author has declared that none of the authors has any competing interests.
Publisher’s note: Copernicus Publications remains neutral with regard to jurisdictional claims made in the text, published maps, institutional affiliations, or any other geographical representation in this paper. While Copernicus Publications makes every effort to include appropriate place names, the final responsibility lies with the authors.
The research has been initiated through a cooperative effort within the Human-Environmental Systems (HES) Research Centre of Jagiellonian University, Krakow, receiving co-funding through the HES-GEO project (Horizon 2020, grant agreement no. 952327). The publication has been supported by a grant from the Faculty Geography and Geology under the Strategic Programme Excellence Initiative at Jagiellonian University.
This research has been supported by the HES-GEO project (EU Horizon 2020, grant agreement no. 952327).
This paper was edited by Nophea Sasaki and reviewed by Oleksandr Melnyk and Jan Hemmerling.
Abatzoglou, J. T., Dobrowski, S. Z., Parks, S. A., and Hegewisch, K. C.: TerraClimate, a high-resolution global dataset of monthly climate and climatic water balance from 1958–2015, Sci. Data, 5, 1–12, https://doi.org/10.1038/sdata.2017.191, 2018.
Achanta, R. and Süsstrunk, S.: Superpixels and polygons using simple non-iterative clustering, 2017 IEEE Conference on Computer Vision and Pattern Recognition (CVPR), Honolulu, HI, USA, 2017, 4895-4904, https://doi.org/10.1109/CVPR.2017.520, 2017.
Ahlswede, S., Schulz, C., Gava, C., Helber, P., Bischke, B., Förster, M., Arias, F., Hees, J., Demir, B., and Kleinschmit, B.: TreeSatAI Benchmark Archive: a multi-sensor, multi-label dataset for tree species classification in remote sensing, Earth Syst. Sci. Data, 15, 681–695,https://doi.org/10.5194/essd-15-681-2023, 2023.
Axelsson, A., Lindberg, E., Reese, H., and Olsson, H.: Tree species classification using Sentinel-2 imagery and Bayesian inference, Int. J. Appl. Earth Obs., 100, 102318, https://doi.org/10.1016/j.jag.2021.102318, 2021.
Bałazy, R.: Forest dieback process in the Polish mountains in the past and nowadays – literature review on selected topics, Folia For. Pol. Ser. A, 62, 184–198, https://doi.org/10.2478/ffp-2020-0018, 2020.
Belgiu, M. and Drăgu, L.: Random forest in remote sensing: A review of applications and future directions, ISPRS J. Photogramm., 114, 24–31, https://doi.org/10.1016/j.isprsjprs.2016.01.011, 2016.
Biuro Urządzania Lasu i Geodezji Leśnej: Wielkoobszarowa inwentaryzacja stanu lasów. Wyniki za okres 2017–2021, https://www.bdl.lasy.gov.pl/portal/media/default/publikacje/wisl2017_2021.pdf (last access: 14 June 2024) 2022.
Boisvenue, C. and White, J. C.: Information needs of next-generation forest carbon models: Opportunities for remote sensing science, Remote Sens., 11, 463, https://doi.org/10.3390/rs11040463, 2019.
Bolyn, C., Michez, A., Gaucher, P., Lejeune, P., and Bonnet, S.: Forest mapping and species composition using supervised per pixel classification of Sentinel-2 imagery, Biotechnol. Agron. Société Environ., 22, 172–187, 2018.
Bonannella, C., Hengl, T., Heisig, J., Parente, L., Wright, M. N., Herold, M., and de Bruin, S.: Forest tree species distribution for Europe 2000-2020: mapping potential and realized distributions using spatiotemporal Machine Learning, PeerJ, 10, e13728, https://doi.org/10.7717/peerj.13728, 2022.
Breidenbach, J., Waser, L. T., Debella-Gilo, M., Schumacher, J., Rahlf, J., Hauglin, M., Puliti, S., and Astrup, R.: National mapping and estimation of forest area by dominant tree species using Sentinel-2 data, Can. J. For. Res., 51, 365–379, https://doi.org/10.1139/cjfr-2020-0170, 2021.
Breiman, L.: Random forests, Mach. Learn., 45, 5–32, https://doi.org/10.1023/A:1010933404324, 2001.
Brown, C. F., Brumby, S. P., Guzder-Williams, B., Birch, T., Hyde, S. B., Mazzariello, J., Czerwinski, W., Pasquarella, V. J., Haertel, R., Ilyushchenko, S., Schwehr, K., Weisse, M., Stolle, F., Hanson, C., Guinan, O., Moore, R., and Tait, A. M.: Dynamic World, Near real-time global 10 m land use land cover mapping, Sci. Data, 9, 1–17, https://doi.org/10.1038/s41597-022-01307-4, 2022.
Chen, B., Xiao, X., Li, X., Pan, L., Doughty, R., Ma, J., Dong, J., Qin, Y., Zhao, B., Wu, Z., Sun, R., Lan, G., Xie, G., Clinton, N., and Giri, C.: A mangrove forest map of China in 2015: Analysis of time series Landsat 7/8 and Sentinel-1A imagery in Google Earth Engine cloud computing platform, ISPRS J. Photogramm., 131, 104–120, https://doi.org/10.1016/j.isprsjprs.2017.07.011, 2017.
Fassnacht, F. E., White, J. C., Wulder, M. A., and Næsset, E.: Remote sensing in forestry : current challenges, considerations and directions, Forestry, 97, 11–37, 2024.
Forstmaier, A., Shekhar, A., and Chen, J.: Mapping of Eucalyptus in Natura 2000 areas using Sentinel 2 imagery and artificial neural networks, Remote Sens., 12, 4–6, https://doi.org/10.3390/rs12142176, 2020.
Gillis, M. D., Omule, A. Y., and Brierley, T.: Monitoring Canada's forests: The national forest inventory, For. Chron., 81, 214–221, https://doi.org/10.5558/tfc81214-2, 2005.
Gorelick, N., Hancher, M., Dixon, M., Ilyushchenko, S., Thau, D., and Moore, R.: Google Earth Engine: Planetary-scale geospatial analysis for everyone, Remote Sens. Environ., 202, 18–27, https://doi.org/10.1016/j.rse.2017.06.031, 2017.
Grabska, E., Hostert, P., Pflugmacher, D., and Ostapowicz, K.: Forest stand species mapping using the sentinel-2 time series, Remote Sens., 11, 1–24, https://doi.org/10.3390/rs11101197, 2019.
Grabska, E., Frantz, D., and Ostapowicz, K.: Evaluation of machine learning algorithms for forest stand species mapping using Sentinel-2 imagery and environmental data in the Polish Carpathians, Remote Sens. Environ., 251, 112103, https://doi.org/10.1016/j.rse.2020.112103, 2020.
Grabska-Szwagrzyk, E.: National-scale tree species/genera map for Poland from Sentinel-2 time series, Zenodo [data set], https://doi.org/10.5281/zenodo.10180469, 2023a.
Grabska-Szwagrzyk, E.: Tree species map for Poland based on Sentinel-2, https://ee-aweaksbarg.projects.earthengine.app/view/speciesmappl (last access: 14 June 2024), 2023b.
Grabska-Szwagrzyk, E. and Tymińska-Czabańska, L.: Sentinel-2 time series : a promising tool in monitoring temperate species spring phenology, For. An Int. J. For. Res., 97, 267–281, 2024.
Grodzki, W.: The decline of Norway spruce, Beskydy, 3, 19–26, 2010.
Hanewinkel, M., Cullmann, D. A., Schelhaas, M. J., Nabuurs, G. J., and Zimmermann, N. E.: Climate change may cause severe loss in the economic value of European forest land, Nat. Clim. Change, 3, 203–207, https://doi.org/10.1038/nclimate1687, 2013.
Hemmerling, J., Pflugmacher, D., and Hostert, P.: Mapping temperate forest tree species using dense Sentinel-2 time series, Remote Sens. Environ., 267, 112743, https://doi.org/10.1016/j.rse.2021.112743, 2021.
Hengl, T. and Nauman, T.: Predicted USDA soil great groups at 250 m (probabilities) (Version v01), Zenodo [data set], https://doi.org/10.5281/zenodo.1476844, 2018.
Hermosilla, T., Bastyr, A., Coops, N. C., White, J. C., and Wulder, M. A.: Mapping the presence and distribution of tree species in Canada's forested ecosystems, Remote Sens. Environ., 282, 113276, https://doi.org/10.1016/j.rse.2022.113276, 2022.
Hijmans, R. J., Cameron, S. E., Parra, J. L., Jones, P. G., and Jarvis, A.: Very high resolution interpolated climate surfaces for global land areas, Int. J. Climatol., 25, 1965–1978, https://doi.org/10.1002/joc.1276, 2005.
Hościło, A. and Lewandowska, A.: Mapping Forest Type and Tree Species on a Regional Scale Using Multi-Temporal Sentinel-2 Data, Remote Sens., 11, 929, https://doi.org/10.3390/rs11080929, 2019.
Hynynen, J., Niemistö, P., Viherä-Aarnio, A., Brunner, A., Hein, S., and Velling, P.: Silviculture of birch (Betula pendula Roth and Betula pubescens Ehrh.) in Northern Europe, Forestry, 83, 103–119, https://doi.org/10.1093/forestry/cpp035, 2010.
Immitzer, M., Vuolo, F., and Atzberger, C.: First Experience with Sentinel-2 Data for Crop and Tree Species Classifications in Central Europe, Remote Sens., 8, 166, https://doi.org/10.3390/rs8030166, 2016.
Immitzer, M., Neuwirth, M., Böck, S., Brenner, H., Vuolo, F., and Atzberger, C.: Optimal input features for tree species classification in Central Europe based on multi-temporal Sentinel-2 data, Remote Sens., 11, 2599, https://doi.org/10.3390/rs11222599, 2019.
Jackson, C. M. and Adam, E.: Machine learning classification of endangered tree species in a tropical submontane forest using worldview-2 multispectral satellite imagery and imbalanced dataset, Remote Sens., 13, 4970, https://doi.org/10.3390/rs13244970, 2021.
Kamińska, A., Lisiewicz, M., Kraszewski, B., and Stereńczak, K.: Mass outbreaks and factors related to the spatial dynamics of spruce bark beetle (Ips typographus) dieback considering diverse management regimes in the Białowieża forest, Forest Ecol. Manage., 498, 119530, https://doi.org/10.1016/j.foreco.2021.119530, 2021.
Karasiak, N., Sheeren, D., Fauvel, M., Willm, J., Dejoux, J.-F., and Monteil, C.: Mapping tree species of forests in southwest France using Sentinel-2 image time series, 9th International Workshop on the Analysis of Multitemporal Remote Sensing Images (MultiTemp), Brugge, Belgium, 1–4, https://doi.org/10.1109/Multi-Temp.2017.8035215, 2017.
Kolecka, N., Kozak, J., Kaim, D., Dobosz, M., Ostafin, K., Ostapowicz, K., Wężyk, P., and Price, B.: Understanding farmland abandonment in the Polish Carpathians, Appl. Geogr., 88, 62–72, https://doi.org/10.1016/j.apgeog.2017.09.002, 2017.
Kollert, A., Bremer, M., Löw, M., and Rutzinger, M.: Exploring the potential of land surface phenology and seasonal cloud free composites of one year of Sentinel-2 imagery for tree species mapping in a mountainous region, Int. J. Appl. Earth Obs., 94, 102208, https://doi.org/10.1016/j.jag.2020.102208, 2021.
Lechner, M., Dostálová, A., Hollaus, M., Atzberger, C., and Immitzer, M.: Combination of Sentinel-1 and Sentinel-2 Data for Tree Species Classification in a Central European Biosphere Reserve, Remote Sens., 14, 1–16, https://doi.org/10.3390/rs14112687, 2022.
Loiselle, B. A., Howell, C. A., Graham, C. H., Goerck, J. M., Brooks, T., Smith, K. G., and Williams, P. H.: Avoiding Pitfalls of Using Species Distribution Models in Conservation Planning, Conserv. Biol., 17, 1591–1600, https://doi.org/10.1111/j.1523-1739.2003.00233.x, 2003.
Majchrowska, A.: Abandonment of agricultural land in central Poland and its ecological role, Ekol. Bratislava, 32, 320–327, https://doi.org/10.2478/eko-2013-0028, 2013.
Marconi, S., Weinstein, B. G., Zou, S., Bohlman, S. A., Zare, A., Singh, A., Stewart, D., Harmon, I., Steinkraus, A., and White, E. P.: Continental-scale hyperspectral tree species classification in the United States National Ecological Observatory Network, Remote Sens. Environ., 282, 113264, https://doi.org/10.1016/j.rse.2022.113264, 2022.
Maxwell, A. E., Warner, T. A., and Fang, F.: Implementation of machine-learning classification in remote sensing: An applied review, Int. J. Remote Sens., 39, 2784–2817, https://doi.org/10.1080/01431161.2018.1433343, 2018.
Melnyk, O., Manko, P., and Brunn, A.: Remote sensing methods for estimating tree species of forests in the Volyn region, Ukraine, Front. For. Glob. Chang., 6, 1041882, https://doi.org/10.3389/ffgc.2023.1041882, 2023.
Müller, H., Rufin, P., Griffiths, P., Barros Siqueira, A. J., and Hostert, P.: Mining dense Landsat time series for separating cropland and pasture in a heterogeneous Brazilian savanna landscape, Remote Sens. Environ., 156, 490–499, https://doi.org/10.1016/j.rse.2014.10.014, 2015.
NASA JPL: NASADEM Merged DEM Global 1 arc second V001, NASA EOSDIS Land Processes DAAC [data set], https://doi.org/10.5067/MEaSUREs/NASADEM/NASADEM_HGT.001, 2020
Nasiri, V., Beloiu, M., Asghar, A., Griess, V. C., Maftei, C., and Waser, L. T.: International Journal of Applied Earth Observations and Geoinformation Mapping tree species composition in a Caspian temperate mixed forest based on spectral-temporal metrics and machine learning, Int. J. Appl. Earth Obs., 116, 103154, https://doi.org/10.1016/j.jag.2022.103154, 2023.
Olofsson, P., Foody, G. M., Herold, M., Stehman, S. V., Woodcock, C. E., and Wulder, M. A.: Good practices for estimating area and assessing accuracy of land change, Remote Sens. Environ., 148, 42–57, https://doi.org/10.1016/j.rse.2014.02.015, 2014.
Pazúr, R., Huber, N., Weber, D., Ginzler, C., and Price, B.: A national extent map of cropland and grassland for Switzerland based on Sentinel-2 data, Earth Syst. Sci. Data, 14, 295–305, https://doi.org/10.5194/essd-14-295-2022, 2022.
Persson, M., Lindberg, E., and Reese, H.: Tree Species Classification with Multi-Temporal Sentinel-2 Data, Remote Sens., 10, 1794, https://doi.org/10.3390/rs10111794, 2018.
Praticò, S., Solano, F., Di Fazio, S., and Modica, G.: Machine learning classification of mediterranean forest habitats in google earth engine based on seasonal sentinel-2 time-series and input image composition optimisation, Remote Sens., 13, 1–28, https://doi.org/10.3390/rs13040586, 2021.
Puletti, N., Chianucci, F., and Castaldi, C.: Use of Sentinel-2 for forest classification in Mediterranean environments, Ann. Silvic. Res., 42, 32–38, https://doi.org/10.12899/asr-1463, 2018.
Punalekar, S. M., Planque, C., Lucas, R. M., Evans, D., Correia, V., Owers, C. J., Poslajko, P., Bunting, P., and Chognard, S.: National scale mapping of larch plantations for Wales using the Sentinel-2 data archive, Forest Ecol. Manage., 501, 119679, https://doi.org/10.1016/j.foreco.2021.119679, 2021.
Richardson, D. M. and Rejmánek, M.: Trees and shrubs as invasive alien species – a global review, Divers. Distrib., 17, 788–809, https://doi.org/10.1111/j.1472-4642.2011.00782.x, 2011.
Rüetschi, M., Weber, D., Koch, T. L., Waser, L. T., Small, D., and Ginzler, C.: Countrywide mapping of shrub forest using multi-sensor data and bias correction techniques, Int. J. Appl. Earth Obs., 105, 102613, https://doi.org/10.1016/j.jag.2021.102613, 2021.
Rusňák, T., Halabuk, A., Halada, L., Hilbert, H., and Gerhátová, K.: Detection of Invasive Black Locust (Robinia pseudoacacia) in Small Woody Features Using Spatiotemporal Compositing of Sentinel-2 Data, Remote Sens., 14, 971, https://doi.org/10.3390/rs14040971, 2022.
Schindler, J., Dymond, J. R., Wiser, S. K., and Shepherd, J. D.: Method for national mapping spatial extent of southern beech forest using temporal spectral signatures, Int. J. Appl. Earth Obs., 102, 102408, https://doi.org/10.1016/j.jag.2021.102408, 2021.
Shahbandeh, M., Kaim, D., and Kozak, J.: The Substantial Increase of Forest Cover in Central Poland Following Extensive Land Abandonment: Szydłowiec County Case Study, Remote Sens., 14, 3852, https://doi.org/10.3390/rs14163852, 2022.
Shirazinejad, G., Javad Valadan Zoej, M., and Latifi, H.: Applying multidate Sentinel-2 data for forest-type classification in complex broadleaf forest stands, Forestry, 95, 363–379, https://doi.org/10.1093/forestry/cpac001, 2022.
Skakun, S., Wevers, J., Brockmann, C., Doxani, G., Aleksandrov, M., Batič, M., Frantz, D., Gascon, F., Gómez-Chova, L., Hagolle, O., López-Puigdollers, D., Louis, J., Lubej, M., Mateo-García, G., Osman, J., Peressutti, D., Pflug, B., Puc, J., Richter, R., Roger, J. C., Scaramuzza, P., Vermote, E., Vesel, N., Zupanc, A., and Žust, L.: Cloud Mask Intercomparison eXercise (CMIX): An evaluation of cloud masking algorithms for Landsat 8 and Sentinel-2, Remote Sens. Environ., 274, 112990, https://doi.org/10.1016/j.rse.2022.112990, 2022.
Somodi, I., Čarni, A., Ribeiro, D., and Podobnikar, T.: Recognition of the invasive species Robinia pseudacacia from combined remote sensing and GIS sources, Biol. Conserv., 150, 59–67, https://doi.org/10.1016/j.biocon.2012.02.014, 2012.
Tamiminia, H., Salehi, B., Mahdianpari, M., Quackenbush, L., Adeli, S., and Brisco, B.: Google Earth Engine for geo-big data applications: A meta-analysis and systematic review, ISPRS J. Photogramm., 164, 152–170, https://doi.org/10.1016/j.isprsjprs.2020.04.001, 2020.
Tomaś, Ł. and Jagodziński, A. M.: Przebudowa drzewostanów, Mag. Pol. Akad. Nauk, 3–4, 94–97, 2019.
Turlej, K., Ozdogan, M., and Radeloff, V. C.: Mapping forest types over large areas with Landsat imagery partially affected by clouds and SLC gaps, Int. J. Appl. Earth Obs., 107, 102689, https://doi.org/10.1016/j.jag.2022.102689, 2022.
Walthert, L. and Meier, E. S.: Tree species distribution in temperate forests is more influenced by soil than by climate, Ecol. Evol., 7, 9473–9484, https://doi.org/10.1002/ece3.3436, 2017.
Waser, L. T., Rüetschi, M., Psomas, A., Small, D., and Rehush, N.: Mapping dominant leaf type based on combined Sentinel-1/-2 data – Challenges for mountainous countries, ISPRS J. Photogramm., 180, 209–226, https://doi.org/10.1016/j.isprsjprs.2021.08.017, 2021.
Welle, T., Aschenbrenner, L., Kuonath, K., Kirmaier, S., and Franke, J.: Mapping Dominant Tree Species of German Forests, Remote Sens., 14, 3330, https://doi.org/10.3390/rs14143330, 2022.
Wessel, M., Brandmeier, M., and Tiede, D.: Evaluation of different machine learning algorithms for scalable classification of tree types and tree species based on Sentinel-2 data, Remote Sens., 10, 1419, https://doi.org/10.3390/rs10091419, 2018.
Ye, N., Morgenroth, J., Xu, C., and Chen, N.: Indigenous forest classification in New Zealand – A comparison of classifiers and sensors, Int. J. Appl. Earth Obs., 102, 102395, https://doi.org/10.1016/j.jag.2021.102395, 2021.
Zajączkowski, G., Jabłoński, M., Jabłoński, T., Sikora, K., Kowalska, A., Małachowska, J., and Piwnicki, J.: Raport o stanie lasów w Polsce 2021, 1–23, ISSN 1641–3229, 2022.
Zanaga, D., Van De Kerchove, R., Daems, D., De Keersmaecker, W., Brockmann, C., Kirches, G., Wevers, J., Cartus, O., Santoro, M., Fritz, S., Lesiv, M., Herold, M., Tsendbazar, N.-E., Xu, P., Ramoino, F., and Arino, O.: ESA WorldCover 10 m 2021 v200, Zenodo [data set], https://doi.org/https://doi.org/10.5281/zenodo.7254221, 2022.
Zeug, G., Geltendorf, T., Immitzer, M., and Atzberger, C.: Machbarkeitsstudie zur Nutzung von Satellitenfernerkundungsdaten (Copernicus) für Zwecke der Ableitung ökologischer Belastungsgrenzen und der Verifizierung von Indikatoren der Deutschen Anpassungsstrategie an den Klimawandel, ISSN 1862-4804, 2019.
Zgłobicki, W., Karczmarczuk, K., and Baran-Zgłobicka, B.: Intensity and driving forces of land abandonment in eastern Poland, Appl. Sci., 10, 3500, https://doi.org/10.3390/app10103500, 2020.