the Creative Commons Attribution 4.0 License.
the Creative Commons Attribution 4.0 License.
 | 22 May 2024
High-resolution mapping of monthly industrial water withdrawal in China from 1965 to 2020
Chengcheng Hou
Shan Sang
Xu Zhao
Yanxu Liu
Yinglu Liu
Fang Zhao
High-quality gridded data on industrial water use are vital for research and water resource management. However, such data in China usually have low accuracy. In this study, we developed a gridded dataset of monthly industrial water withdrawal (IWW) for China, which is called the China Industrial Water Withdrawal (CIWW) dataset; this dataset spans a 56-year period from 1965 to 2020 at spatial resolutions of 0.1 and 0.25°. We utilized > 400 000 records of industrial enterprises, monthly industrial product output data, and continuous statistical IWW records from 1965 to 2020 to facilitate spatial scaling, seasonal allocation, and long-term temporal coverage in developing the dataset. Our CIWW dataset is a significant improvement in comparison to previous data for the characterization of the spatial and seasonal patterns of the IWW dynamics in China and achieves better consistency with statistical records at the local scale. The CIWW dataset, together with its methodology and auxiliary data, will be useful for water resource management and hydrological models. This new dataset is now available at https://doi.org/10.6084/m9.figshare.21901074 (Hou and Li, 2023).
- Article
(6331 KB) - Full-text XML
-
Supplement
(1664 KB) - BibTeX
- EndNote


Industrial water withdrawal (IWW) is the amount of water abstracted from freshwater sources for industrial purposes, which is different from water consumption. IWW accounts for approximately 19 % of human water withdrawal globally and is the second largest sector of human water use, following irrigation (WWAP, 2019). In developed countries, IWW accounts for more than half of the water use (Shen et al., 2010; Wada et al., 2011a; Flörke et al., 2013). Driven by economic and population growth, global IWW has steadily increased over the past 60 years (Oki and Kanae, 2006; Wada et al., 2011b) from 400 km3 yr−1 in 1960 to 955 km3 yr−1 in 2010 (Flörke et al., 2013), and it is projected to continue to increase in the future (Oki et al., 2003; Shen et al., 2010; Fujimori et al., 2017). Considering the high spatial heterogeneity and fast changes in IWW, quantitative information with a high spatiotemporal resolution on IWW is essential for water resource management and research.
Existing IWW datasets primarily consist of statistical data at the administrative/watershed levels and model estimations at the grid level, in which the sectoral information is represented with varying degrees of complexity (Arnell, 1999, 2004; Alcamo et al., 2000, 2007; Vörösmarty et al., 2000; Oki et al., 2003; Hanasaki et al., 2008a; Otaki et al., 2008; Wada et al., 2011b; Hejazi et al., 2014; Wada et al., 2016; Yan et al., 2022). Gridded datasets developed from administrative-level data or models provide more detailed spatial information (Hanasaki et al., 2008a; Wada et al., 2011a); however, their accuracy depends on the spatial downscaling methods, including the spatial proxies and data sources.
For the total IWW, statistical data are usually allocated to the grid level relying on the spatial proxies, such as population density and urban or industrial area (Hanasaki et al., 2008a, b, 2010; Van Beek et al., 2011; Wada et al., 2011a, b, 2014). For the sectoral IWW, different mapping methods are applied. For the energy sector, water withdrawal was estimated by the total energy generated and water use efficiency under different technologies (Koch and Vögele, 2009; Flörke et al., 2013). With detailed information on the location, power output, and water use efficiency of power plants, water withdrawal for the energy sector could be mapped out (Vassolo and Döll, 2005; Flörke et al., 2013; Müller Schmied et al., 2014; Wang et al., 2016; Qin et al., 2019). For manufacturing, water withdrawal was estimated to be either the residue of the energy water use from the total IWW downscaled using the spatial proxies mentioned above (Hejazi et al., 2014) or the product of population and per capita water consumption (Vörösmarty et al., 2000). Although several global gridded IWW datasets have been developed, the spatial proxies used for downscaling (e.g. population) are only indirect factors that are not directly tied to industrial production processes that consume water, and they cannot be used to separate the different industrial subsectors whose water use efficiencies could be substantially different (0.32×10³ of paper and paper products versus 5.6×10³ of electrical equipment and machinery in units of CNY per cubic metre). Moreover, when downscaling, the global gridded datasets typically rely on the national statistical data (Hejazi et al., 2014; WaterGAP model 2.2 as per Wada et al., 2016; Huang et al., 2018) without incorporating subnational statistics to better capture the regional differences. Therefore, global datasets are sufficient in showing the global general pattern, but their performance could be poor for the specific regions, limiting their applications for regional water issues (Liu et al., 2019b).
More importantly, IWW has seasonal fluctuations because of changes in weather conditions (temperature, precipitation, and thunderstorms), water supply availability (especially in monsoon climates, such as in China), production demand, and emission restrictions (Liu et al., 2006). However, most existing datasets do not represent seasonal variations (only annual data) or treat it as monthly invariant (i.e. each month shares of the annual total withdrawal) (Brunner et al., 2019; Wada et al., 2011a). The lack of representation of intra-annual variations may result in significant discrepancies between the data and reality. A few studies consider seasonal variations in industrial water withdrawal for specific sectors. For example, seasonality in IWW for electricity generation is estimated by incorporating the influence of temperature variability on the electricity demand of thermoelectric power plants (Byers et al., 2014; Liu et al., 2015). The included climate variations introduce a clear seasonal pattern, with large withdrawals in winter at high latitudes and summer in tropical regions (Huang et al., 2018). Therefore, it is essential to fully account for intra-annual variations in IWW, which directly affect water resource management and allocation (Derepasko et al., 2021; Sunkara and Singh, 2022).
After decades of fast growth, China has become the second-largest economy in the world, with rapid industrial development leading to increasing water use (Zhou et al., 2020). IWW in China accounted for 20.2 % of the total water withdrawal in 2019 (as reported by the China Water Resources Bulletin; Ministry of Water Resources of the People’s Republic of China, 2019) and increased 4.5 times, from 31.93 km3 in 1965 to 142.86 km3 in 2013 (Zhou et al., 2020). However, water resources in China are distributed unevenly in space, causing severe water stress due to a mismatch between the water supply and demand of the population and industrial development (Liu et al., 2013; Zhao et al., 2015). For instance, northern China is one of China's largest industrial centres and most densely populated regions, but it is experiencing the most severe water scarcity in the world (Yin et al., 2020). The changes in IWW and total water withdrawal have further increased the water conflict, making it urgent to optimize the current water use and management structure. Therefore, high-quality gridded IWW data for China are needed to characterize the spatial–temporal pattern of IWW for water management and for research on hydrological processes and modelling (Addor et al., 2020). However, IWW data produced from reliable data sources with a long period and high spatial resolution in China are still lacking. The publicly available data on IWW in China are either the statistical data at the provincial, prefecture, and basin level (Xia et al., 2017; Qin et al., 2020; Chen et al., 2021) or the gridded data extracted from the global datasets that have low accuracy for regional and local studies (Liu et al., 2019a, b; Han et al., 2019; Niva et al., 2020; Yin et al., 2020; Li et al., 2022).
To address this data gap, in our study, we used reliable local data sources to develop gridded datasets of monthly IWW in China with a high spatial resolution, while incorporating seasonal variations. Using multiple statistical data sources, the high-resolution mapping of IWW was achieved by a unique industrial enterprise dataset including > 400 000 enterprises, the seasonal variations were derived from the industrial product output data, and the long-term temporal coverage was obtained by the continuous statistical records from 1965 to 2020. The resulting dataset, named the China Industrial Water Withdrawal (CIWW) dataset, provides monthly IWW from 1965 to 2020 at spatial resolutions of 0.1 and 0.25°. The dataset, along with its auxiliary data, is useful to better understand the spatial and seasonal variations in IWW in China and support hydrological studies and regional water resource management.
2.1 Data
2.1.1 Statistical data for the industrial output value and water withdrawal
The provincial-level industrial output value (IOV; multiplied by 103 and in units of CNY per year) and IWW were from the China Economic Census Yearbook in 2008 (http://www.stats.gov.cn/sj/pcsj/jjpc/2jp/indexch.htm, last access: 2 April 2021). The data included surveyed IOV and IWW for enterprises above a designated production level (annual production > CNY 5 million), consisting of three main industrial sectors (mining; manufacturing; and production and supply of electricity, gas and water) and 38 subsectors (Table A1). Note that two subsectors, Other mining and Waste resources and material recycling and processing, contained no data, and the average values of the IOV and IWW of the mining and manufacturing sectors in each province were used to fill these two subsectors.
2.1.2 Industrial enterprise data in China
The industrial enterprise dataset used in this study was from the Chinese Industrial Enterprises database in mainland China from 1998 to 2013 (https://www.lib.pku.edu.cn/portal/cn/news/0000001637, last access: 18 May 2022). The dataset contains surveyed industrial information, including the address, products, annual IOV, and industrial category, for more than 400 000 enterprises whose annual IOV was more than CNY 5 million (or CNY 20 million from 2011 to 2013 due to standard changes). The dataset covers 3 main industrial sectors and 37 subsectors similarly to the provincial data in Sect. 2.1.1. The enterprises' records for the subsector of Water production and supply were not used because the water supply was mainly for domestic rather than industrial purposes. To match the IWW survey data, which were only available in 2008 (the economic censuses in other years do not include detailed provincial IWW by subsector), industrial enterprise data in 2008 were selected for spatial downscaling of the provincial IWW (Fig. S1 in the Supplement).
2.1.3 Statistical data for the monthly industrial product output
The monthly industrial product output data were from the China Industrial Product Output database (http://olap.epsnet.com.cn, last access: 26 September 2021). The data contain monthly outputs of 283 specific products of 36 industrial subsectors at the provincial level. We used the average of 5 years, from 2006–2010, to reduce interannual variability in outputs. The monthly outputs of each product were converted to monthly fractions (divided by the annual total output) to represent their intra-annual variation. Missing values in monthly product output fractions were filled by the average value of monthly fractions of product output from 2006 to 2010. The monthly output fractions of 283 products were aggregated to 36 subsectors by averaging products within each subsector by the arithmetic mean.
2.1.4 Statistical data of industrial water withdrawal for long-term extension
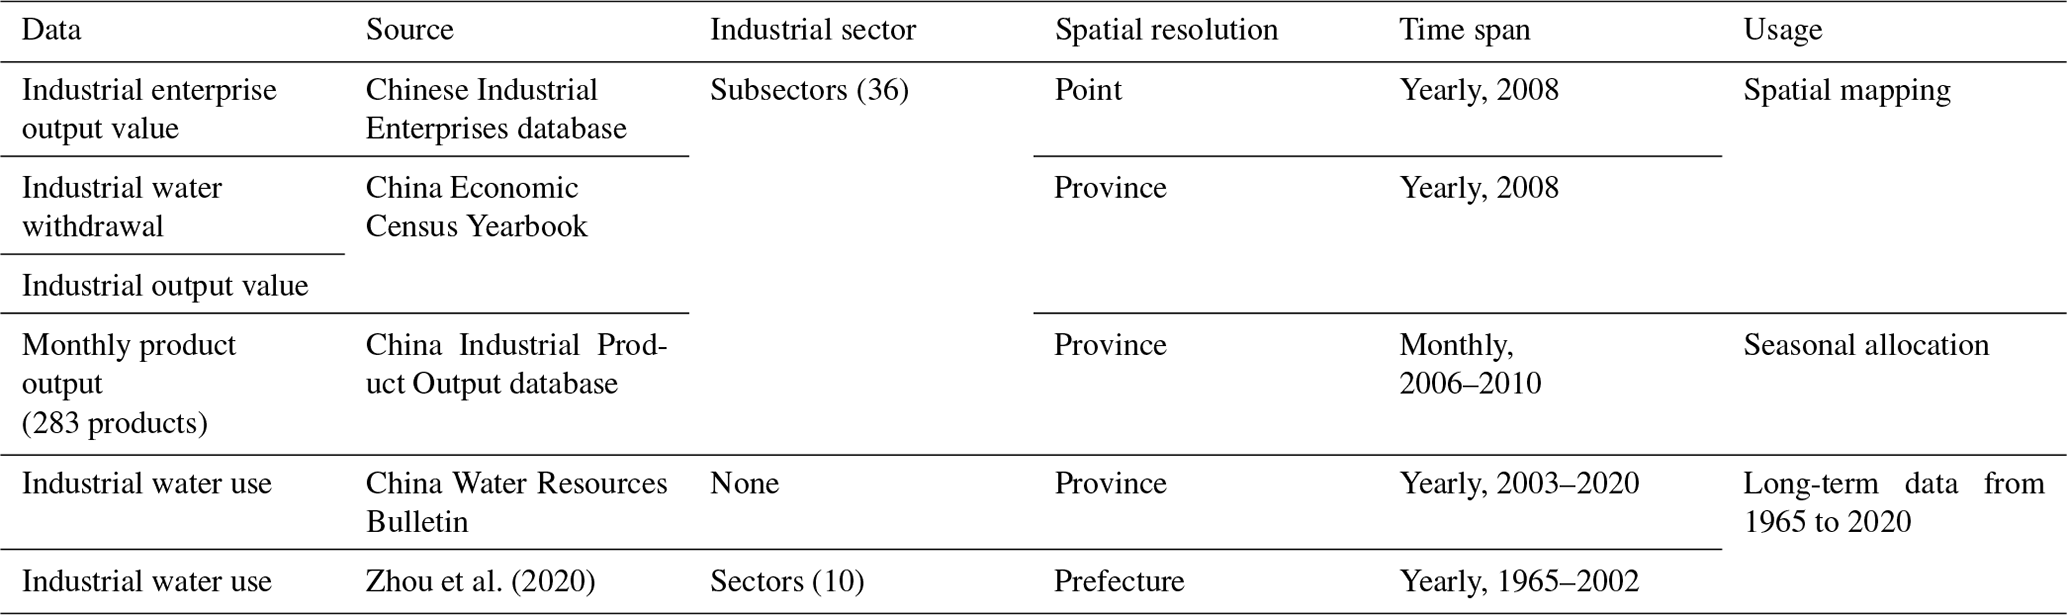
Long-term statistical IWW data were required to produce IWW data for the past 4 decades. Provincial surveyed IWW statistical data of 2003 to 2020 were obtained from the China Water Resources Bulletin (http://www.mwr.gov.cn/sj/tjgb/szygb/, last access: 3 May 2022). IWW is defined in the China Water Resources Bulletin as the annual amount of water withdrawal for industrial production activities, including primary production, auxiliary production, and ancillary production and excluding recycled water. To further extend the time series to an earlier period, the IWW from 1965 to 2002 reported by Zhou et al. (2020) (referred to as “Zhou2020 data” hereafter), was used after summing the prefecture data to form the provincial-level data. The IWW record was from multiple versions of water resources survey data (first and second National Water Resources Assessment Programme) and defined the same way as in the China Water Resource Bulletin and our study. The national IWW between two sources (Zhou2020 data and China Water Resources Bulletin) was almost identical in 2003 (117.72 vs. 118.86 in units of km3; Fig. S2) but started to diverge afterwards. To ensure data continuity, we opted for the China Water Resources Bulletin starting from 2003 as a statistical data source because it has been updated continuously since then. Thus, the combination of the above two data sources provided complete and continuous statistical records of IWW from 1965 to 2020 in China. Table 1 provides a summary of the data sources used for developing the CIWW dataset.
Table 1A summary of data sources for developing the CIWW dataset.
2.1.5 Other industrial water withdrawal data for comparison
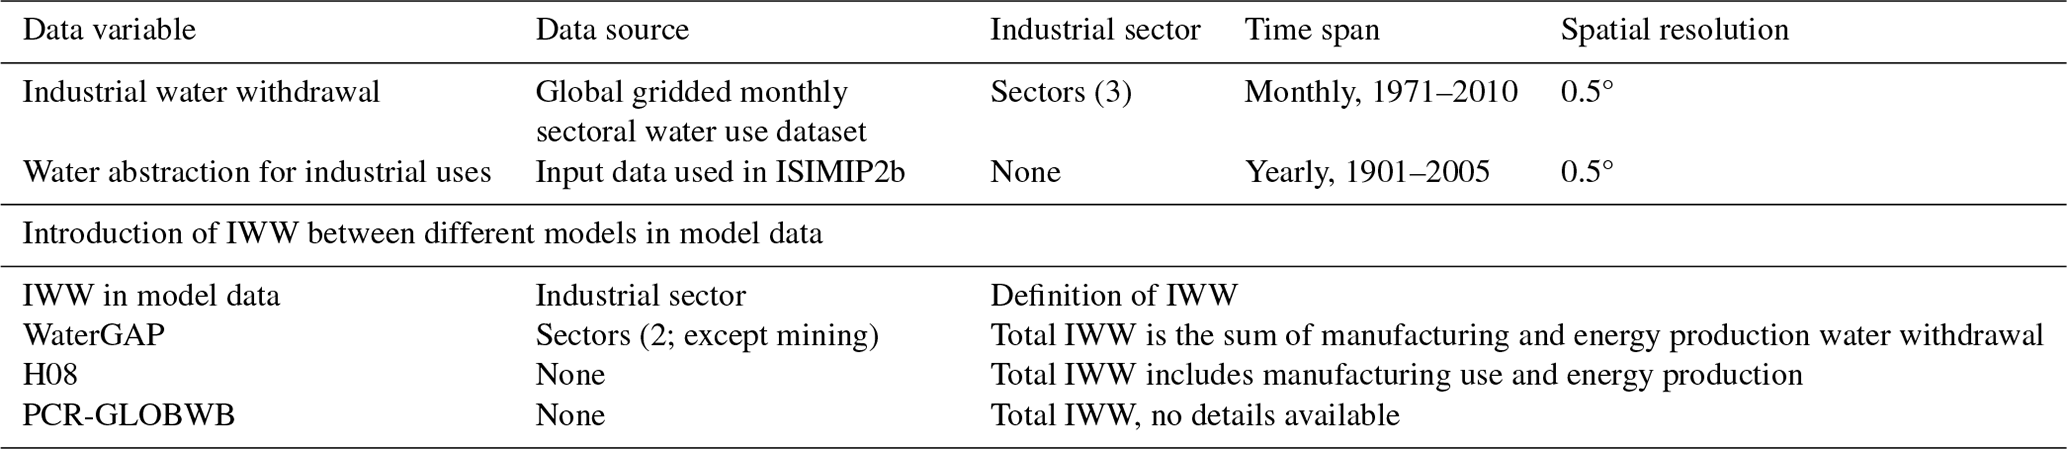
We used two other gridded IWW datasets to compare with the CIWW dataset: the global gridded monthly sectoral water use dataset for 1971–2010 at 0.5° (Huang et al., 2018) (hereafter referred to as Huang data) and water abstraction for industrial uses from 1901 to 2005 at 0.5° as the input data for ISIMIP2b (hereafter referred to as model data). The IWW from Huang data consists of three sectors: mining, manufacturing, and cooling of thermal power plants, and the sum of the three sectors was treated as the total IWW. The IWW from model data is the multi-model mean (WaterGAP, PCR-GLOBWB, and H08). The sum of sectoral IWWs (if available) was treated as the total IWW (Wada et al., 2016). The unit of IWWs was converted from m3 to millimetres by dividing the grid cell area. Table B2 provides a summary of the data description used for comparison.
2.2 Methods
The development of the CIWW dataset primarily consisted of three steps: (1) mapping the provincial IWW data to the grid scale, (2) allocating annual IWW data to the monthly scale, and (3) producing long time series of IWW (Fig. 1).
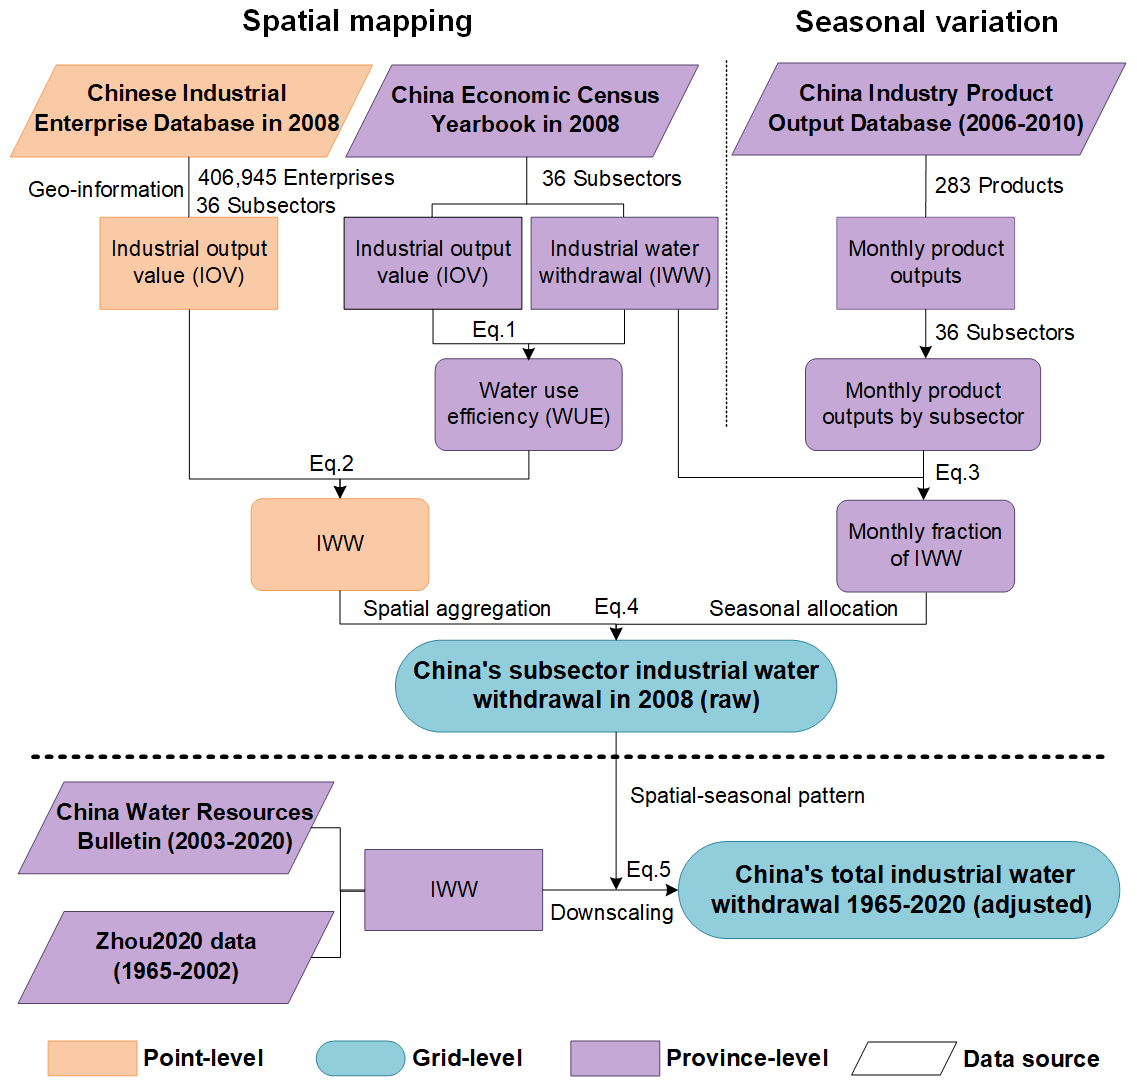
2.2.1 Mapping industrial water withdrawal
The spatial mapping of IWW in China was achieved using the IOV of > 400 000 enterprises in 2008 and the subsectoral water use efficiency at the provincial level from the Chinese Economic Census Yearbook in 2008.
The geographical location of industrial enterprises was obtained by converting their addresses to geographical coordinates by the BaiduV3 geocoding service with the geopy package in Python. The industrial water use efficiency (WUEp,subs) of the province (p) and subsectors (subs) was computed as the industrial output value (IOVp,subs) divided by the industrial water withdrawal (IWWp,subs) (Eq. 1).
By assuming the same industrial water use efficiency for all industrial enterprises in a province of a subsector, the industrial water withdrawal (IWWi,subs) of an enterprise (i) belonging to the subsector (subs) was estimated by multiplying the corresponding water use efficiency of the subsector (subs) in a province (p; WUEp,subs) and the industrial output value of an enterprise (i; IOVi,subs), as shown in Eq. (2).
The IWWs of the enterprises of specific subsectors (IWWi,subs) could be summed up from the point level to the grid level at a given spatial resolution (IWWgrid,subs). The summation of the subsectors ( provided the spatial pattern of the total IWW in 2008.
2.2.2 Allocating industrial water withdrawal to seasonal variations
We assumed that the monthly IWW was proportional to the industrial product output and that there was no seasonal variation in water use efficiency during the year. Therefore, seasonal variations in IWW could be approximated by the monthly industrial product output, which was calculated as the fraction of the monthly product output to the annual total output. The seasonal pattern included signals of variations in climate and weather because the industrial product output for some sectors could be affected by seasonal climate conditions and extreme weather events (e.g. production shutdowns or restrictions due to heatwaves, thunderstorms, and torrential rains). Since the climate-change-induced seasonality changes were slow and gradual, their influences on monthly IWW were also low, and the long-term climate change impacts (e.g. warming) could be captured by the yearly statistical IWW data.
Since the monthly industrial product output data included 283 different products of different subsectors and the number of products varied across subsectors, we initially calculated the monthly fraction of each product output of each province, averaged from 2006 to 2010, to reduce the influence of interannual variability. Because the amount of industrial water used for producing different products is unknown, we simply used the arithmetic mean of the monthly fractions of the different products belonging to a subsector to represent aggregated monthly fractions for that subsector. In this way, we obtained the fractions of the product outputs for a subsector (subs) in a province (p) for a month (mon; ).
Although provincial differences exist in the seasonality of IWW, we found that in certain subsectors and provinces exhibited unreasonable seasonal variations that were difficult to explain (Fig. S3). Instead of directly using the provincial-specific seasonal variations in the output, the seasonal variations in each industrial subsector () were represented by the weighted mean of monthly product fractions across all provinces (), with weights of provincial subsector IWW (IWWp,subs) from the Chinese Economic Census Yearbook in 2008 (Eq. 3). The only exception is for the Electricity and heating power production and supply (EPS) subsector because its seasonality is strongly linked to seasonal temperature variation in each province and may thus exhibit regional differences. To account for this issue, we used the k-means method and classified the seasonality of EPS into three types, which broadly correspond to north China (type 1), south and northwest China (type 2), and Xizang (type 3) (Fig. S4). Shanghai in particular was manually adjusted from the originally classified type 1 to type 2 because of its strong peak in JJA.
Therefore, the monthly IWW of the different subsectors at the grid level () could be obtained by allocating its annual IWW (IWWgrid,subs) into 12 months based on the corresponding monthly fractions of the same subsector () as Eq. (4).
The monthly IWW at the grid level (IWWgrid,mon) after summing subsectors ( provided the spatial and seasonal pattern of the total IWW of China in 2008.
2.2.3 Developing China's industrial water withdrawal data from 1965 to 2020
We developed long-term IWW data in China from 1965 to 2020 by mapping provincial IWW statistics based on the spatial–seasonal pattern derived from IWW in 2008. Due to the different statistical calibers of the data sources, the raw IWW from the 2008 Chinese Economic Census Yearbook was not directly used in the long-term IWW data. Instead, its spatial–seasonal distribution was used to map the provincial industrial water withdrawal (IWWp) from the China Water Resources Bulletin between 2003 and 2020 and the Zhou2020 data between 1965 and 2002. These two IWW records were combined to develop the long-term data. The provincial industrial water withdrawal (IWWp) of each year was allocated to the grid level following Eq. (5) to obtain the gridded IWW data from 1965 to 2020 ():
where was the adjusted IWW (to match IWWp) of month mon at the grid level, was the monthly IWW at the grid level in 2008, and summed the monthly gridded to form the annual total IWW of all grids in a province (p), representing the fraction of grid-to-provincial total IWW.
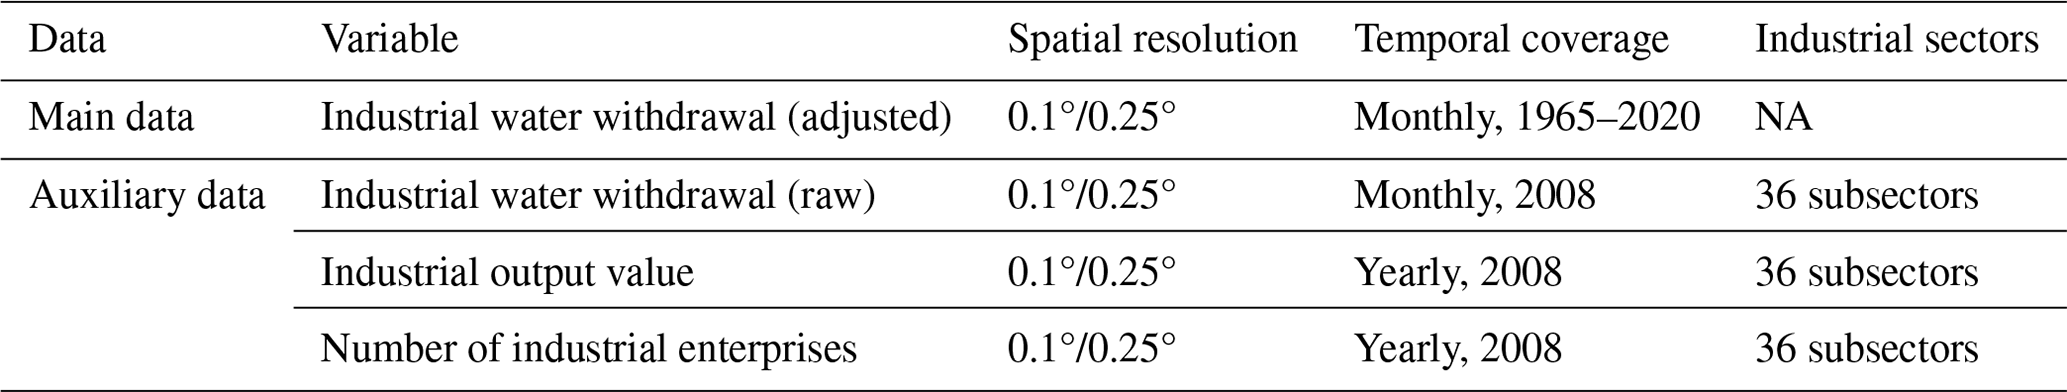
Table 2 provides an overview of the CIWW dataset, including the gridded monthly IWW data in China from January 1965 to December 2020 with spatial resolutions of 0.1 and 0.25° and auxiliary data supporting the development.
Table 2Overview of the China Industrial Water Withdrawal (CIWW) dataset (available at https://doi.org/10.6084/m9.figshare.21901074; Hou and Li, 2023). NA – not available
2.3 Data validation and comparison with other datasets
To validate the CIWW dataset, we compared the spatial and seasonal patterns with statistical data records and other datasets. For spatial validation, the 35-year mean IWW (1971–2005) from CIWW, global gridded data (Huang et al., 2018), and model data (ISIMIP2b input data) were compared with the Zhou2020 data (treated as truth) (Zhou et al., 2020) for 341 prefectures in China. Although we used the provincial-level Zhou2020 data in the spatial mapping, the prefectural-level data were unused in developing CIWW but intentionally left only for validation purposes. The provincial- and prefectural-level IWW are not completely independent (each province consists of many prefectures); however, the intra-provincial variations reflected in prefectural IWW are not captured by the provincial IWW. In the absence of additional validation data, the prefectural IWW can support the validation and determine the effectiveness of spatial patterns after downscaling. All gridded data were averaged over each prefecture using the zonal statistics function of the rasterstats package (with the all-touched option enabled) in Python and then multiplied by the prefecture area to obtain IWW for each prefecture (in units of km3). The results in Fig. 2a indicate a superior performance of CIWW data in representing the spatial variations in IWW compared with Huang data and model data due to its much higher correlation (0.75, 0.43, and 0.54) and lower root mean square error (RMSE) (0.28, 0.38, and 0.38 km3). Additionally, when comparing CIWW at higher resolutions (0.25 and 0.1°), the consistency with the Zhou2020 data improved further, with a similar or higher correlation (0.74 and 0.79, respectively) than the 0.5° data. This result demonstrated the benefit of an increased spatial resolution in characterizing the IWW at smaller scales.
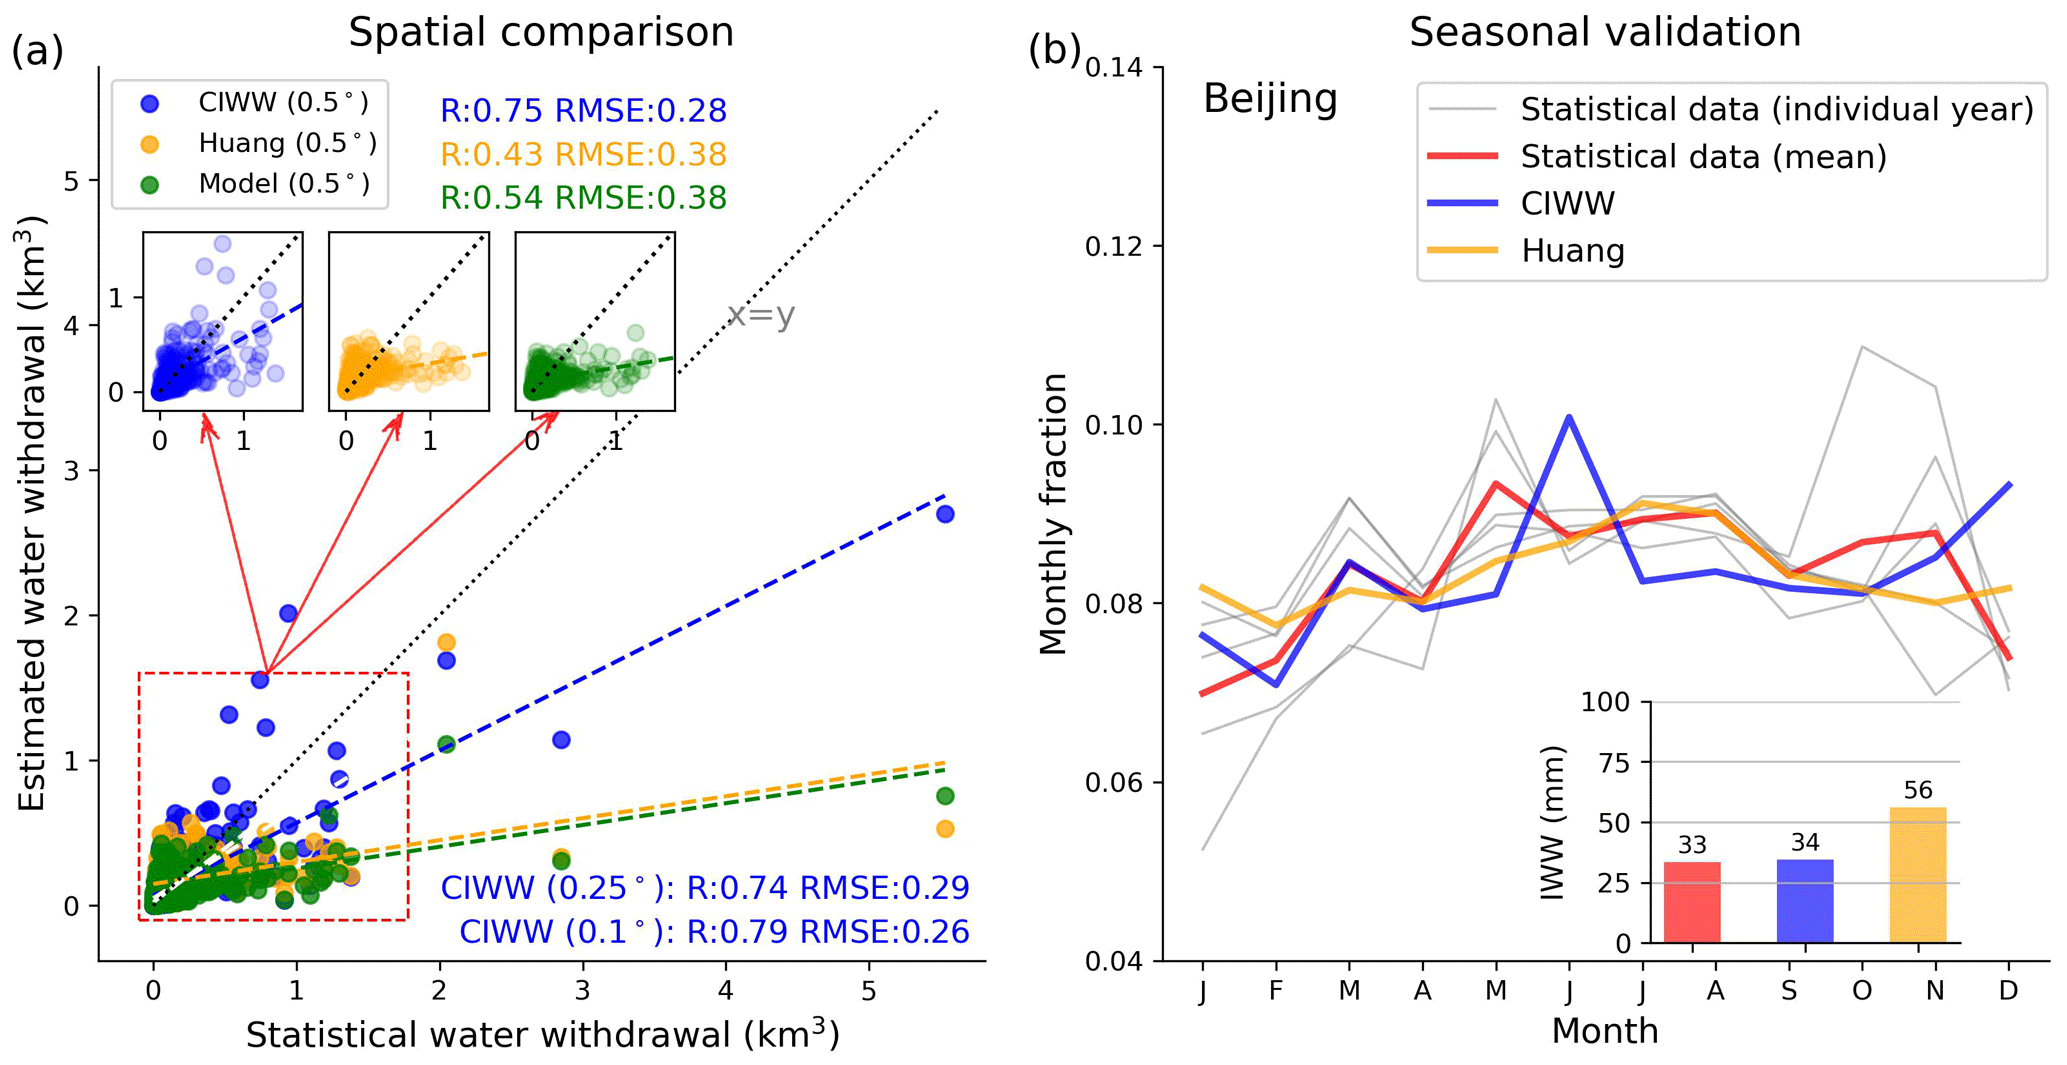
Figure 2Validation of the CIWW data against the statistical data for spatial distribution and seasonal variation. (a) Relationship between the mean IWW of 1971–2005 from the Zhou2020 data (Zhou et al., 2020) and CIWW, Huang data (Huang et al., 2018), and the model data (ISIMIP2b input data) for 341 prefectures in China. The dotted black line indicates the 1 : 1 line and the dashed coloured lines indicate the fitted lines. For this comparison, CIWW is processed to the same spatial resolution of the Huang data and the model data at 0.5° before aggregating to the prefecture level. Comparison results with CIWW at other resolutions (0.25 and 0.1°) are reported in R and RMSE. (b) Comparison of the 5-year mean (2006–2010) monthly variation in IWW from the surveyed data (red; Long et al., 2020), CIWW (blue), and Huang data (orange) in Beijing. The solid grey line shows IWW for individual years from 2006 to 2010. The inset shows the annual mean total IWW from 2006 to 2010.
For seasonal validation, owing to the data limitation, we only had monthly surveyed statistical IWW data in Beijing from 2006 to 2010 (Long et al., 2020). The results showed that both the CIWW and the Huang data could capture the 5-year mean seasonality of IWW in Beijing (Fig. 2b). However, the magnitude of IWW was significantly overestimated by the Huang data (56 mm yr−1) relative to the surveyed statistical data (33 mm yr−1). In comparison, the magnitude of IWW in the CIWW data (34 mm yr−1) was more in line with the surveyed statistical data (Fig. 2b). The slight deviation of CIWW from statistical data in certain months (e.g. December) reflects the imperfect capability of applying national seasonality to characterize local variations in Beijing. These validations demonstrated better performances of CIWW data with much higher accuracy and improved representations of the spatial and seasonal variations; thus, CIWW could be a preferable data source for IWW-related applications in China.
3.1 Spatial distribution of industrial water withdrawal in China
There was substantial spatial variation in the total IWW according to the 2008 data (Fig. 3a). The eastern coastal area of China had a generally higher IWW, followed by southeastern and central China, and the lowest IWW occurred in western China. The largest water withdrawal was found in the urban agglomeration of the Yangtze River Delta and Pearl River Delta. The spatial distribution of IWW over the country indicated that industry enterprises were primarily concentrated in urban areas with more intensified economic activities.
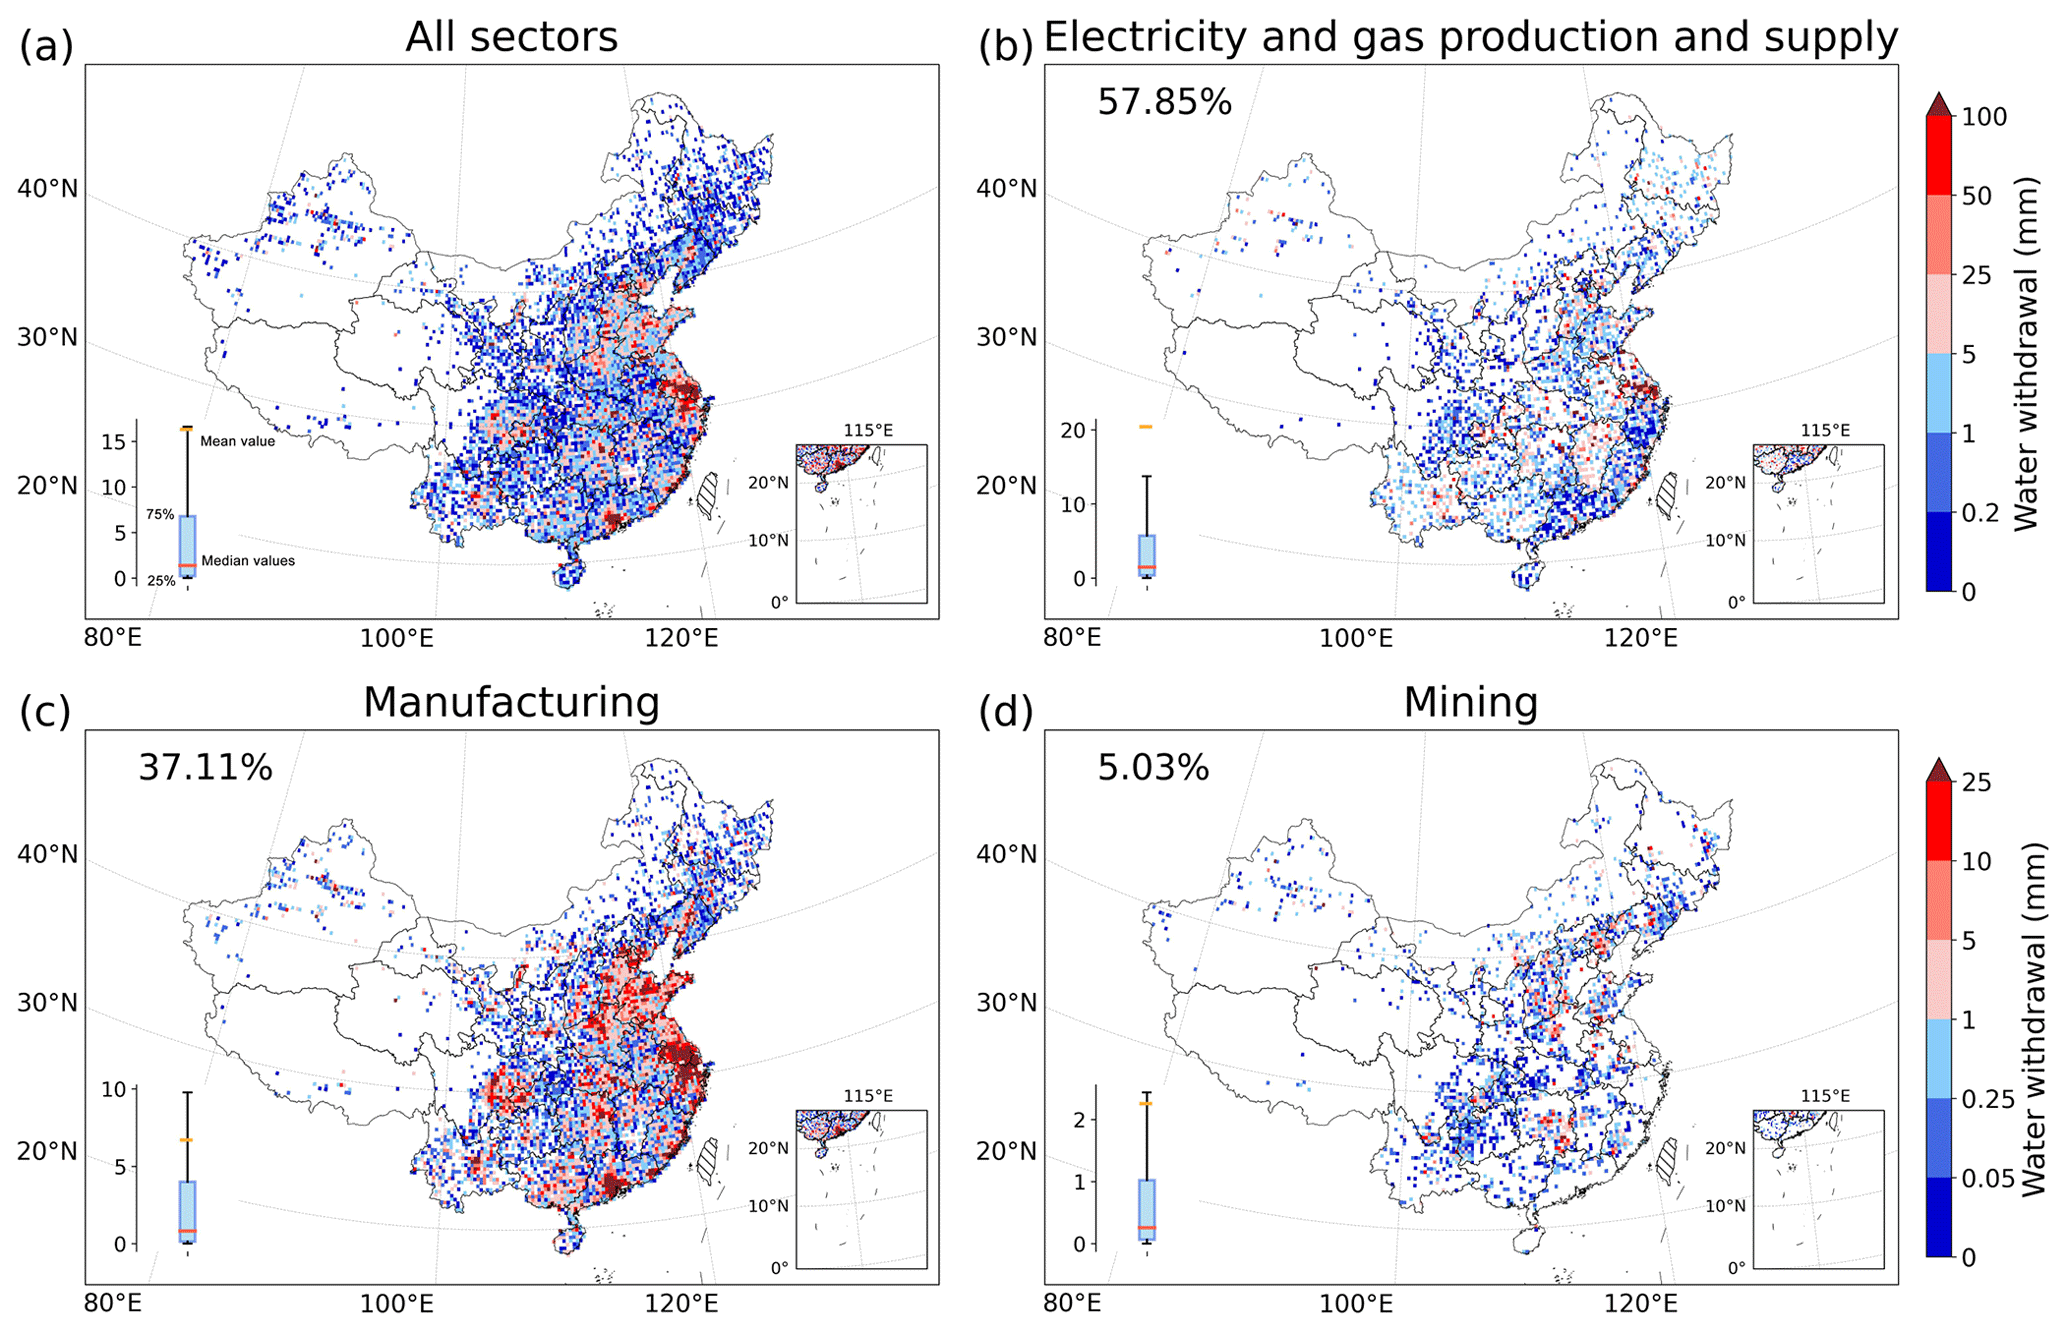
Figure 3Total IWW (raw) in China at 0.25° in 2008 (a) and for different industrial sectors, including electricity and gas production and supply (EGPS; b), manufacturing (c), and mining (d). The box plot in the bottom-left corner shows the interquartile range (25 % and 75 %) of nonzero water withdrawal, with the red and yellow lines denoting the median and mean values, respectively. The numbers displayed as percentages denote the percentage of the sectoral IWW to the total IWW. Publisher's remark: please note that the above figure contains disputed territories.
The water withdrawal by the main industrial sectors showed distinctive spatial patterns. Water withdrawal from Electricity and gas production and supply (EGPS) showed a dispersive pattern that was mainly concentrated in southeastern coastal areas, especially in the Yangtze River Delta region (Fig. 3b). Water withdrawal from manufacturing broadly reflected the total IWW and population distribution of China because of the close linkage between manufacturing and population (Figs. 3c and S5). The water withdrawal in mining was confined to regions with rich mineral resources, such as central, northern, and southwestern China (Fig. 3d). Overall, the industrial sector with the largest IWW was EGPS (57.85 %) followed by manufacturing (37.11 %) and mining (5.03 %). The dominance of the EGPS sector in the total IWW reflected the large water requirement for thermoelectric power generation (Gu et al., 2016; Niva et al., 2020).
3.2 Seasonal variations in industrial water withdrawal in China
The seasonal variations in IWW during 2006–2010, represented by the fraction of the monthly water withdrawal to the annual total, are shown in Fig. 4. The results indicated that the IWW peaked in summer (June to August; 28 %), followed by autumn (September to November; 25 %), spring (March to May; 24 %), and winter (December to February; 23 %) (Fig. 4). February was the month with the lowest IWW, possibly due to it being shorter and coinciding with the Chinese Spring Festival (Liu et al., 2006). The highest IWW occurred in June, potentially due to the industrial output being the largest and the high demand for cooling. This IWW peak did not extend to other summer months because extreme weather events, such as heatwaves and heavy rain, occurred more frequently in July and August, which could result in production shutdowns and reduced water consumption (Liu et al., 2006).
Seasonal patterns of IWW for the manufacturing and mining sectors were generally similar, but the subsectors of manufacturing showed more diverse patterns. The IWW for the EGPS had quite a different seasonality as there were two peaks, one from June to August and the other in December (Fig. 4b); these peaks were likely caused by the seasonal changes in cooling water withdrawal for thermal electricity generation due to seasonal temperature variation. The summer peak of EGPS was related to the high energy demand for air-conditioning cooling (Huang et al., 2018), and the winter peak was related to the high energy demand for heating (Byers et al., 2014; Liu et al., 2015; Huang et al., 2018).
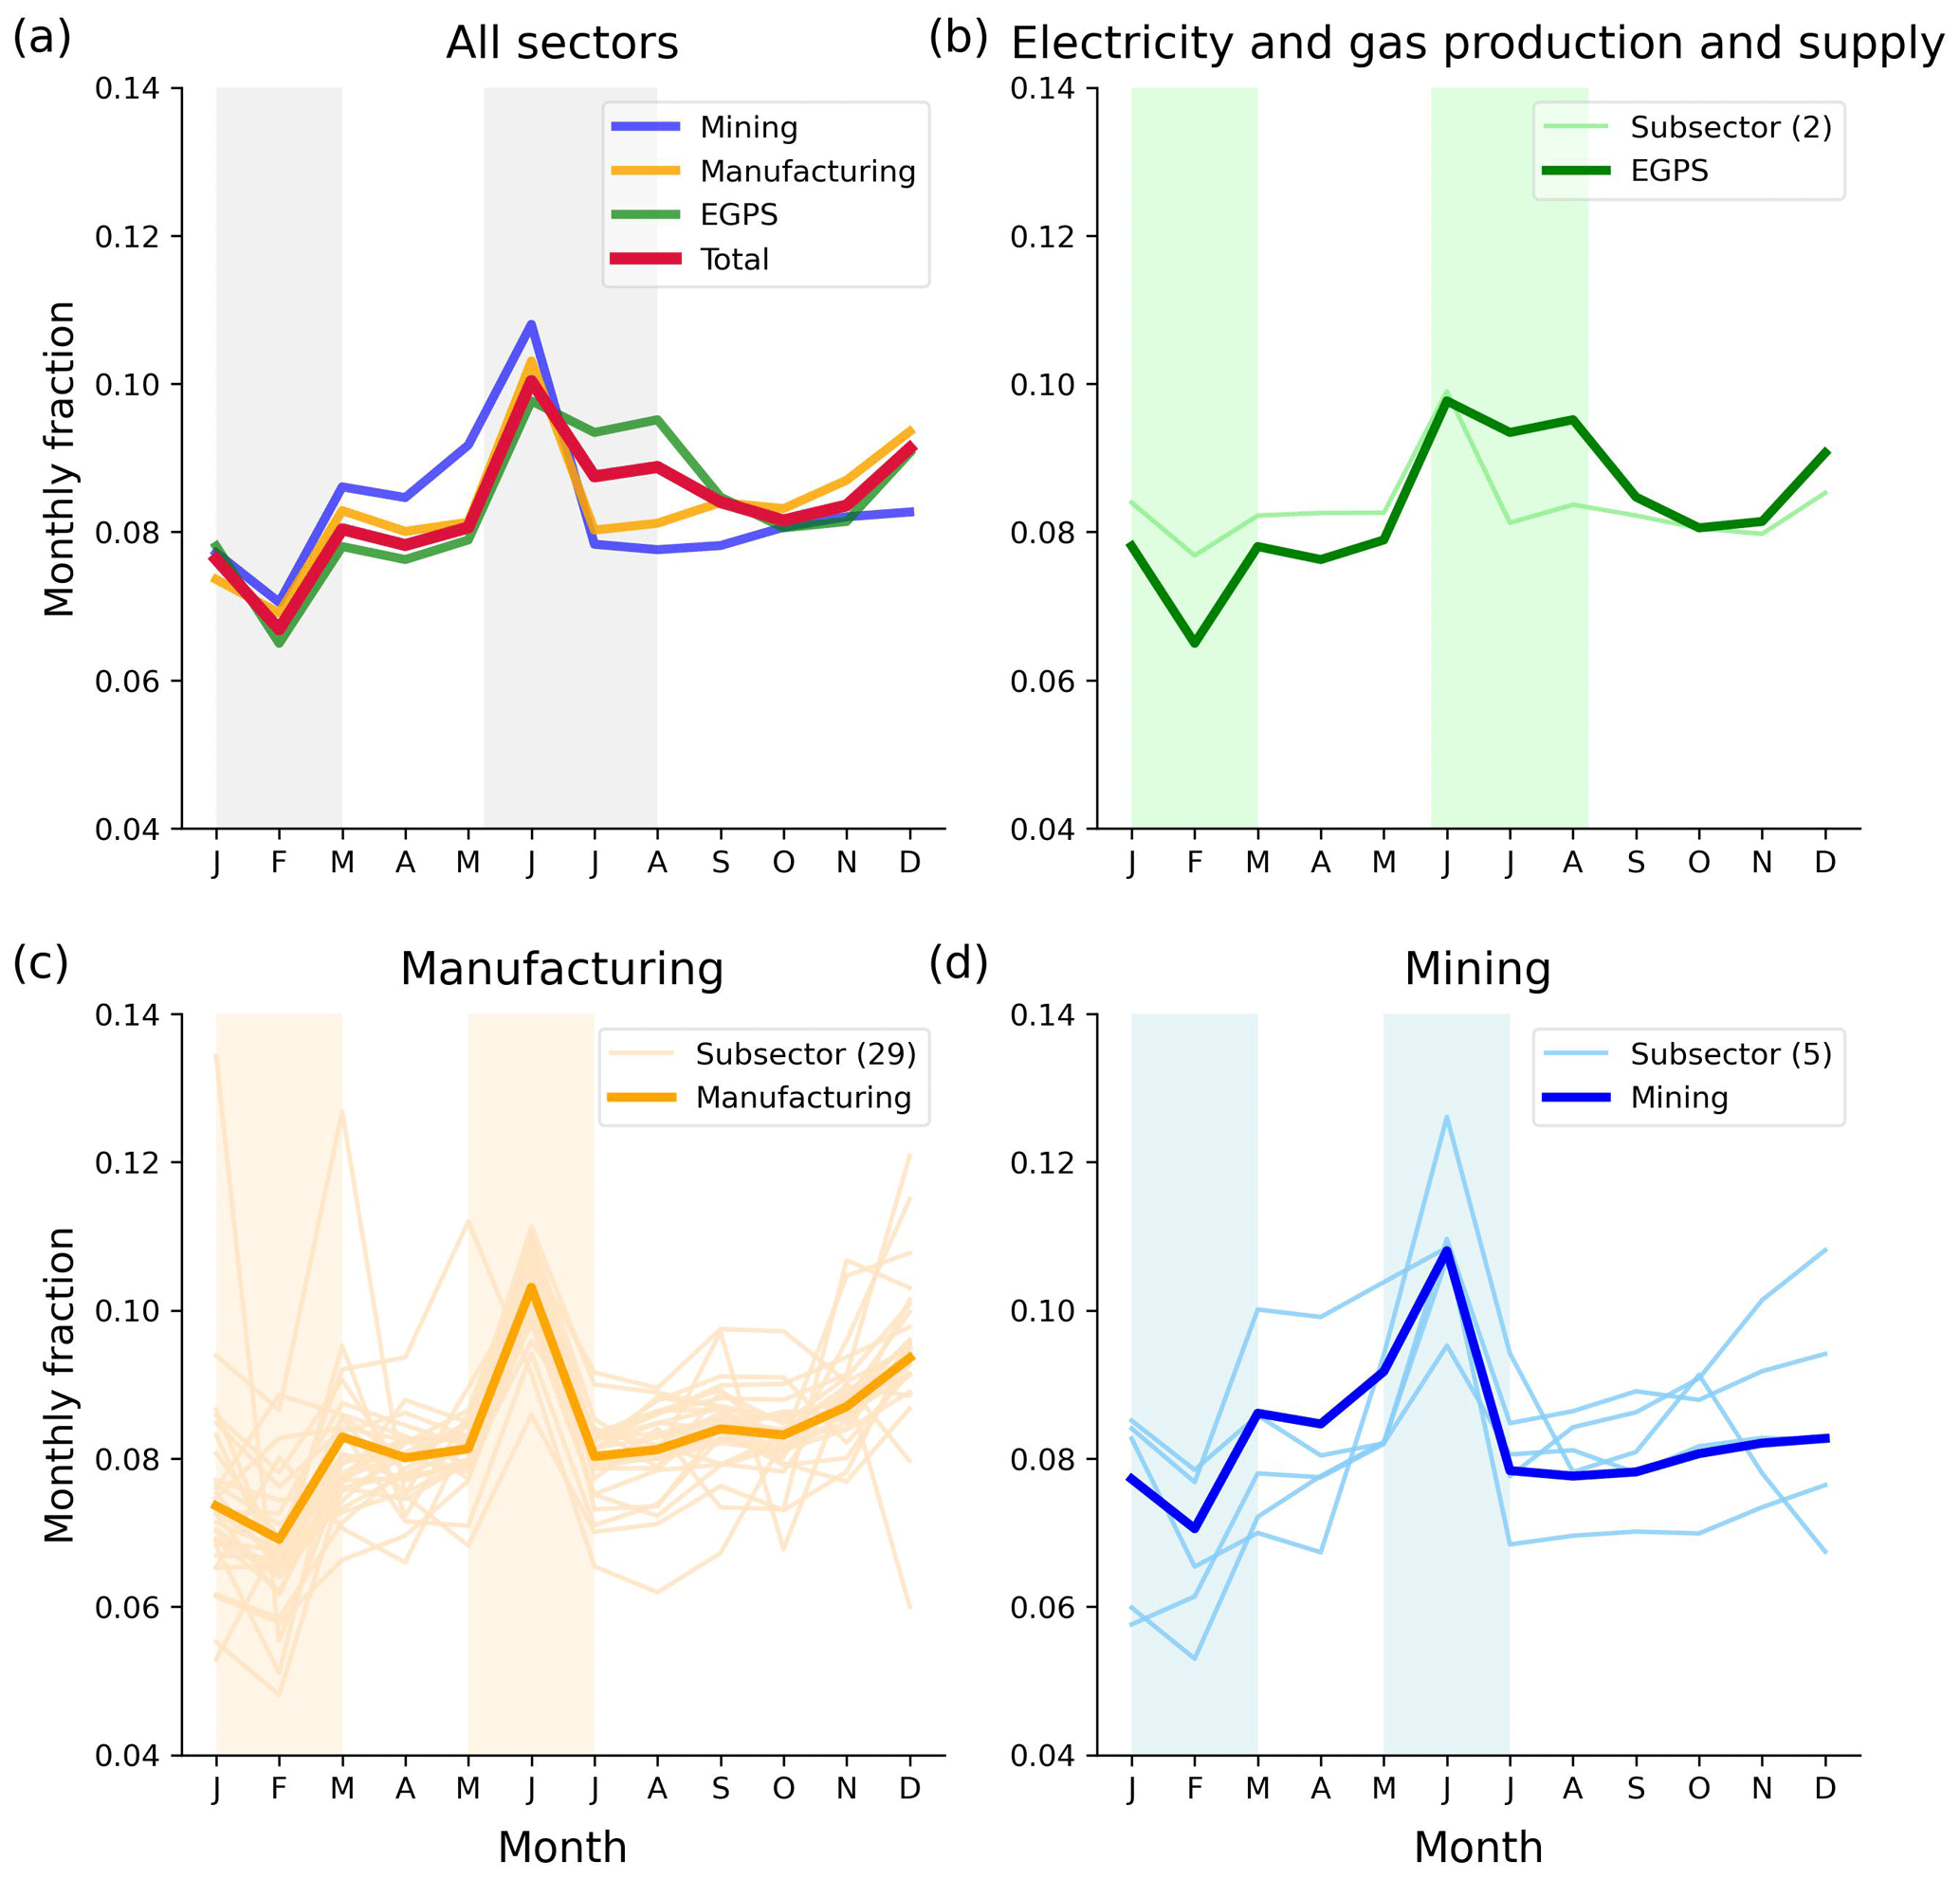
Figure 4Seasonal variations in the national total IWW (a) and for separate industrial sectors, including the electricity and gas production and supply (EGPS) (b), manufacturing (c), and mining sectors (d). The seasonal variations are represented as the fraction of the monthly IWW to the annual total during 2006–2010. The thick lines represent the water withdrawal of the main industrial sectors, and the thin lines represent the subsectors. The shadows represent the seasons with peak and low water withdrawal of a year.
3.3 Long-term changes in industrial water withdrawal in China from 1965 to 2020
For interannual variations, IWW in China increased significantly from 2.1 billion to 14 billion m3 per month during 1965–2010, and it then decreased to 10 billion m3 per month (Fig. 5). These long-term changes indicated that IWW in China has now entered a slowly declining phase. The decline in national IWW after 2010 is mainly due to the implementation of a series of water-saving management measures (The State Council of the People's Republic of China, 2011) such as establishing the “three red lines” principle to cap the total water withdrawal, enhance water use efficiency, and increase industrial water recycling rate (Chen and Chen, 2021; Zhang et al., 2023). In addition, the comparison of long-term annual national IWW of three datasets (CIWW, Huang, and model data) showed that the other two datasets significantly underestimated China's total IWW and presented different temporal patterns, as they did not consider the effects of water use policies (Fig. S6).
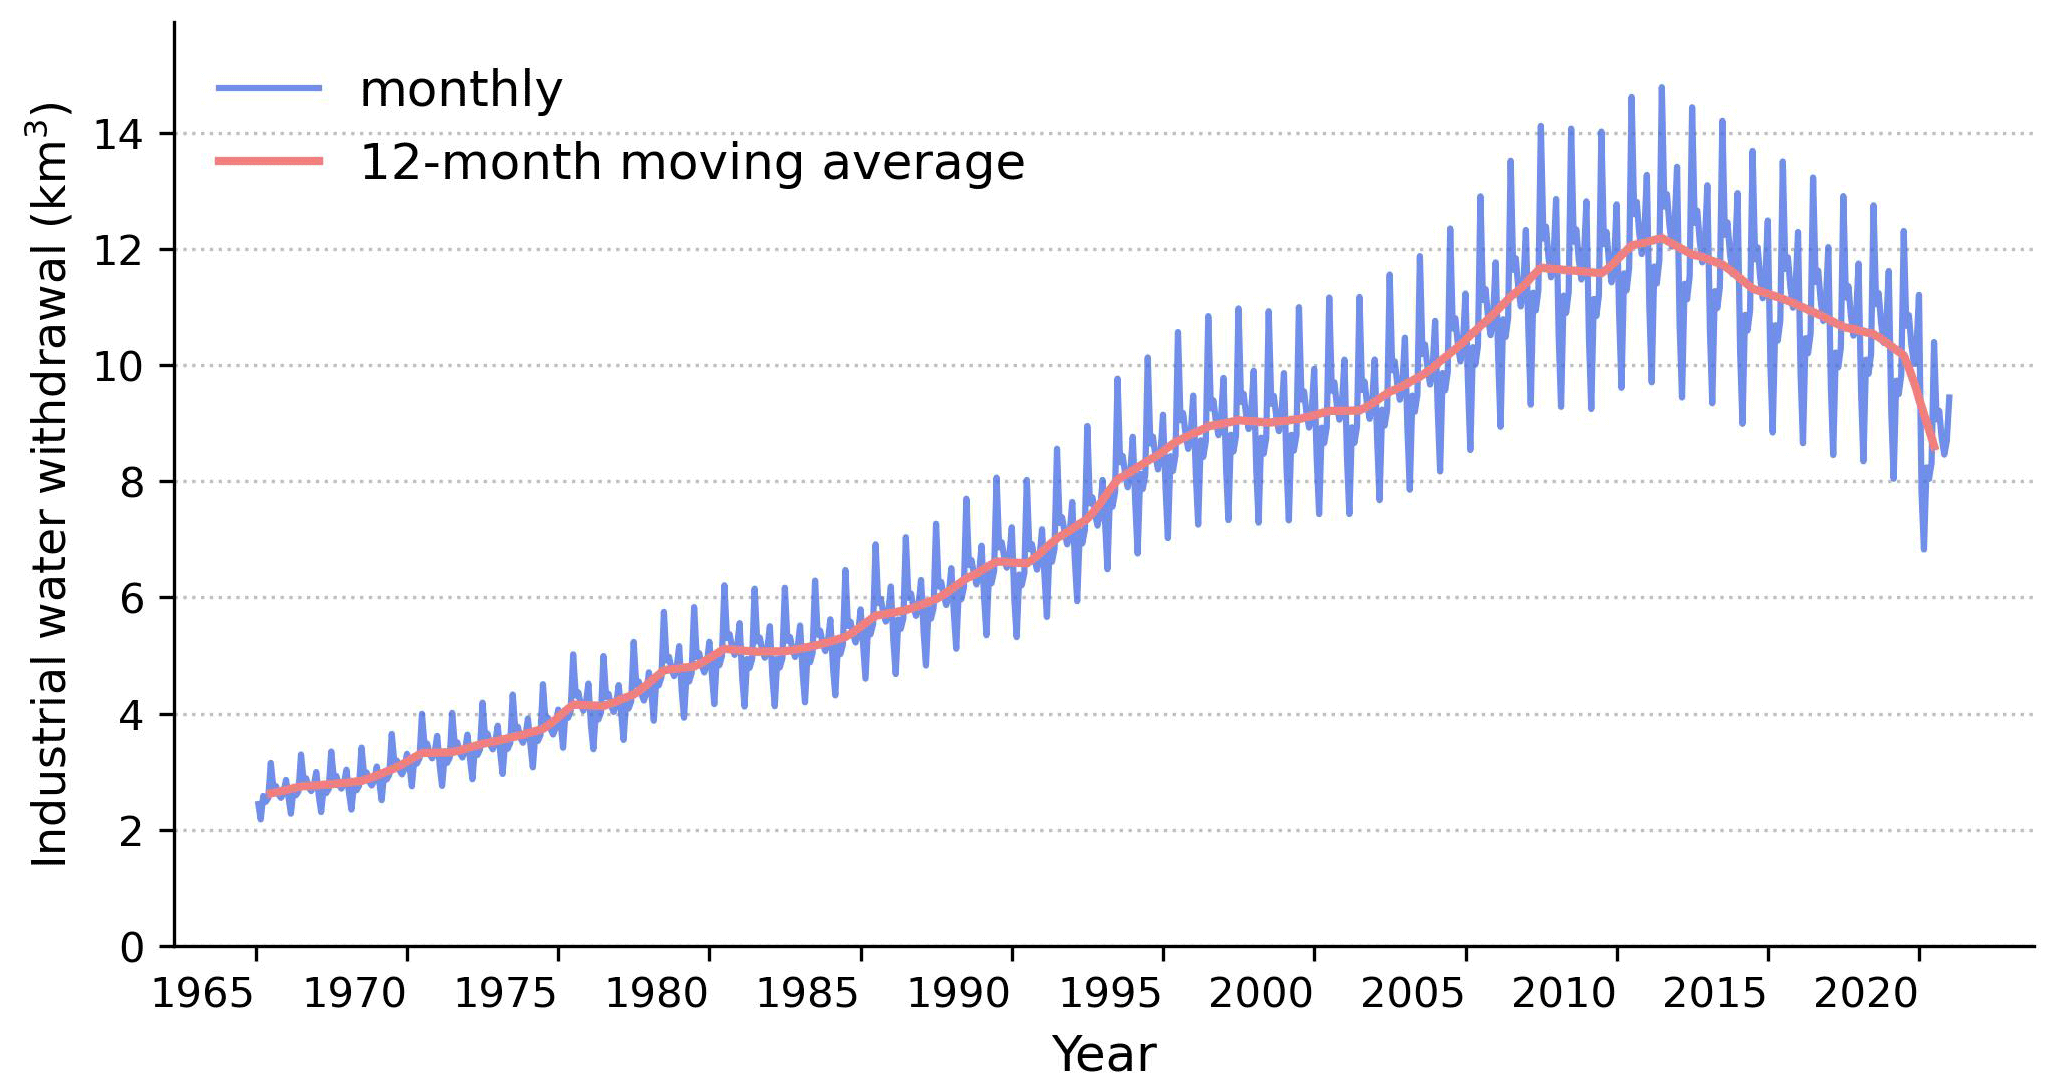
Figure 5Monthly industrial water withdrawal in China from 1965 to 2020 in the CIWW dataset. The red line represents the moving average of the monthly IWW of a 12-month moving window.
Our study developed new gridded data for IWW in China from 1965 to 2020. The CIWW dataset improves upon previous data, particularly in the characterization of spatial and seasonal patterns. Instead of using indirect proxies, such as population density, to map IWW, we used data on industrial enterprises that were direct water withdrawers. Compared with existing IWW datasets that either lack or have a limited representation of seasonal changes (Wada et al., 2011b; Huang et al., 2018; Brunner et al., 2019), our dataset contained seasonal variations based on information from direct water consumers of the sectorial industrial production processes. Furthermore, we used localized data sources in China to produce the long-term IWW data, significantly improving regional accuracy and consistency with the statistical data records. The usage of public data sources and the transparent methodology make it possible to update and recalibrate the data further for specific user needs.
4.1 Potential applications of industrial water withdrawal data: high-resolution analysis and data scaling
The IWW data product with a high resolution supports various research applications. The high spatial resolution revealed IWW at fine scales. Figure 6 shows IWW hotspots in some of China's most densely urbanized regions in 2008 at 0.01° (this resolution was not included in the CIWW dataset but could be produced by the data and code we provided), including the Beijing–Tianjin–Hebei, the Yangtze River Delta, and the Pearl River Delta. These maps displayed high heterogeneity of IWW at the local scales.
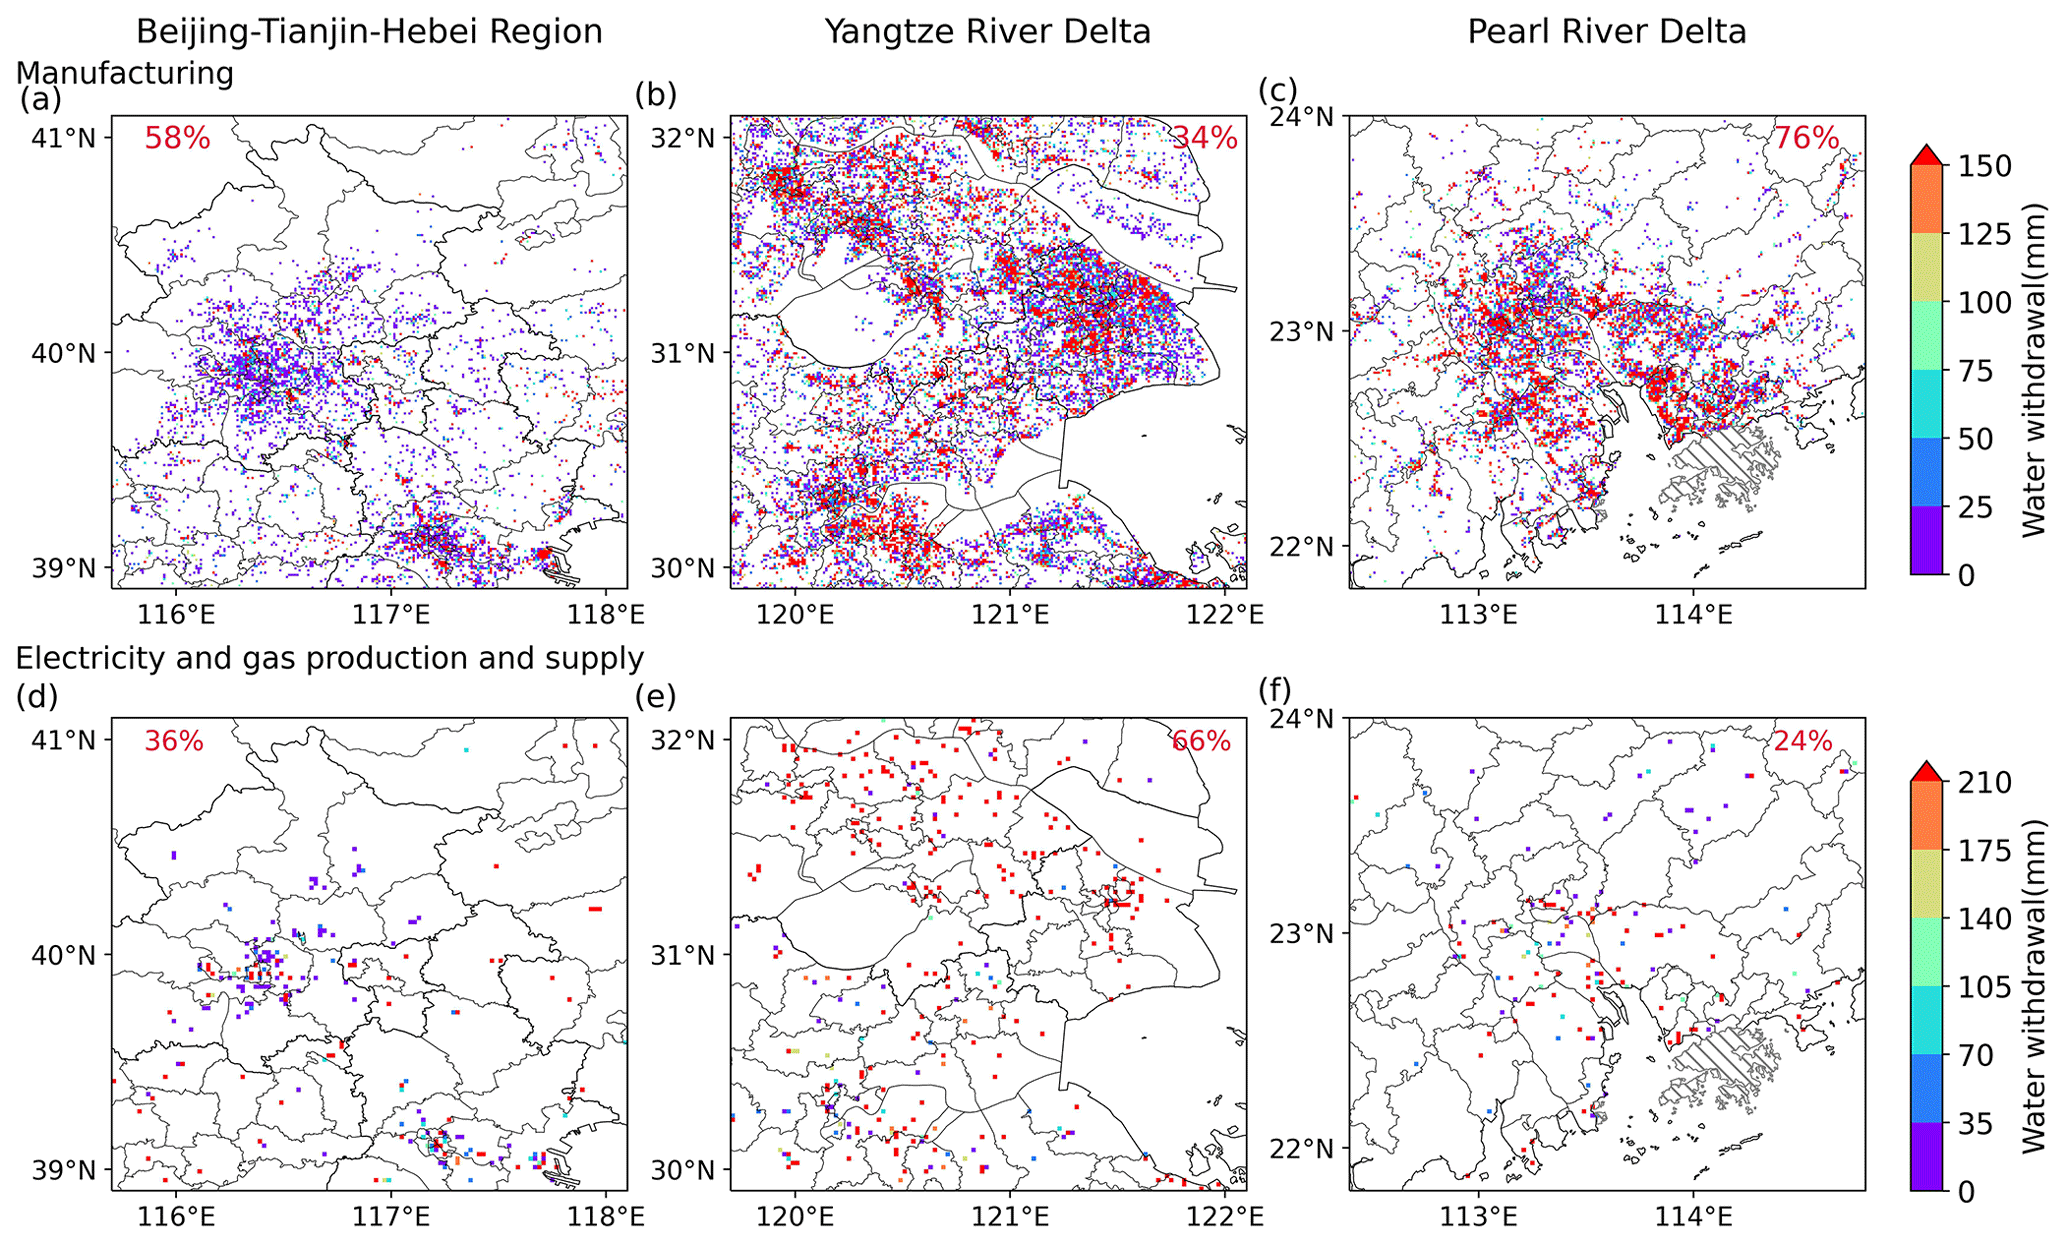
Figure 6Zoomed view of IWW in the densely urbanized regions in China at a spatial resolution of 0.01° (a, b, c) and 0.02° (d, e, f) for clarity, including the Beijing–Tianjin–Hebei region (a, d), Yangtze River Delta (b, e), and Pearl River Delta (c, f). Panels (a)–(c) show the spatial pattern of IWW for manufacturing, and panels (d)–(f) show the spatial pattern of IWW for electricity and gas production and supply. The numbers displayed as percentages denote the percentage of the sectoral IWW to total IWW.
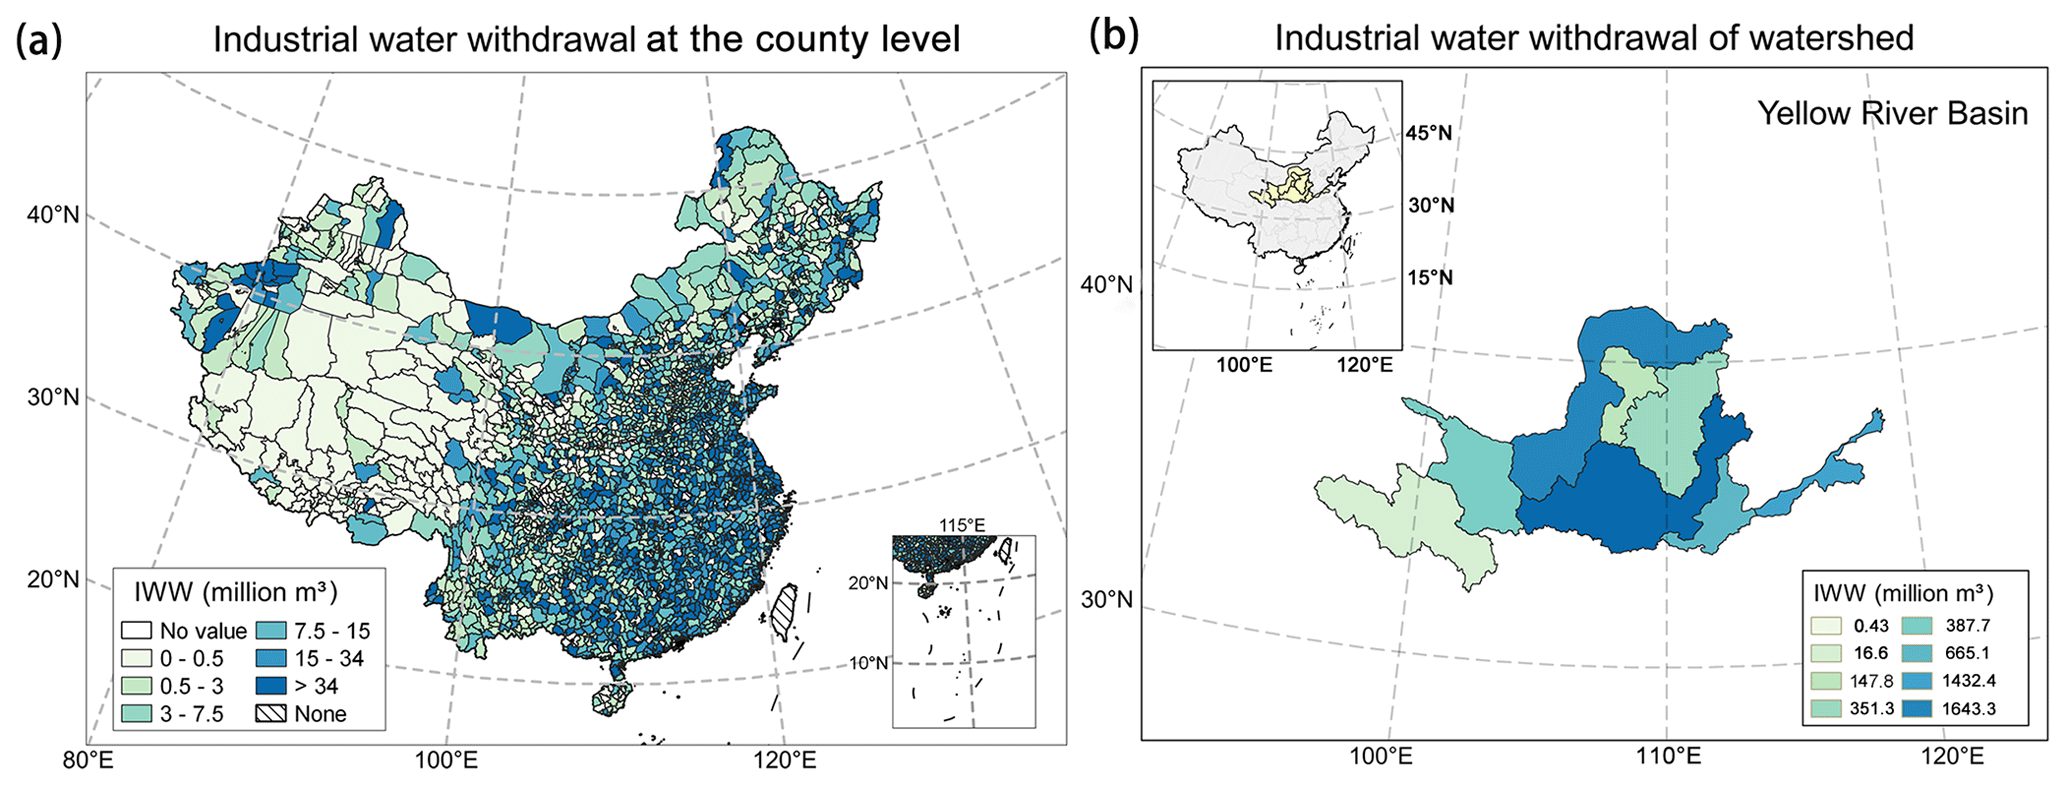
Figure 7CIWW data showing the downscaling of IWW from provincial to county levels in China (a) and from provincial to water basin levels in the Yellow River Basin (b). Publisher's remark: please note that the above figure contains disputed territories.
Additionally, CIWW data could facilitate downscaling of statistical data between different administrative (e.g. provincial or prefecture level), natural (e.g. watershed), and grid levels and help reconcile the scale mismatch between data with different spatial units (e.g. administrative and watershed/catchment). For example, with the gridded CIWW data, the statistical provincial IWW data could be downscaled to the prefecture level or even the county level (Fig. 7a). Moreover, the provincial IWW could be rescaled to the watershed level using weights from the gridded IWW. Figure 7b shows the rescaling of the IWW from provincial levels to watersheds in the Yellow River basin.
4.2 Uncertainties in the spatial downscaling methods
The spatial pattern of IWW in the CIWW dataset was primarily derived based on > 400 000 industrial enterprises in 2008. The spatial sampling of industrial enterprises could affect the spatial mapping. Although this was a large number of records, the enterprise dataset could not cover all enterprises in China since it only sampled enterprises above a designated production level. Therefore, other enterprises below this level, including their IWWs, would be omitted from the datasets, leading to spatial undersampling of all industrial enterprises and their IWWs in China. According to the 2008 Chinese Economic Census Yearbook, the enterprises above a designated level accounted for 93 % of the IOV and 85 % of the water withdrawal of all industries. This data indicated that spatial sampling could have a limited influence on the overall spatial pattern. Additionally, this issue could have been mitigated when the point-level enterprise estimates were aggregated to the grid level.
Another source of uncertainty came from water use efficiency (WUE). Ideally, the enterprise-level IWW could be estimated using each enterprise's IOV and WUE. However, the enterprise-specific WUE was unavailable; thus, we used the provincial subsectorial WUE, assuming the enterprises of the same subsector in the province had similar WUEs. This assumption disregarded the WUE variations since the WUE of different enterprises could vary substantially depending on the subsector, technological levels, investment, scale effects, and so on. For this matter, the spatial distribution of IWW could be further improved with better data sources available at finer scales in the future.
4.3 Uncertainties in seasonal allocation methods
When allocating the annual IWW to monthly scales, we used monthly variations in industrial product output data to represent the seasonal variations in IWW. Notably, there were differences in monthly variations across different products and provinces. When aggregating the monthly variations in 283 products to subsectors, each product was assigned an equal weight due to the lack of product-specific WUE, which neglected the structural differences within the subsector that exist because the products consuming more water could have a more important role. When aggregating IWW from a subsector to a sector, the structural differences within a sector were considered with the weights of subsector WUEs.
We observed considerable differences in monthly variations in product output across provinces for different industrial sectors (Fig. S3). However, the seasonal fluctuations shown in sectors, such as manufacturing and mining, exhibited patterns that were chaotic and unreasonable at the provincial level (Fig. S3). It was difficult to determine whether these different seasonal fluctuations originated from statistical/random errors, unweighted product outputs to the subsector, interannual variability, or actual regional differences. Therefore, we selected to use the national mean monthly variations to represent each subsector to improve the robustness. These monthly subsector variations were then combined with the subsectoral water withdrawal to derive the seasonal variations in IWW (Eq. 4). This choice was expected to have a limited impact on the seasonality of total IWW because it was primarily determined by the sectorial composition of a province (Reynaud, 2003; Sathre et al., 2022). In future research, the regional differences in seasonal variations in IWW should be further explored.
4.4 Uncertainties in producing long-term gridded data
A key step in developing the long-term gridded IWW data was to apply the spatial–seasonal pattern of IWW derived in 2008 for downscaling. The year 2008 was chosen to match the 2008 Chinese Economic Census Yearbook data, which include detailed IWW information that are only available for 2008. Thus, even though the total IWW increased over time with economic development, their spatial pattern and seasonality remained the same in CIWW. We acknowledge that the time-invariant spatial–seasonal pattern of IWW from a single year in 2008 was a strong assumption and probably not true in reality. Nevertheless, this practice was acceptable in the literature under the data limit. For example, the spatial patterns from a single year – e.g. the urban population distribution in 2009 used in WaterGAP3 (Flörke et al., 2013) and the global IWW map in 2000 used in PCR-GLOBAL (Wada et al., 2011a, b) – or patterns with multi-year updates – e.g. H08 (Hanasaki et al., 2008b) and Huang et al. (2018) – were used when developing the gridded IWW data with long time spans. Other time-varying data sources, such as nightlight, land cover, and population density maps with frequent temporal updates, could potentially facilitate the characterization of the temporal changes in the spatial pattern of IWW.
The long-term changes in the industrial WUE can affect IWW since WUE generally improves over time with the development of technology. This improvement would occur for all enterprises (Chen et al., 2019; Yang et al., 2021) and thus would not necessarily change the broad spatial pattern of IWW, since this pattern is determined by the spatial distribution of the industry and economic activities. The influence of other long-term factors such as climate change and WUE changes related to industry development could be partially captured by the provincial statistical data which incorporate the changing spatial pattern of total IWW at the provincial level (Fig. S7).
Notably, the number of enterprises would also change over time and is likely to influence the spatial pattern of IWW. By comparing the spatial pattern of the IOV between 2008 and 2013 using the gridded enterprise data, the two years showed high consistency, with correlation values of 0.9 at 0.1° and 0.94 at 0.25° (Fig. S8). Since the 2013 data had 16 % fewer enterprise samples (< 340 000) than 2008 data (> 400 000), the different sample sizes meant fewer enterprises would appear in 2013 compared to 2008. Nonetheless, the number of grids with the presence of valid enterprises in 2013 was just 12 % lower than that in 2008 at 0.1° and 7 % at 0.25°, which is much smaller than the expected 16 % decline in spatial coverage. This result indicated that the spatial pattern of the gridded data was less sensitive to the number of enterprises, especially at coarse spatial resolutions.
These analyses support that although specific industrial enterprises, their WUEs, and water withdrawal substantially changed over time, the broad spatial pattern after aggregating to the grid scale still largely holds because the spatial pattern of IWW is determined by the distribution of the population and economy of the country, which remain relatively stable over the years (Fig. S5). Nevertheless, temporal changes in the driving factors of IWW and their regional differences, such as industrial structure, water use efficiency, and climate (Alcamo et al., 2003; Otaki et al., 2008; Flörke et al., 2013; Zhou et al., 2020), should be considered to achieve higher accuracy. Due to this limitation, the CIWW dataset would have better performance for the last 20 years but may contain larger uncertainties towards earlier periods. Users can select the time period of the dataset according to their specific needs and interpret data from earlier years with caution. Our evaluation indicated that the CIWW data in earlier years had a surprisingly good performance with a much higher correlation (0.83 vs. 0.35–0.36 in 1971; as illustrated in Fig. S9) and smaller RRMSE (relative root mean square error; RMSE / mean; 1.97 vs. 2.78–2.85 in 1971) than other gridded datasets when compared against Zhou2020 data at a prefectural level (note that the prefecture-level IWW from Zhou2020 data was not used in the development CIWW).
The China Industrial Water Withdrawal (CIWW) dataset is available at https://doi.org/10.6084/m9.figshare.21901074 (Hou and Li, 2023). The Chinese Industrial Enterprises database is available from the library resources of Peking University (https://www.lib.pku.edu.cn/portal/cn/news/0000001637, China State Statistical Bureau, 2022). The Chinese Economic Census Yearbook in 2008 is freely available to the public at https://www.stats.gov.cn/sj/pcsj/jjpc/2jp/left.htm (Leading Office of the Second Economic Census, 2010). The China Industrial Product Output database can be downloaded from the EPS database (https://www.epsnet.com.cn/, China State Statistical Bureau, 2021). The provincial industrial water withdrawal data from 2003 to 2020 are from the China Water Resources Bulletin (http://www.mwr.gov.cn/sj/tjgb/szygb/, Ministry of Water Resources of the People’s Republic of China, 2022), and the data from 1965 to 2002 were obtained from Zhou et al. (2020).
The Python codes used in this study are available on Zenodo (https://doi.org/10.5281/zenodo.11198022, Hou and Li, 2024).
To address the data gap in industrial water withdrawal in China, one of the top water consumers in the world, we developed a new gridded dataset, namely the China Industrial Water Withdrawal (CIWW) dataset. This dataset provided monthly IWWs from 1965 to 2020 at spatial resolutions of 0.1 and 0.25°. With the best available data sources, this dataset showed significant improvements compared to previous global datasets in characterizing the spatial pattern, seasonal variation, and long-term changes in IWW in China and had much higher accuracy. The transparent methodology and public availability of the source data enabled further adjustments and calibration to support the various applications by users. They also served as a reference to develop localized datasets for other countries. This dataset could help to understand human water use dynamics and support studies in hydrology, geography, environment, sustainability sciences, and regional water resource management and allocation in China.
Table A1Classification of sectors in the data. Subsectors in italics are not used in mapping of CIWW as explained in the Notes.
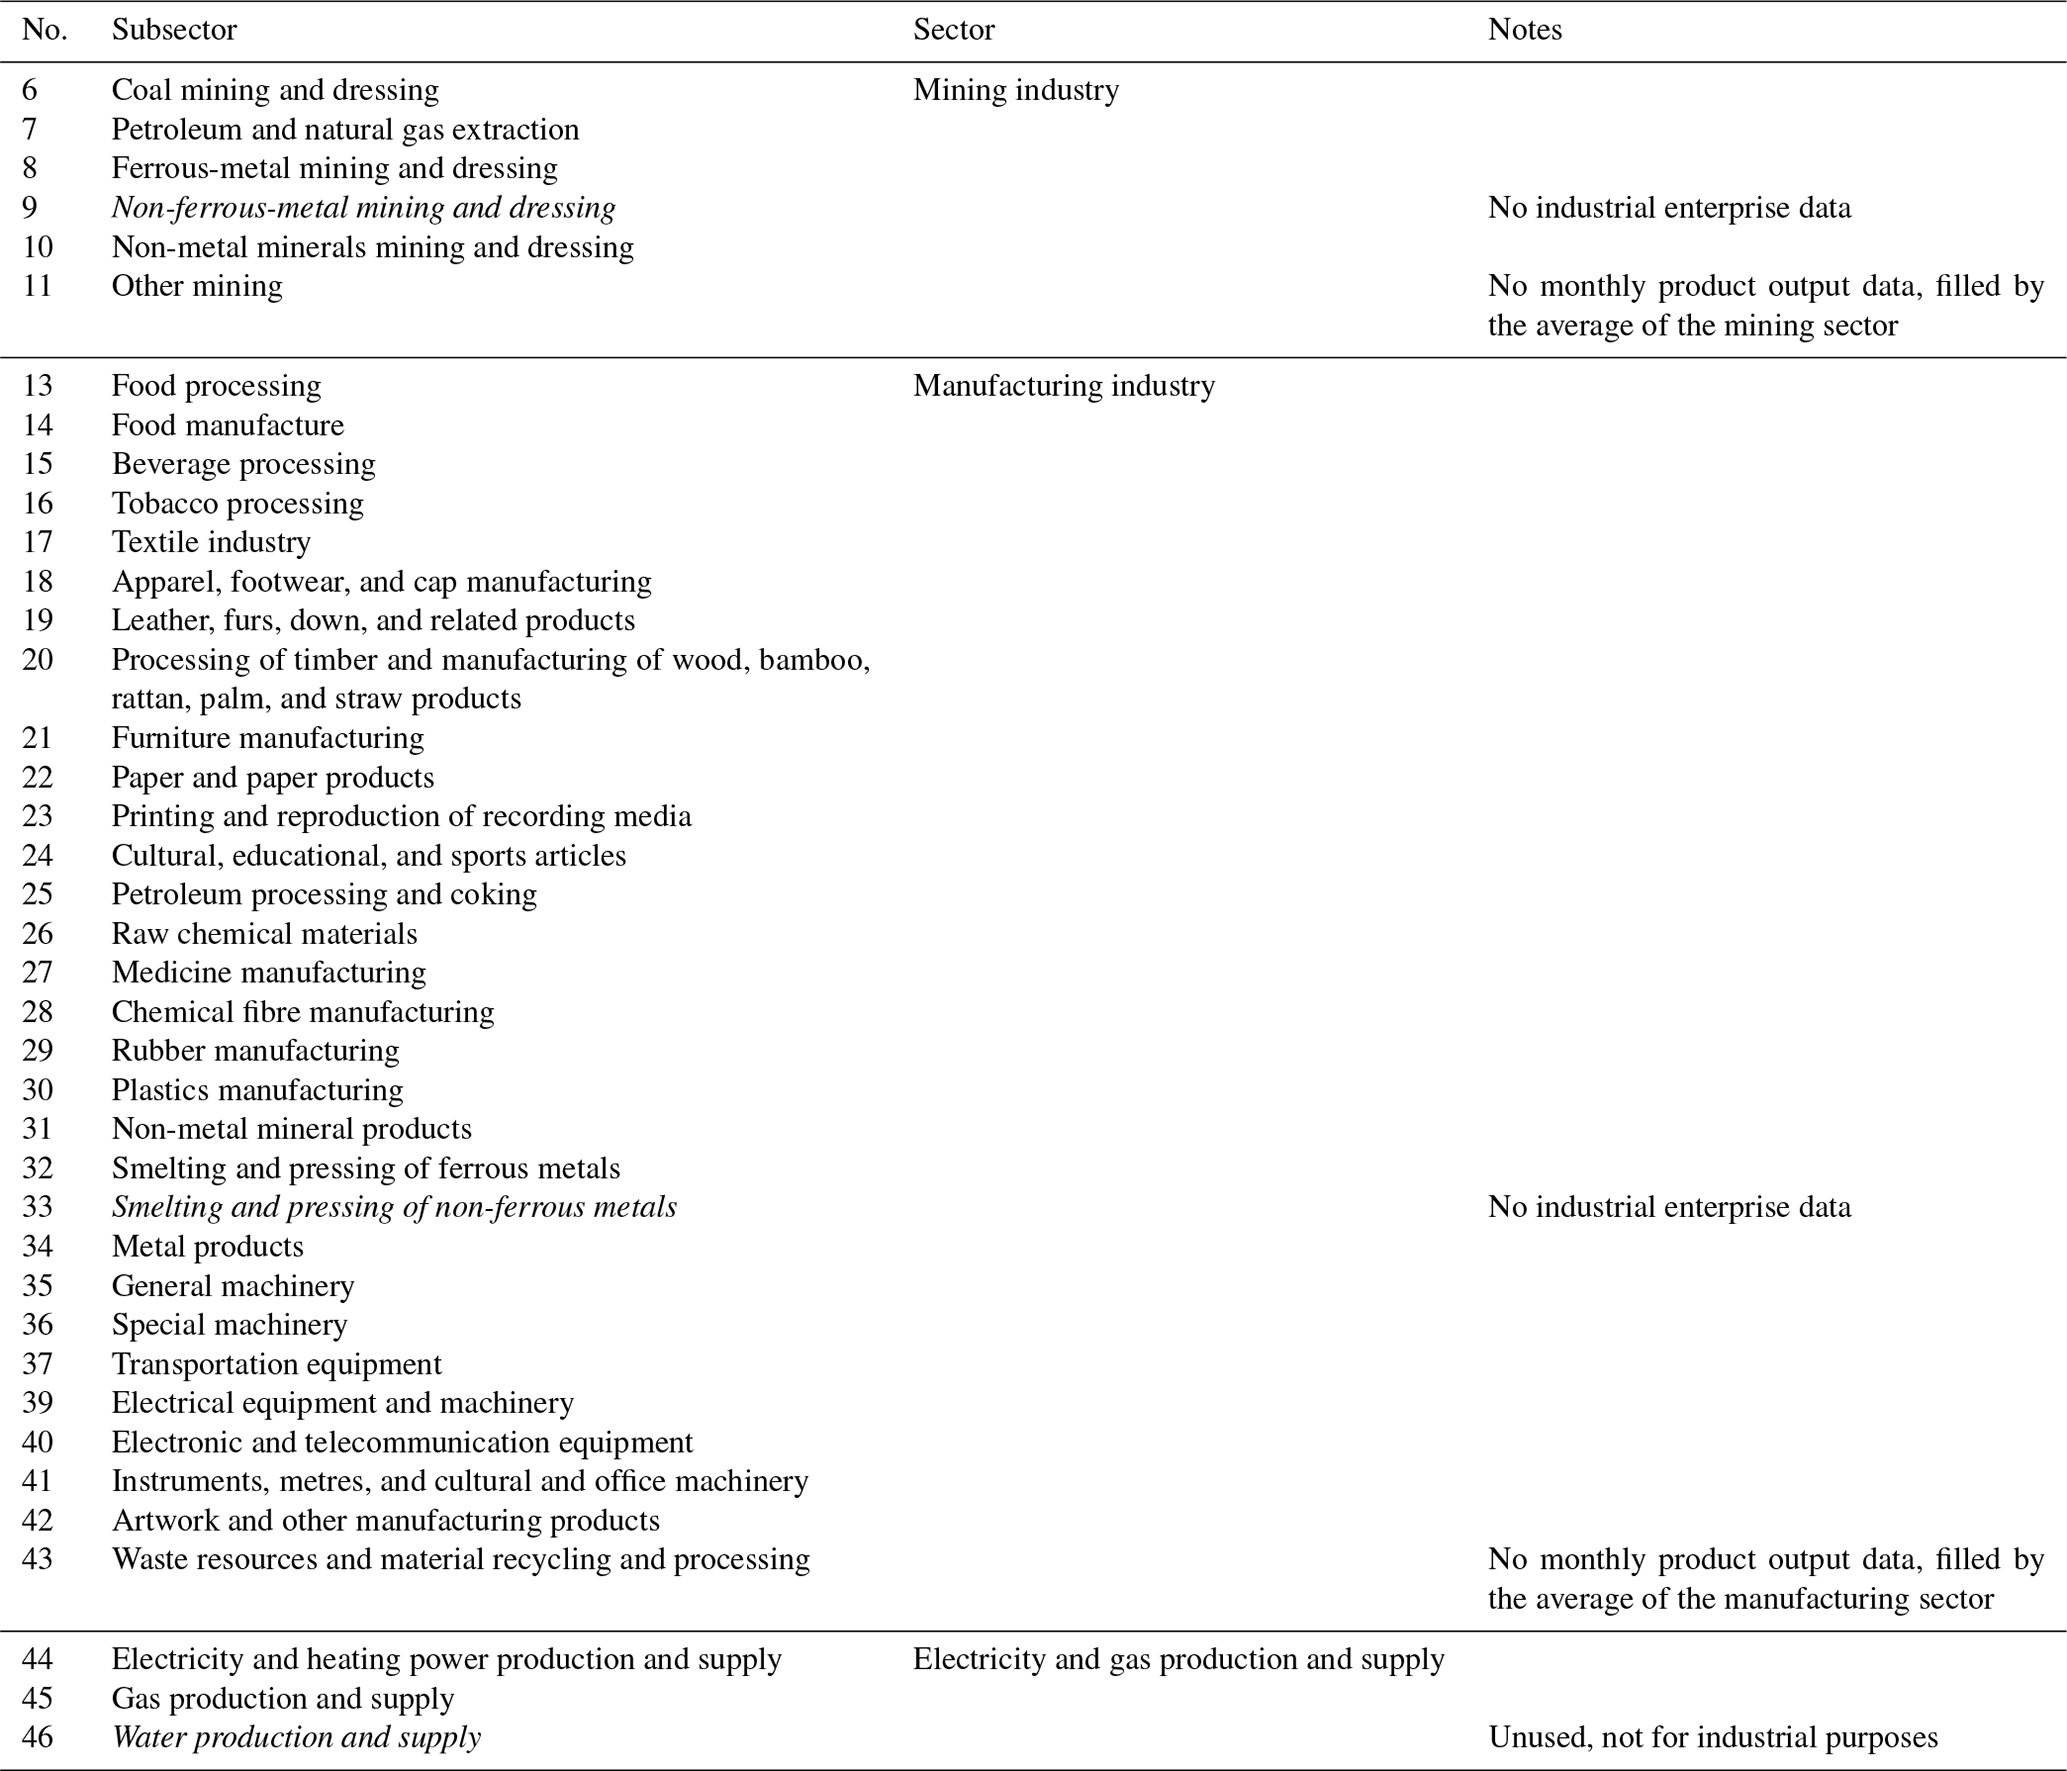
Table B1A summary description of other IWW data for comparison.
The supplement related to this article is available online at: https://doi.org/10.5194/essd-16-2449-2024-supplement.
YL and CCH conceived and designed the study. YLL and CCH contributed to data collection. CCH performed the data generation, data analysis, and the original draft. YL, SS, XZ, YXL, and FZ participated in reviewing and editing the paper. All authors have read and approved the paper.
The contact author has declared that none of the authors has any competing interests.
Publisher’s note: Copernicus Publications remains neutral with regard to jurisdictional claims made in the text, published maps, institutional affiliations, or any other geographical representation in this paper. While Copernicus Publications makes every effort to include appropriate place names, the final responsibility lies with the authors.
We thank the anonymous referees for their constructive review, which improved the quality of this paper.
This research is supported by the National Natural Science Foundation of China (grant nos. 42041007, 41991235, and 72074136) and the Fundamental Research Funds for the Central Universities of China. Fang Zhao is supported by the National Natural Science Foundation of China (grant no. 42101075) and the Shanghai Pujiang Program (grant no. 20PJ1403300).
This paper was edited by Kuishuang Feng and reviewed by five anonymous referees.
Addor, N., Do, H. X., Alvarez-Garreton, C., Coxon, G., Fowler, K., and Mendoza, P. A.: Large-sample hydrology: recent progress, guidelines for new datasets and grand challenges, Hydrolog. Sci. J., 65, 712–725, https://doi.org/10.1080/02626667.2019.1683182, 2020.
Alcamo, J., Henrichs, T., and Rösch, T.: World Water in 2025 – Global modeling and scenario analysis for the World Commission on Water for the 21st Century, Report A0002, Center for Environmental System Research, University of Kassel, Germany, 47 pp., 2000.
Alcamo, J., Döll, P., Henrichs, T., Kaspar, F., Lehner, B., Rösch, T., and Siebert, S.: Development and testing of the WaterGAP 2 global model of water use and availability, Hydrolog. Sci. J., 48, 317–337, https://doi.org/10.1623/hysj.48.3.317.45290, 2003.
Alcamo, J., Flörke, M., and Märker, M.: Future long-term changes in global water resources driven by socio-economic and climatic changes, Hydrolog. Sci. J., 52, 247–275, https://doi.org/10.1623/hysj.52.2.247, 2007.
Arnell, N. W.: Climate change and global water resources, Global Environ. Chang., 9, S31–S49, https://doi.org/10.1016/S0959-3780(99)00017-5, 1999.
Arnell, N. W.: Climate change and global water resources: SRES emissions and socio-economic scenarios, Global Environ. Chang., 14, 31–52, https://doi.org/10.1016/j.gloenvcha.2003.10.006, 2004.
Brunner, M. I., Zappa, M., and Stähli, M.: Scale matters: Effects of temporal and spatial data resolution on water scarcity assessments, Adv. Water Resour., 123, 134–144, https://doi.org/10.1016/j.advwatres.2018.11.013, 2019.
Byers, E. A., Hall, J. W., and Amezaga, J. M.: Electricity generation and cooling water use: UK pathways to 2050, Global Environ. Chang., 25, 16–30, https://doi.org/10.1016/j.gloenvcha.2014.01.005, 2014.
Chen, M. and Chen, H.: Spatiotemporal coupling measurement of industrial wastewater discharge and industrial economy in China, Environ. Sci. Pollut. Res., 28, 46319–46333, https://doi.org/10.1007/s11356-021-14743-3, 2021.
Chen, Y., Feng, X., Fu, B., Shi, W., Yin, L., and Lv, Y.: Recent Global Cropland Water Consumption Constrained by Observations, Water Resour. Res., 55, 3708–3738, https://doi.org/10.1029/2018WR023573, 2019.
Chen, Y., Yin, G., and Liu, K.: Regional differences in the industrial water use efficiency of China: The spatial spillover effect and relevant factors, Resour. Conserv. Recy., 167, 105239, https://doi.org/10.1016/j.resconrec.2020.105239, 2021.
China State Statistical Bureau: China Industrial Product Output database [data set], https://www.epsnet.com.cn/, last access: 26 September 2021.
China State Statistical Bureau: The Chinese Industrial Enterprises database [data set], https://www.lib.pku.edu.cn/portal/cn/news/0000001637, last access: 18 May 2022.
Derepasko, D., Peñas, F. J., Barquín, J., and Volk, M.: Applying Optimization to Support Adaptive Water Management of Rivers, Water, 13, 1281, https://doi.org/10.3390/w13091281, 2021.
Flörke, M., Kynast, E., Bärlund, I., Eisner, S., Wimmer, F., and Alcamo, J.: Domestic and industrial water uses of the past 60 years as a mirror of socio-economic development: A global simulation study, Global Environ. Chang., 23, 144–156, https://doi.org/10.1016/j.gloenvcha.2012.10.018, 2013.
Fujimori, S., Hanasaki, N., and Masui, T.: Projections of industrial water withdrawal under shared socioeconomic pathways and climate mitigation scenarios, Sustain. Sci., 12, 275–292, https://doi.org/10.1007/s11625-016-0392-2, 2017.
Gu, A., Teng, F., and Lv, Z.: Exploring the nexus between water saving and energy conservation: Insights from industry sector during the 12th Five-Year Plan period in China, Renew. Sust. Energ. Rev., 59, 28–38, https://doi.org/10.1016/j.rser.2015.12.285, 2016.
Han, Z., Long, D., Fang, Y., Hou, A., and Hong, Y.: Impacts of climate change and human activities on the flow regime of the dammed Lancang River in Southwest China, J. Hydrol., 570, 96–105, https://doi.org/10.1016/j.jhydrol.2018.12.048, 2019.
Hanasaki, N., Kanae, S., Oki, T., Masuda, K., Motoya, K., Shirakawa, N., Shen, Y., and Tanaka, K.: An integrated model for the assessment of global water resources – Part 1: Model description and input meteorological forcing, Hydrol. Earth Syst. Sci., 12, 1007–1025, https://doi.org/10.5194/hess-12-1007-2008, 2008a.
Hanasaki, N., Kanae, S., Oki, T., Masuda, K., Motoya, K., Shirakawa, N., Shen, Y., and Tanaka, K.: An integrated model for the assessment of global water resources – Part 2: Applications and assessments, Hydrol. Earth Syst. Sci., 12, 1027–1037, https://doi.org/10.5194/hess-12-1027-2008, 2008b.
Hanasaki, N., Inuzuka, T., Kanae, S., and Oki, T.: An estimation of global virtual water flow and sources of water withdrawal for major crops and livestock products using a global hydrological model, J. Hydrol., 384, 232–244, https://doi.org/10.1016/j.jhydrol.2009.09.028, 2010.
Hejazi, M., Edmonds, J., Clarke, L., Kyle, P., Davies, E., Chaturvedi, V., Wise, M., Patel, P., Eom, J., Calvin, K., Moss, R., and Kim, S.: Long-term global water projections using six socioeconomic scenarios in an integrated assessment modeling framework, Technol. Forecast. Soc., 81, 205–226, https://doi.org/10.1016/j.techfore.2013.05.006, 2014.
Hou, C. and Li, Y.: The China industrial water withdrawal Dataset (CIWW) – a gridded monthly industrial water withdrawal data in China from 1965 to 2020, figshare [data set], https://doi.org/10.6084/m9.figshare.21901074, 2023.
Hou, C. and Li, Y.: Code for mapping China Industrial Water Withdrawal (CIWW) dataset (CIWW), Zenodo [code], https://doi.org/10.5281/zenodo.11198022, 2024.
Huang, Z., Hejazi, M., Li, X., Tang, Q., Vernon, C., Leng, G., Liu, Y., Döll, P., Eisner, S., Gerten, D., Hanasaki, N., and Wada, Y.: Reconstruction of global gridded monthly sectoral water withdrawals for 1971–2010 and analysis of their spatiotemporal patterns, Hydrol. Earth Syst. Sci., 22, 2117–2133, https://doi.org/10.5194/hess-22-2117-2018, 2018.
Koch, H. and Vögele, S.: Dynamic modelling of water demand, water availability and adaptation strategies for power plants to global change, Ecol. Econ., 68, 2031–2039, https://doi.org/10.1016/j.ecolecon.2009.02.015, 2009.
Leading Office of the Second Economic Census: The Chinese Economic Census Yearbook 2008 [data set], https://www.stats.gov.cn/sj/pcsj/jjpc/2jp/left.htm (last access: 2 April 2021), 2010.
Li, X., Long, D., Scanlon, B. R., Mann, M. E., Li, X., Tian, F., Sun, Z., and Wang, G.: Climate change threatens terrestrial water storage over the Tibetan Plateau, Nat. Clim. Change, 12, 801–807, https://doi.org/10.1038/s41558-022-01443-0, 2022.
Liu, J., Zang, C., Tian, S., Liu, J., Yang, H., Jia, S., You, L., Liu, B., and Zhang, M.: Water conservancy projects in China: Achievements, challenges and way forward, Global Environ. Chang., 23, 633–643, https://doi.org/10.1016/j.gloenvcha.2013.02.002, 2013.
Liu, L., Hejazi, M., Patel, P., Kyle, P., Davies, E., Zhou, Y., Clarke, L., and Edmonds, J.: Water demands for electricity generation in the U.S.: Modeling different scenarios for the water–energy nexus, Technol. Forecast. Soc. Change, 94, 318–334, https://doi.org/10.1016/j.techfore.2014.11.004, 2015.
Liu, M., Fang, Y., and Li Y.: Analysis of Several Chinese National Economic Indexes' Seasonal Fluctuation by Applying the Methods of Directional Data Statistics, 64–72, 2006 (in Chinese).
Liu, X., Tang, Q., Liu, W., Veldkamp, T. I. E., Boulange, J., Liu, J., Wada, Y., Huang, Z., and Yang, H.: A Spatially Explicit Assessment of Growing Water Stress in China From the Past to the Future, Earths Future, 7, 1027–1043, https://doi.org/10.1029/2019EF001181, 2019a.
Liu, X., Liu, W., Yang, H., Tang, Q., Flörke, M., Masaki, Y., Müller Schmied, H., Ostberg, S., Pokhrel, Y., Satoh, Y., and Wada, Y.: Multimodel assessments of human and climate impacts on mean annual streamflow in China, Hydrol. Earth Syst. Sci., 23, 1245–1261, https://doi.org/10.5194/hess-23-1245-2019, 2019b.
Long, D., Yang, W., Scanlon, B. R., Zhao, J., Liu, D., Burek, P., Pan, Y., You, L., and Wada, Y.: South-to-North Water Diversion stabilizing Beijing's groundwater levels, Nat. Commun., 11, 3665, https://doi.org/10.1038/s41467-020-17428-6, 2020.
Ministry of Water Resources of the People’s Republic of China: China Water Resources Bulletin, Beijing, China, http://www.mwr.gov.cn/sj/tjgb/szygb/ (last access: 9 March 2024), 2019.
Müller Schmied, H., Eisner, S., Franz, D., Wattenbach, M., Portmann, F. T., Flörke, M., and Döll, P.: Sensitivity of simulated global-scale freshwater fluxes and storages to input data, hydrological model structure, human water use and calibration, Hydrol. Earth Syst. Sci., 18, 3511–3538, https://doi.org/10.5194/hess-18-3511-2014, 2014.
Niva, V., Cai, J., Taka, M., Kummu, M., and Varis, O.: China's sustainable water-energy-food nexus by 2030: Impacts of urbanization on sectoral water demand, J. Clean. Prod., 251, 119755, https://doi.org/10.1016/j.jclepro.2019.119755, 2020.
Oki, T. and Kanae, S.: Global hydrological cycles and world water resources, Science, 313, 1068–1072, https://doi.org/10.1126/science.1128845, 2006.
Oki, T., Agata, Y., Kanae, S., Saruhashi, T., and Musiake, K.: Global water resources assessment under climatic change in 2050 using TRIP, IAHS-AISH Publ., 280, 124–133, 2003.
Otaki, Y., Otaki, M., and Yamada, T.: Attempt to Establish an Industrial Water Consumption Distribution Model, J. Water Environ. Technol., 6, 85–91, https://doi.org/10.2965/jwet.2008.85, 2008.
Qin, J., Ding, Y.-J., Zhao, Q.-D., Wang, S.-P., and Chang, Y.-P.: Assessments on surface water resources and their vulnerability and adaptability in China, Adv. Clim. Change Res., 11, 381–391, https://doi.org/10.1016/j.accre.2020.11.002, 2020.
Qin, Y., Mueller, N. D., Siebert, S., Jackson, R. B., AghaKouchak, A., Zimmerman, J. B., Tong, D., Hong, C., and Davis, S. J.: Flexibility and intensity of global water use, Nat. Sustain., 2, 515–523, https://doi.org/10.1038/s41893-019-0294-2, 2019.
Reynaud, A.: An Econometric Estimation of Industrial Water Demand in France, Environ. Resour. Econ., 25, 213–232, https://doi.org/10.1023/A:1023992322236, 2003.
Sathre, R., Antharam, S. M., and Catena, M.: Water Security in South Asian Cities: A Review of Challenges and Opportunities, CivilEng, 3, 873–894, https://doi.org/10.3390/civileng3040050, 2022.
Shen, Y., Oki, T., Utsumi, N., and Kanae, S.: Projection of future world water resources under SRES scenarios: water withdrawal/Projection des ressources en eau mondiales futures selon les scénarios du RSSE: prélèvement d'eau Projection of future world water resources under SRES scenarios: wat, Hydrolog. Sci. J., 53, 11–33, https://doi.org/10.1623/hysj.53.1.11, 2010.
Sunkara, S. V. and Singh, R.: Assessing the impact of the temporal resolution of performance indicators on optimal decisions of a water resources system, J. Hydrol., 612, 128185, https://doi.org/10.1016/j.jhydrol.2022.128185, 2022.
The state Council of the People's Republic of China, Decision on accelerating the reform and development of water resources https://www.gov.cn/gongbao/content/2011/content_1803158.htm (last access: 9 March 2024), 2011 (in Chinese).
Van Beek, L. P. H., Wada, Y., Viviroli, D., Durr, H. H., Weingartner, R., and Bierkens, M. F. P.: Global monthly water stress: 1. Water balance and water availability, Water Resour. Res., 47, W07517, https://doi.org/10.1029/2010WR009791, 2011.
Vassolo, S. and Döll, P.: Global-scale gridded estimates of thermoelectric power and manufacturing water use, Water Resour. Res., 41, 1–11, https://doi.org/10.1029/2004WR003360, 2005.
Vörösmarty, C. J., Green, P., Salisbury, J., and Lammers, R. B.: Global water resources: Vulnerability from climate change and population growth, Science, 289, 284–288, https://doi.org/10.1126/science.289.5477.284, 2000.
Wada, Y., Van Beek, L. P. H., Viviroli, D., Drr, H. H., Weingartner, R., and Bierkens, M. F. P.: Global monthly water stress: 2. Water demand and severity of water stress, Water Resour. Res., 47, 1–17, https://doi.org/10.1029/2010WR009792, 2011a.
Wada, Y., van Beek, L. P. H., and Bierkens, M. F. P.: Modelling global water stress of the recent past: on the relative importance of trends in water demand and climate variability, Hydrol. Earth Syst. Sci., 15, 3785–3808, https://doi.org/10.5194/hess-15-3785-2011, 2011b.
Wada, Y., Wisser, D., and Bierkens, M. F. P.: Global modeling of withdrawal, allocation and consumptive use of surface water and groundwater resources, Earth Syst. Dynam., 5, 15–40, https://doi.org/10.5194/esd-5-15-2014, 2014.
Wada, Y., Flörke, M., Hanasaki, N., Eisner, S., Fischer, G., Tramberend, S., Satoh, Y., van Vliet, M. T. H., Yillia, P., Ringler, C., Burek, P., and Wiberg, D.: Modeling global water use for the 21st century: the Water Futures and Solutions (WFaS) initiative and its approaches, Geosci. Model Dev., 9, 175–222, https://doi.org/10.5194/gmd-9-175-2016, 2016.
Wang, J., Zhong, L., and Long, Y.: Baseline Water Stress: China, Technical Note, World Resources Institute, Beijing, http://www.wri.org/publication/baseline-water-stress-china (last access: 17 May 2024), 2016.
WWAP (UNESCO World Water Assessment Programme), The United Nations World Water Development Report 2019: Leaving No One Behind, Paris, UNESCO, ISBN 978-92-3-100309-7, 2019.
Xia, J., Ning, L., Wang, Q., Chen, J., Wan, L., and Hong, S.: Vulnerability of and risk to water resources in arid and semi-arid regions of West China under a scenario of climate change, Climatic Change, 144, 549–563, https://doi.org/10.1007/s10584-016-1709-y, 2017.
Yan, D., Zhang, X., Qin, T., Li, C., Zhang, J., Wang, H., Weng, B., Wang, K., Liu, S., Li, X., Yang, Y., Li, W., Lv, Z., Wang, J., Li, M., He, S., Liu, F., Bi, W., Xu, T., Shi, X., Man, Z., Sun, C., Liu, M., Wang, M., Huang, Y., Long, H., Niu, Y., Dorjsuren, B., Gedefaw, M., Li, Y., Tian, Z., Mu, S., Wang, W., and Zhou, X.: A data set of distributed global population and water withdrawal from 1960 to 2020, Sci. Data, 9, 640, https://doi.org/10.1038/s41597-022-01760-1, 2022.
Yang, F., Wang, D., Zhao, L., and Wei, F.: Efficiency evaluation for regional industrial water use and wastewater treatment systems in China: A dynamic interactive network slacks-based measure model, J. Environ. Manage., 279, 111721, https://doi.org/10.1016/j.jenvman.2020.111721, 2021.
Yin, Y., Wang, L., Wang, Z., Tang, Q., Piao, S., Chen, D., Xia, J., Conradt, T., Liu, J., Wada, Y., Cai, X., Xie, Z., Duan, Q., Li, X., Zhou, J., and Zhang, J.: Quantifying Water Scarcity in Northern China Within the Context of Climatic and Societal Changes and South-to-North Water Diversion, Earths Future, 8, e2020EF001492, https://doi.org/10.1029/2020EF001492, 2020.
Zhang, L., Ma, Q., Zhao, Y., Chen, H., Hu, Y., and Ma, H.: China's strictest water policy: Reversing water use trends and alleviating water stress, J. Environ. Manage., 345, 118867, https://doi.org/10.1016/j.jenvman.2023.118867, 2023.
Zhao, X., Liu, J., Liu, Q., Tillotson, M. R., Guan, D., and Hubacek, K.: Physical and virtual water transfers for regional water stress alleviation in China, P. Natl. Acad. Sci. USA, 112, 1031–1035, https://doi.org/10.1073/pnas.1404130112, 2015.
Zhou, F., Bo, Y., Ciais, P., Dumas, P., Tang, Q., Wang, X., Liu, J., Zheng, C., Polcher, J., Yin, Z., Guimberteau, M., Peng, S., Ottle, C., Zhao, X., Zhao, J., Tan, Q., Chen, L., Shen, H., Yang, H., Piao, S., Wang, H., and Wada, Y.: Deceleration of China's human water use and its key drivers, P. Natl. Acad. Sci. USA, 117, 7702–7711, https://doi.org/10.1073/pnas.1909902117, 2020.