the Creative Commons Attribution 4.0 License.
the Creative Commons Attribution 4.0 License.
 | 16 Apr 2024
High-resolution physicochemical dataset of atmospheric aerosols over the Tibetan Plateau and its surroundings
Jianzhong Xu
Xinghua Zhang
Wenhui Zhao
Lixiang Zhai
Miao Zhong
Jinsen Shi
Junying Sun
Yanmei Liu
Conghui Xie
Yulong Tan
Kemei Li
Xinlei Ge
Shichang Kang
Atmospheric aerosol in the Tibetan Plateau (TP) and its surroundings has attracted significant scientific interest in recent decades due to its notable impacts on regional climatic and cryospheric changes, ecological and environmental security, and the hydrological cycle. However, our understanding of the atmospheric aerosol in this remote region is highly limited by the scarcity of available datasets owing to the extremely harsh natural conditions. This challenge has been mitigated in recent decades by establishing field observatories at typical sites within the TP and its surroundings. A continuous project initiated in 2015 aims to explore the properties and sources of atmospheric aerosols, as well as their regional differences, through multiple short-term intensive observations obtained across this vast region utilizing a suite of high-time-resolution online instruments. This paper presents a systematic and hourly scale dataset of aerosol physicochemical and optical properties at eight sites across the TP and its surroundings that is derived from the project. It includes size-resolved chemical compositions of submicron aerosols, high-resolution mass spectra and sources of organic aerosols, size distributions of particle number concentrations, particle light-scattering and light-absorption coefficients, particle light absorptions attributed to different carbonaceous substances including black carbon and brown carbon, and number concentrations of cloud condensation nuclei. In brief, atmospheric aerosols in these remote sites were all well mixed and highly aged, reflecting their dominant regional transport sources. However, the southern TP region exhibited high contributions of carbonaceous organic aerosols, neutralized bulk submicron aerosols, and a relatively high light-absorption capacity, whereas in the northern TP region, secondary inorganic species were the main contributors to the overall acidic submicron aerosols. Beyond providing insights into the regional differences in aerosol sources and properties across the TP and its surroundings, the datasets will also benefit simulations of aerosol radiative forcing and evaluations of interactions among different Earth system components in numerical models for this region. The datasets are accessible through the National Cryosphere Desert Data Center, Chinese Academy of Sciences (https://doi.org/10.12072/ncdc.NIEER.db2200.2022; Xu, 2022).
- Article
(14447 KB) - Full-text XML
-
Supplement
(1911 KB) - BibTeX
- EndNote


The Tibetan Plateau (TP), with an average elevation exceeding 4000 m above sea level (a.s.l.) and spanning a surface area of approximately 2.5 million km2, stands as the highest plateau on the Earth. Its high-altitude mountain ranges, integral to one of the world's most crucial cryospheric regions, have earned the TP the monikers “the Roof of the World”, “the Third Pole”, and “the Asian Water Tower” (Qiu, 2008; Yao et al., 2019). The TP and its surroundings play a pivotal role in influencing global and regional climate systems, hydrological cycles, and cryospheric changes through its vast and complex topography and its function as a significant heat source (Duan and Wu, 2005; Yao et al., 2012; Chen et al., 2021). In recent decades, a major concern has been the significant climatic warming and the rapid changes in the cryosphere of this region (Kang et al., 2010), which exhibits a warming trend that exceeds that of the Northern Hemisphere (0.34 vs. 0.29 °C/decade) (You et al., 2021; Zhou and Zhang, 2021).
Atmospheric aerosols, one of the most complex and critical components of the atmosphere, significantly influence climatic warming and cryospheric changes in the TP region. They exert crucial direct and indirect effects on the atmospheric energy budget and the albedos of snow and ice surfaces, impacting Earth's climate system (Xu et al., 2009; Kang et al., 2019b). Notably, light-absorbing carbonaceous aerosols (CAs) such as black carbon (BC) and brown carbon (BrC) directly absorb solar radiation, warming the atmosphere and contributing to positive forcing in Earth's energy budget (Ramanathan et al., 2007; Kopacz et al., 2011). For instance, Li et al. (2018) demonstrated that BC causes a significantly greater albedo reduction (∼46 %) and significantly greater instantaneous radiative forcing (7–64 W m−2) on aged snow surfaces of a TP glacier than mineral dust. Moreover, aerosol particles over the TP significantly affect ice cloud properties and cloud development through their semi-direct effects (Liu et al., 2019). Given the vast and remote nature of the TP, coupled with its complex topography, meteorology, and harsh environment, in situ observation of atmospheric aerosols poses substantial challenges. Consequently, numerical model simulations based on reanalysis data have emerged as a predominant and crucial method in recent decades. Notable studies include that of Lau et al. (2006), who assessed the impact of atmospheric aerosols on the Asian summer monsoon intensification using the NASA finite-volume general circulation model; that of Kopacz et al. (2011), who explored the origin and radiative forcing of BC in the TP and Himalayas with the GEOS-Chem global chemical transport model; and that of Liu et al. (2015), who examined the transport of summer dust and anthropogenic aerosols using a three-dimensional aerosol transport–radiation model with satellite data inputs. Despite the significant insights gained from these simulations, in situ observations of atmospheric aerosols in the TP are increasingly recognized as critical for evaluating and enhancing model accuracy in this remote area. The absence of in situ aerosol data to refine models introduces considerable uncertainty into the results. Furthermore, while model simulations primarily focus on spatial distributions across broad regions, they often overlook temporal variations or the inherent evolution mechanisms at high temporal resolution, which in situ observations could illuminate.
Recent advancements in observational techniques and instrumentation have enabled numerous in situ measurements within the TP and its surroundings aimed at delineating the physical, chemical, and optical properties of aerosols along with their potential sources, transport pathways, and regional distributions. A detailed compilation of direct ambient aerosol measurements in the TP, employing a variety of observational methods and instruments, is presented in Table S1 in the Supplement. Notably, off-line atmospheric filter sampling has emerged as a key in situ aerosol collection method in the TP, favored for its low cost and feasibility under the region's harsh conditions and logistical constraints. This method has effectively captured the composition, size, light absorption properties, sources, and variations of ambient aerosols, including diverse CA components such as BC, BrC, organic carbon (OC), water-soluble OC (WSOC), humic-like substances (HULS), and polycyclic aromatic hydrocarbons (PAHs) in the remote TP region (Cao et al., 2009; Zhao et al., 2013; Xu et al., 2014a; Zhang et al., 2014; Cong et al., 2015; Wan et al., 2015; Xu et al., 2015; Kang et al., 2016; Li et al., 2016b; Xu et al., 2020). Furthermore, off-line filter sampling has been instrumental in mapping the regional aerosol distribution across the TP, as such mapping is facilitated by its simplicity and the ability to conduct simultaneous observations at multiple locations (Li et al., 2016a; Chen et al., 2019; Kang et al., 2022). Despite these advancements, off-line filter sampling studies in the TP's remote regions remain insufficient for current needs. The gathered data are generally fragmented and unsystematic; they are characterized by low temporal resolution, limited aerosol property parameters, and sparse data points. Typically, these studies have been localized to specific sites, utilizing single instruments with temporal resolutions ranging from days to weeks over brief periods. Such low temporal resolution limits the accurate understanding of aerosols' temporal evolution and underlying mechanisms, especially during rapid, short-term events. Additionally, integrating and comparing data across different research groups is challenging due to variations in research focuses, measured parameters, sampling methodologies, laboratory filter processing, and data analysis techniques. Moreover, despite the relative ease of off-line sampling, extensive areas of the TP still lack such observational efforts. To date, comprehensive research focusing on multiple aerosol parameters through real-time online consecutive measurements (with high temporal resolutions ranging from minute to hour scales) at multiple sites remains a rarity in the TP.
Research on atmospheric aerosols in China has achieved significant advancements over the past decade. The Aerodyne high-resolution time-of-flight aerosol mass spectrometer (HR-ToF-AMS) has become a widely used online instrument, enabling numerous studies to characterize the real-time, size-resolved chemical compositions and sources of submicron aerosols (Li et al., 2017; Zhou et al., 2020). However, its application in the TP has been limited – a situation attributed to the instrument's demanding operational requirements and the area's challenging observation conditions. Since 2015, our research group has initiated a continuous and systematic observation project aiming to investigate the regional differences in aerosol sources and properties across the TP. This effort involves annual deployments of the HR-ToF-AMS alongside other high-resolution, real-time online instruments at various sites. Remarkably, our dataset represents the first and only collection that extensively covers a wide range of aerosol parameters (including physical, chemical, and optical properties and their diverse sources) across multiple geographic environments (e.g., urban, remote, high-altitude mountain, grassland, and subtropical forest) within the TP and its surroundings. This is achieved through real-time and high-time-resolution online observations, providing a comprehensive resource for understanding regional aerosol variations and serving as essential input for future aerosol radiative-forcing simulations and Earth system interaction assessments. The structure of this paper is as follows: Sects. 2 and 3 describe the observation sites, instrumental deployments, and data processing; Sect. 4 presents the high-time-resolution aerosol data, encompassing physical, chemical, and optical properties as well as source information; and the limitations and uniqueness of our dataset are discussed in Sect. 5.
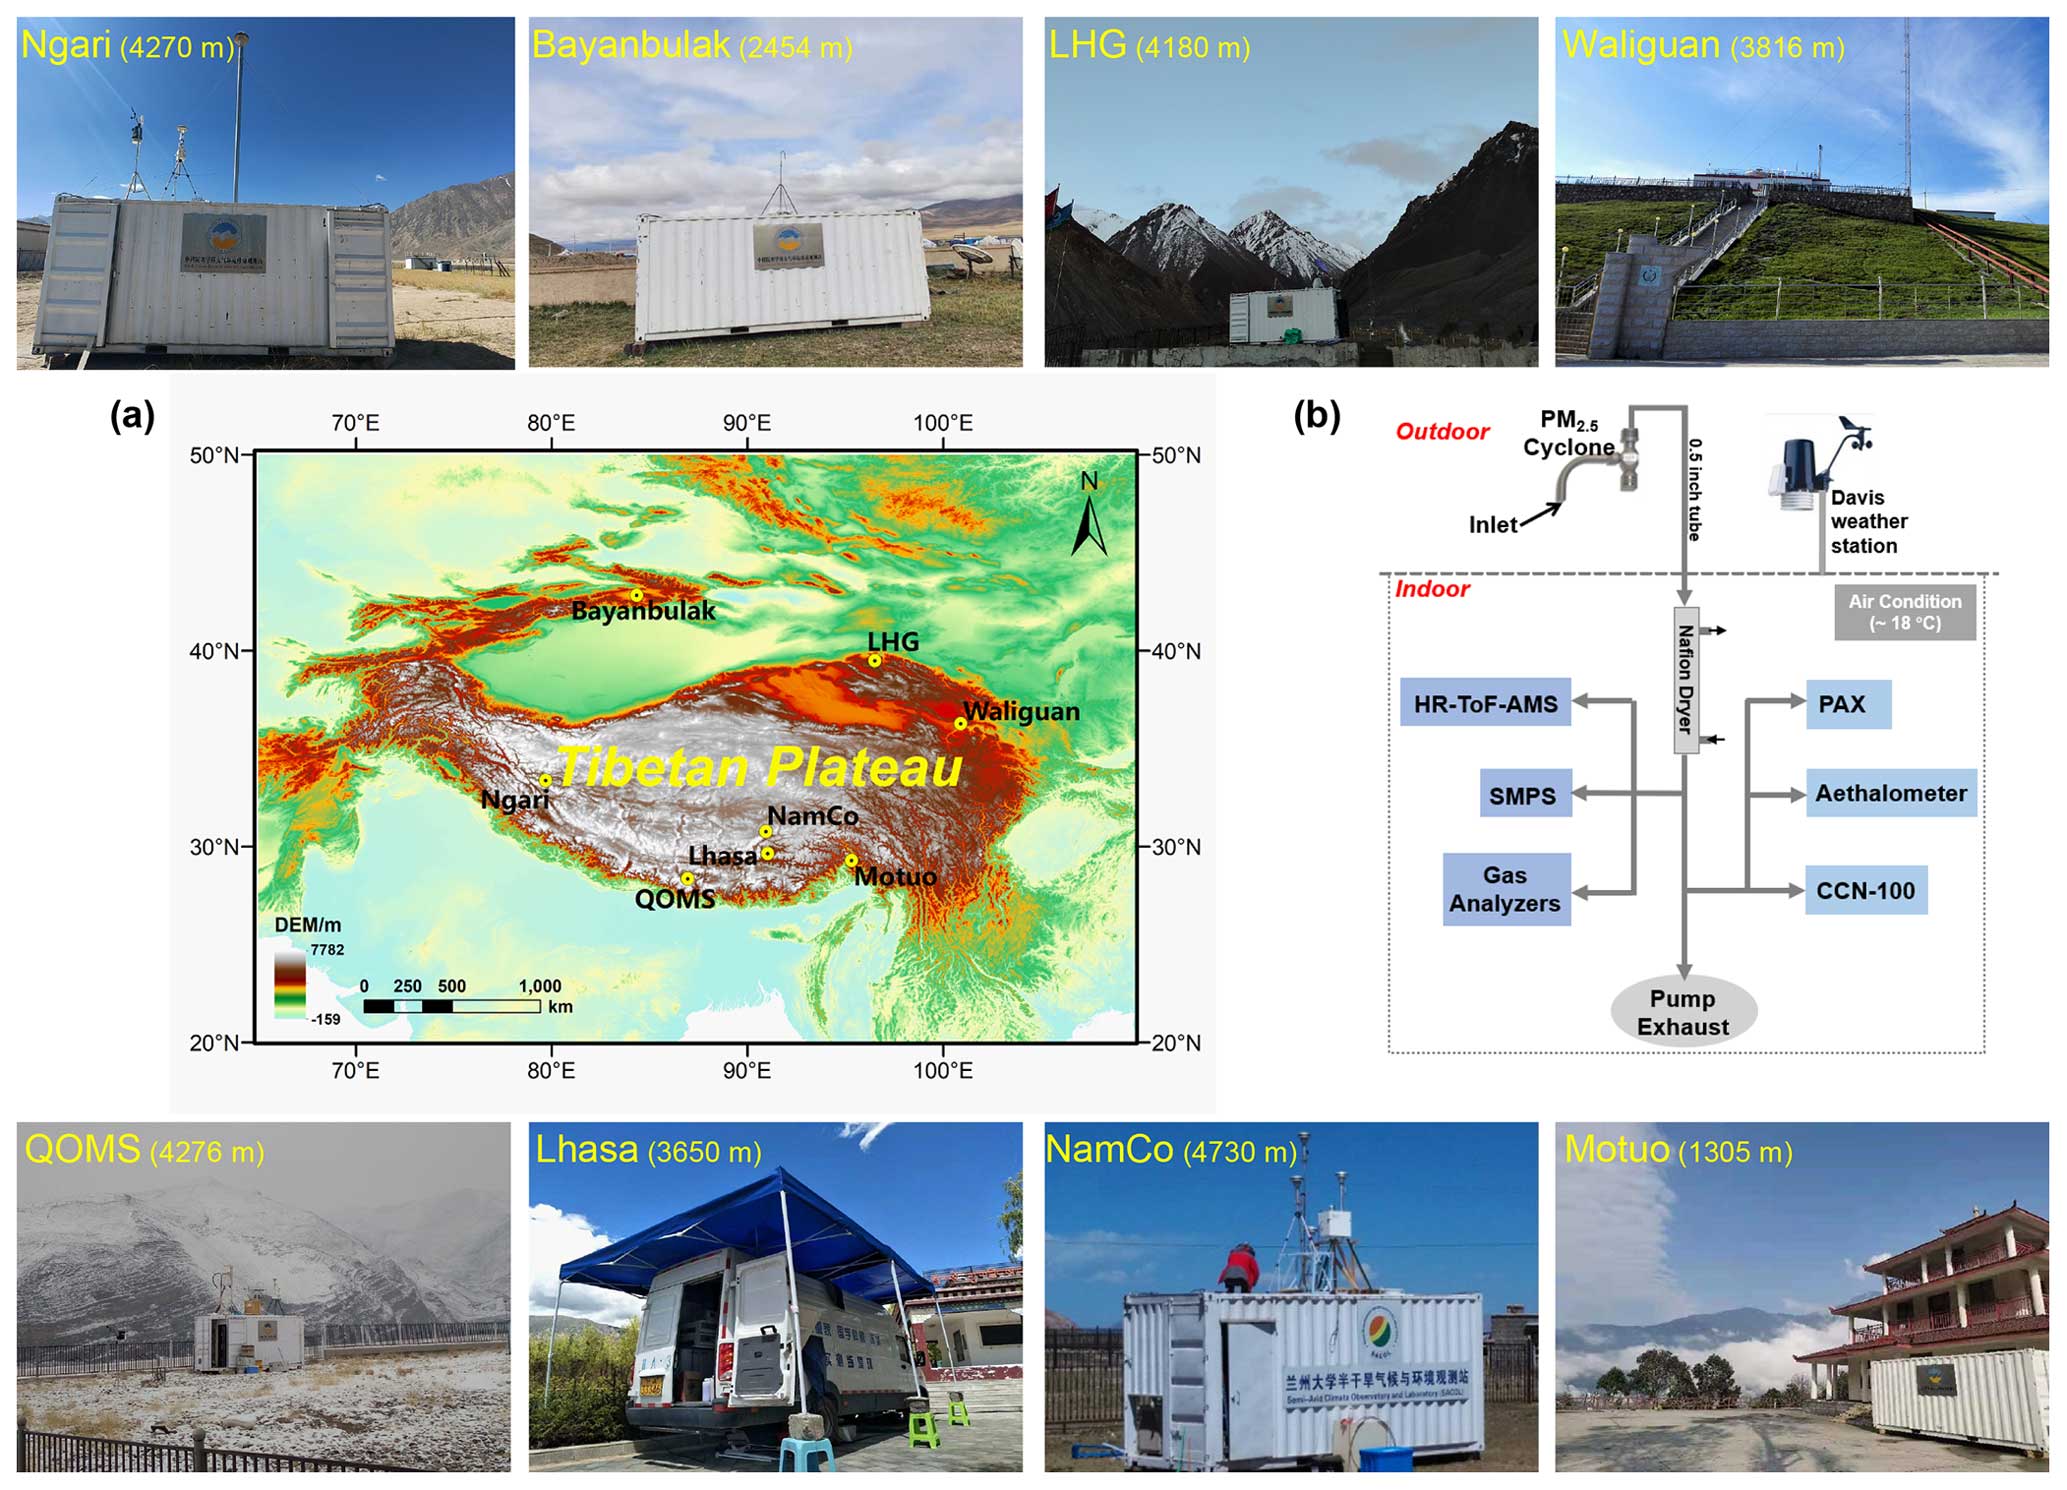
Figure 1(a) Geographical locations of the observation sites (see Table 1 for the full name and characteristics of each site) in the Tibetan Plateau and its surroundings used in this study (the geographical base map was created with ArcGIS). Fieldwork photographs illustrate the real observation conditions and surroundings at each site. (b) The normal sampling setups of instruments during the online aerosol observations.
Table 1Detailed information about the observation stations used in this study, including their full names and geographic location, as well as the sampling period, online instruments used, and corresponding reference publications.
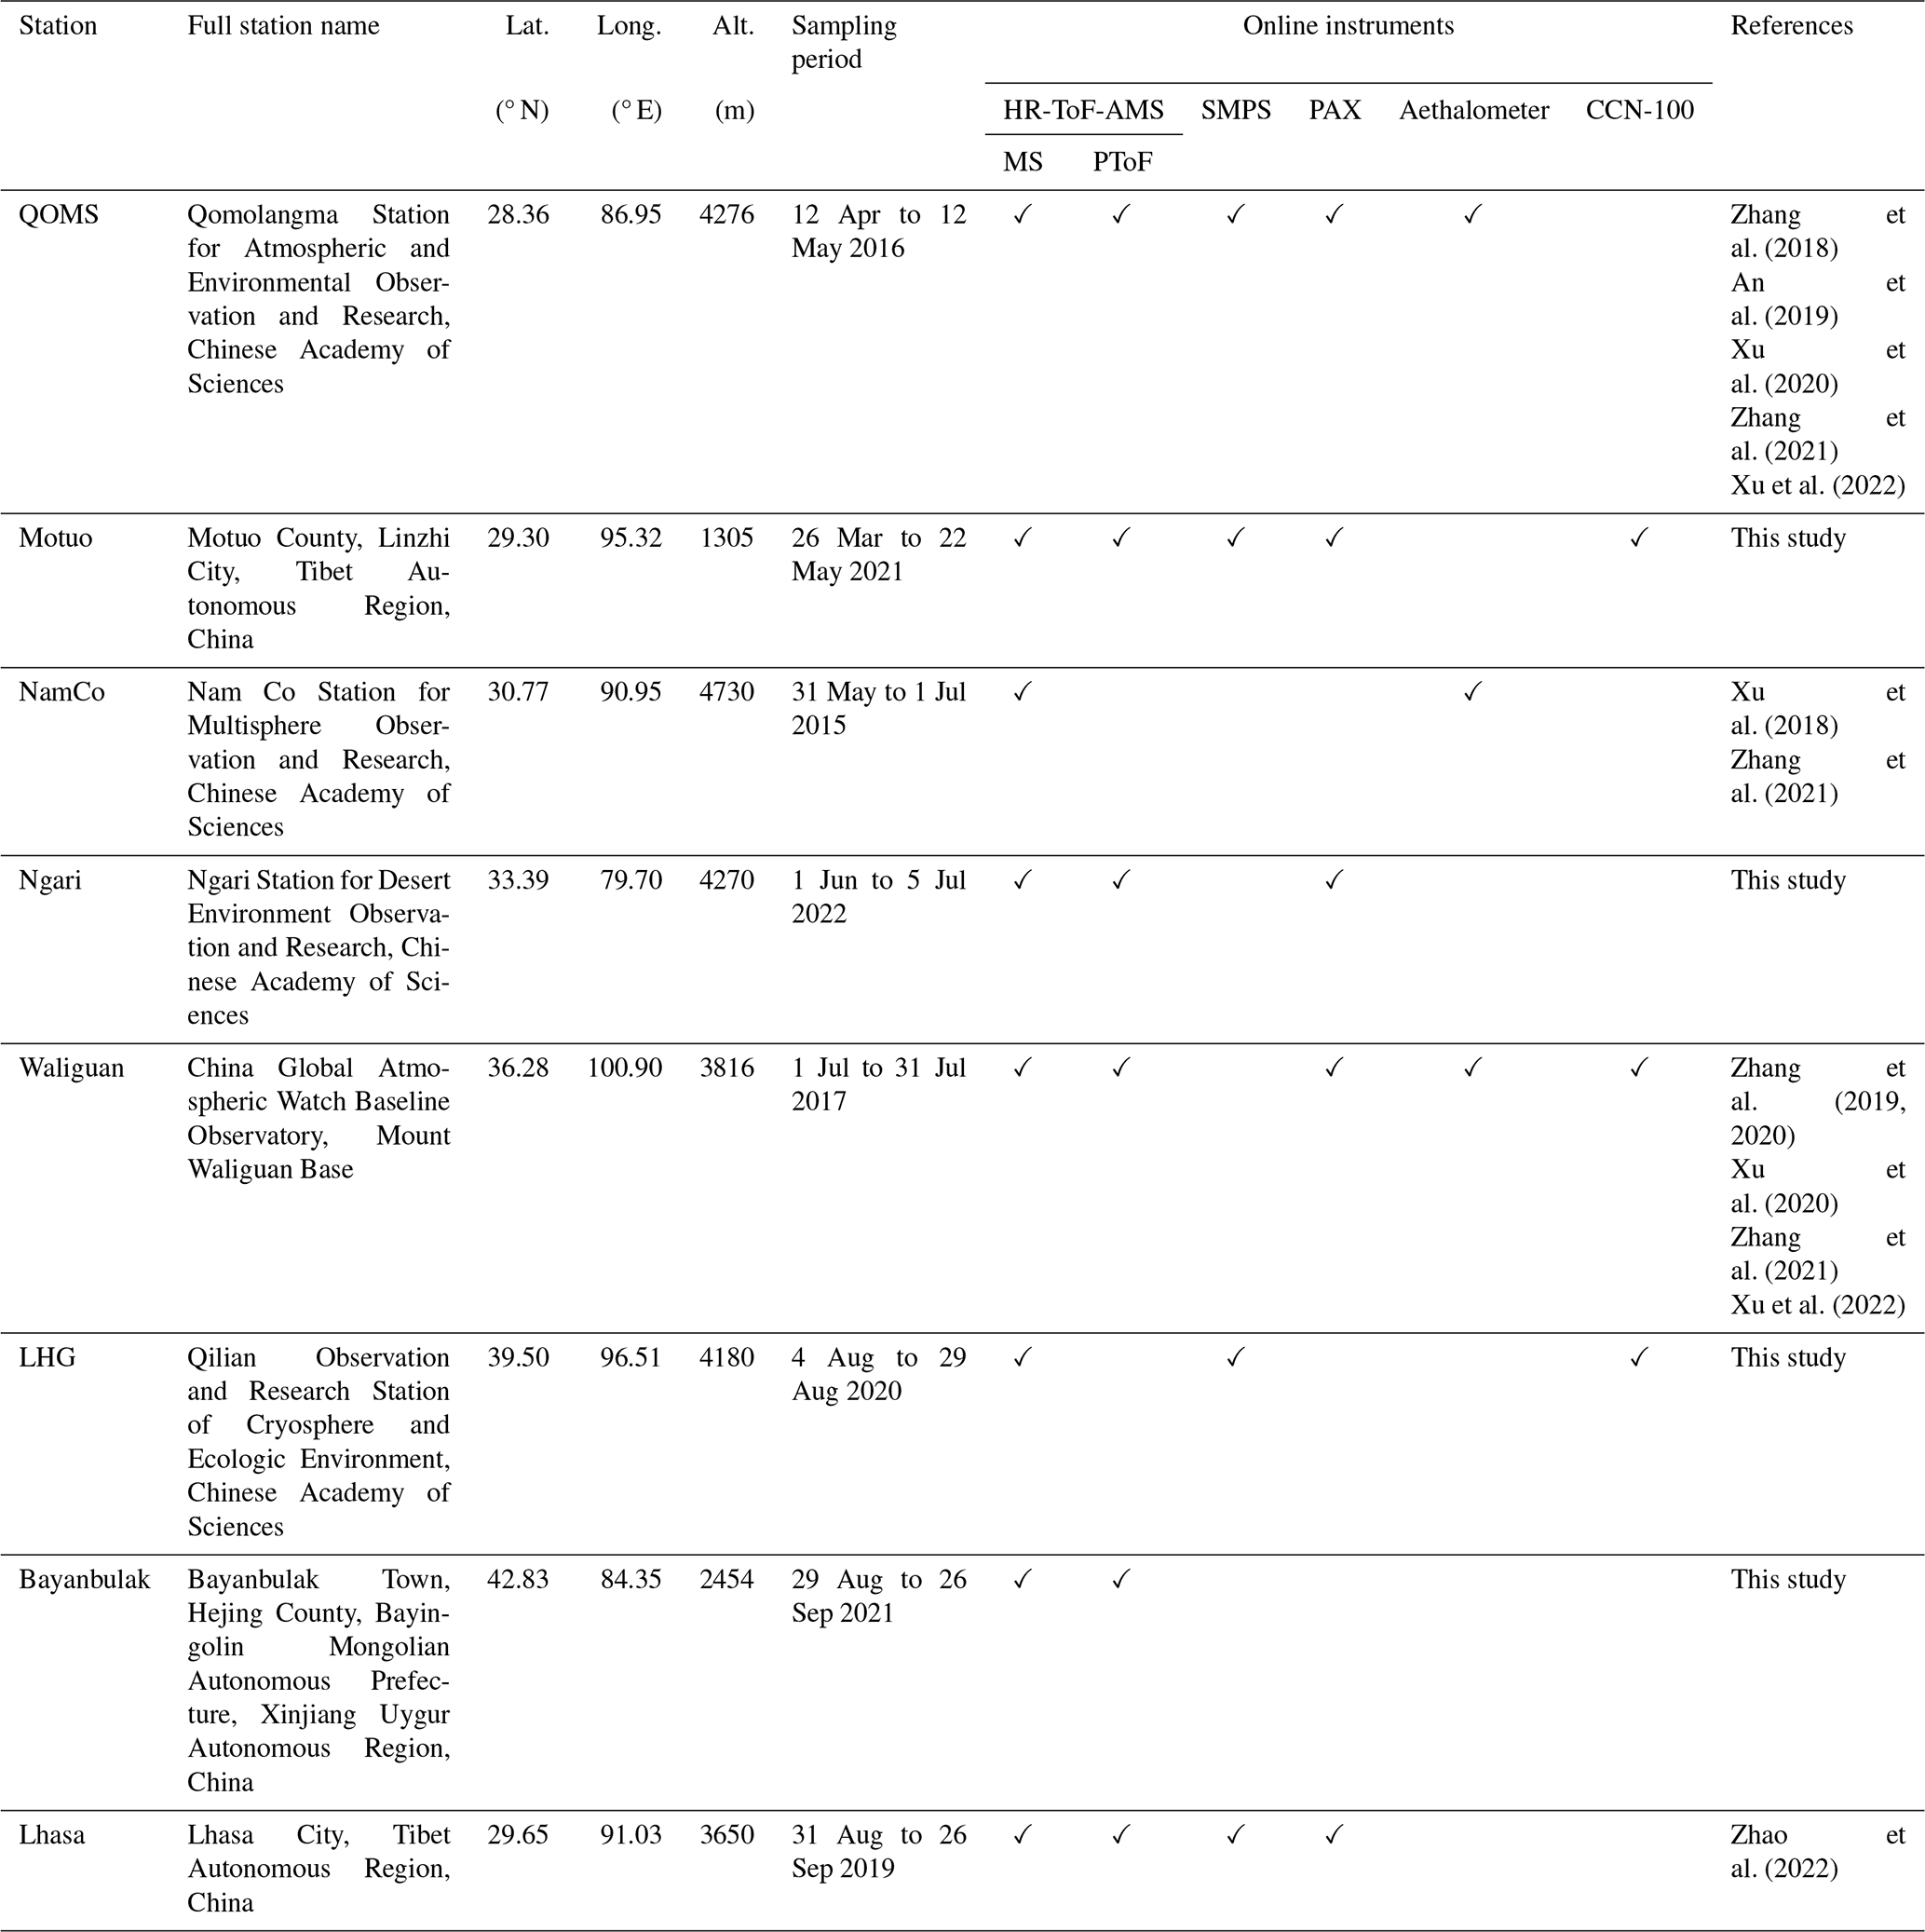
Between 2015 and 2022, intensive observations of atmospheric aerosol chemistry were carried out at eight sites across the TP and its surroundings. These sites comprise seven remote sites (QOMS, Motuo, NamCo, Ngari, Waliguan, LHG, and Bayanbulak) and one urban site (Lhasa), the latter serving as a contrast for comparative analysis. Figure 1 illustrates the geographical locations of these sites along with photographs taken during each observation. Table 1 details the specifics of each site, including the sampling periods and the instruments deployed during each field campaign. The subsequent sections provide brief descriptions of these sites, arranged geographically from the southern to the northern parts of the TP.
2.1 QOMS
The Qomolangma Station for Atmospheric and Environmental Observation and Research, Chinese Academy of Sciences (86.56° E, 28.21° N; 4276 m a.s.l.; abbreviated as QOMS in this study, with similar abbreviations used for other sites hereafter), is situated in the Rongbuk Valley basin on the northern slope of Mt. Everest. The climate on the northern slope of Mt. Everest has obvious seasonal variation that is heavily influenced by the Indian monsoon system (Bonasoni et al., 2010; Cong et al., 2015). During the pre-monsoon season (typically March to May), dominant westerlies facilitate the long-range transport of atmospheric pollutants from South Asia, making QOMS an ideal high-altitude observatory at the south edge of the TP for examining transboundary pollutant transport into the plateau's interior. In the summer monsoon season (June–August), prevailing southerly winds bring warm and wet airflow from the Indian Ocean, leading to increased humidity and precipitation in the plateau.
2.2 Motuo
Motuo County is located in the lower reaches of the Yarlung Tsangpo River, on the southern slopes of the eastern Himalayas and Gangrigab Mountains at the southeast edge of the TP. The county, sited halfway up a mountain, enjoys a subtropical humid climate characterized by relatively high temperatures and abundant rainfall. With a small population of ∼15 000, Motuo County remains one of the TP's most pristine regions. The sampling site in Motuo (29.30° N, 95.32° E; 1305 m a.s.l.) was located atop a hill overlooking the Yarlung Tsangpo Grand Canyon. This vantage point makes it an ideal location for directly monitoring the transboundary transport of atmospheric pollutants and moisture from Southeast Asia and the Indian Ocean into the TP.
2.3 NamCo
The Nam Co Station for Multisphere Observation and Research, Chinese Academy of Sciences (NamCo; 30.77° N, 90.95° E; 4730 m a.s.l.), is a high-altitude observatory in the south-central part of the TP. Situated at the southeast shore of Nam Co Lake, the station is surrounded by a pristine and isolated area. The region experiences a typical semi-arid plateau monsoon climate characterized by increased precipitation during the summer monsoon season. NamCo is a pivotal inland site within the TP and is predominantly influenced by air masses from the south and west.
2.4 Ngari
The Ngari Station for Desert Environment Observation and Research, Chinese Academy of Science (Ngari; 33.39° N, 79.70° E; 4270 m a.s.l.), is located in Rutog County within the Ngari Prefecture of the Tibet Autonomous Region, China. This area is at the southwestern edge of the TP and is characterized by a semi-arid climate, sparse vegetation, and intense solar radiation. As a key member of the High-Cold Region Observation and Research Network for Land Surface Processes & Environment of China, the Ngari station plays a crucial role in monitoring climate, hydrological, atmospheric, and ecological environmental changes in the TP's western territories. Additionally, it contributes to understanding the interactions between the Indian monsoon system and the westerlies.
2.5 Waliguan
The Waliguan Baseline Observatory (Waliguan; 36.28° N, 100.9° E; 3816 m a.s.l.) is one of the 29 baseline stations of the Global Atmosphere Watch (GAW) program of the World Meteorological Organization (WMO). Situated at the top of Mt. Waliguan, which rises approximately 600 m, the observatory is located in a pristine region with minimal human activity impact. Waliguan represents a key observatory on the northeastern edge of the TP and is predominantly influenced by air masses from the northeast during the summer. This location is strategic for studying the transport of air pollutants from industrial regions in northwestern China to the TP and the impact of those pollutants in this study.
2.6 LHG
The Qilian Observation and Research Station of Cryosphere and Ecologic Environment, Chinese Academy of Sciences (LHG; 39.50° N, 96.51° E; 4180 m a.s.l.), is located approximately 1 km from the terminus of Laohugou No. 12 Glacier This glacier is among the largest mountain glaciers on the northern slope of the western Qilian Mountains. The LHG serves as another notable station in the northeastern TP and is distinctly remote from human settlements. The climate in this region is predominantly arid and continental, influenced by the East-Asian monsoon in summer and the westerlies in winter. A pronounced mountain-valley breeze during summer facilitates the upward transport of air masses from lower altitudes, making the LHG an ideal site for background air mass sampling and for investigating the transport and potential impacts of air pollutants from surrounding areas.
2.7 Bayanbulak
The Bayanbulak National Basic Meteorological Station (Bayanbulak; 84.35° N, 42.83° E; 2454 m a.s.l.) is located in the Bayanbulak grassland northwest of Hejing County in the Xinjiang Uygur Autonomous Region, China. Bayanbulak lies within an intermontane basin in the central Tianshan Mountains and is surrounded by numerous snow mountains with altitudes of more than 3000 m. The Bayanbulak grassland is characterized by a typical temperate continental mountain climate, with an annual average precipitation ranging between 200 to 300 mm. The town of Bayanbulak experiences minimal human activities and traffic, so it has retained a pristine environment.
2.8 Lhasa
Lhasa (29.65° N, 91.03° E; 3650 m a.s.l.) is the capital of the Tibet Autonomous Region, China, and is located in the south-central part of the TP. The city lies in a broad river valley surrounded by mountains that reach up to 5500 m, with the Lhasa River passing through the city from west to east. Our observation site is located in Binhe Park, adjacent to the Lhasa River. Notably, the Norbulingka scenic area, one of the main activity centers for local Tibetans celebrating their religious festivals (such as the Sho Dun festival), is located ∼1 km to the northwest of the sampling site. Moreover, the Potala Palace, the center of Tibetan Buddhism, is ∼1.8 km to the northeast. Given Lhasa's unique energy structure and the distinct living habits of the residents, comparative observations were carried out at this urban site. Those studies aimed to investigate the primary aerosol properties and sources, particularly those from various residential combustion activities.
3.1 Online real-time aerosol sampling over the TP
Atmospheric aerosol observations were conducted at each site using a suite of real-time, high-resolution instruments. These instruments typically included an HR-ToF-AMS (Aerodyne Research Inc., Billerica, MA, USA) to determine the chemical composition (organic aerosol (OA), nitrate, sulfate, ammonium, and chloride) of non-refractory submicron aerosol (PM1); a scanning mobility particle sizer (SMPS, model 3936, TSI Inc., Shoreview, MN, USA) to measure the size distribution and number concentration of submicron particles; a photoacoustic extinctiometer (PAX, DMT Inc., Boulder, CO, USA) for obtaining particle light-absorption, scattering, and extinction coefficients (Babs, Bscat, and Bext) along with the single-scattering albedo (SSA) at 405 nm and the BC mass concentration; an Aethalometer (model AE33/AE31, Magee Scientific Corp., Berkeley, CA, USA) for acquiring Babs across seven wavelengths (370–950 nm); and a cloud condensation nuclei (CCN) counter (model CCN-100, DMT Inc., Boulder, CO, USA) to measure CCN number concentrations at various water vapor supersaturation (SS) values. The measurement uncertainty for each instrument is difficult to quantify based on the data from a single instrument. The following uncertainties were taken from other studies: <30 % for the HR-ToF-AMS (Jimenez et al., 2016) and SMPS, <40 % for the Aethalometer (Backman et al., 2017), <10 % for the PAX (Selimovic et al., 2018), and <25 % for the CCNC (Rose et al., 2008). Details on the specific instruments deployed and the sampling periods for each observation campaign are summarized in Table 1.
The HR-ToF-AMS was the cornerstone instrument for atmospheric aerosol chemistry observations across all field campaigns. The SMPS was deployed at QOMS, Motuo, LHG, and Lhasa, whereas the PAX was employed at QOMS, Motuo, Ngari, Waliguan, and Lhasa. The Aethalometer was utilized at QOMS, NamCo, and Waliguan, with the CCN-100 operational at Motuo, Waliguan, and LHG. Field observations in the southern, western, and central regions of the TP were predominantly conducted during the pre-monsoon season and aimed to study the transboundary transport of pollutants from South Asia into the TP under the influence of westerlies and the Indian monsoon. For instance, observations took place at QOMS from 12 April to 12 May, at Motuo from 26 March to 22 May, at NamCo from 31 May to 1 July, and at Ngari from 1 June to 5 July. On the other hand, measurements in the remote regions of the northern TP and its surroundings were carried out during the summer to track aerosol transport from surrounding polluted areas, considering the effects of the westerlies or the intensified East Asian monsoon. Specifically, observations occurred from 1 to 31 July at Waliguan, from 4 to 29 August at LHG, and from 29 August to 26 September at Bayanbulak. The observations at Lhasa were conducted from 31 August to 26 September and focused on capturing the peak atmospheric oxidation capacity during the summer.
3.2 Instrumental setup
Despite the variations in instrumentation across different observation campaigns, the core setup for sampling was largely consistent. Figure 1b illustrates that the standard sampling configuration for each campaign typically involved housing all instruments within an air-conditioned trailer or room. The inlets to the instruments were on the roof, and a cyclone (model URG-2000-30EH, URG Corp., Chapel Hill, NC, USA) was used in the front of the inlet to eliminate particles with an aerodynamic diameter (Dva) exceeding 2.5 µm. These fine particles were then passed through a Nafion dryer via in. (1.27 cm) stainless-steel tubing to dehumidify the airflows before they were directed into the instruments for real-time analysis. Detailed information on the setup and methodology of the instruments can be found in our previous publications (Xu et al., 2018; Zhang et al., 2018, 2019; Zhao et al., 2022).
3.3 Instrument operation and data processing
The measurement principles, operation procedures, calibration methods, and data analysis for the instruments used in this study are thoroughly detailed in Sects. S1–S4 of the Supplement. Here, we highlight only key descriptions and critical settings. (1) The HR-ToF-AMS was operated in V mode during most of the eight field campaigns to accommodate the relatively low signal-to-noise ratios due to low aerosol mass loading in the TP regions. (2) Particle size observations were not conducted during the NamCo and LHG campaigns due to a chopper malfunction in the HR-ToF-AMS. (3) Different relative ionization efficiency (RIE) values were used for ammonium and sulfate, which were based on the ionization efficiency calibrations of HR-ToF-AMS performed in different campaigns. (4) Different size parameters were used, which were based on the particle sizing calibrations performed in different campaigns. (5) Elemental ratios of OA, such as the ratios of oxygen to carbon (), hydrogen to carbon (), organic matter to organic carbon (), and nitrogen to carbon (), were determined using the improved method (Canagaratna et al., 2015). (6) A default collection efficiency (CE) value of 0.5 was employed for the HR-ToF-AMS measurements during the QOMS, NamCo, Ngari, Waliguan, and Lhasa campaigns, considering that their bulk submicron aerosols were neutralized overall, whereas a composition-dependent CE (Middlebrook et al., 2012) value was adopted at Motuo, LHG, and Bayanbulak, where the aerosols were slightly acidic. (7) Source apportionment of OA during all observations was performed by positive matrix factorization (PMF) analysis. The details of the PMF solution determination for each site are not presented here but can be found in our previous publications on select campaigns (Xu et al., 2018; Zhang et al., 2018, 2019). (8) Only the chemical compositions of non-refractory PM1 are reported for the Bayanbulak campaign due to the absence of BC observations. (9) At both QOMS and Lhasa, the sample and sheath flow rates of SMPS were set at 0.3 and 3.0 L min−1, respectively, covering a particle size range between 14.6 and 661.2 nm in mobility diameter (Dm), whereas these rates were 0.5 and 5.0 L min−1 at the LHG and Motuo sites, respectively, with a range of 10.9–495.8 nm in Dm. (10) Aethalometer measurements were corrected for filter-based loading and multiple-scattering effects. A traditional absorption Ångström exponents (AAE) method (Zhang et al., 2021) was adopted to apportion the total Babs into two parts for BC and BrC (Babs,BC and Babs,BrC, respectively). (11) CCN number concentrations were measured at five different SS values (0.2 %, 0.4 %, 0.6 %, 0.8 %, and 1.0 %) in a 30 min cycle during the Motuo, Waliguan, and LHG campaigns.
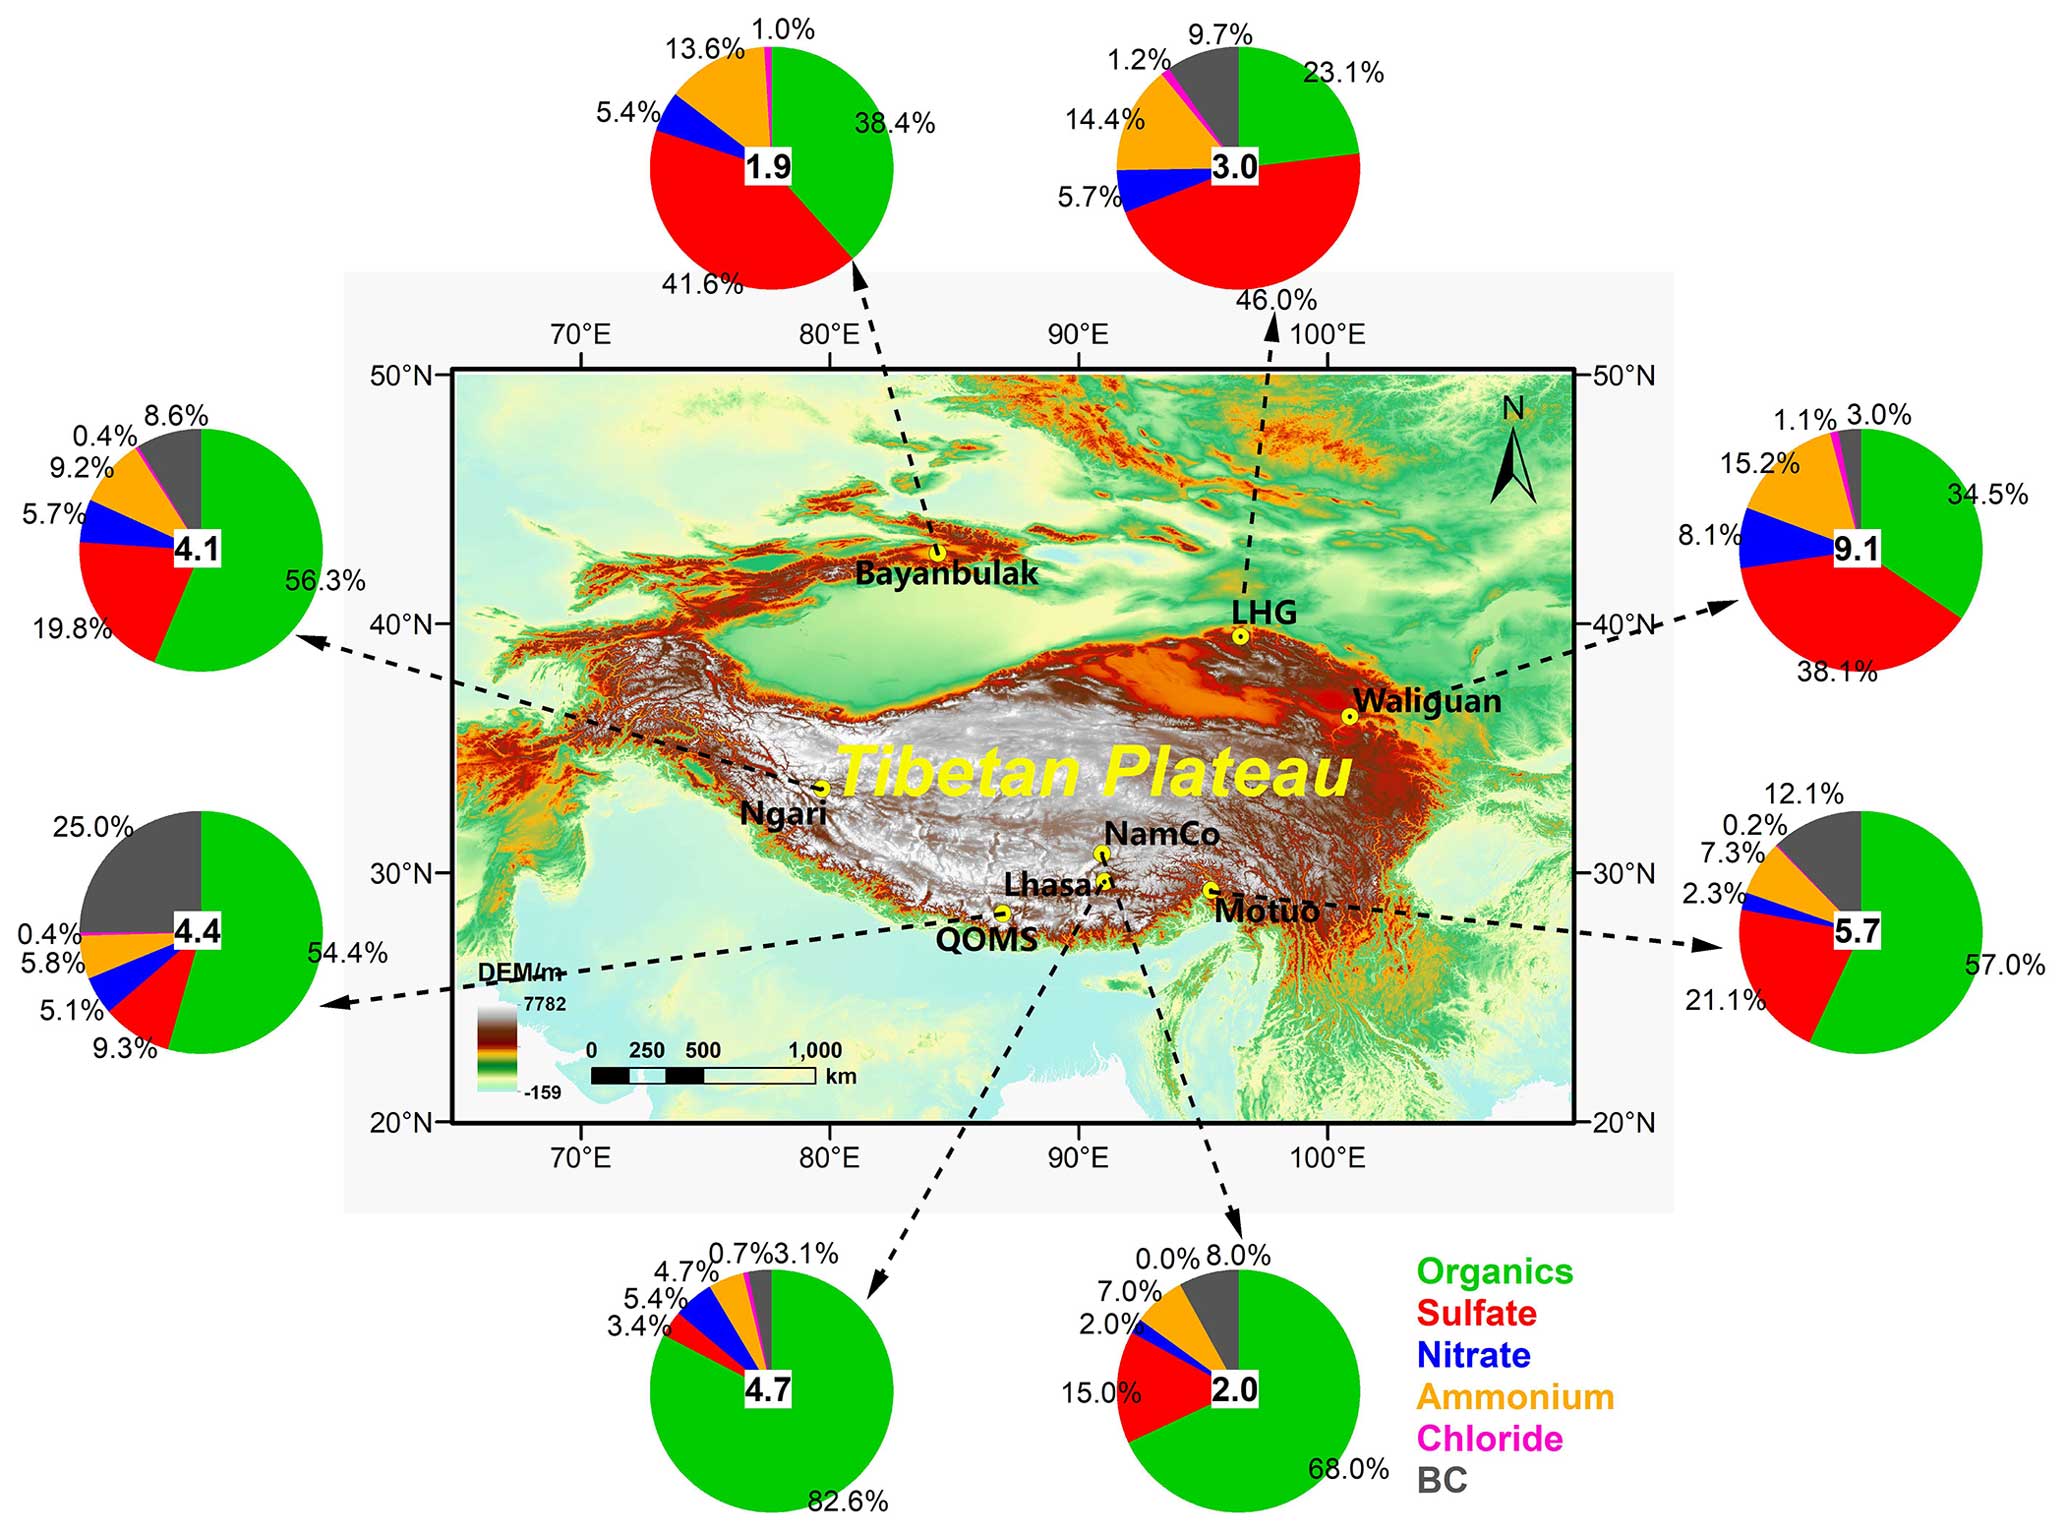
Figure 2Regional distributions of the average mass concentration (the value in the center of each pie chart, with units of µg m−3) and chemical composition (the percentage values around each pie chart) of submicron aerosols (PM1) from the eight online aerosol field measurements on the Tibetan Plateau and its surroundings (the geographical base map was created with ArcGIS). The concentration presented for each site was measured under ambient conditions.
Table 2Summary of the average values measured with various instruments during the eight aerosol field measurement campaigns in the TP and its surroundings in this study.
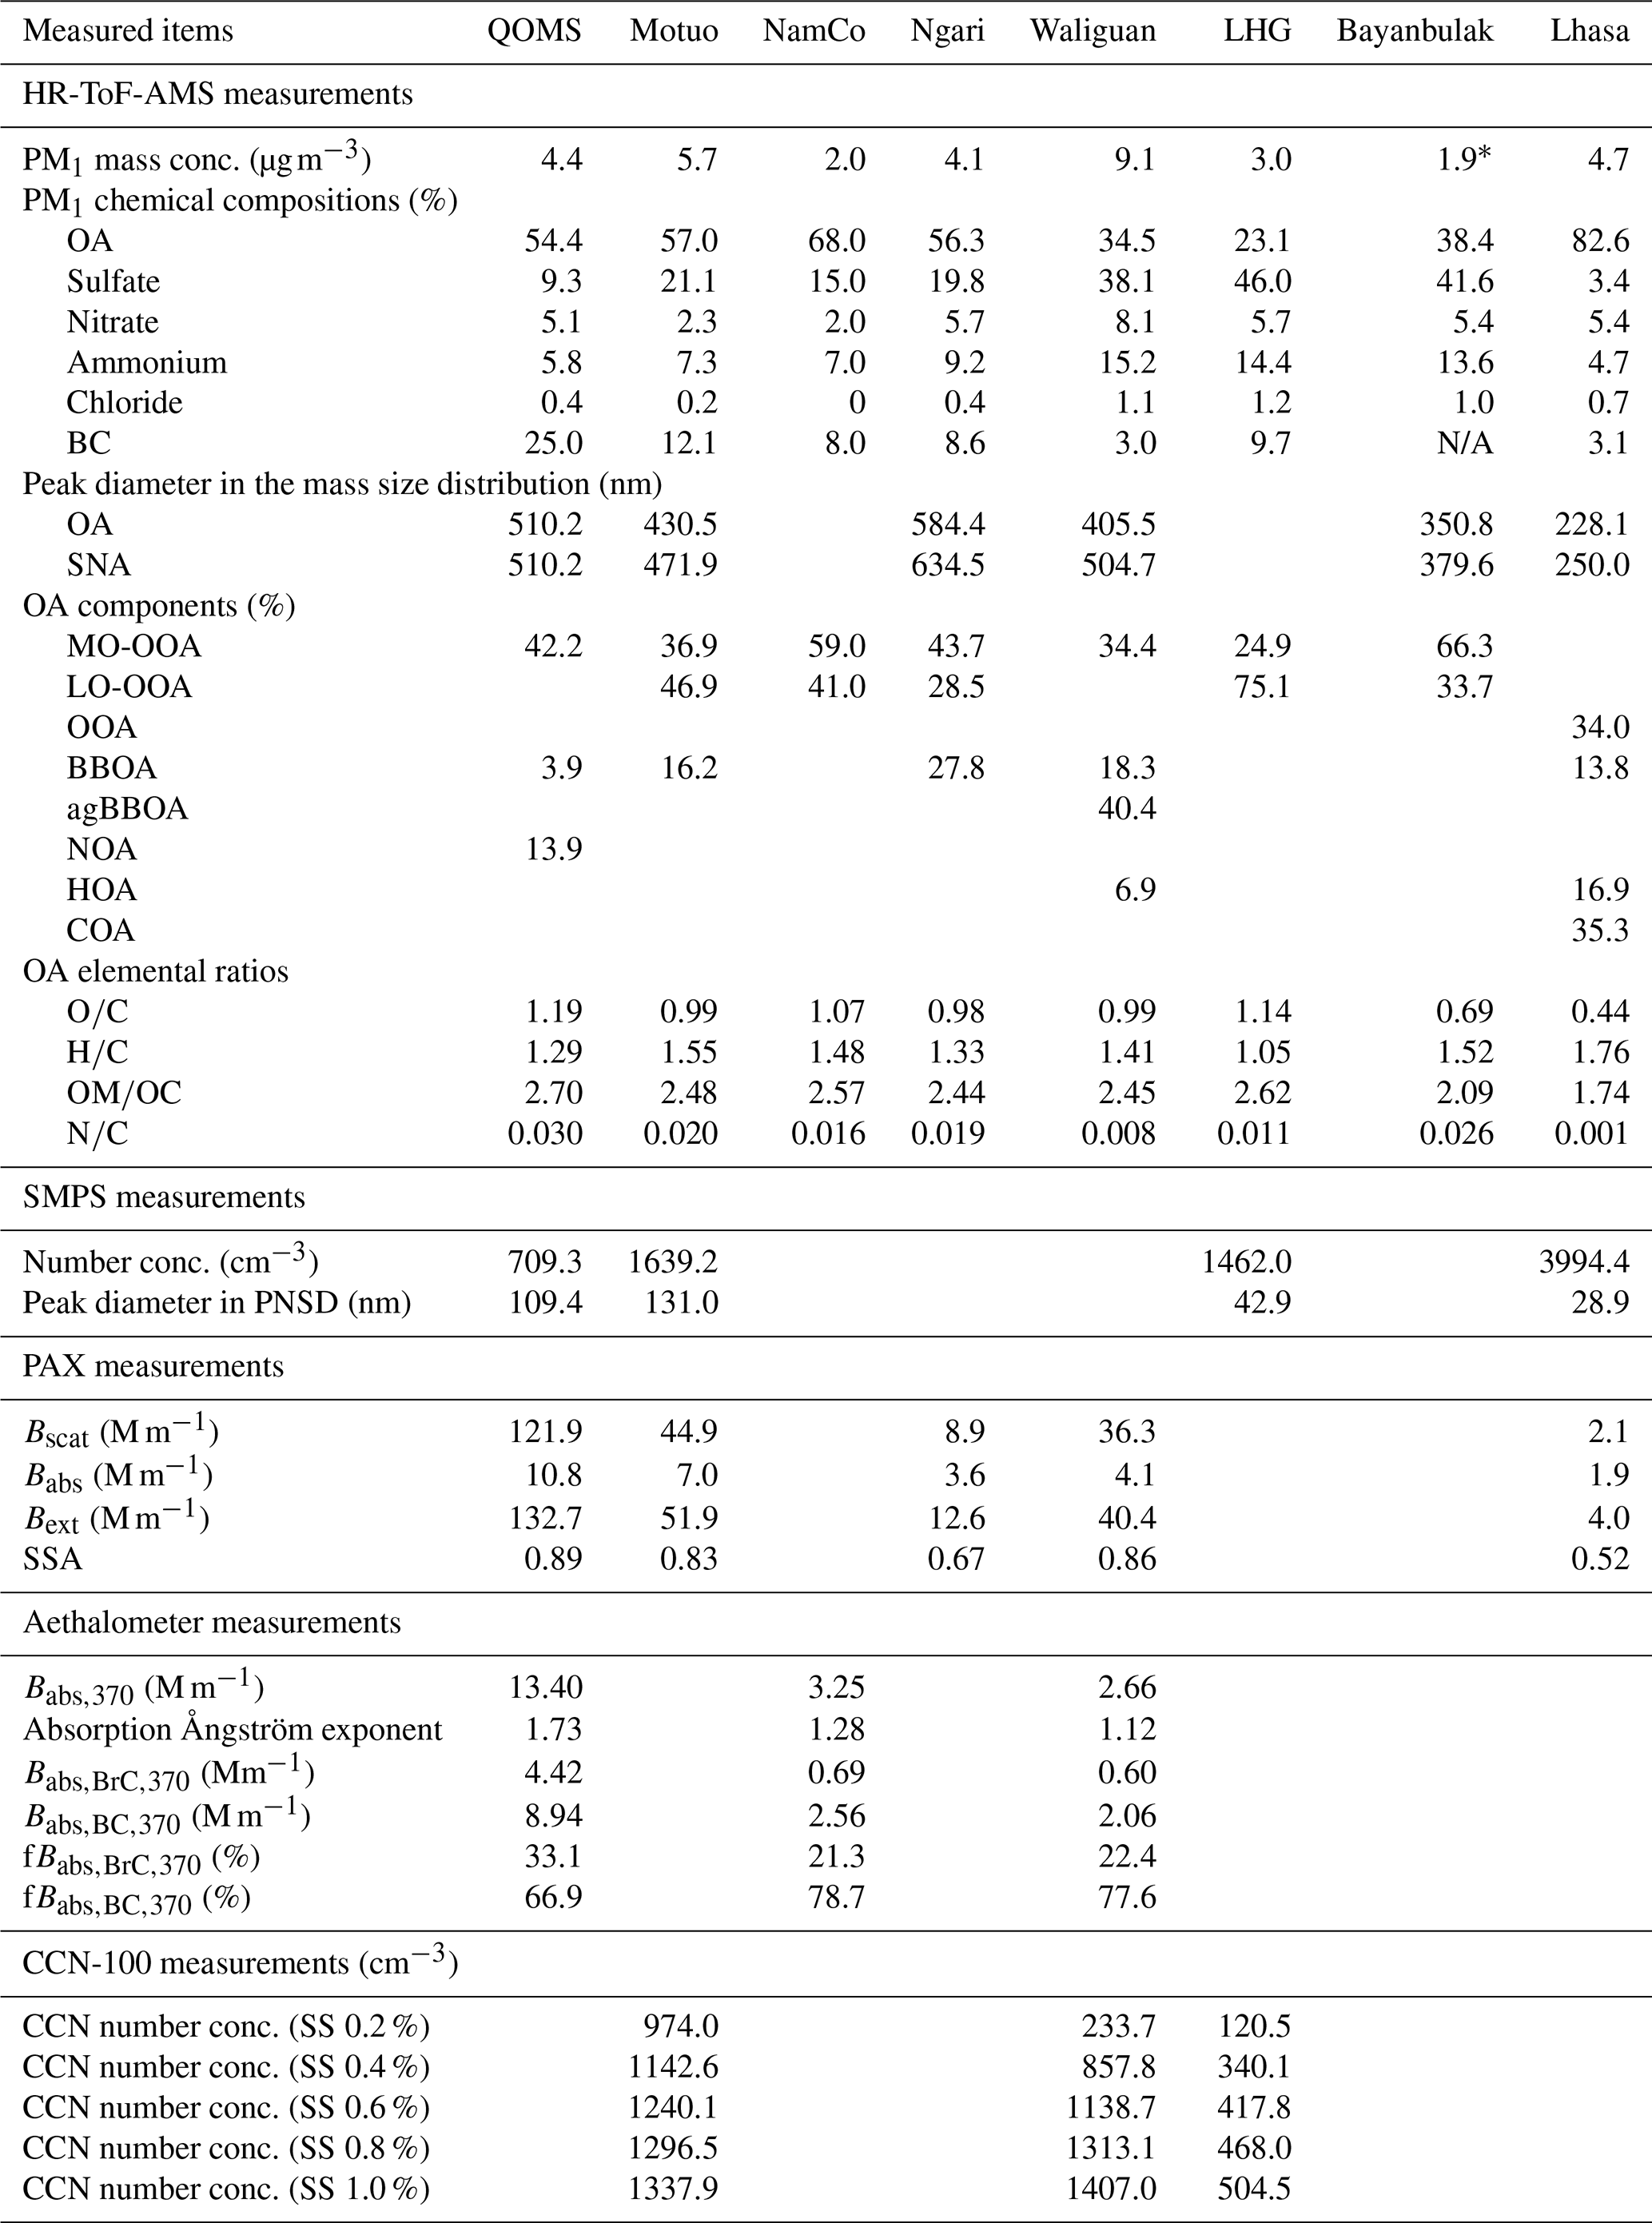
∗ Only the non-refractory PM1 at Bayanbulak is reported due to the absence of BC observations.
4.1 Mass loading and chemical composition of submicron aerosols
Figure S1 in the Supplement presents the temporal variations of PM1 chemical species (OA, nitrate, sulfate, ammonium, chloride, and BC) observed across the eight observations in the TP and its surroundings. The mass concentrations of PM1 and its components exhibited distinct variations, with a few periods of high mass loading observed throughout each campaign's sampling period. Despite the variations in sampling years (2015–2022), seasons (March–September), and altitudes (1350–4730 m a.s.l.) across these sites, the distinct PM1 mass concentrations and chemical compositions clearly illustrate the regional differences among these sites. On average, total PM1 mass concentrations across the eight campaigns ranged from 1.9 to 9.1 µg m−3 (Fig. 2 and Table 2). The highest mass concentration was observed at Waliguan, driven by the transport of anthropogenic aerosols and gaseous pollutants from urban centers in northwestern China. In contrast, the lowest values were observed at NamCo and Bayanbulak, reflecting their background and pristine environmental conditions. The average PM1 mass level across the TP and its surroundings was comparable to those observed at other high-altitude, coastal, forest, and remote background sites globally (0.46–15.1 µg m−3; Table 3), yet it remains significantly lower than those observed in densely urban (34.4–71.5 µg m−3) and suburban (21.4–44.9 µg m−3) areas in other parts of China (Li et al., 2017). This suggests that the atmospheric conditions in the remote and high-altitude regions of the TP are predominantly clean.
Table 3Summary of the average PM1 mass concentrations (µg m−3) measured by the Aerodyne AMSs at various high-altitude and remote sites worldwide.
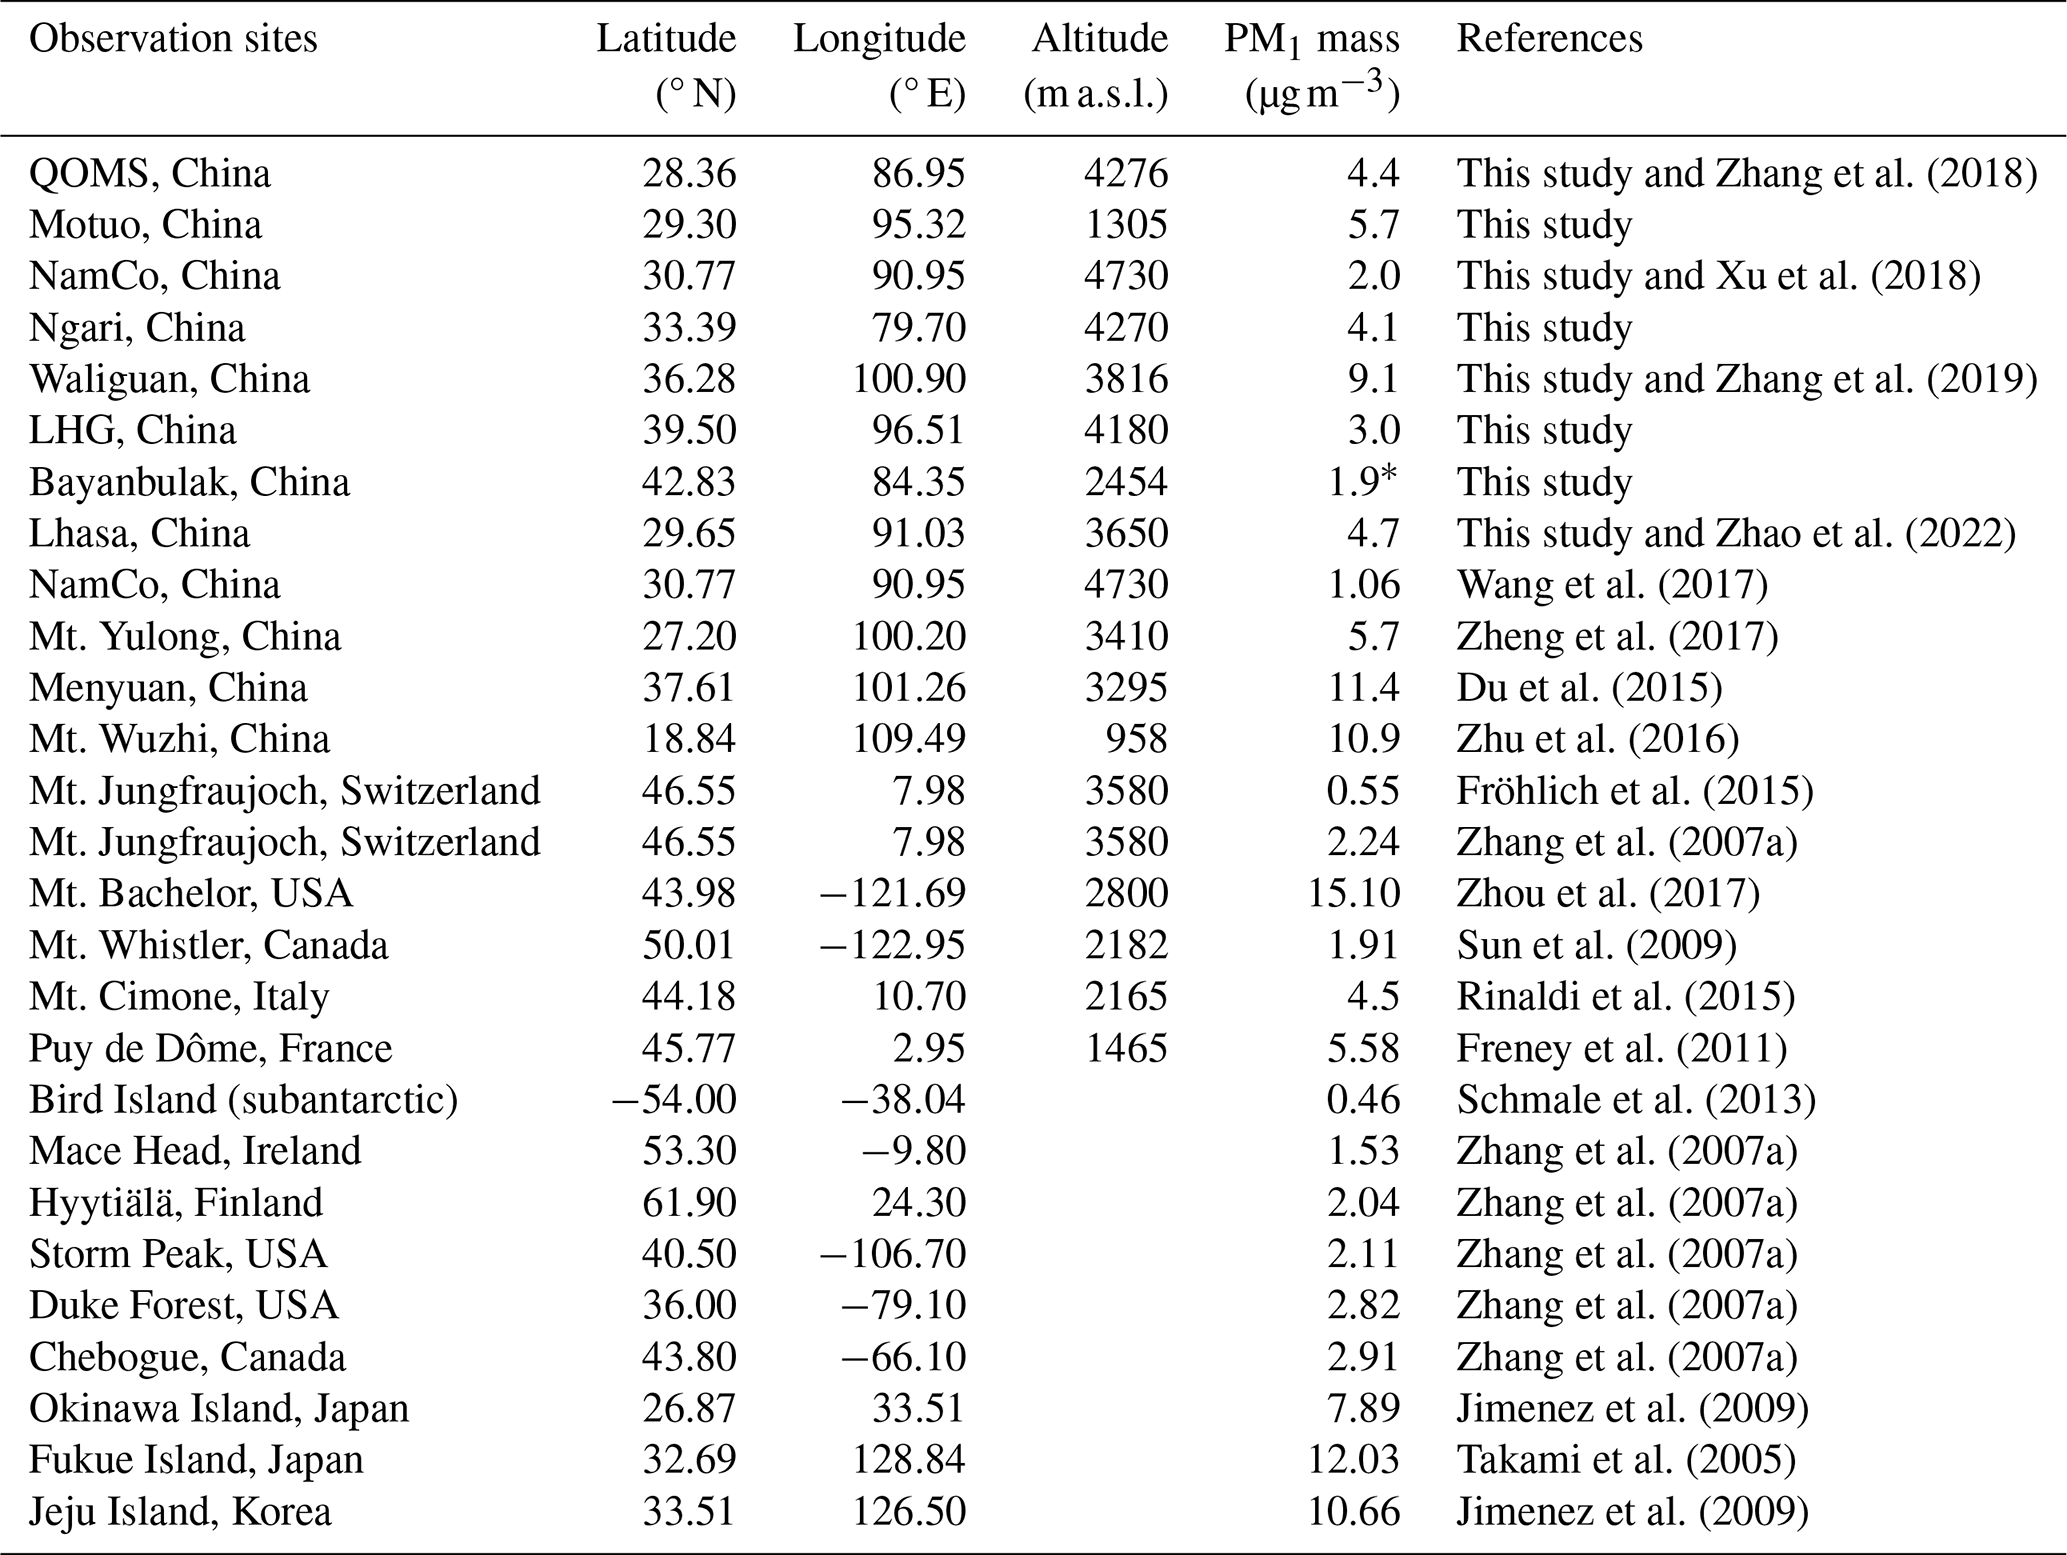
∗ Only the non-refractory PM1 at Bayanbulak is reported due to the absence of BC observations.
The chemical compositions of PM1 also exhibited significant regional differences across the TP (Fig. 2), highlighting the varied aerosol sources in different areas of the TP. At five sites (QOMS, Motuo, NamCo, Ngari, and Lhasa) located in the southern, western, or central TP, OA and BC together accounted for as high as 64.9 %–85.7 % of the total PM1 mass (Table 2). This high contribution was largely attributed to the frequent transport of biomass-burning emissions from South and Southeast Asia to the TP during the pre-monsoon season (Bonasoni et al., 2010; Cong et al., 2015; Zhang et al., 2018), along with significant local biomass burning from religious activities in Lhasa (Cui et al., 2018; Zhao et al., 2022). In contrast, at the three northern sites (Waliguan, LHG, and Bayanbulak), inorganic species (sulfate, nitrate, and ammonium; referred to as SNA) accounted for more than 60 % of the total PM1. Sulfate was the most significant component of SNA (38.1 %–46.0 %), aligning with observations from another high-altitude site in the northeastern TP (Menyuan; 28 %) and various rural and remote sites (19 %–64 %) in East Asia (Du et al., 2015). The pronounced SNA contributions, particularly those of sulfate, in the northern TP and its surroundings were mainly related to the regional transport of anthropogenic aerosols and its gaseous precursor from nearby urban areas as well as important in-cloud aqueous reactions during the transportation to the mountains (Zhang et al., 2019).
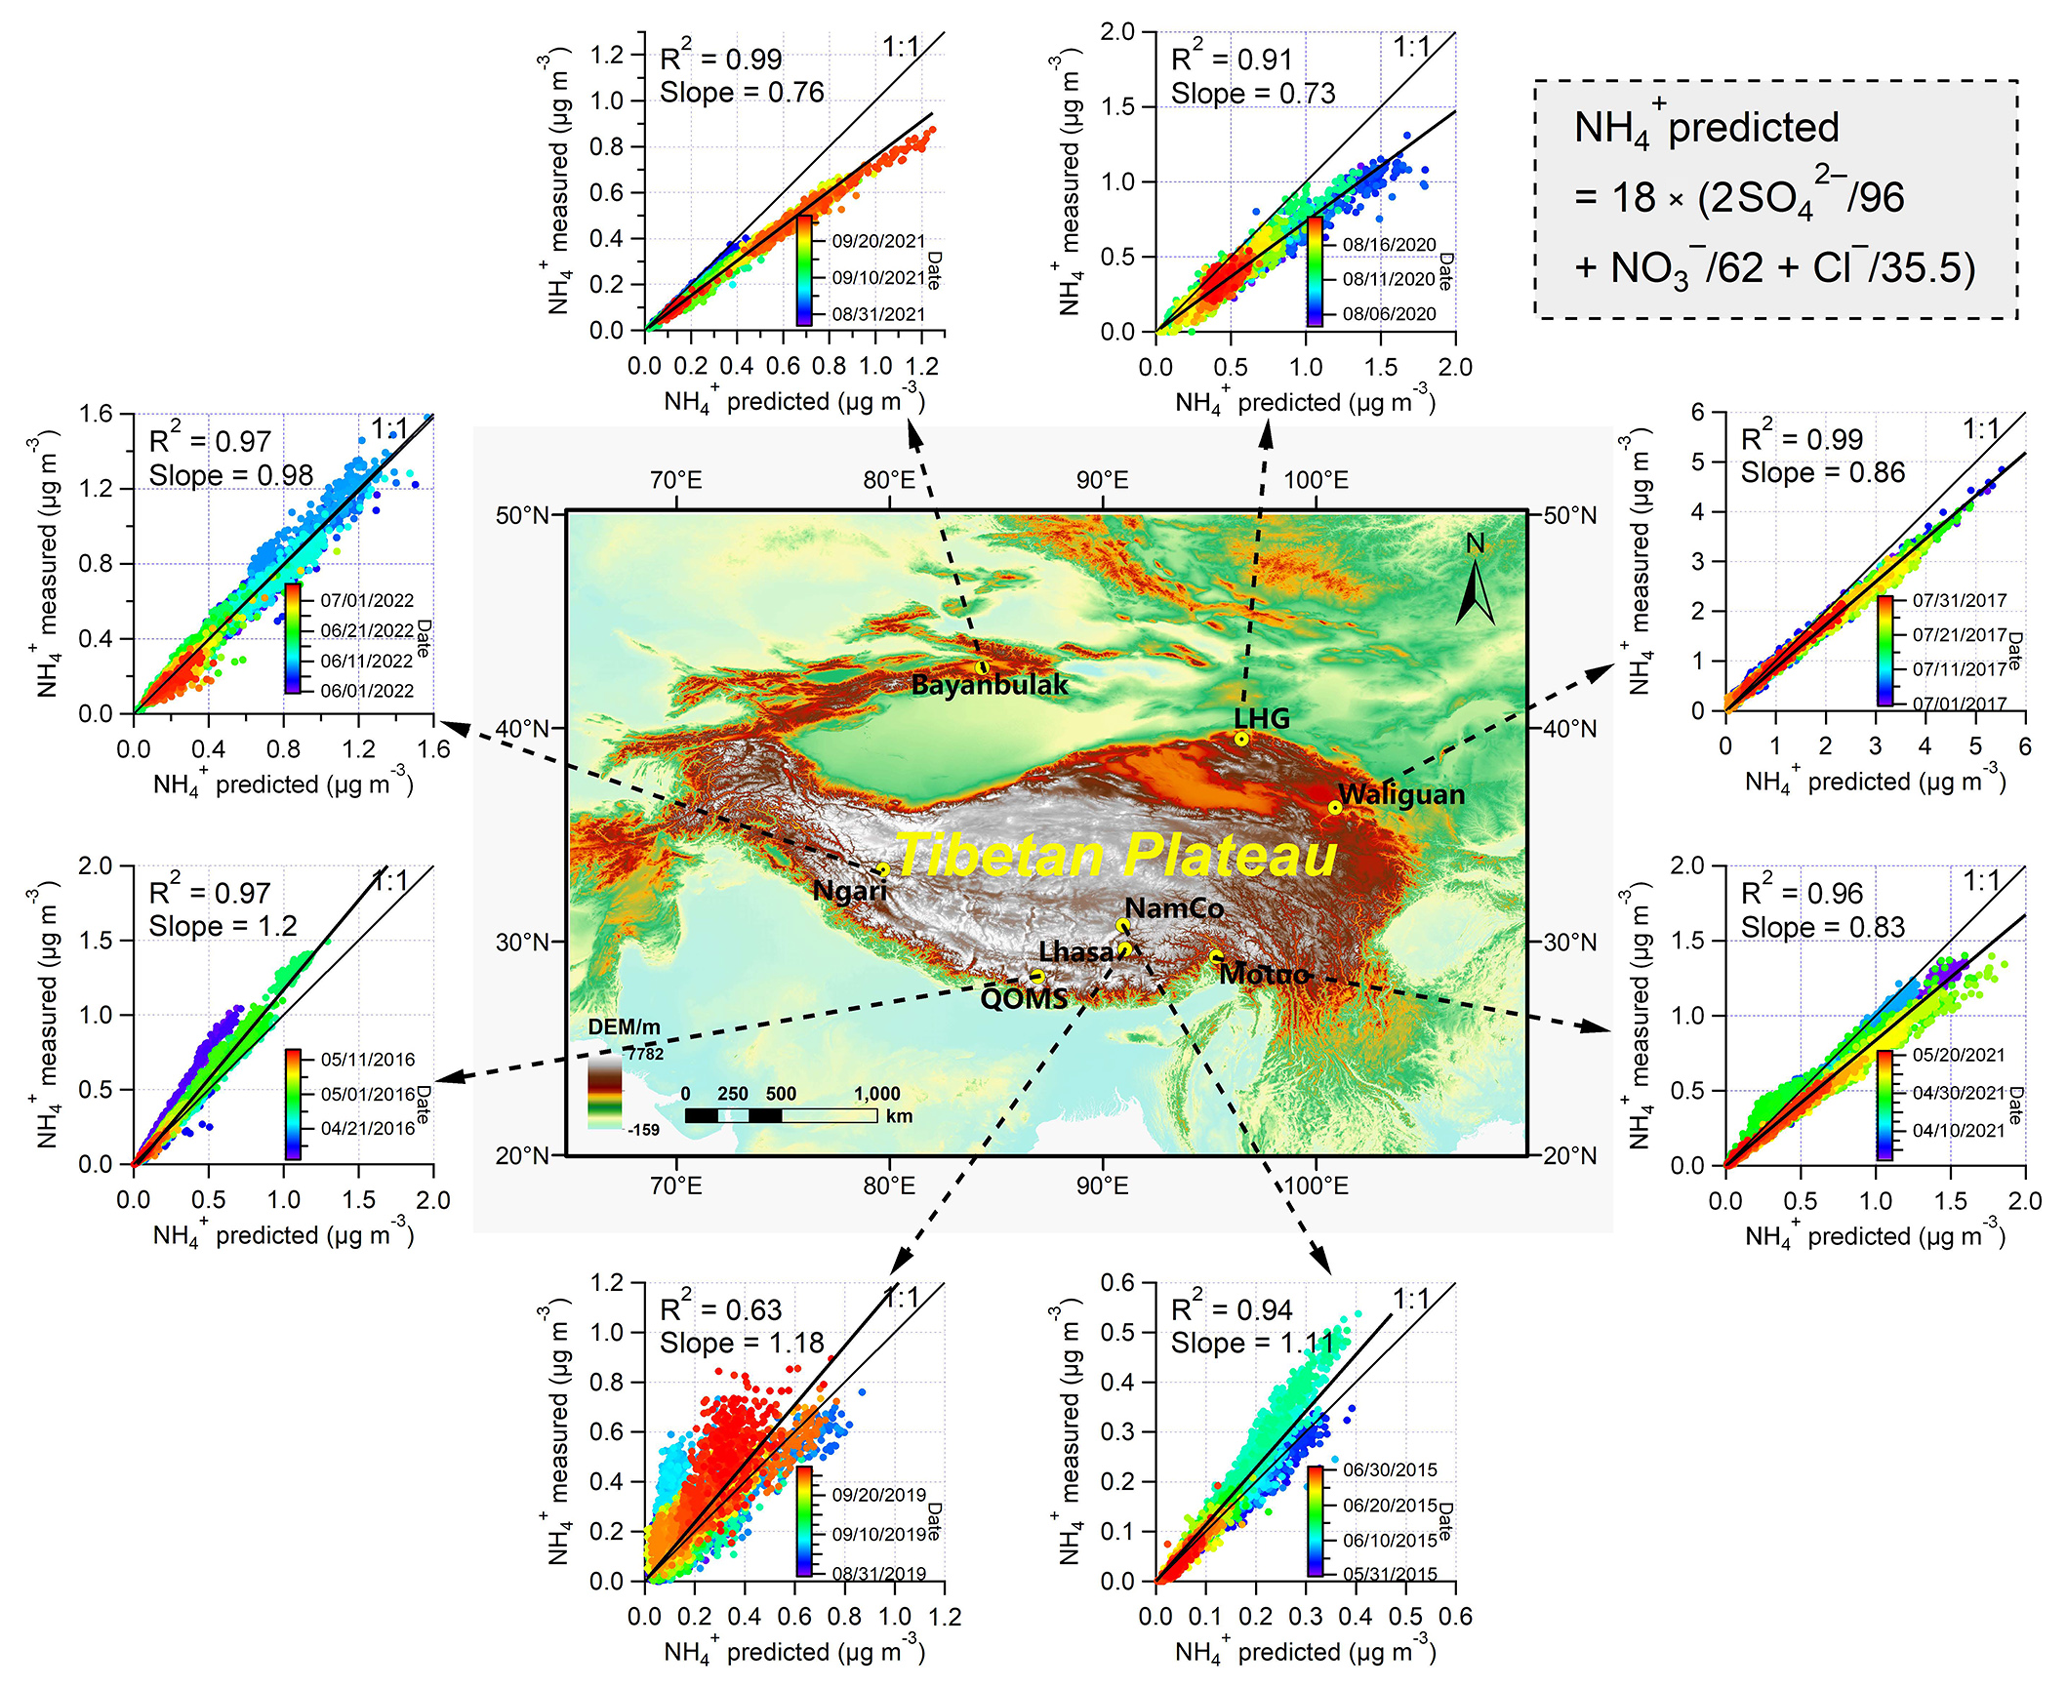
Figure 3Regional differences in the bulk acidity of submicron aerosols based on the scatterplot analysis and linear regression of measured NH versus predicted NH, where measurements were taken during the eight aerosol field measurement campaigns in the Tibetan Plateau and its surroundings (the geographical base map was created with ArcGIS).
4.2 Bulk acidity, size distribution, and diurnal variation of submicron aerosols
Particle-phase acidity significantly influences the physicochemical properties of aerosol, affecting its hygroscopicity, toxicity, and heterogeneous reactions. The bulk acidity of submicron aerosols was evaluated at each site following the method in Zhang et al. (2007b) and Schueneman et al. (2021), using AMS measurements. A detailed description of this method can be found in Sect. S5 or our previous publications (Zhang et al., 2018, 2019). Notably, we observed clear regional variations between the southern and northern TP, largely due to differences in aerosol sources and composition (Fig. 3). The fitted linear regression slopes for QOMS, NamCo, Ngari, and Lhasa (located in the southern, western, or central TP) were 1.2, 1.11, 0.98, and 1.18, respectively, indicating that the submicron aerosols at these sites were generally neutralized but occasionally showed an excess of ammonium. This result is consistent with previous findings of high ammonia availability from agricultural emissions in South Asia (Van Damme et al., 2015). Moreover, as reported in our previous publications, atmospheric aerosols at QOMS and NamCo were significantly influenced by biomass-burning emissions from South and Southeast Asia during the pre-monsoon season (Xu et al., 2018; Zhang et al., 2018), and Lhasa experienced intense biomass fuel burning during frequent religious festivals (Zhao et al., 2022). In contrast, submicron particles at the remaining four sites, particularly LHG and Bayanbulak in the north, were acidic overall, with regression slopes ranging from 0.73 to 0.86, and sulfate was a major PM1 component (46.0 % and 41.6 %, respectively). Similar findings of acidic submicron aerosol particles have also been reported for Menyuan and LHG in the northern TP in previous studies (Du et al., 2015; Xu et al., 2015); these are mainly related to the transport of enriched SNA species or their gaseous precursors from the industrial areas in northwestern China.
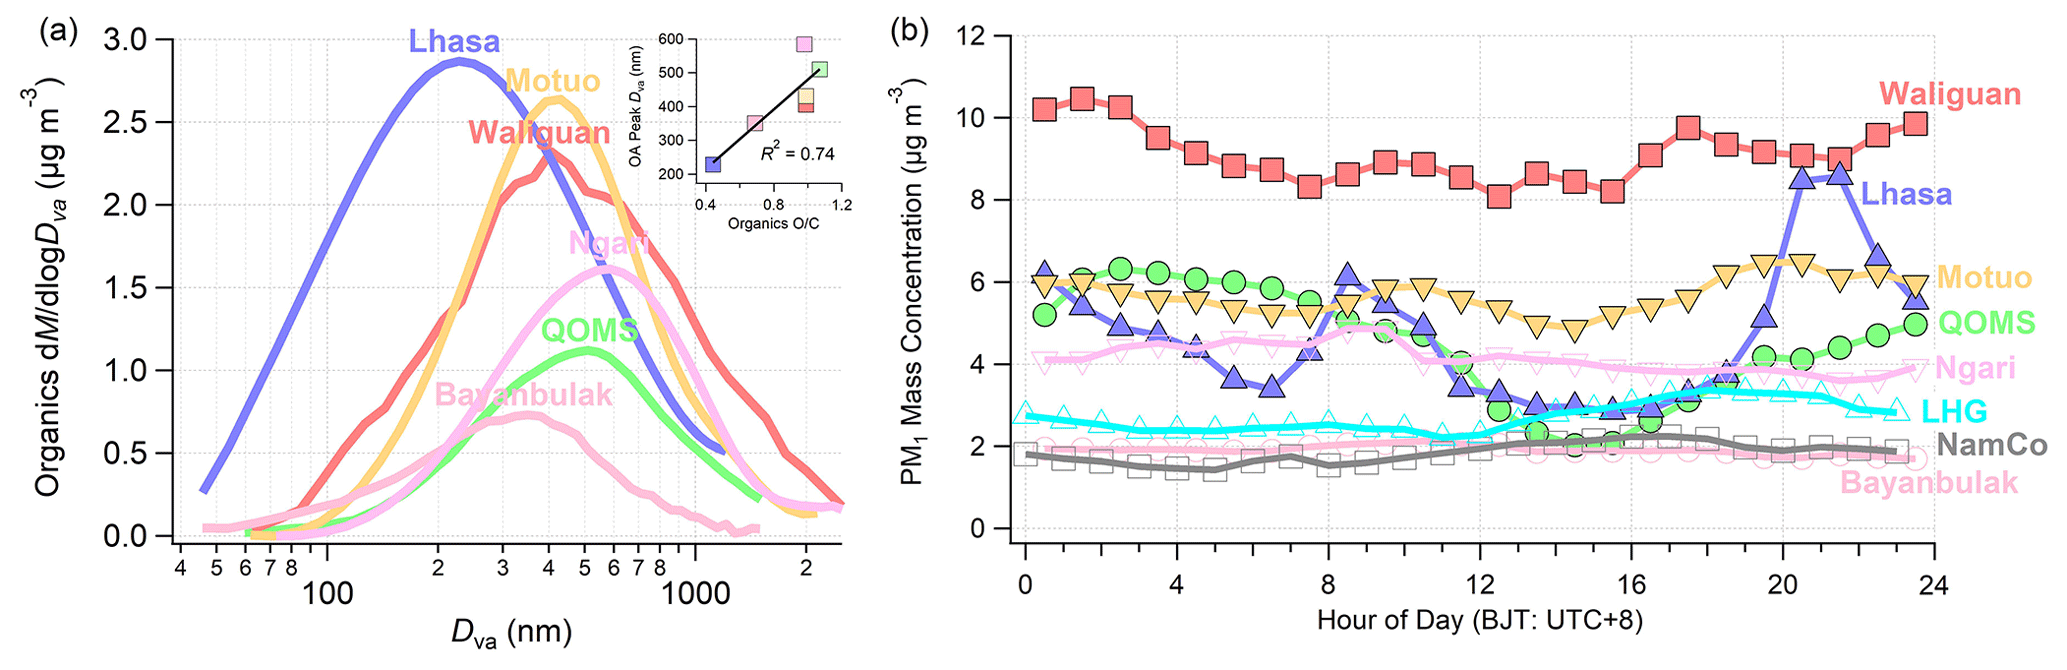
Figure 4(a) Average size distributions of organic mass concentrations during six field measurement campaigns in the Tibetan Plateau and its surroundings. (b) Diurnal variations of the total PM1 mass concentrations during the eight field measurement campaigns in the Tibetan Plateau and its surroundings. The inset graph in (a) is a scatter plot of the peak diameters in the size distributions versus the average ratio of organics.
The size distributions of non-refractory PM1 chemical species, obtained from HR-ToF-AMS measurements, provide valuable insights into aerosol sources, oxidation degrees, mixing states, and formation, transformation, and growth mechanisms as well as their impacts on CCN activity. Typically, size distributions for SNA species and oxidized OA peaked in the accumulation mode (∼400–600 nm in Dva) as a result of secondary formation processes. In contrast, fresh organics from primary emission sources exhibit a smaller size (Zhang et al., 2005b; Aiken et al., 2009). In this study, we focus on organics and the three SNA species combined to highlight regional variations in size distributions across the TP. As shown in Figs. 4a and S2 and Table 2, the peak diameters of the OA and SNA size distributions varied significantly, from 584.4 and 634.5 nm at Ngari to smaller sizes of 228.1 and 250.0 nm at Lhasa, respectively. This variation suggests that there are distinctly different sources and aging processes of atmospheric aerosols across the TP, particularly between those high-altitude remote sites and urban sites. For instance, the bulk PM1 at QOMS was reported to be internally well mixed and aged, which was attributed to long-range transport of biomass-burning emissions in South Asia (Zhang et al., 2018), whereas local primary sources, including cooking, traffic exhausts, and biomass burning, in total accounted for more than 60 % of the total OA in urban Lhasa (Zhao et al., 2022). The crucial influence of aerosol sources on the size distributions is further supported by the correlation between the mode size and ratios of OA (R2=0.74) (Fig. 4a).
The diurnal variations in PM1 chemical compositions are typically influenced by multiple factors, including meteorological conditions (e.g., planetary boundary layer (PBL) height, wind direction and speed, temperature, and relative humidity), various primary emission sources (e.g., vehicle exhausts during traffic rush hours, cooking emissions, and emissions from coal combustion for heating), and distinct formation mechanisms (e.g., daytime photochemical oxidation, nighttime heterogeneous reactions, and gas-particle partitioning of secondary species). A comprehensive understanding of these diurnal variations is crucial for exploring the dynamic evolution of aerosol compositions and identifying the primary drivers (source, meteorology, or secondary formation) behind the variations in different chemical species.
Distinct diurnal patterns in the total PM1 mass concentrations were observed across different field campaigns (Fig. 4b). At the remote sites of QOMS, LHG, NamCo, and Waliguan, located in valleys or atop mountains, variations were largely governed by mountain-valley wind circulation and changes in PBL height. For instance, QOMS exhibited a distinct diurnal pattern with continuously decreasing concentrations during the daytime but relatively high concentrations at night. The minimum occurred at around ∼15:00 LT in this valley site, likely due to strong afternoon glacier winds and a higher PBL (Zhang et al., 2018). Conversely, LHG and NamCo experienced lower PM1 concentrations from night to early morning with an increase in the afternoon, which was attributed to up-slope wind transport at LHG and to aerosols descending from higher layers and enhanced afternoon transport from the west at NamCo (Xu et al., 2018). A complex diurnal pattern of PM1 was observed at Waliguan, influenced by diffusion conditions, wind directions, and air mass sources, including afternoon air masses from the northeast, which likely carried industrial pollutants (Zhang et al., 2019). At Motuo, the diurnal pattern of PM1 was relatively stable, with two weak peaks linked to local combustion activities in the late morning and evening. Ngari exhibited relatively high nighttime loadings and lower daytime loadings, mainly due to the variations in PBL height. Bayanbulak, on the other hand, had a relatively low and stable PM1 mass throughout the entire day due to its background location. In contrast, urban Lhasa displayed two pronounced peaks correlating with primary emissions during the morning and evening rush hours (Zhao et al., 2022). Although the diurnal pattern of PM1 was mainly shaped by the mountain-valley winds and PBL height in those remote sites and by primary emissions in the urban site in this study, secondary formation processes, including photochemical oxidation and aqueous-phase reactions also played a key role in the formation of inorganic and organic aerosol species. This was evidenced by the afternoon peaks in oxygenated OA (OOA) components observed across almost all the sites, which were commonly formed by photo-chemical processes (Xu et al., 2018; Zhang et al., 2018, 2019; Zhao et al., 2022).
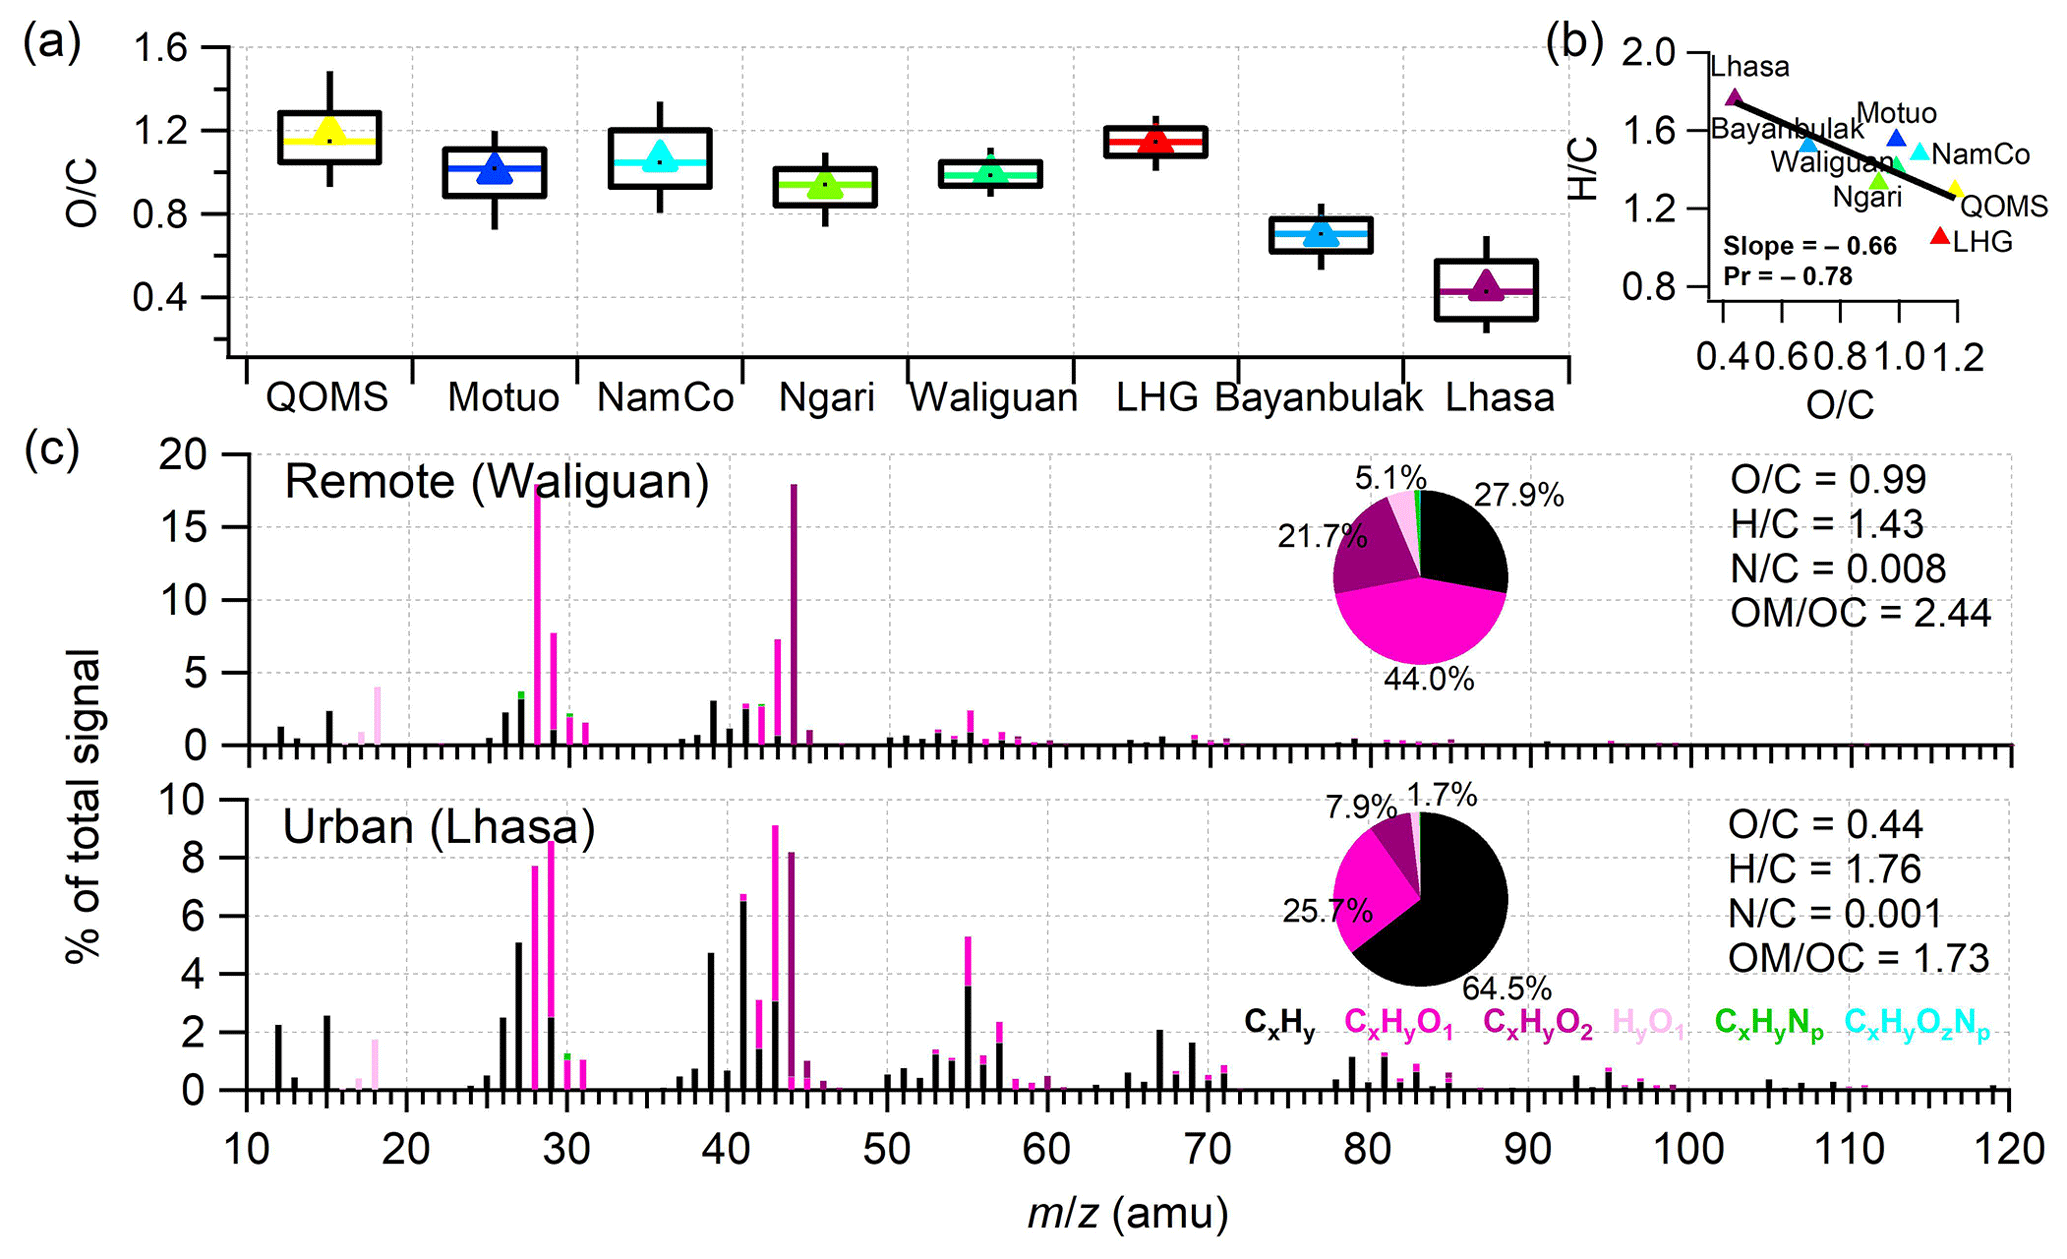
Figure 5(a) Box plots of the average ratios. The whiskers of the boxes indicate the 90th and 10th percentiles, the upper and lower boundaries of the boxes indicate the 75th and 25th percentiles, the lines in the boxes indicate the median values, and the markers indicate the mean values (and similarly for other box plots in this paper). (b) A van Krevelen diagram of versus for the eight field measurement campaigns in this study. (c) The average HRMSs of OA obtained during the Waliguan and Lhasa measurement campaigns, colored by ion category.
4.3 High-resolution mass spectrum and elemental ratios of organic aerosol
The high-resolution mass spectrum (HRMS) and elemental ratios of OA were determined to identify the possible sources, the formation and evolution mechanisms, and the oxidation states at each site. A direct comparison of the average ratios from the eight field campaigns is presented in Fig. 5a. It is apparent that the ratios at the remote sites of QOMS, Motuo, NamCo, Ngari, Waliguan, and LHG typically reached or exceeded 1.0, indicating highly oxidized OA. In contrast, Bayanbulak exhibited a lower ratio of 0.69, and the urban site of Lhasa showed an even lower ratio of 0.44. These variations in the ratio across sites primarily reflect differences in OA sources and aging processes. Remote sites in the TP generally received well-mixed and aged OA due to long-range transport (Xu et al., 2018; Zhang et al., 2018, 2019). Meanwhile, local emissions from activities like cooking, traffic, and biomass burning significantly contribute to the OA in urban Lhasa, resulting in a comparatively low ratio (Zhao et al., 2022). This pattern of higher ratios at remote sites and lower ratios at urban sites was observed in previous findings across China; for example, ratios of 0.98, 1.11, and 1.16 were observed at Mt. Wuzhi (Zhu et al., 2016), Mt. Yulong (Zheng et al., 2017), and LHG (Xu et al., 2015), respectively, whereas ratios typically fell below 0.5 at most urban sites (Zhou et al., 2020). The van Krevelen diagram, which plots versus ratios to illustrate changes in OA elemental composition due to atmospheric aging, shows an overall slope of −0.66 for the bulk OA across all campaigns. This result is comparable to the slopes of −0.58 and −0.47 obtained in previous studies, further illustrating common pathways in OA aging (Chen et al., 2015; Zhou et al., 2020).
The average HRMSs of OA for a remote site (Waliguan) and an urban site (Lhasa) were directly compared to investigate the difference in ionic compositions (Fig. 5c). Waliguan was selected for comparison as it presents highly aged OA overall, a characteristic shared with other remote sites (Fig. S3). The HRMSs of OA at Waliguan and Lhasa displayed significant differences. At Waliguan, 44, predominantly composed of and a key marker for OOA, was the most prominent peak (18 %) in the OA HRMS. and its related ions (CO+, H2O+, HO+, and O+) together contributed over 41 % of the total OA signal. Additionally, two oxygenated ion fragments ( and ) accounted for as much as 66 % of the total OA signal (Fig. 5c), suggesting a highly oxygenated nature of OA at this remote site. In contrast, the OA HRMS at Lhasa was remarkably similar to those observed in urban environments, with significant contributions from four values at 43, 55, 57, and 60. These ions, which are recognized as markers for less-oxidized OA or primary emissions related to traffic, cooking, and biomass burning (Zhang et al., 2005a; Alfarra et al., 2007; He et al., 2010), make a significant contribution to the OA signal in Lhasa. Specifically, non-oxygenated ion fragments () contributed as much as 64.5 % of the total OA in Lhasa, whereas the oxygenated fragments accounted for only 33.6 %. This pattern of fresh ion fragments in the OA HRMS in Lhasa is comparable to those measured in other urban cities, such as 56 % and 59 % in Lanzhou (Xu et al., 2014b, 2016), 51.2 % in Nanjing (Wang et al., 2016), and 51.2 % in New York (Sun et al., 2011).
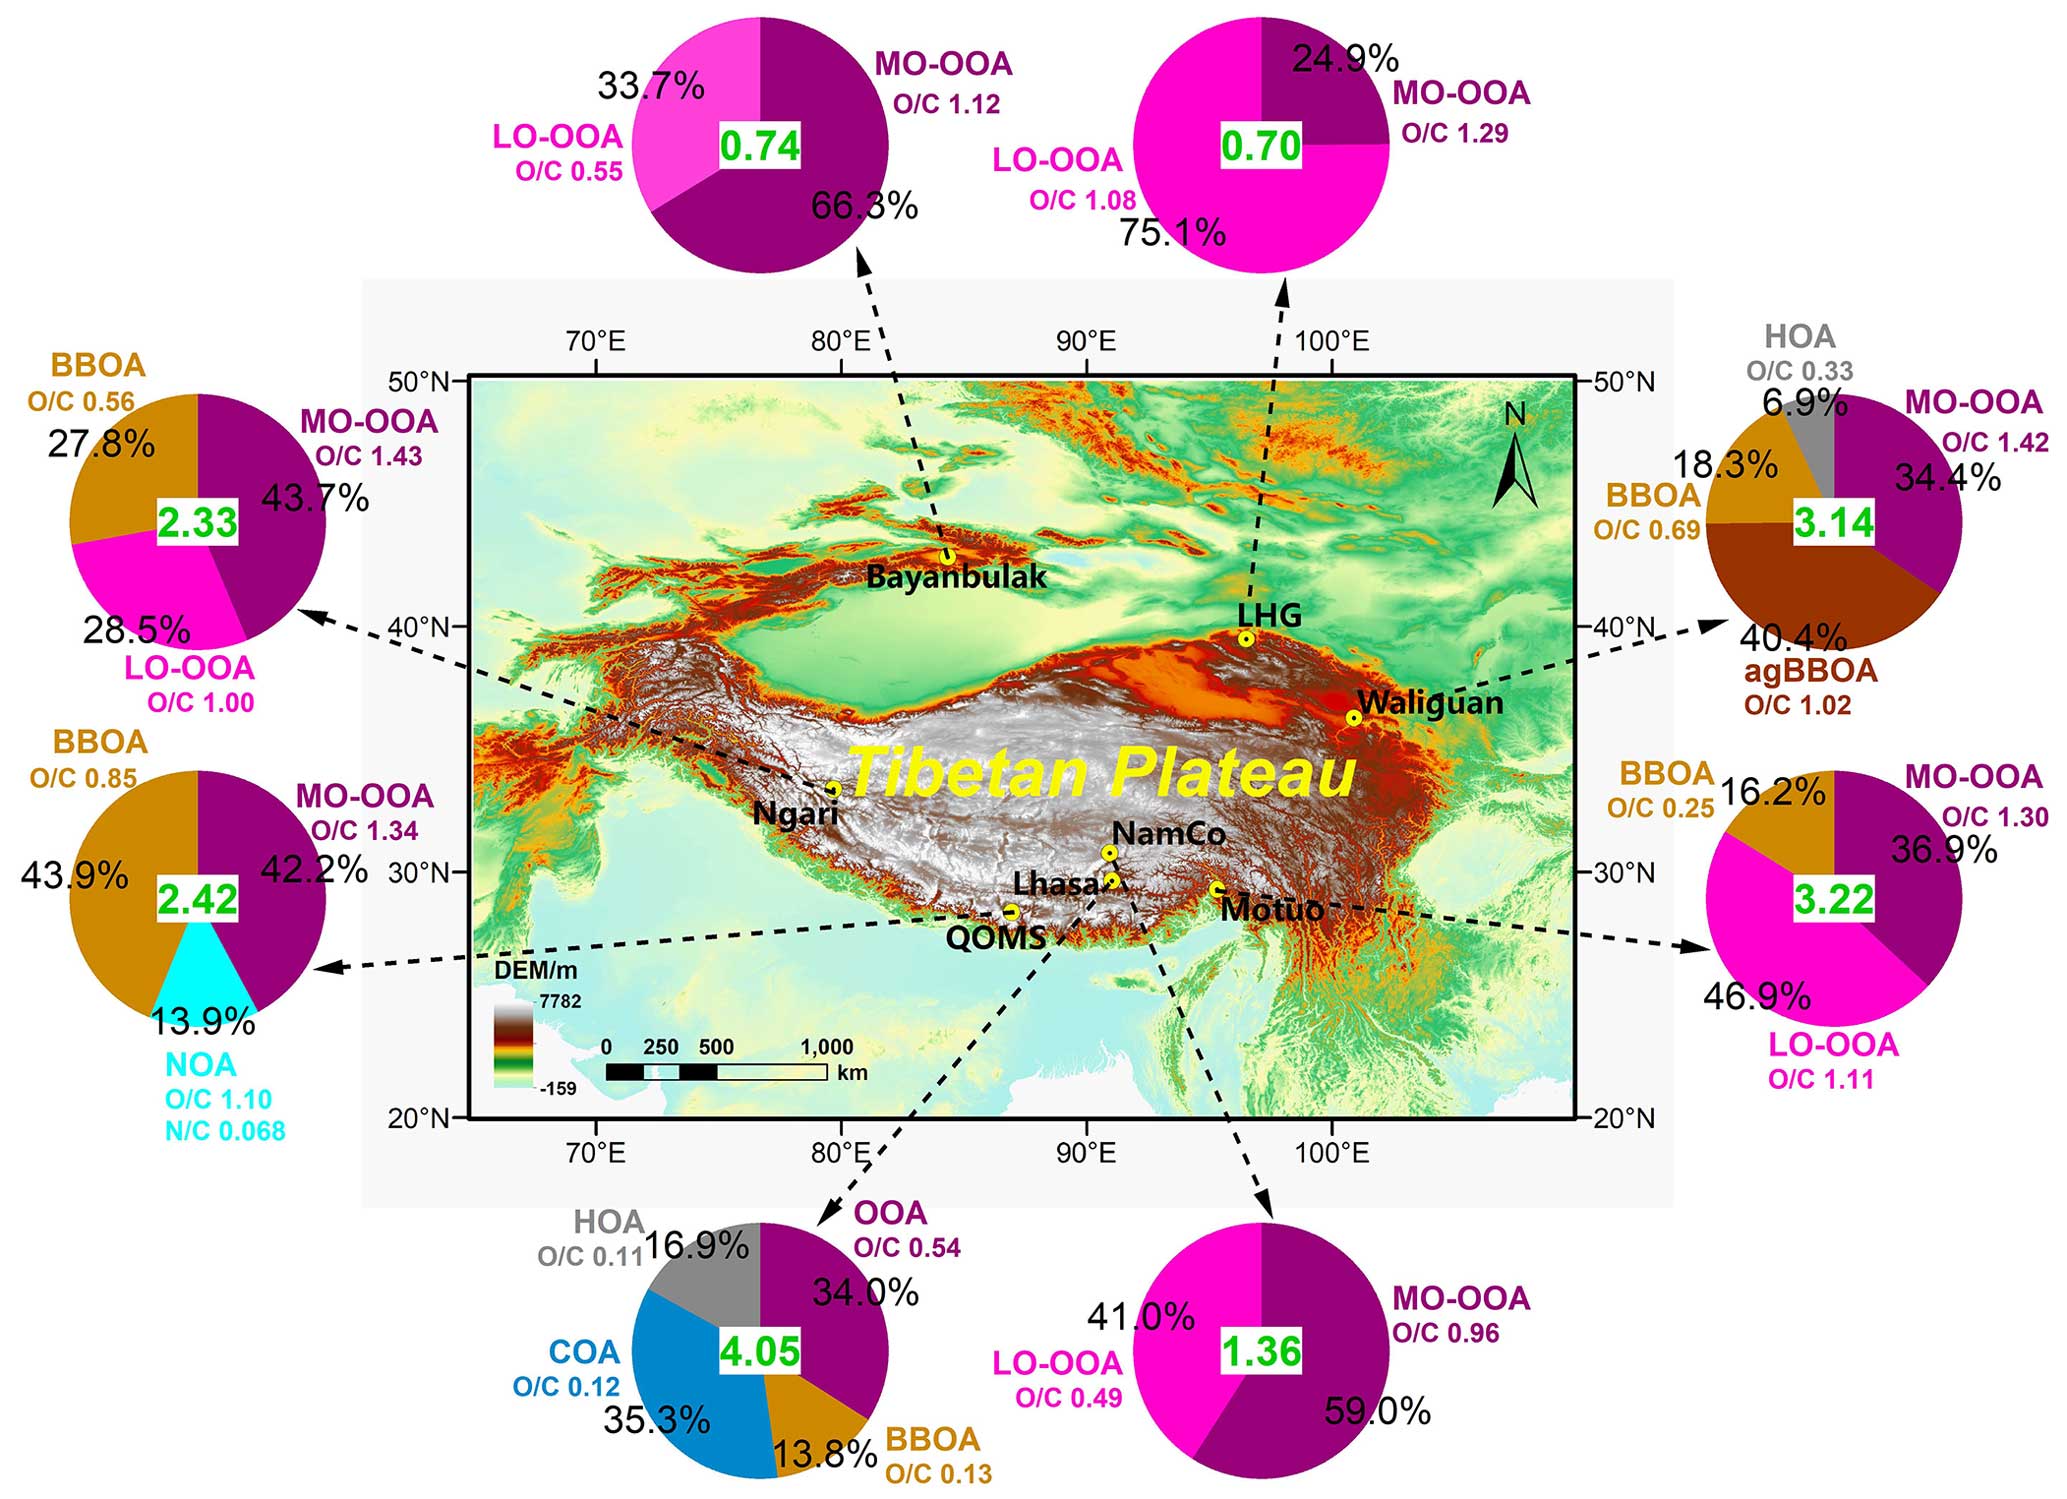
Figure 6Regional distribution of OA components from PMF source apportionment based on the eight online aerosol field measurements in the Tibetan Plateau and its surroundings (the geographical base map was created with ArcGIS). The value at the center of each pie chart is the average OA mass, with units of µg m−3, while the percentage values around the pie chart are the mass contributions of each OA component. The ratio of each OA component is also marked around each pie chart.
4.4 OA components from PMF source apportionment
Source apportionments of OA were performed using PMF analysis of OA HRMS data for each field campaign. Figure 6 presents the average mass contributions of OA components from the selected two- to four-factor solutions across eight field campaigns, while Fig. S4 details the specific HRMS signature for each OA component. In regions with limited local emissions but a significant influence from regional transport, such as NamCo, LHG, and Bayanbulak, two secondary OA factors with different oxidation degrees, namely a less-oxidized OOA (LO-OOA) and a more-oxidized OOA (MO-OOA), were identified. For instance, during the NamCo campaign, the MO-OOA and LO-OOA accounted for 59.0 % and 41.0 % of the total OA mass, with average ratios of 0.96 and 0.49, respectively. The Bayanbulak campaign exhibited a similar result, with MO-OOA (average of 1.12) and LO-OOA (average of 0.55) accounting for 66.3 % and 33.7 % of the OA mass, respectively. Contrastingly, the LHG campaign revealed a different pattern, with 24.9 % MO-OOA and 75.1 % LO-OOA, albeit with higher ratios of 1.29 and 1.08, respectively. Note that the properties of each OOA factor could vary across the locations in the TP despite the factor having the same name at each location.
Additionally, biomass-burning-related OA (BBOA) was also a prevalent component in the TP. At QOMS, the OA was composed of 42.4 % MO-OOA, 43.9 % BBOA, and 13.9 % nitrogen-containing OA (NOA), with average ratios of 1.34, 0.85, and 1.10, respectively. The high ratio and significant contributions of BBOA and NOA at QOMS were linked to biomass-burning emissions transported from South Asia during the pre-monsoon season (Cong et al., 2015; Zhang et al., 2018; Kang et al., 2019a). At Waliguan, the OA was composed of 34.4 % MO-OOA, 40.4 % relatively aged BBOA (agBBOA), 18.3 % BBOA, and 6.9 % hydrocarbon-like OA (HOA), with average ratios of 1.42, 1.02, 0.69, and 0.33, respectively. The agBBOA exhibited an enhanced contribution to OA as the OA mass concentration increased, ranging from ∼10 % to 70 % when the OA mass varied from <1.0 to 7 µg m−3 (Zhang et al., 2019). High contributions from BBOA at Waliguan were associated with regional transport of biomass-burning emissions from areas in the northeast (Zhang et al., 2019). At Ngari, the OA was composed of 43.7 % MO-OOA, 28.5 % LO-OOA, and 27.8 % BBOA, with average ratios of 1.43, 1.00, and 0.56, respectively. In contrast, Motuo exhibited OA components of 36.9 % MO-OOA, 46.9 % LO-OOA, and 16.2 % BBOA, with ratios of 1.30, 1.11, and 0.25, respectively. The lower BBOA contribution and ratio at Motuo suggest weaker local biomass-burning emissions. At urban Lhasa, four OA factors were identified, including an OOA with an ratio of 0.54 and three primary OA components, i.e., BBOA ( of 0.13), cooking-related OA (COA, of 0.12), and HOA ( of 0.11). These components were markedly different from those at the above remote sites, with the three primary OA components accounting for more than 60 % of the total OA, suggesting abundant primary aerosol sources from residential activities. In addition, the BBOA contribution increased significantly (up to 36 %) during a major local festival in Lhasa, suggesting that there was a crucial aerosol source from biomass burning during religious activities in the city (Zhao et al., 2022).
In summary, our study identified diverse OA components with varying ratios at different sites, indicating heterogeneous sources and oxidation states of OA across the TP regions.
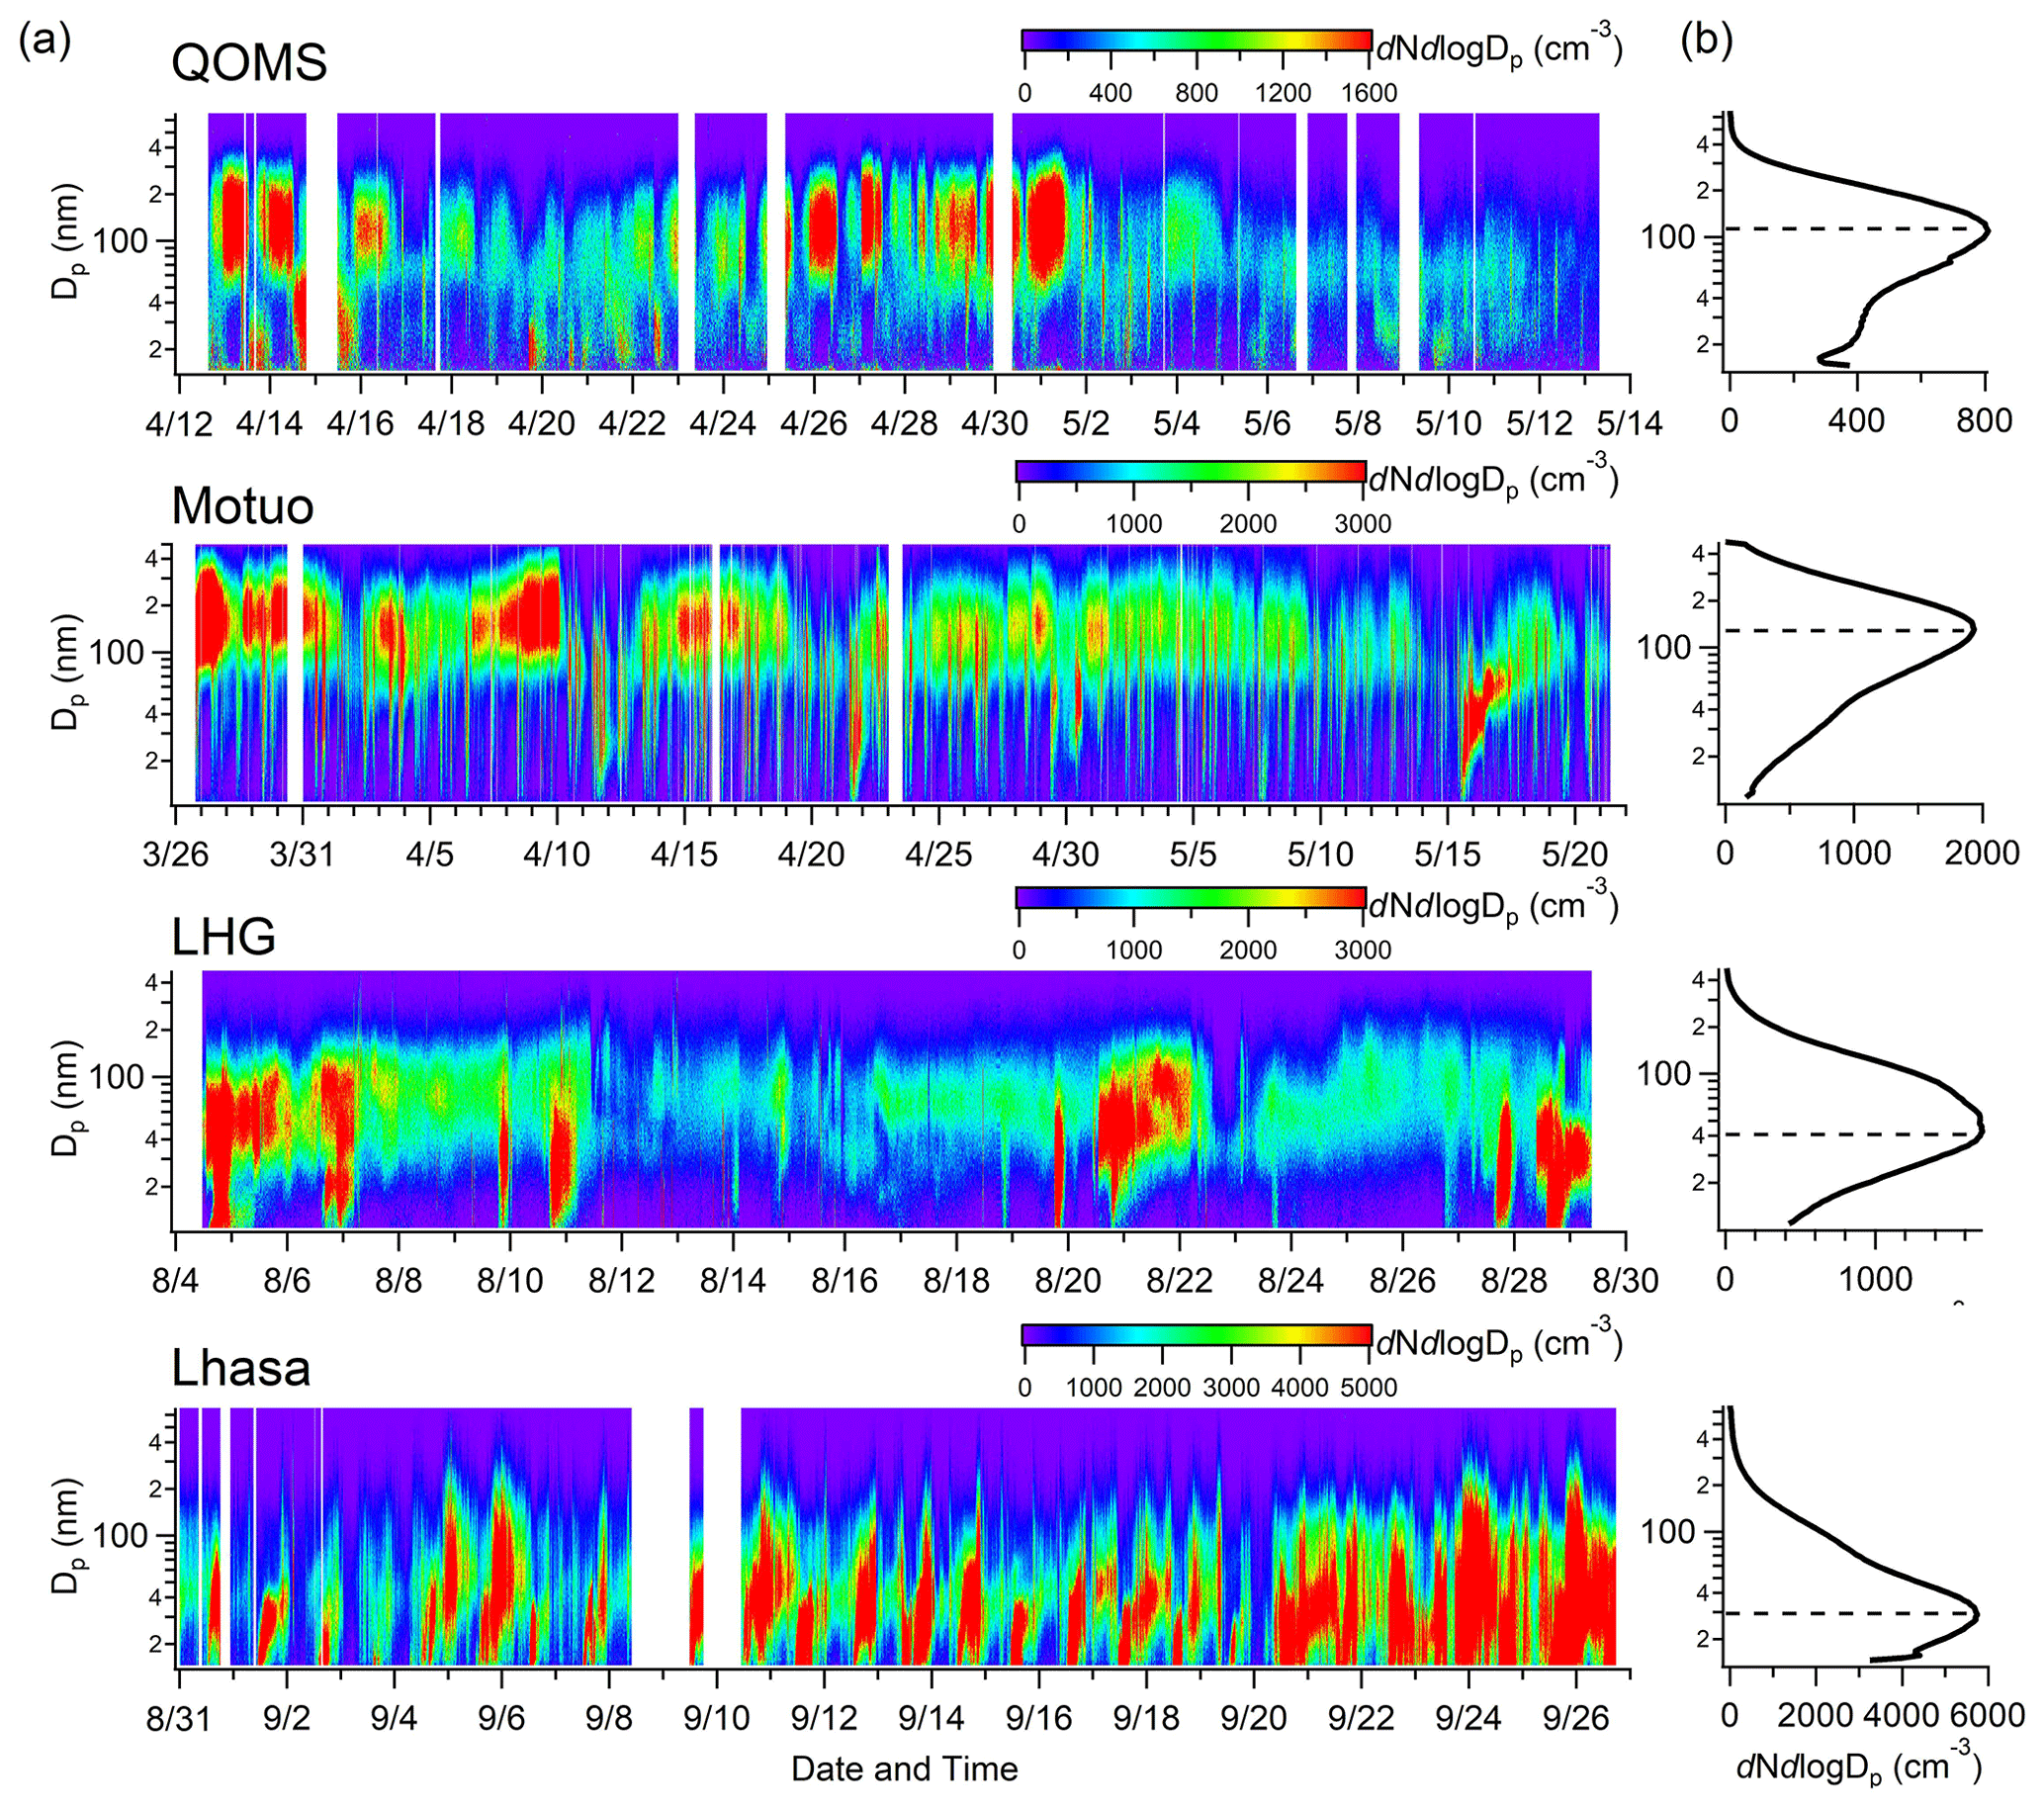
Figure 7(a) Temporal variations of the size distributions of the particle number concentration obtained during the aerosol field measurement campaigns at the QOMS, Motuo, LHG, and Lhasa sites. (b) The average size distribution of the particle number concentration for the entire measurement period at each site.
4.5 Number concentrations of submicron aerosols and cloud condensation nuclei
The measurement of the particle number size distribution (PNSD) is useful for studying the formation and growth mechanisms of aerosol particles in the atmosphere. Figure 7a shows the high-resolution temporal variations of the PNSDs observed during four field campaigns (QOMS, Motuo, LHG, and Lhasa), which reveal significant variability in number concentrations and size distribution patterns across the different sites. On average, the total number concentration was 709.3 and 3994.4 cm−3 at QOMS and Lhasa, respectively, while it was 1639.2 and 1462.0 cm−3 at Motuo and LHG. Notably, the variations in particle number concentrations were not consistent with the mass concentrations measured using the HR-ToF-AMS at the four sites (Table 2). For instance, although the PM1 mass concentration at Lhasa was comparable to that at QOMS (4.7 versus 4.4 µg m−3), the number concentration at Lhasa was more than 5 times higher than that at QOMS. This inconsistency was mainly related to the difference in size distribution between sites. As mentioned above, submicron aerosols at QOMS were predominantly secondary due to long-range transport from South Asia and were characterized by their accumulation-mode size. In contrast, Lhasa exhibited fresher aerosols emitted from local residential activities and characterized by their Aitken-mode size. The variation in submicron aerosol sizes across the TP was further evidenced by the peak diameters in the average mass and number size distributions (Figs. 4a and 7b). For instance, the average OA mass size distribution peaked at 510.2 and 430.5 nm in Dva for QOMS and Motuo, respectively. Meanwhile, the average number size distributions at these two sites had peaks at 109.4 and 131.0 nm in Dm, respectively. In contrast, Lhasa displayed significantly smaller peak diameters of only 228.1 nm in Dva and 28.9 nm in Dm.
New particle formation (NPF) events were observed at several sites in our study. Typically, an NPF event is characterized by a rapid burst in nucleation mode followed by subsequent growth into larger particles, as defined as banana-shaped temporal developments in the PNSD (Dal Maso et al., 2005). Figure 7a displays cases of banana-shaped patterns in the PNSD, which were frequently observed at urban Lhasa. Throughout the 27 d Lhasa campaign, a total of 10 NPF events were observed (Zhao et al., 2022). In contrast, such a banana-shaped pattern in the PNSD was relatively rare at the other three remote sites (QOMS, Motuo, and LHG), which might be related to the predominance of long-range transported aerosol with overall highly-aged states and limited gaseous precursors at those sites.
Cloud condensation nuclei (CCN) comprise a distinct class of atmospheric aerosol particles which can be activated as cloud droplets at a certain supersaturated water vapor condition and play important roles in cloud formation, precipitation, climate change, and the regional hydrological cycle (Andreae and Rosenfeld, 2008). Across the TP field campaigns, CCN measurements were conducted at three sites: Motuo, Waliguan, and LHG. The temporal variations in the CCN number concentrations at each SS exhibited a similar trend to the total number concentration from the SMPS measurements and the PM1 mass concentration from the HR-ToF-AMS measurements during each campaign. On average, the CCN number concentrations at Motuo were 974.0, 1142.6, 1240.1, 1296.5, and 1337.9 cm−3 at SS levels of 0.2 %, 0.4 %, 0.6 %, 0.8 %, and 1.0 %, respectively. At Waliguan, relatively comparable average values of 233.7, 857.8, 1138.7, 1313.1, and 1407.0 cm−3 were observed at corresponding SS levels. In contrast, LHG exhibited significantly lower average CCN concentrations of 120.5, 340.1, 417.8, 468.0, and 504.5 cm−3 at the same SS levels, respectively (Table 2). The lower CCN number concentrations at LHG compared to Waliguan and Motuo were consistent with its lower PM1 mass loading. Compared with other regions, the CCN number concentrations at the three TP sites were almost an order of magnitude lower than those observed in polluted urban environments or from specific combustion emissions. For instance, CCN concentrations reached 12 963 cm−3 (SS = 0.70 %) in Wuqing, 9890 cm−3 (SS = 0.86 %) in Beijing (Deng et al., 2011; Gunthe et al., 2011), 7913 cm−3 (SS = 0.70 %) at Panyu in the Pearl River Delta, and 11 565 cm−3 (SS = 0.87 %) and 10 000 cm−3 (SS = 0.80 %) during unique biomass-burning plumes (Rose et al., 2010; Zhang et al., 2020). However, the CCN values from our study were comparable to those measured at eight remote marine sites in the South China Sea (228–2150 cm−3 at SS = 0.87 %) and the Amazon rain forest (941 cm−3 at SS = 0.74 %) (Pöhlker et al., 2016; Atwood et al., 2017). These comparisons again highlight the overall clean atmospheric condition over the TP.
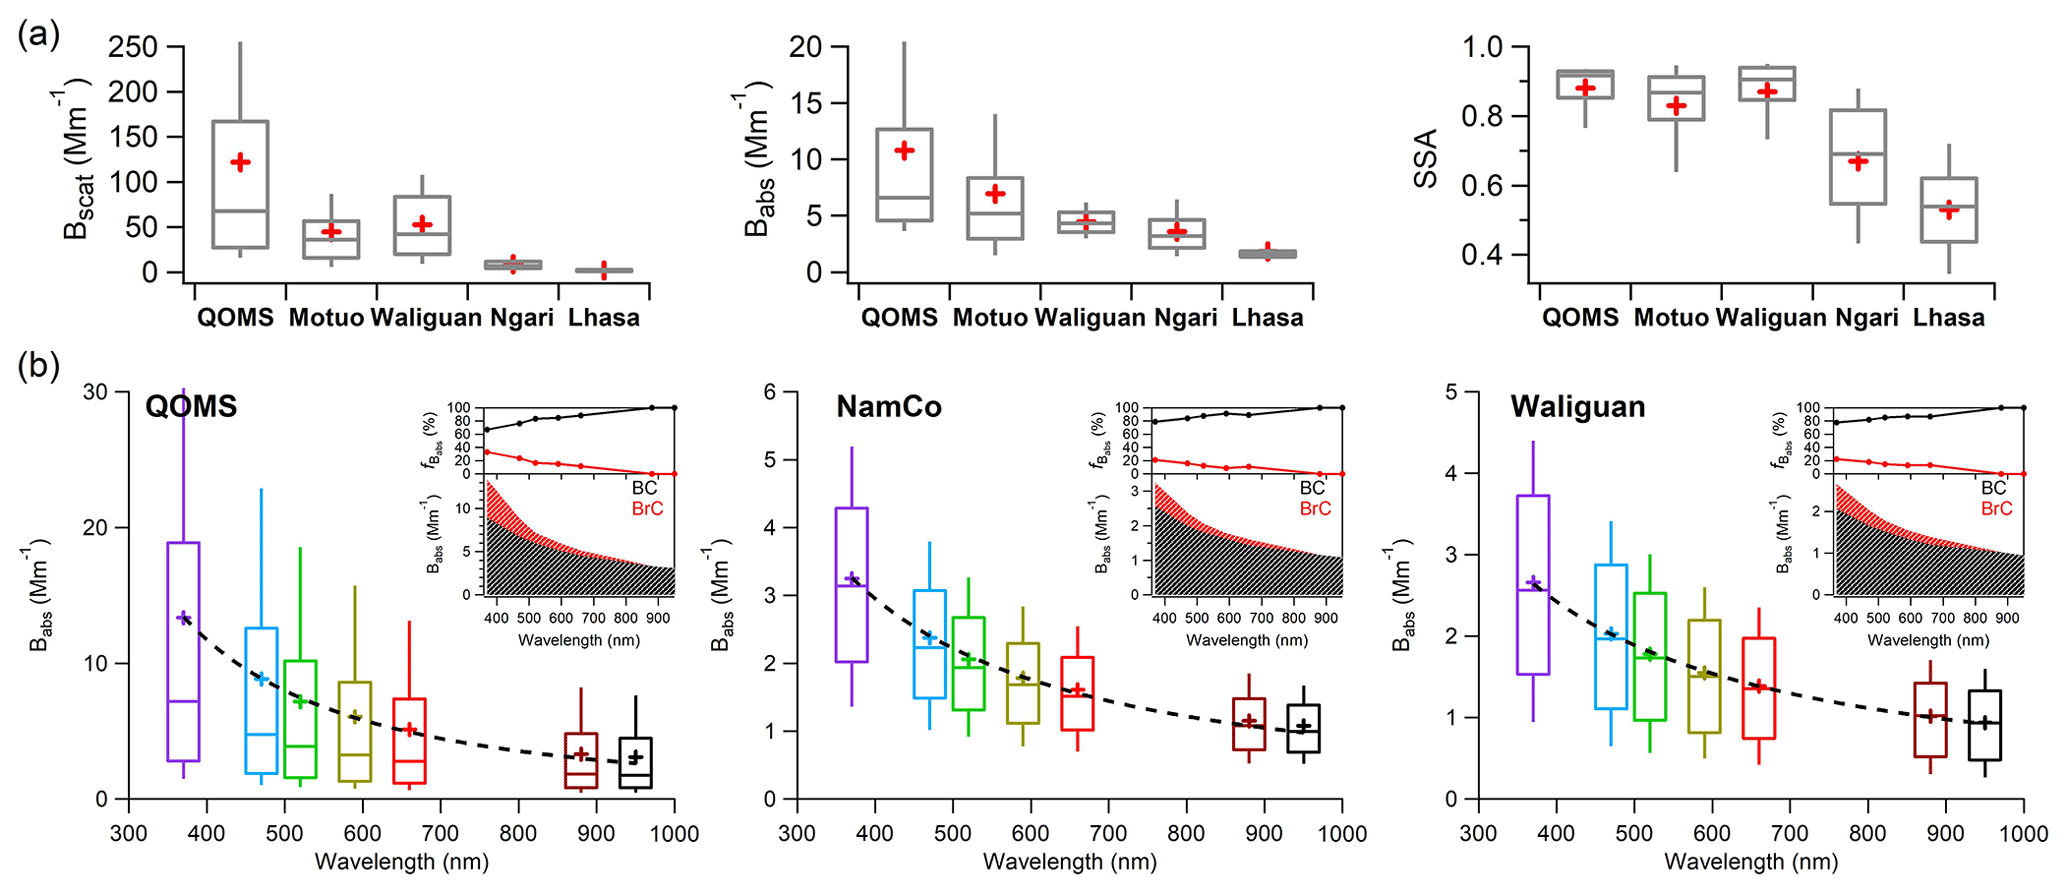
Figure 8Box plots of (a) the average particle light-scattering coefficient (Bscat), light absorption coefficient (Babs), and single-scattering albedo (SSA) during the five aerosol field measurement campaigns at the QOMS, Motuo, Waliguan, Ngari, and Lhasa sites, and (b) the particle Babs at seven wavelengths, as measured by Aethalometer instruments at the QOMS, NamCo, and Waliguan sites. The dashed lines in the boxes in (b) show the power-law fit of the average Babs as a function of wavelength. The inset plots in (b) show the apportioned contributions of BC and BrC to the total Babs at different wavelengths.
4.6 Aerosol optical properties and light absorption by BC and BrC
In this study, the parameters Bscat, Babs, and SSA for fine particles at 405 nm were observed in the field campaigns at QOMS, Motuo, Waliguan, Ngari, and Lhasa to explore the variations in aerosol optical properties across the TP. On average, the Bscat and Babs at 405 nm during the five campaigns were 121.9, 44.9, 36.3, 8.9, and 2.1 M m−1 and 10.8, 7.0, 4.1, 3.6, and 1.9 M m−1, respectively. These values yielded average SSA values of 0.89, 0.83, 0.86, 0.67, and 0.52, respectively (Fig. 8a and Table 2). The Bscat and Babs values at the TP sites were significantly lower than those reported in various urban areas in China, such as 459.5 and 47.2 M m−1 at 630 nm in Beijing (Xie et al., 2019), 272 and 31 M m−1 at 532 nm in Xi'an (Zhu et al., 2015), and 418 and 91 M m−1 at 540 nm in Guangzhou (Andreae et al., 2008), again suggesting that the TP has a clean atmospheric condition overall. Although the PM1 mass concentration at QOMS was comparable to or even lower than those at the other four sites, QOMS exhibited the highest Bscat, Babs, and SSA values. This discrepancy may be due to variations in the aerosol chemical composition and aerosol mass scattering and absorption efficiencies. In contrast, Lhasa exhibited a significantly lower SSA compared to the other four remote sites, suggesting a prevalence of fresh aerosols in the urban environment. On the other hand, aerosols at the four remote sites were highly aged, leading to significant photobleaching of BrC chromophores and an obvious decrease in their light absorptivity.
Real-time online measurements of the particle Babs at seven wavelengths ranging from 370 to 950 nm were also conducted using an Aethalometer at QOMS, NamCo, and Waliguan to explore regional variations in aerosol absorption properties across the TP. Overall, the multi-wavelength Babs decreased significantly with increasing wavelength during the three measurement campaigns, with fitted AAE values of 1.73, 1.28, and 1.12, respectively (Fig. 8b). The average Babs at the shortest wavelength of 370 nm was 13.40, 3.25, and 2.66 M m−1 at the three sites, respectively (Table 2). Despite a relatively low PM1 mass concentration at QOMS, the Babs at 370 nm was 5 times higher than that at Waliguan, mainly due to a higher contribution of light-absorbing aerosol components in the southern TP. Specifically, OA and BC together accounted for nearly 80 % of the total PM1 at QOMS, whereas this contribution decreased to only 37.5 % at Waliguan. The obviously higher AAE at QOMS also suggested a dominant light-absorbing contribution from BrC or a significant lensing effect of coated BC (Zhang et al., 2021). The inset plots in Fig. 8b illustrate significant decreases in the particle Babs,BC and Babs,BrC with increasing wavelength, yet their contributions to the total Babs (fBabs,BC and fBabs,BrC) varied inversely. BC was the primary light-absorbing component across all three sites, contributing 66.9 %, 78.7 %, and 77.6 % of the total Babs at 370 nm at the QOMS, NamCo, and Waliguan sites, respectively. Its contribution clearly increased with increasing wavelength (Table 2). Conversely, BrC showed more significant contributions to the total Babs at shorter wavelengths. For instance, the average Babs,BrC at 370 nm was 4.42, 0.69, and 0.60 M m−1 at the three sites, respectively, meaning that it ultimately contributed 33.1 %, 21.3 %, and 22.4 % of the total Babs. The significantly higher values of total Babs, Babs,BC, Babs,BrC, and fBabs,BrC in the southern TP region could be related to the important contributions of light-absorbing CAs from transported biomass-burning emissions (Xu et al., 2020, 2022).
4.7 Estimation of aerosol radiative forcing in the different TP regions
Atmospheric aerosols have a significant impact on Earth's climate systems by affecting solar radiation and exerting a positive forcing on the energy budget (Bond and Bergstrom, 2006). In this study, aerosol direct radiative forcings (DRFs) caused by BC, organic carbon (OC), and water-soluble ions (WSIs) are estimated, respectively, using the Santa Barbara DISORT (Discrete Ordinate Radiative Transfer) Atmospheric Radiative Transfer (SBDART) model (Ricchiazzi et al., 1998). A detailed introduction to and description of the operation of this model is given in Sect. S6. Since the model's performance is evaluated and calibrated by comparing the values with measurements from Aethalometer and PAX results, the aerosol DRF estimations are limited to QOMS, NamCo, and Waliguan. Furthermore, these three sites are located in the southern, central, and northern regions of the TP, respectively, which allows for an exploration of regional variations in aerosol DRFs across the TP.
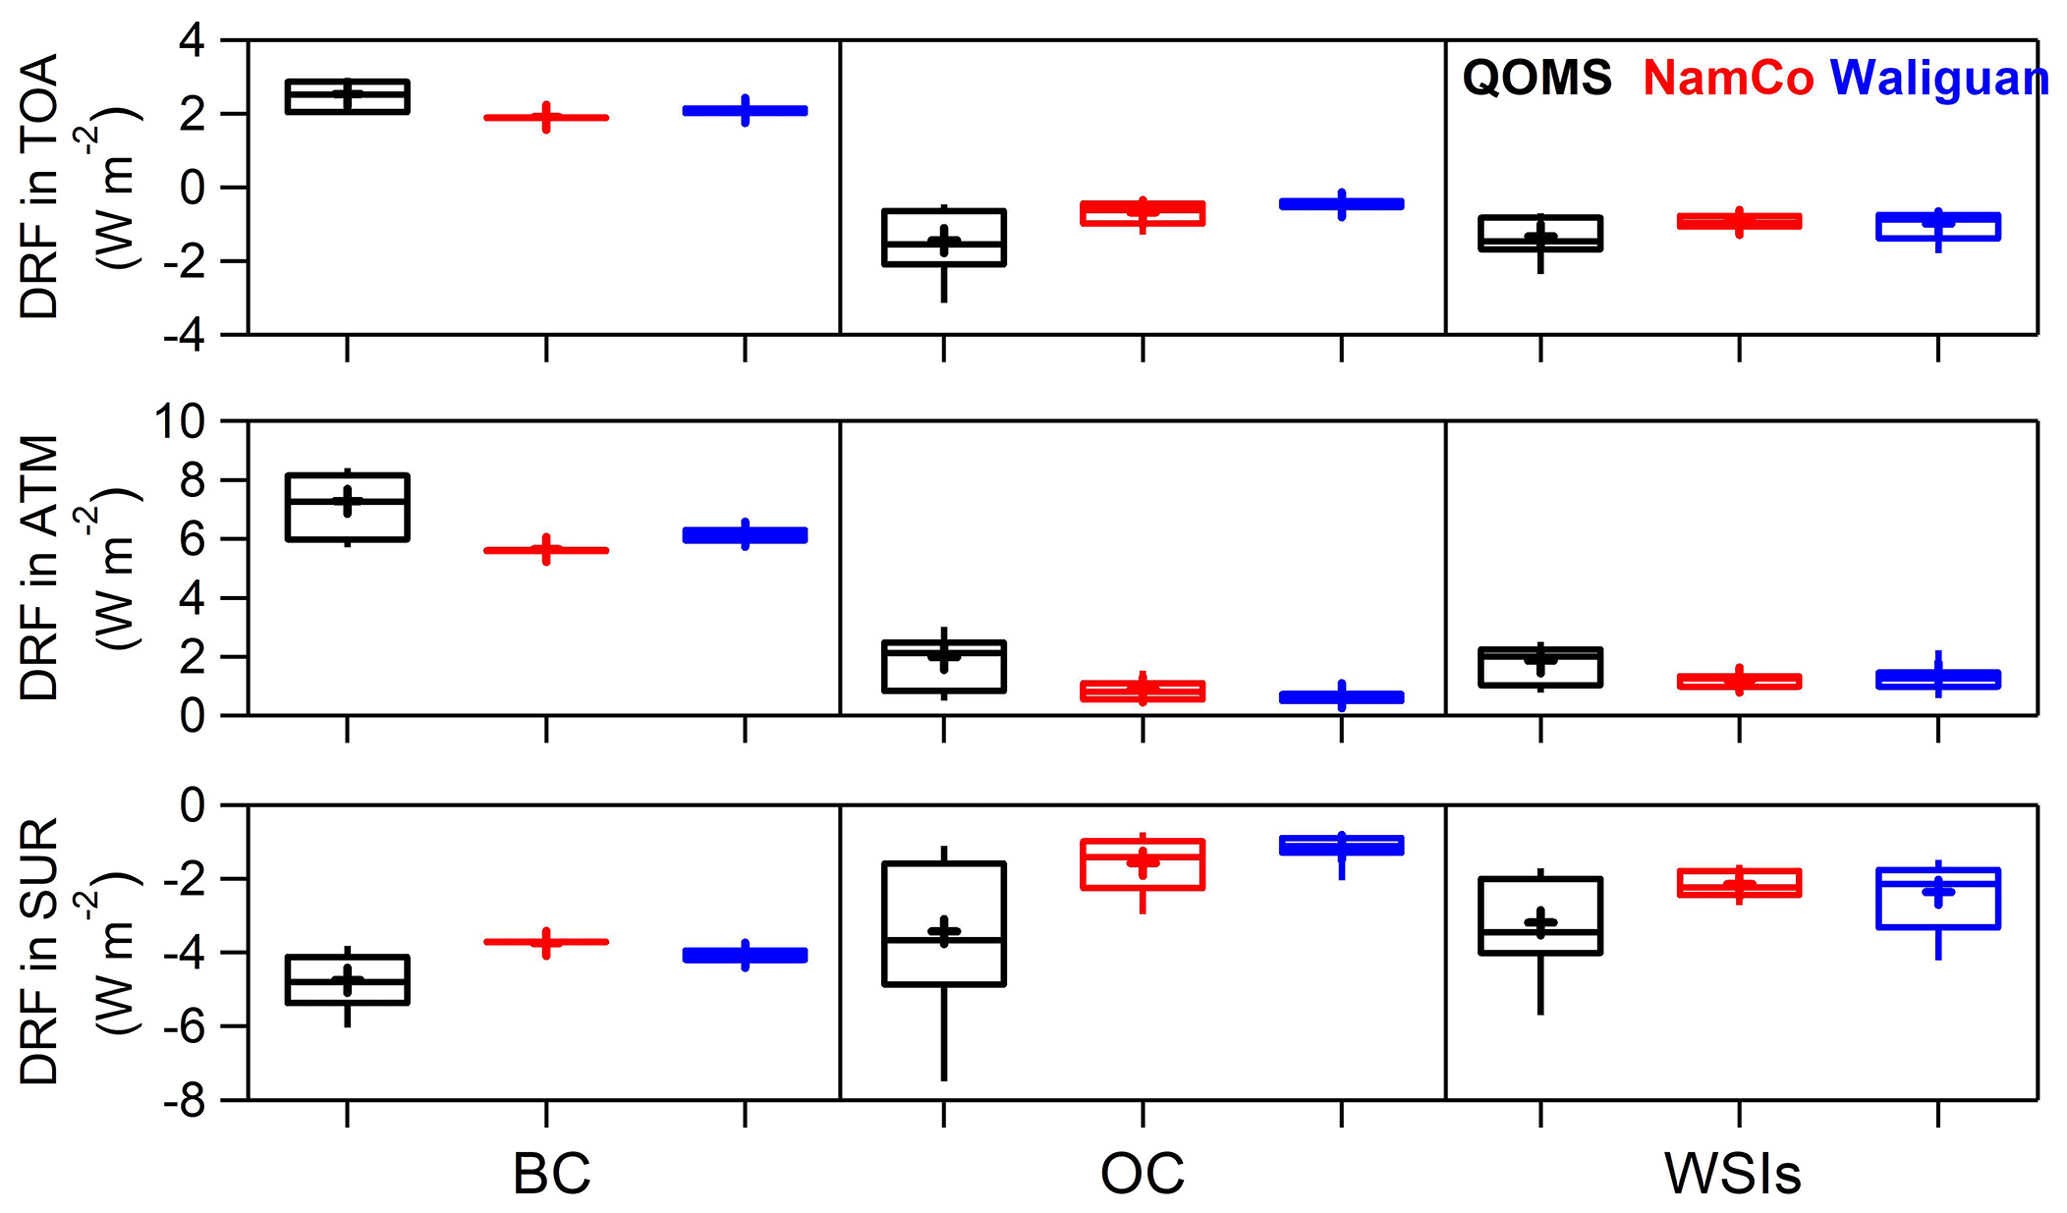
Figure 9Box plots of the modeled direct radiative forcing (DRF) at the top of the atmosphere (TOA), the atmosphere (ATM), and the Earth's surface (SUR) caused by black carbon (BC), organic carbon (OC), and water-soluble ions (WSIs) during the QOMS, NamCo, and Waliguan campaigns.
Figure 9 presents the results for the DRFs attributed to BC, OC, and WSIs across the three campaigns. BC demonstrated a pronounced warming effect at the top of the atmosphere, with average DRF values of , , and W m−2 during the QOMS, Waliguan, and NamCo campaigns, respectively. In contrast, BC exhibited a noticeable cooling effect at the Earth's surface, with average DRF values of , , and W m−2 across the three campaigns. The combination of these two effects resulted in a significantly high net atmospheric forcing by BC, amounting to , , and W m−2 for the three campaigns. These results suggest that BC has an important radiative effect in the TP, especially in the southern region influenced by long-range transported biomass-burning emissions from South Asia. In contrast, OC and WSIs exhibited cooling effects at both the top of the atmosphere and the Earth's surface, characterized by negative and relatively low average DRFs. Consequently, the net atmospheric forcings for OC and WSIs were notably lower compared to those for BC across the three campaigns, with values of , , and W m−2 for OC and , , and W m−2 for WSIs at QOMS, Waliguan, and NamCo, respectively. Interestingly, at QOMS, the average atmospheric DRF of OC was 27.3 % of that of BC, whereas at Waliguan and NamCo, the fractions were only 11.1 % and 15.7 %, respectively. The higher atmospheric DRF observed at QOMS suggests a dominant contribution from light-absorbing BC and BrC aerosols at that site compared to Waliguan and NamCo.
It is worth noting that the simulations of DRF effects in this study were only conducted at three specific sites over limited periods. Future research should focus on long-term comprehensive measurements and DRF simulations across the entire TP to enhance our understanding of aerosol impacts on regional climate.
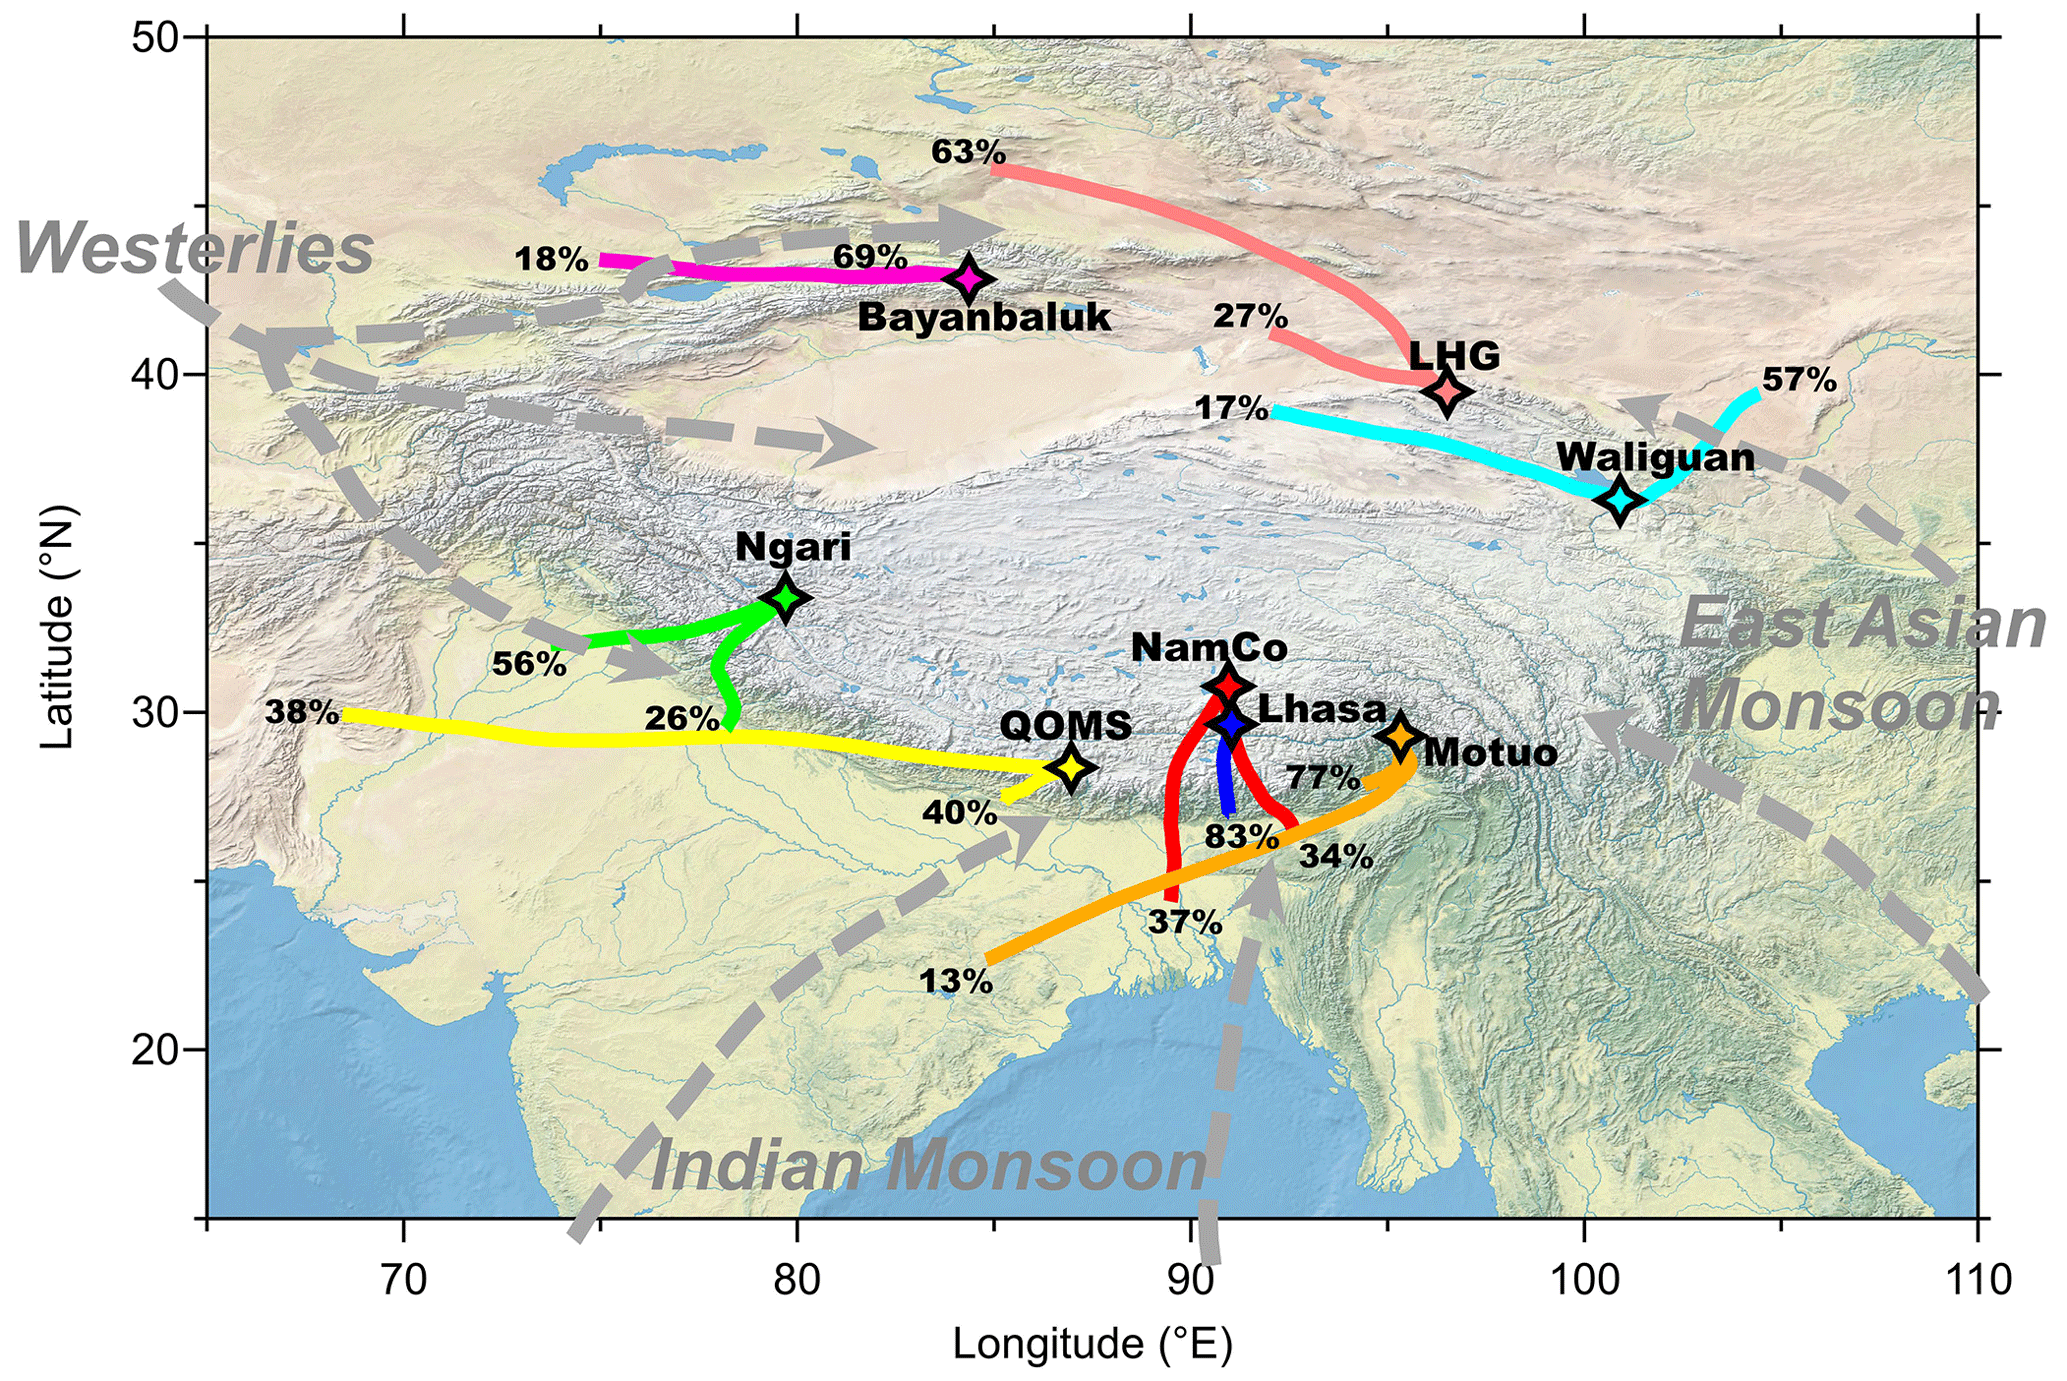
Figure 10Air-mass backward-trajectory clusters during the eight field campaigns in the Tibetan Plateau and its surroundings in our study (the geographical base map was created with Igor Pro). Only the major trajectory clusters during each field campaign are displayed, along with their corresponding contributions.
4.8 Long-range transport of aerosols from surrounding areas
To further understand the potential sources and specific transport pathways of aerosols at each site, particularly for those remote sites, 3- or 5-day air-mass backward trajectories were calculated every 6 h during each measurement period at an ending height of 500 m above ground level using the Hybrid Single Particle Lagrangian Integrated Trajectory (HYSPLIT) model (Draxler and Rolph, 2003). The cluster analysis of the trajectories was based on the total spatial minimum variance method. Figure 10 displays the average backward-trajectory clusters across all eight field campaigns.
In general, distinct air mass sources were identified across the TP. The five sites (QOMS, Motuo, Lhasa, NamCo, and Ngari) located in the southern or south-central part of the TP generally showed air masses from the south or southwest with different transport distances and pathways during their measurement periods. For instance, during the QOMS campaign, 38 % of the air masses originated from the west and covered a long distance, while another 40 % originated from the southwest and covered a shorter distance. In the Motuo campaign, two major clusters originated from the southwest and covered different distances (77 % covered a shorter distance, compared to only 13 % that covered a longer distance). Similarly, during the NamCo campaign, two major clusters with comparable contributions (37 % and 34 %) and transport distances but different pathways were identified from the south. In the Ngari campaign, air masses showed similar transport distances, with 56 % originating from the southwest and 26 % from the south. These air mass clusters originating from the south of the TP generally traverse polluted regions in South Asia such as the Indo-Gangetic Plain, Nepal, and Bangladesh, carrying significant amounts of pollutants, particularly biomass-burning emissions, into the inland of the TP. In contrast, air masses at northern sites were primarily influenced by westerlies and the East Asian monsoon during the summer season. In the campaigns at Bayanbulak, air masses originated from the west from different distances, i.e., 69 % were from a relatively short distance, whereas 18 % were from a longer distance. During the LHG campaign, the air masses originated from the northwest of the site, with 63 % covering longer distances and 27 % shorter distances. For the Waliguan campaign, the air masses originated from two distinct directions. Most of the air masses (57 %) came from the northeast of the site and covered shorter distances, while the remaining air masses originated from the west and northwest and covered longer distances.
In summary, significant variations in air mass sources and transport pathways were observed across the TP, particularly between southern and northern regions. These differences play a crucial role in shaping the different physicochemical and optical properties of aerosols across the TP regions.
Our dataset was compiled from eight short-term intensive field observations across the TP, utilizing a suite of high-resolution online instruments. However, it is important to note that our dataset does have certain limitations that proved to be quite challenging to address in these remote regions.
The primary limitation stems from the short and inconsistent measurement periods across different observational years and seasons at different sites, impeding robust comparisons of aerosol properties across the TP. This limitation also hampers the ability to ascertain long-term and seasonal characteristics. The harsh natural environments, challenging weather conditions, limited logistical support and instruments, and stringent instrumental requirements (such as the necessity for comprehensive field stations with a stable power supply) presented significant challenges during our field observations in these remote TP regions. It is worth noting that online HR-ToF-AMS observations such as those we conducted are predominantly short-term and intensive observations carried out worldwide due to the instability issues and challenging maintenance required for long-term measurements. Such short-term intensive measurements are enough to capture and characterize the dynamic evolution of aerosol properties at a high time resolution (Jimenez et al., 2009; Li et al., 2017). Long-term, high-time-resolution observations utilizing an HR-ToF-AMS have only rarely been conducted thus far, even in urban environments with relatively favorable observational conditions and logistic support compared to our remote TP sites. Consequently, performing continuous long-term observations at or simultaneous comparisons of multiple sites in these high-altitude remote TP regions without a stable power supply is exceedingly challenging. Furthermore, assessing the representativeness of each observation for the spatial scale is particularly challenging due to the limited number of observatories across the TP. Actually, these observatories were strategically established based on the representation of specific geographic and climatic features.
In addition to the limitations above, our team has made significant efforts over the past decade to conduct this comprehensive observation project which aimed to study the regional differences in aerosol sources and properties across the TP. The dataset generated from our project represents the first and only high-time-resolution dataset focusing on the physicochemical and optical properties of atmospheric aerosol for most regions of the TP. The applications of this dataset in atmospheric science are multifaceted. Firstly, the high-time-resolution observations offer crucial advantages in understanding the rapid evolution and diurnal variations of aerosol properties during a short period or special event. Furthermore, these observations are invaluable for model simulation and verification, providing a wealth of data points that can be utilized for assessing aerosol loading, chemical composition, and size distribution as well as other parameters essential for model accuracy and validation. Such advantages are not achievable with traditional off-line samplings, which typically exhibit low time resolutions ranging from days to weeks. Secondly, the eight sites used in our project effectively represent a wide range of regions of the TP. This is particularly noteworthy considering the limited availability of observatories on the TP. These sites facilitate comparisons of aerosol sources and properties among different regions. Thirdly, our observations encompass a wide range of aerosol physical, chemical, and optical parameters, including aerosol mass loadings, chemical compositions, size distribution, diurnal variations, number concentrations, light scattering and absorption coefficients, and so on. This comprehensive dataset plays a crucial role in fostering a profound understanding of aerosol properties in the TP.
Overall, it is noteworthy that our online observational aerosol datasets, which focus on multiple parameters with at least hourly scale resolution at various sites across the TP, are the only such datasets reported to date. Although the dataset is not perfect for valid reasons, sharing it improves quality and exposes both its value and difficulties.
The high-resolution online measurement datasets encompassing aerosol physical, chemical, and optical properties over the Tibetan Plateau and its surroundings in our observation project have been released and are now available for download from the National Cryosphere Desert Data Center (https://doi.org/10.12072/ncdc.NIEER.db2200.2022; Xu, 2022). These datasets are provided in an Excel file comprising eight worksheets. The first sheet of the Excel file contains a concise description of the dataset, including the dataset name, observation stations, sampling periods, online instruments used, and corresponding references. The remaining seven sheets present the high-resolution measurement data obtained from the online instruments employed during the eight campaigns. These instruments include HR-ToF-AMS, SMPS, PAX, Aethalometer, and CCN-100 instruments.
This study presents a comprehensive dataset encompassing aerosol physicochemical and optical properties, with a particular focus on high-resolution size-resolved chemical characteristics and sources of submicron aerosols, conducted at eight different sites in the TP and its surroundings. The datasets collected offer insights into temporal and diurnal variations, the size distribution of PM1 chemical compositions, the HRMS and chemical components of OA, particle light-scattering and light-absorption coefficients, and CCN number concentrations at different supersaturations in different campaigns.
The datasets offer valuable insights into regional variations in aerosol properties and sources. In the southern TP region, atmospheric aerosols were primarily influenced by biomass-burning emissions transported from South Asia, which resulted in high mass contributions (>70 %) of CAs and an overall neutralized PM1 as well as an enhanced light-absorption capability of aerosols. In contrast, in the northern TP, secondary inorganic species, particularly sulfate, contributed significantly to the total PM1 due to the regional transport of anthropogenic aerosol and gaseous precursor emissions from urban areas in northwestern China. Furthermore, in contrast to the well-mixed, highly aged, and regionally transported aerosols observed in the remote sites, atmospheric aerosols in the urban Lhasa site mainly originated from local primary sources such as cooking, traffic vehicle exhausts, and biofuel combustion during residential activities. Consequently, these aerosol particles were relatively fresh and characterized by a small size and low oxidation degree, but they exhibited a high frequency of NPF origin.
| TP | Tibetan Plateau |
| HR-ToF-AMS | High-resolution time-of-flight aerosol mass spectrometer |
| SMPS | Scanning mobility particle sizer |
| PAX | Photoacoustic extinctiometer |
| CCN | Cloud condensation nuclei |
| SS | Supersaturation |
| PM1 | Submicron aerosol |
| BC | Black carbon |
| BrC | Brown carbon |
| OA | Organic aerosol |
| SNA | Sulfate, nitrate, and ammonium |
| Dm | Mobility diameter |
| Dva | Aerodynamic diameter |
| CE | Collection efficiency |
| HRMS | High-resolution mass spectrum |
| PBL | Planetary boundary layer |
| Oxygen-to-carbon ratio | |
| Hydrogen-to-carbon ratio | |
| Nitrogen-to-carbon ratio | |
| Organic-matter-to-organic-carbon ratio | |
| PMF | Positive matrix factorization |
| OOA | Oxygenated organic aerosol |
| LO-OOA | Less-oxidized oxygenated organic aerosol |
| MO-OOA | More-oxidized oxygenated organic aerosol |
| BBOA | Biomass-burning-related organic aerosol |
| agBBOA | Aged-biomass-burning-related organic aerosol |
| NOA | Nitrogen-containing organic aerosol |
| HOA | Traffic-related hydrocarbon-like organic aerosol |
| COA | Cooking-related organic aerosol |
| PNSD | Particle number size distribution |
| NPF | New particle formation |
| Bscat | Light scattering coefficient |
| Babs | Light absorption coefficient |
| Bext | Light extinction coefficient |
| SSA | Single-scattering albedo |
| AAE | Absorption Ångström exponents |
| Babs,BC | Light absorption coefficient from BC |
| Babs,BrC | Light absorption coefficient from BrC |
| OC | Organic carbon |
| WSIs | Water-soluble ions |
| DRF | Direct radiative forcing |
The supplement related to this article is available online at: https://doi.org/10.5194/essd-16-1875-2024-supplement.
JX designed the study. XZ, WZ, and JX wrote the manuscript. JX and SK organized and supervised the field measurement campaigns. JX, XZ, WZ, LZ, MZ, JuS, JiS, YL, CX, YT, KL, XG, and QZ conducted the field measurements. JX, XZ, WZ, and YT analyzed the data. All authors reviewed and commented on the final form of the manuscript.
The contact author has declared that none of the authors has any competing interests.
Publisher's note: Copernicus Publications remains neutral with regard to jurisdictional claims made in the text, published maps, institutional affiliations, or any other geographical representation in this paper. While Copernicus Publications makes every effort to include appropriate place names, the final responsibility lies with the authors.
We extend our thanks to all our colleagues and collaborators who participated in the aerosol field measurements, maintained the instruments, analyzed the data, and commented on the manuscript. We also extend great thanks to all the observation stations in this study for their logistical support with the field campaigns.
This work was supported by the National Natural Science Foundation of China (grant nos. 41977189, 41771079, 41805106), the Second Tibetan Plateau Scientific Expedition and Research program (STEP) (grant no. 2019QZKK0605), the Strategic Priority Research Program of Chinese Academy of Sciences, Pan-Third Pole Environment Study for a Green Silk Road (Pan-TPE) (grant no. XDA20040501), the State Key Laboratory of Cryospheric Sciences Scientific Research Foundation (grant no. SKLCS-ZZ-2023), and the Chinese Academy of Sciences Hundred Talents Program.
This paper was edited by David Carlson and reviewed by two anonymous referees.
Aiken, A. C., Salcedo, D., Cubison, M. J., Huffman, J. A., DeCarlo, P. F., Ulbrich, I. M., Docherty, K. S., Sueper, D., Kimmel, J. R., Worsnop, D. R., Trimborn, A., Northway, M., Stone, E. A., Schauer, J. J., Volkamer, R. M., Fortner, E., de Foy, B., Wang, J., Laskin, A., Shutthanandan, V., Zheng, J., Zhang, R., Gaffney, J., Marley, N. A., Paredes-Miranda, G., Arnott, W. P., Molina, L. T., Sosa, G., and Jimenez, J. L.: Mexico City aerosol analysis during MILAGRO using high resolution aerosol mass spectrometry at the urban supersite (T0) – Part 1: Fine particle composition and organic source apportionment, Atmos. Chem. Phys., 9, 6633–6653, https://doi.org/10.5194/acp-9-6633-2009, 2009.
Alfarra, M. R., Prevot, A. S. H., Szidat, S., Sandradewi, J., Weimer, S., Lanz, V. A., Schreiber, D., Mohr, M., and Baltensperger, U.: Identification of the mass spectral signature of organic aerosols from wood burning emissions, Environ. Sci. Technol., 41, 5770–5777, https://doi.org/10.1021/es062289b, 2007.
An, Y., Xu, J., Feng, L., Zhang, X., Liu, Y., Kang, S., Jiang, B., and Liao, Y.: Molecular characterization of organic aerosol in the Himalayas: insight from ultra-high-resolution mass spectrometry, Atmos. Chem. Phys., 19, 1115–1128, https://doi.org/10.5194/acp-19-1115-2019, 2019.
Andreae, M. O. and Rosenfeld, D.: Aerosol–cloud–precipitation interactions. Part 1. The nature and sources of cloud-active aerosols, Earth-Sci. Rev., 89, 13–41, https://doi.org/10.1016/j.earscirev.2008.03.001, 2008.
Andreae, M. O., Schmid, O., Yang, H., Chand, D., Zhen Yu, J., Zeng, L.-M., and Zhang, Y.-H.: Optical properties and chemical composition of the atmospheric aerosol in urban Guangzhou, China, Atmos. Environ., 42, 6335–6350, https://doi.org/10.1016/j.atmosenv.2008.01.030, 2008.
Atwood, S. A., Reid, J. S., Kreidenweis, S. M., Blake, D. R., Jonsson, H. H., Lagrosas, N. D., Xian, P., Reid, E. A., Sessions, W. R., and Simpas, J. B.: Size-resolved aerosol and cloud condensation nuclei (CCN) properties in the remote marine South China Sea – Part 1: Observations and source classification, Atmos. Chem. Phys., 17, 1105–1123, https://doi.org/10.5194/acp-17-1105-2017, 2017.
Backman, J., Schmeisser, L., Virkkula, A., Ogren, J. A., Asmi, E., Starkweather, S., Sharma, S., Eleftheriadis, K., Uttal, T., Jefferson, A., Bergin, M., Makshtas, A., Tunved, P., and Fiebig, M.: On Aethalometer measurement uncertainties and an instrument correction factor for the Arctic, Atmos. Meas. Tech., 10, 5039–5062, https://doi.org/10.5194/amt-10-5039-2017, 2017.
Bonasoni, P., Laj, P., Marinoni, A., Sprenger, M., Angelini, F., Arduini, J., Bonafè, U., Calzolari, F., Colombo, T., Decesari, S., Di Biagio, C., di Sarra, A. G., Evangelisti, F., Duchi, R., Facchini, MC., Fuzzi, S., Gobbi, G. P., Maione, M., Panday, A., Roccato, F., Sellegri, K., Venzac, H., Verza, G. P., Villani, P., Vuillermoz, E., and Cristofanelli, P.: Atmospheric Brown Clouds in the Himalayas: first two years of continuous observations at the Nepal Climate Observatory-Pyramid (5079 m), Atmos. Chem. Phys., 10, 7515–7531, https://doi.org/10.5194/acp-10-7515-2010, 2010.
Bond, T. C. and Bergstrom, R. W.: Light absorption by carbonaceous particles: An investigative review, Aerosol Sci. Technol., 40, 27–67, https://doi.org/10.1080/02786820500421521, 2006.
Canagaratna, M. R., Jimenez, J. L., Kroll, J. H., Chen, Q., Kessler, S. H., Massoli, P., Hildebrandt Ruiz, L., Fortner, E., Williams, L. R., Wilson, K. R., Surratt, J. D., Donahue, N. M., Jayne, J. T., and Worsnop, D. R.: Elemental ratio measurements of organic compounds using aerosol mass spectrometry: characterization, improved calibration, and implications, Atmos. Chem. Phys., 15, 253–272, https://doi.org/10.5194/acp-15-253-2015, 2015.
Cao, J., Xu, B., He, J., Liu, X., Han, Y., Wang, G., and Zhu, C.: Concentrations, seasonal variations, and transport of carbonaceous aerosols at a remote Mountainous region in western China, Atmos. Environ., 43, 4444–4452, https://doi.org/10.1016/j.atmosenv.2009.06.023, 2009.
Chen, F., Ding, L., Piao, S., Zhou, T., Xu, B., Yao, T., and Li, X.: The Tibetan Plateau as the engine for Asian environmental change: the Tibetan Plateau Earth system research into a new era, Sci. Bull., 66, 1263–1266, https://doi.org/10.1016/j.scib.2021.04.017, 2021.
Chen, P., Kang, S., Li, C., Zhang, Q., Guo, J., Tripathee, L., Zhang, Y., Li, G., Gul, C., Cong, Z., Wan, X., Niu, H., Panday, A. K., Rupakheti, M., and Ji, Z.: Carbonaceous aerosol characteristics on the Third Pole: A primary study based on the Atmospheric Pollution and Cryospheric Change (APCC) network, Environ. Pollut., 253, 49–60, https://doi.org/10.1016/j.envpol.2019.06.112, 2019.
Chen, Q., Heald, C. L., Jimenez, J. L., Canagaratna, M. R., Zhang, Q., He, L. Y., Huang, X. F., Campuzano-Jost, P., Palm, B. B., Poulain, L., Kuwata, M., Martin, S. T., Abbatt, J. P. D., Lee, A. K. Y., and Liggio, J.: Elemental composition of organic aerosol: The gap between ambient and laboratory measurements, Geophys. Res. Lett., 42, 4182–4189, https://doi.org/10.1002/2015gl063693, 2015.
Cong, Z., Kang, S., Kawamura, K., Liu, B., Wan, X., Wang, Z., Gao, S., and Fu, P.: Carbonaceous aerosols on the south edge of the Tibetan Plateau: concentrations, seasonality and sources, Atmos. Chem. Phys., 15, 1573–1584, https://doi.org/10.5194/acp-15-1573-2015, 2015.
Cui, Y. Y., Liu, S., Bai, Z., Bian, J., Li, D., Fan, K., McKeen, S. A., Watts, L. A., Ciciora, S. J., and Gao, R.-S.: Religious burning as a potential major source of atmospheric fine aerosols in summertime Lhasa on the Tibetan Plateau, Atmos. Environ., 181, 186–191, https://doi.org/10.1016/j.atmosenv.2018.03.025, 2018.
Dal Maso, M., Kulmala, M., Riipinen, I., Wagner, R., Hussein, T., Aalto, P. P., and Lehtinen, K. E. J.: Formation and growth of fresh atmospheric aerosols: eight years of aerosol size distribution data from SMEAR II, Hyytiala, Finland, Boreal Environ. Res., 10, 323–336, 2005.
Deng, Z. Z., Zhao, C. S., Ma, N., Liu, P. F., Ran, L., Xu, W. Y., Chen, J., Liang, Z., Liang, S., Huang, M. Y., Ma, X. C., Zhang, Q., Quan, J. N., Yan, P., Henning, S., Mildenberger, K., Sommerhage, E., Schäfer, M., Stratmann, F., and Wiedensohler, A.: Size-resolved and bulk activation properties of aerosols in the North China Plain, Atmos. Chem. Phys., 11, 3835–3846, https://doi.org/10.5194/acp-11-3835-2011, 2011.
Draxler, R. R. and Rolph, G. D.: HYSPLIT (HYbrid Single-Particle Lagrangian Integrated Trajectory) model access via NOAA ARL READY website, NOAA Air Resources Laboratory, Silver Spring, MD, USA, https://www.arl.noaa.gov/hysplit/ (last access: 12 April 2024), 2003.
Du, W., Sun, Y. L., Xu, Y. S., Jiang, Q., Wang, Q. Q., Yang, W., Wang, F., Bai, Z. P., Zhao, X. D., and Yang, Y. C.: Chemical characterization of submicron aerosol and particle growth events at a national background site (3295 m a.s.l.) on the Tibetan Plateau, Atmos. Chem. Phys., 15, 10811–10824, https://doi.org/10.5194/acp-15-10811-2015, 2015.
Duan, A. M. and Wu, G. X.: Role of the Tibetan Plateau thermal forcing in the summer climate patterns over subtropical Asia, Clim. Dynam., 24, 793–807, https://doi.org/10.1007/s00382-004-0488-8, 2005.
Freney, E. J., Sellegri, K., Canonaco, F., Boulon, J., Hervo, M., Weigel, R., Pichon, J. M., Colomb, A., Prévôt, A. S. H., and Laj, P.: Seasonal variations in aerosol particle composition at the puy-de-Dôme research station in France, Atmos. Chem. Phys., 11, 13047–13059, https://doi.org/10.5194/acp-11-13047-2011, 2011.
Fröhlich, R., Cubison, M. J., Slowik, J. G., Bukowiecki, N., Canonaco, F., Croteau, P. L., Gysel, M., Henne, S., Herrmann, E., Jayne, J. T., Steinbacher, M., Worsnop, D. R., Baltensperger, U., and Prévôt, A. S. H.: Fourteen months of on-line measurements of the non-refractory submicron aerosol at the Jungfraujoch (3580 m a.s.l.) – chemical composition, origins and organic aerosol sources, Atmos. Chem. Phys., 15, 11373–11398, https://doi.org/10.5194/acp-15-11373-2015, 2015.
Gunthe, S. S., Rose, D., Su, H., Garland, R. M., Achtert, P., Nowak, A., Wiedensohler, A., Kuwata, M., Takegawa, N., Kondo, Y., Hu, M., Shao, M., Zhu, T., Andreae, M. O., and Pöschl, U.: Cloud condensation nuclei (CCN) from fresh and aged air pollution in the megacity region of Beijing, Atmos. Chem. Phys., 11, 11023–11039, https://doi.org/10.5194/acp-11-11023-2011, 2011.
He, L.-Y., Lin, Y., Huang, X.-F., Guo, S., Xue, L., Su, Q., Hu, M., Luan, S.-J., and Zhang, Y.-H.: Characterization of high-resolution aerosol mass spectra of primary organic aerosol emissions from Chinese cooking and biomass burning, Atmos. Chem. Phys., 10, 11535–11543, https://doi.org/10.5194/acp-10-11535-2010, 2010.
Jimenez, J. L., Canagaratna, M. R., Donahue, N. M., Prevot, A. S., Zhang, Q., Kroll, J. H., DeCarlo, P. F., Allan, J. D., Coe, H., Ng, N. L., Aiken, A. C., Docherty, K. S., Ulbrich, I. M., Grieshop, A. P., Robinson, A. L., Duplissy, J., Smith, J. D., Wilson, K. R., Lanz, V. A., Hueglin, C., Sun, Y. L., Tian, J., Laaksonen, A., Raatikainen, T., Rautiainen, J., Vaattovaara, P., Ehn, M., Kulmala, M., Tomlinson, J. M., Collins, D. R., Cubison, M. J., Dunlea, E. J., Huffman, J. A., Onasch, T. B., Alfarra, M. R., Williams, P. I., Bower, K., Kondo, Y., Schneider, J., Drewnick, F., Borrmann, S., Weimer, S., Demerjian, K., Salcedo, D., Cottrell, L., Griffin, R., Takami, A., Miyoshi, T., Hatakeyama, S., Shimono, A., Sun, J. Y., Zhang, Y. M., Dzepina, K., Kimmel, J. R., Sueper, D., Jayne, J. T., Herndon, S. C., Trimborn, A. M., Williams, L. R., Wood, E. C., Middlebrook, A. M., Kolb, C. E., Baltensperger, U., and Worsnop, D. R.: Evolution of organic aerosols in the atmosphere, Science, 326, 1525–1529, https://doi.org/10.1126/science.1180353, 2009.
Jimenez, J. L., Canagaratna, M. R., Drewnick, F., Allan, J. D., Alfarra, M. R., Middlebrook, A. M., Slowik, J. G., Zhang, Q., Coe, H., Jayne, J. T., and Worsnop, D. R.: Comment on “The Effects of Molecular Weight and Thermal Decomposition on the Sensitivity of a Thermal Desorption Aerosol Mass Spectrometer”, Aerosol Sci. Technol., 50, i–xv, https://doi.org/10.1080/02786826.2016.1205728, 2016.
Kang, S., Xu, Y., You, Q., Flügel, W.-A., Pepin, N., and Yao, T.: Review of climate and cryospheric change in the Tibetan Plateau, Environ. Res. Lett., 5, 015101, https://doi.org/10.1088/1748-9326/5/1/015101, 2010.
Kang, S., Chen, P., Li, C., Liu, B., and Cong, Z.: Atmospheric Aerosol Elements over the Inland Tibetan Plateau: Concentration, Seasonality, and Transport, Aerosol Air Qual. Res., 16, 789–800, https://doi.org/10.4209/aaqr.2015.05.0307, 2016.
Kang, S., Cong, Z., Wang, X., Zhang, Q., Ji, Z., Zhang, Y., and Xu, B.: The transboundary transport of air pollutants and their environmental impacts on Tibetan Plateau, Chin. Sci. Bull., 64, 2876–2884, https://doi.org/10.1360/tb-2019-0135, 2019a.
Kang, S., Zhang, Q., Qian, Y., Ji, Z., Li, C., Cong, Z., Zhang, Y., Guo, J., Du, W., Huang, J., You, Q., Panday, A. K., Rupakheti, M., Chen, D., Gustafsson, Ö., Thiemens, M. H., and Qin, D.: Linking atmospheric pollution to cryospheric change in the Third Pole region: current progress and future prospects, Natl. Sci. Rev., 6, 796–809, https://doi.org/10.1093/nsr/nwz031, 2019b.
Kang, S., Zhang, Y., Chen, P., Guo, J., Zhang, Q., Cong, Z., Kaspari, S., Tripathee, L., Gao, T., Niu, H., Zhong, X., Chen, X., Hu, Z., Li, X., Li, Y., Neupane, B., Yan, F., Rupakheti, D., Gul, C., Zhang, W., Wu, G., Yang, L., Wang, Z., and Li, C.: Black carbon and organic carbon dataset over the Third Pole, Earth Syst. Sci. Data, 14, 683–707, https://doi.org/10.5194/essd-14-683-2022, 2022.
Kopacz, M., Mauzerall, D. L., Wang, J., Leibensperger, E. M., Henze, D. K., and Singh, K.: Origin and radiative forcing of black carbon transported to the Himalayas and Tibetan Plateau, Atmos. Chem. Phys., 11, 2837–2852, https://doi.org/10.5194/acp-11-2837-2011, 2011.
Lau, K. M., Kim, M. K., and Kim, K. M.: Asian summer monsoon anomalies induced by aerosol direct forcing: the role of the Tibetan Plateau, Clim. Dynam., 26, 855–864, https://doi.org/10.1007/s00382-006-0114-z, 2006.
Li, C., Bosch, C., Kang, S., Andersson, A., Chen, P., Zhang, Q., Cong, Z., Chen, B., Qin, D., and Gustafsson, O.: Sources of black carbon to the Himalayan-Tibetan Plateau glaciers, Nat. Commun., 7, 12574, https://doi.org/10.1038/ncomms12574, 2016a.
Li, C., Yan, F., Kang, S., Chen, P., Hu, Z., Gao, S., Qu, B., and Sillanpää, M.: Light absorption characteristics of carbonaceous aerosols in two remote stations of the southern fringe of the Tibetan Plateau, China, Atmos. Environ., 143, 79–85, https://doi.org/10.1016/j.atmosenv.2016.08.042, 2016b.
Li, X., Kang, S., Zhang, G., Qu, B., Tripathee, L., Paudyal, R., Jing, Z., Zhang, Y., Yan, F., Li, G., Cui, X., Xu, R., Hu, Z., and Li, C.: Light-absorbing impurities in a southern Tibetan Plateau glacier: Variations and potential impact on snow albedo and radiative forcing, Atmos. Res., 200, 77–87, https://doi.org/10.1016/j.atmosres.2017.10.002, 2018.
Li, Y. J., Sun, Y., Zhang, Q., Li, X., Li, M., Zhou, Z., and Chan, C. K.: Real-time chemical characterization of atmospheric particulate matter in China: A review, Atmos. Environ., 158, 270–304, https://doi.org/10.1016/j.atmosenv.2017.02.027, 2017.
Liu, Y., Sato, Y., Jia, R., Xie, Y., Huang, J., and Nakajima, T.: Modeling study on the transport of summer dust and anthropogenic aerosols over the Tibetan Plateau, Atmos. Chem. Phys., 15, 12581–12594, https://doi.org/10.5194/acp-15-12581-2015, 2015.
Liu, Y., Hua, S., Jia, R., and Huang, J.: Effect of Aerosols on the Ice Cloud Properties Over the Tibetan Plateau, J. Geophys. Res.-Atmos., 124, 9594–9608, https://doi.org/10.1029/2019jd030463, 2019.
Middlebrook, A. M., Bahreini, R., Jimenez, J. L., and Canagaratna, M. R.: Evaluation of Composition-Dependent Collection Efficiencies for the Aerodyne Aerosol Mass Spectrometer using Field Data, Aerosol Sci. Technol., 46, 258–271, https://doi.org/10.1080/02786826.2011.620041, 2012.
Pöhlker, M. L., Pöhlker, C., Ditas, F., Klimach, T., Hrabe de Angelis, I., Araújo, A., Brito, J., Carbone, S., Cheng, Y., Chi, X., Ditz, R., Gunthe, S. S., Kesselmeier, J., Könemann, T., Lavrič, J. V., Martin, S. T., Mikhailov, E., Moran-Zuloaga, D., Rose, D., Saturno, J., Su, H., Thalman, R., Walter, D., Wang, J., Wolff, S., Barbosa, H. M. J., Artaxo, P., Andreae, M. O., and Pöschl, U.: Long-term observations of cloud condensation nuclei in the Amazon rain forest – Part 1: Aerosol size distribution, hygroscopicity, and new model parametrizations for CCN prediction, Atmos. Chem. Phys., 16, 15709–15740, https://doi.org/10.5194/acp-16-15709-2016, 2016.
Qiu, J.: The third pole, Nature, 454, 393–396, https://doi.org/10.1038/454393a, 2008.
Ramanathan, V., Ramana, M. V., Roberts, G., Kim, D., Corrigan, C., Chung, C., and Winker, D.: Warming trends in Asia amplified by brown cloud solar absorption, Nature, 448, 575–578, https://doi.org/10.1038/nature06019, 2007.
Ricchiazzi, P., Yang, S., Gautier, C., and Sowle, D.: SBDART: A Research and Teaching Software Tool for Plane-Parallel Radiative Transfer in the Earth's Atmosphere, B. Am. Meteorol. Soc., 79, 2101–2114, https://doi.org/10.1175/1520-0477(1998)079<2101:Sarats>2.0.Co;2, 1998.
Rinaldi, M., Gilardoni, S., Paglione, M., Sandrini, S., Fuzzi, S., Massoli, P., Bonasoni, P., Cristofanelli, P., Marinoni, A., Poluzzi, V., and Decesari, S.: Organic aerosol evolution and transport observed at Mt. Cimone (2165 m a.s.l.), Italy, during the PEGASOS campaign, Atmos. Chem. Phys., 15, 11327–11340, https://doi.org/10.5194/acp-15-11327-2015, 2015.
Rose, D., Gunthe, S. S., Mikhailov, E., Frank, G. P., Dusek, U., Andreae, M. O., and Pöschl, U.: Calibration and measurement uncertainties of a continuous-flow cloud condensation nuclei counter (DMT-CCNC): CCN activation of ammonium sulfate and sodium chloride aerosol particles in theory and experiment, Atmos. Chem. Phys., 8, 1153–1179, https://doi.org/10.5194/acp-8-1153-2008, 2008.
Rose, D., Nowak, A., Achtert, P., Wiedensohler, A., Hu, M., Shao, M., Zhang, Y., Andreae, M. O., and Pöschl, U.: Cloud condensation nuclei in polluted air and biomass burning smoke near the mega-city Guangzhou, China – Part 1: Size-resolved measurements and implications for the modeling of aerosol particle hygroscopicity and CCN activity, Atmos. Chem. Phys., 10, 3365–3383, https://doi.org/10.5194/acp-10-3365-2010, 2010.
Schmale, J., Schneider, J., Nemitz, E., Tang, Y. S., Dragosits, U., Blackall, T. D., Trathan, P. N., Phillips, G. J., Sutton, M., and Braban, C. F.: Sub-Antarctic marine aerosol: dominant contributions from biogenic sources, Atmos. Chem. Phys., 13, 8669–8694, https://doi.org/10.5194/acp-13-8669-2013, 2013.
Schueneman, M. K., Nault, B. A., Campuzano-Jost, P., Jo, D. S., Day, D. A., Schroder, J. C., Palm, B. B., Hodzic, A., Dibb, J. E., and Jimenez, J. L.: Aerosol pH indicator and organosulfate detectability from aerosol mass spectrometry measurements, Atmos. Meas. Tech., 14, 2237–2260, https://doi.org/10.5194/amt-14-2237-2021, 2021.
Selimovic, V., Yokelson, R. J., Warneke, C., Roberts, J. M., de Gouw, J., Reardon, J., and Griffith, D. W. T.: Aerosol optical properties and trace gas emissions by PAX and OP-FTIR for laboratory-simulated western US wildfires during FIREX, Atmos. Chem. Phys., 18, 2929–2948, https://doi.org/10.5194/acp-18-2929-2018, 2018.
Sun, Y., Zhang, Q., Macdonald, A. M., Hayden, K., Li, S. M., Liggio, J., Liu, P. S. K., Anlauf, K. G., Leaitch, W. R., Steffen, A., Cubison, M., Worsnop, D. R., van Donkelaar, A., and Martin, R. V.: Size-resolved aerosol chemistry on Whistler Mountain, Canada with a high-resolution aerosol mass spectrometer during INTEX-B, Atmos. Chem. Phys., 9, 3095–3111, https://doi.org/10.5194/acp-9-3095-2009, 2009.
Sun, Y.-L., Zhang, Q., Schwab, J. J., Demerjian, K. L., Chen, W.-N., Bae, M.-S., Hung, H.-M., Hogrefe, O., Frank, B., Rattigan, O. V., and Lin, Y.-C.: Characterization of the sources and processes of organic and inorganic aerosols in New York city with a high-resolution time-of-flight aerosol mass apectrometer, Atmos. Chem. Phys., 11, 1581–1602, https://doi.org/10.5194/acp-11-1581-2011, 2011.
Takami, A., Miyoshi, T., Shimono, A., and Hatakeyama, S.: Chemical composition of fine aerosol measured by AMS at Fukue Island, Japan during APEX period, Atmos. Environ., 39, 4913–4924, https://doi.org/10.1016/j.atmosenv.2005.04.038, 2005.
Van Damme, M., Erisman, J. W., Clarisse, L., Dammers, E., Whitburn, S., Clerbaux, C., Dolman, A. J., and Coheur, P.-F.: Worldwide spatiotemporal atmospheric ammonia (NH3) columns variability revealed by satellite, Geophys. Res. Lett., 42, 8660–8668, https://doi.org/10.1002/2015gl065496, 2015.
Wan, X., Kang, S., Wang, Y., Xin, J., Liu, B., Guo, Y., Wen, T., Zhang, G., and Cong, Z.: Size distribution of carbonaceous aerosols at a high-altitude site on the central Tibetan Plateau (Nam Co Station, 4730 m a.s.l.), Atmos. Res., 153, 155–164, https://doi.org/10.1016/j.atmosres.2014.08.008, 2015.
Wang, J., Ge, X., Chen, Y., Shen, Y., Zhang, Q., Sun, Y., Xu, J., Ge, S., Yu, H., and Chen, M.: Highly time-resolved urban aerosol characteristics during springtime in Yangtze River Delta, China: insights from soot particle aerosol mass spectrometry, Atmos. Chem. Phys., 16, 9109–9127, https://doi.org/10.5194/acp-16-9109-2016, 2016.
Wang, J., Zhang, Q., Chen, M., Collier, S., Zhou, S., Ge, X., Xu, J., Shi, J., Xie, C., Hu, J., Ge, S., Sun, Y., and Coe, H.: First Chemical Characterization of Refractory Black Carbon Aerosols and Associated Coatings over the Tibetan Plateau (4730 m a.s.l.), Environ. Sci. Technol., 51, 14072–14082, https://doi.org/10.1021/acs.est.7b03973, 2017.
Xie, C., Xu, W., Wang, J., Wang, Q., Liu, D., Tang, G., Chen, P., Du, W., Zhao, J., Zhang, Y., Zhou, W., Han, T., Bian, Q., Li, J., Fu, P., Wang, Z., Ge, X., Allan, J., Coe, H., and Sun, Y.: Vertical characterization of aerosol optical properties and brown carbon in winter in urban Beijing, China, Atmos. Chem. Phys., 19, 165–179, https://doi.org/10.5194/acp-19-165-2019, 2019.
Xu, B., Cao, J., Hansen, J., Yao, T., Joswia, D. R., Wang, N., Wu, G., Wang, M., Zhao, H., Yang, W., Liu, X., and He, J.: Black soot and the survival of Tibetan glaciers, P. Natl. Acad. Sci. USA, 106, 22114–22118, https://doi.org/10.1073/pnas.0910444106, 2009.
Xu, J.: High-time-resolution dataset of atmospheric aerosols over the Tibetan Plateau and its surroundings (2015–2021), National Cryosphere Desert Data Center [data set], https://doi.org/10.12072/ncdc.NIEER.db2200.2022, 2022.
Xu, J., Wang, Z., Yu, G., Qin, X., Ren, J., and Qin, D.: Characteristics of water soluble ionic species in fine particles from a high altitude site on the northern boundary of Tibetan Plateau: Mixture of mineral dust and anthropogenic aerosol, Atmos. Res., 143, 43–56, https://doi.org/10.1016/j.atmosres.2014.01.018, 2014a.
Xu, J., Zhang, Q., Chen, M., Ge, X., Ren, J., and Qin, D.: Chemical composition, sources, and processes of urban aerosols during summertime in northwest China: insights from high-resolution aerosol mass spectrometry, Atmos. Chem. Phys., 14, 12593–12611, https://doi.org/10.5194/acp-14-12593-2014, 2014b.
Xu, J., Shi, J., Zhang, Q., Ge, X., Canonaco, F., Prévôt, A. S. H., Vonwiller, M., Szidat, S., Ge, J., Ma, J., An, Y., Kang, S., and Qin, D.: Wintertime organic and inorganic aerosols in Lanzhou, China: sources, processes, and comparison with the results during summer, Atmos. Chem. Phys., 16, 14937–14957, https://doi.org/10.5194/acp-16-14937-2016, 2016.
Xu, J., Zhang, Q., Shi, J., Ge, X., Xie, C., Wang, J., Kang, S., Zhang, R., and Wang, Y.: Chemical characteristics of submicron particles at the central Tibetan Plateau: insights from aerosol mass spectrometry, Atmos. Chem. Phys., 18, 427–443, https://doi.org/10.5194/acp-18-427-2018, 2018.
Xu, J., Hettiyadura, A. P. S., Liu, Y., Zhang, X., Kang, S., and Laskin, A.: Regional Differences of Chemical Composition and Optical Properties of Aerosols in the Tibetan Plateau, J. Geophys. Res.-Atmos., 125, e2019JD031226, https://doi.org/10.1029/2019jd031226, 2020.
Xu, J., Hettiyadura, A. P. S., Liu, Y., Zhang, X., Kang, S., and Laskin, A.: Atmospheric Brown Carbon on the Tibetan Plateau: Regional Differences in Chemical Composition and Light Absorption Properties, Environ. Sci. Technol. Lett., 9, 219–225, https://doi.org/10.1021/acs.estlett.2c00016, 2022.
Xu, J. Z., Zhang, Q., Wang, Z. B., Yu, G. M., Ge, X. L., and Qin, X.: Chemical composition and size distribution of summertime PM2.5 at a high altitude remote location in the northeast of the Qinghai–Xizang (Tibet) Plateau: insights into aerosol sources and processing in free troposphere, Atmos. Chem. Phys., 15, 5069–5081, https://doi.org/10.5194/acp-15-5069-2015, 2015.
Yao, T., Thompson, L., Mosbrugger, V., Zhang, F., Ma, Y., Luo, T., Xu, B., Yang, X., Joswiak, D. R., Wang, W., Joswiak, M. E., Devkota, L. P., Tayal, S., Jilani, R., and Fayziev, R.: Third Pole Environment (TPE), Environ. Dev., 3, 52–64, https://doi.org/10.1016/j.envdev.2012.04.002, 2012.
Yao, T., Xue, Y., Chen, D., Chen, F., Thompson, L., Cui, P., Koike, T., Lau, W. K. M., Lettenmaier, D., Mosbrugger, V., Zhang, R., Xu, B., Dozier, J., Gillespie, T., Gu, Y., Kang, S., Piao, S., Sugimoto, S., Ueno, K., Wang, L., Wang, W., Zhang, F., Sheng, Y., Guo, W., Ailikun, Yang, X., Ma, Y., Shen, S. S. P., Su, Z., Chen, F., Liang, S., Liu, Y., Singh, V. P., Yang, K., Yang, D., Zhao, X., Qian, Y., Zhang, Y., and Li, Q.: Recent Third Pole's Rapid Warming Accompanies Cryospheric Melt and Water Cycle Intensification and Interactions between Monsoon and Environment: Multidisciplinary Approach with Observations, Modeling, and Analysis, B. Am. Meteorol. Soc., 100, 423–444, https://doi.org/10.1175/bams-d-17-0057.1, 2019.
You, Q., Cai, Z., Pepin, N., Chen, D., Ahrens, B., Jiang, Z., Wu, F., Kang, S., Zhang, R., Wu, T., Wang, P., Li, M., Zuo, Z., Gao, Y., Zhai, P., and Zhang, Y.: Warming amplification over the Arctic Pole and Third Pole: Trends, mechanisms and consequences, Earth-Sci. Rev., 217, 103625, https://doi.org/10.1016/j.earscirev.2021.103625, 2021.
Zhang, N., Cao, J., Liu, S., Zhao, Z., Xu, H., and Xiao, S.: Chemical composition and sources of PM2.5 and TSP collected at Qinghai Lake during summertime, Atmos. Res., 138, 213–222, https://doi.org/10.1016/j.atmosres.2013.11.016, 2014.
Zhang, Q., Alfarra, M. R., Worsnop, D. R., Allan, J. D., Coe, H., Canagaratna, M. R., and Jimenez, J. L.: Deconvolution and quantification of hydrocarbon-like and oxygenated organic aerosols based on aerosol mass spectrometry, Environ. Sci. Technol., 39, 4938–4952, https://doi.org/10.1021/es048568l, 2005a.
Zhang, Q., Canagaratna, M. R., Jayne, J. T., Worsnop, D. R., and Jimenez, J. L.: Time- and size-resolved chemical composition of submicron particles in Pittsburgh: Implications for aerosol sources and processes, J. Geophys. Res.-Atmos., 110, D07S09, https://doi.org/10.1029/2004jd004649, 2005b.
Zhang, Q., Jimenez, J. L., Canagaratna, M. R., Allan, J. D., Coe, H., Ulbrich, I., Alfarra, M. R., Takami, A., Middlebrook, A. M., Sun, Y. L., Dzepina, K., Dunlea, E., Docherty, K., DeCarlo, P. F., Salcedo, D., Onasch, T., Jayne, J. T., Miyoshi, T., Shimono, A., Hatakeyama, S., Takegawa, N., Kondo, Y., Schneider, J., Drewnick, F., Borrmann, S., Weimer, S., Demerjian, K., Williams, P., Bower, K., Bahreini, R., Cottrell, L., Griffin, R. J., Rautiainen, J., Sun, J. Y., Zhang, Y. M., and Worsnop, D. R.: Ubiquity and dominance of oxygenated species in organic aerosols in anthropogenically-influenced Northern Hemisphere midlatitudes, Geophys. Res. Lett., 34, L13801, https://doi.org/10.1029/2007gl029979, 2007a.
Zhang, Q., Jimenez, J. L., Worsnop, D., and Canagaratna, M.: A case study of urban particle acidity and its influence on secondary organic aerosol, Environ. Sci. Technol., 41, 3213–3219, https://doi.org/10.1021/es061812j, 2007b.
Zhang, X., Xu, J., Kang, S., Liu, Y., and Zhang, Q.: Chemical characterization of long-range transport biomass burning emissions to the Himalayas: insights from high-resolution aerosol mass spectrometry, Atmos. Chem. Phys., 18, 4617–4638, https://doi.org/10.5194/acp-18-4617-2018, 2018.
Zhang, X., Xu, J., Kang, S., Zhang, Q., and Sun, J.: Chemical characterization and sources of submicron aerosols in the northeastern Qinghai–Tibet Plateau: insights from high-resolution mass spectrometry, Atmos. Chem. Phys., 19, 7897–7911, https://doi.org/10.5194/acp-19-7897-2019, 2019.
Zhang, X., Xu, J., and Kang, S.: Chemical characterization of submicron particulate matter (PM1) emitted by burning highland barley in the northeastern part of the Qinghai–Tibet Plateau, Atmos. Environ., 224, 117351, https://doi.org/10.1016/j.atmosenv.2020.117351, 2020.
Zhang, X., Xu, J., Kang, S., Sun, J., Shi, J., Gong, C., Sun, X., Du, H., Ge, X., and Zhang, Q.: Regional Differences in the Light Absorption Properties of Fine Particulate Matter Over the Tibetan Plateau: Insights From HR-ToF-AMS and Aethalometer Measurements, J. Geophys. Res.-Atmos., 126, e2021JD035562, https://doi.org/10.1029/2021jd035562, 2021.
Zhao, W., Zhang, X., Zhai, L., Shen, X., and Xu, J.: Chemical characterization and sources of submicron aerosols in Lhasa on the Qinghai–Tibet Plateau: Insights from high-resolution mass spectrometry, Sci. Total Environ., 815, 152866, https://doi.org/10.1016/j.scitotenv.2021.152866, 2022.
Zhao, Z., Cao, J., Shen, Z., Xu, B., Zhu, C., Chen, L.-W. A., Su, X., Liu, S., Han, Y., Wang, G., and Ho, K.: Aerosol particles at a high-altitude site on the Southeast Tibetan Plateau, China: Implications for pollution transport from South Asia, J. Geophys. Res.-Atmos., 118, 11360–11375, https://doi.org/10.1002/jgrd.50599, 2013.
Zheng, J., Hu, M., Du, Z., Shang, D., Gong, Z., Qin, Y., Fang, J., Gu, F., Li, M., Peng, J., Li, J., Zhang, Y., Huang, X., He, L., Wu, Y., and Guo, S.: Influence of biomass burning from South Asia at a high-altitude mountain receptor site in China, Atmos. Chem. Phys., 17, 6853–6864, https://doi.org/10.5194/acp-17-6853-2017, 2017.
Zhou, S., Collier, S., Jaffe, D. A., Briggs, N. L., Hee, J., Sedlacek III, A. J., Kleinman, L., Onasch, T. B., and Zhang, Q.: Regional influence of wildfires on aerosol chemistry in the western US and insights into atmospheric aging of biomass burning organic aerosol, Atmos. Chem. Phys., 17, 2477–2493, https://doi.org/10.5194/acp-17-2477-2017, 2017.
Zhou, T. and Zhang, W.: Anthropogenic warming of Tibetan Plateau and constrained future projection, Environ. Res. Lett., 16, 044039, https://doi.org/10.1088/1748-9326/abede8, 2021.
Zhou, W., Xu, W., Kim, H., Zhang, Q., Fu, P., Worsnop, D. R., and Sun, Y.: A review of aerosol chemistry in Asia: insights from aerosol mass spectrometer measurements, Environ. Sci.-Proc. Imp., 22, 1616–1653, https://doi.org/10.1039/D0EM00212G, 2020.
Zhu, C.-S., Cao, J.-J., Ho, K.-F., Antony Chen, L. W., Huang, R.-J., Wang, Y.-C., Li, H., Shen, Z.-X., Chow, J. C., Watson, J. G., Su, X.-L., Wang, Q.-Y., and Xiao, S.: The optical properties of urban aerosol in northern China: A case study at Xi'an, Atmos. Res., 160, 59–67, https://doi.org/10.1016/j.atmosres.2015.03.008, 2015.
Zhu, Q., He, L.-Y., Huang, X.-F., Cao, L.-M., Gong, Z.-H., Wang, C., Zhuang, X., and Hu, M.: Atmospheric aerosol compositions and sources at two national background sites in northern and southern China, Atmos. Chem. Phys., 16, 10283–10297, https://doi.org/10.5194/acp-16-10283-2016, 2016.
- Abstract
- Introduction
- Observation site descriptions
- Online sampling, instrumental setup, and data processing
- Aerosol properties, sources, and radiative forcing over the TP
- Dataset limitations and applications
- Data availability
- Conclusions
- Appendix A: Main abbreviations
- Author contributions
- Competing interests
- Disclaimer
- Acknowledgements
- Financial support
- Review statement
- References
- Supplement