the Creative Commons Attribution 4.0 License.
the Creative Commons Attribution 4.0 License.
 | 04 Apr 2024
ChinaRiceCalendar – seasonal crop calendars for early-, middle-, and late-season rice in China
Hui Li
Shaoqiang Wang
Jinyuan Liu
Yuanyuan Liu
Zhenhai Liu
Shiliang Chen
Qinyi Wang
Tongtong Zhu
Lunche Wang
Lizhe Wang
Long time series and large-scale rice calendar datasets provide valuable information for agricultural planning and field management in rice-based cropping systems. However, current regional-level rice calendar datasets do not accurately distinguish between rice seasons in China, causing uncertainty in crop model simulation and climate change impact analysis. Based on satellite remote sensing data, we extracted transplanting, heading, and maturity dates of early-, middle-, and late-season rice across China from 2003 to 2022 and established a multi-season rice calendar dataset named ChinaRiceCalendar (https://doi.org/10.7910/DVN/EUP8EY, Liu et al., 2023). Overall, the ChinaRiceCalendar dataset shows good agreement with field-observed phenological dates of early-, middle-, and late-season rice in Chinese agricultural meteorological stations (AMSs). According to the calendar data from 2003 to 2022 in China, the transplanting dates for early-, middle-, and late-season rice shifted by +0.7, −0.7, and −5.1 DOY (day of year) per decade, respectively; the heading dates for early-, middle-, and late-season rice shifted by −0.5, +2.7, and −0.6 DOY per decade, respectively; the maturity dates for early-, middle-, and late-season rice shifted by −0.7, +3.8, and −1.6 DOY per decade, respectively. ChinaRiceCalendar can be utilized to investigate and optimize the spatiotemporal structure of rice cultivation in China under climate and land use change.
- Article
(5659 KB) - Full-text XML
- BibTeX
- EndNote


As one of the major food crops, rice feeds nearly half of the world's population (Fahad et al., 2019). In the context of climate change, continued warming is projected to result in shorter crop growth periods, lower rice productivity, and food insecurity in the Asian monsoon region (Carleton, 2017; Zhao et al., 2017; IPCC, 2022). Revealing changes in rice phenology will facilitate timely adjustment of planting time, rice cultivars, and cropping systems under global warming (Waha et al., 2013; Wang et al., 2022, 2024). Moreover, a dynamic rice calendar with key phenological dates is integral to agricultural monitoring and farmer support systems (Laborte et al., 2017; Fritz et al., 2019; Mishra et al., 2021). Large-scale rice calendars can contribute to more reliable simulations of crop growth and yield at regional and global scales (Franke et al., 2020).
Satellite remote sensing is an effective tool for detecting long-term trends in crop phenology at the regional scale (Xiao et al., 2006; Kotsuki and Tanaka, 2015; Luo et al., 2020; Gao and Zhang, 2021; Mishra et al., 2021). Crop phenology detection methods based on remote sensing vegetation indices (VIs) can be categorized as threshold, inflection point, and shape model approaches. The threshold approaches assume that a development stage begins when the VI value exceeds a predefined threshold (Jönsson and Eklundh, 2004; Boschetti et al., 2009; Pan et al., 2015; Guo et al., 2016). The inflection point approaches reconstruct the VI time series curve by filter smoothing or function fitting and then match the maxima, minima, and inflection points on the curve to the key phenological events (Zhang et al., 2003; Sakamoto et al., 2005; Sun et al., 2009; Wang et al., 2019). The shape model approaches fit observed VI time series curves by geometric scaling a robust standard VI time series curve for the specific crop to identify development stages (Sakamoto et al., 2010; More et al., 2016; Zeng et al., 2016; Sakamoto et al., 2018). In addition to the methods based on time series of VIs, there are also rule-based algorithms that integrate multiple approaches and indicators to detect crop phenology, such as the PhenoRice algorithm proposed by Boschetti et al. (2017). The PhenoRice algorithm, which combines the advantages of threshold and inflection point approaches, utilizes the Enhanced Vegetation Index (EVI), the Normalized Difference Flood Index (NDFI), and the land surface temperature (LST) to estimate rice planting dates. The PhenoRice algorithm excels at extracting rice phenology in multiple cropping systems and has been widely used in East Asia, South Asia, Southeast Asia, and Europe (Busetto et al., 2019; Liu et al., 2020; Mishra et al., 2021). However, the performance of the PhenoRice algorithm depends on the division of rice seasons, which requires expert knowledge about rice-based cropping systems in different regions (Mishra et al., 2021).
In China, there are at least three rice-growing seasons (early, middle, and late seasons) in diverse rice-based cropping systems (e.g., single-rice, double-rice, rice–wheat, rice–rapeseed, or rice–vegetable systems) (Frolking et al., 2002; Qiu et al., 2003; Cao et al., 2021; He et al., 2021). Generally, early-, middle-, and late-season rice in China is transplanted around days of the year (DOY) 80–130, DOY 130–180, and DOY 180–230, respectively. Their typical maturity dates align with DOY 160–220, DOY 240–290, and DOY 270–330, respectively. Although field observations are important data sources for studying rice calendars in different growing seasons, they are usually limited by spatial and temporal discontinuities (Wang et al., 2017). Therefore, previous studies have typically utilized satellite remote sensing products to establish rice calendar datasets at the regional scale (Shihua et al., 2014; Liu et al., 2019; Bai and Xiao, 2020; Luo et al., 2020; Mishra et al., 2021). Nevertheless, these calendar datasets based on satellite remote sensing do not rationally classify rice growing seasons across China. For example, the dataset ChinaCropPhen1km only distinguishes between early and late rice in double-rice systems (Luo et al., 2020); the assumptions of the dataset RICA about rice heading dates in different seasons do not correspond to the realities in China (Mishra et al., 2021). R. Shen et al. (2023) produced high-resolution distribution maps of single-season rice but did not explore multiple rice cropping systems. Early-, middle- and late-season rice in China is not only planted at different times, but also has distinguishing varietal characteristics, such as different temperature and photoperiod sensitivities (Zong et al., 2021). Thus, a crop calendar that accurately classifies rice seasons will provide reliable data for agricultural models to calibrate crop parameters at the variety level. Moreover, effective identification of different rice seasons will help analyze the response and adaptation of rice phenology to climate change.
Therefore, to address the shortcomings of the existing rice calendar datasets in China, we attempted to improve the PhenoRice algorithm and use satellite remote sensing data to (1) establish crop calendars for the early, middle, and late seasons in China; (2) validate the extracted rice calendars in different growing seasons; and (3) explore the spatiotemporal changes in rice calendar dates in major agricultural zones across China from 2003 to 2022.
2.1 Study area
We selected seven agricultural zones in China as the study area: the Northeast Plain (NP), Huanghuaihai Plain (HP), Loess Plateau (LP), Middle and Lower Yangtze River Region (MLY), South China Region (SC), Yunnan–Guizhou Plateau (YGP), and the Sichuan Basin and Surrounding Region (SCS) (Fig. 1). Due to limited hydrothermal resources, the NP and HP zones mainly cultivate single-season rice. Early-, middle-, and late-season rice exist in different cropping systems in the MLY zone. The SC zone has a higher cropping frequency than the other zones and usually cultivates rice twice a year. Parts of Hainan Province cultivate rice three times a year. Agricultural zoning data were obtained from the Resources and Environment Science and Data Center (https://www.resdc.cn/data.aspx?DATAID=275, last access: December 2022).
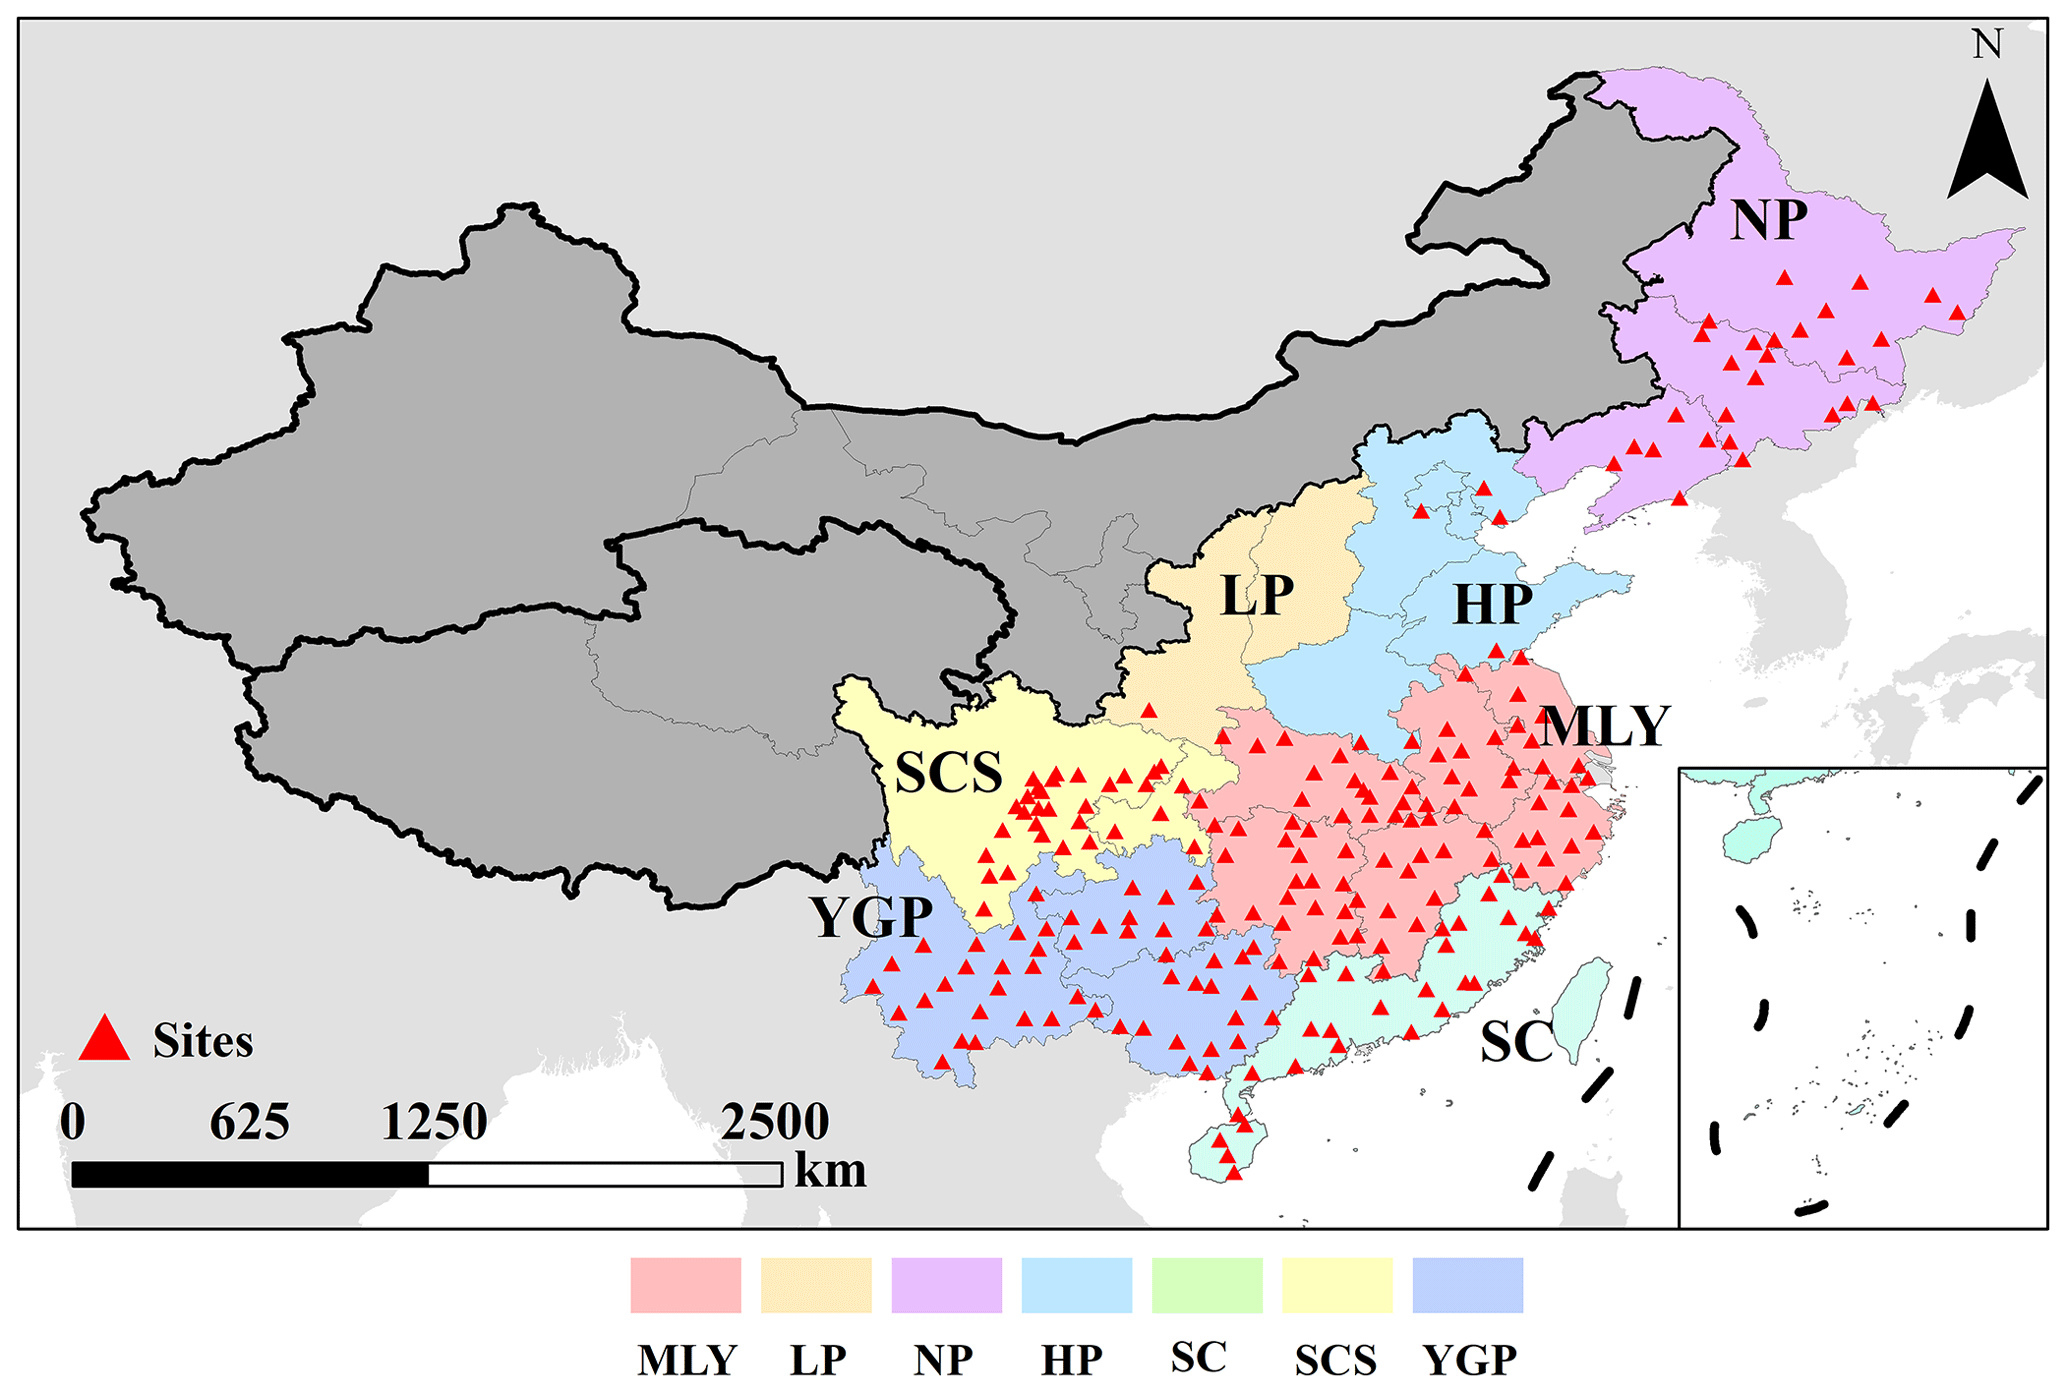
Figure 1Study area and distribution of agricultural meteorological stations (AMSs) in China. Publisher's remark: please note that the above figure contains disputed territories.
2.2 Data
2.2.1 Satellite imagery
MODIS (Moderate Resolution Imaging Spectroradiometer) remote sensing data are widely used in crop phenology detection because of their excellent performance in temporal and spatial continuity (Reed et al., 1994; Zhang et al., 2003; Zhao et al., 2011; Son et al., 2013). We selected two MODIS EVI products for the study area during 2003–2022: MOD13Q1 (TERRA data) and MYD13Q1 (AQUA data) (https://doi.org/10.5067/MODIS/MOD13Q1.061, Didan, 2021). Because the TERRA and AQUA data are based on the synthetic period of moving 8 d from each other, the time series of the two 16 d products of MOD13Q1 and MYD13Q1 have a temporal resolution of 8 d (Boschetti et al., 2017). The red (ρRED) and near-red (ρSWIR) bands of MOD13Q1 and MYD13Q1 were used to calculate the Normalized Flooding Index (NDFI) (Eq. 1). Pixel Reliability, the Usefulness Index, and Blue Band Reflectance from MOD13Q1 and MYD13Q1 were used to assess data quality. The Land Surface Temperature (LST) product from MOD11A2 (https://doi.org/10.5067/MODIS/MOD11A2.061, Wan et al., 2021) was employed to estimate land surface temperature during rice planting.
All the above raster data were downloaded and spatially aggregated to 1 km resolution by the Google Earth Engine (GEE) platform and the Python package of Geemap (Wu, 2020).
2.2.2 Validation data
We collected field observations including the transplanting, heading, and maturity dates of early-, middle- (single-season), and late-season rice between 2003 and 2013 from 338 agricultural meteorological stations (AMSs, https://data.cma.cn/, last access: March 2022) in China. Moreover, we compared ChinaRiceCalendar with other multi-season and regional-scale calendar datasets, including the RiceAtlas dataset based on the agricultural statistics (Laborte et al., 2017), the ChinaCropPhen1km dataset based on the Global Land Surface Satellite (GLASS) leaf area index (LAI) products (Luo et al., 2020), and the RICA dataset based on the MOD13Q1 and MYD13Q1 products (Mishra et al., 2021).
2.2.3 Additional data
Cropland data were obtained from the International Geosphere-Biosphere Program (IGBP) classification of the MODIS land cover product (MCD12Q1) from 2003 to 2022 (https://doi.org/10.5067/MODIS/MCD12Q1.006, Friedl and Sulla-Menashe, 2023). Digital elevation model (DEM) data used to create a terrain mask were obtained from the Shuttle Radar Topography Mission (SRTM, https://srtm.csi.cgiar.org, last access: December 2022). Both data are resampled to a spatial resolution of 1 km.
2.3 Methodology
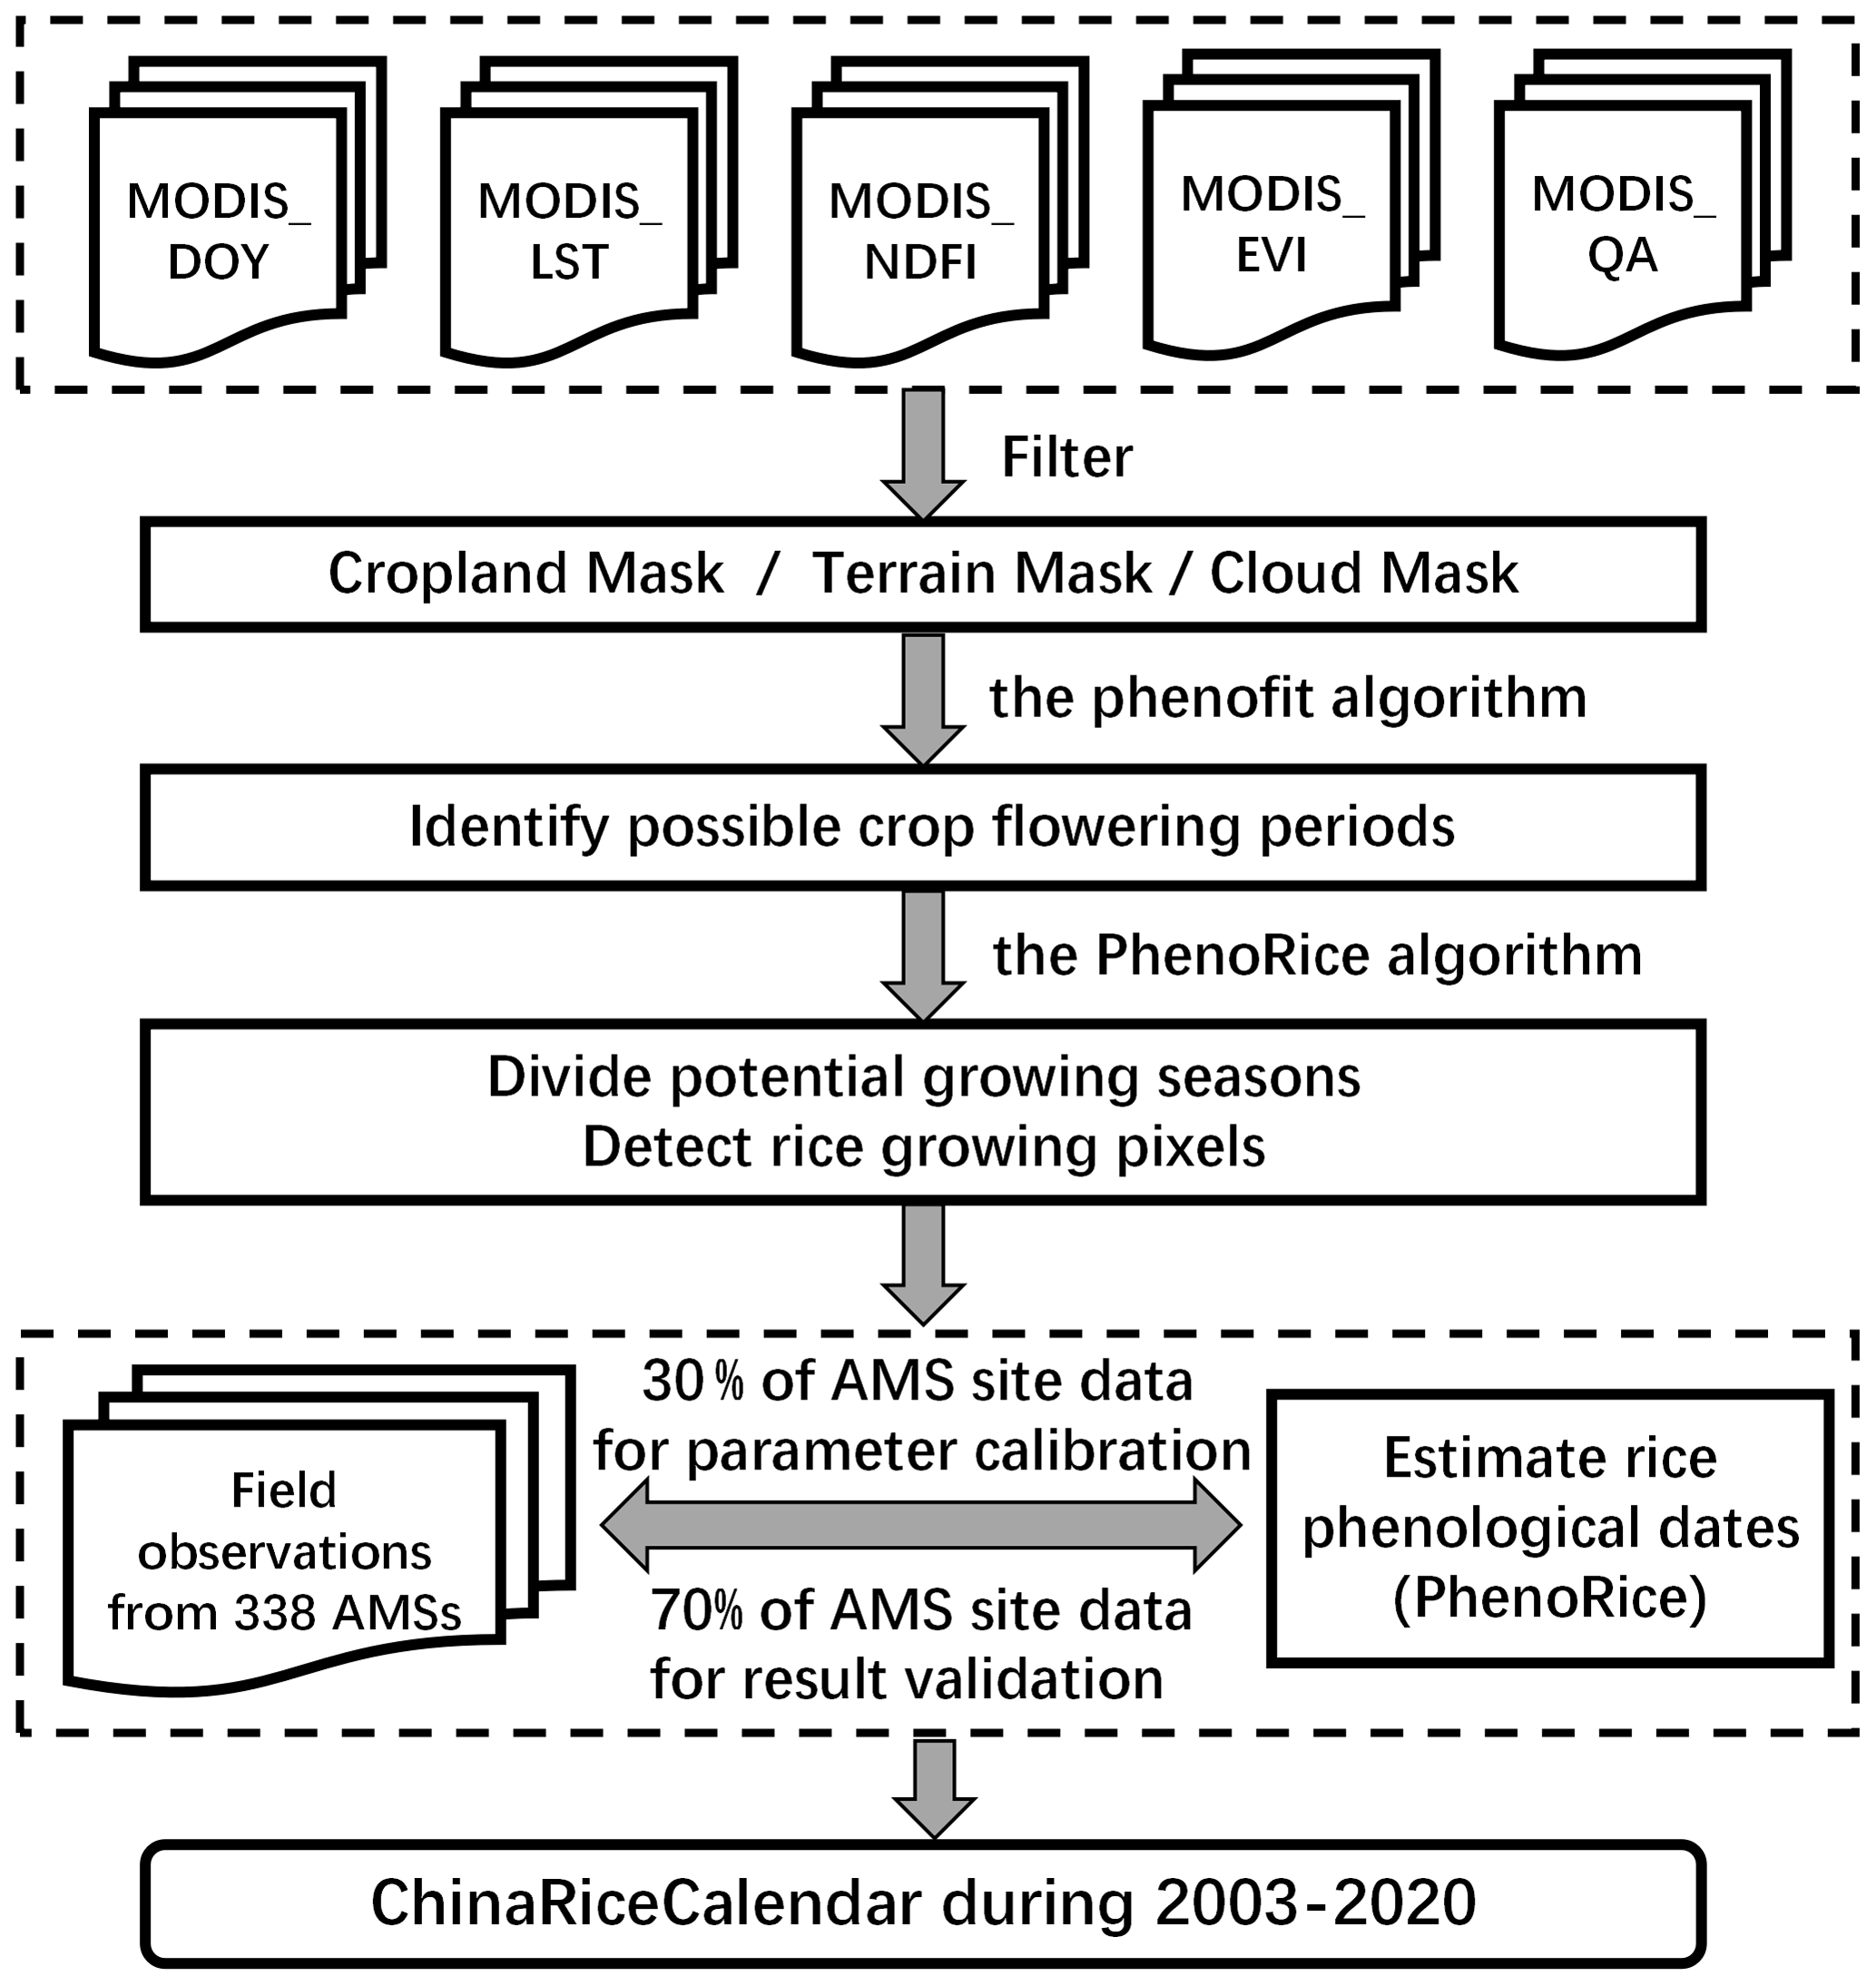
The technology roadmap of this study is shown in Fig. 2.
2.3.1 Data pre-processing
The data pre-processing in the study falls into three steps.
-
The signal of agronomic flooding was used to help identify the rice transplanting period, but non-agricultural wetlands may have similar flooding signals to paddy fields (Dong and Xiao, 2016; Han et al., 2022). Thus, the annual cropland extent from 2003 to 2020 was used to establish a cropland mask to screen the cropland pixels of the MODIS EVI data.
-
Given that too high an elevation or too great a slope is unsuitable for paddy rice cultivation (Gumma et al., 2011; Dong and Xiao, 2016), only the image pixels with an elevation below 2600 m and a slope less than 8° were selected to extract rice calendars (Han et al., 2022).
-
To reduce the impacts of cloud contamination, we deleted the image pixels with reflectances greater than 0.2 in the blue band (Xiao et al., 2006).
2.3.2 Estimation of the rice area and cropping calendar
We combined the PhenoRice algorithm (Boschetti et al., 2017) with a growing season division method (Kong et al., 2022) to extract rice pixels and cropping calendars in different growing seasons. Firstly, we identified possible crop heading periods based on a weighted and smoothed EVI time series curve in each image pixel. Then we input the possible heading periods into the PhenoRice algorithm to divide potential growing seasons and check whether the corresponding EVI time series belongs to rice. Lastly, we estimated rice planting, heading, and maturity dates and categorized them into early-, middle-, and late-season calendars according to the respective transplanting and maturity times.
-
Divide potential growing seasons. The PhenoRice algorithm requires a pre-specification of rice heading periods in different growing seasons to extract the corresponding VI time series. To reduce the uncertainty caused by the artificial division of growing seasons, we employed the phenofit R package developed by Kong et al. (2022) to identify possible heading periods in each image pixel. (1) The weighted Whittaker method in the phenofit R package was employed to smoothen the MODIS–EVI time series (Kong et al., 2022). The Whittaker smoothing function can robustly capture seasonal signals with little noise interference, and it is widely used to identify crop phenology (Atzberger and Eilers, 2011; Bush et al., 2017). The curve fitting mainly relies on information from good-quality points but also extracts the limited information available from the marginal- and bad-quality points. During the rough fitting to the EVI time series, we categorized the data quality of the observations according to their quality control (QC) information (SummaryQA of MOD13A1) and assigned weights of 1.0, 0.5, and 0.2 to the good-, marginal-, and bad-quality VI observations, respectively. (2) Following Kong et al. (2022), the possible heading date (peak point date) in each crop season was identified by the smoothed EVI time series, based on the rules that only one peak value is inside a growing season and that two trough values define a growing season. (3) The possible heading periods (peak point dates ±16 d) detected in each image pixel were input into the PhenoRice algorithm to generate the potential growing seasons.
-
Check whether the pixel belongs to a rice-cultivated area. Whether the pixel belongs to a rice-cultivated area during the selected growing season is checked using the following procedure (Boschetti et al., 2017). (1) Compare the observed maximum and minimum EVI values with the corresponding thresholds for paddy fields (EVImax_th and EVImin_th) to reduce misclassification problems with evergreen forests and non-vegetative areas. (2) Check for the existence of a maximum inflection point on the EVI curve, which must show a consistent increasing trend before the maxima and a consistent decreasing trend after the maxima. The time interval between the inflection points of the minimum and maximum EVI values during the season must fall within the range of rice vegetative growing periods [vl1, vl2]. (3) Check whether the meteorological conditions on the day of the minimum are favourable for rice crop establishment based on a MODIS-LST value above a specified threshold (LSTth). (4) Detect a flood signal (NDFI ≥ minndfi) within a time window (winfl) centred on the minimum. (5) Check whether there is a consistent increase in EVI observed after the minimum. (6) Check whether EVI decreases by more than decrth % of the amplitude of the minimum–maximum range in a time window after the maxima (windecr). Only if all the above requirements are satisfied is the selected growing season in the pixel labelled as a rice season. The PhenoRice parameters used in the study were calibrated by the phenological observations from the AMSs in China (Table 1).
-
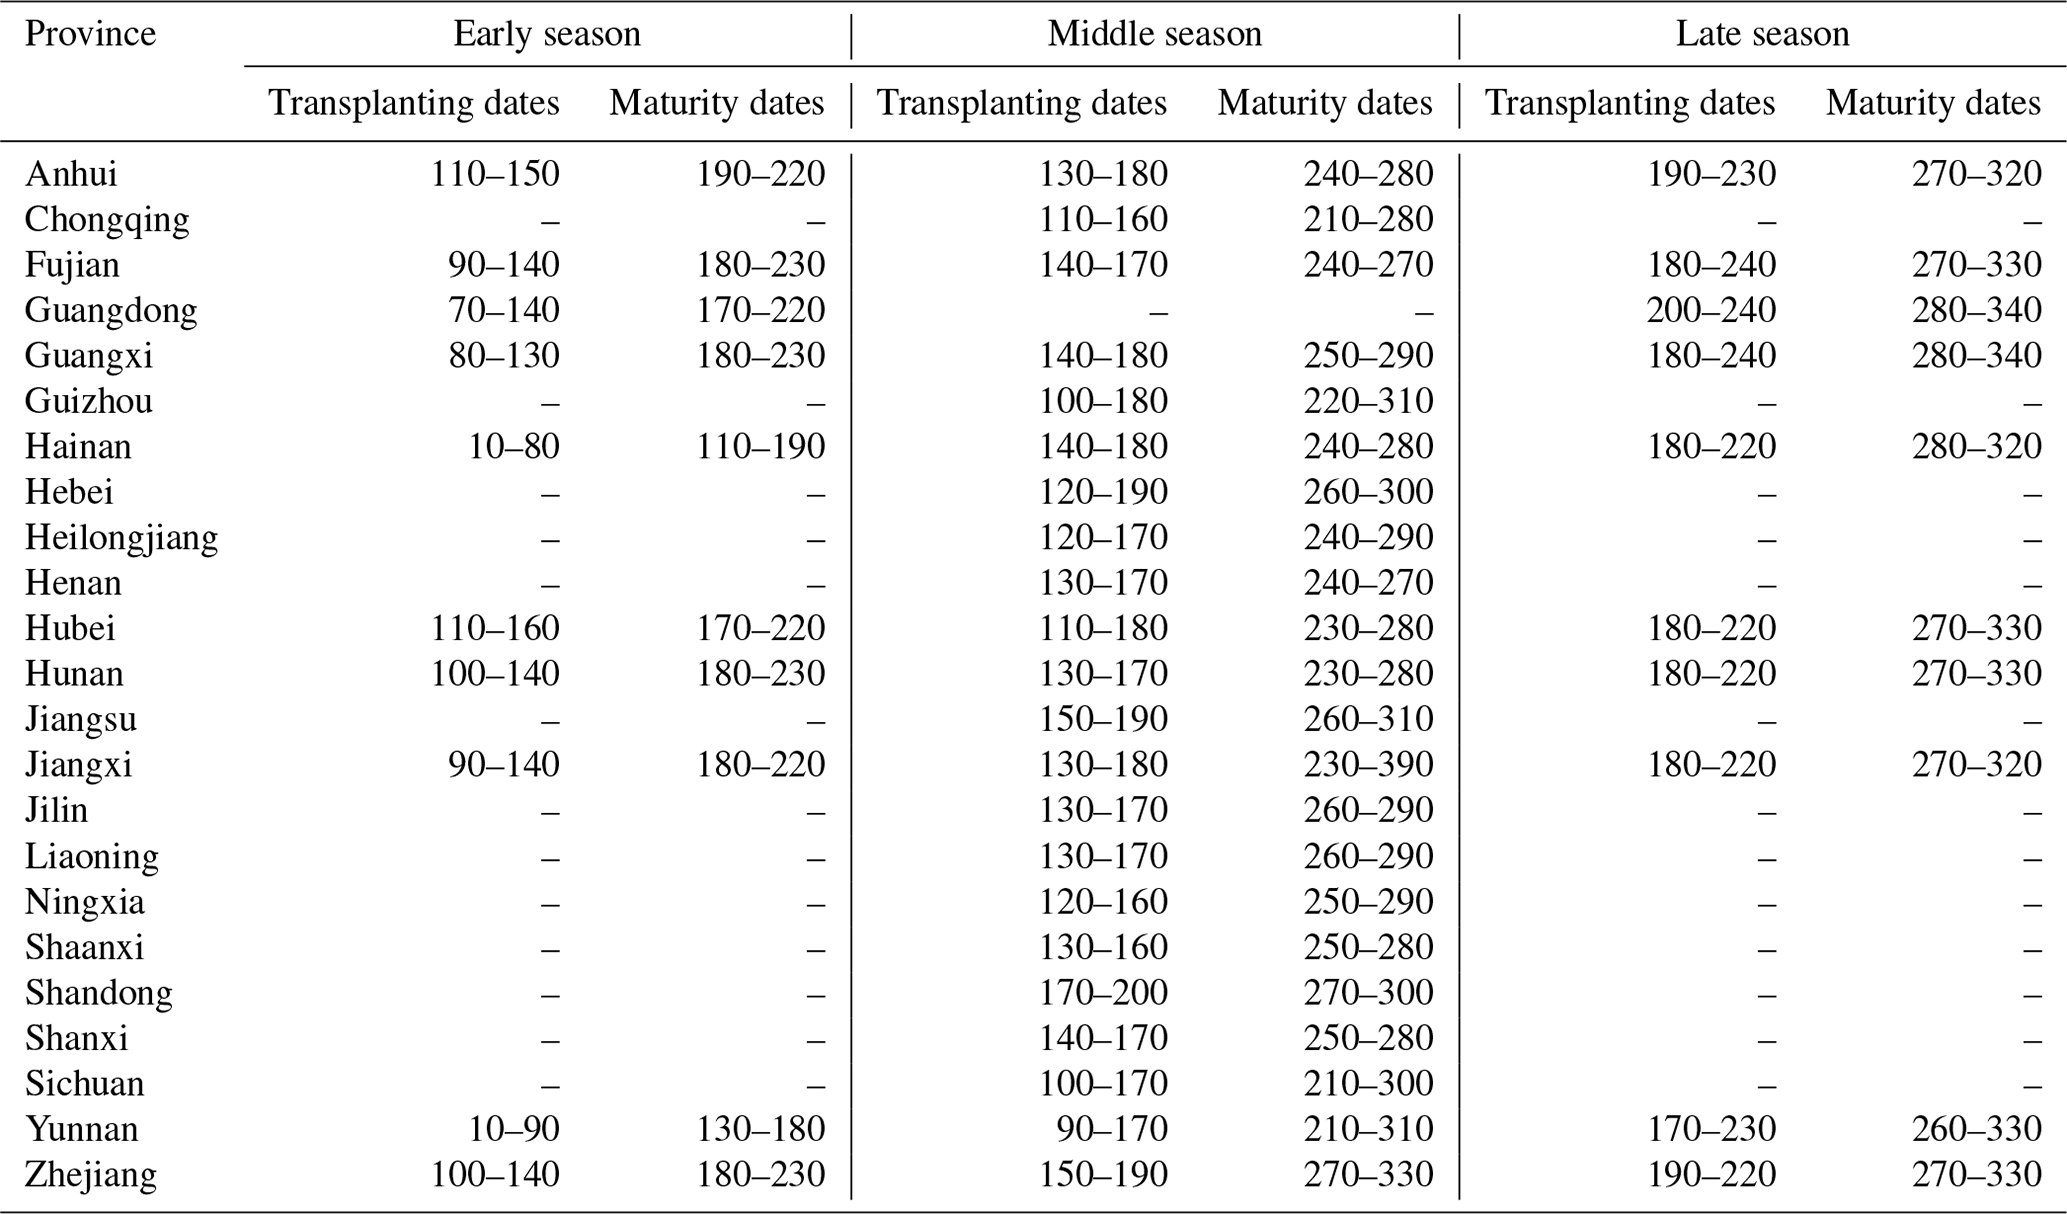
Estimate rice planting, heading, and maturity dates. The rice calendar dates were estimated in the detected rice pixels within the rice seasons. On the EVI time series curve, the onset date of the field growth period corresponds to the date of the minimum point closest to the retained maximum. The heading time corresponds to the date of the retained maximum point. The maturity date corresponds to the date when the EVI declined by decrth % of the amplitude of the minimum–maximum range. Additionally, the study categorized the detected rice calendars as early, middle, and late seasons based on their respective ranges of transplanting and maturity dates in each province (Table 2).
Table 1PhenoRice parameters used in the study (EVImax_th: the EVI threshold above which a local maximum can be considered the peak of a growing season; EVImin_th: the EVI threshold below which a local minimum can be considered the start of a growing season; vl1: the shortest vegetative growth length; vl2: the longest vegetative growth length; tl1: the shortest field growth length; tl2: the longest field growth length; LSTth: the minimum land surface temperature for rice planting; Winfl: time window for capturing flooding signals; minndfi: threshold for the NDFI; Windecr: threshold for a decline window after the EVI maximum; decth: percent decrease in the EVI after the EVI maximum).
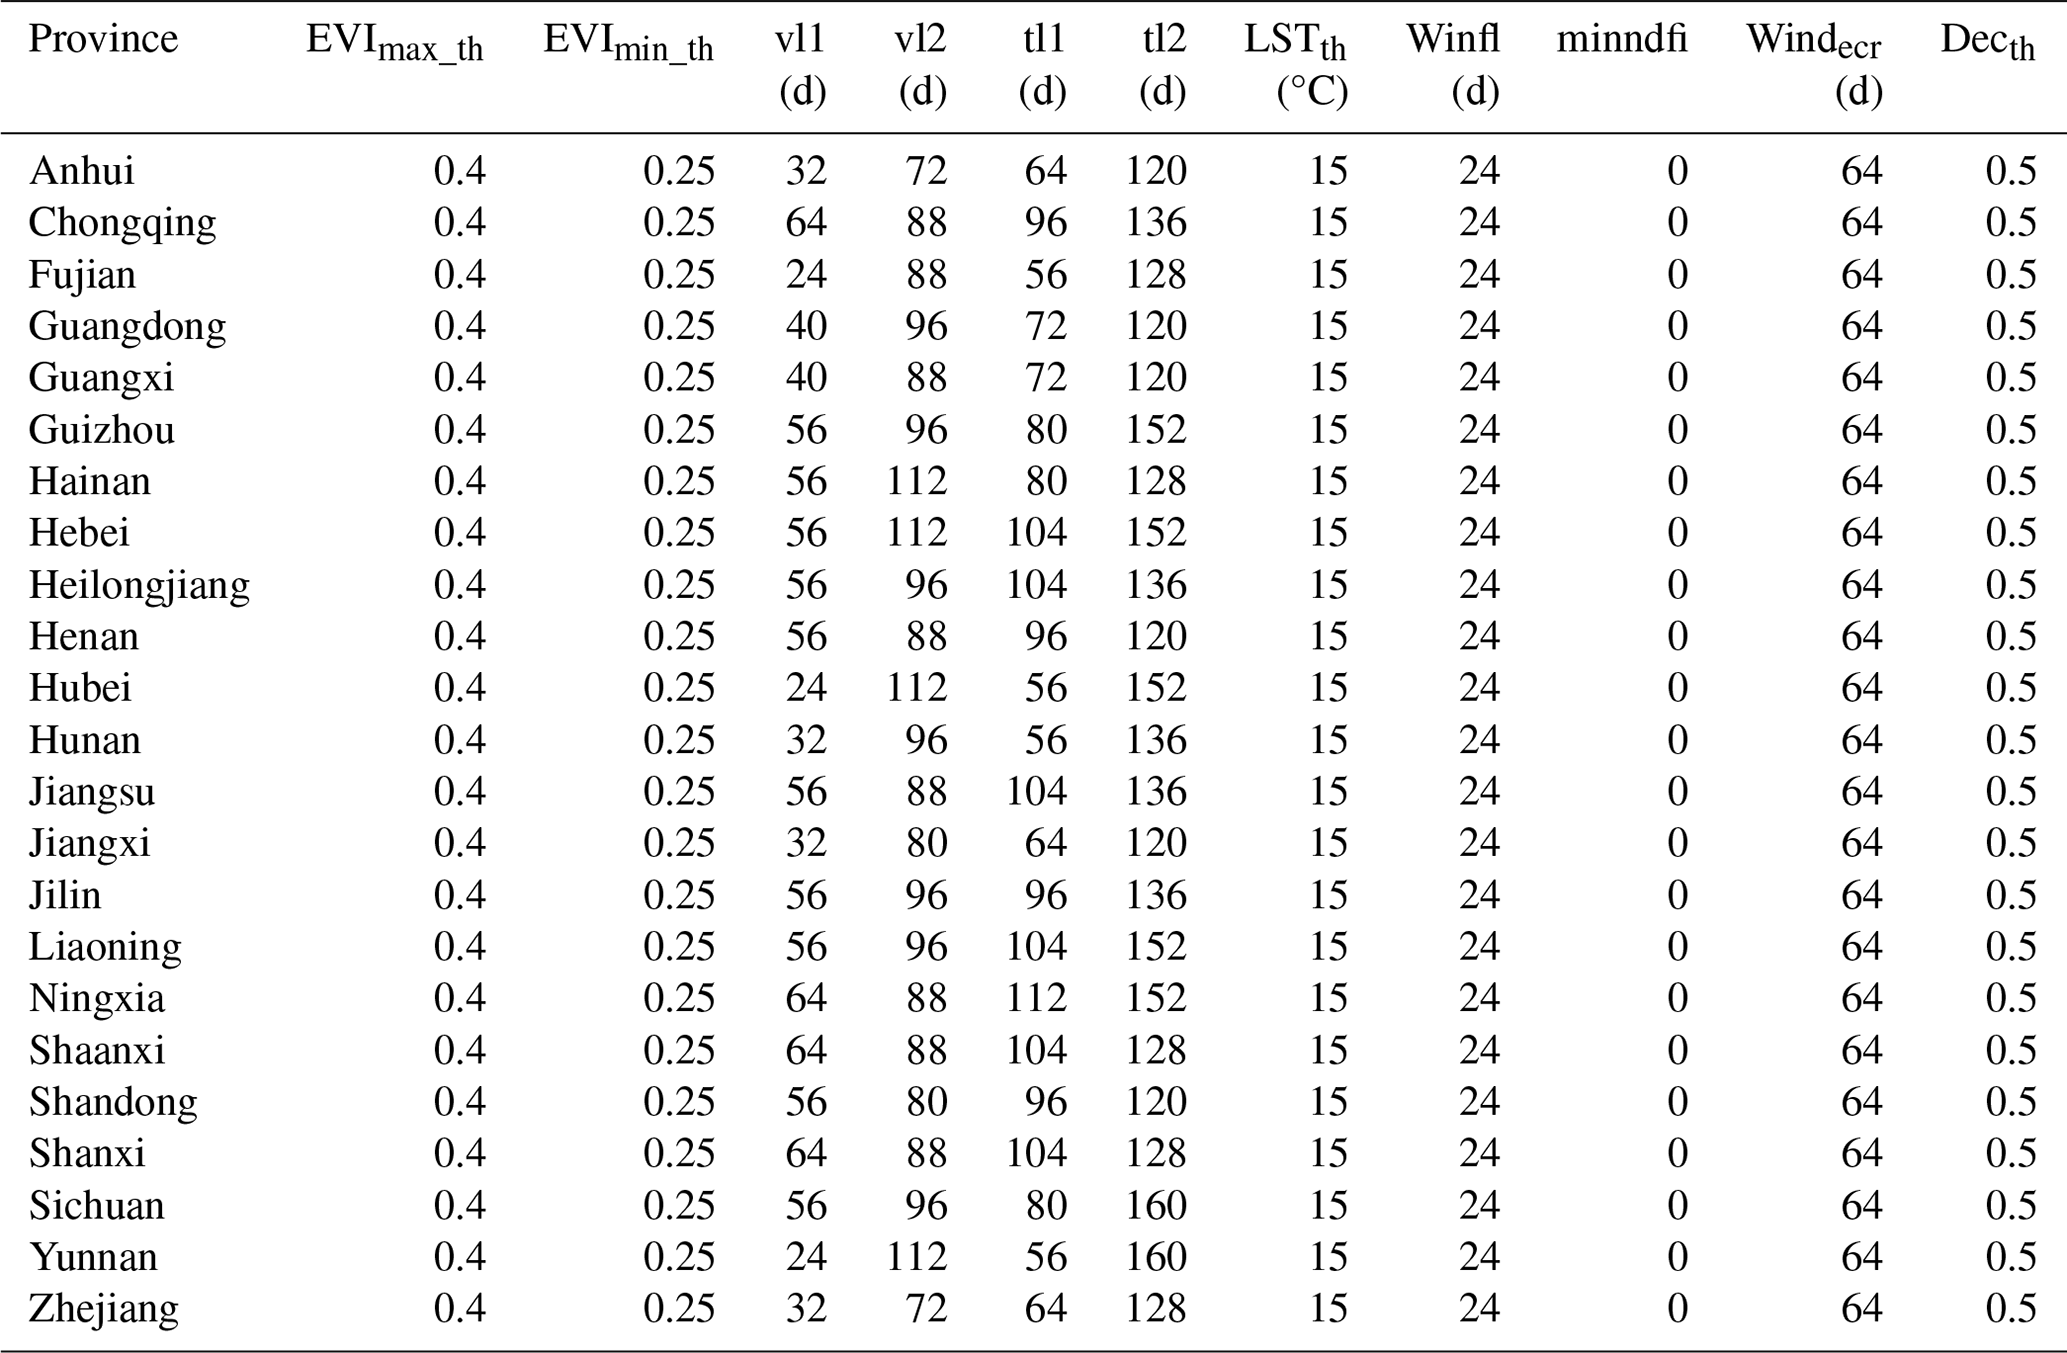
Table 2Classification criteria of seasons for detected rice calendars by province in China.
2.3.3 Data validation
Taking AMS field observations as benchmarks, we evaluated the accuracy of rice calendar dates derived from four multi-season rice calendars: ChinaRiceCalendar, ChinaCropPhen1km, RiceAtlas, and RICA. These regional rice calendars can be divided into two categories: raster datasets (ChinaRiceCalendar and ChinaCropPhen1km) and district-level datasets (RiceAtlas and RICA). For ChinaRiceCalendar and ChinaCropPhen1km, we sought the nearest rice pixel around each AMS site for data pairing. In instances where there was no corresponding rice pixel within a 4 km radius around an AMS site, the site was excluded from the analysis. Also, we conducted a comparison between district-level rice calendars obtained from RiceAtlas and RICA, juxtaposed with AMS data distributed within the respective districts. Two criteria were used to evaluate the accuracy of the estimated rice areas and cropping dates in each season, i.e., root mean squared error (RMSE, Eq. 2) and R2 (Eq. 3):
where truei is the true value in the ith province or AMS; esti is the corresponding estimated value; and denote the mean of the estimated and true values, respectively; and N is the number of provinces or AMSs.
Additionally, in order to investigate the historical shifts of rice phenological dates in China, we analyzed the trends of rice planting, heading, and maturity dates at the county level by a Sen and Mann–Kendall trend analysis at a significance level of 0.05. The trend analysis method is detailed in Gocic and Trajkovic (2013).
3.1 Validation of ChinaRiceCalendar
The key phenological dates estimated in the study show high consistency with the data from AMSs (Fig. 3). The R2 between rice phenological dates from ChinaRiceCalendar and AMSs is 0.95. The R2 values between ChinaRiceCalendar and AMS data for transplanting, heading, and maturity dates in China are 0.91, 0.88, and 0.90, respectively. The RMSEs of transplanting, heading, and maturity dates in ChinaRiceCalendar are approximately 14 d. The R2 values between rice phenological dates from ChinaRiceCalendar and AMS data for early-, middle-, and late-season rice are 0.91, 0.94, and 0.90, respectively.
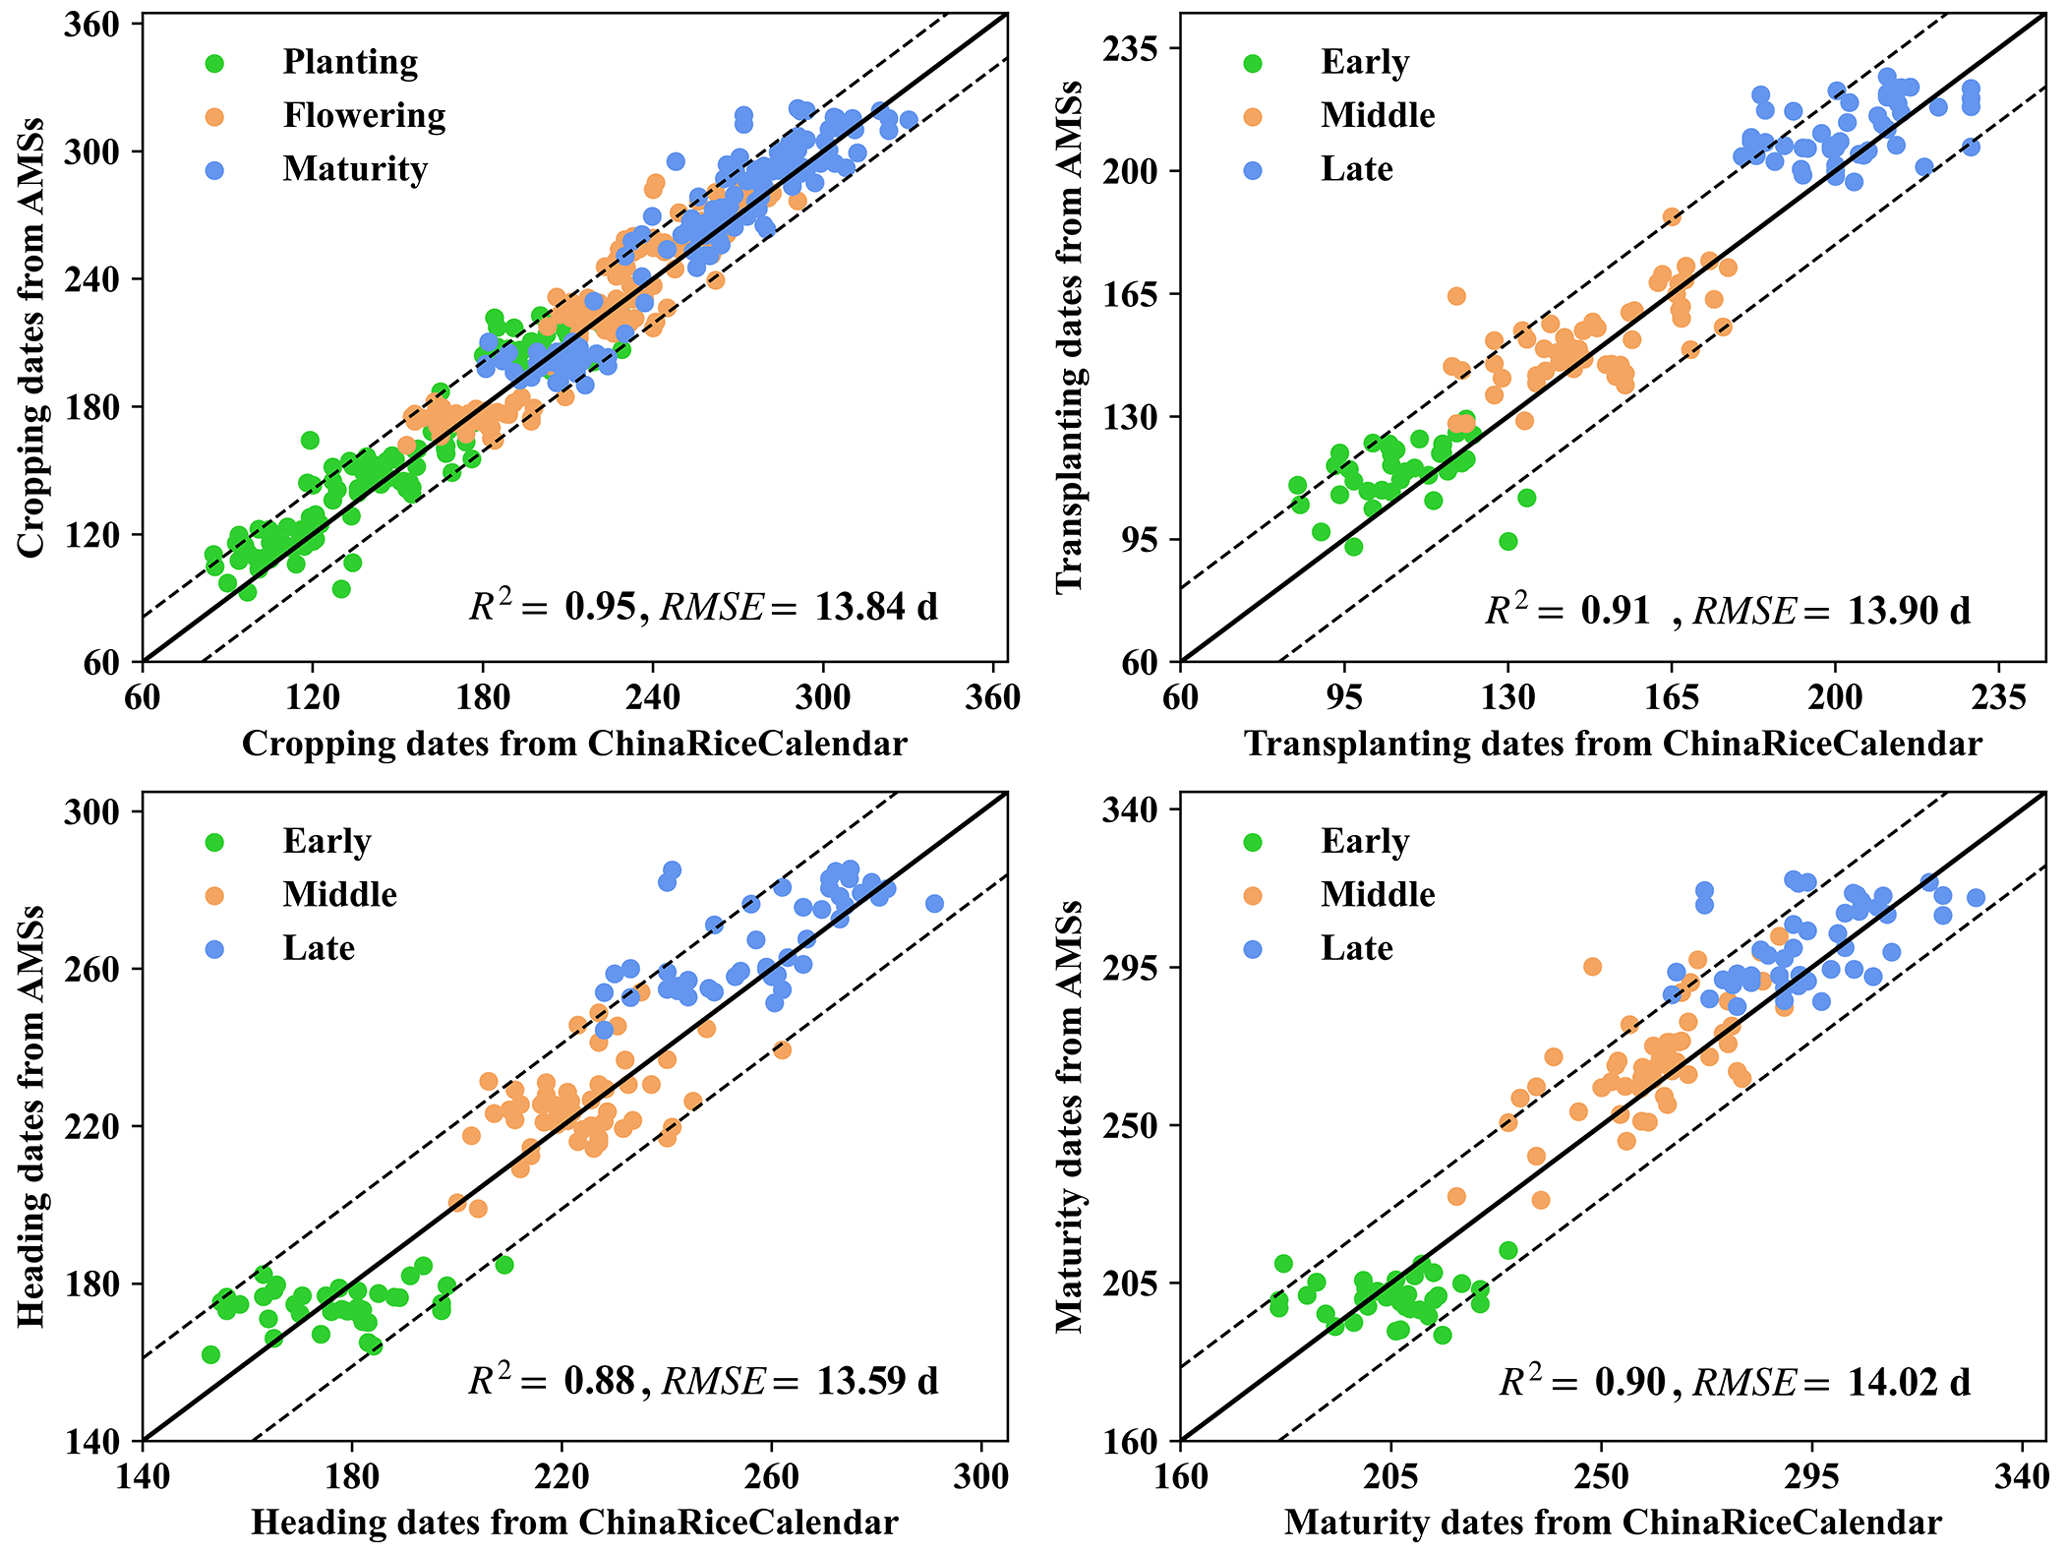
Figure 3Comparison of rice phenological dates between ChinaRiceCalendar and AMS data at the site scale (dashed lines are ±21 d).
Also, we calculated the RMSE of the estimated rice cropping dates in the seven agricultural regions in China (Fig. 4). Overall, the estimated rice calendars are more accurate in northern China than in the south. For early-season rice, the RMSE averages of the estimated cropping dates are 12.73, 12.43, and 14.53 d in the MLY, SC, and YGP, respectively. For middle-season rice, the range of the RMSEs in the seven agricultural regions is from 4.74 d in the HP to 14.34 d in the YGP. For late-season rice, the RMSE averages of the estimated cropping dates are 13.90, 17.54, and 14.25 d in the MLY, SC, and YGP, respectively.
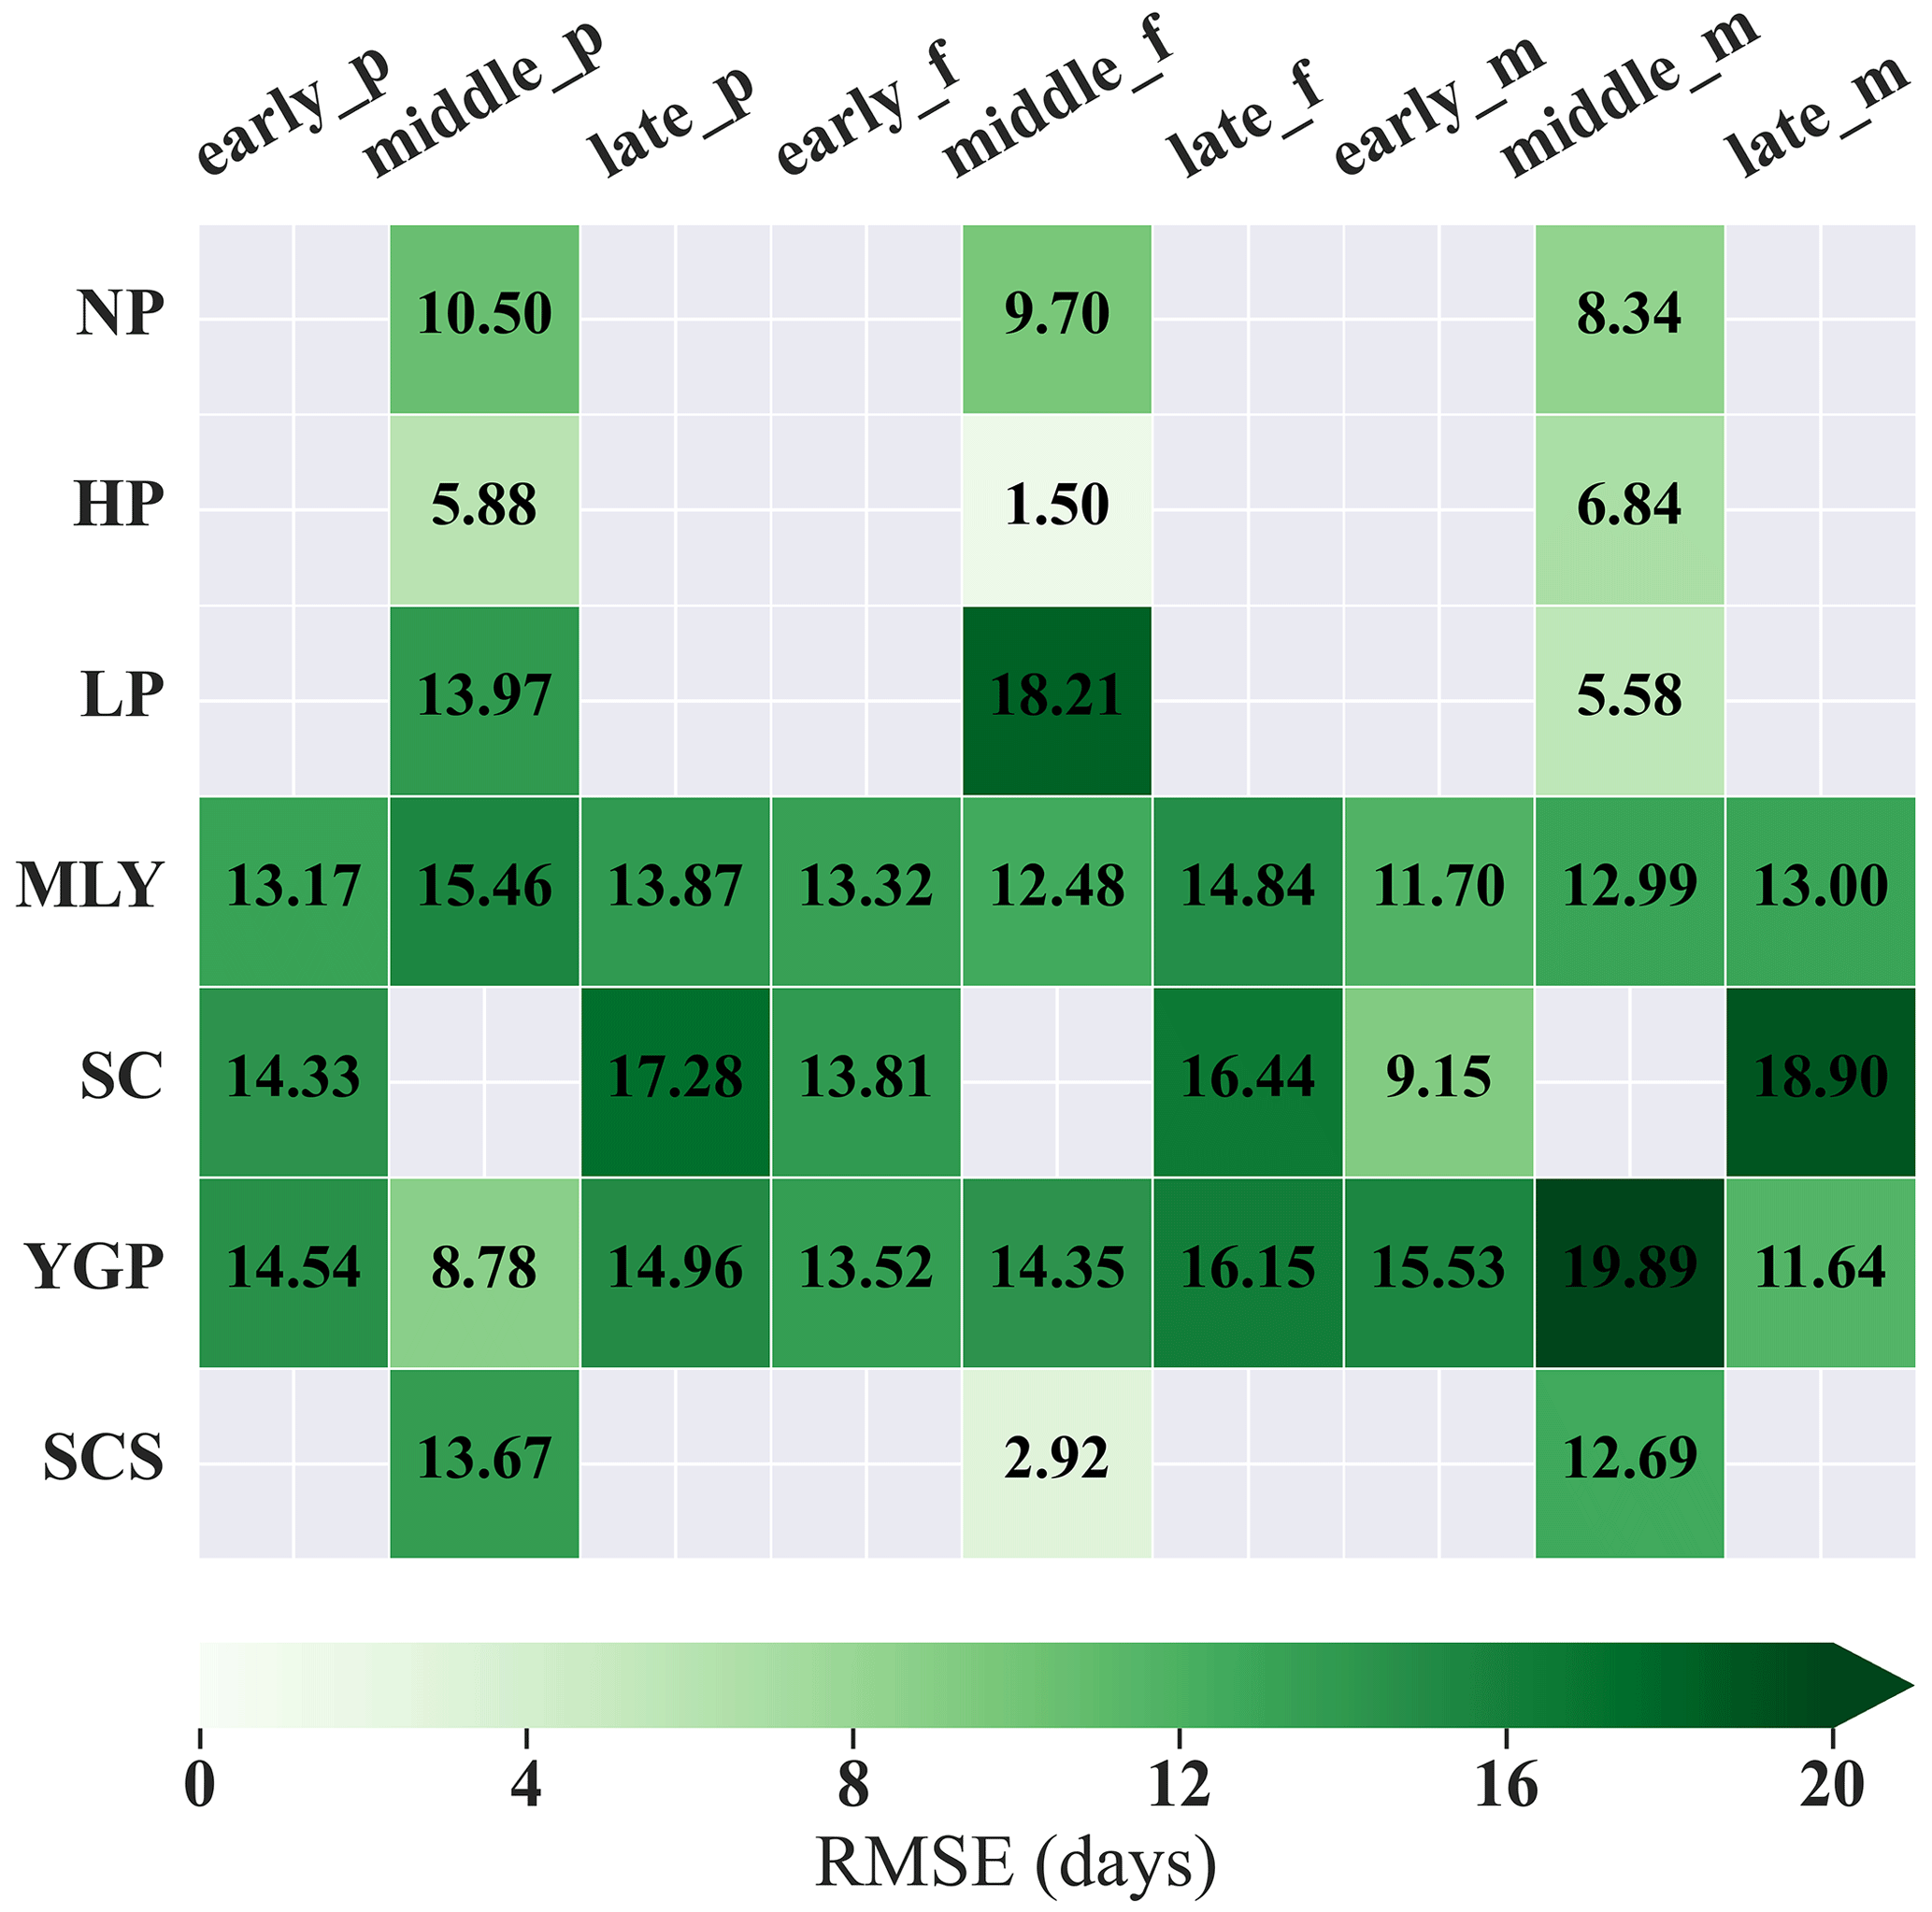
Figure 4RMSEs of rice phenological dates between ChinaRiceCalendar and AMS data in the main agricultural regions.
3.2 Comparison with other calendar datasets
Using AMS field observations as benchmarks, the RMSEs of rice phenological dates obtained from ChinaRiceCalendar, ChinaCropPhen1km, RiceAtlas, and RICA are 13.8, 15.0, 17.9, and 22.6 d, respectively. According to the accuracy evaluation at the seasonal level (Fig. 5), ChinaRiceCalendar is the only dataset where the RMSE does not exceed 15 d across the three rice seasons. Compared with the ChinaRiceCalendar dataset, ChinaCropPhen1km exhibits sub-optimal performance in early-rice seasons (RMSE = 18 d), RiceAtlas underperforms in middle-rice seasons (RMSE = 22 d), and RICA falls short in both middle- and late-rice seasons (RMSE > 30 d). Overall, ChinaRiceCalendar demonstrates superior accuracy in the estimated rice calendars compared to ChinaCropPhen1km, RiceAtlas, and RICA at the annual and seasonal levels in China.
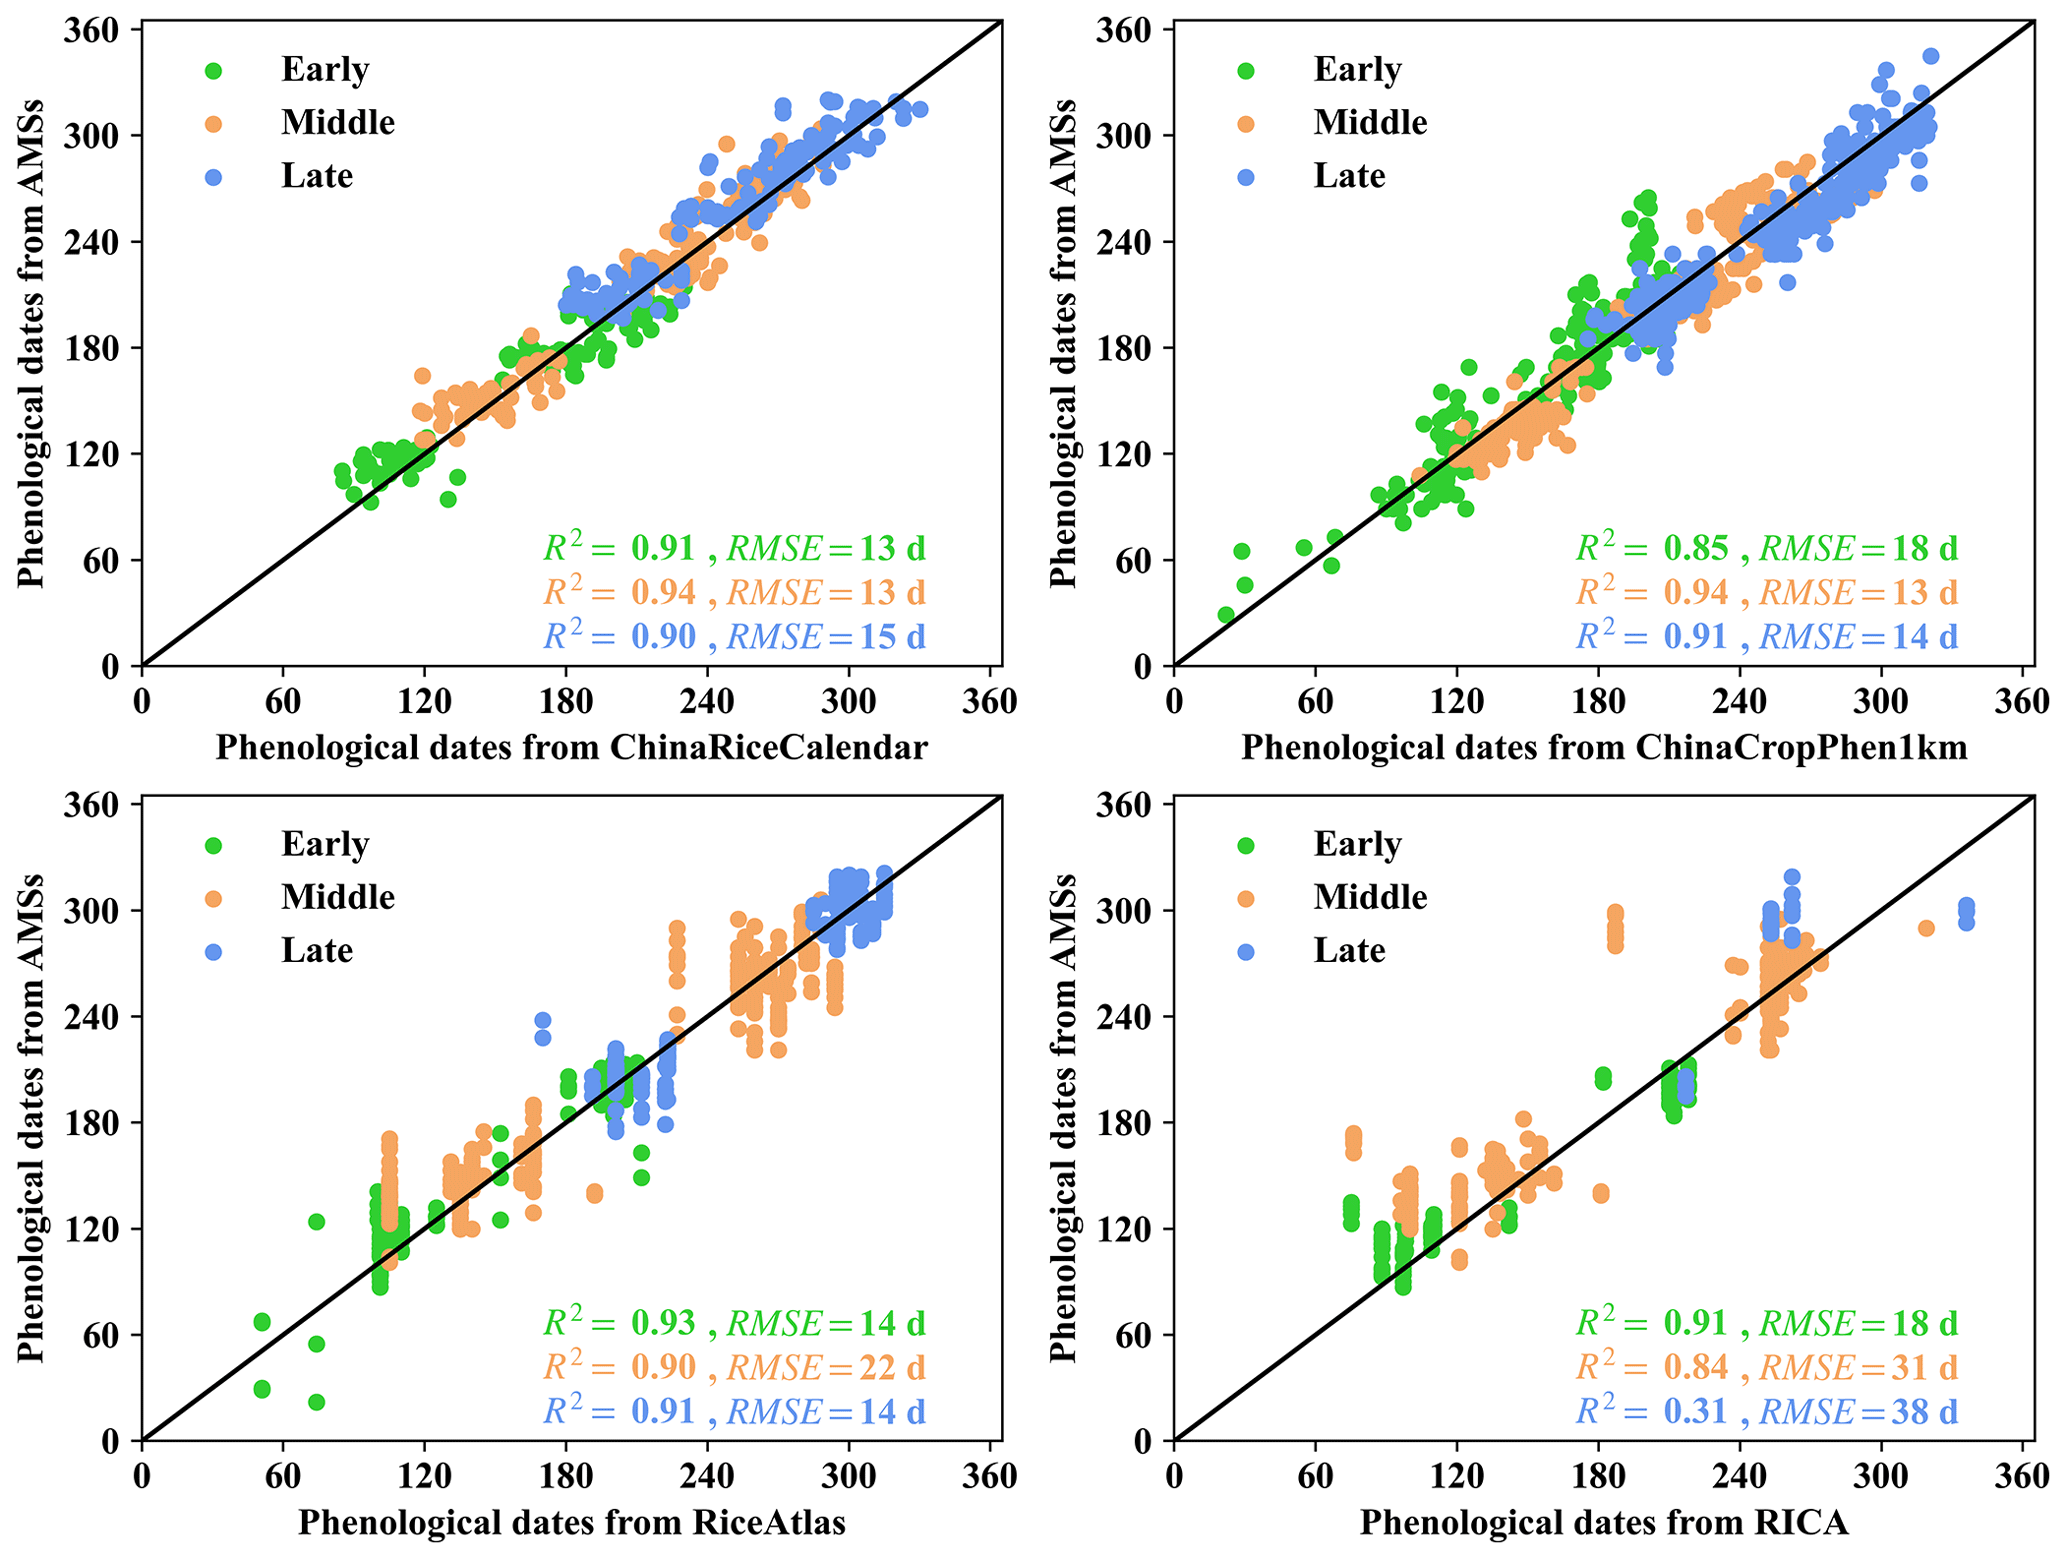
Figure 5Comparison of rice phenological dates between calendar datasets and AMS data at the site scale in the early (green), middle (orange), and late (blue) seasons.
3.3 Spatial distribution of rice phenological dates
According to the spatial distribution of the detected rice areas during 2003–2022, early and late rice was mainly grown in southern China, while middle rice was widely planted in China from south to north (Figs. 6 and 7). The spatial variations of rice phenology were significant in the early, middle, and late seasons. In the NP, HP, and LP, middle rice was transplanted around DOY150, flowered around DOY230, and matured around DOY270. In the YGP, the mean transplanting date was approximately DOY100 for early rice, DOY150 for middle rice, and DOY195 for late rice; the mean heading dates for early-, middle-, and late-season rice were DOY170, DOY230, and DOY250, respectively. The mean maturity dates were approximately DOY200 for early rice, DOY260 for middle rice, and DOY290 for late rice. In the MLY, the mean transplanting dates were approximately DOY120 for early rice, DOY160 for middle rice, and DOY200 for late rice. The mean heading dates were approximately DOY190 for early rice, DOY230 for middle rice, and DOY250 for late rice. The mean maturity dates were DOY210 for early rice, DOY260 for middle rice, and DOY290 for late rice. In the SC, the mean transplanting dates were approximately DOY100 for early rice and DOY220 for late rice. The mean heading dates were approximately DOY170 for early rice and DOY270 for late rice. The mean maturity dates were approximately DOY200 for early rice and DOY300 for late rice. For rice in the SCS, the mean transplanting, heading, and maturity dates were approximately DOY130, DOY220, and DOY250, respectively.
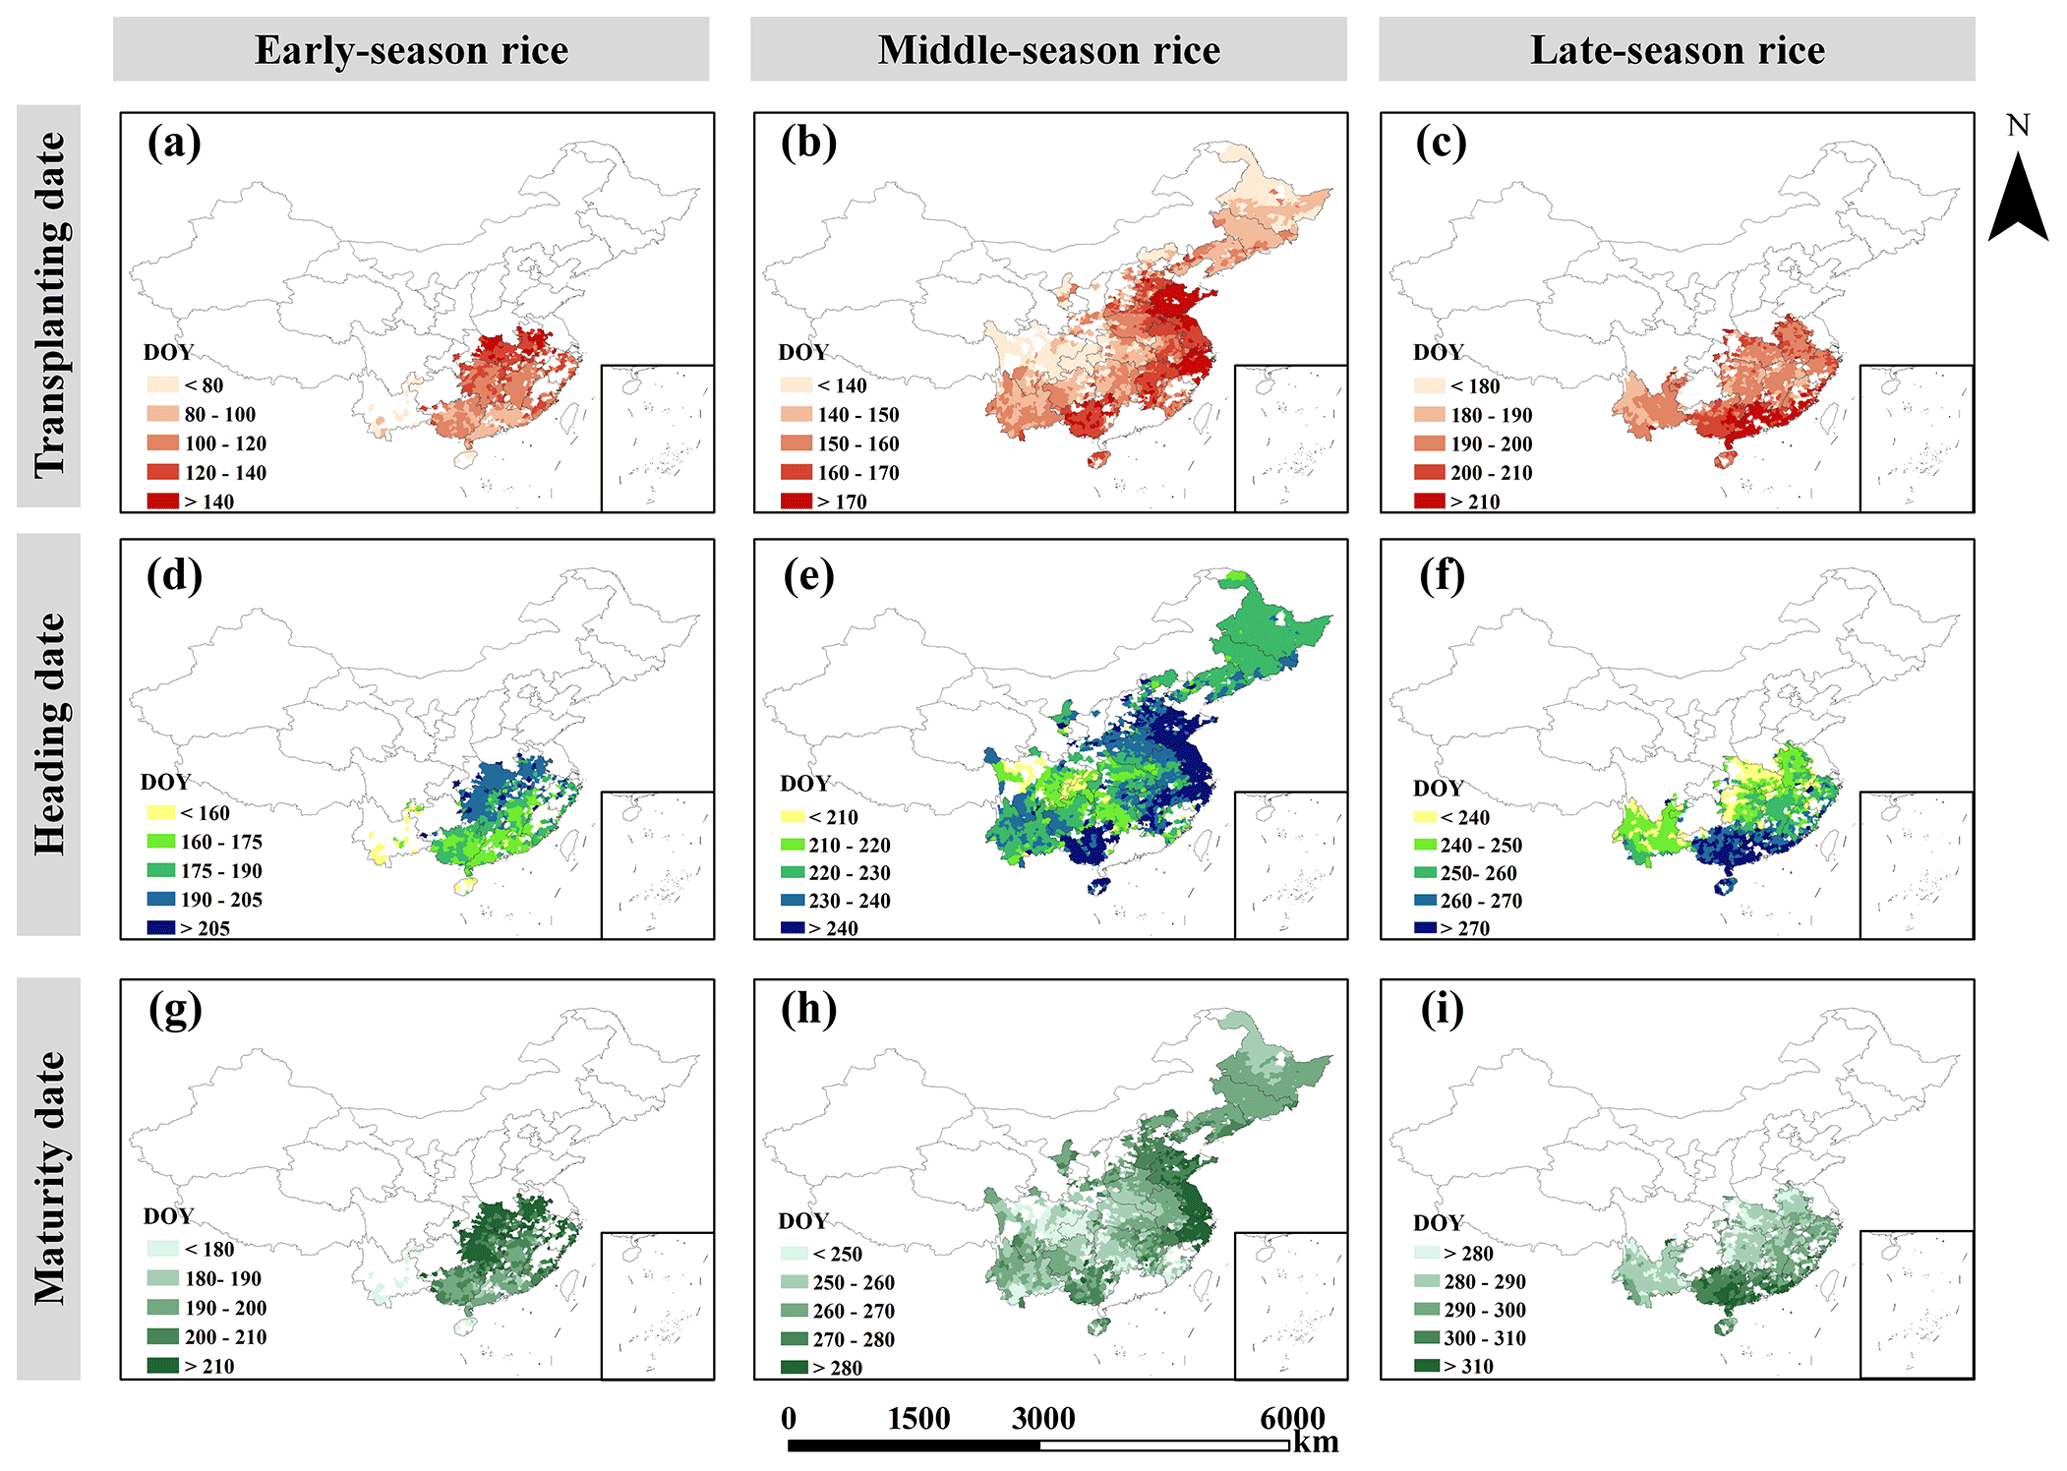
Figure 6Rice phenological dates at the county scale between 2003 and 2022. ((a) early-rice transplanting dates; (b) middle-rice transplanting dates; (c) late-rice transplanting dates; (d) early-rice heading dates; (e) middle-rice heading dates; (f) late-rice heading dates; (g) early-rice maturity dates; (h) middle-rice maturity dates; (i) late-rice maturity dates). Publisher's remark: please note that the above figure contains disputed territories.
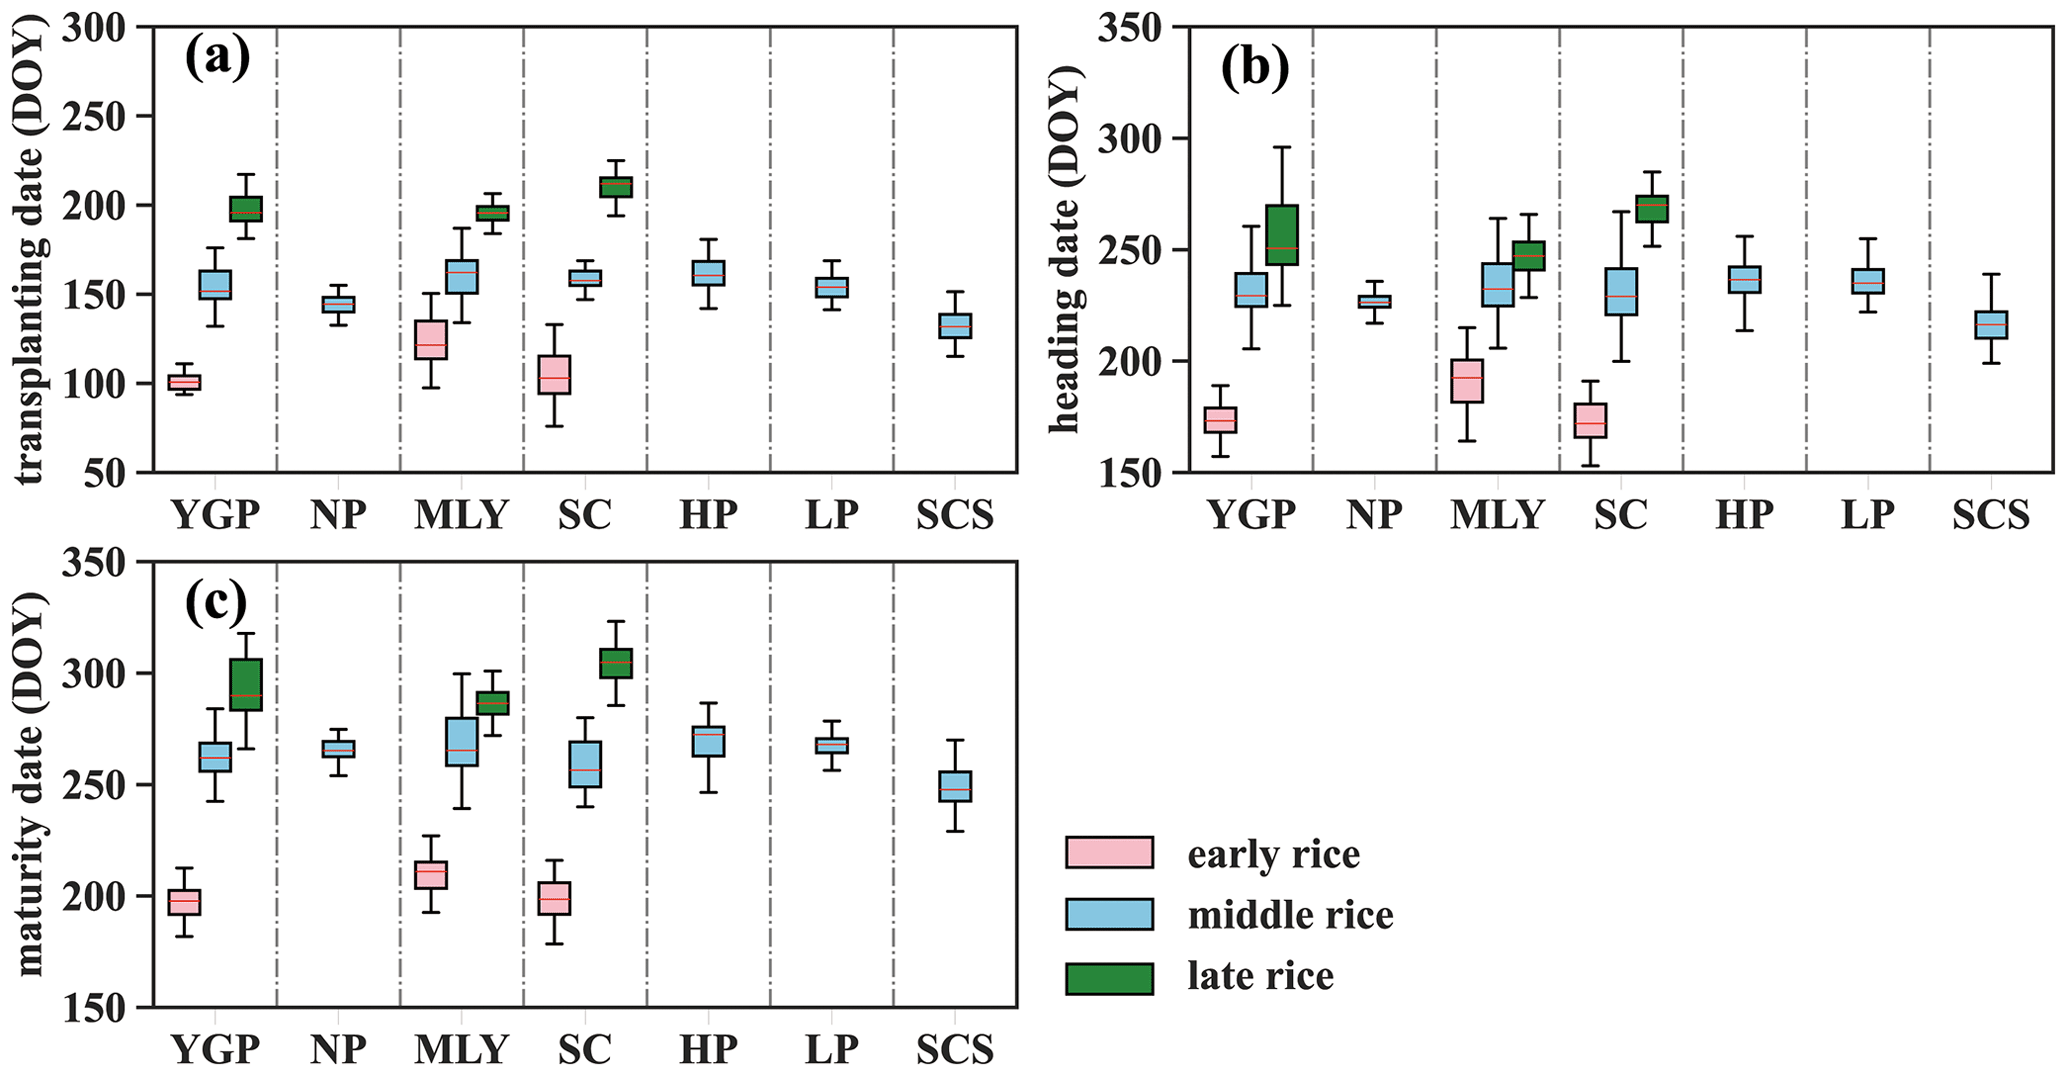
Figure 7Rice phenological dates in rice-producing counties between 2003 and 2022 ((a) transplanting dates; (b) heading dates; (c) maturity dates).
3.4 Temporal changes in rice phenological dates
Based on the trend analysis of rice phenological dates from 2003 to 2022 in China (Fig. 8), the mean transplanting dates for early-, middle-, and late-season rice shifted by +0.74, −0.68, and −5.12 DOY per decade, respectively. The mean heading dates for early-, middle-, and late-season rice shifted by −0.51, +2.73, and −0.60 DOY per decade, respectively. The mean maturity dates for early, middle, and late rice shifted by −0.67, +3.75, and −1.62 DOY per decade, respectively. The detected shifts in rice phenological dates during 2003–2022 depended on the agricultural region (Fig. 9). For middle-season rice in the NP, 76 % of the counties showed a significant or slight advance in transplanting dates, while 71 % of the counties showed a significant or slight delay in maturity dates. In the MLY, 59 %, 66 %, and 72 % of the rice-producing counties showed a significant or slight delay in the transplanting, heading, and maturity dates of middle rice, respectively. In the SCS, 79 %, 86 %, and 80 % of the rice-producing counties showed a significant or slight delay in the transplanting, heading, and maturity dates of middle rice, respectively. In the YGP, 77 %, 67 %, and 59 % of the rice-producing counties showed a significant or slight delay in the transplanting, heading, and maturity dates of middle rice, respectively. In the HP and the LP, rice phenological dates did not show a consistent or significant trend. For early-season rice, transplanting tends to be delayed, but maturity tends to be earlier in the SC. In most parts of China, the detected trends in early-rice phenological dates were not significant during 2003–2022. For late-season rice in China, 64 % of the counties showed a significant or slight advance in transplanting dates, whereas 64 % of the counties showed a significant or slight delay in heading and maturity dates.
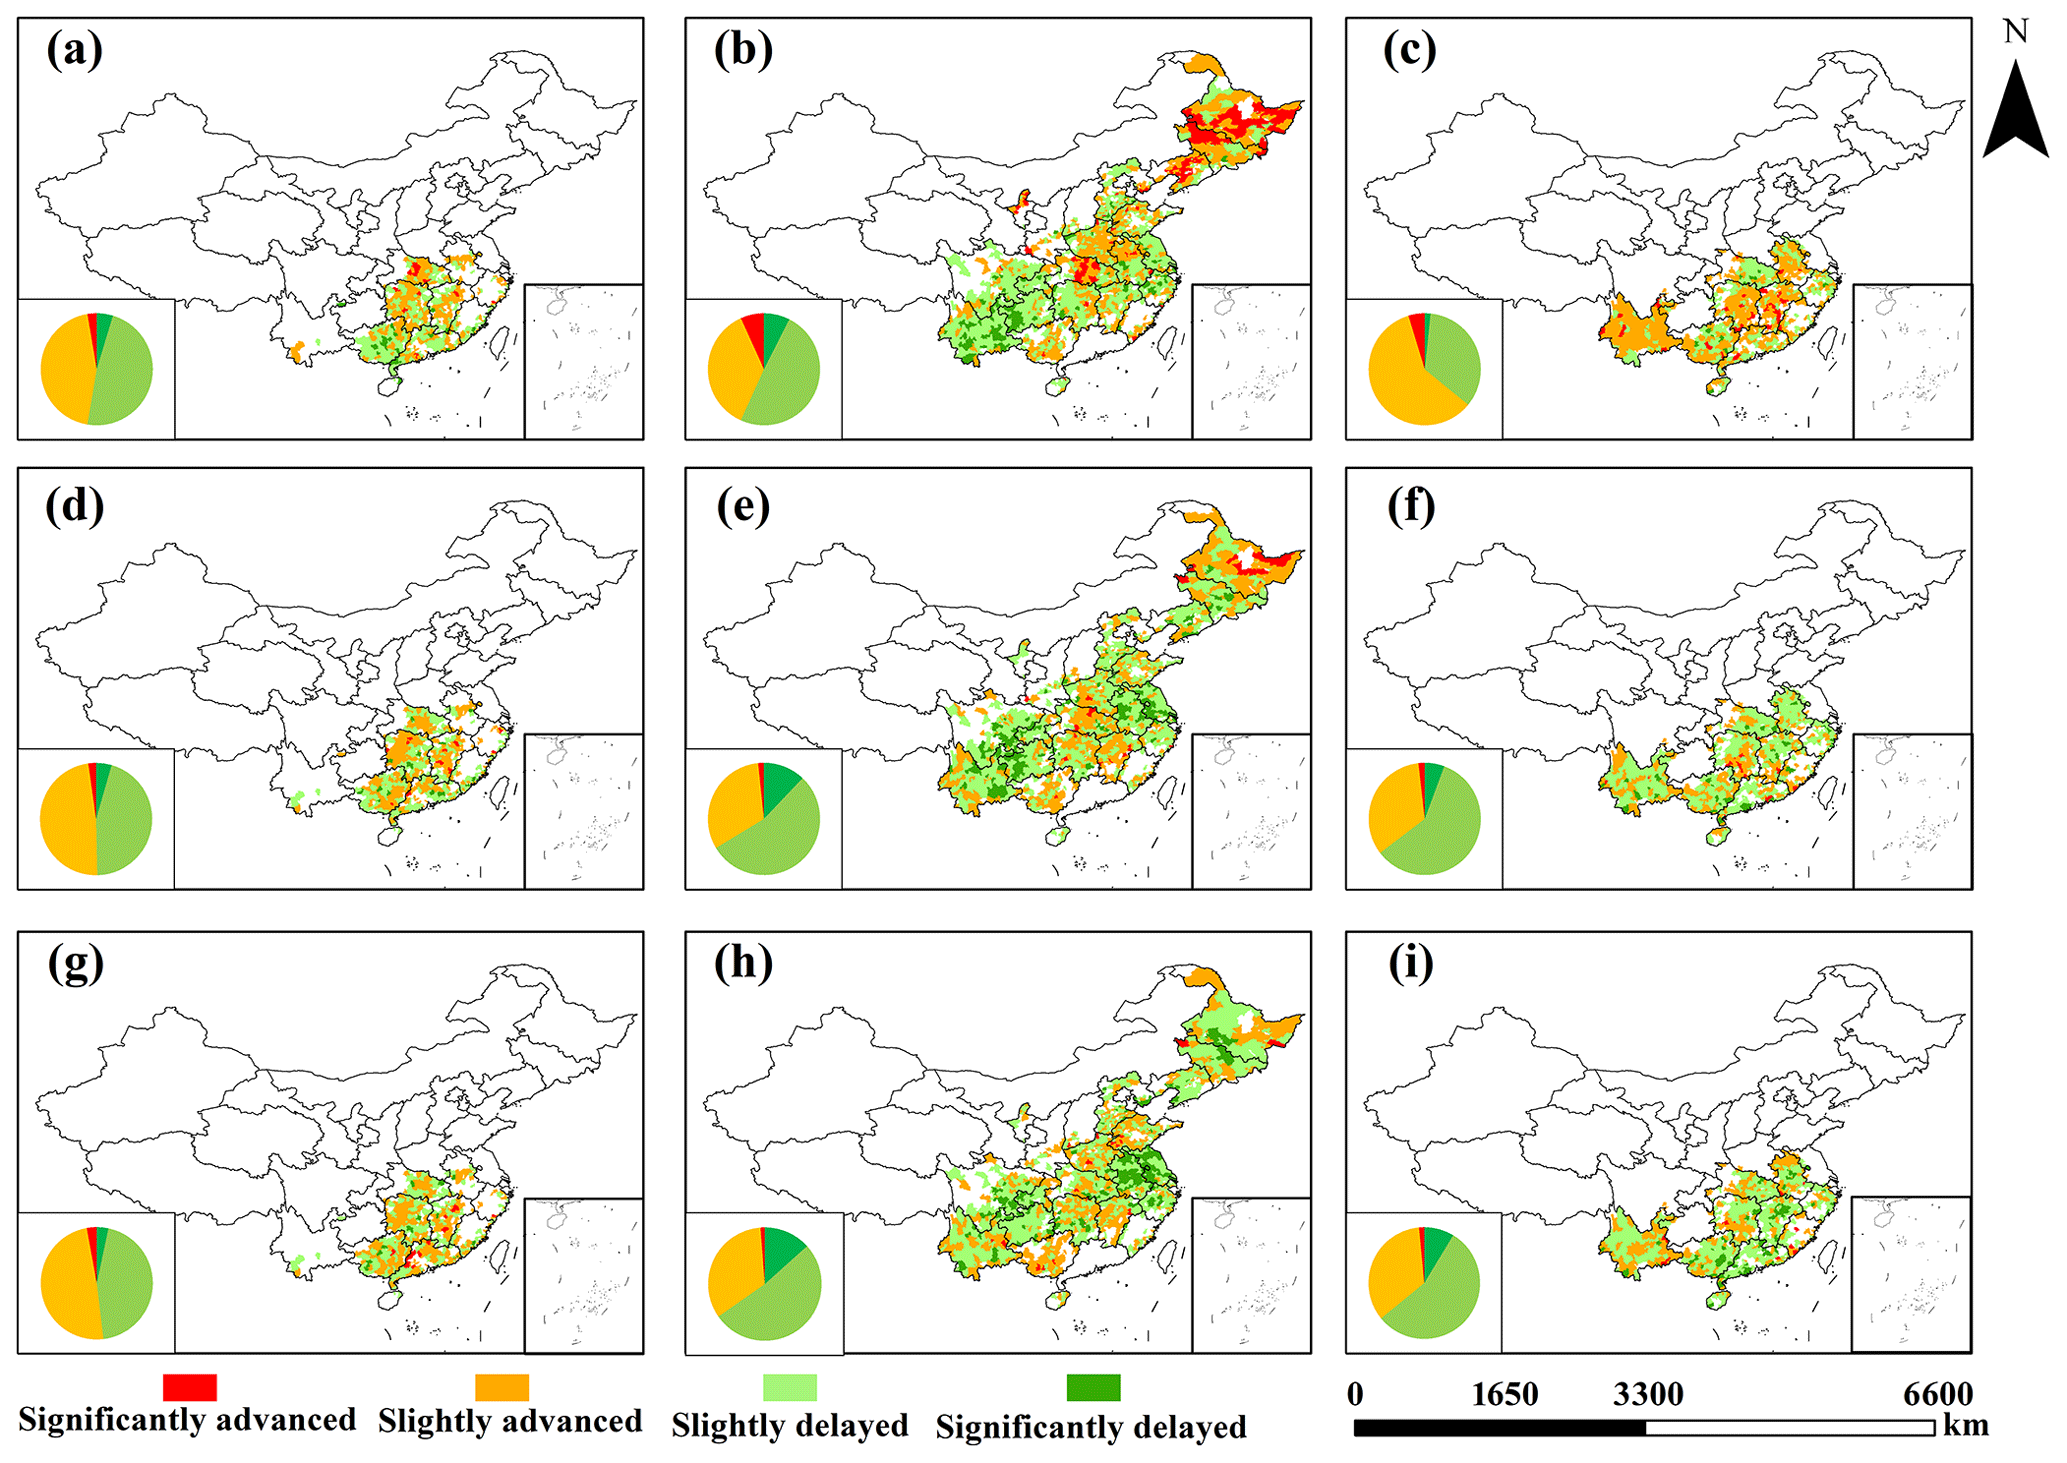
Figure 8Temporal trends in rice phenological dates at the county scale from 2003 to 2022 ((a) early-rice transplanting dates; (b) middle-rice transplanting dates; (c) late-rice transplanting dates; (d) early-rice heading dates; (e) middle-rice heading dates; (f) late-rice heading dates; (g) early-rice maturity dates; (h) middle-rice maturity dates; (i) late-rice maturity dates). Publisher's remark: please note that the above figure contains disputed territories.
This study used MODIS remote sensing data to extract rice phenological dates in various growing seasons in China. The MODIS remote sensing products have an appropriate temporal resolution, long time series, and good time consistency for analyzing changes in rice calendars at the regional scale. Moreover, the MODIS data are easy to obtain and process on the GEE platform, allowing for automated and timely updating of the calendar dataset. Nevertheless, discerning early- and late-rice pixels is more difficult than identifying middle-rice pixels in MODIS data, resulting in lower accuracy of the detected rice calendars in southern China (MLY, SC, SCS, YGP) than in northern China (NP, HP, LP).
There are several factors leading to the incomplete identification of rice pixels in the early and late seasons in southern China. Firstly, the pixel-based detection of rice areas may be interfered with by the contamination of clouds, aerosols, and water vapor, especially during the monsoon season, when late rice is transplanted (Xiao et al., 2005; Clauss et al., 2016; Mishra et al., 2021). Because synthetic aperture radar (SAR) can penetrate through clouds, subsequent studies could combine optical and SAR images to avoid the impacts of clouds (R. Shen et al., 2023). Utilizing geostationary satellite observations to increase the temporal frequency of remote sensing data may also be an effective way of improving the accuracy of rice calendars (Y. Shen et al., 2023). Secondly, diverse multi-cropping systems, complex topography, and the fragmentation of croplands in southern China make the pixel detection for early and late rice more challenging (Dong and Xiao, 2016). Producing satellite remote sensing data with higher spatial resolution and integrating multiple data sources from satellite–airborne–ground observations will facilitate real-time monitoring of rice cropping areas at the regional scale (Zheng et al., 2022; Sun et al., 2023). Additionally, the PhenoRice algorithm falls short in detecting rice pixels in rainfed or upland rice systems due to the absence of clear agronomic flooding signals. In China, rice is mainly planted in flooded paddy fields (Luo et al., 2022), which mitigates the problems of detecting rainfed or upland rice. Last but not least, precisely matching the image pixels from the MODIS dataset to the agricultural meteorological stations remains a challenge during data validation. In the future, it would be beneficial to conduct a quantitative assessment to determine the representativeness of the MODIS pixels surrounding the AMS site.
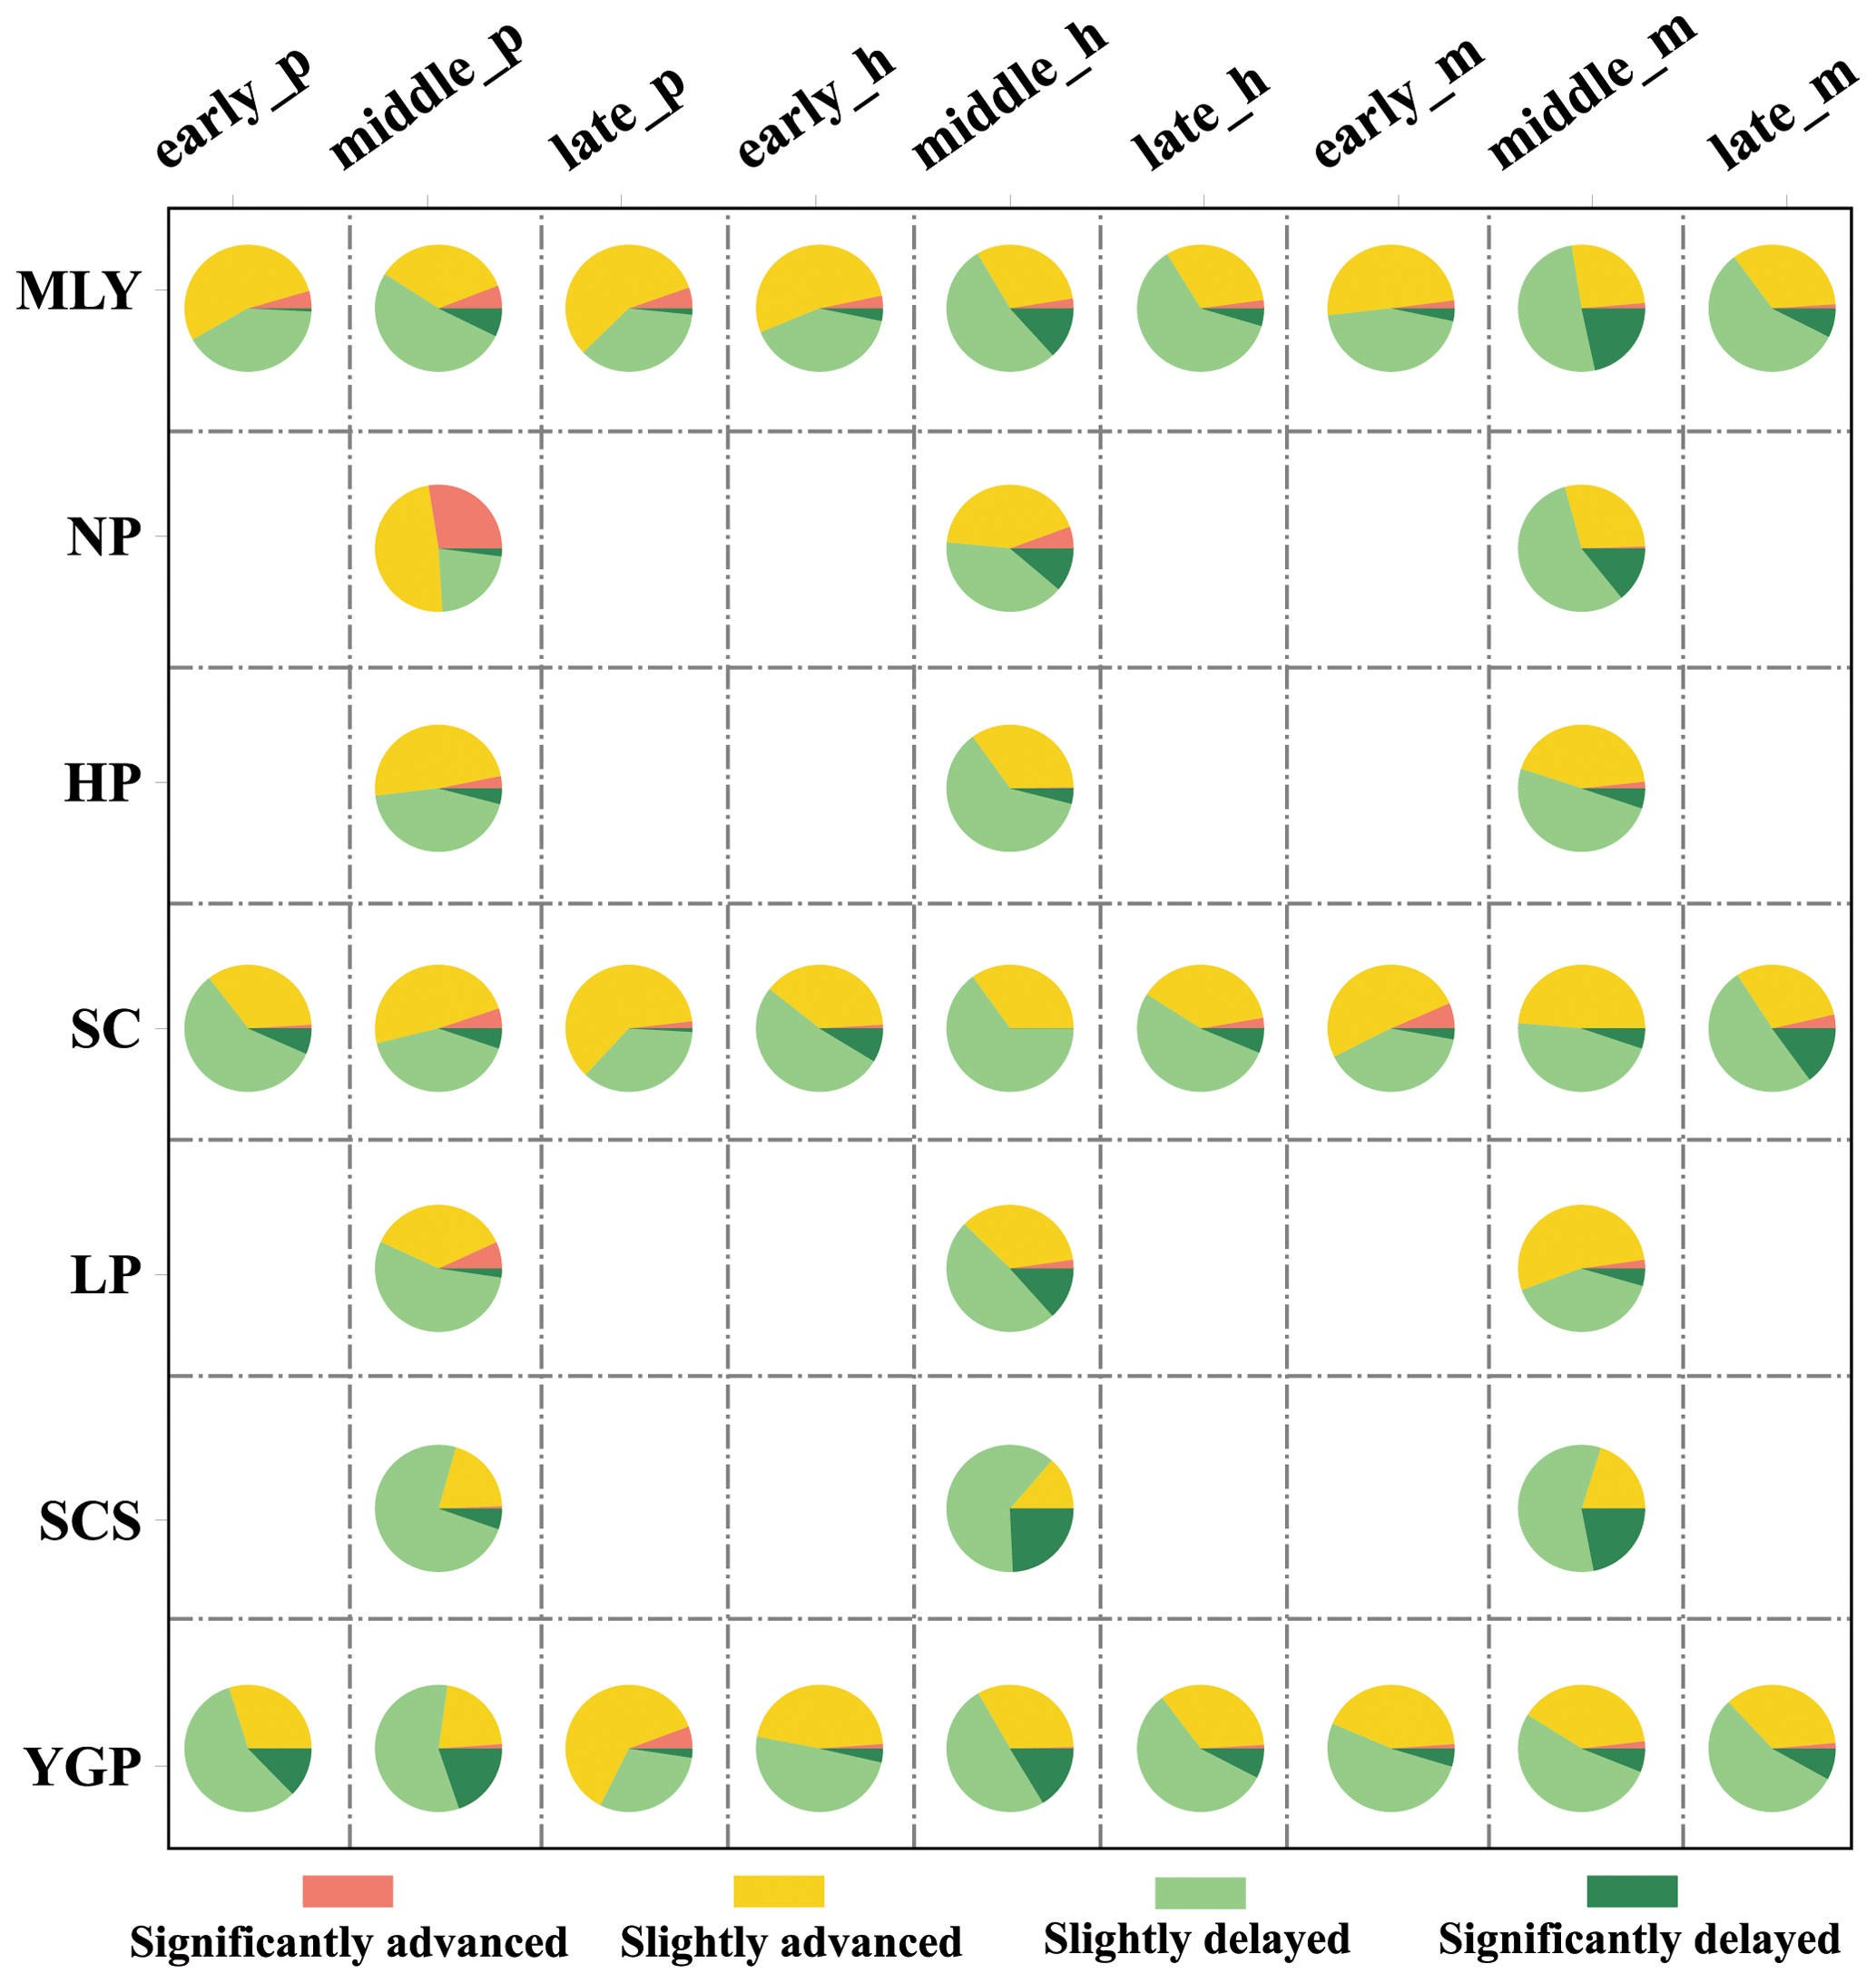
Figure 9Temporal trends in rice phenological dates at the regional level from 2003 to 2022 (early_p: early-rice transplanting dates; middle_p: middle-rice transplanting dates; late_p: late-rice transplanting dates; early_h: early-rice heading dates; middle_h: middle-rice heading dates; late_h: late-rice heading dates; early_m: early-rice maturity dates; middle_m: middle-rice maturity dates; late_m: late-rice maturity dates).
In this study, we improved the method of growing season division in the PhenoRice algorithm. We also attempted to remove non-paddy pixels and reduce the impacts of low-quality data on the reconstruction of EVI time series curves. Although the local tuning of the PhenoRice algorithm parameters could further improve the results, we employed a single configuration of EVI threshold values (EVImax_th, EVImin_th, Windecr, and decth) in the PhenoRice algorithm across China because automated methods that perform robustly are essential for developing timely information about crop calendars over large extents (Mishra et al., 2021). Subsequently, we will try to automate the generation and updating of ChinaRiceCalendar based on the rgee package (Aybar et al., 2023).
ChinaRiceCalendar is a raster dataset with 1 km spatial resolution. The dataset has two parts: detected rice pixel data (*_rice_pixels.tif) and county-level rice calendar data (*_county_level.tif). The spatial reference system of the dataset is WGS_1984_UTM_Zone_49N. The dataset currently includes mean calendar dates during five periods: 2003–2007, 2008–2012, 2013–2017, 2018–2022, and 2003–2022. ChinaRiceCalendar is available at https://doi.org/10.7910/DVN/EUP8EY (Liu et al., 2023).
Utilizing MODIS time series data, we established a multi-season rice calendar dataset named ChinaRiceCalendar, encompassing transplanting, heading, and maturity dates of early-, middle-, and late-season rice in China from 2003 to 2022. The rice phenological dates within ChinaRiceCalendar, estimated through the enhanced PhenoRice algorithm, exhibit strong alignment with field observations collected by agricultural meteorological stations across China. The R2 values between ChinaRiceCalendar and field data for early-, middle-, and late-season rice consistently surpass 0.90, with RMSE values below 15 d in the three rice seasons. According to the calendar data from 2003 to 2022, the transplanting dates for early-, middle-, and late-season rice shifted by +0.7, −0.7, and −5.1 DOY per decade, respectively; the heading dates for early-, middle-, and late-season rice shifted by −0.5, +2.7, and −0.6 DOY per decade, respectively; and the maturity dates for early-, middle-, and late-season rice shifted by −0.7, +3.8, and −1.6 DOY per decade, respectively. In summary, ChinaRiceCalendar stands as a reliable dataset for investigating and optimizing the spatiotemporal dynamics of rice cultivation in China, particularly in the context of climate and land use changes.
Conceptualization and methodology: HL and XW; algorithmic improvements: HL; data download and processing: JL, YL, and ZL; validation: JL, SC, and QW; formal analysis: HL, XW, and TZ; writing – original draft preparation: HL and XW; writing – review and editing: XW, SW, and LW. All the authors have read and agreed to the published version of the manuscript.
The contact author has declared that none of the authors has any competing interests.
Publisher's note: Copernicus Publications remains neutral with regard to jurisdictional claims made in the text, published maps, institutional affiliations, or any other geographical representation in this paper. While Copernicus Publications makes every effort to include appropriate place names, the final responsibility lies with the authors.
We would like to thank Dongdong Kong from the China University of Geosciences (Wuhan) for providing the R package Phnofit and thank Mirco Boschetti from the Italian National Research Council for providing the source code of PhenoRice.
This research has been supported by the National Natural Science Foundation of China (grant nos. 31861143015 and 32301393).
This paper was edited by Zhen Yu and reviewed by Chen Zhang and two anonymous referees.
Atzberger, C. and Eilers, P. H.: Evaluating the effectiveness of smoothing algorithms in the absence of ground reference measurements, Int. J. Remote Sens., 32, 3689–3709, 2011.
Aybar, C., Montero, D., Barja, A., Herrera, F., Gonzales, A., and Espinoza, W.: Combining R and Earth Engine, in: Cloud-Based Remote Sensing with Google Earth Engine: Fundamentals and Applications, Cham, Springer International Publishing, 629–651, https://doi.org/10.1007/978-3-031-26588-4_31, 2023.
Bai, H. and Xiao, D.: Spatiotemporal changes of rice phenology in China during 1981–2010, Theor. Appl. Clim., 140, 1483–1494, 2020.
Boschetti, M., Stroppiana, D., Brivio, P., and Bocchi, S.: Multi-year monitoring of rice crop phenology through time series analysis of MODIS images, Int. J. Remote Sens., 30, 4643–4662, 2009.
Boschetti, M., Busetto, L., Manfron, G., Laborte, A., Asilo, S., Pazhanivelan, S., and Nelson, A.: PhenoRice: A method for automatic extraction of spatio-temporal information on rice crops using satellite data time series, Remote Sens. Environ., 194, 347–365, 2017.
Busetto, L., Zwart, S. J., and Boschetti, M.: Analysing spatial–temporal changes in rice cultivation practices in the Senegal River Valley using MODIS time-series and the PhenoRice algorithm, Int. J. Appl. Earth Obs., 75, 15–28, 2019.
Bush, E. R., Abernethy, K. A., Jeffery, K., Tutin, C., White, L., Dimoto, E., Dikangadissi, J. T., Jump, A. S., and Bunnefeld, N.: Fourier analysis to detect phenological cycles using long-term tropical field data and simulations, Meth. Ecol. Evol., 8, 530–540, 2017.
Cao, J., Cai, X., Tan, J., Cui, Y., Xie, H., Liu, F., Yang, L., and Luo, Y.: Mapping paddy rice using Landsat time series data in the Ganfu Plain irrigation system, Southern China, from 1988–2017, Int. J. Remote Sens., 42, 1556–1576, 2021.
Carleton, T. A.: Crop-damaging temperatures increase suicide rates in India, P. Natl. Acad. Sci. USA, 114, 8746–8751, 2017.
Clauss, K., Yan, H., and Kuenzer, C.: Mapping paddy rice in China in 2002, 2005, 2010 and 2014 with MODIS time series, Remote Sens., 8, 434, https://doi.org/10.3390/rs8050434, 2016.
Didan, K.: MODIS/Terra Vegetation Indices 16-Day L3 Global 250m SIN Grid V061, NASA EOSDIS Land Processes Distributed Active Archive Center [data set], https://doi.org/10.5067/MODIS/MOD13Q1.061, 2021.
Dong, J. and Xiao, X.: Evolution of regional to global paddy rice mapping methods: A review, ISPRS J. Photogramm. Remote, 119, 214–227, 2016.
Fahad, S., Adnan, M., Noor, M., Arif, M., Alam, M., Khan, I.A., Ullah, H., Wahid, F., Mian, I. A., and Jamal, Y.: Major constraints for global rice production, Advances in rice research for abiotic stress tolerance, Elsevier, 1–22, https://doi.org/10.1016/B978-0-12-814332-2.00001-0, 2019.
Franke, J. A., Müller, C., Elliott, J., Ruane, A. C., Jägermeyr, J., Snyder, A., Dury, M., Falloon, P. D., Folberth, C., François, L., Hank, T., Izaurralde, R. C., Jacquemin, I., Jones, C., Li, M., Liu, W., Olin, S., Phillips, M., Pugh, T. A. M., Reddy, A., Williams, K., Wang, Z., Zabel, F., and Moyer, E. J.: The GGCMI Phase 2 emulators: global gridded crop model responses to changes in CO2, temperature, water, and nitrogen (version 1.0), Geosci. Model Dev., 13, 3995–4018, https://doi.org/10.5194/gmd-13-3995-2020, 2020.
Friedl, M. and Sulla-Menashe, D.: MCD12Q1 MODIS/Terra+Aqua Land Cover Type Yearly L3 Global 500m SIN Grid V006, NASA EOSDIS Land Processes Distributed Active Archive Center [data set], https://doi.org/10.5067/MODIS/MCD12Q1.006, 2019.
Fritz, S., See, L., Bayas, J. C. L., Waldner, F., Jacques, D., Becker-Reshef, I., Whitcraft, A., Baruth, B., Bonifacio, R., and Crutchfield, J.: A comparison of global agricultural monitoring systems and current gaps, Agr. Syst., 168, 258–272, 2019.
Frolking, S., Qiu, J., Boles, S., Xiao, X., Liu, J., Zhuang, Y., Li, C., and Qin, X.: Combining remote sensing and ground census data to develop new maps of the distribution of rice agriculture in China, Global Biogeochem. Cy., 16, 38-1–38-10, 2002.
Gao, F. and Zhang, X.: Mapping crop phenology in near real-time using satellite remote sensing: Challenges and opportunities, J. Remote Sens., 2021, 8379391, https://doi.org/10.34133/2021/8379391, 2021.
Gocic, M. and Trajkovic, S.: Analysis of changes in meteorological variables using Mann-Kendall and Sen's slope estimator statistical tests in Serbia, Global Planet. Change, 100, 172–182, 2013.
Gumma, M. K., Nelson, A., Thenkabail, P. S., and Singh, A. N.: Mapping rice areas of South Asia using MODIS multitemporal data, J. Appl. Remote Sens., 5, 053547, https://doi.org/10.1117/1.3619838, 2011.
Guo, L., An, N., and Wang, K.: Reconciling the discrepancy in ground- and satellite-observed trends in the spring phenology of winter wheat in China from 1993 to 2008, J. Geophys. Res.-Atmos., 121, 1027–1042, 2016.
Han, J., Zhang, Z., Luo, Y., Cao, J., Zhang, L., Zhuang, H., Cheng, F., Zhang, J., and Tao, F.: Annual paddy rice planting area and cropping intensity datasets and their dynamics in the Asian monsoon region from 2000 to 2020, Agr. Syst., 200, 103437, https://doi.org/10.1016/j.agsy.2022.103437, 2022.
He, Y., Dong, J., Liao, X., Sun, L., Wang, Z., You, N., Li, Z., and Fu, P.: Examining rice distribution and cropping intensity in a mixed single-and double-cropping region in South China using all available Sentinel 1/2 images, Int. J. Appl. Earth Obs., 101, 102351, https://doi.org/10.1016/j.jag.2021.102351, 2021.
IPCC: Climate Change 2022: Impacts, Adaptation, and Vulnerability. Contribution of Working Group II to the Sixth Assessment Report of the Intergovernmental Panel on Climate Change, edited by: Pörtner, H.-O., Roberts, D. C., Tignor, M., Poloczanska, E. S., Mintenbeck, K., Alegría, A., Craig, M., Langsdorf, S., Löschke, S., Möller, V., Okem, A., and Rama, B., Cambridge University Press. Cambridge University Press, Cambridge, UK and New York, NY, USA, 3056 pp., https://doi.org/10.1017/9781009325844, 2022.
Jönsson, P. and Eklundh, L.: TIMESAT—a program for analyzing time-series of satellite sensor data, Comput. Geosci., 30, 833–845, https://doi.org/10.1016/j.cageo.2004.05.006, 2004.
Kong, D., McVicar, T. R., Xiao, M., Zhang, Y., Peña-Arancibia, J. L., Filippa, G., Xie, Y., and Gu, X.: phenofit: An R package for extracting vegetation phenology from time series remote sensing, Meth. Ecol. Evol., 13, 1508–1527, https://doi.org/10.1111/2041-210X.13870, 2022.
Kotsuki, S. and Tanaka, K.: SACRA – a method for the estimation of global high-resolution crop calendars from a satellite-sensed NDVI, Hydrol. Earth Syst. Sci., 19, 4441–4461, https://doi.org/10.5194/hess-19-4441-2015, 2015.
Laborte, A. G., Gutierrez, M. A., Balanza, J. G., Saito, K., Zwart, S. J., Boschetti, M., Murty, M., Villano, L., Aunario, J. K., and Reinke, R.: RiceAtlas, a spatial database of global rice calendars and production, Sci. Data, 4, 1–10, 2017.
Liu, J., Li, H., Wang, X., Wang, S., Liu, Y., Liu, Z., Chen, S., Wang Q., Zhu, T., Wang, L., and Wang, L.: ChinaRiceCalendar, Harvard Dataverse [data set], https://doi.org/10.7910/DVN/EUP8EY, 2023.
Liu, L., Huang, J., Xiong, Q., Zhang, H., Song, P., Huang, Y., Dou, Y., and Wang, X.: Optimal MODIS data processing for accurate multi-year paddy rice area mapping in China, GISci. Remote Sens., 57, 687–703, 2020.
Liu, Y., Zhou, W., and Ge, Q.: Spatiotemporal changes of rice phenology in China under climate change from 1981 to 2010, Climatic Change, 157, 261–277, 2019.
Luo, W., Chen, M., Kang, Y., Li, W., Li, D., Cui, Y., Khan, S., and Luo, Y.: Analysis of crop water requirements and irrigation demands for rice: Implications for increasing effective rainfall, Agr. Water Manage., 260, 107285, https://doi.org/10.1016/j.agwat.2021.107285, 2022.
Luo, Y., Zhang, Z., Chen, Y., Li, Z., and Tao, F.: ChinaCropPhen1km: a high-resolution crop phenological dataset for three staple crops in China during 2000–2015 based on leaf area index (LAI) products, Earth Syst. Sci. Data, 12, 197–214, https://doi.org/10.5194/essd-12-197-2020, 2020.
Mishra, B., Busetto, L., Boschetti, M., Laborte, A., and Nelson, A.: RICA: A rice crop calendar for Asia based on MODIS multi year data, Int. J. Appl. Earth Obs., 103, 102471, https://doi.org/10.1016/j.jag.2021.102471, 2021.
More, R. S., Manjunath, K., Jain, N. K., Panigrahy, S., and Parihar, J. S.: Derivation of rice crop calendar and evaluation of crop phenometrics and latitudinal relationship for major south and south-east Asian countries: A remote sensing approach, Comput. Electron. Agr., 127, 336–350, 2016.
Pan, Z., Huang, J., Zhou, Q., Wang, L., Cheng, Y., Zhang, H., Blackburn, G. A., Yan, J., and Liu, J.: Mapping crop phenology using NDVI time-series derived from HJ-1 A/B data, Int. J. Appl. Earth Obs., 34, 188–197, 2015.
Qiu, J., Tang, H., Frolking, S., Boles, S., Li, C., Xiao, X., Liu, J., Zhuang, Y. and Qin, X.: Mapping single-, double-, and triple-crop agriculture in China at 0.5°× 0.5° by combining county-scale census data with a remote sensing-derived land cover map, Geocarto Int., 18, 3–13, 2003.
Reed, B. C., Brown, J. F., VanderZee, D., Loveland, T. R., Merchant, J. W., and Ohlen, D. O.: Measuring phenological variability from satellite imagery, J. Veg. Sci., 5, 703–714, 1994.
Sakamoto, T.: Refined shape model fitting methods for detecting various types of phenological information on major US crops, ISPRS J. Photogramm., 138, 176–192, 2018.
Sakamoto, T., Yokozawa, M., Toritani, H., Shibayama, M., Ishitsuka, N., and Ohno, H.: A crop phenology detection method using time-series MODIS data, Remote Sens. Environ., 96, 366–374, 2005.
Sakamoto, T., Wardlow, B. D., Gitelson, A. A., Verma, S. B., Suyker, A. E., and Arkebauer, T. J.: A two-step filtering approach for detecting maize and soybean phenology with time-series MODIS data, Remote Sens. Environ., 114, 2146–2159, 2010.
Shen, R., Pan, B., Peng, Q., Dong, J., Chen, X., Zhang, X., Ye, T., Huang, J., and Yuan, W.: High-resolution distribution maps of single-season rice in China from 2017 to 2022, Earth Syst. Sci. Data, 15, 3203–3222, https://doi.org/10.5194/essd-15-3203-2023, 2023.
Shen, Y., Zhang, X., Yang, Z., Ye, Y., Wang, J., Gao, S., Liu, Y., Wang, W., Tran, K. H., and Ju, J.: Developing an operational algorithm for near-real-time monitoring of crop progress at field scales by fusing harmonized Landsat and Sentinel-2 time series with geostationary satellite observations, Remote Sens. Environ., 296, 113729, https://doi.org/10.1016/j.rse.2023.113729, 2023.
Shihua, L., Jingtao, X., Ping, N., Jing, Z., Hongshu, W., and Jingxian, W.: Monitoring paddy rice phenology using time series MODIS data over Jiangxi Province, China, Int. J. Agr. Biol. Eng., 7, 28–36, 2014.
Son, N.-T., Chen, C.-F., Chen, C.-R., Duc, H.-N., and Chang, L.-Y.: A phenology-based classification of time-series MODIS data for rice crop monitoring in Mekong Delta, Vietnam, Remote Sens., 6, 135–156, 2013.
Sun, C., Zhang, H., Xu, L., Ge, J., Jiang, J., Zuo, L., and Wang, C.: Twenty-meter annual paddy rice area map for mainland Southeast Asia using Sentinel-1 synthetic-aperture-radar data, Earth Syst. Sci. Data, 15, 1501–1520, https://doi.org/10.5194/essd-15-1501-2023, 2023.
Sun, H., Huang, J., and Peng, D.: Detecting major growth stages of paddy rice using MODIS data, J. Remote Sens., 13, 1122–1137, 2009.
Waha, K., Müller, C., and Rolinski, S.: Separate and combined effects of temperature and precipitation change on maize yields in sub-Saharan Africa for mid-to late-21st century, Global Planet. Change, 106, 1–12, 2013.
Wan, Z., Hook, S., and Hulley, G.: MODIS/Terra Land Surface Temperature/Emissivity 8-Day L3 Global 1km SIN Grid V061, NASA EOSDIS Land Processes Distributed Active Archive Center [data set], https://doi.org/10.5067/MODIS/MOD11A2.061, 2021.
Wang, J., Yu, K., Tian, M., and Wang, Z.: Estimation of rice key phenology date using Chinese HJ-1 vegetation index time-series images, 2019 8th International Conference on Agro-Geoinformatics (Agro-Geoinformatics), IEEE, 1–4, https://doi.org/10.1109/Agro-Geoinformatics.2019.8820262, 2019.
Wang, X., Ciais, P., Li, L., Ruget, F., Vuichard, N., Viovy, N., Zhou, F., Chang, J., Wu, X., and Zhao, H.: Management outweighs climate change on affecting length of rice growing period for early rice and single rice in China during 1991–2012, Agr. Forest Meteorol., 233, 1–11, 2017.
Wang, X., Folberth, C., Skalsky, R., Wang, S., Chen, B., Liu, Y., Chen, J., and Balkovic, J.: Crop calendar optimization for climate change adaptation in rice-based multiple cropping systems of India and Bangladesh, Agr. Forest Meteorol., 315, 108830, https://doi.org/10.1016/j.agrformet.2022.108830, 2022.
Wang, X., Wang, S., Folberth, C., Skalsky, R., Li, H., Liu, Y., and Balkovic, J.: Limiting global warming to 2° C benefits building climate resilience in rice-wheat systems in India through crop calendar management, Agr. Syst., 213, 103806, https://doi.org/10.1016/j.agsy.2023.103806, 2024.
Wu, Q.: geemap: A Python package for interactive mapping with Google Earth Engine, J. Open Source Softw., 5, 2305, https://doi.org/10.21105/joss.02305, 2020.
Xiao, X., Boles, S., Liu, J., Zhuang, D., Frolking, S., Li, C., Salas, W., and Moore III, B.: Mapping paddy rice agriculture in southern China using multi-temporal MODIS images, Remote Sens. Environ., 95, 480–492, 2005.
Xiao, X., Boles, S., Frolking, S., Li, C., Babu, J. Y., Salas, W., and Moore III, B.: Mapping paddy rice agriculture in South and Southeast Asia using multi-temporal MODIS images, Remote Sens. Environ., 100, 95–113, 2006.
Zeng, L., Wardlow, B. D., Wang, R., Shan, J., Tadesse, T., Hayes, M. J., and Li, D.: A hybrid approach for detecting corn and soybean phenology with time-series MODIS data, Remote Sens. Environ., 181, 237–250, 2016.
Zhang, X., Friedl, M. A., Schaaf, C. B., Strahler, A. H., Hodges, J. C., Gao, F., Reed, B. C., and Huete, A.: Monitoring vegetation phenology using MODIS, Remote Sens. Environ., 84, 471–475, 2003.
Zhao, C., Liu, B., Piao, S., Wang, X., Lobell, D. B., Huang, Y., Huang, M., Yao, Y., Bassu, S., and Ciais, P.: Temperature increase reduces global yields of major crops in four independent estimates, P. Natl. Acad. Sci. USA, 114, 9326–9331, 2017.
Zhao, H., Yang, Z., Di, L., and Pei, Z.: Evaluation of temporal resolution effect in remote sensing based crop phenology detection studies, International Conference on Computer and Computing Technologies in Agriculture, Springer, 135–150, https://doi.org/10.1007/978-3-642-27278-3_16, 2011.
Zheng, J., Song, X., Yang, G., Du, X., Mei, X., and Yang, X.: Remote sensing monitoring of rice and wheat canopy nitrogen: A review, Remote Sens., 14, 5712, https://doi.org/10.3390/rs14225712, 2022.
Zong, W., Ren, D., Huang, M., Sun, K., Feng, J., Zhao, J., Xiao, D., Xie, W., Liu, S., and Zhang, H.: Strong photoperiod sensitivity is controlled by cooperation and competition among Hd1, Ghd7 and DTH8 in rice heading, New Phytol., 229, 1635–1649, 2021.