the Creative Commons Attribution 4.0 License.
the Creative Commons Attribution 4.0 License.
 | 27 Mar 2024
Harmonized European Union subnational crop statistics can reveal climate impacts and crop cultivation shifts
Giulia Ronchetti
Luigi Nisini Scacchiafichi
Lorenzo Seguini
Iacopo Cerrani
Marijn van der Velde
The availability of coherent time series of crop statistics is essential for better analyzing the past, understanding the present, and predicting future trends in yield, area, and production. Importantly, such data also underpin assessments and subsequent policy actions that can shape future food systems that are more resilient in the face of climate change and that are sustainable in terms of resource use efficiency. In the European Union (EU), there currently is no legal obligation for EU countries to provide subnational crop statistics. However, such data could improve in-season crop forecasts, climate change impacts and adaption need assessments, and evaluation of agri-environmental schemes. The dataset described in this paper includes a harmonized collection of subnational crop statistics on area, production, and yield, collected for the EU from National Statistical Institutes (NSIs) and the EUROSTAT REGIO database – subnational crop statistics voluntarily contributed by EU countries. The crops considered are wheat (including soft and durum wheat), barley (including winter and spring barley), grain maize, sunflower, and sugar beet. All data are harmonized towards the hierarchical structure of the EUROSTAT legend and the regional classification of NUTS (Nomenclature of Territorial Units for Statistics) version 2016, to provide coherent time series. A total of 344 282 records is presented here (115 974 for wheat, 122 705 for barley, 35 274 for grain maize, 34 916 for sugar beet, and 35 413 for sunflower) for a total of 961 regions in 27 EU countries. Statistics are reported from 1975 to 2020, with a median time-span range of 21 years. A flagging system details, for each data record, information on data sources, processing steps, and quality-checking results. This includes consistency checks between reported values for area, yield and production, identification of null values, missing and calculated data, information on crop legend matching, and NUTS versioning. We illustrate the value of this dataset by analyzing impacts on crops and production zone shifts in Europe due to climatic and economic factors. Recommendations and future developments of collecting subnational statistics at the EU level are briefly discussed. The dataset is accessible with European Commission Authentication Service (ECAS) login at https://doi.org/10.2905/685949ff-56de-4646-a8df-844b5bb5f835 (Ronchetti et al., 2023b).
-
Please read the editorial note first before accessing the article.
-
Article
(11304 KB)
-
Please read the editorial note first before accessing the article.
- Article
(11304 KB) - Full-text XML
- BibTeX
- EndNote


Coherent statistics on yield, area, and production feed the fields of food system analysis, food security assessments (Mueller et al., 2012), and food economics, to name a few. While good-quality national-level crop statistics are – as a rule of thumb – available (but not always) for most countries around the world (see FAOSTAT), subnational crop statistics generally are not. However, coherent subnational crop statistics on yield, area, and production are increasingly in demand by businesses, market analysts, policymakers, scientists, and economists. Among the main application fields that rely on subnational crop statistics, remote-sensing-based analysis and crop model estimations play a major role. To name a few, Blickensdörfer et al. make use of area crop statistics as an independent dataset to assess the accuracy of crop-type maps derived from a combination of satellite imagery; similarly, in d'Andrimont et al. (2021) and Becker-Reshef et al. (2023), crop maps are compared to official subnational statistics to validate results. The major global agricultural monitoring systems (Fritz et al., 2019) rely on well-consolidated time series of crop statistics to develop estimation models for providing crop yield forecasts (Schauberger et al., 2020), but many other studies are available in the literature, where crop statistical datasets are used to calibrate and validate crop model performances from the local to global level (Paudel et al., 2022; Kern et al., 2018; Neumann and Smith, 2018; Kowalik et al., 2014).
Subnational statistics are published by National Statistical Institutes (NSIs) and/or Other National Authorities (ONAs) for each respective country. These subnational statistics can often be obtained through dedicated websites (e.g., the United States Department of Agriculture – USDA). Several public international organizations (e.g., EUROSTAT or FAOSTAT) or inter-agency platforms (e.g., the Agricultural Market Information System – AMIS) provide access to harmonized datasets that include statistical information on area, production, and yield for the most relevant crops at the national level for many countries (AMIS, 2022). Crop statistics are also provided by universities or research institutes. For instance, in 2008, Monfreda et al. (2008) provided global gridded data on harvested area and yields of 175 distinct crops around the year 2000 based on national and subnational-level census statistics and a global cropland dataset. Recently, Iizumi and Sakai (2020) developed a hybrid dataset for crop yields based on agricultural census statistics and satellite remote sensing to fill temporal and spatial gaps. To support climate impact analysis, Anderson et al. (2023) published a dataset with 100-year time series of subnational wheat and maize crop statistics from global breadbaskets (Anderson et al., 2022).
However, despite their importance, a complete and harmonized collection of subnational crop statistics for countries in the European Union (EU) currently does not exist. A new EU framework regulation governing the collection of Statistics on Agricultural Inputs and Outputs (SAIO) will apply from 1 January 2025. The collection of subnational crop statistics will become legally binding (European Parliament, EPRS, 2023). This new regulation should improve the availability and quality of subnational statistics at the EU level considerably. Currently, EUROSTAT (Eurostat, 2020) receives subnational statistics from Member States (MSs) and reports these in the regional database (Eurostat, 2023b), the data provision relies on voluntary contributions, contains gaps, and does not consider changes in regional administrative boundaries through time. By assessing EUROSTAT regional crop statistics for the years 2016–2018, we found that extended use of this dataset can be limited by some inconsistencies, such as (i) it not containing yield data, (ii) it not reporting statistics for spring barley, (iii) it including records of outdated Nomenclature of Territorial Units for Statistics (NUTS) classifications (i.e., versions 2006, 2010, and 2013), (iv) there being incoherent use of zero and null values for crop record entries without data, and (v) aggregated production values not being coherent with the national production values published in the national database (Eurostat, 2023b) for many combinations of countries and crops. In addition, NSIs annually provide subnational crop statistics, accounting for regional variations but also accommodating the specific characteristics and needs of each individual country. A further challenge is the mapping between the different crop names, terminology, and classifications used in the various countries. As an example, the Austrian statistical service (Statistics Austria, 2023) distinguishes between spring soft wheat, winter soft wheat, spring durum wheat, and winter durum wheat, while the National Statistical Institute of Bulgaria (Republic of Bulgaria, 2023) only reports figures for total wheat, without any specifications on variety. In Spain, the Ministry of Agriculture, Fisheries and Food (MAPA, 2023) provides crop statistics on area and yield with a distinction between irrigated and non-irrigated crops. Furthermore, from a historical and geographical point of view, the EU has changed over the years. The number of MSs has changed over time, and within each country, there have been variations in terms of local subdivisions. The EU-wide NUTS includes several spatial levels for each country and has been managed by EUROSTAT under a series of agreements with the MSs (Eurostat, 2018). These NUTS classifications can undergo changes over time. For example, a regional unit can be merged with another region or divided, creating new regions in the process (Eurostat, 2023c). For example, in the NUTS 2016 classification, some NUTS 2 regions in France have been recoded with respect to the NUTS 2013 classification (Eurostat, 2015b) (i.e., FR42 turned into FRF1). In Poland, a new region (i.e., PL92) has been introduced as an aggregation of regions. In Hungary, region HU10 has been split into two new regions (i.e., HU11 and HU12). These variations could compromise the completeness of statistical time series; therefore, the reporting of crop statistics requires a spatial reference system that is spatially consistent through time.
Given these considerations, the need for a homogeneous dataset of crop statistics that can consider and solve local variations, from both geographical and agronomical points of view, and that is as extensive as possible so that it can be considered as a reference for the EU, becomes evident. The dataset presented in this paper is a harmonized set of subnational crop statistics for the EU (in the current composition, including 27 countries). Statistical values include information on area, yield, and production for the major crops cultivated in the EU (Avitabile et al., 2023). In particular, the crops considered here are wheat (including soft and durum wheat), barley (including winter and spring barley), grain maize, sugar beet, and sunflower. According to EUROSTAT data, in the last 3 years these crops jointly accounted for 50 % of the arable land in the EU (Eurostat, 2023b). The harmonization follows the hierarchical structure of the EUROSTAT legend and is harmonized towards the administrative classification of NUTS 2016 to provide a consistent and complete dataset. The length of the time series varies by crop and subnational unit. A flagging system details information on data sources, data processing steps, and data quality. This dataset may define a benchmark for subnational crop statistics in the EU and can be used in agro-economic and agro-environmental studies as a reference for model calibration and validation purposes.
The aim of this paper is to describe all the different steps involved in the generation of the dataset. Data collection and data processing are detailed in Sect. 2, while Sect. 3 focuses on the structure of the dataset. The value of the dataset is illustrated by mapping the lowest- and highest-yielding years and by calculating shifts in crop production zones in Sect. 4. The paper closes with some general considerations and future perspectives on collecting subnational crop statistics in the EU.
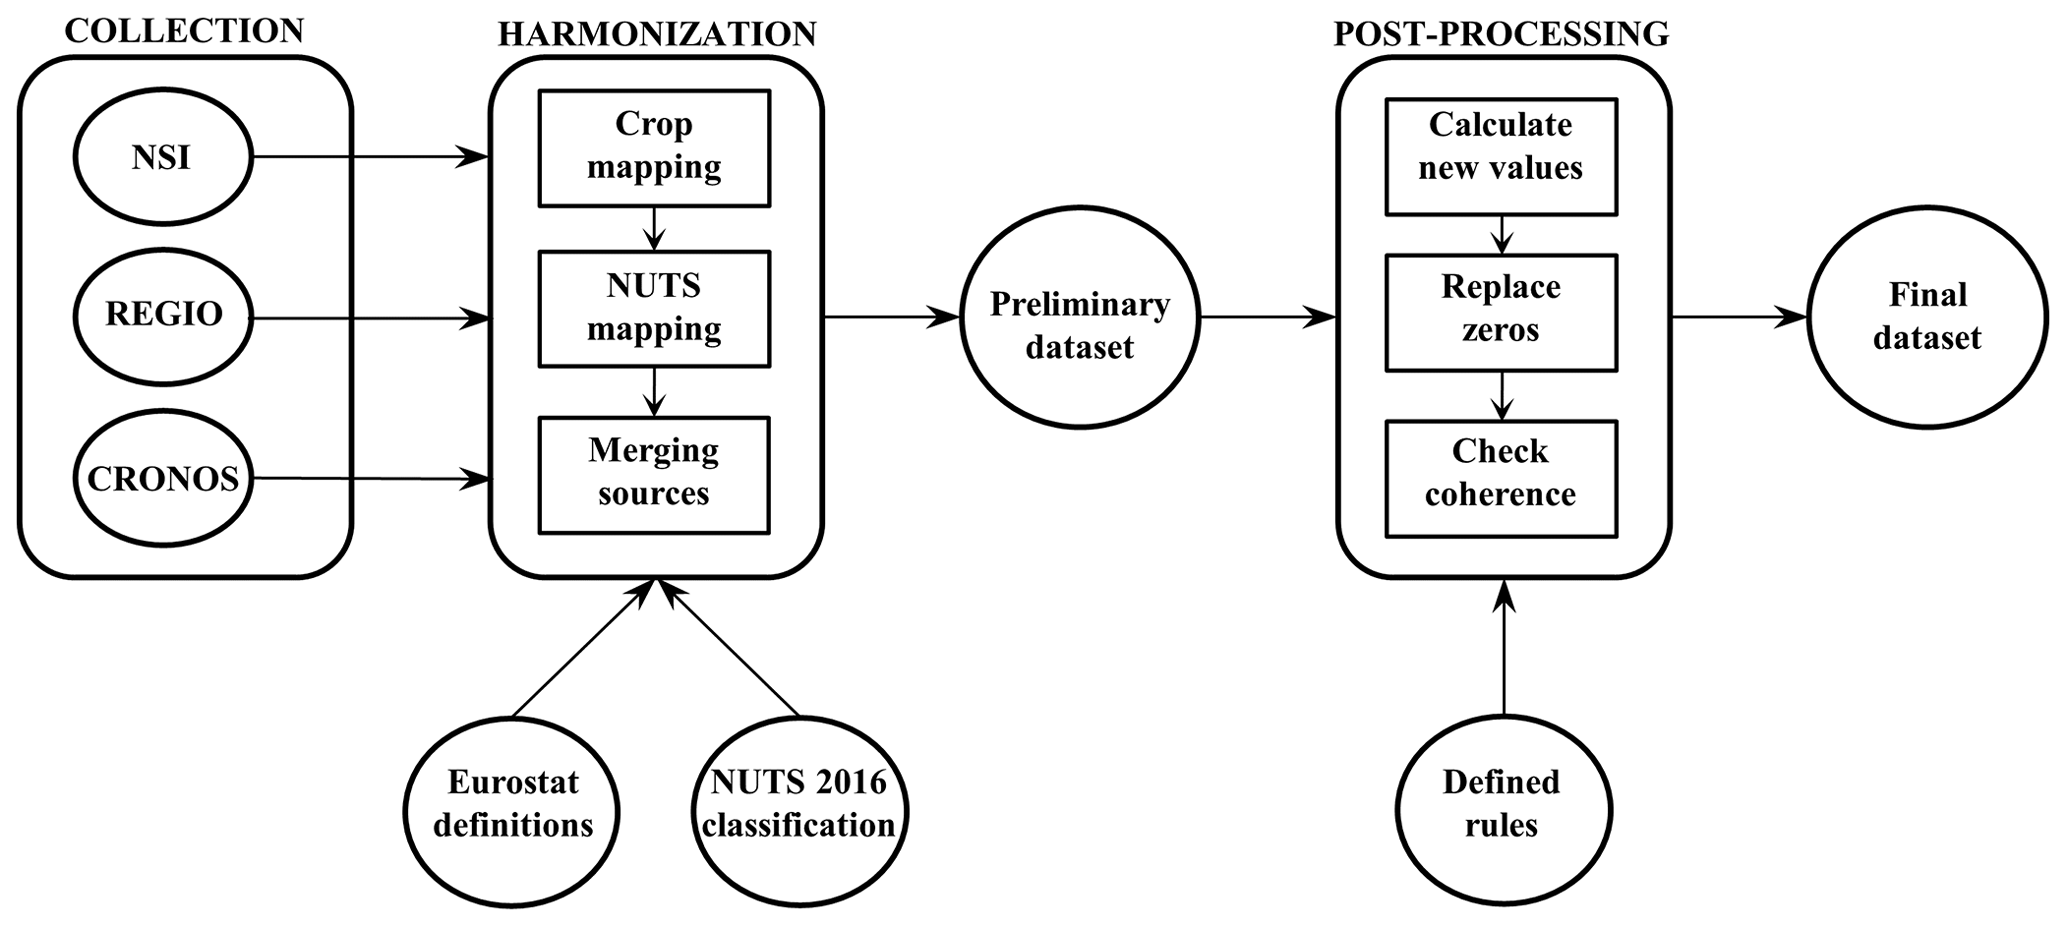
The procedure to generate a harmonized dataset of subnational crop statistics of the EU consists of three main steps, i.e., (i) data collection, (ii) data harmonization, and (iii) data postprocessing. The complete workflow is schematically shown in Fig. 1.
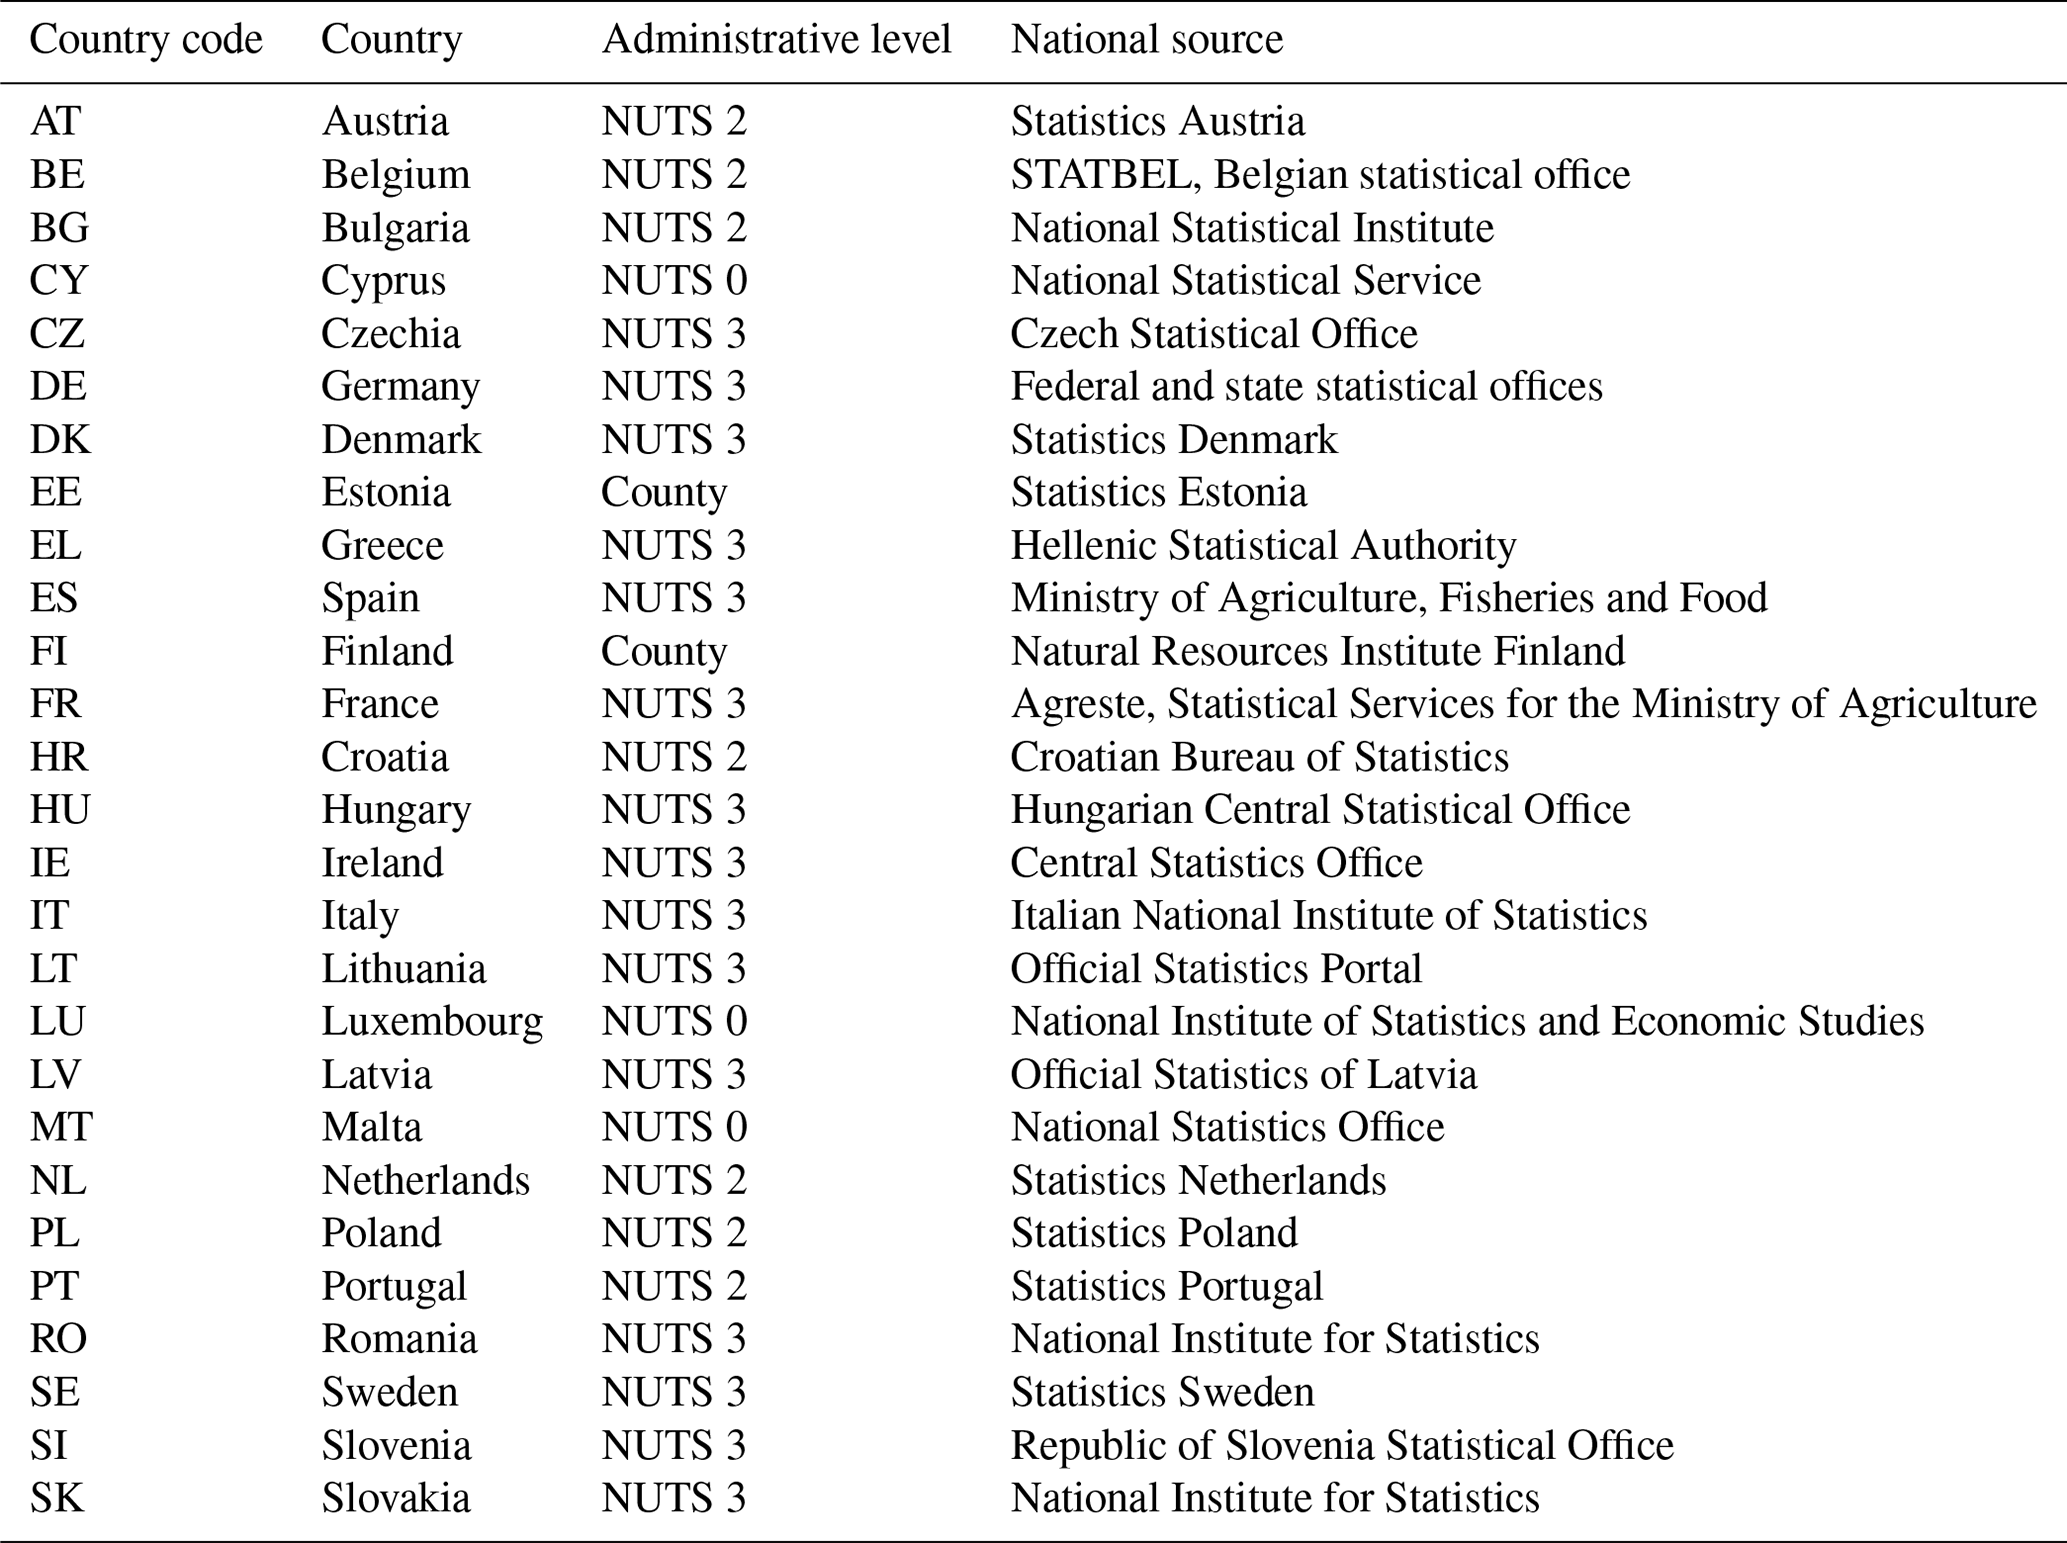
Table 1National source and administrative level provided of the statistics collected in the EU Member States.
2.1 Data collection
The collection of statistics on the area, production, and yield for the crops considered in this dataset includes the querying of different statistical sources and the extraction of the required information, when existing and available. Data are first collected in any provided format (i.e., text files, documents, and spreadsheets) and then converted into a compatible format to be ingested into a database. The length of statistical time series can vary depending on crops, countries, and data sources, but overall statistics cover the period from 1975 to 2020. The latest data were collected in July 2022, accounting for 219 472 records for the crops included in this dataset. The main statistical sources investigated for the data collection are the following.
-
Subnational statistics from NSIs and ONAs responsible for agricultural statistics (Eurostat, 2023a): this set of agricultural statistical time series is obtained by directly downloading statistics from the official national websites or by contacting the different NSIs or national authorities, which provide crop statistics on area, production, and yield at the lowest administrative level available (e.g., NUTS 3). The complete list of all the involved NSIs and national authorities is reported in Table 1, together with the administrative level at which the statistics are provided. From here on, this dataset is identified with the name “NSI”.
-
EUROSTAT regional database (Tables apro_cpnhr and apro_cpnhr_h, Eurostat, 2023b): this source consists of a database providing figures for a list of agricultural commodities available for EU Member States and some neighboring countries. Data are provided at the subnational level, i.e., the NUTS 1 and NUTS 2 levels. From here on, this dataset is identified with the name “REGIO”.
-
EUROSTAT national database (Tables apro_cpnh1 and apro_cpnh1_h, Eurostat, 2023b): this source consists of a database providing figures for a list of agricultural commodities available for EU Member States and some neighboring countries. Data are provided at the national level, i.e., the NUTS 0 level. From here on, this dataset is identified with the name “CRONOS”.
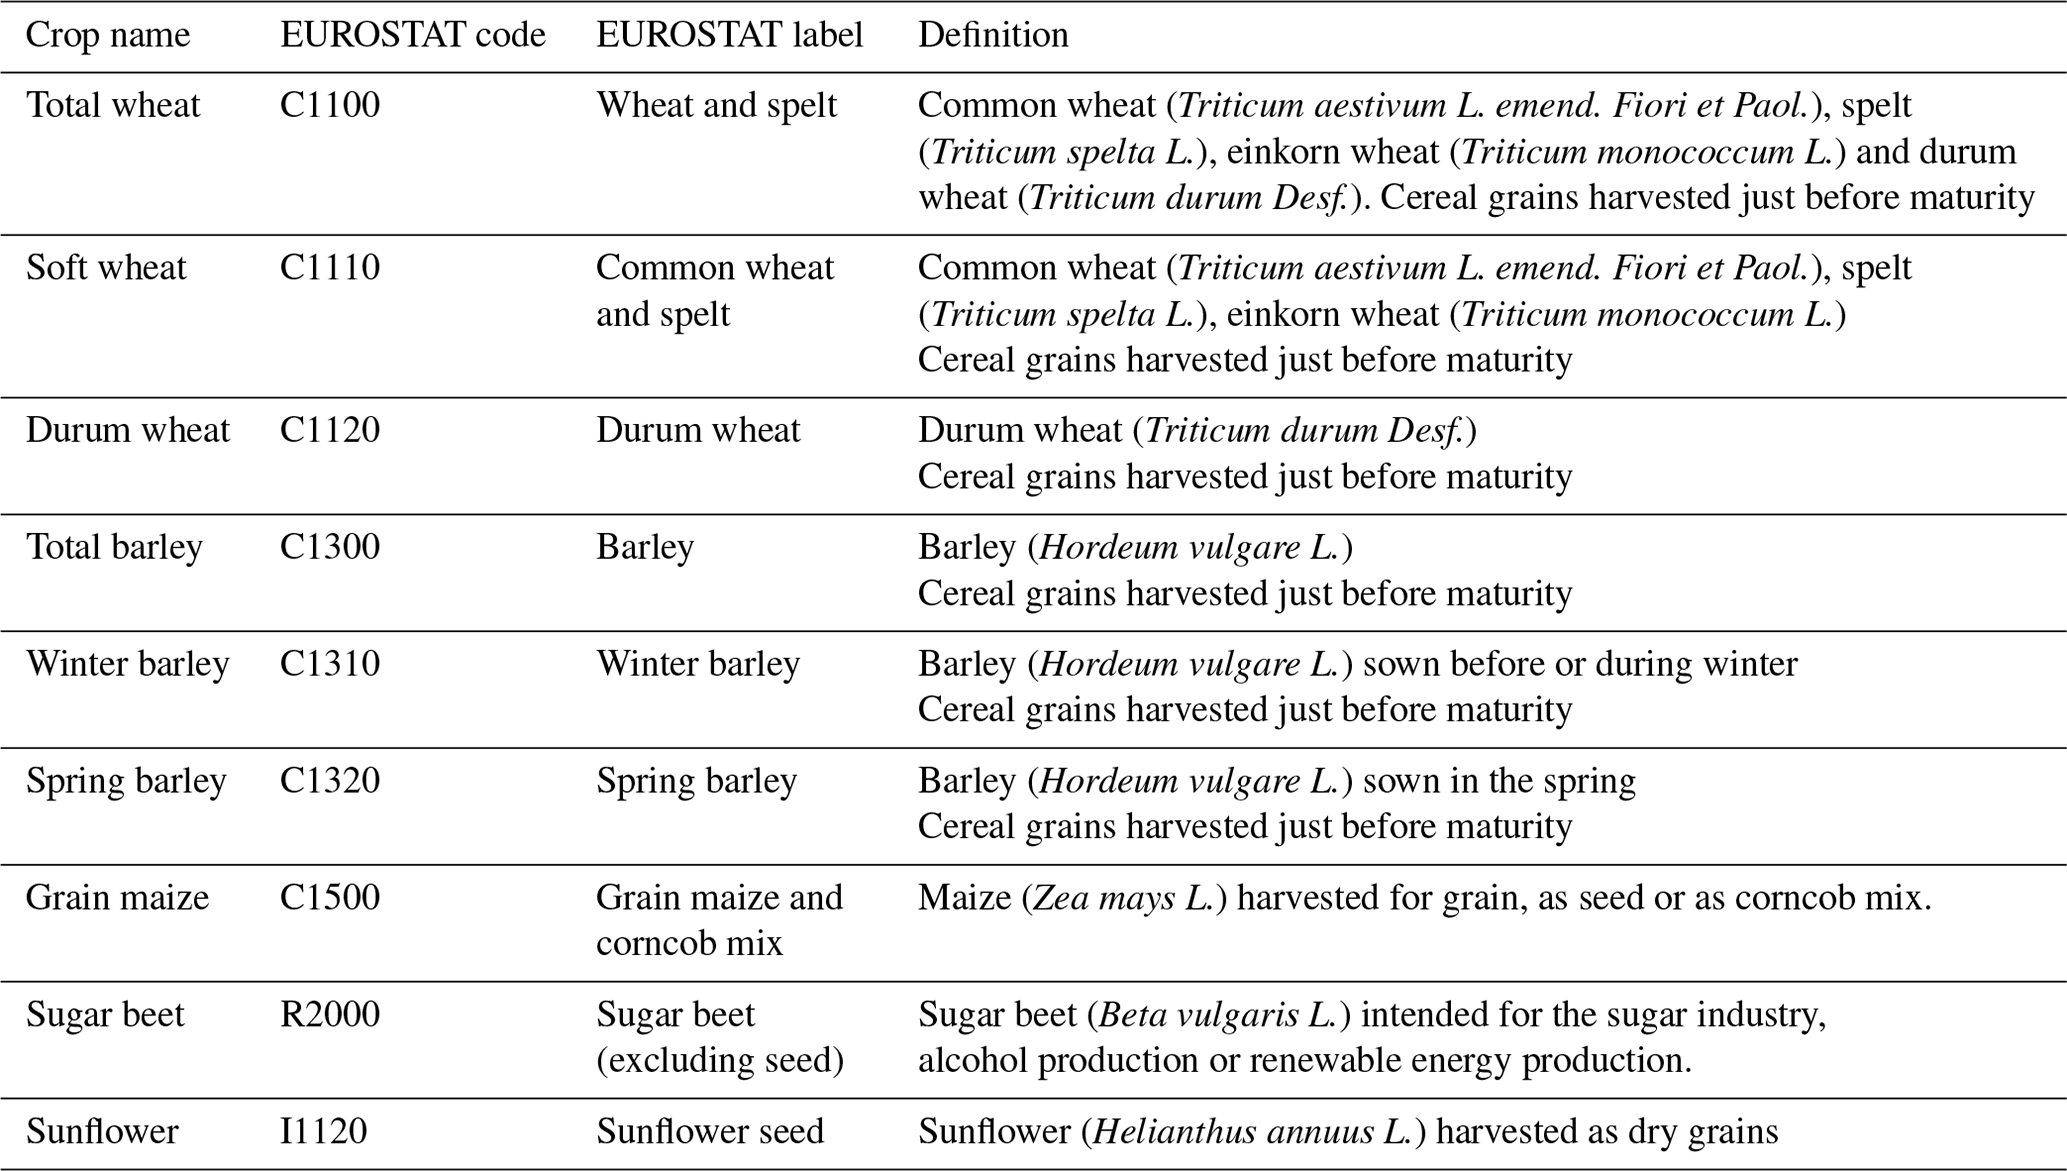
Table 2EUROSTAT definitions for the crops included in the dataset.
2.2 Data harmonization
The set of regional data on crop statistics collected from EUROSTAT and NSIs is very heterogeneous. As mentioned before, the administrative level at which statistics are provided (i.e., NUTS 1, NUTS 2, or NUTS 3) varies among the different sources and even within the same source, as the several statistical offices from the Member States often produce regional statistics disaggregated at different administrative levels and levels for publication can change over the years. Moreover, the definitions of crops sometimes differ between national statistical services and over the years, and crop and varieties have to be properly assigned to match reference terminology. Therefore, the statistical data collected are processed to make them comparable to the European standards used for crop definitions and administrative units. These standards follow the convention in terms of both the aggregated name and crop definition provided by EUROSTAT (Eurostat, 2020). The target crops selected for this dataset are listed in Table 2, while the selected reference layer for the administrative division is the Nomenclature of Territorial Units for Statistics (NUTS), version 2016 (Eurostat, 2018). Moreover, the units of measure of the collected data can vary according to the different data sources, although the standard rules suggest reporting area statistics in hectares (ha), production in tons (t), and yield in tons per hectare (t ha−1). A harmonization procedure has been developed to map collected statistics to the reference hierarchy and to merge the different data sources. This procedure is fully detailed in Cerrani et al. (2023) and consists of three main steps.
-
Crop mapping and transformation: all the crop legend classes in use by the EU Member States are mapped to match the EUROSTAT crop legend hierarchy. Original crop classes and their mapping values per country are included as tables in the data documentation available along with the dataset (see Sect. 3.1). Any value that needed crop harmonization after the collection is marked with a proper flag.
-
NUTS mapping and transformation: any region that was affected by a NUTS version update through time is aggregated or disaggregated to coherently match the NUTS version 2016 regional subdivision. An algorithm was developed to compare two administrative units belonging to different NUTS versioning and to determine the regions that are equal: those which have changed only the region identifier but not their geometry and those which have changed both the geometry and the identifier, also providing the weight to recompute statistics to the target layer. Any value that needed regional harmonization after the collection is marked with a proper flag.
-
Data source merging: crop and NUTS mapping and transformation are applied independently to each collected dataset. The final dataset is then generated by merging the data from the various sources from the NSIs and the EUROSTAT databases. The merging procedure ranks sources and first gives priority to the most recently collected data, then to data directly collected from NSIs, and finally to the regional data reported in the EUROSTAT database, particularly for the cases of crop statistics not reported by the NSIs. In this phase, units of measure are also homogenized to be consistent with each other. The final dataset provides area values in hectares (ha), production values in tons (t), and yield values in tons per hectare (t ha−1).
2.3 Data postprocessing
After data harmonization, a postprocessing procedure is required in order to complete the dataset with possible newly calculated values and to verify data consistency. In particular, data postprocessing focuses on (i) calculation of new values starting from the existing ones, both as a combination of variables and as an aggregation of crops; (ii) recognition and replacement of null or erroneously zero values; and (iii) assessment of coherence between variables and, whenever possible, between aggregated crops.
2.3.1 Calculate new values
Whenever a value is missing in the dataset, a dedicated procedure tries to derive the missing value from the existing ones through the application of simple rules. The newly calculated value can be retrieved either as a combination of variables, by exploiting the relationship between area, production, and yield values, or, in the specific case of total wheat and total barley, as an aggregation between soft and durum wheat or between winter and spring barley, respectively. Any newly calculated value is marked with a proper flag, and, in the newly calculated record, the source is set according to the source used to calculate the new data (i.e., if both data records are from either NSIs or EUROSTAT, then the data source for the calculated value is set accordingly, and otherwise it is set as Mixed sources).
To derive a new value as a combination of variables, the formulas reported in Eqs. (1)–(3) are implemented in the data postprocessing procedure:
where Y is the newly calculated value of the yield (t ha−1), P is the existing value of production (t), A is the existing value of the area (ha), P≥0, and A>0.
where A is the newly calculated value of the area (ha), P is the existing value of production (t), Y is the existing value of the yield (t ha−1), P≥0, and Y>0.
where P is the newly calculated value of production (t), A is the existing value of the area (ha), Y is the existing value of the yield (t ha−1), A≥0, and Y≥0.
The formulas reported in Eqs. (1)–(3) can also be applied to replace a value equal to zero or a null value. If two out of three variables have positive values and the third one is zero or null, a new value is calculated for the third variable by means of the same equations. Moreover, if two out of three variables are zeros and the third one is null, the value for the third variable is turned into zero as well. Conversely, if two out of three variables are null and the third one is equal to zero, the value for the third variable is converted to a null value.
To derive a new value of total wheat and/or total barley as an aggregation of crops, the formulas reported in Eqs. (4)–(6) are implemented in the data postprocessing procedure:
where Atotal is the newly calculated value of the area (ha) for total wheat (barley), Acrop 1 is the existing value of the area (ha) for soft wheat (winter barley), Acrop 2 is the existing value of the area (ha) for durum wheat (spring barley), Acrop 1>0, and Acrop 2>0.
where Ptotal is the newly calculated value of production (t) for total wheat (barley), Pcrop 1 is the existing value of production (t) for soft wheat (winter barley), Pcrop 2 is the existing value of production (t) for durum wheat (spring barley), Pcrop 1>0, and Pcrop 2>0.
where Ytotal is the newly calculated value of the yield (t ha−1) for total wheat (barley), Ptotal is the value of production (t) for total wheat (barley), Atotal is the value of the area (ha) for total wheat (barley), Ptotal≥0, and Atotal>0. If Ptotal is not available, then the new value for yield is derived as an area-weighted average of the yields. Specifically, the formula reported in Eq. (7) is applied:
where Ytotal is the newly calculated value of the yield (t ha−1) for total wheat (barley), Ycrop 1 is the existing value of the yield (t ha−1) for soft wheat (winter barley), Acrop 1 is the existing value of the area (ha) for soft wheat (winter barley), Ycrop 2 is the existing value of the yield (t ha−1) for durum wheat (spring barley), Acrop 2 is the existing value of the area (ha) for durum wheat (spring barley), Atotal is the value of the area (ha) for total wheat (barley), Ycrop 1≥0, Ycrop 2≥0, Acrop 1≥0, Acrop 2≥0, and Atotal>0.
2.3.2 Identify and replace zero with null
A dedicated procedure was also developed to identify and replace any value equal to zero that causes inconsistencies. In principle, the values of area, production, and yield must be consistent with each other. Gross errors, e.g., area values equal to zero associated with positive yield values or positive production values, are detected and flagged to provide end-users with the possibility of easily managing them. In particular, all zero values are checked and transformed into a null value should the variables disagree. Any value originally equal to zero that is replaced with a null value is marked with a proper flag.
2.3.3 Check coherence
Finally, data quality control is carried out by calculating the coherence between the three variables. The threshold value for determining an inconsistency between the data is set at 1 %. The coherence between the statistics of the area, production, and yield for a given region and year are verified by applying the formula in Eq. (8):
where P is the value of production (t), A is the value of the area (ha), and Y is the value of the yield (t ha−1). Whenever the condition is met or not, a proper flag is provided. Of course, the coherence check can only be applied if none of the three variables is missing or is null. The coherence between the variables is calculated for all the crops included in the dataset.
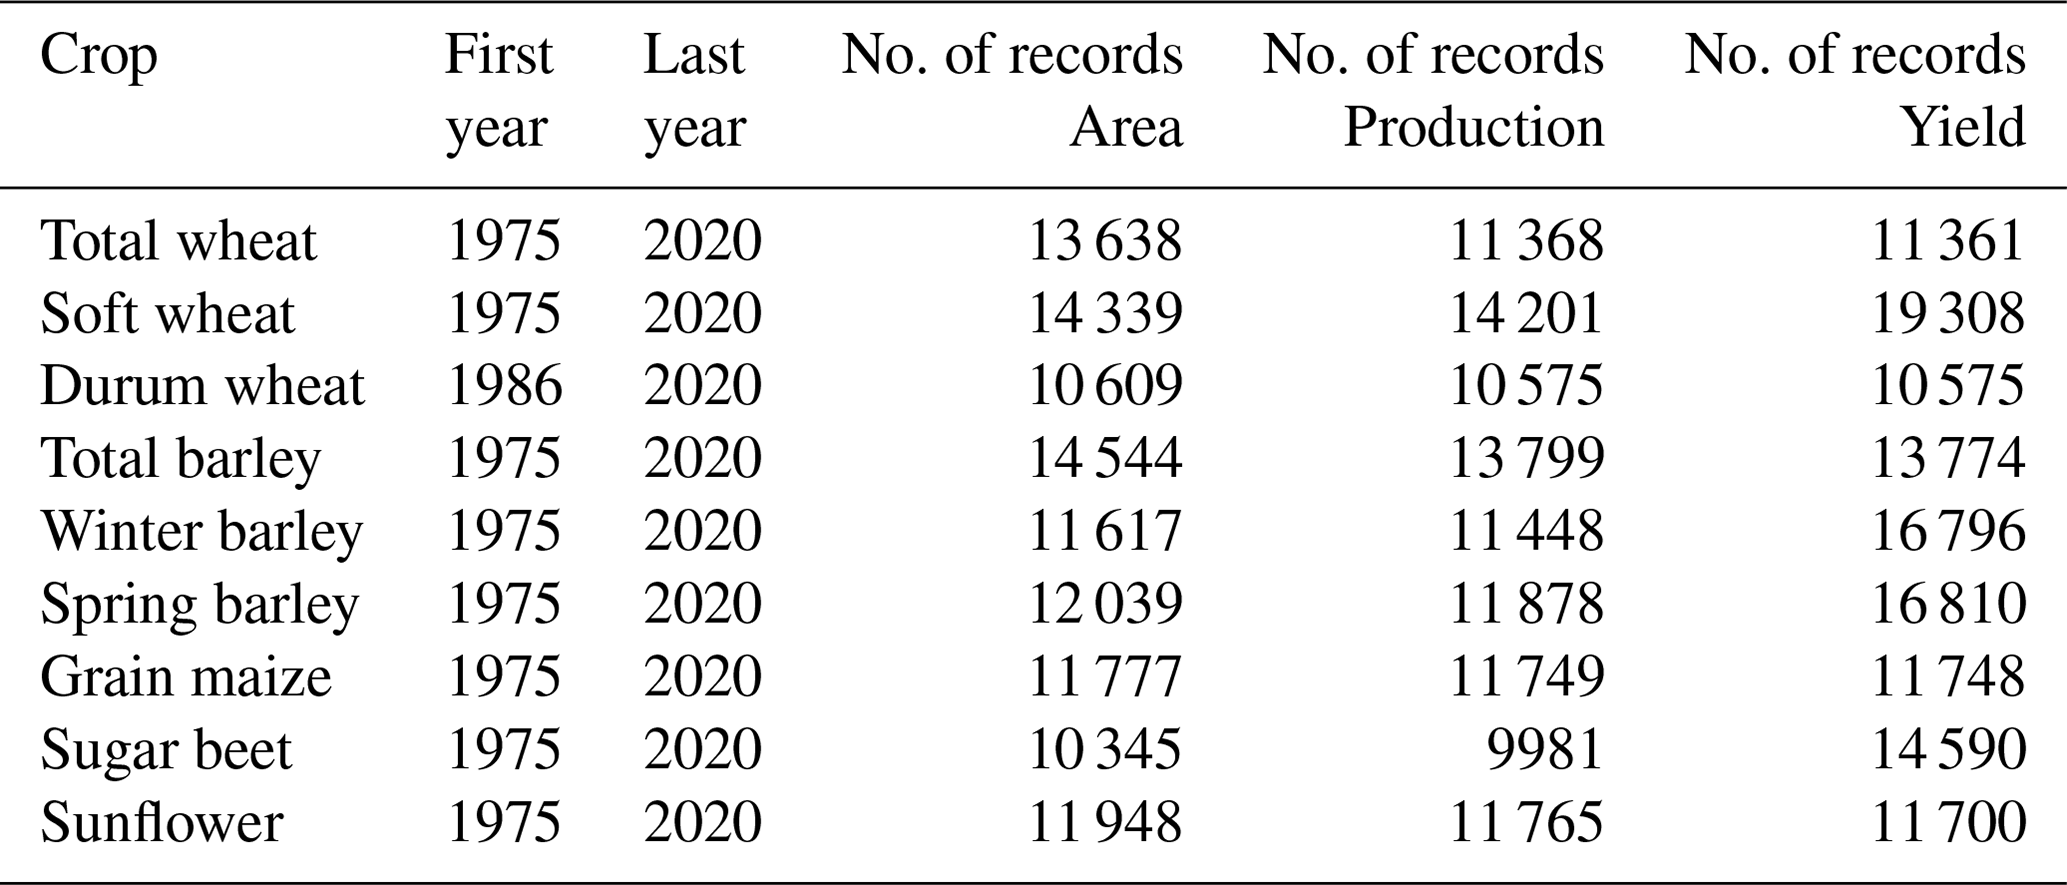
Table 3Number of records and length of the time series for each crop included in the dataset.
Moreover, an additional coherence check is provided exclusively for statistics regarding the crops wheat and barley. Since the statistics for total wheat (barley) are derived by aggregation, the coherence between the statistics of the crops involved in the aggregation is also verified. In particular, the formulas reported in Eqs. (9)–(11) are applied. For these controls, the threshold value for determining an inconsistency between the data is also set at 1 %.
where Atotal is the value of the area (ha) for total wheat (barley), Acrop 1 is the value of the area (ha) for soft wheat (winter barley), and Acrop 2 is the value of the area (ha) for durum wheat (spring barley). Whenever the condition is met or not, a proper flag is provided. The coherence can only be checked if none of the three values is missing or null.
where Ptotal is the value of production (t) for total wheat (barley), Pcrop 1 is the value of production (t) for soft wheat (winter barley), and Pcrop 2 is the value of production (t) for durum wheat (spring barley). Whenever the condition is met or not, a proper flag is provided. The coherence can only be checked if none of the three values is missing or null.
where Ytotal is the value of the yield (t ha−1) for total wheat (barley), Ycrop 1 is the value of the yield (t ha−1) for soft wheat (winter barley), Acrop 1 is the value of the area (ha) for soft wheat (winter barley), Ycrop 2 is the value of the yield (t ha−1) for durum wheat (spring barley), Acrop 2 is the existing value of the area (ha) for durum wheat (spring barley), Atotal is the value of the area (ha) for total wheat (barley), and Atotal>0. Whenever the condition is met or not, a proper flag is provided. The coherence can only be checked if none of the values is missing or null.
The final dataset consists of 344 282 records, including 115 974 records for wheat, 122 705 records for barley, 35 274 records for grain maize, 34 916 records for sugar beet, and 35 413 records for sunflower, covering 961 regions and 46 years, i.e., from 1975 to 2020. Table 3 presents the number of records for each crop and variable as well as the length of each time series. In addition, details regarding the number of records for each crop and variable, the reported administrative level, and the length of each time series according to country are summarized in Appendix A.
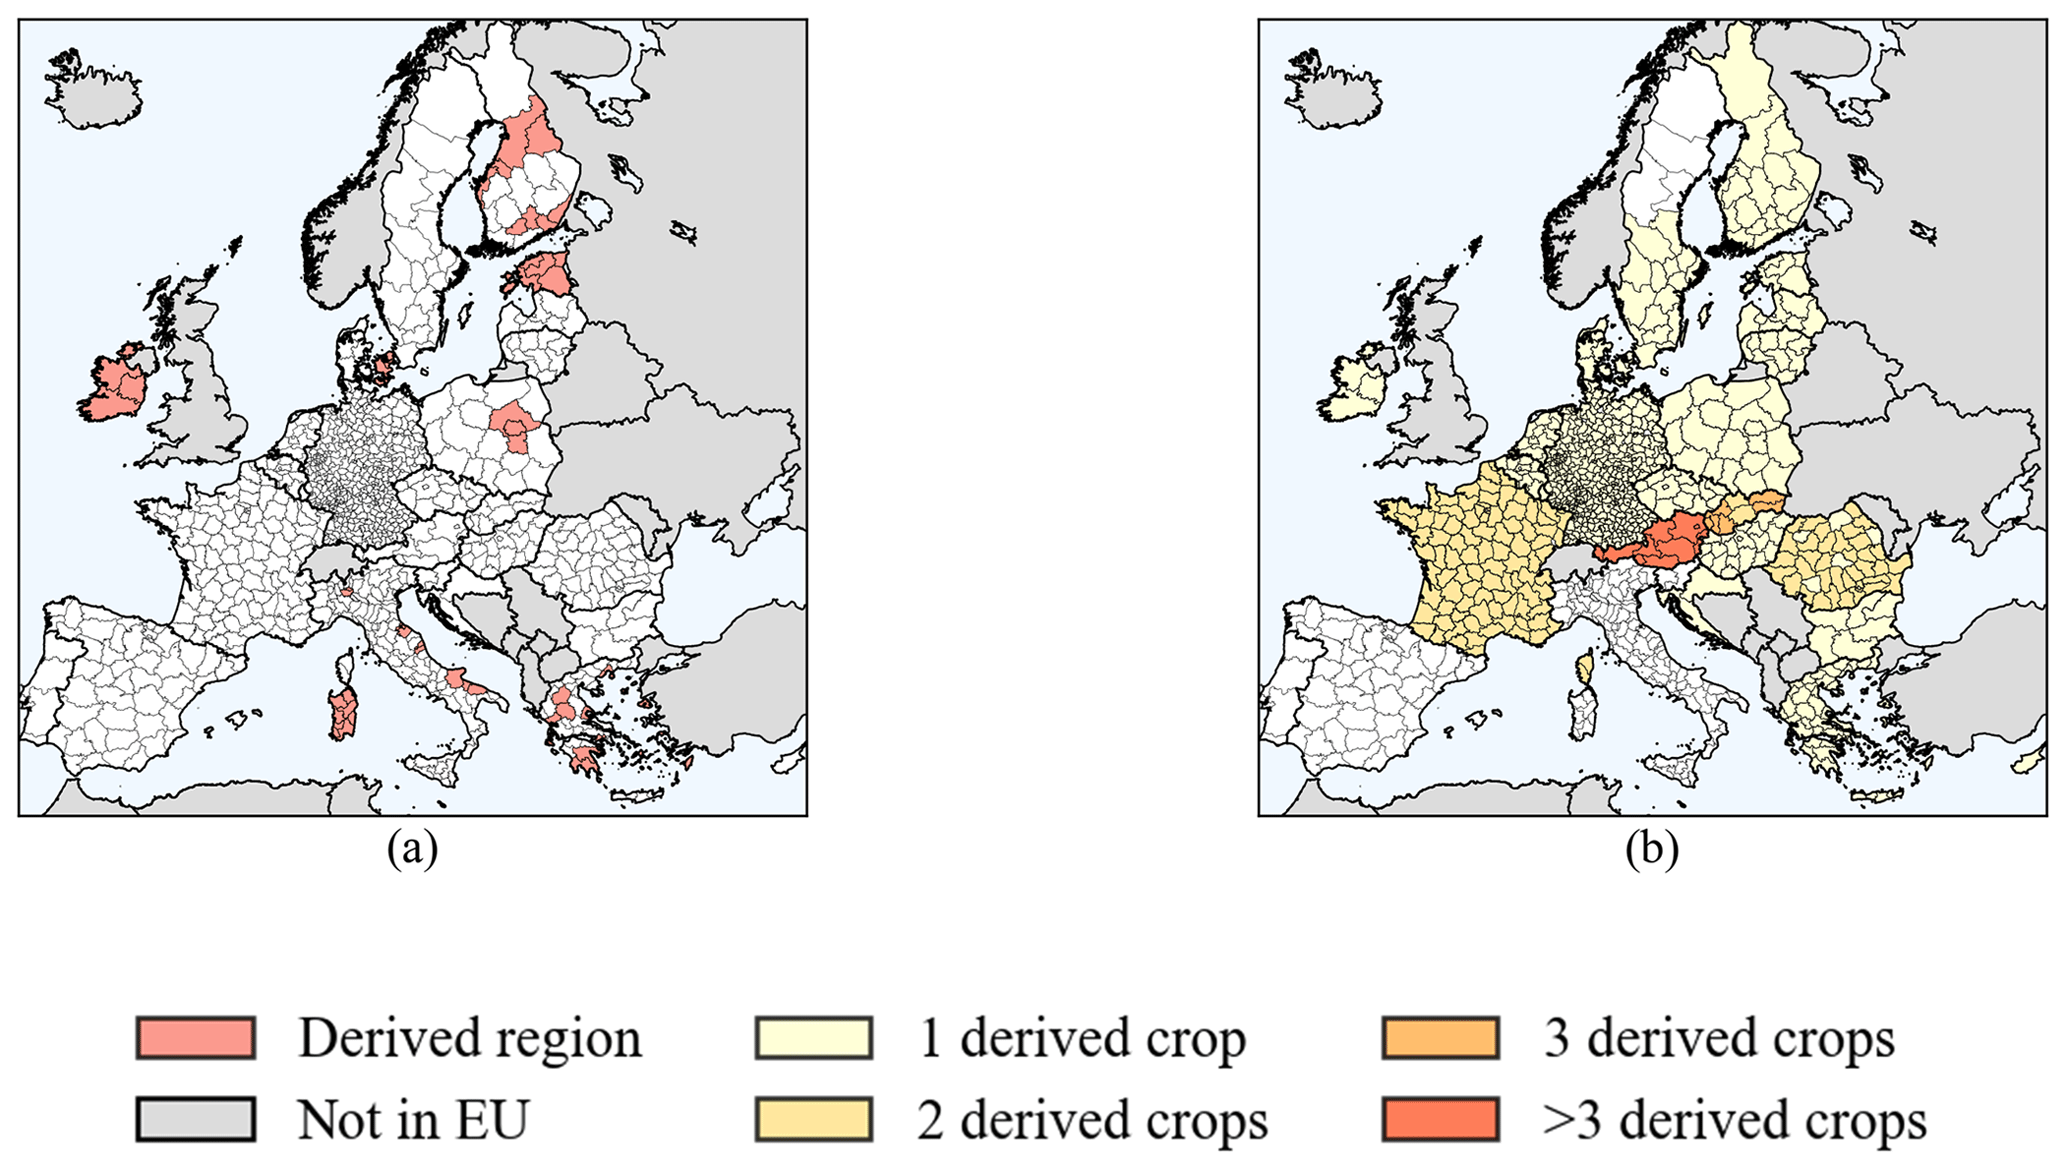
Figure 2Regions whose reported values were derived from a transformation of NUTS (a) and/or crops (b) for at least one crop included in this dataset.
3.1 Structure of the dataset
The current version of the subnational crop statistics dataset is composed of 13 fields, including information on region, crop, year, variable, value, source, and some additional flags. The following information can be found in the dataset.
-
REGION: the code of the administrative unit which the value refers to. Administrative unit codes are based on the EUROSTAT classification of NUTS 2016.
-
CROP_NAME: the name of the crop which the value refers to. Crop names follow the EUROSTAT definition (Table 2, Eurostat, 2020).
-
YEAR: the year which the value refers to. Years range from 1975 to 2020, according to data availability.
-
VARIABLE: the variable which the value refers to. Specifically, the variables are Area, Production, and Yield. In this dataset, the variable Area refers to the area of harvesting, although not all the data sources distinguish between areas of sowing and harvesting.
-
VALUE: the harmonized subnational statistics value
-
UoM: the unit of measure for the specific value. Units of measure depend on the respective variable: area in hectares (ha), production in tons (t), and yield (t ha−1).
-
SOURCE: the data source of the value. The data sources are NSI, EUROSTAT, or Mixed (i.e., when a value is calculated from a combination of values derived from both NSI and EUROSTAT).
-
CALCULATED_R: flagging system reporting whether a value has been derived from a NUTS version different from NUTS 2016, by means of the NUTS mapping and transformation procedure (Sect. 2.2)
-
CALCULATED_C: flagging system reporting whether a value has been derived from a combination of crops to match EUROSTAT definitions, by means of a crop mapping and transformation procedure (Sect. 2.2)
-
CALCULATED_V: flagging system reporting whether a value that originally was missing, null, or zero has been calculated during the postprocessing phase by means of the equations presented in Sect. 2.3.1
-
ZERO_AS_NULL: flagging system reporting whether a value of zero has been turned into a null value during the postprocessing phase because of any inconsistencies, as described in Sect. 2.3.2
-
COHERENCE_APY: flagging system reporting whether there is agreement among the values of area, production, and yield for the same region, crop, and year according to the rule defined in Eq. (8)
-
COHERENCE_CROP: flagging system reporting whether there is agreement among the values of total wheat (total barley), soft wheat (winter barley), and durum wheat (spring barley) for the same region, variable, and year according to the rules defined in Eqs. (9)–(11)
3.2 Flagging system
A total of six flags are reported together with the data representing additional information on data processing and data quality. This flagging system can help the users of this dataset to have clear knowledge of the originality and level of processing underlying the values they are dealing with as well as to verify the reliability of the data. The flags CALCULATED_R, CALCULATED_C, CALCULATED_V, and ZERO_AS_NULL are set as Yes or left blank, depending on whether the specific condition is met or not. The flags about coherence, i.e., COHERENCE_APY and COHERENCE_CROP, are set as Yes or No, depending on whether coherence is verified or not, and left blank when it is not possible to evaluate coherence due to missing or null values, as described in Sect. 2.3.3. Maps in Fig. 2 represent regions whose values were derived from a transformation of NUTS and/or crops. The need to derive values from a transformation of regions arises for two main reasons: data sources providing values according to a different NUTS version classification prior to version 2016 and/or data sources providing values according to their own internal administrative subdivision. The former is the case for regions in Ireland, Italy, and Poland, where the less recent crop statistics values were updated to match NUTS classification version 2016, as data sources originally provided them according to a different NUTS versioning. The latter is the case for regions in Denmark, Estonia, and Finland, whose NSIs report crop statistics values using their own internal administrative units (e.g., county) not compliant (i.e., Estonia) or only partially compliant (i.e., Denmark and Finland) with NUTS classification. Finally, crop statistics values for Greece were derived from a NUTS transformation, as regions in Greece have deeply changed after NUTS classification version 2010, but NSIs also report detailed crop statistics for small islands that need to be grouped to match the NUTS classification in use.
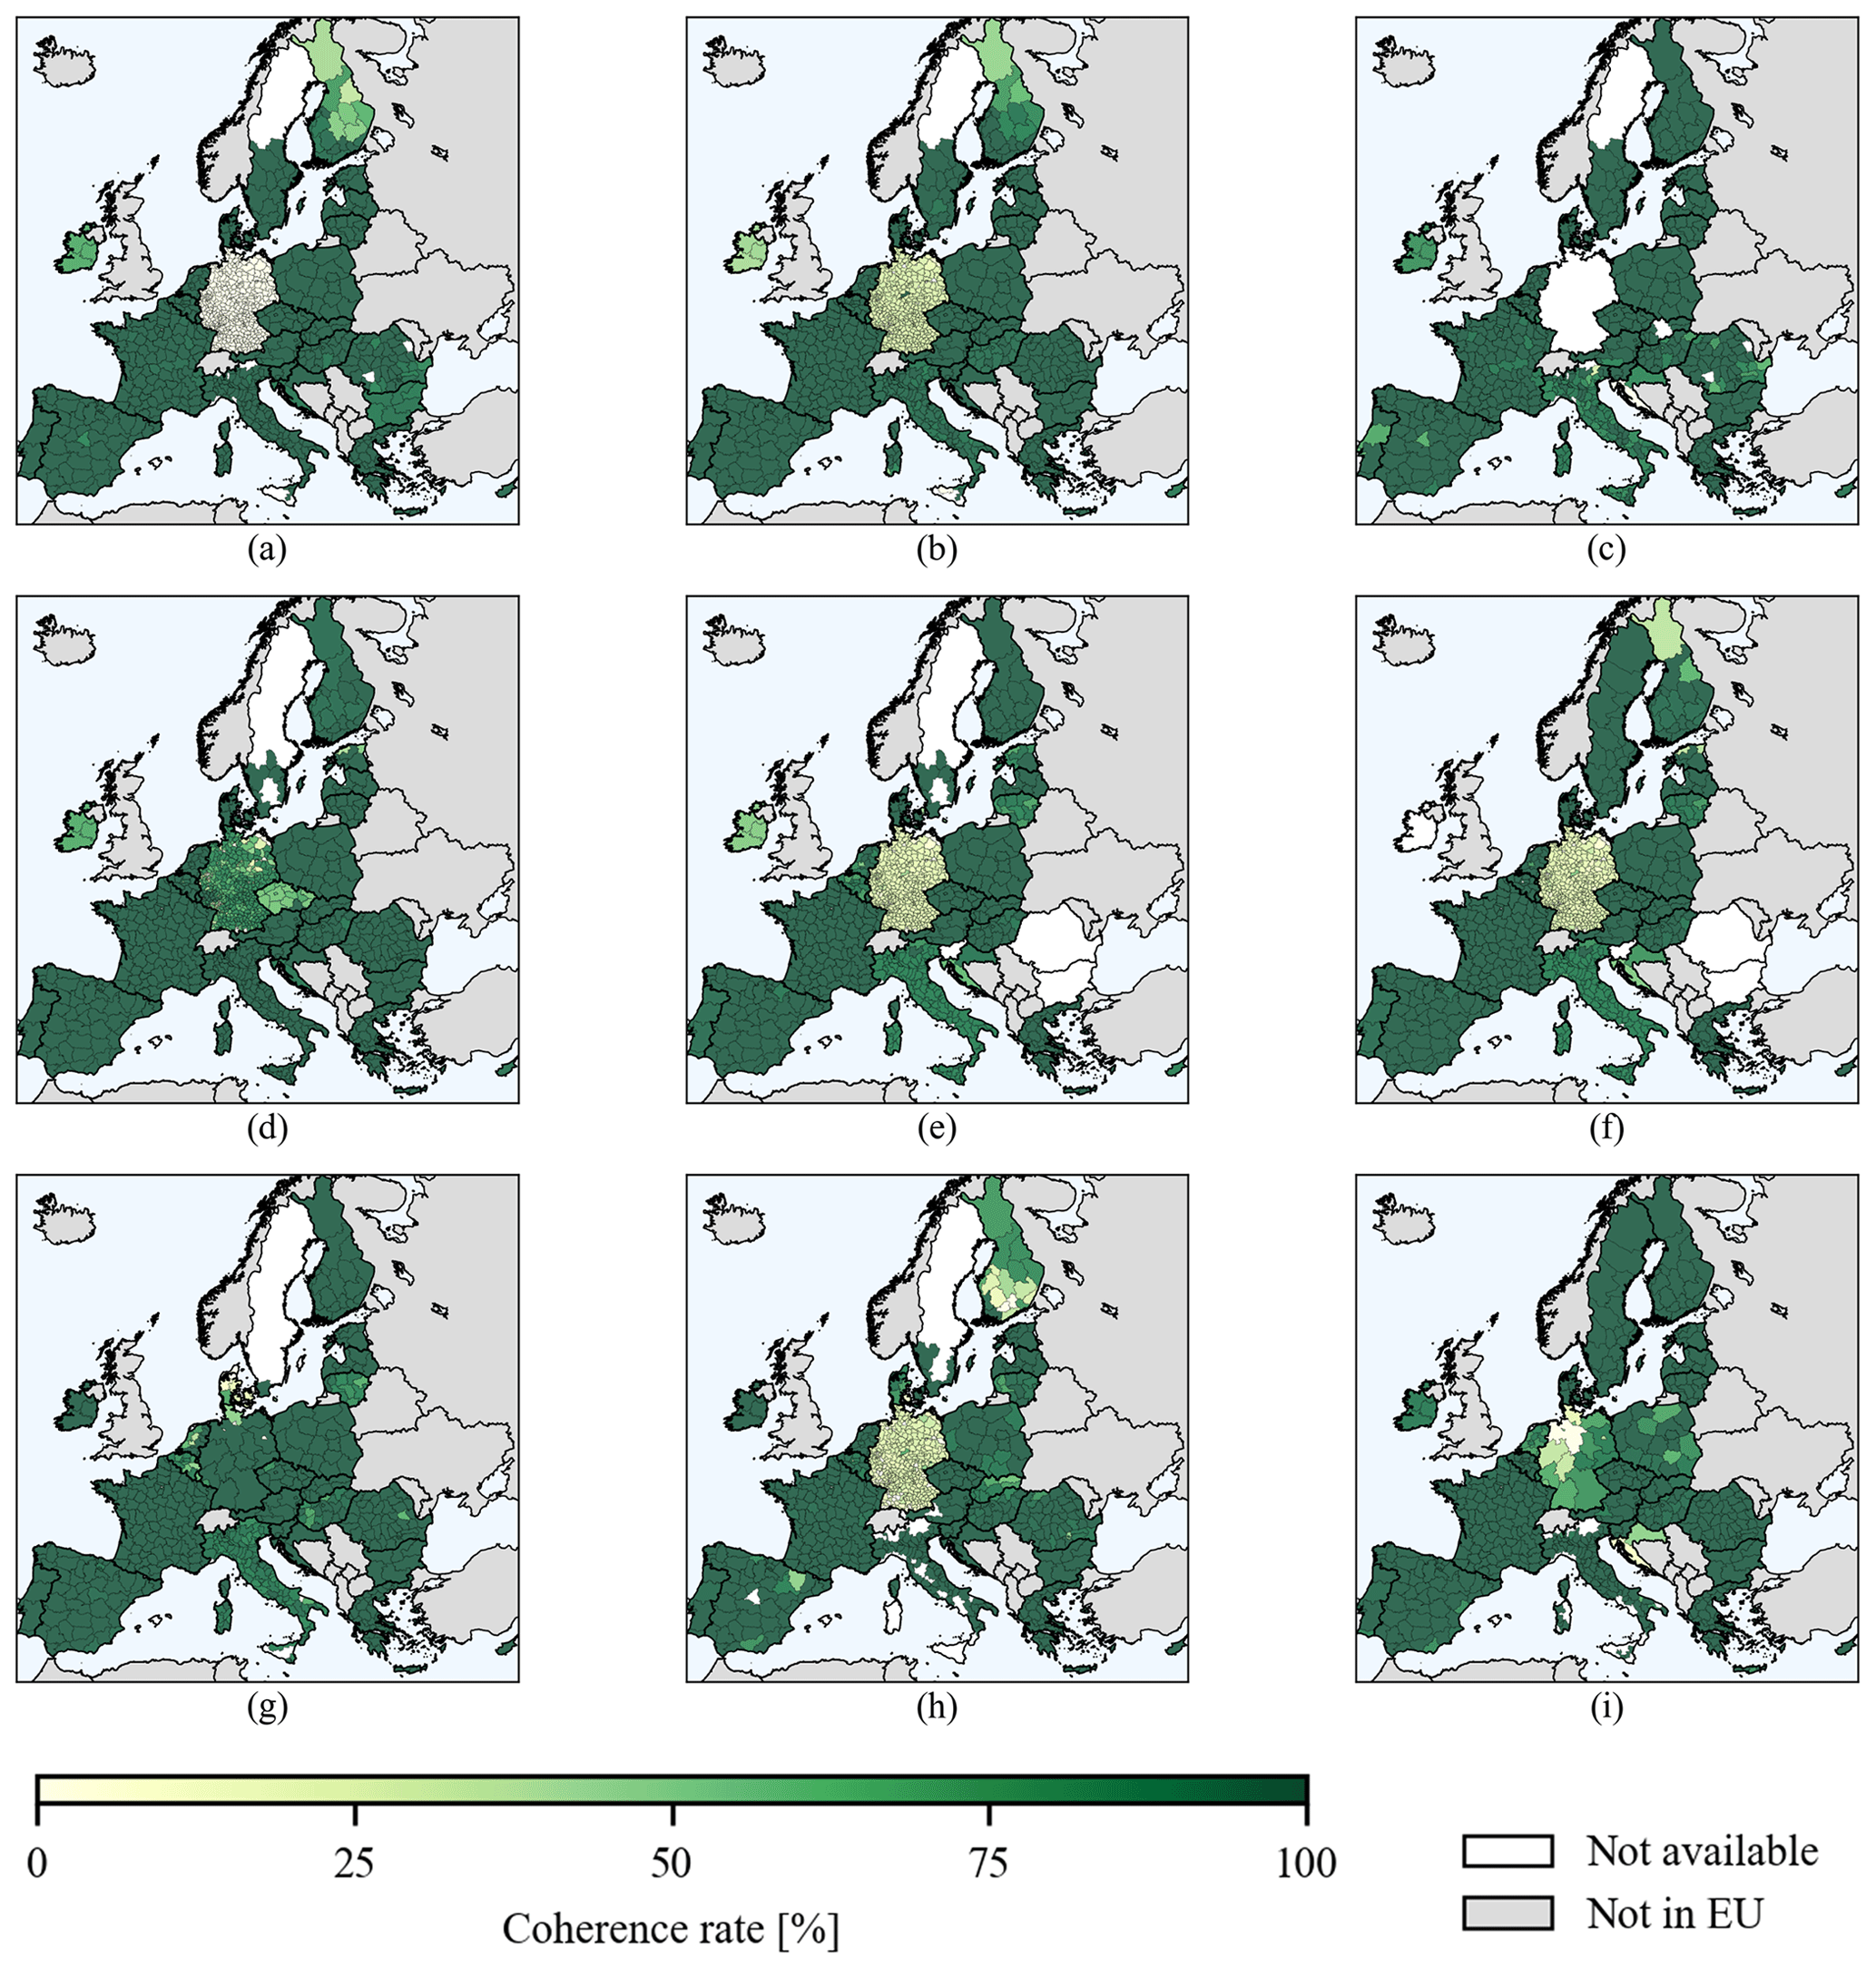
Figure 3The shares of records with verified coherence among area, production, and yield variables for each region and crop. (a) Total wheat. (b) Soft wheat. (c) Durum wheat. (d) Total barley. (e) Winter barley. (f) Spring barley. (g) Grain maize. (h) Sugar beet. (i) Sunflower.
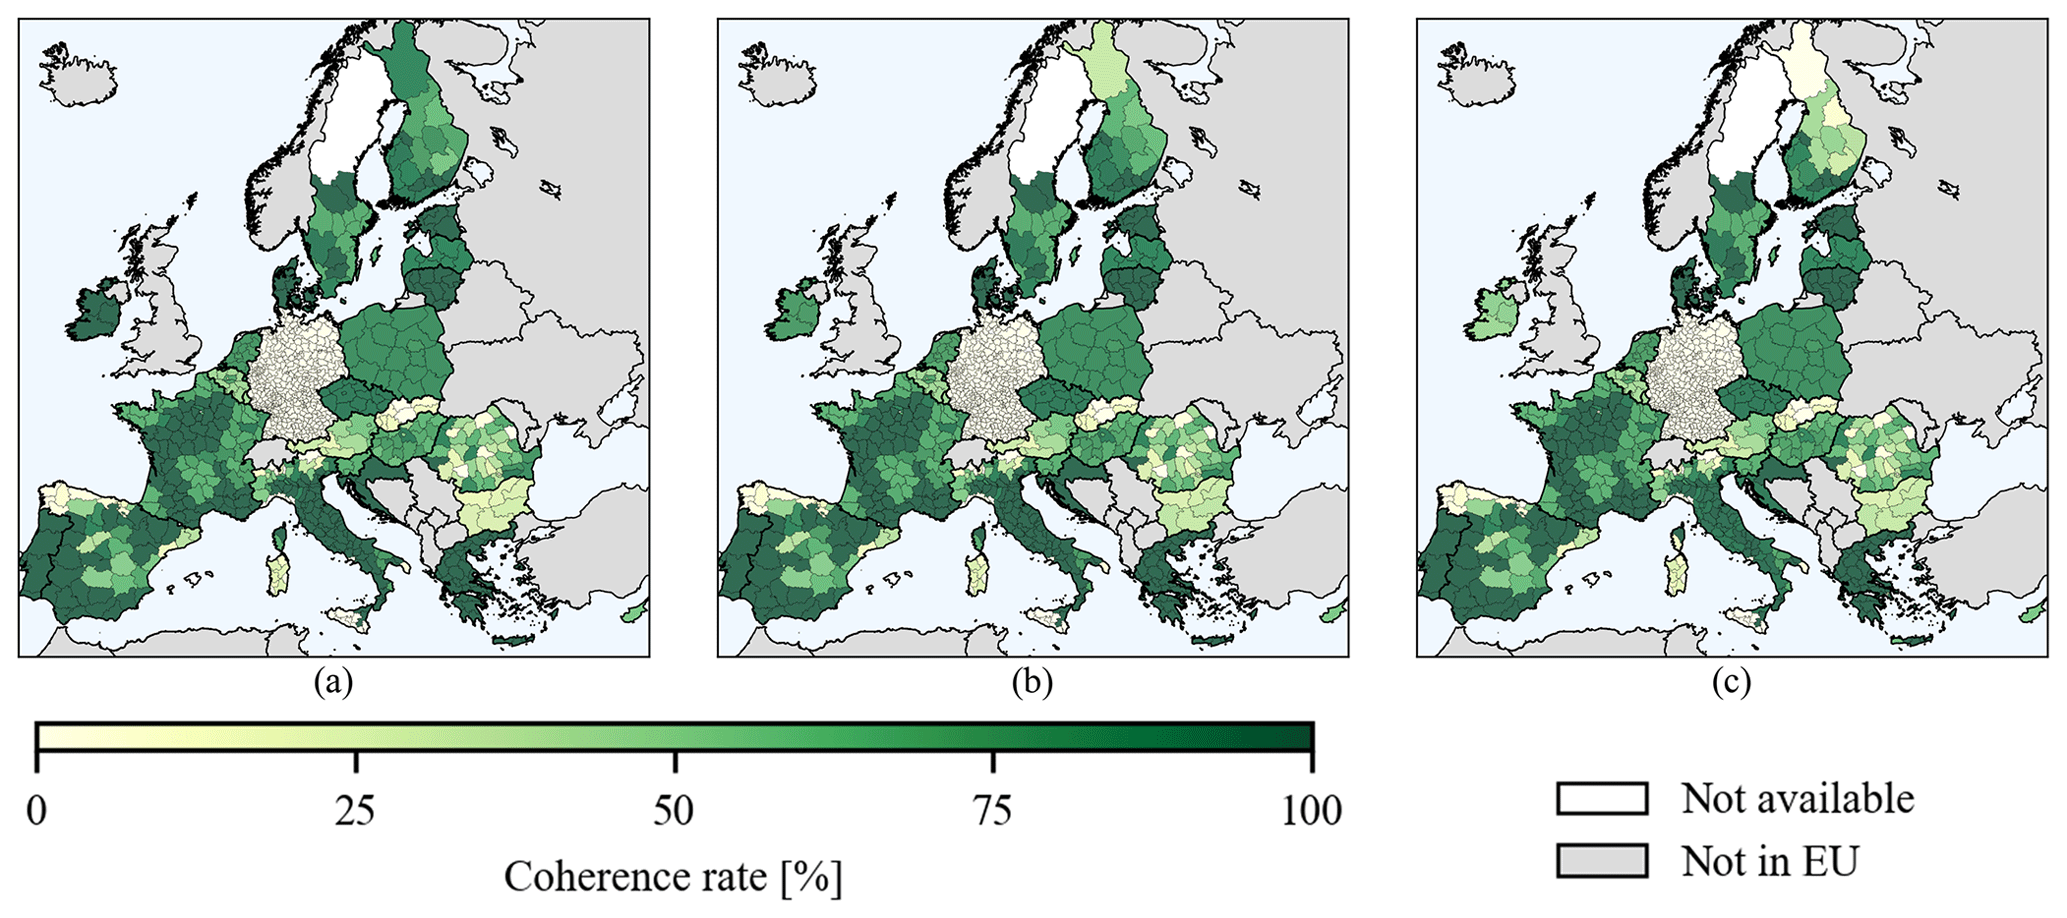
Figure 4The shares of records with verified coherence among total, soft, and durum wheat for each region and variable. (a) Area. (b) Production. (c) Yield.
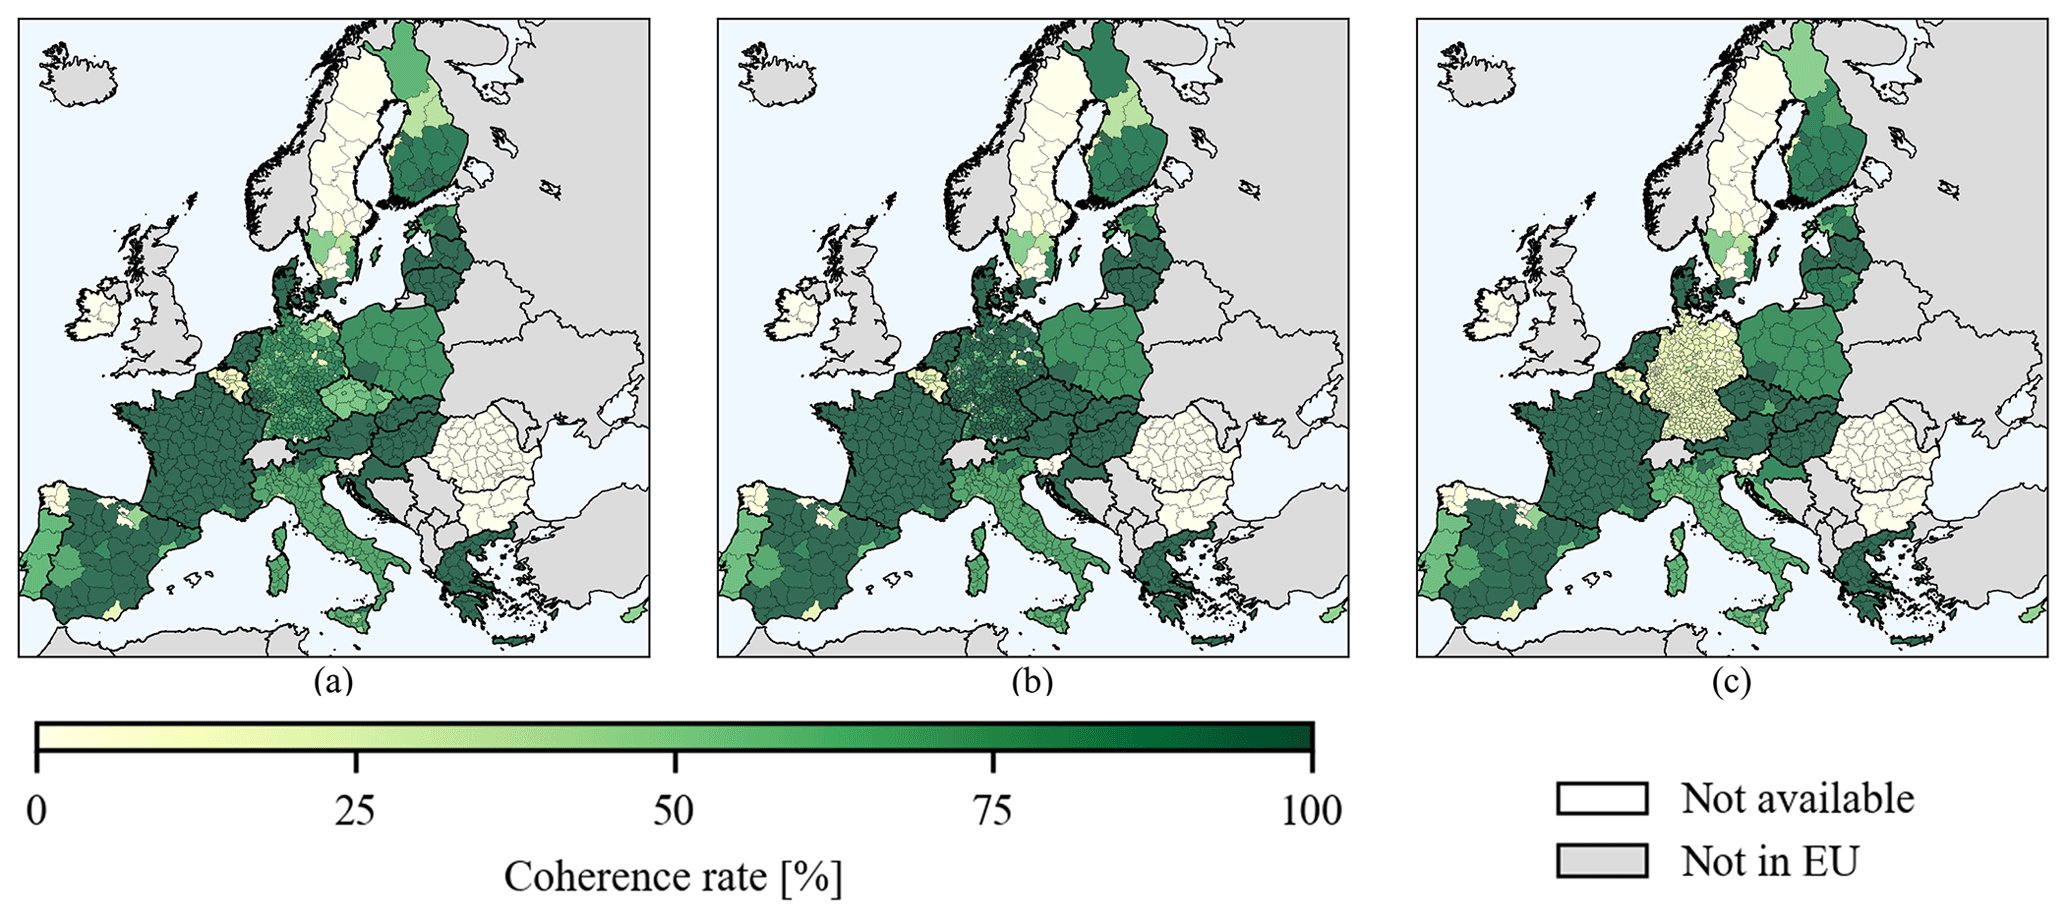
Figure 5The shares of records with verified coherence among total, winter, and spring barley for each region and variable. (a) Area. (b) Production. (c) Yield.
As regards values calculated from a transformation of crops, wheat and grain maize have required the highest number of transformations. Most NSIs report statistics for wheat with a distinction between winter and spring varieties and for maize with details about seeds and corncob mix and/or about irrigation. The map of Fig. 2b shows that most countries required computation of a transformation of crops for only one crop (i.e., soft wheat), while in France and Romania we derived values for two crops (i.e., soft and durum wheat). Only in Austria were almost all crops (i.e., total wheat, soft wheat, durum wheat, and grain maize) required to be harmonized with EUROSTAT crop definitions. Also, not all the data sources reported clear and coherent details about how they account for the corncob mix in their publications. In Fig. 3, maps show the shares of records with verified coherence among variables for each region and crop, and the maps of Figs. 4 and 5 display the shares of records with verified coherence for total wheat and total barley, respectively. The shares of records with verified coherence among variables and/or crops are computed by comparing the number of coherent records (i.e., Yes flags in the coherence columns) with the total number of records in the time series for each crop and region. A share close to 100 % means that coherence is verified in all the reported records, while a share close to 0 % represents very few records with verified coherence in the time series.
The main causes that can affect coherence among variables are to be attributed to the distinction between sown and harvested areas. It is not always known whether area values refer to sown or harvested areas, since only a few statistical sources either publish both values or clearly mention values they refer to. The nature of statistical collection often results in sown area being reported, as it is derived from aggregated area values from the farmers' applications for the Common Agricultural Policy that are made at the start of the season and are not updated. However, such information is especially important during heavy impacts where sown area may have been strongly reduced, and this can result in inconsistencies with production and yield data.
From the maps of Fig. 3, it is evident that the coherence rate among the variables is very high for all the regions and crops with a few exceptions, including Germany and Finland. For Germany, the low coherence rate is due to the fact that time series of variable yield are more complete and longer than the ones of area and production. Therefore, coherence checks can only be computed for a few records. Differently, for Finland, the coherence check rule is not verified in the northernmost regions with low agricultural activity where crop statistics are affected by approximation errors. Regarding the coherence among total, soft, and durum wheat (Fig. 4), coherence rate values differ from country to country and mostly depend on the availability of durum wheat statistics. Coherence rates are high for regions in southern Europe, where most durum wheat is produced, and in regions where the production of durum wheat is absent, while rates are low in regions where time series of durum wheat statistics are discontinuous or rarely published. Similarly, coherence rates among total, winter, and spring barley vary from country to country, as some NSIs do not provide distinct statistics for winter and spring wheat, as for the cases of Romania and Bulgaria. Finally, in Germany, coherence rates of the yield are lower than the ones of area and production because of the different lengths of these time series preventing application of the coherence check formula (Eq. 11).
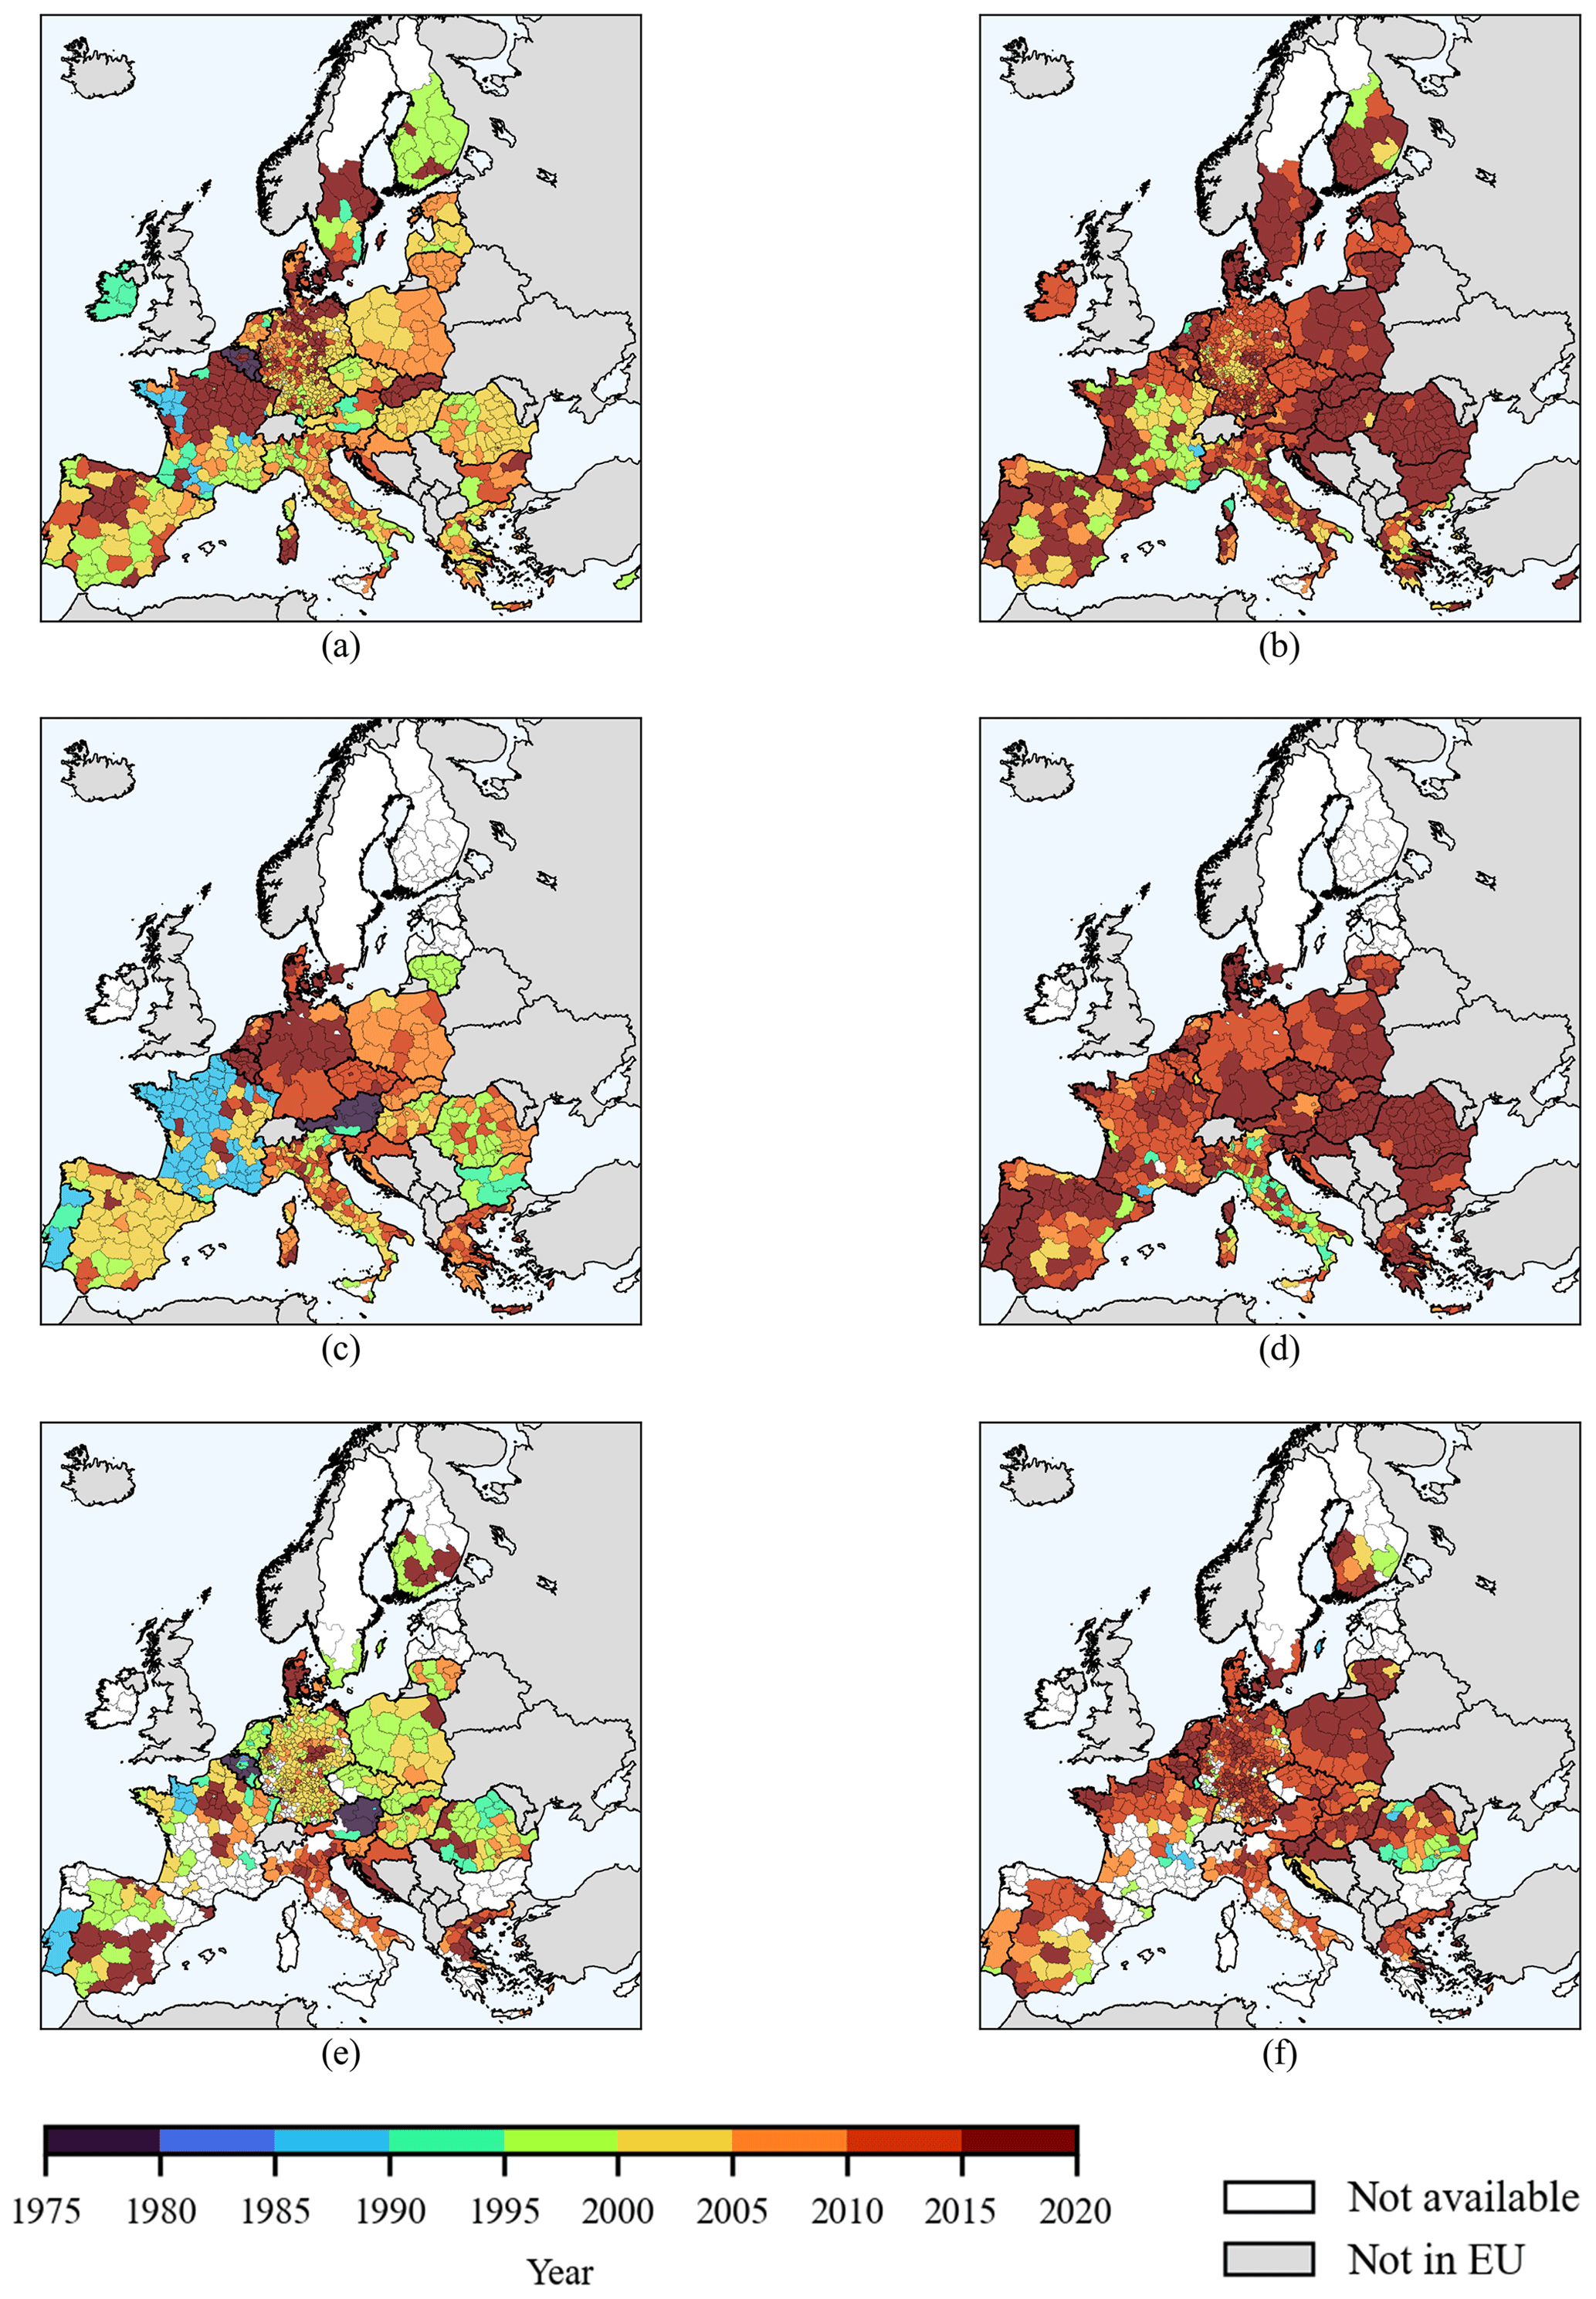
Figure 6Years when the lowest (a, c, and e) and highest (b, d, and f) yield values that occurred for each region for the crops soft wheat (a, b), grain maize (c, d), and sugar beet (e, f).
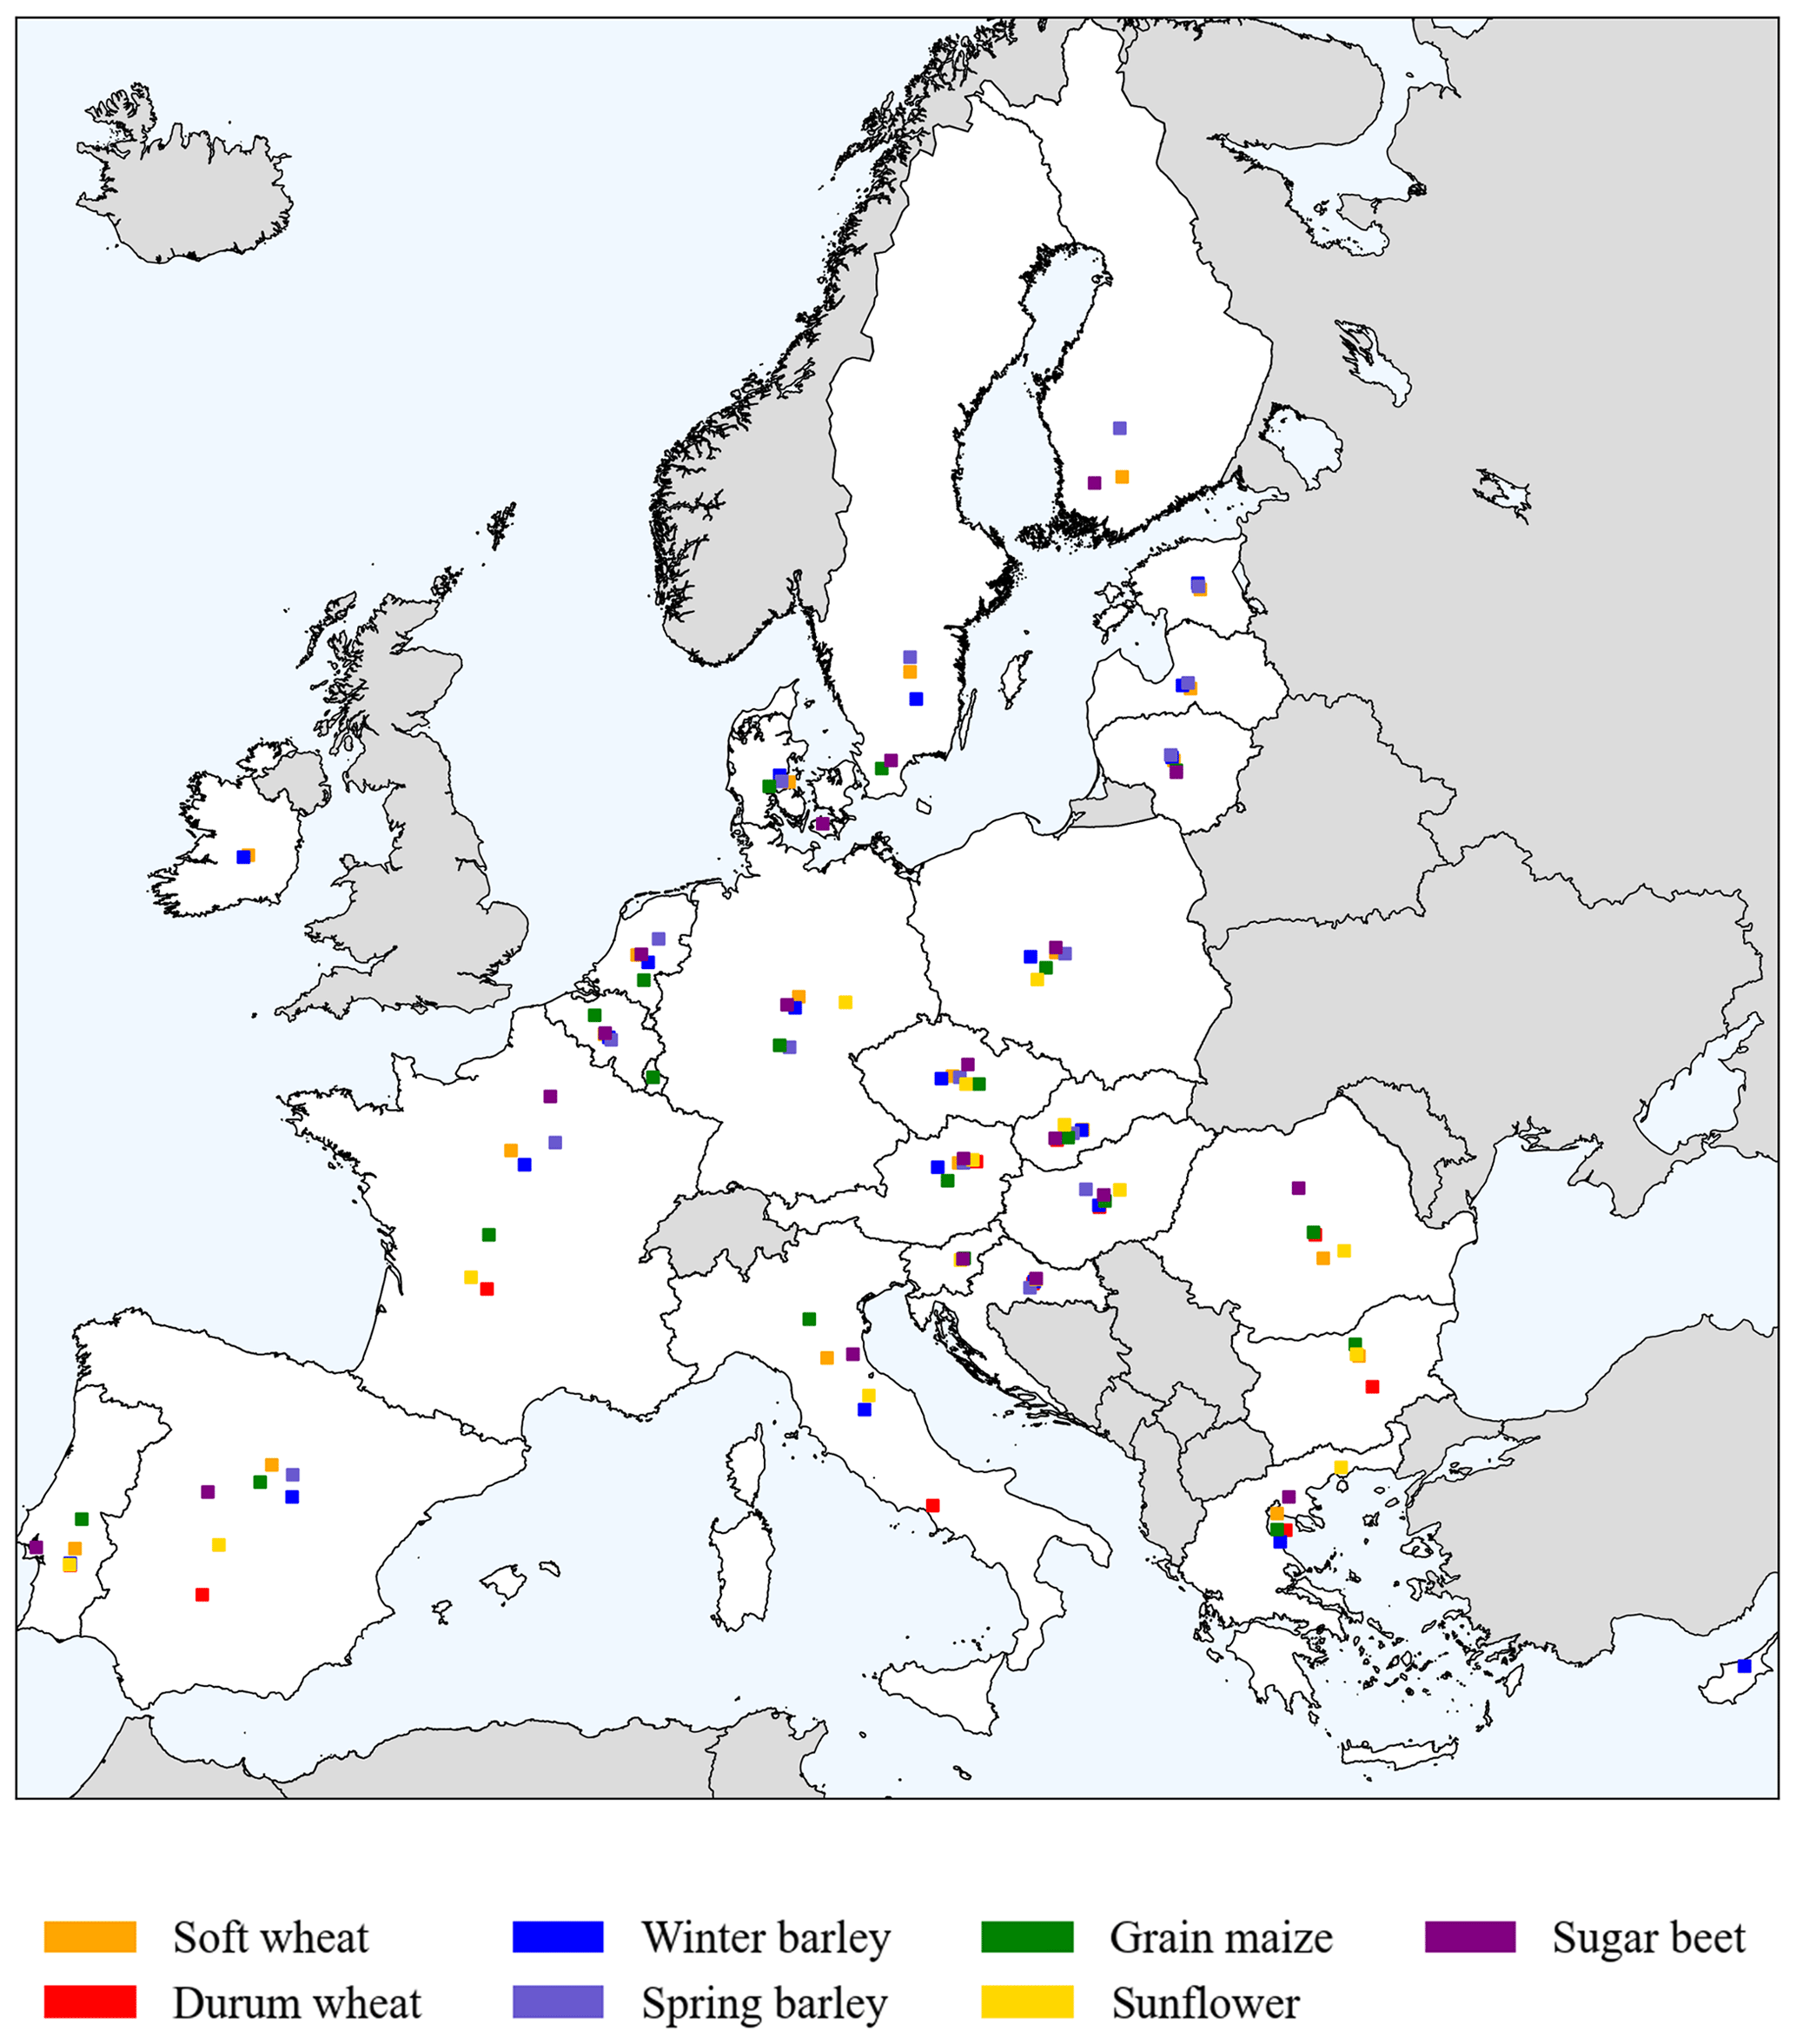
Figure 7Spatial representation of crop production centroids within each country in the time period 2000–2020.
4.1 Potential uses of this dataset
In order to highlight the novelty and significance of this dataset, some potential uses are presented below and discussed. The reported analyses exploit the major strengths of this dataset, including the fine spatial resolution of the data and the length, completeness, and coherence of the time series.
4.1.1 Lowest and highest yielding years
Crop statistics included in this dataset cover a long time range, from 1975 to 2020, to allow time series analysis. In this study, we performed a simple analysis, selecting for each region and crop the years when the lowest and highest yield values occurred. Results for soft wheat, grain maize, and sugar beet are reported in Fig. 6. No detrending procedure was computed on yield values. Therefore, in regions where an important trend component related to the improvement of agro-management practices exists (García-Condado et al., 2019; Ceglar et al., 2016; Finger, 2010), the highest yield values were observed (Fig. 6, right) in the most recent years (i.e., from 2016 to 2020), while the lowest yield values were registered at the beginning of the time series, mostly in the early 2000s (Fig. 6, left). This is particularly evident in eastern and northeastern EU countries, including Bulgaria, Romania, Hungary, Slovakia, Poland, and Lithuania. In the other MSs, improvements in agronomic techniques and management practices have less impact on crop yields (Ronchetti et al., 2023a), which are more dependent on climate and weather conditions within the season. Trend effects on yield values are low, and in these countries the interannual variability of the yields is high. Thus, the years when the highest and lowest yield values occurred are heterogeneous, vary from region to region, and cover the whole time range. The maps on the left of Fig. 6 can also reveal extreme years whose unfavorable conditions have affected crops and led to low yield values. The most outstanding one is the year 2016 in France for soft wheat (Fig. 6a), when a combination of factors caused the most severe yield loss in over half a century in one of the leading wheat-producing regions of Europe (Nóia Júnior et al., 2023; Ben-Ari et al., 2018). This exceptional yield decline is well depicted on the map, with dark-red colors extending throughout the northeasternmost administrative units of France. Similarly, in 2018, a severe summer drought affected summer crop yields in central and eastern Europe (Beillouin et al., 2020; Webber et al., 2020). As a consequence, 2018 was the year when the lowest yield values for grain maize occurred in Germany and Belgium, as represented in Fig. 6c. Furthermore, these maps show that the distribution of the yields does not necessarily follow national boundaries, but often there are clusters of regions with similar behavior in neighboring states. Weather conditions, soil types, agronomic practices, and historical factors have determined clusters of agricultural regions that do not coincide with national borders (Guth and Smędzik-Ambroży, 2020; Guiomar et al., 2018; Reiff et al., 2018). Regions in Poland are the most evident case: the western regions tend to be uniform with eastern German regions, whereas the eastern Polish regions create an agronomic cluster with the Baltic.
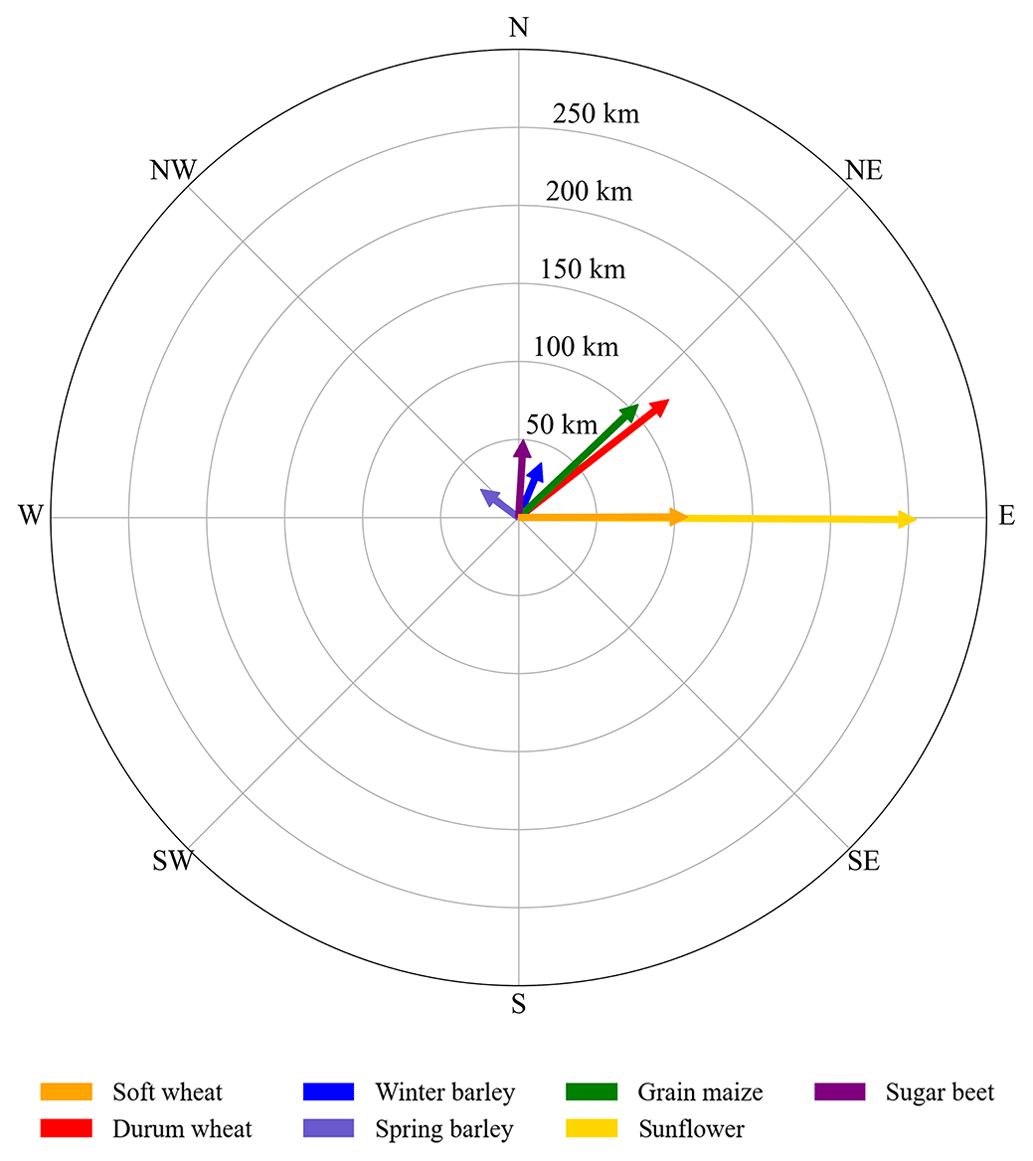
Figure 8Displacement vectors representing the shifts of production centroids for each crop in the EU from the first to second decades of the 2000s.
4.1.2 Crop production zones and shifts
In this dataset, crop statistics are reported at the finest spatial detail available, i.e., a subnational administrative distribution. This allows us to perform analyses and comparisons within each country and to assess the intercountry spatial distribution of crop production. Figure 7 shows the spatial distribution of crop production centroids within each country in the time period 2000–2020. To produce the map, we first selected production statistics for the period of interest and computed the average for each subnational unit, and then we extracted geometric centroids for each subnational unit. Finally, crop production centroids for each country were calculated as the weighted aggregation of subnational centroids using production averages as weights. The resulting map represents the spatial distribution of the production for each crop in the different countries. In some countries, including central and northeastern Europe (e.g., Czechia, Slovakia, Poland, Lithuania, Latvia, or Estonia), production centroids for the different crops are located in the same area, roughly corresponding to the geometric centroids of the country. This can suggest that all subnational units almost equally concur with national crop production and that there are few regions making a greater contribution (Joint Research Centre, 2023; Lennert and Farkas, 2020; Rega et al., 2020; López-Lozano et al., 2015). In Finland, Denmark, Sweden, and Austria, the map shows the presence of agriculturally active regions, as production centroids are centered on a small area that does not correspond to the geometric centroids (Peltonen-Sainio and Jauhiainen, 2020; Jørgensen et al., 2019; Piikki and Söderström, 2019; Stürmer et al., 2013). In the remaining parts of these countries, agricultural activities are limited by mountains, forests, and non-favorable climatic conditions. Finally, in wide and/or north–south-oriented European countries, including Spain, France, Italy, Germany, and Romania, crop production centroids are widespread over the country, with crops located in their most productive regions in each country (Ballot et al., 2023; Schmitt et al., 2022; d'Andrimont et al., 2021; Ribeiro et al., 2020). As an example, in Italy, the durum wheat centroid is located in the south, while the grain maize centroid is located in the north in the middle of Pianura Padana. In Spain, all the crop centroids are distributed around the Castilla y Leon region, with the exception of the durum wheat centroid, which is shifted in the south close to the Andalusia region. In France, centroids for soft wheat, barley, and sugar beet are located in the northeastern part of the country, while the centroids for grain maize, sunflower, and durum wheat are located in the western and southwestern regions.
By exploiting both the fine spatial resolution of data and the length and completeness of time series, we performed an analysis of the distribution of crop production zones in the EU and their evolution and changes in time. First, we divided the dataset into two parts, the first one including statistics from 2000 to 2009 and the second one including statistics from 2010 to 2019. Then, following the approach above, we calculated the average production in both time periods and computed crop production centroids for the EU for both time periods as the weighted average of each regional centroid using crop production averages as weights. Finally, we compared the two centroids and generated the displacement vectors as the difference between crop production centroids of the second and first time periods. Results are displayed in the polar plot of Fig. 8. These vectors represent the shift in production in the EU in a 10-year time frame for each crop. Overall, the prevalent directions of vectors are from northwest to east, testifying to an increasing contribution of northern and eastern EU MSs to European agricultural production. The lowest shifts (i.e., a rate equal to 5 km yr−1) are reported for spring barley, winter barley, and sugar beet, mostly northward. The greatest displacements are observed for sunflower, followed by durum wheat, grain maize, and soft wheat. For sunflower, the production shift follows a rate of 25 km yr−1 in the easterly direction due to continuously growing production in Romania, Hungary, and Bulgaria. These countries jointly accounted for 70 % of the total European sunflower production in 2019 and almost 53 % in 2009. Likewise, the vector for soft wheat points towards an easterly direction at a rate of 10 km yr−1. For soft wheat, an increasing contribution of eastern and northeastern European states, such as Romania and Poland but also Baltic states, is highlighted. Similarly, Sloat et al. (2020) found a northward migration for wheat in eastern European countries. The production centroids of grain maize and durum wheat are also displaced by nearly 10 km yr−1 but northeastward. These crops, typically cultivated in southern Europe, including Spain, Italy, and France, are expanding more and more northeastward. Climate change is one of the causes of these shifts. Ceglar et al. (2019) pointed out that agro-climate zones are migrating northward and that the migrating rate is accelerating due to climate change. Crop production may shift northward because of larger suitability and more favorable climate conditions, while in southern Europe adverse conditions may affect crop production. In this scenario, southern regions, including the Mediterranean area, may lose suitability for growing specific crops in favor of northern European regions (Ceglar et al., 2019; Fontana et al., 2015). Ceglar et al. observed a migration velocity of agro-climate zones northward of 100 km per 10 years solely using agro-meteorological indicators, while we find results comparable in magnitude through the analysis of crop statistics for grain maize and durum wheat. In addition, we show production shifts not mediated by climate but rather by economic opportunity, largely in eastern Europe, as illustrated by the high eastward shift rate of sunflower production. Hence, the completeness of the subnational crop statistics presented here can be of help in revealing changes in agricultural cultivation zones due to various concurring factors with subsequent crop production impacts.
4.2 Outlook and recommendations
In SAIO, MSs will have to report crop statistics on area and production before 30 September the year after (N+1). Guidance is given on how the reporting should be done, e.g., in terms of clean, dry weight of grains at the standard market humidity level in the country (Eurostat, 2015a). The national standard humidity level needs to be reported too for possible recalculations to standardized EU values. For sugar beet, MSs will have to provide data on the sugar content of the harvested production. SAIO will improve subnational crop statistics in the EU considerably. A few practical recommendations have been identified during the progress of this study, which we list here and which should improve the reporting and use of future statistics.
-
Mapping to a common legend. There is no integral publication available on how MSs match their national crop legends in national languages in their reporting to the harmonized EUROSTAT crop legend (Eurostat, 2020). While several newer MSs have adopted their national reporting to the EUROSTAT crop legend, older MSs have not. Since all MSs must go through this exercise, this information should exist and the availability of such a document would be very valuable. We provide such a (re-engineered) list in the ancillary file Mapping_eurostat_legend.xlsx included in our data repository (see Sect. 5).
-
Adherence to the latest NUTS version. In reporting to EUROSTAT, MSs should use the latest and most up-to-date NUTS version.
-
Clarity on reported data values. In SAIO, clarity has been created on the definition of area, and sown area is the area data that will be collected. This is often sourced from the farm-holding declarations in the MS IACS (Integrated Administration and Control System). We find that incoherence between area, production, and yield often arises from the fact that NSIs use harvested areas to calculate production and yield. In cases with those inconsistencies, the sown area is then not updated. Therefore, depending on the methodology MSs use to calculate harvested production, clarity should be provided on whether harvested area is used as part of the calculation.
-
Sharing common parameters. Reporting and using unequivocal standards on humidity and, if relevant, oil and sugar content
-
Updating past statistical data values. In the creation of this dataset, we also identified inconsistencies with respect to past statistics on area, production, and yield. An MS should make an effort to update the past statistical time series available at EUROSTAT. While SAIO will cover data from 2025 and onward, ideally, such an update would be an integrated exercise since the availability of such time series will underpin our capacity to improve the assessment and forecasting of the impact of extreme weather. Such information is essential for global forecasting systems, as is the case for the European Commission's Joint Research Centre (EC-JRC) MARS (Monitoring Agricultural Resources) Crop Yield Forecasting System (MCYFS, Van der Velde et al., 2019).
-
Promoting the use of automated data flows. While sourcing and reporting of crop statistics from MS to EUROSTAT has significantly improved in the last years, with standardized online forms facilitating this, ample room exists for the use of automated data flows. For instance, if each MS keeps a registry with a database of national and subnational crop statistics following standardized metadata, an application programming interface (API) could automatically source this information from NSI websites. This would improve the transparency and timeliness of reporting of crop statistics considerably, including for national and preliminary statistics.
The harmonized dataset of subnational crop statistics presented in this paper is available for download at https://doi.org/10.2905/685949ff-56de-4646-a8df-844b5bb5f835 (Ronchetti et al., 2023b) and is accessible with European Commission Authentication Service (ECAS) login. The data publication includes ancillary documentation along with the dataset to provide users with useful information for a deep understanding of the dataset and can be found here: https://agri4cast.jrc.ec.europa.eu/DataPortal/Resource_Files/SupportFiles/36/Allmetadata.zip (last access: 20 February 2024). The whole publication contains the following files.
-
AllCrops_subnstats_2023.csv: crop statistics dataset stored in CSV format. The complete list of attributes and fields included in the dataset is reported in Sect. 3.
-
ResourceInfo.pdf: document reporting a description of the whole data publication
-
Regional db Structure and Flagging system.pdf: document reporting a description of the structure of the dataset and details of the associated flagging system
-
Summary of the algorithm for disaggregation.pdf: document reporting a short summary of the procedures used for data harmonization
-
Mapping_eurostat_legend.xlsx: Excel file, including a set of tables reporting original crop classes in the original language and their mapping to the common EUROSTAT legend (Table 2) per country
-
Country_fiches.zip: compressed files containing a set of tables with summary statistics per MS and crop as well as Supplement figures mapping the number of records across the EU and the length of the time series for each of the area, yield, and production crop statistics for each MS.
This data paper presents a subnational dataset of crop statistics for major crops in the EU. The dataset includes harmonized subnational crop statistics on area, production, and yield, collected for the EU from National Statistical Institutes and the EUROSTAT REGIO database. Crop statistics are available for soft, durum, and total wheat, winter, spring, and total barley, grain maize, sunflower, and sugar beet, for a total of 344 282 reported values. A dedicated flagging system has been set for the dataset to provide users with more information on data quality and coherence.
The dataset requires frequent activities dedicated to maintaining and updating it, including efforts to provide complete time series at the finest available subnational level and for an increasing number of crops. Nonetheless, for the time being, this dataset can be considered a benchmark for subnational crop statistics in Europe and can serve as a reference for setting methodologies and indicators, including calibration and validation of agronomic models and crop yield forecasting systems, and many research studies will benefit from it. Among the potential uses of this dataset, in this paper we presented the effects of climate change on crop production by analyzing crop statistics only.
The number of records included in the dataset, the length of the time series, and the reported administrative level for each crop are presented here.
Table A1Number of records included in the dataset, the length of the time series, and the reported administrative level for the crop total wheat.
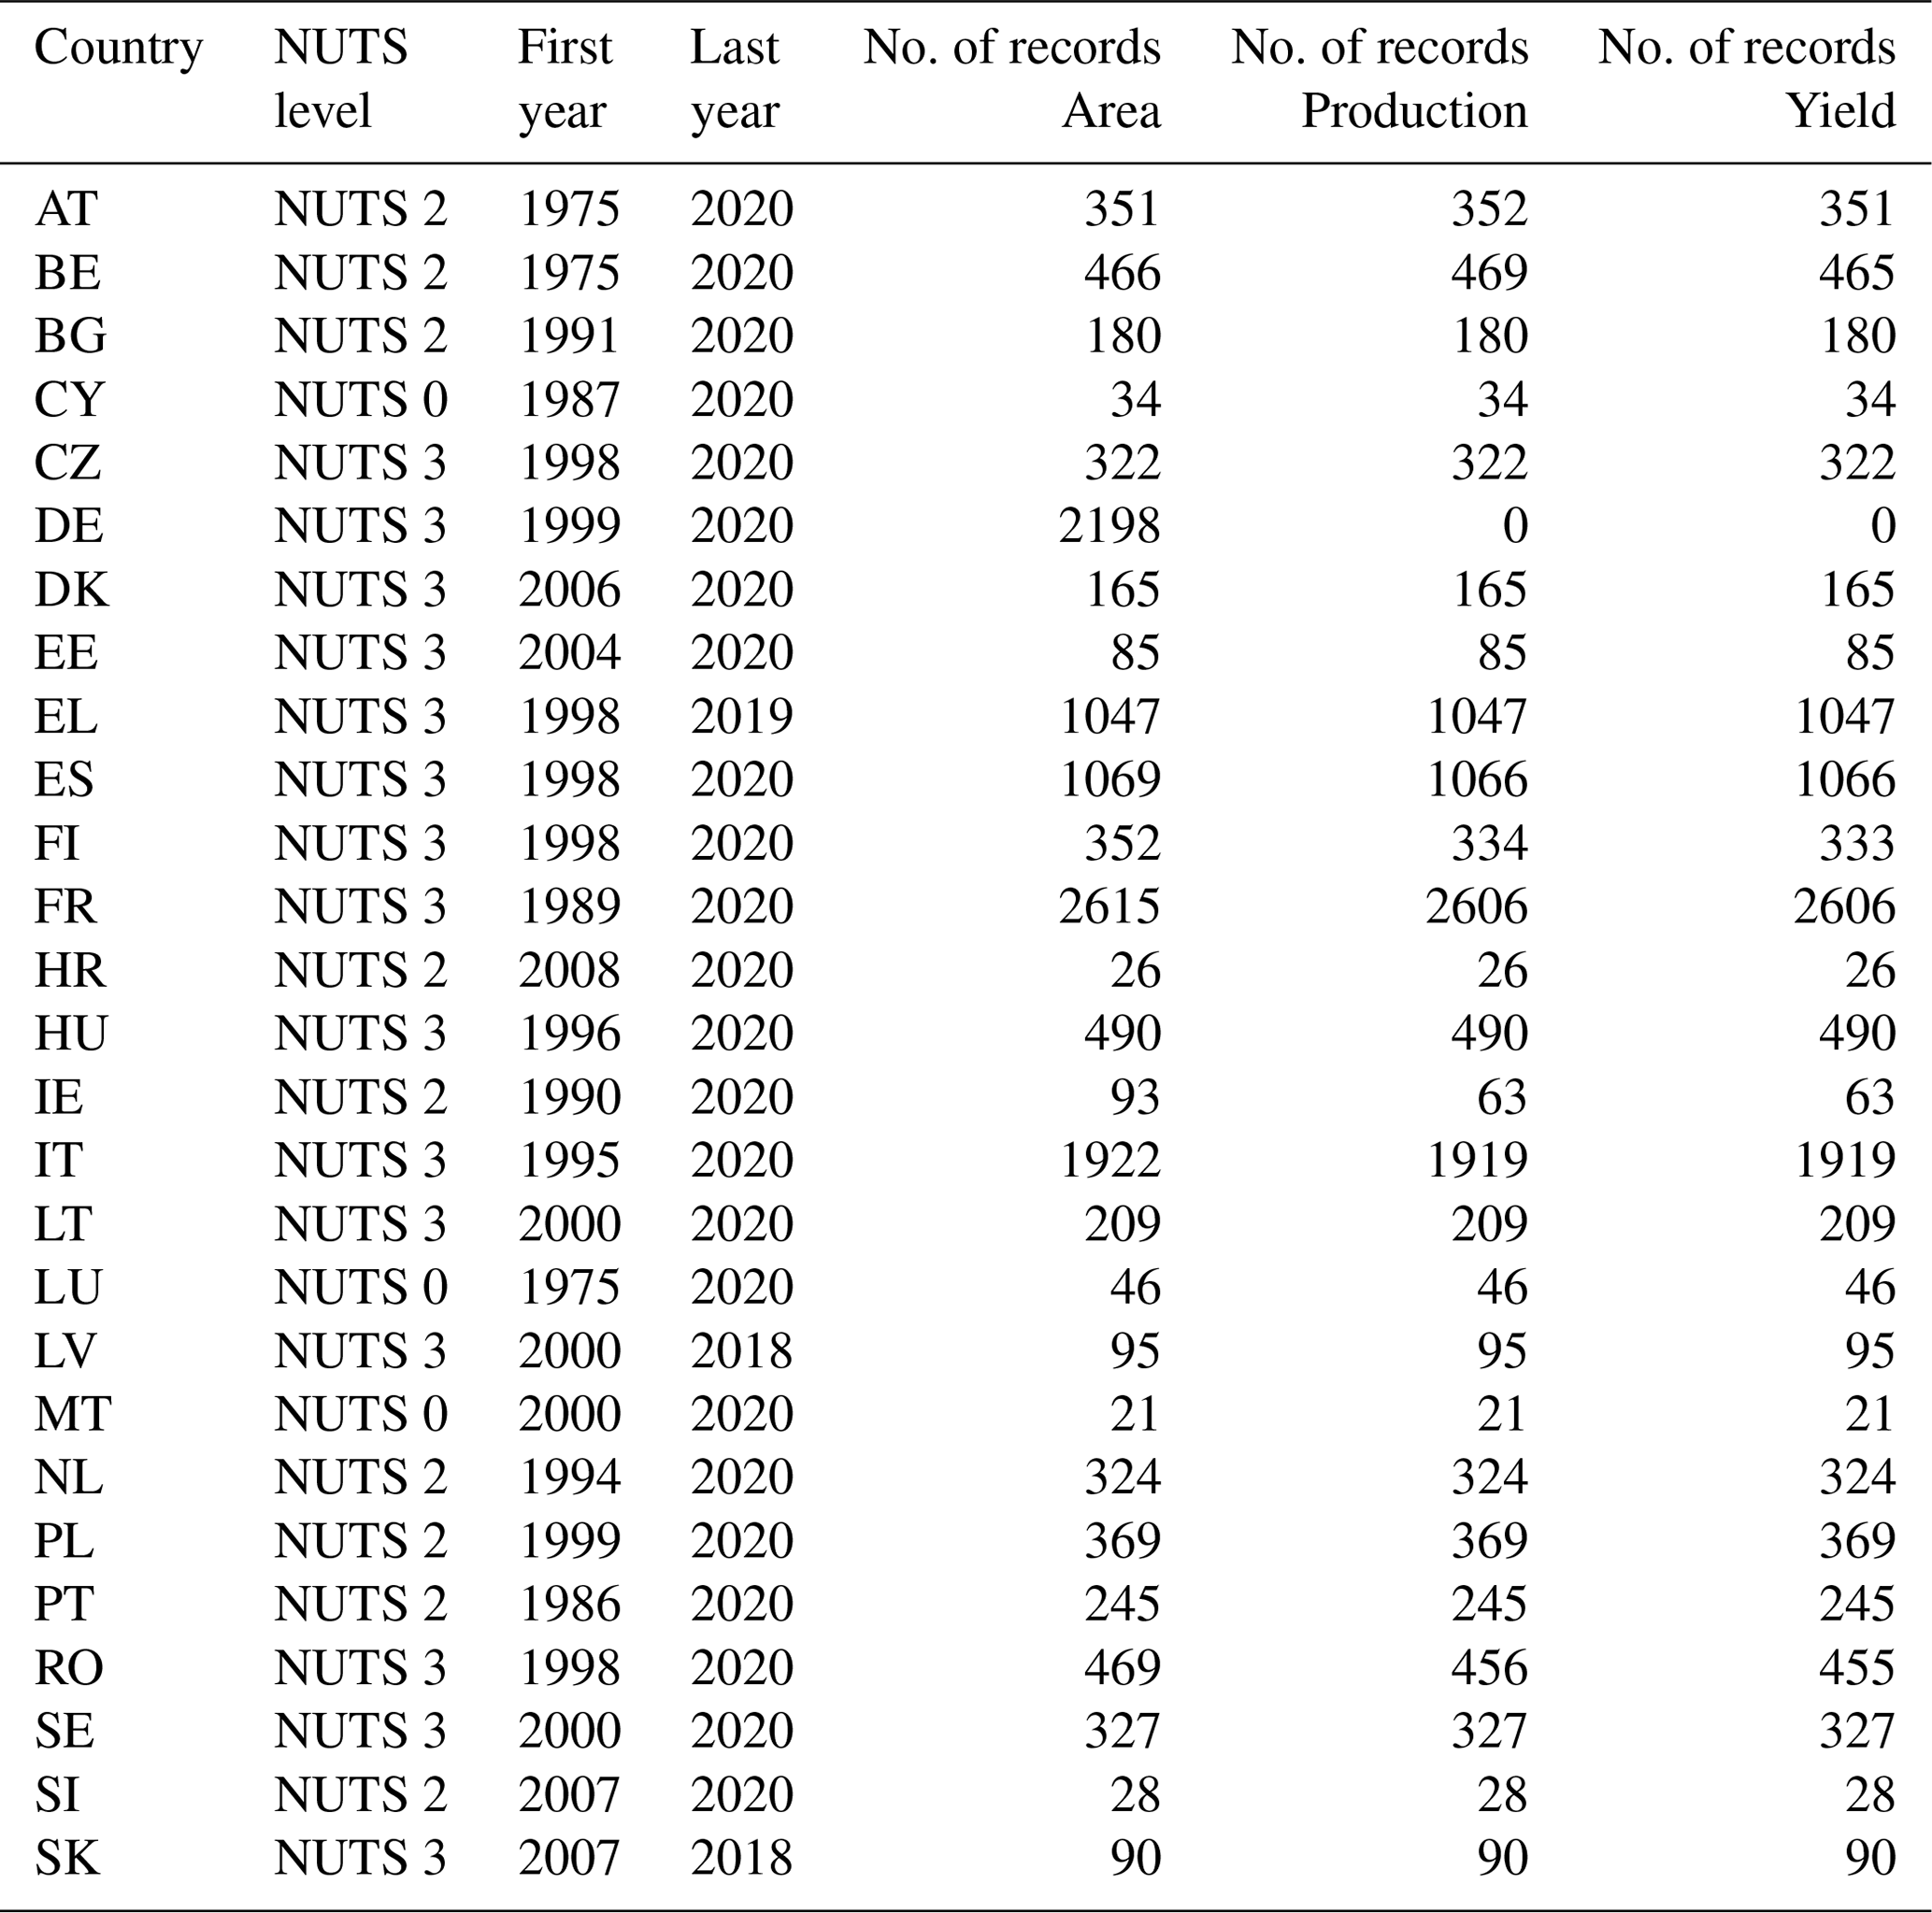
Table A2Number of records included in the dataset, the length of the time series, and the reported administrative level for the crop soft wheat.
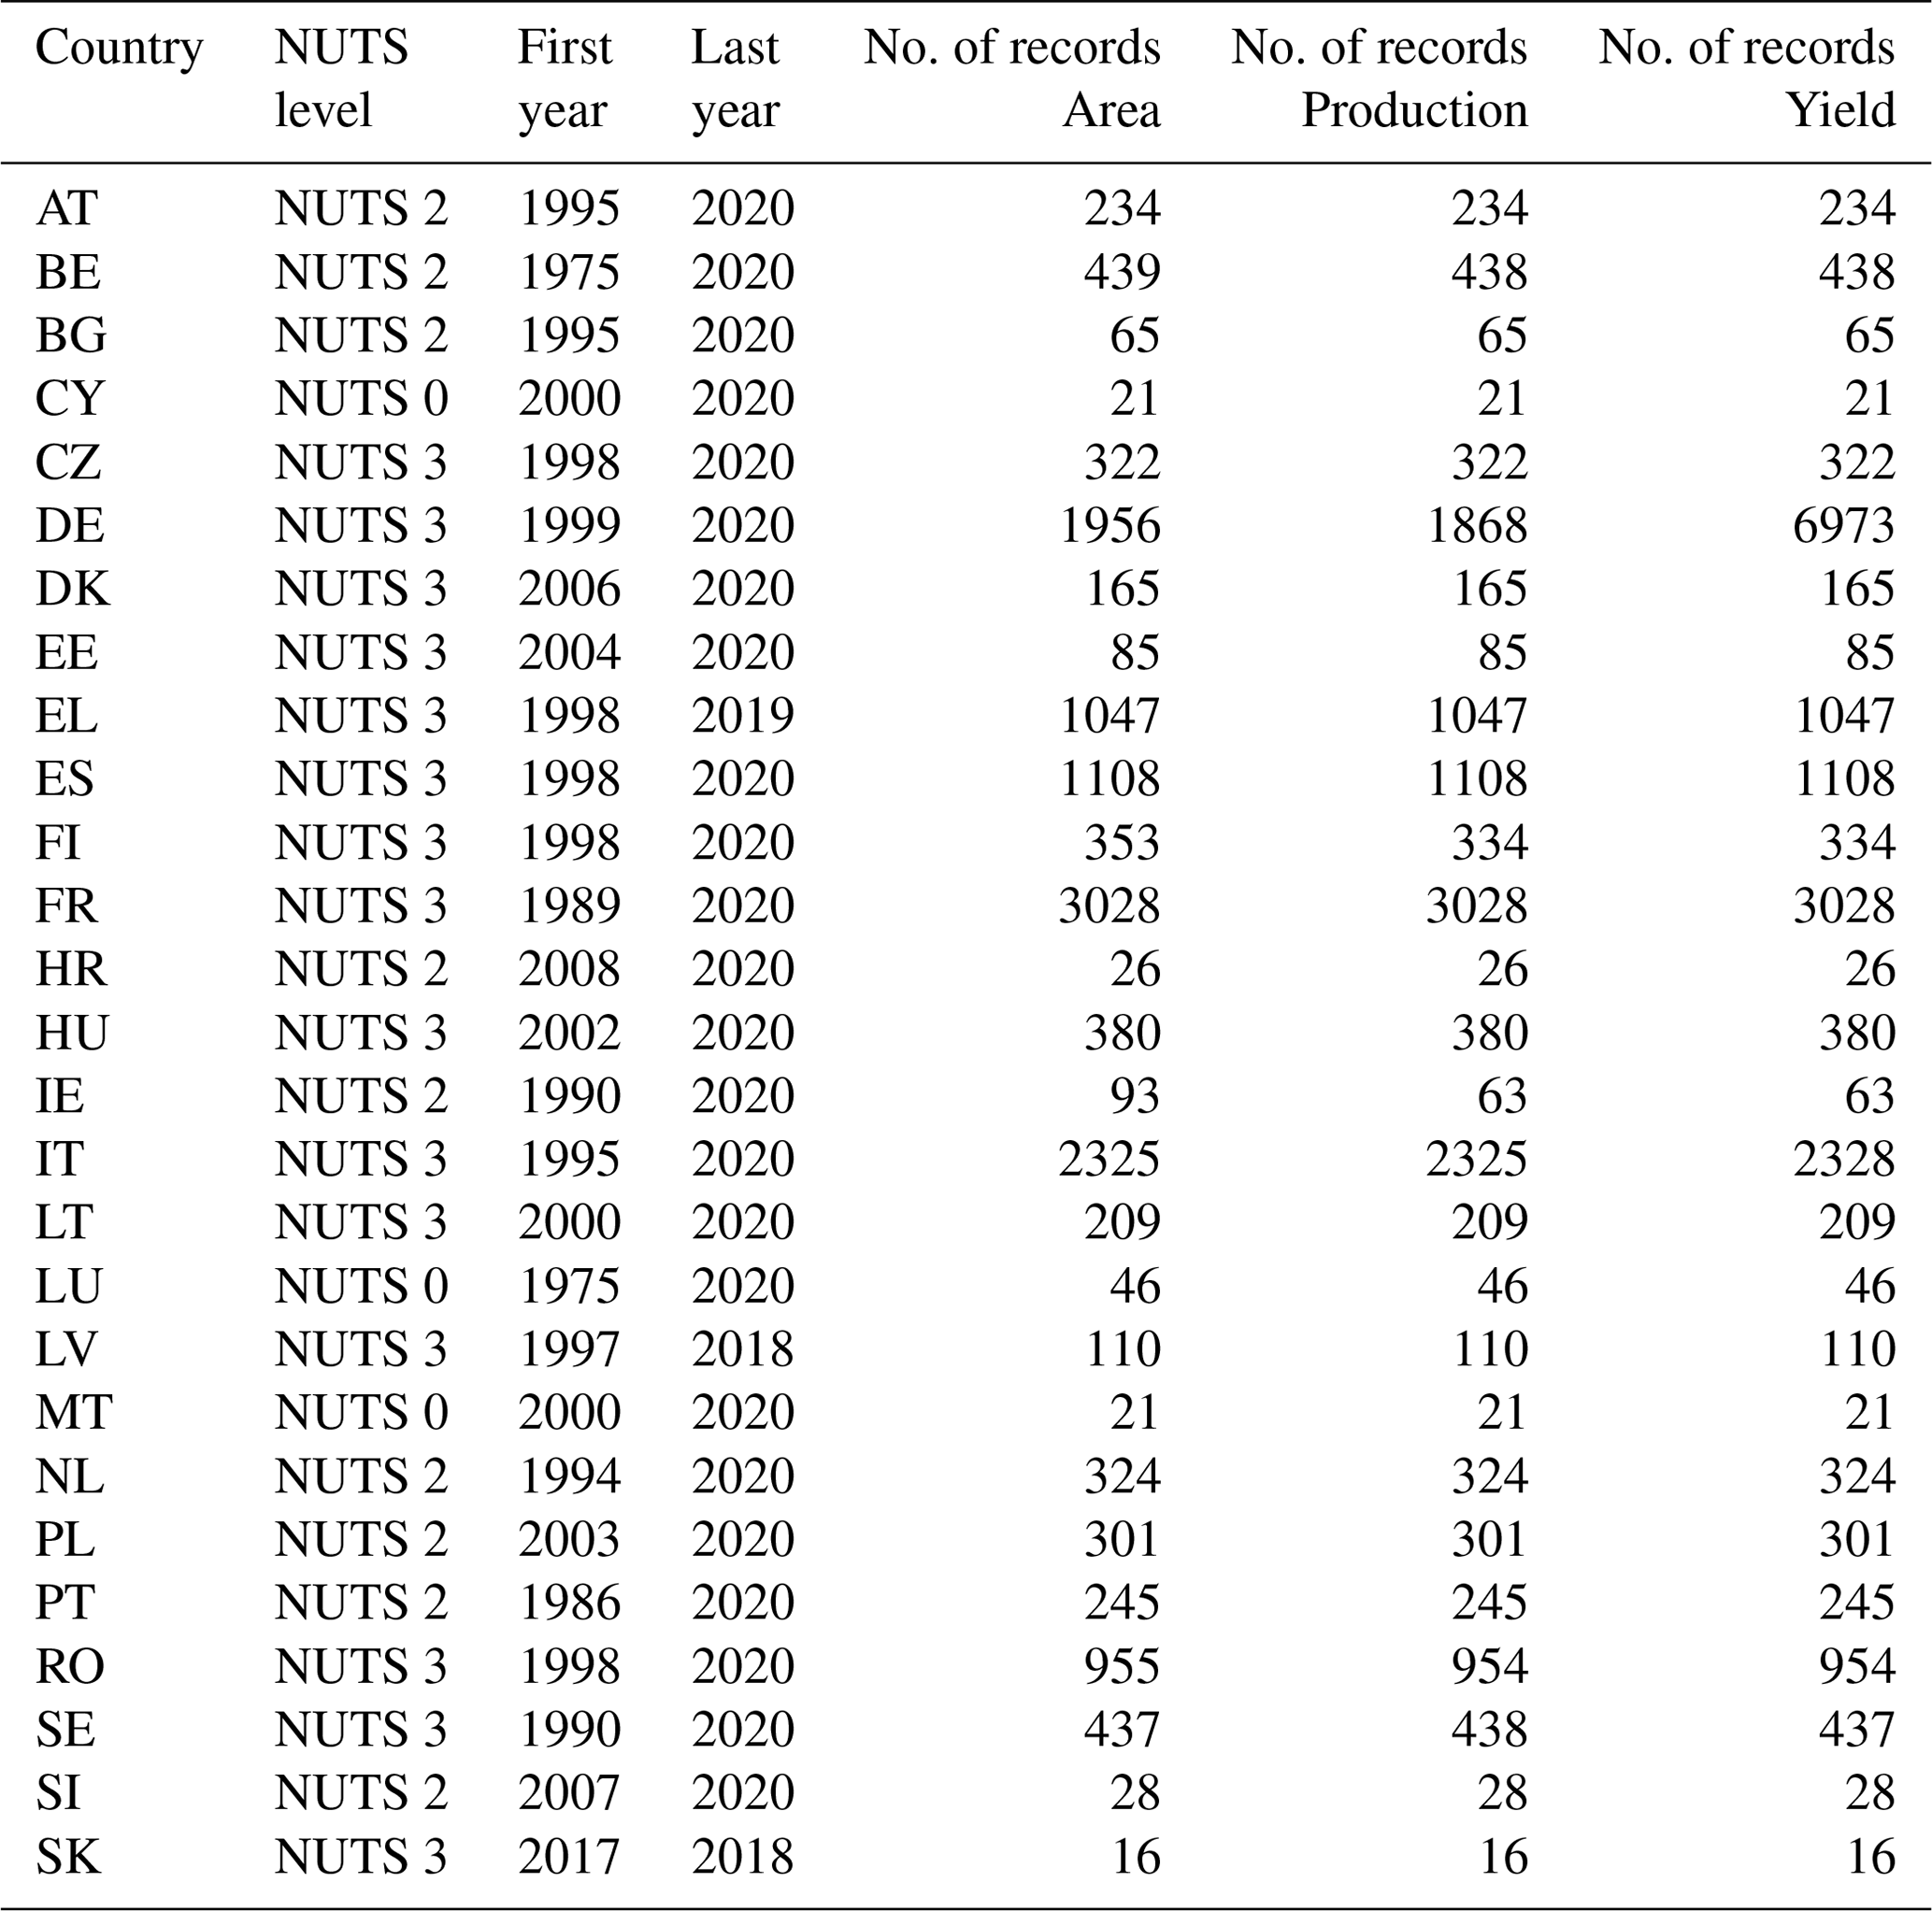
Table A3Number of records included in the dataset, the length of the time series, and the reported administrative level for the crop durum wheat.
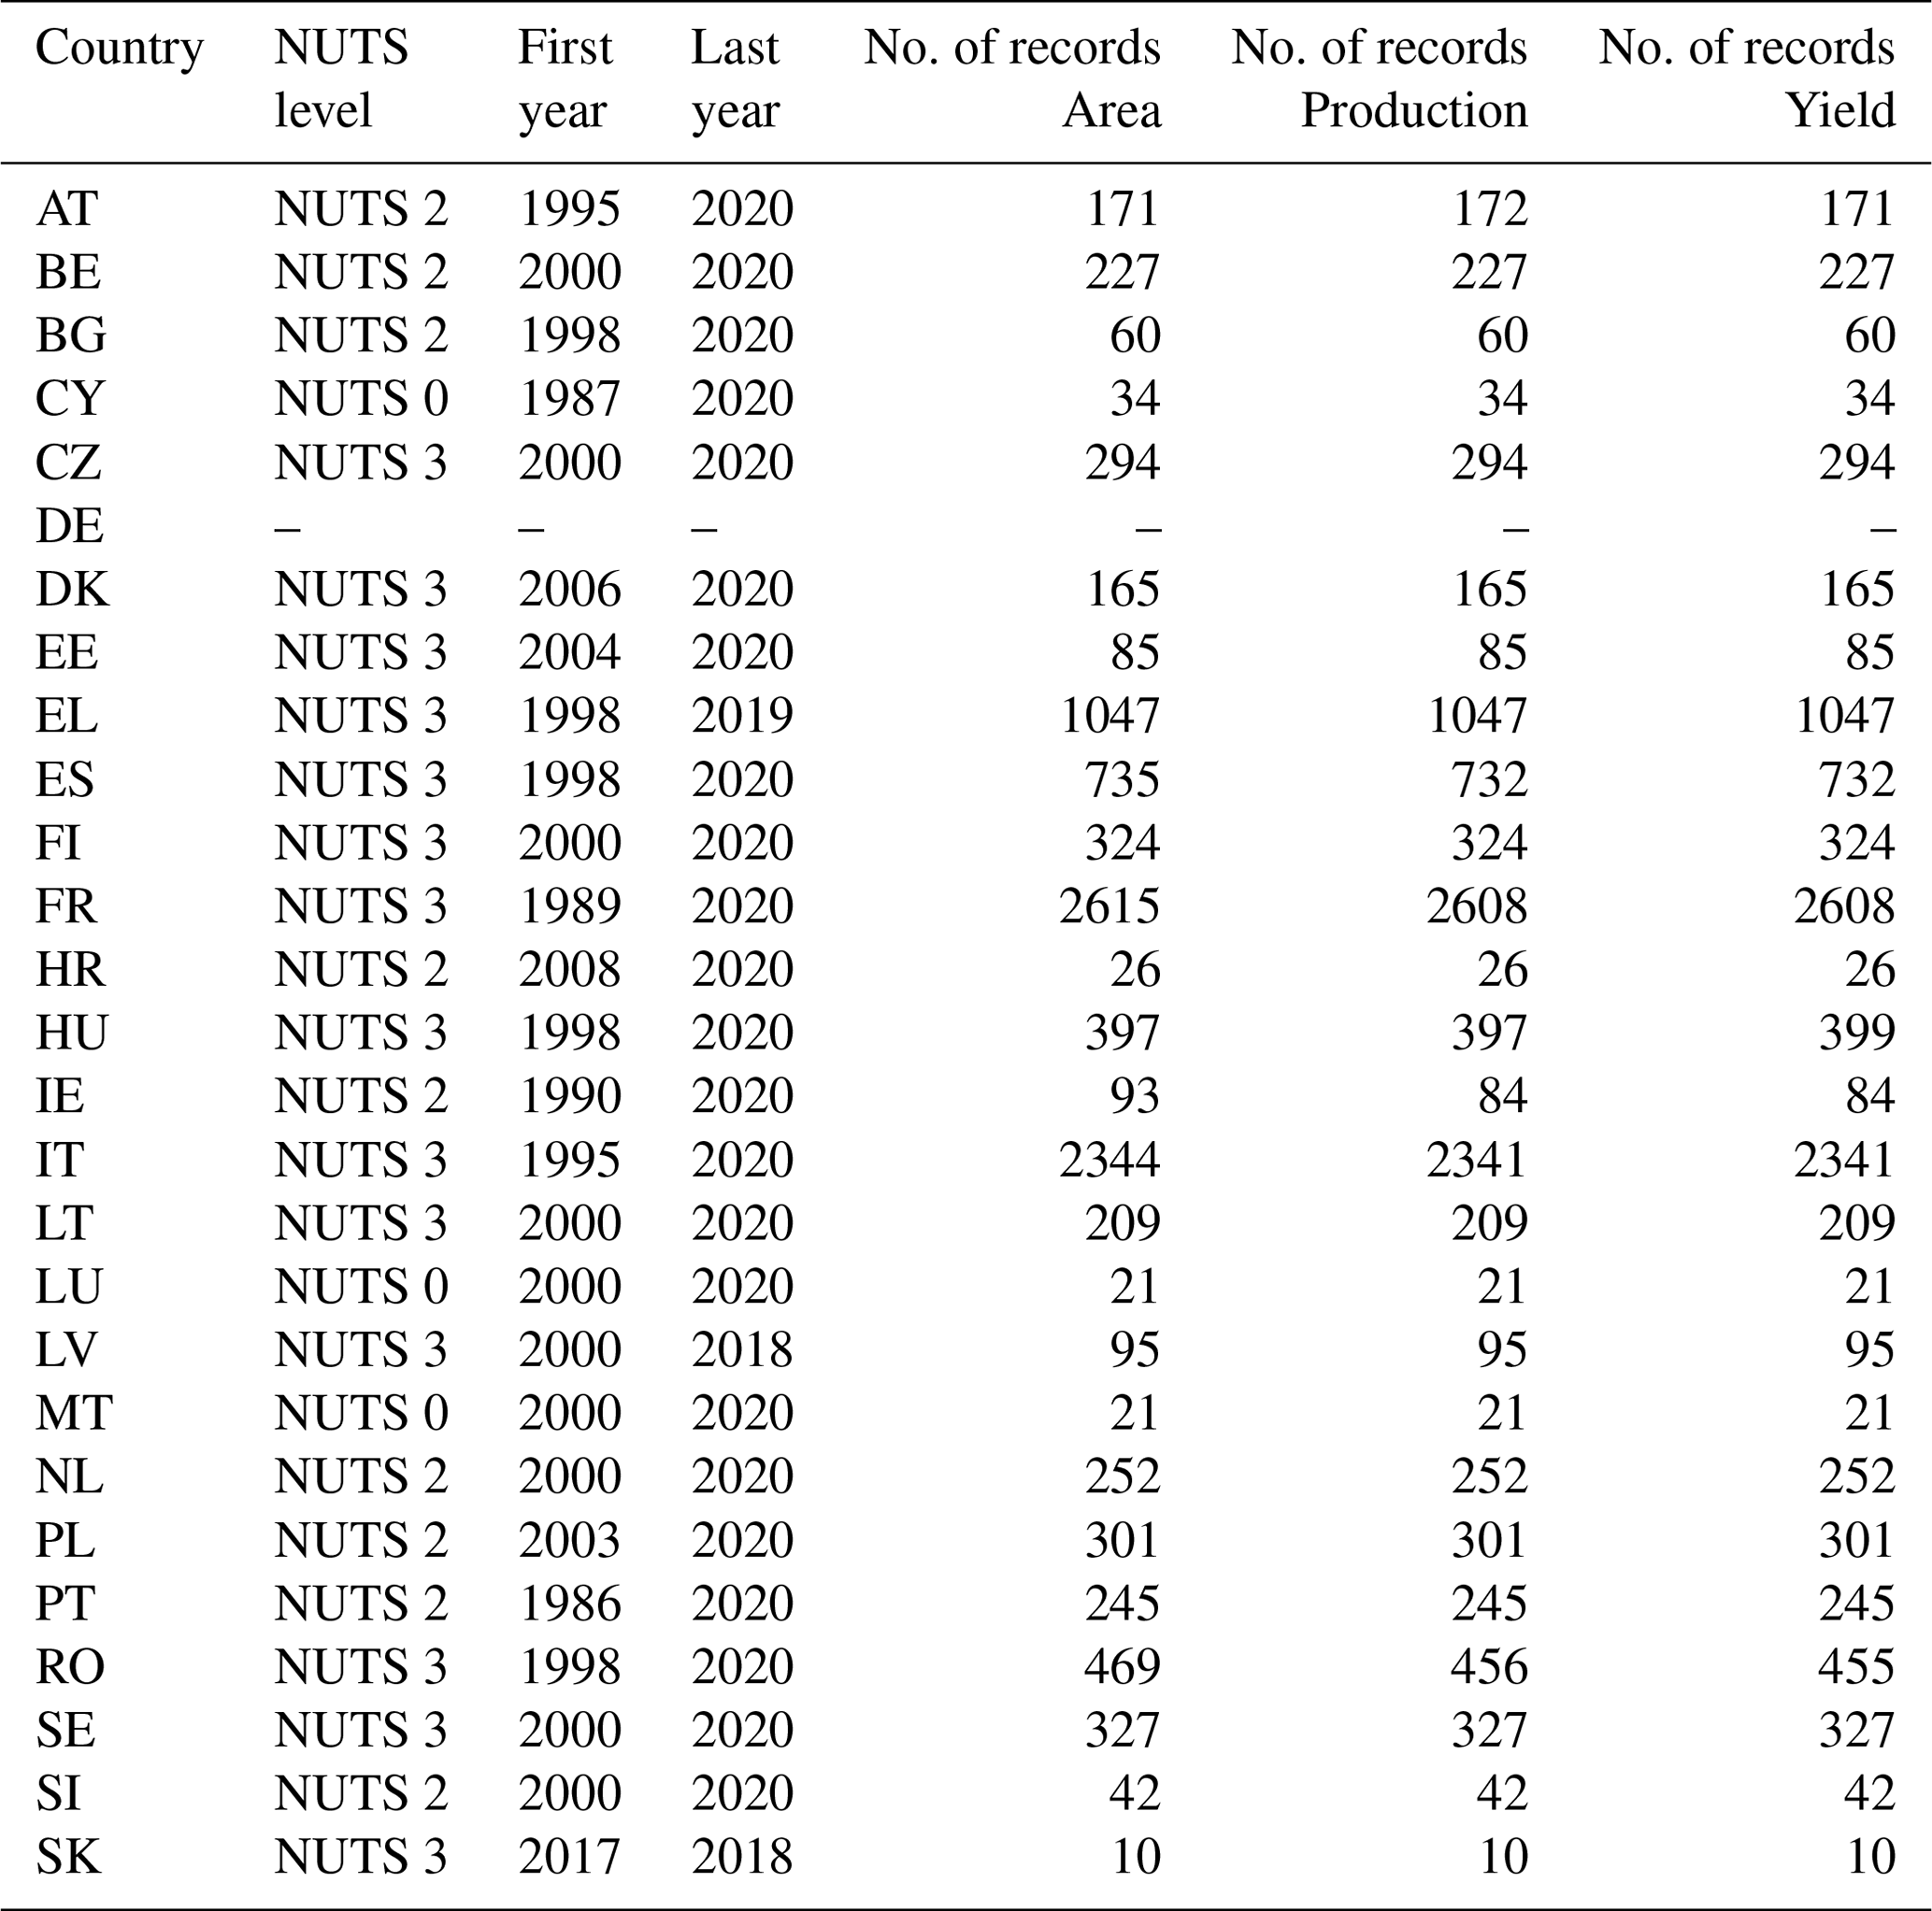
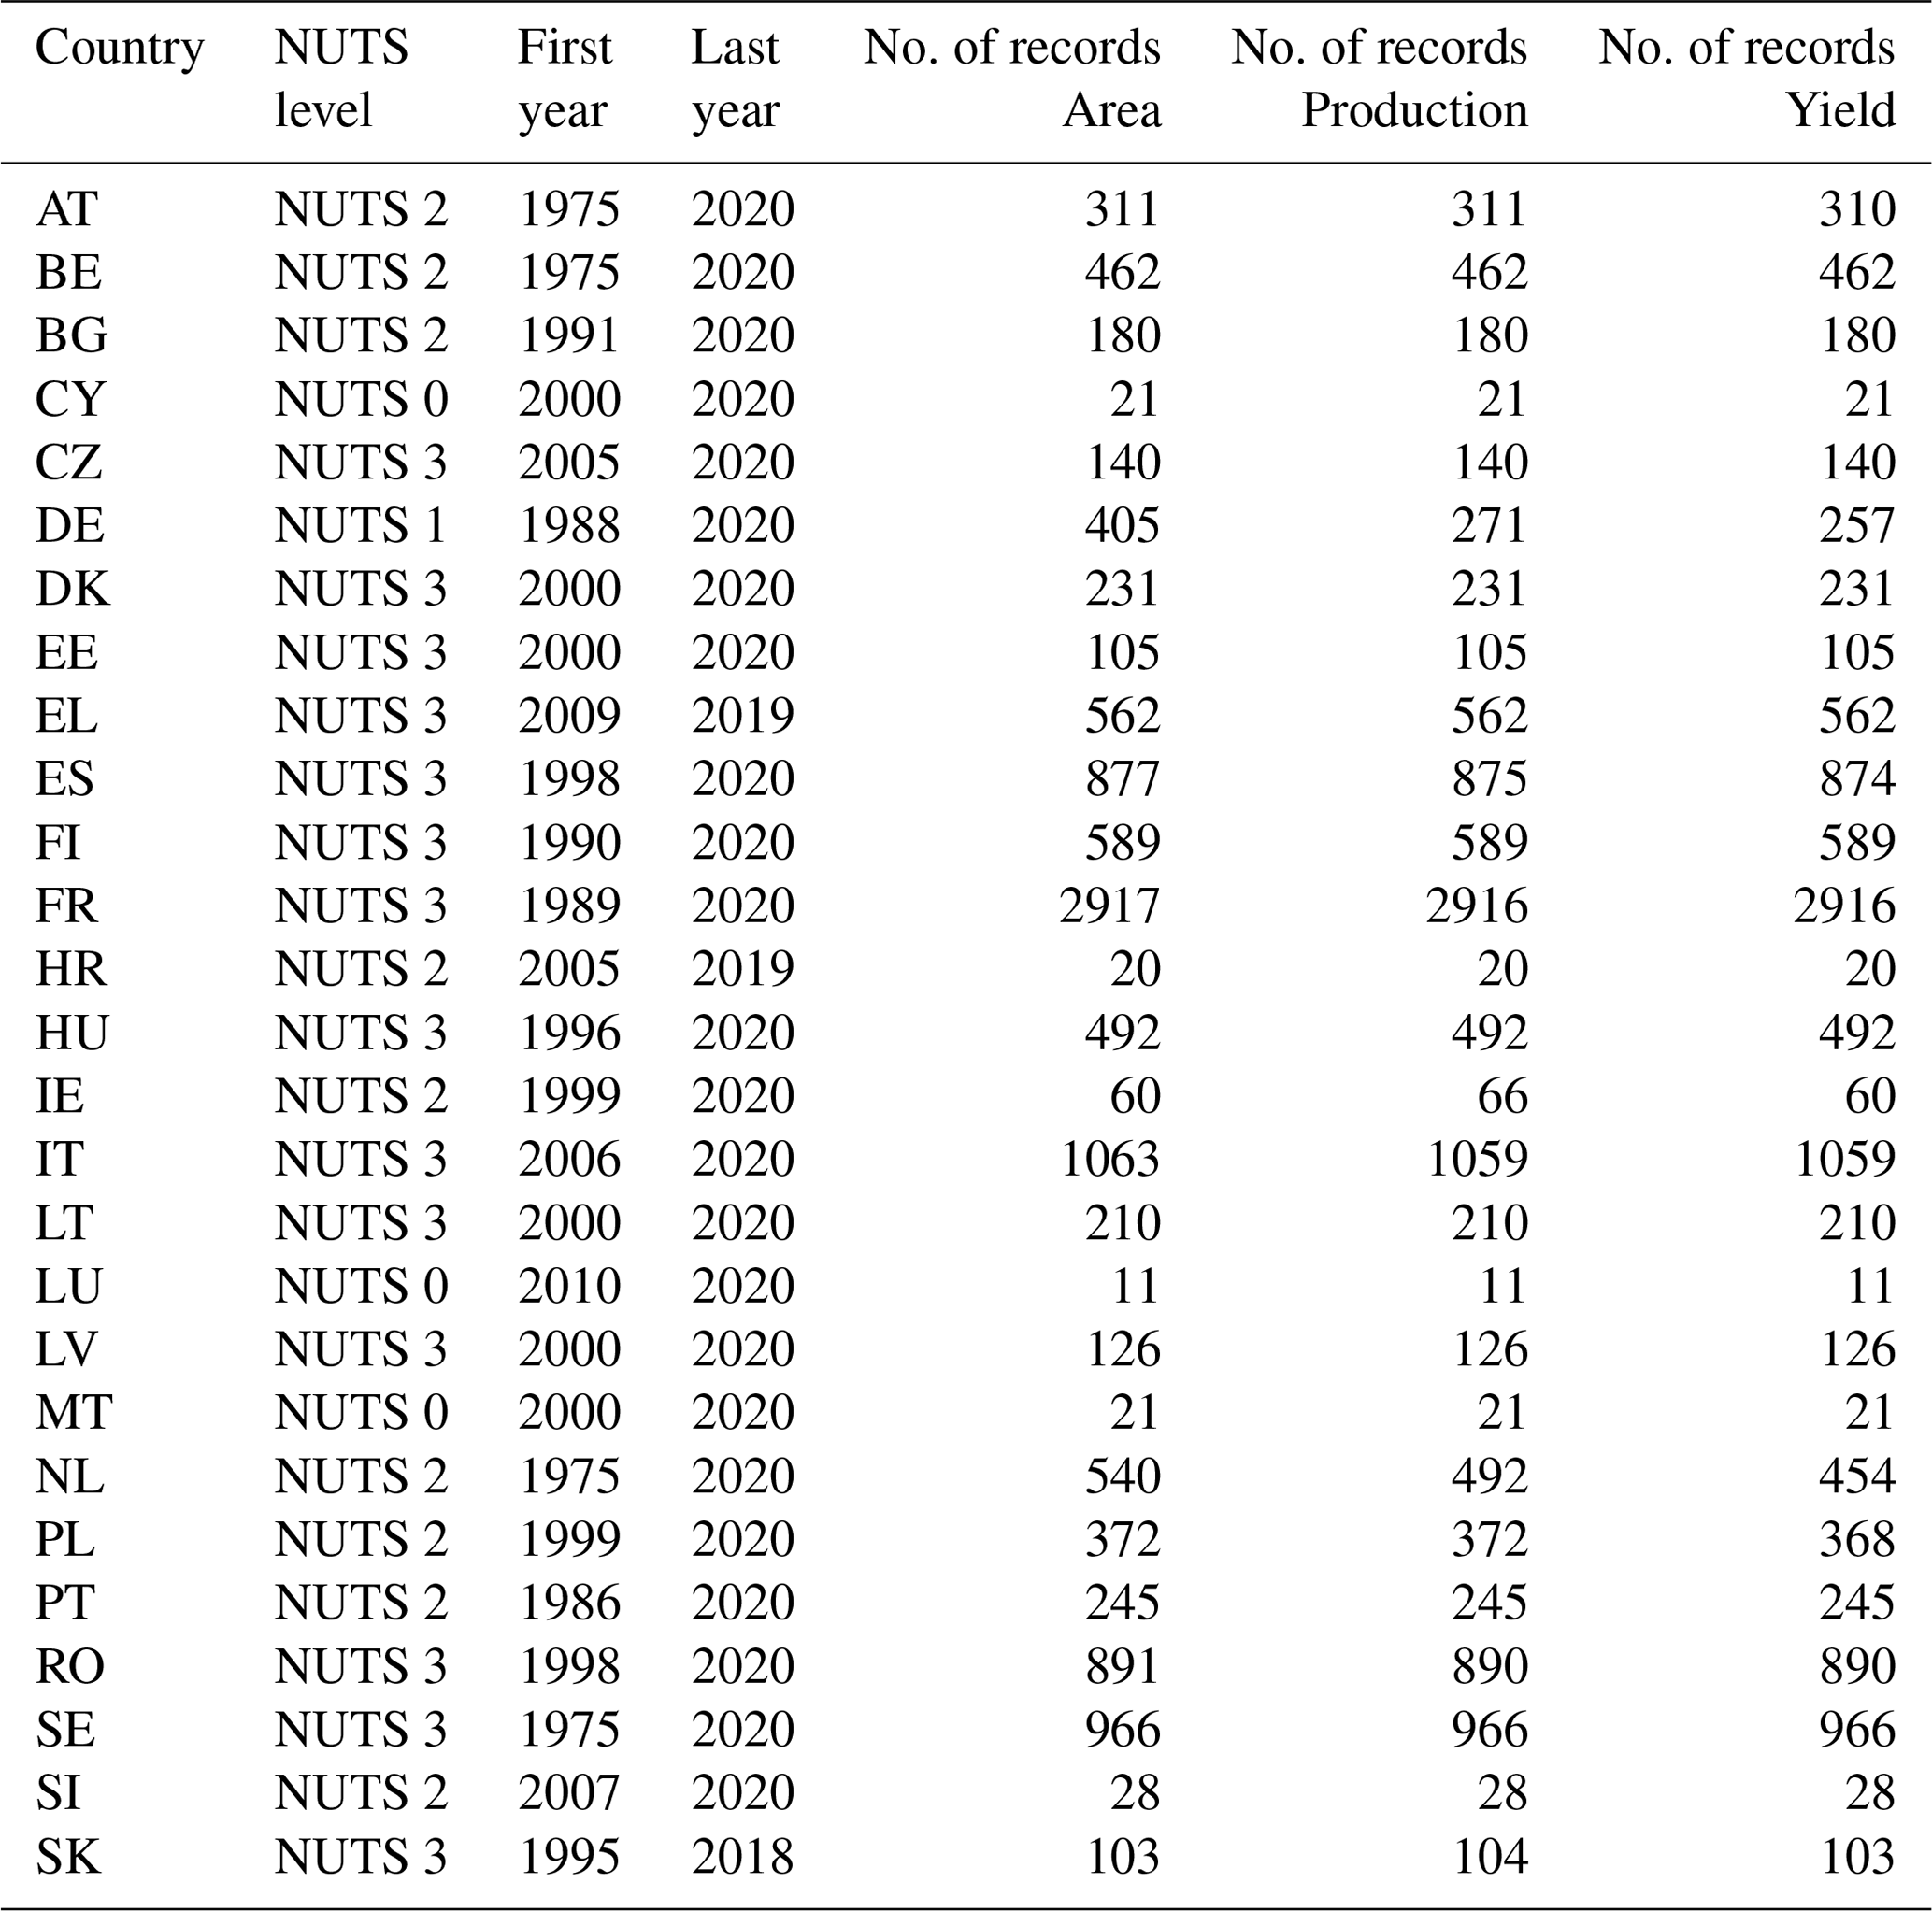
Table A4Number of records included in the dataset, the length of the time series, and the reported administrative level for the crop total barley.
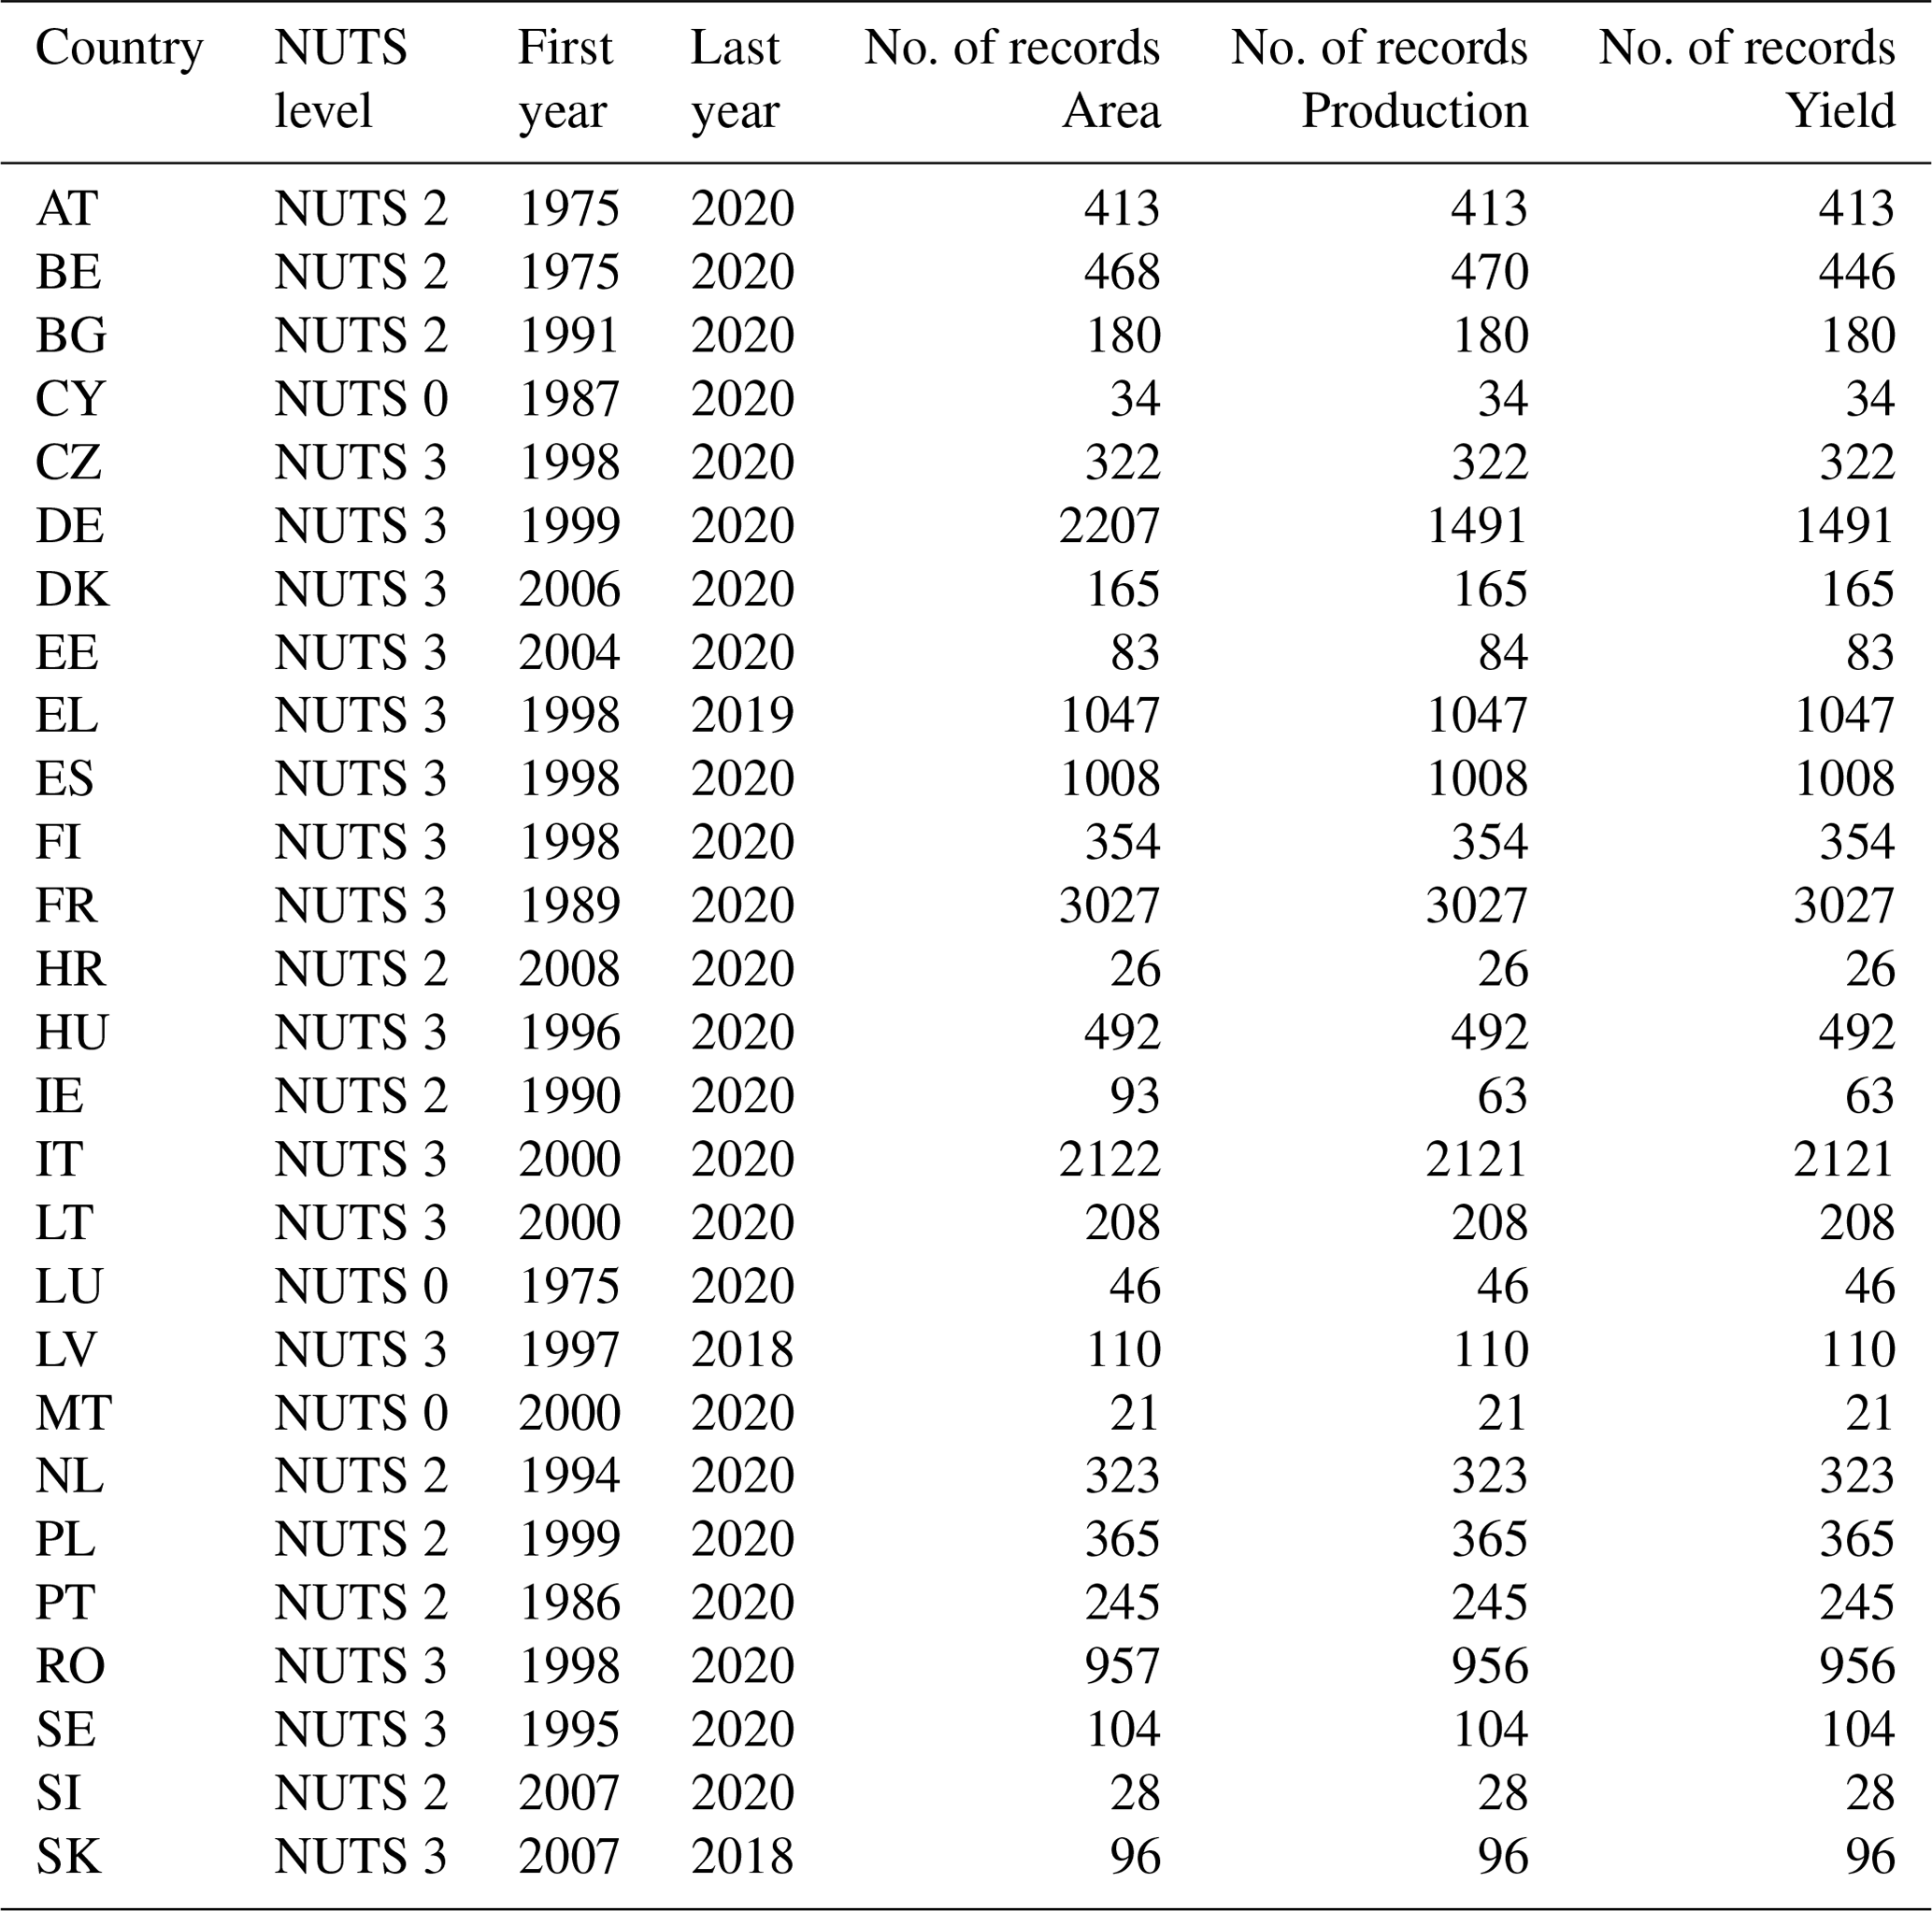
Table A5Number of records included in the dataset, the length of the time series, and the reported administrative level for the crop winter barley.
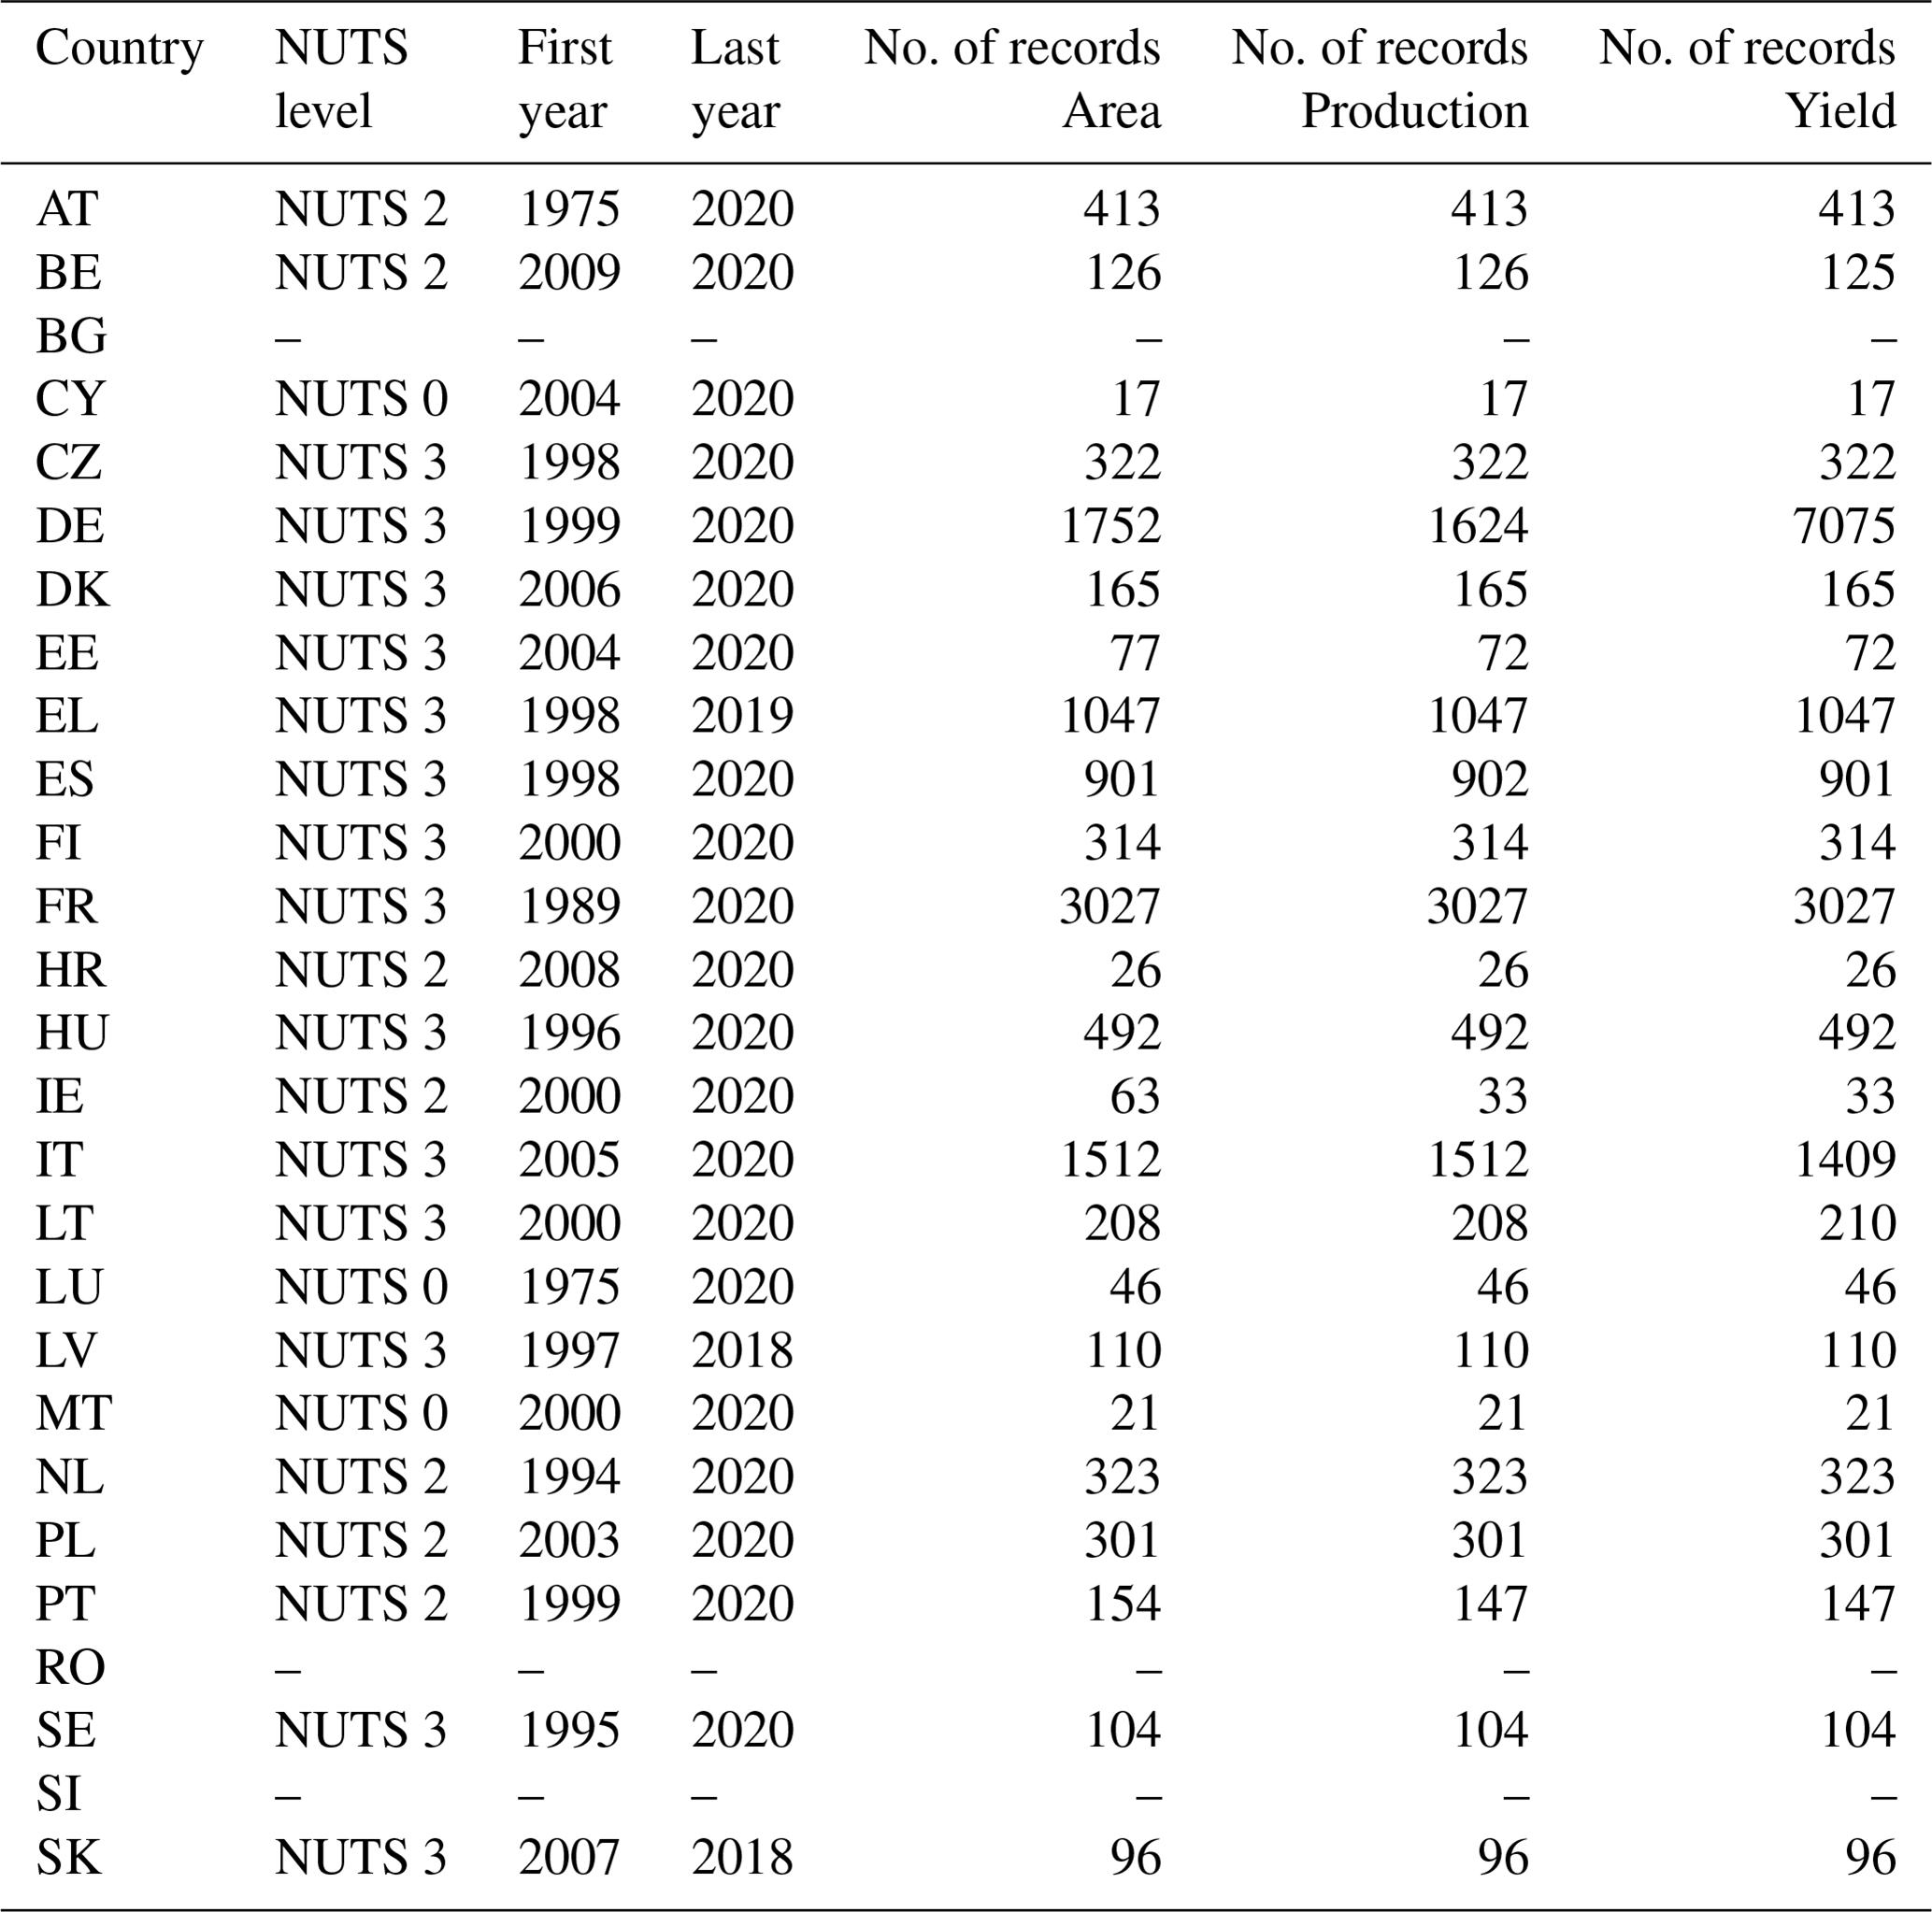
Table A6Number of records included in the dataset, the length of the time series, and the reported administrative level for the crop spring barley.
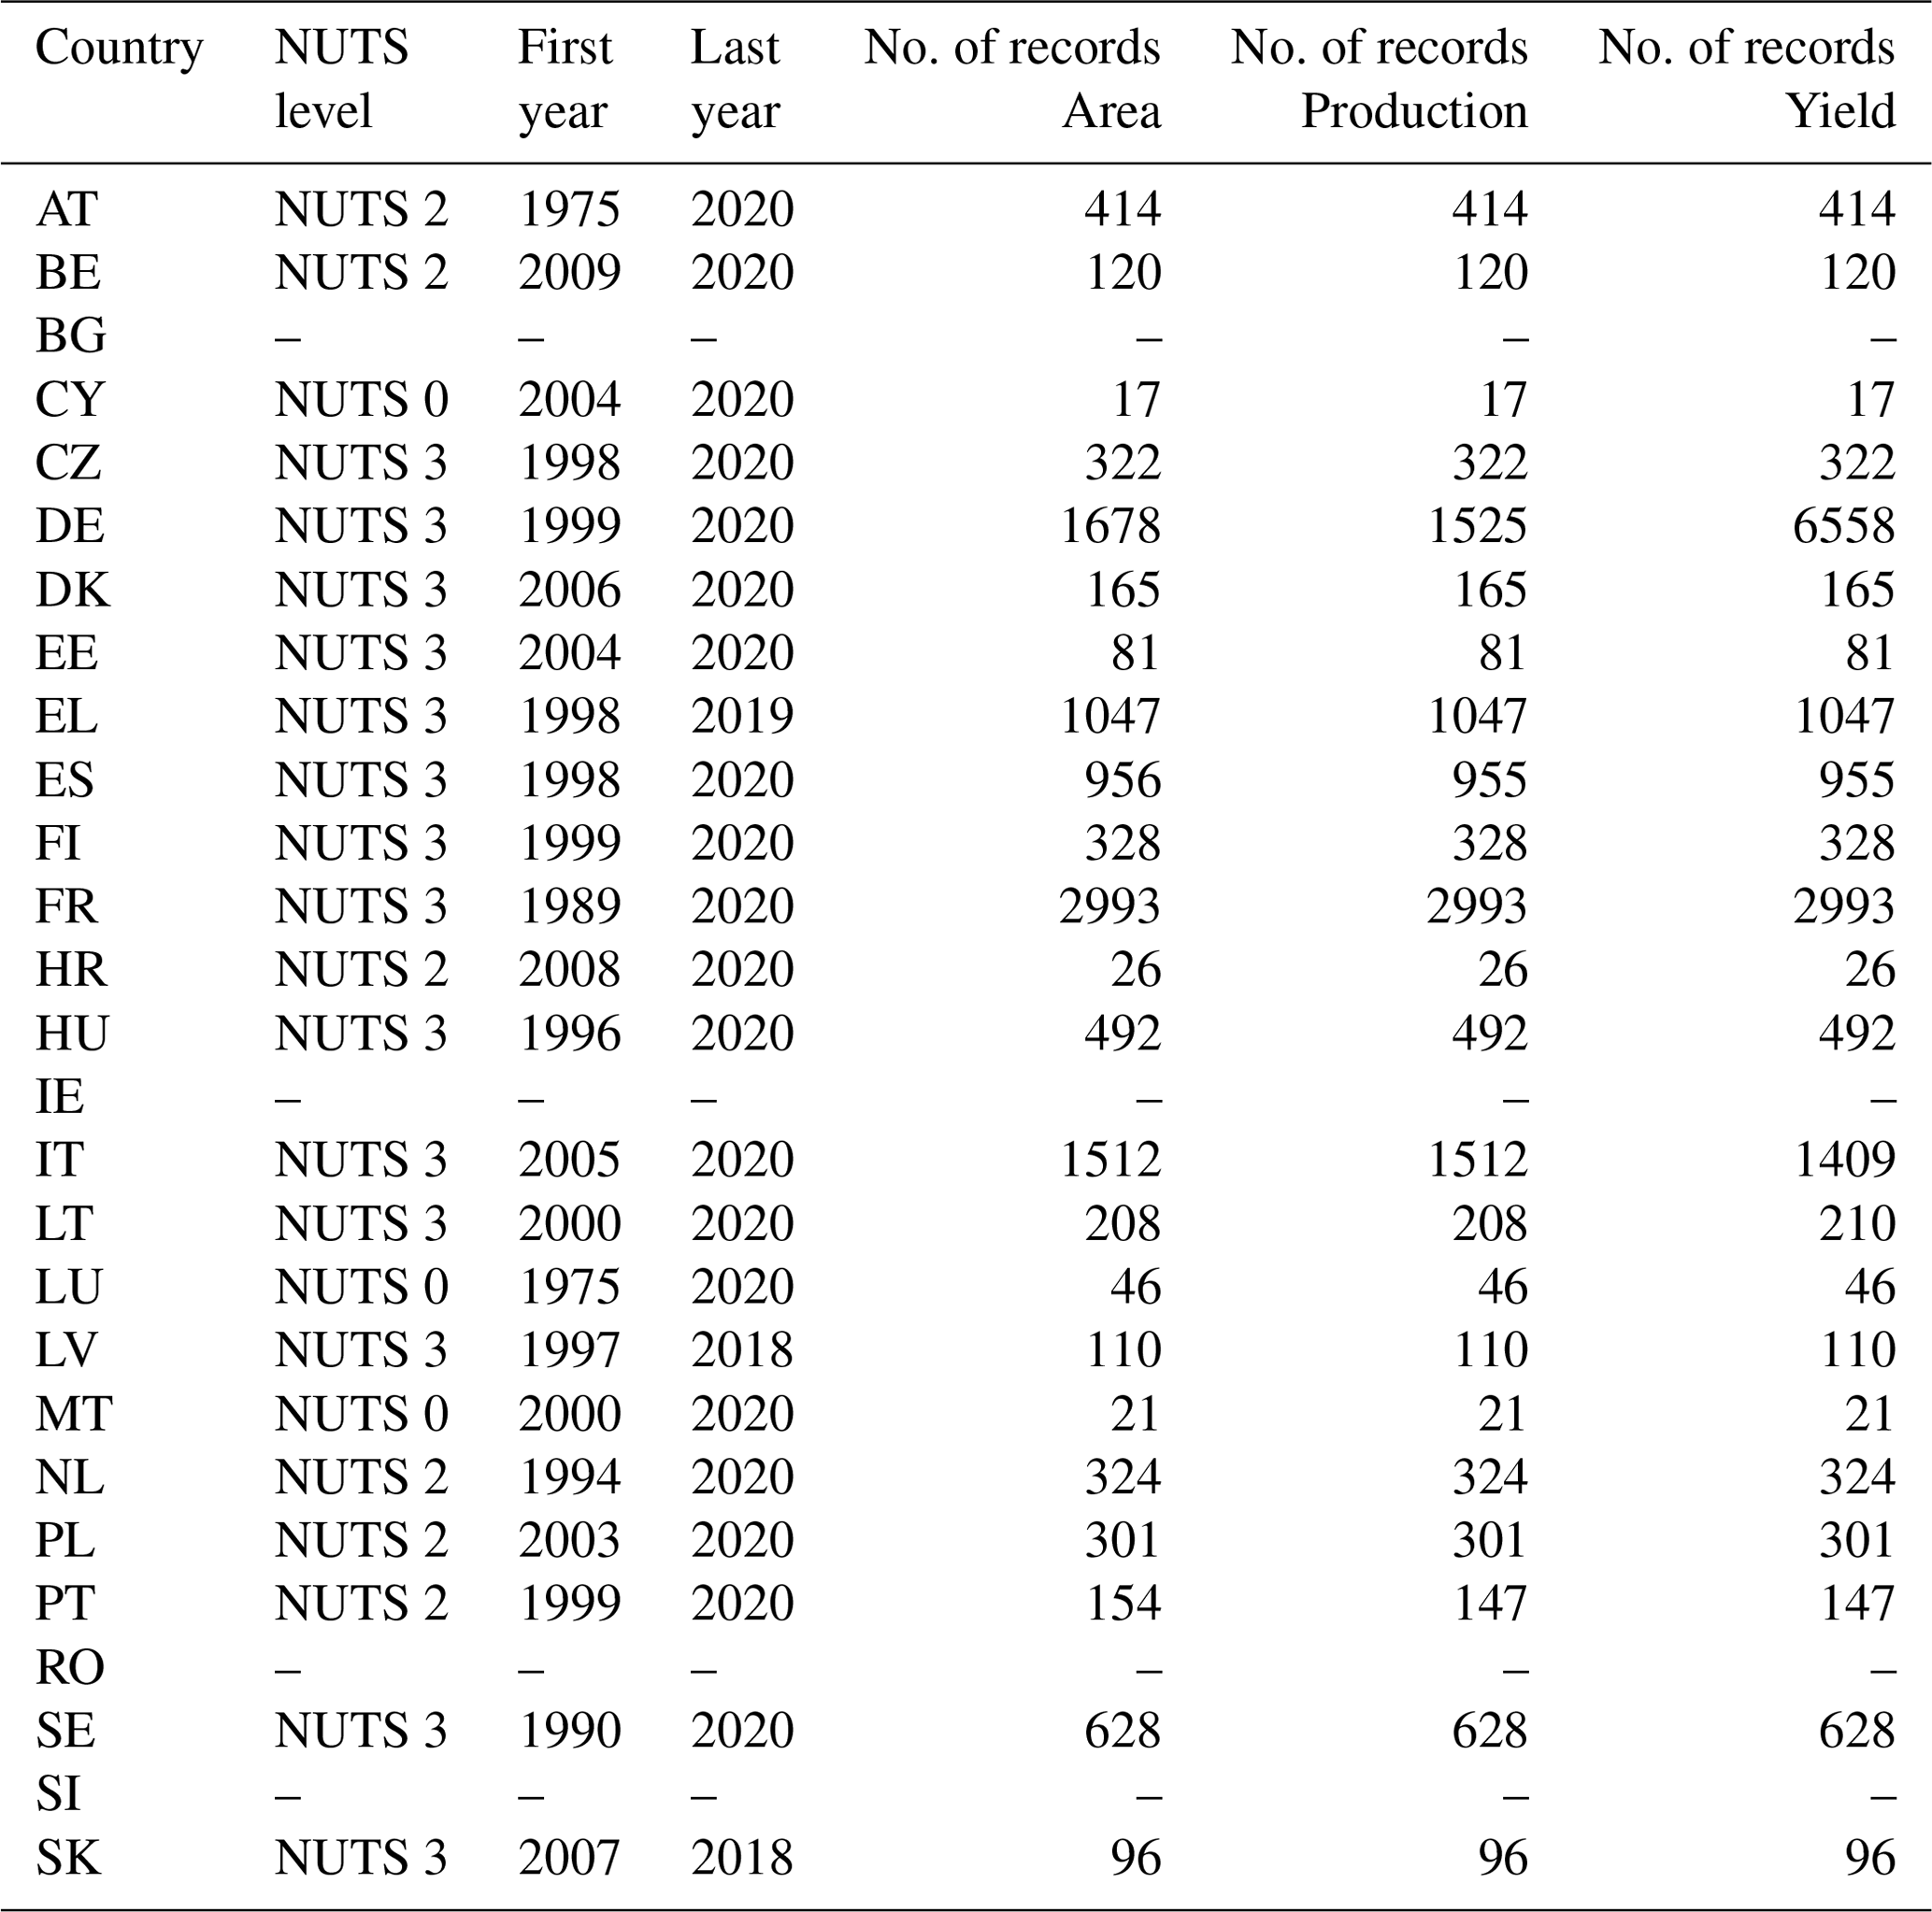
Table A7Number of records included in the dataset, the length of the time series, and the reported administrative level for the crop grain maize.
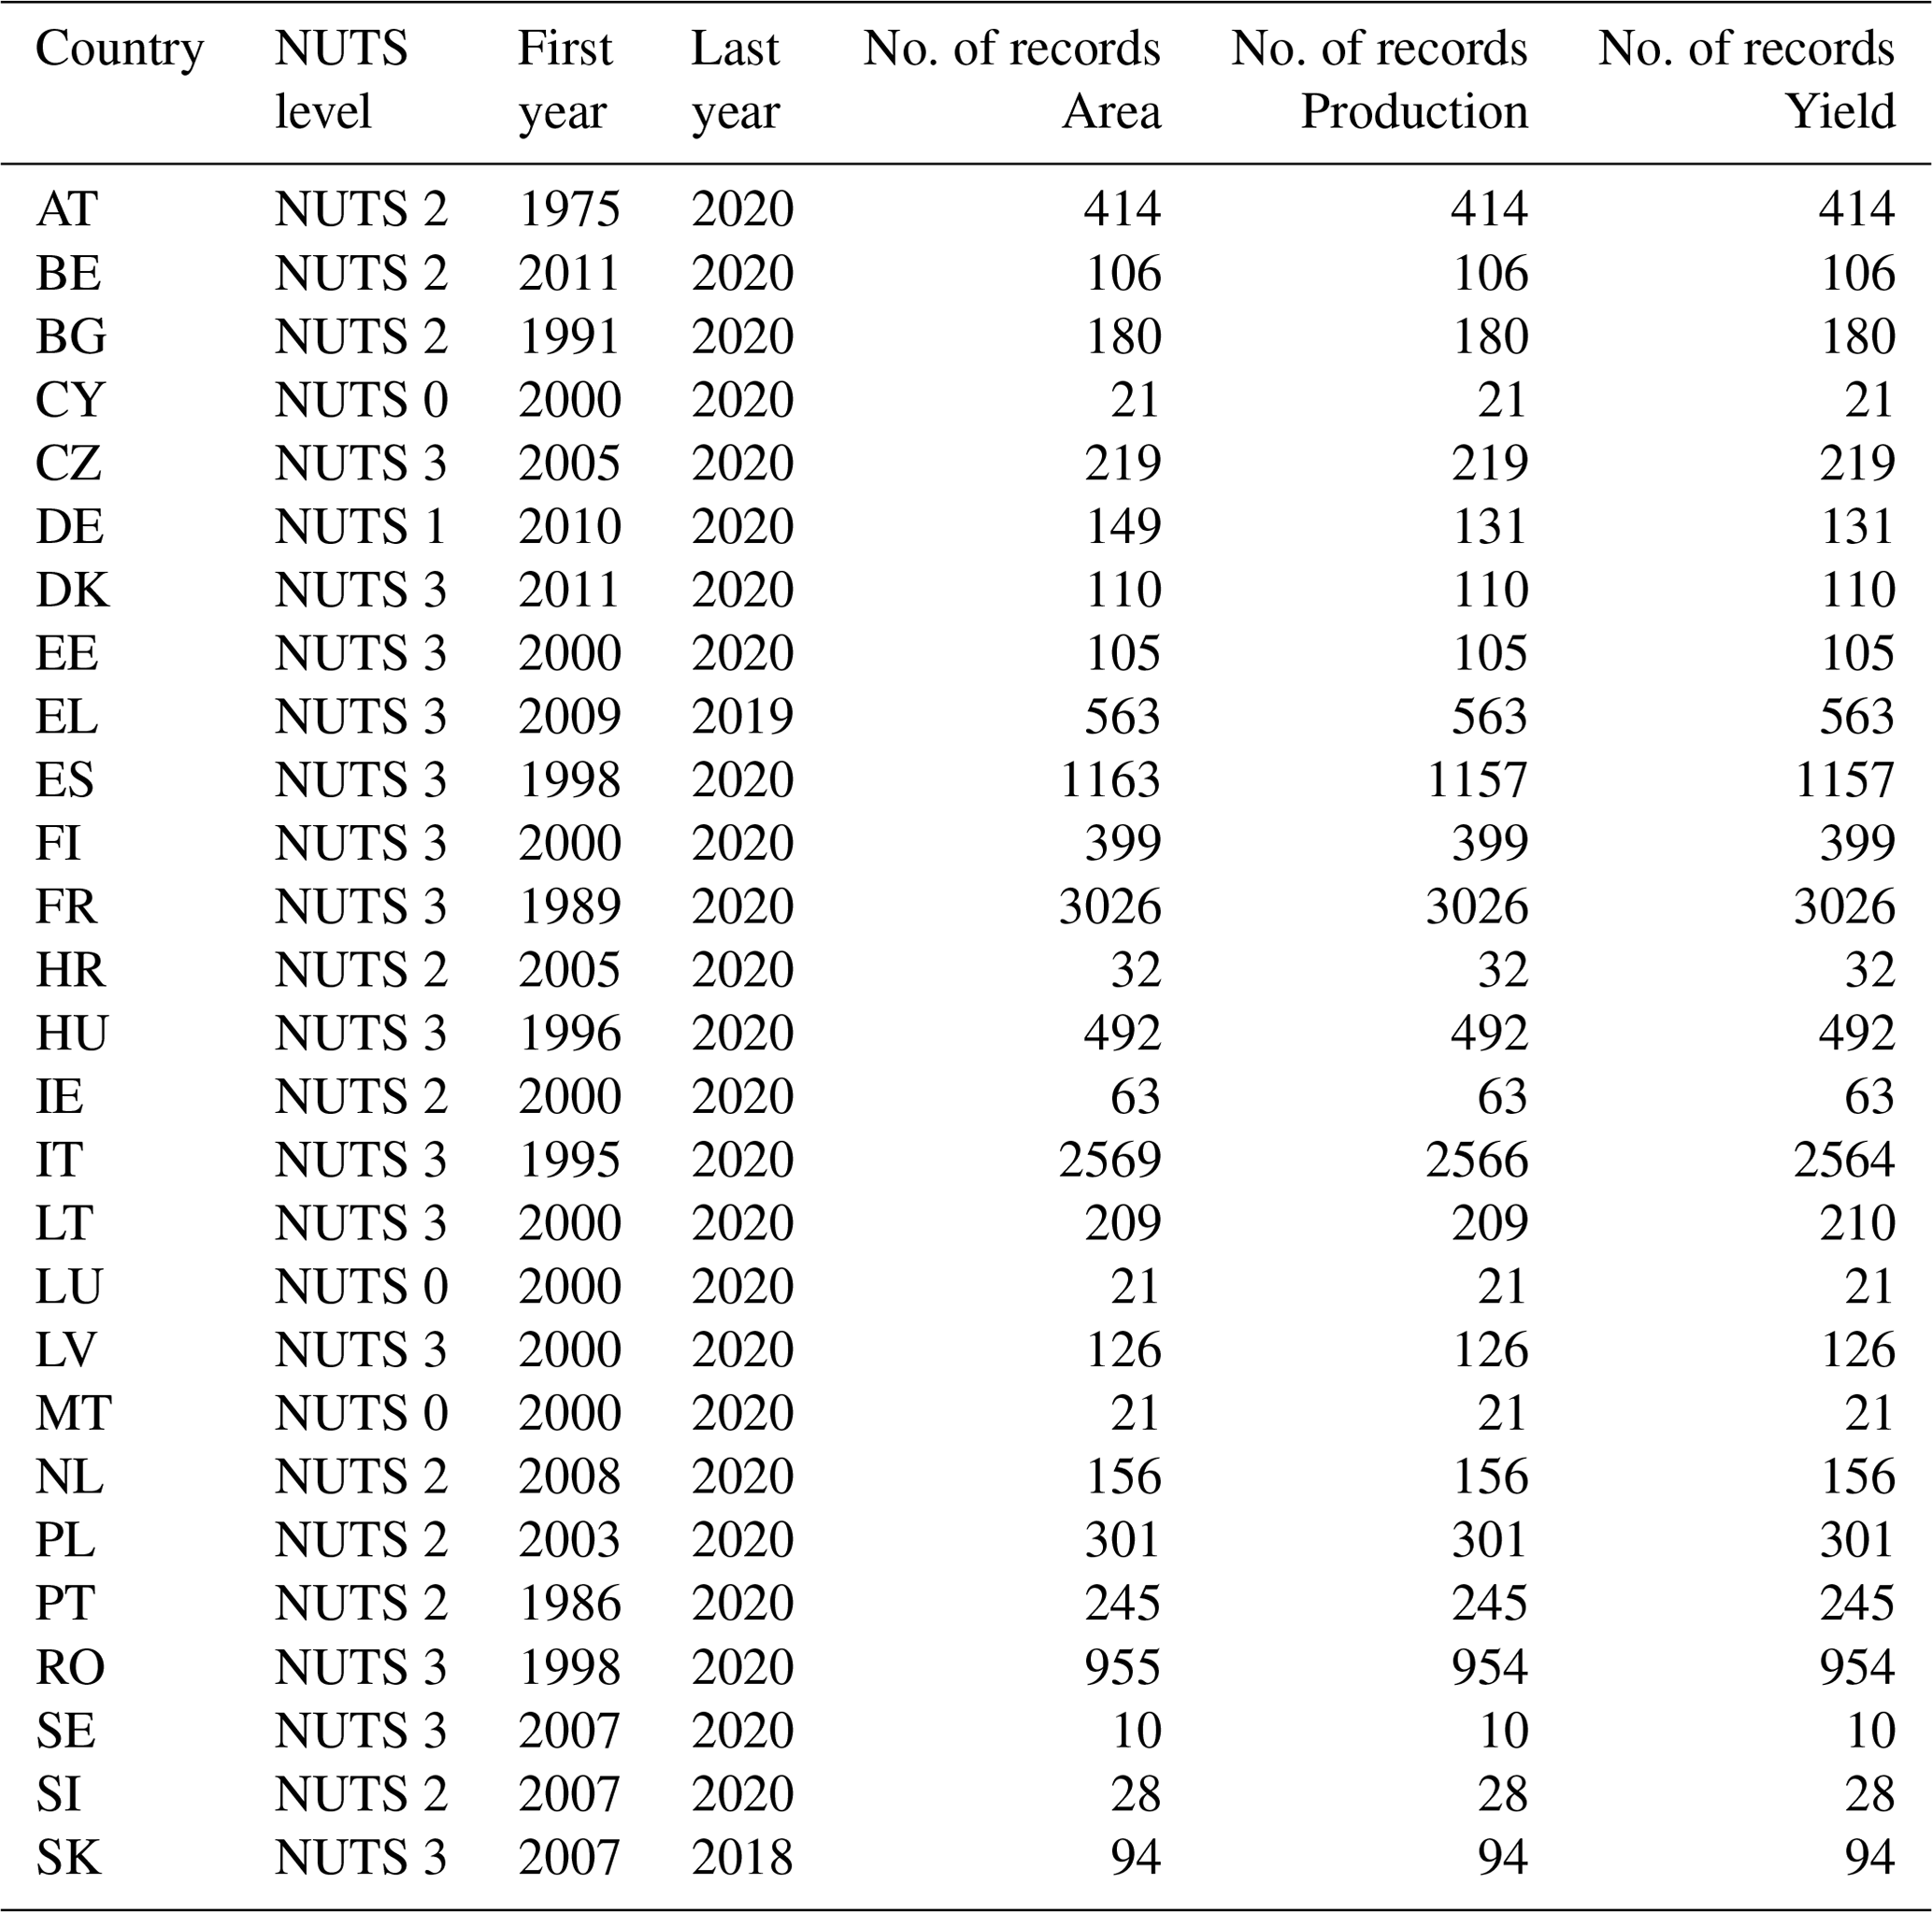
Table A8Number of records included in the dataset, the length of the time series, and the reported administrative level for the crop sugar beet.
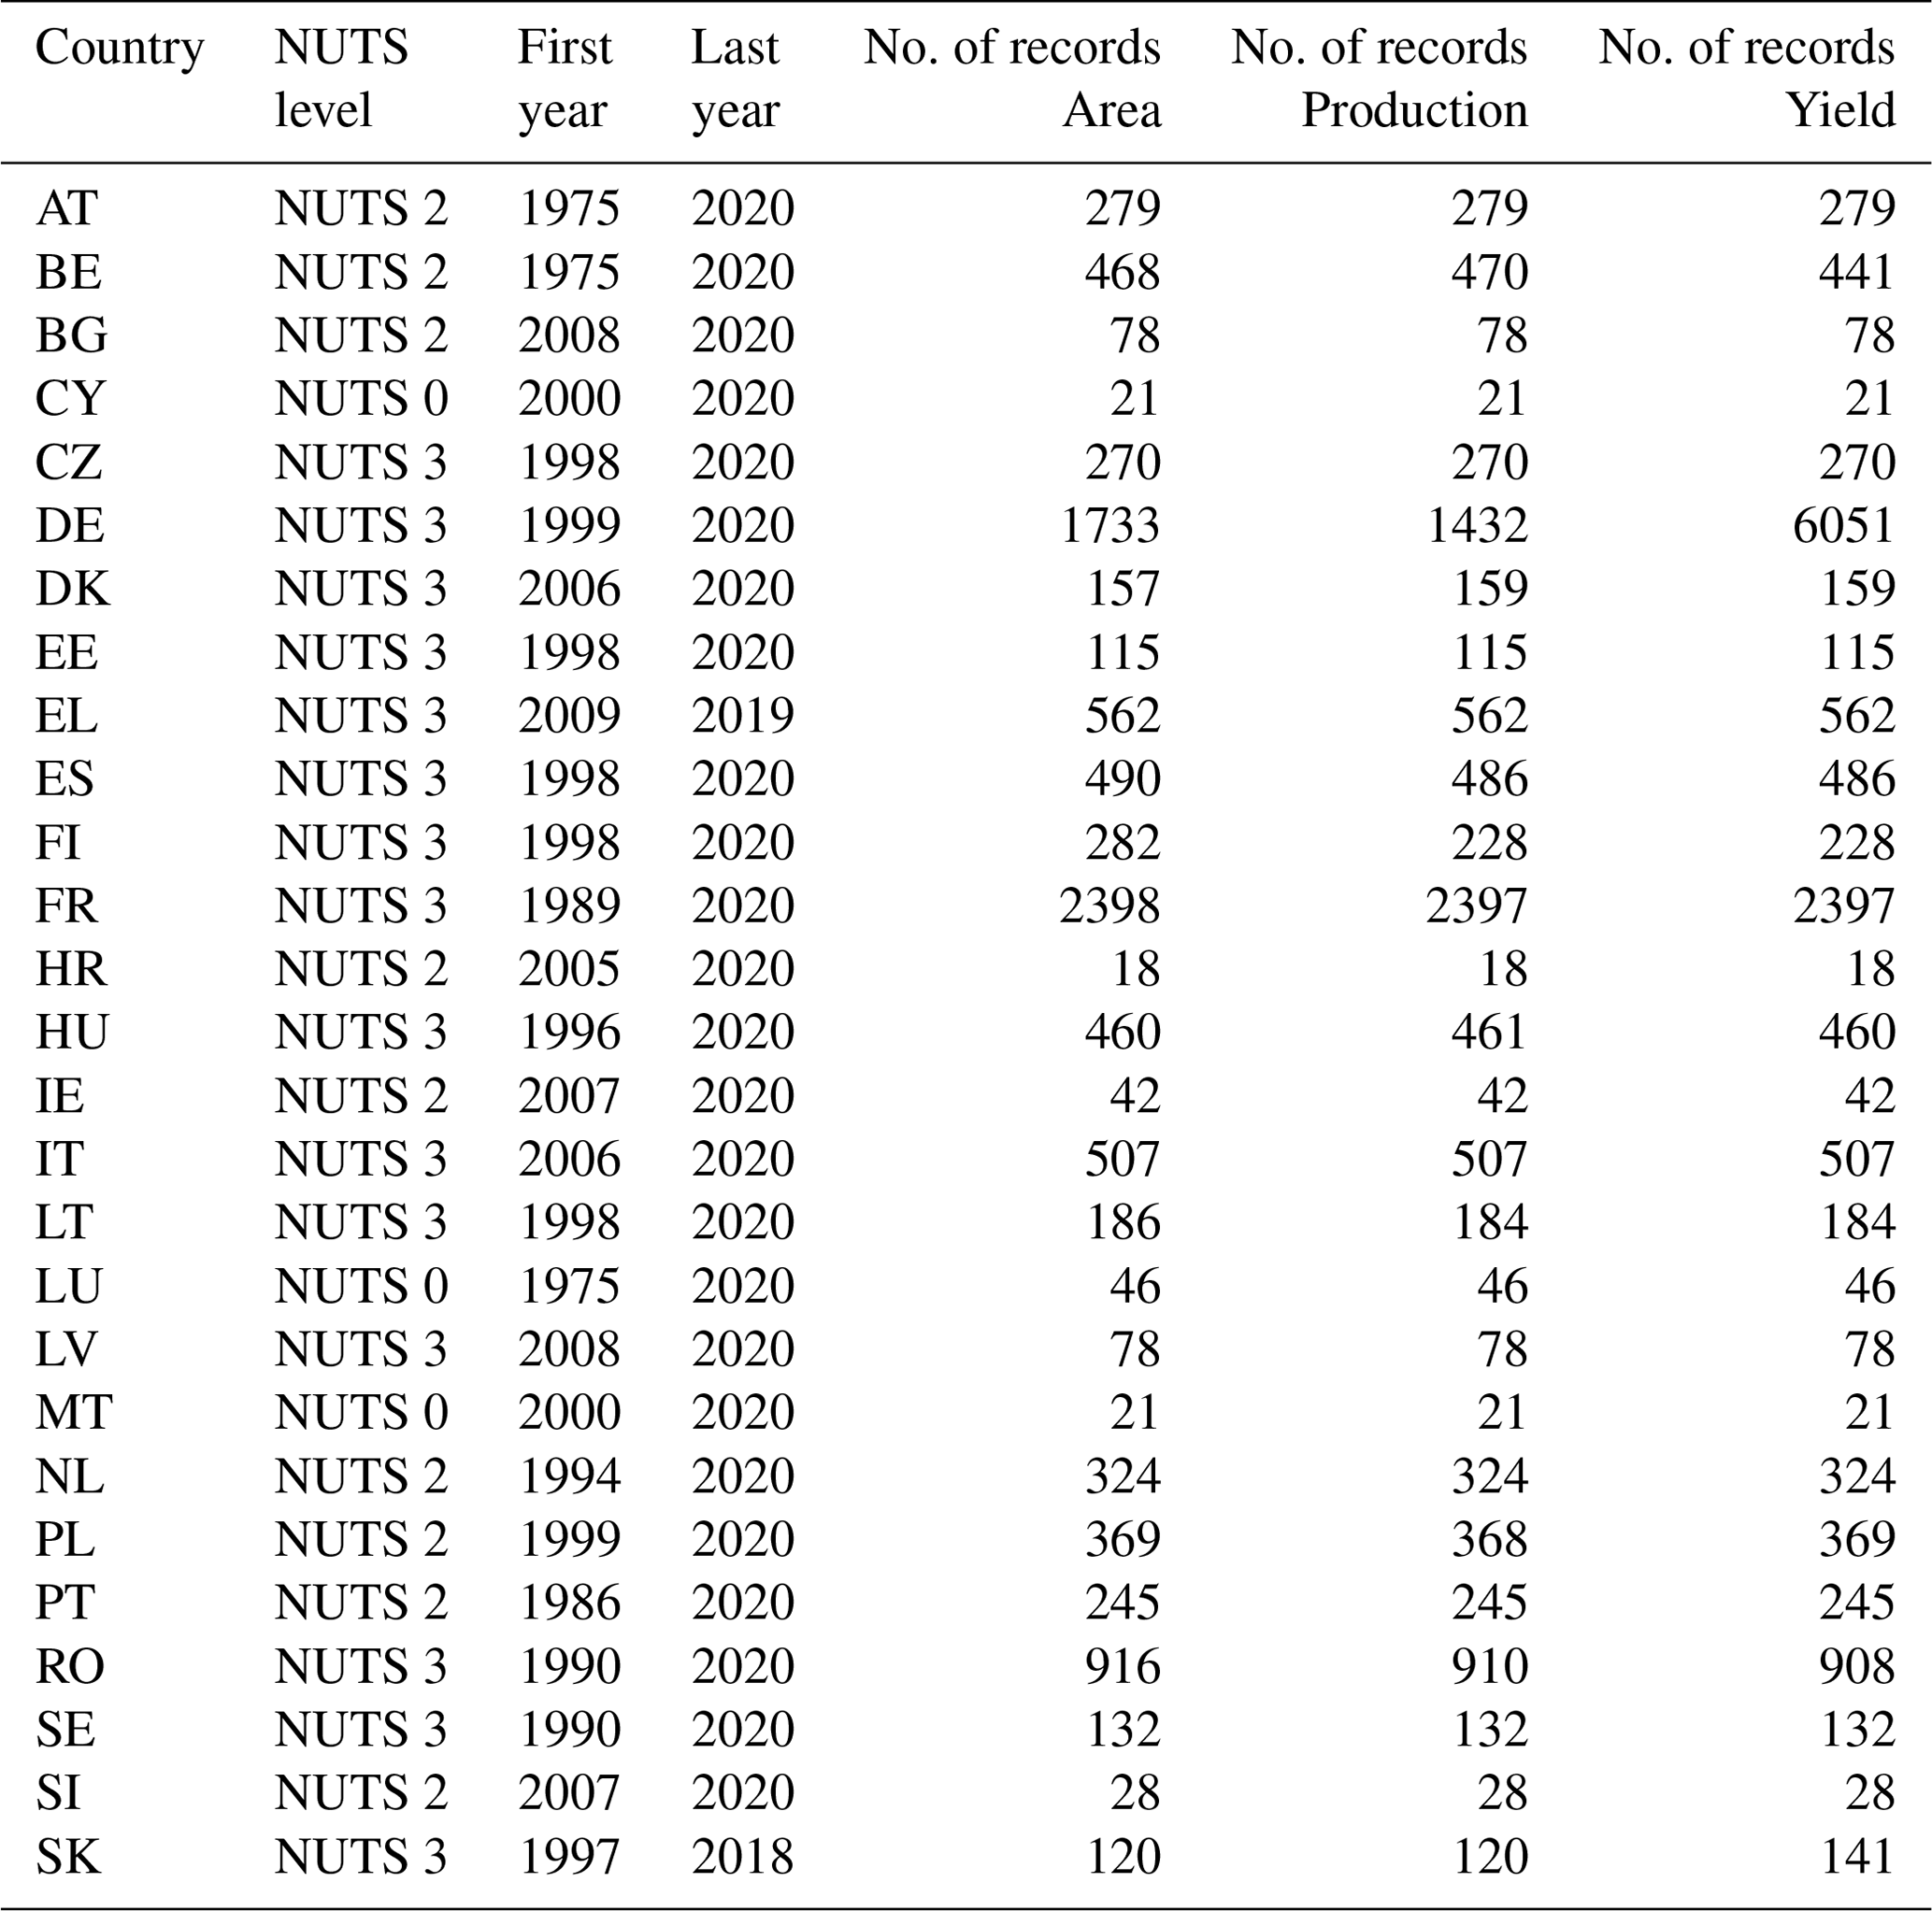
Table A9Number of records included in the dataset, the length of the time series, and the reported administrative level for the crop sunflower.
GR drafted the manuscript, created the figures, and processed and analyzed the data. GR, LNS, LS, and IC collected the data, performed the data harmonization, and defined the postprocessing rules. MvdV provided guidance and reviewed the manuscript. All the authors provided comments and suggestions on the paper.
The contact author has declared that none of the authors has any competing interests.
Publisher's note: Copernicus Publications remains neutral with regard to jurisdictional claims made in the text, published maps, institutional affiliations, or any other geographical representation in this paper. While Copernicus Publications makes every effort to include appropriate place names, the final responsibility lies with the authors.
The authors would like to acknowledge Steven Hoek and Hendrik Boogaard from Wageningen Environmental Research (WENR) as well as many colleagues, including Sara García-Condado and Raul López-Lozano, who contributed to setting definitions and collecting data statistics over the years.
This paper was edited by Francesco N. Tubiello and reviewed by two anonymous referees.
AMIS: AMIS Market Database, https://app.amis-outlook.org/#/market-database/supply-and-demand-overview (last access: 24 August 2023), 2022. a
Anderson, W., Baethgen, W., Capitanio, F., Ciais, P., Cook, B. I., da Cunha, C. G., Goddard, L., Schauberger, B., Sonder, K., Podestá, G., van der Velde, M., and You, L.: Twentieth Century Crop Statistics, 1900–2017., https://sedac.ciesin.columbia.edu/data/set/food-twentieth-century-crop-statistics-1900-2017 (last access: 24 August 2023), 2022. a
Anderson, W., Baethgen, W., Capitanio, F., Ciais, P., Cook, B. I., da Cunha, C. G., Goddard, L., Schauberger, B., Sonder, K., Podestá, G., van der Velde, M., and You, L.: Climate variability and simultaneous breadbasket yield shocks as observed in long-term yield records, Agr. Forest Meteorol., 331, 109321, https://doi.org/10.1016/j.agrformet.2023.109321, 2023. a
Avitabile, V., Baldoni, E., Baruth, B., Bausano, G., Boysen-Urban, K., Caldeira, C., Camia, A., Cazzaniga, N., Ceccherini, G., Laurentis, V. D., Doerner, H., Giuntoli, J., Gras, M., Garcia, J. G., Gurria, P., Hassegawa, M., JasineviČius, G., Jonsson, R., Konrad, C., Kupschus, S., Notte, A. L., M'barek, R., Mannini, A., Migliavacca, M., Mubareka, S., Patani, S., Pilli, R., Rebours, C., Ronchetti, G., Ronzon, T., Rougieoux, P., Sala, S., Lopez, J. S., Mengual, E. S., Sinkko, T., Sturm, V., Leeuwen, M. V., Vasilakopoulos, P., Verkerk, P. J., Virtanen, J., Winker, H., and Zulian, G.: Biomass production, supply, uses and flows in the European Union. Integrated assessment, Technical Report, Publications Office of the European Union, Luxembourg, https://doi.org/10.2760/811744, JRC132358, 2023. a
Ballot, R., Guilpart, N., and Jeuffroy, M.-H.: The first map of crop sequence types in Europe over 2012–2018, Earth Syst. Sci. Data, 15, 5651–5666, https://doi.org/10.5194/essd-15-5651-2023, 2023. a
Becker-Reshef, I., Barker, B., Whitcraft, A., Oliva, P., Mobley, K., Justice, C., and Sahajpal, R.: Crop Type Maps for Operational Global Agricultural Monitoring, Sci. Data, 10, 172, https://doi.org/10.1038/s41597-023-02047-9, 2023. a
Beillouin, D., Schauberger, B., Bastos, A., Ciais, P., and Makowski, D.: Impact of extreme weather conditions on European crop production in 2018, Philos. T. R. Soc. B, 375, 20190510, https://doi.org/10.1098/rstb.2019.0510, 2020. a
Ben-Ari, T., Boé, J., Ciais, P., Lecerf, R., Van der Velde, M., and Makowski, D.: Causes and implications of the unforeseen 2016 extreme yield loss in the breadbasket of France, Nat. Commun., 9, 1627, https://doi.org/10.1038/s41467-018-04087-x, 2018. a
Blickensdörfer, L., Schwieder, M., Pflugmacher, D., Nendel, C., Erasmi, S., and Hostert, P.: Mapping of crop types and crop sequences with combined time series of Sentinel-1, Sentinel-2 and Landsat 8 data for Germany, Remote Sens. Environ., 269, 112831, https://doi.org/10.1016/j.rse.2021.112831, 2022. a
Ceglar, A., Toreti, A., Lecerf, R., Van der Velde, M., and Dentener, F.: Impact of meteorological drivers on regional inter-annual crop yield variability in France, Agr. Forest Meteorol., 216, 58–67, https://doi.org/10.1016/j.agrformet.2015.10.004, 2016. a
Ceglar, A., Zampieri, M., Toreti, A., and Dentener, F.: Observed northward migration of agro–climate zones in Europe will further accelerate under climate change, Earths Future, 7, 1088–1101, 2019. a, b, c
Cerrani, I., Ronchetti, G., Nisini Scacchiafichi, L., López Lozano, R., and Van der Velde, M.: Algorithm for the disaggregation of crop area statistics in the MARS crop yield forecasting system, European Commission, Ispra, 2023. a
d'Andrimont, R., Verhegghen, A., Lemoine, G., Kempeneers, P., Meroni, M., and Van der Velde, M.: From parcel to continental scale–A first European crop type map based on Sentinel-1 and LUCAS Copernicus in-situ observations, Remote Sens. Environ., 266, 112708, https://doi.org/10.1016/j.rse.2021.112708, 2021. a, b
European Parliament, EPRS: Statistics on agricultural input and output (SAIO), European Parliament Research Service, https://www.europarl.europa.eu/legislative-train/theme-agriculture-and-rural-development-agri/file-saio, last access: 28 August 2023. a
Eurostat: Strategy for agricultural statistics for 2020 and beyond, Crop statistics working group, Publications Office of the European Union, Luxembourg, 2015a. a
Eurostat: Regions in the European Union. Nomenclature of territorial units for statistics NUTS 2013/EU-28, Publications Office of the European Union, Luxembourg, 2015b. a
Eurostat: Regions in the European Union, edition 2018, Nomenclature of territorial units for statistics -NUTS 2016/EU-28, Publications Office of the European Union, Luxembourg, https://doi.org/10.2785/475524, 2018. a, b
Eurostat: Annual crop statistics handbook, Crop statistics working group, Publications Office of the European Union, Luxembourg, 2020. a, b, c, d
Eurostat: European Statistical System (ESS), European Commission, Directorate-General for Communication, https://ec.europa.eu/eurostat/web/european-statistical-system (last access: 25 July 2023), 2023a. a
Eurostat: Database, European Commission, Directorate-General for Communication, https://ec.europa.eu/eurostat/web/main/data/database (last access: 31 January 2023), 2023b. a, b, c, d, e
Eurostat: History of NUTS, European Commission, Directorate-General for Communication, https://ec.europa.eu/eurostat/web/nuts/history (last access: 31 January 2023), 2023c. a
FAOSTAT: Crops and livestock products, Food and Agriculture Organization of the United Nations (FAO), https://www.fao.org/faostat/en/#data/QCL (last access: 31 January 2023), 2023. a
Finger, R.: Evidence of slowing yield growth–the example of Swiss cereal yields, Food Policy, 35, 175–182, 2010. a
Fontana, G., Toreti, A., Ceglar, A., and De Sanctis, G.: Early heat waves over Italy and their impacts on durum wheat yields, Nat. Hazards Earth Syst. Sci., 15, 1631–1637, https://doi.org/10.5194/nhess-15-1631-2015, 2015. a
Fritz, S., See, L., Laso Bayas, J. C., Waldner, F., Jacques, D., Becker-Reshef, I., Whitcraft, A., Baruth, B., Bonifacio, R., Crutchfield, J., Rembold, F., Rojas, O., Schucknecht, A., Van der Velde, M., Verdin, J., Wu, B., Yan, N., You, L., Gilliams, S., Mücher, S., Tetrault, R.,Moorthy, I., and McCallum, I.: A comparison of global agricultural monitoring systems and current gaps, Agr. Syst., 168, 258–272, 2019. a
García-Condado, S., López-Lozano, R., Panarello, L., Cerrani, I., Nisini, L., Zucchini, A., Van der Velde, M., and Baruth, B.: Assessing lignocellulosic biomass production from crop residues in the European Union: Modelling, analysis of the current scenario and drivers of interannual variability, GCB Bioenergy, 11, 809–831, 2019. a
Guiomar, N., Godinho, S., Pinto-Correia, T., Almeida, M., Bartolini, F., Bezák, P., Biró, M., Bjørkhaug, H., Bojnec, Š., Brunori, G., Corazzin, M., Czekaj, M., Davidova, S., Kania, J., Kristensen, S., Marraccini, E., Molnár, Zs., Niedermayr, J., O'Rourke, E., Ortiz-Miranda, D., Redman, M., Sipiläinen, T., Sooväli-Sepping, H., Šūmane, S., Surová, D., Sutherland, L. A., Tcherkezova, E., Tisenkopfs, T., Tsiligiridis, T., Tudor, M. M., Wagner, K., and Wästfelt, A.: Typology and distribution of small farms in Europe: Towards a better picture, Land Use Policy, 75, 784–798, 2018. a
Guth, M. and Smędzik-Ambroży, K.: Economic resources versus the efficiency of different types of agricultural production in regions of the European union, Econ. Res.-Ekon. Istraz., 33, 1036–1051, https://doi.org/10.1080/1331677X.2019.1585270, 2020. a
Iizumi, T. and Sakai, T.: The global dataset of historical yields for major crops 1981–2016, Sci. Data, 7, 97, https://doi.org/10.1038/s41597-020-0433-7, 2020. a
Joint Research Centre: JRC MARS Bulletin – Crop monitoring in Europe, Publications Office of the European Union, https://joint-research-centre.ec.europa.eu/monitoring-agricultural-resources-mars/jrc-mars-bulletin_en (last access: 24 August 2023), 2023. a
Jørgensen, L. N., Kudsk, P., and Ørum, J. E.: Links between pesticide use pattern and crop production in Denmark with special reference to winter wheat, Crop Prot., 119, 147–157, 2019. a
Kern, A., Barcza, Z., Marjanović, H., Árendás, T., Fodor, N., Bónis, P., Bognár, P., and Lichtenberger, J.: Statistical modelling of crop yield in Central Europe using climate data and remote sensing vegetation indices, Agr. Forest Meteorol., 260, 300–320, 2018. a
Kowalik, W., Dabrowska-Zielinska, K., Meroni, M., Raczka, T. U., and de Wit, A.: Yield estimation using SPOT-VEGETATION products: A case study of wheat in European countries, Int. J. Appl. Earth Obs., 32, 228–239, 2014. a
Lennert, J. and Farkas, J. Z.: Transformation of agriculture in Hungary in the period 1990–2020, Studia, 56, 33–72, 2020. a
López-Lozano, R., Duveiller, G., Seguini, L., Meroni, M., García-Condado, S., Hooker, J., Leo, O., and Baruth, B.: Towards regional grain yield forecasting with 1 km-resolution EO biophysical products: Strengths and limitations at pan-European level, Agr. Forest Meteorol., 206, 12–32, 2015. a
MAPA: Ministery of Agriculture, Fisheries and Food, https://www.mapa.gob.es/en/default.aspx, last access: 31 January 2023. a
Monfreda, C., Ramankutty, N., and Foley, J. A.: Farming the planet: 2. Geographic distribution of crop areas, yields, physiological types, and net primary production in the year 2000, Global Biogeochem. Cy., 22, https://doi.org/10.1029/2007GB002947, 2008. a
Mueller, N. D., Gerber, J. S., Johnston, M., Ray, D. K., Ramankutty, N., and Foley, J. A.: Closing yield gaps through nutrient and water management, Nature, 490, 254–257, 2012. a
Neumann, M. and Smith, P.: Carbon uptake by European agricultural land is variable, and in many regions could be increased: Evidence from remote sensing, yield statistics and models of potential productivity, Sci. Total Environ., 643, 902–911, 2018. a
Nóia Júnior, R. de S., Deswarte, J.-C., Cohan, J.-P., Martre, P., van der Velde, M., Lecerf, R., Webber, H., Ewert, F., Ruane, A. C., Slafer, G. A., and Asseng, S.: The extreme 2016 wheat yield failure in France, Glob. Change Biol., 29, 3130–3146, 2023. a
Paudel, D., Boogaard, H., de Wit, A., van der Velde, M., Claverie, M., Nisini, L., Janssen, S., Osinga, S., and Athanasiadis, I. N.: Machine learning for regional crop yield forecasting in Europe, Field Crop. Res., 276, 108377, https://doi.org/10.1016/j.fcr.2021.108377, 2022. a
Peltonen-Sainio, P. and Jauhiainen, L.: Large zonal and temporal shifts in crops and cultivars coincide with warmer growing seasons in Finland, Reg. Environ. Change, 20, 1–13, 2020. a
Piikki, K. and Söderström, M.: Digital soil mapping of arable land in Sweden–Validation of performance at multiple scales, Geoderma, 352, 342–350, 2019. a
Rega, C., Short, C., Pérez-Soba, M., and Paracchini, M. L.: A classification of European agricultural land using an energy-based intensity indicator and detailed crop description, Landscape Urban Plan., 198, 103793, https://doi.org/10.1016/j.landurbplan.2020.103793, 2020. a
Reiff, M., Ivanicova, Z., and Surmanova, K.: Cluster analysis of selected world development indicators in the fields of agriculture and the food industry in European Union countries, Agr. Econ.-Czech, 64, 197–205, 2018. a
Republic of Bulgaria: National Statistical Institute, https://www.nsi.bg/en, last access: 31 January 2023. a
Ribeiro, A. F. S., Russo, A., Gouveia, C. M., Páscoa, P., and Zscheischler, J.: Risk of crop failure due to compound dry and hot extremes estimated with nested copulas, Biogeosciences, 17, 4815–4830, https://doi.org/10.5194/bg-17-4815-2020, 2020. a
Ronchetti, G., Manfron, G., Weissteiner, C. J., Seguini, L., Scacchiafichi, L. N., Panarello, L., and Baruth, B.: Remote sensing crop group-specific indicators to support regional yield forecasting in Europe, Comput. Electron. Agr., 205, 107633, https://doi.org/10.1016/j.compag.2023.107633, 2023a. a
Ronchetti, G., Nisini Scacchiafichi, L., Seguini, L., Cerrani, I., and van der Velde, M.: Harmonized European Union subnational crop statistics, European Commission, Joint Research Centre (JRC) https://doi.org/10.2905/685949ff-56de-4646-a8df-844b5bb5f835, [data set], 2023b. a, b
Schauberger, B., Jägermeyr, J., and Gornott, C.: A systematic review of local to regional yield forecasting approaches and frequently used data resources, Eur. J. Agron., 120, 126153, https://doi.org/10.1016/j.eja.2020.126153, 2020. a
Schmitt, J., Offermann, F., Söder, M., Frühauf, C., and Finger, R.: Extreme weather events cause significant crop yield losses at the farm level in German agriculture, Food Policy, 112, 102359, https://doi.org/10.1016/j.foodpol.2022.102359, 2022. a
Sloat, L. L., Davis, S. J., Gerber, J. S., Moore, F. C., Ray, D. K., West, P. C., and Mueller, N. D.: Climate adaptation by crop migration, Nat. Commun., 11, 1243, https://doi.org/10.1038/s41467-020-15076-4, 2020. a
Statistics Austria: The National Statistical System, https://www.statistik.at/en/about-us/organisation/the-national-statistical-system, last access: 31 January 2023. a
Stürmer, B., Schmidt, J., Schmid, E., and Sinabell, F.: Implications of agricultural bioenergy crop production in a land constrained economy–The example of Austria, Land Use Policy, 30, 570–581, 2013. a
Van der Velde, M., van Diepen, C., and Baruth, B.: The European crop monitoring and yield forecasting system: Celebrating 25 years of JRC MARS Bulletins, 168, 56–57, https://doi.org/10.1016/j.agsy.2018.10.003, 2019. a
Webber, H., Lischeid, G., Sommer, M., Finger, R., Nendel, C., Gaiser, T., and Ewert, F.: No perfect storm for crop yield failure in Germany, Environ. Res. Lett., 15, 104012, https://doi.org/10.1088/1748-9326/aba2a4, 2020. a
Please read the editorial note first before accessing the article.
- Article
(11304 KB) - Full-text XML