the Creative Commons Attribution 4.0 License.
the Creative Commons Attribution 4.0 License.
 | 10 Jan 2024
A coarse pixel-scale ground “truth” dataset based on global in situ site measurements to support validation and bias correction of satellite surface albedo products
Fei Pan
Xiaodan Wu
Qicheng Zeng
Rongqi Tang
Jingping Wang
Xingwen Lin
Dongqin You
Jianguang Wen
Qing Xiao
In situ measurements from sparsely distributed networks worldwide are a critical source of reference data for validating or correcting biases in satellite products. However, due to the substantial difference in spatial scales between in situ and satellite measurements, the two cannot be compared except for the fact that the underlying surface of in situ sites is absolutely homogeneous. Instead, the in situ measurements needed to be upscaled to be matched with the satellite pixels. Based on the upscaling model, we also proposed the consideration that in situ observation generally lacks spatial representativeness due to the widely distributed spatial heterogeneity, and we have developed a coarse pixel-scale ground “truth” dataset based on ground measurements of 416 in situ sites from the sparsely distributed observation networks. Furthermore, we thoroughly assessed the effectiveness of the dataset at sites with different degrees of spatial representativeness. The results demonstrate that using this dataset in validation outperforms the direct comparison between satellite and in situ site measurements over heterogeneous surfaces when in situ measurement footprints are less than satellite pixel size. The accuracy of the reference data employed for validation or bias correction can be boosted by 17.09 % over the regions with strong spatial heterogeneity. However, the degree of improvement with this dataset displays a decreasing trend with the reduction in spatial heterogeneity. At a global scale, the pixel-scale ground “truth” dataset enhances the accuracy of pixel-scale reference data in general, with the overall relative root-mean-square error (RRMSE) decreasing by 6.04 % compared to in situ single-site measurements. Our results suggest that in situ single-site measurements are limited in their ability to capture surface spatial variability information at a coarse pixel scale (i.e., the kilometer scale). The dataset we provided, which merges temporal information from ground-based observations and spatial information from high-resolution data, represents a valuable resource for validating and correcting worldwide surface albedo products over heterogeneous surfaces. To the best of our knowledge, this dataset is unique in providing a coarse pixel-scale ground “truth” with the widest spatial distribution and longest time series. The dataset is publicly available through https://doi.org/10.5281/zenodo.8008454 (Pan et al., 2023).
- Article
(6439 KB) - Full-text XML
- BibTeX
- EndNote


Surface albedo is an important variable in climate and biogeochemical models because it determines the amount of energy absorbed by the Earth's surface. Coarse-pixel (i.e., with a kilometer pixel scale) satellite albedo products such as MODIS and the Suomi National Polar-orbiting Partnership (NPP) Visible Infrared Imaging Radiometer Suite (VIIRS) have been widely used to tackle global challenges and support a range of initiatives (e.g., the Paris Agreement and Sustainable Development Goals). However, satellite albedo products generally suffer from different degrees of errors due to the error in satellite observation data and the limitation of the inversion algorithm, and the error in the remote-sensing product brings great uncertainty to the next application of the product. Taking albedo as an example, the change in albedo of 11 % will cause a fluctuation in surface net radiation of 3.5 Wm−2 on global and annual averages (GCOS-154, 2011), which in turn will cause the change in global temperature of 0.1 K. An increase of 0.00106 ± 0.00008 (mean ± standard deviation) in albedo will cause the radiation at the top of the atmosphere to cool by −0.15 ± 0.1 Wm−2 (Ghimire et al., 2014). Therefore, it is very important to evaluate the uncertainty of remote-sensing albedo products. In particular, when the error is relatively large, it is urgent to correct the error in remote-sensing albedo products to improve the application accuracy of remote-sensing products. Both the validation and correction of remote-sensing products rely on reference data, which can represent the ground “truth” on the coarse pixel scale.
The sparsely distributed in situ sites (i.e., at most one site within a specific product grid cell) from networks such as FLUXNET, Baseline Surface Radiation Network (BSRN), and Surface Radiation (SURFRAD) provide an important data source for the validation of remote-sensing albedo products (Chu et al., 2021; Augustine et al., 2000; Driemel et al., 2018). However, in situ measurements cannot be directly used as a coarse pixel-scale “truth” if the footprint of in situ sites (depending on tower height) is far less than the scale of a coarse pixel. A practical method of using in situ site measurements as the coarse pixel-scale “truth” is to conduct the spatial representativeness assessment of in situ sites (Román et al., 2009; Wang et al., 2014b; Moustafa et al., 2017). However, since these in situ sites were not originally established for the validation or bias correction of satellite products, only a small part of them was proven to be spatially representative, and most of them were rejected. Even for the representative site, the representativeness errors of in situ measurements are still inevitable, because land surfaces are not absolutely homogeneous throughout the year (Colliander et al., 2017; Xu et al., 2018; Lei et al., 2018; Williamson et al., 2018). Consequently, the representative in situ measurements are only limited to a few locations on the globe and cover discrete time periods, which cannot support a comprehensive validation and bias correction over a wide range of conditions (Loew et al., 2016).
To overcome the representative errors of in situ measurements and to promote the utilization ratio of in situ sites from these sparse networks in validation, Wu et al. (2020) proposed an upscaling method specified for the single-site in situ measurements. However, the effectiveness of this method has not been comprehensively assessed, and its transferability to in situ sites all over the world is still unknown. As the continuation and deepening of our previous work (Wu et al., 2020), this study places an emphasis on the comprehensive evaluation and extensive use of this upscaling method based on 416 in situ sites throughout the world. Furthermore, a coarse pixel-scale ground “truth” dataset was provided for validation and bias correction of satellite surface albedo products. The potential usage of this dataset was also discussed.
It is important to note that the Copernicus Global Terrestrial Monitoring Service partners have instituted a centralized validation database known as the Copernicus Global Terrestrial Product Validation (GBOV, http://land.copernicus.eu/global/gbov/home, last access: 18 December 2023) ground-based observation dataset, providing direct access to the set of reference measurements. However, the Copernicus GBOV ground-based observation dataset merely comprises 20 stations that provide albedo reference data, and the scope of these reference data is inadequate for systematically evaluating remote-sensing products globally. Thus, our collection of ground-based “truth”, which covers the widest spatial range and the longest time series on the coarse pixel scales, is essential for supplementing the scientific efforts on existing albedo datasets and delivering a more precise and consistent albedo reference dataset on the coarse pixel scale for heterogeneous regions.
2.1 In situ site observation
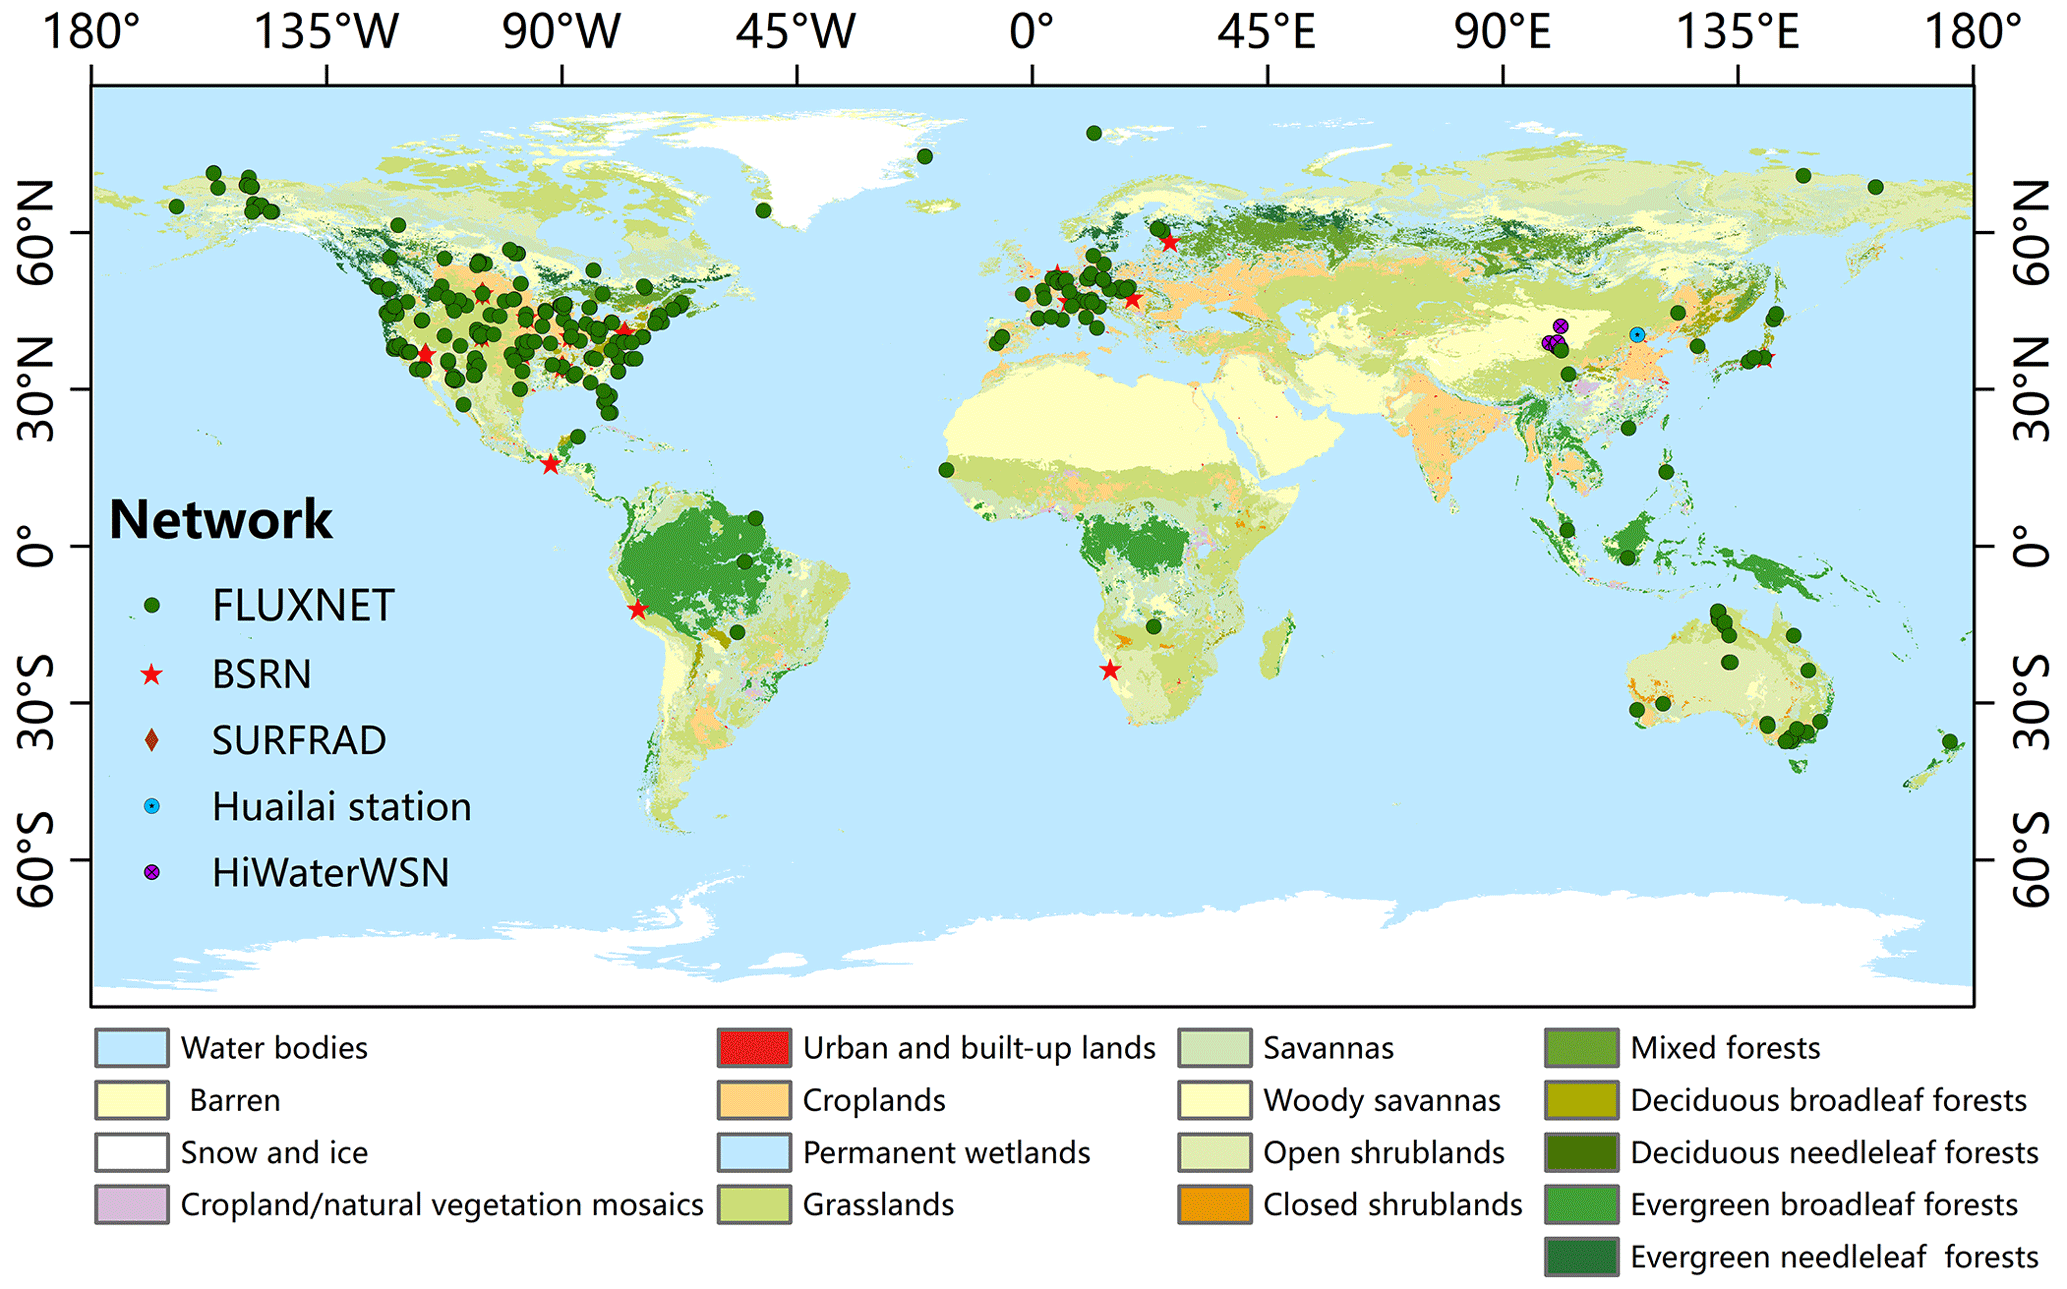
Figure 1The distribution of the 416 in situ sites over different land cover types.
In this study, in situ radiometric measurements from SURFRAD, BSRN, FLUXNET, Heihe Watershed Allied Telemetry Experimental Research (HiwaterWSN) (Li et al., 2013), and Huailai station (Ma et al., 2013) were incorporated to generate the coarse pixel-scale “truth” dataset. These measurements include half-hourly observations of ecosystem fluxes and meteorological data. Figure 1 illustrates the spatial distribution of these in situ sites. The geographical distribution of these sites is predominantly concentrated in Europe and North America, accounting for 50 and 272 sites, respectively, which represent 12 % and 65 % of the total. These regions have a long history of conducting continuous and high-quality ecosystem flux measurements (Baldocchi et al., 2001). Additionally, there are several long-term observation sites located in tropical Amazonia, East Asia, and Australia. However, the coverage in Africa and polar regions remains limited in terms of both the number of sites and the years observed. Despite this uneven geographical distribution, the selected in situ measurements ensure comprehensive coverage of the main plant functional types, including grasslands (GRA), croplands (CRO), woody savannas (WSA), deciduous broadleaf forests (DBF), mixed forests (MF), and evergreen needleleaf forests (ENF). These functional types are prominently represented, comprising 25 %, 19 %, 11 %, 9 %, 8 %, and 6 % of the sites, respectively.
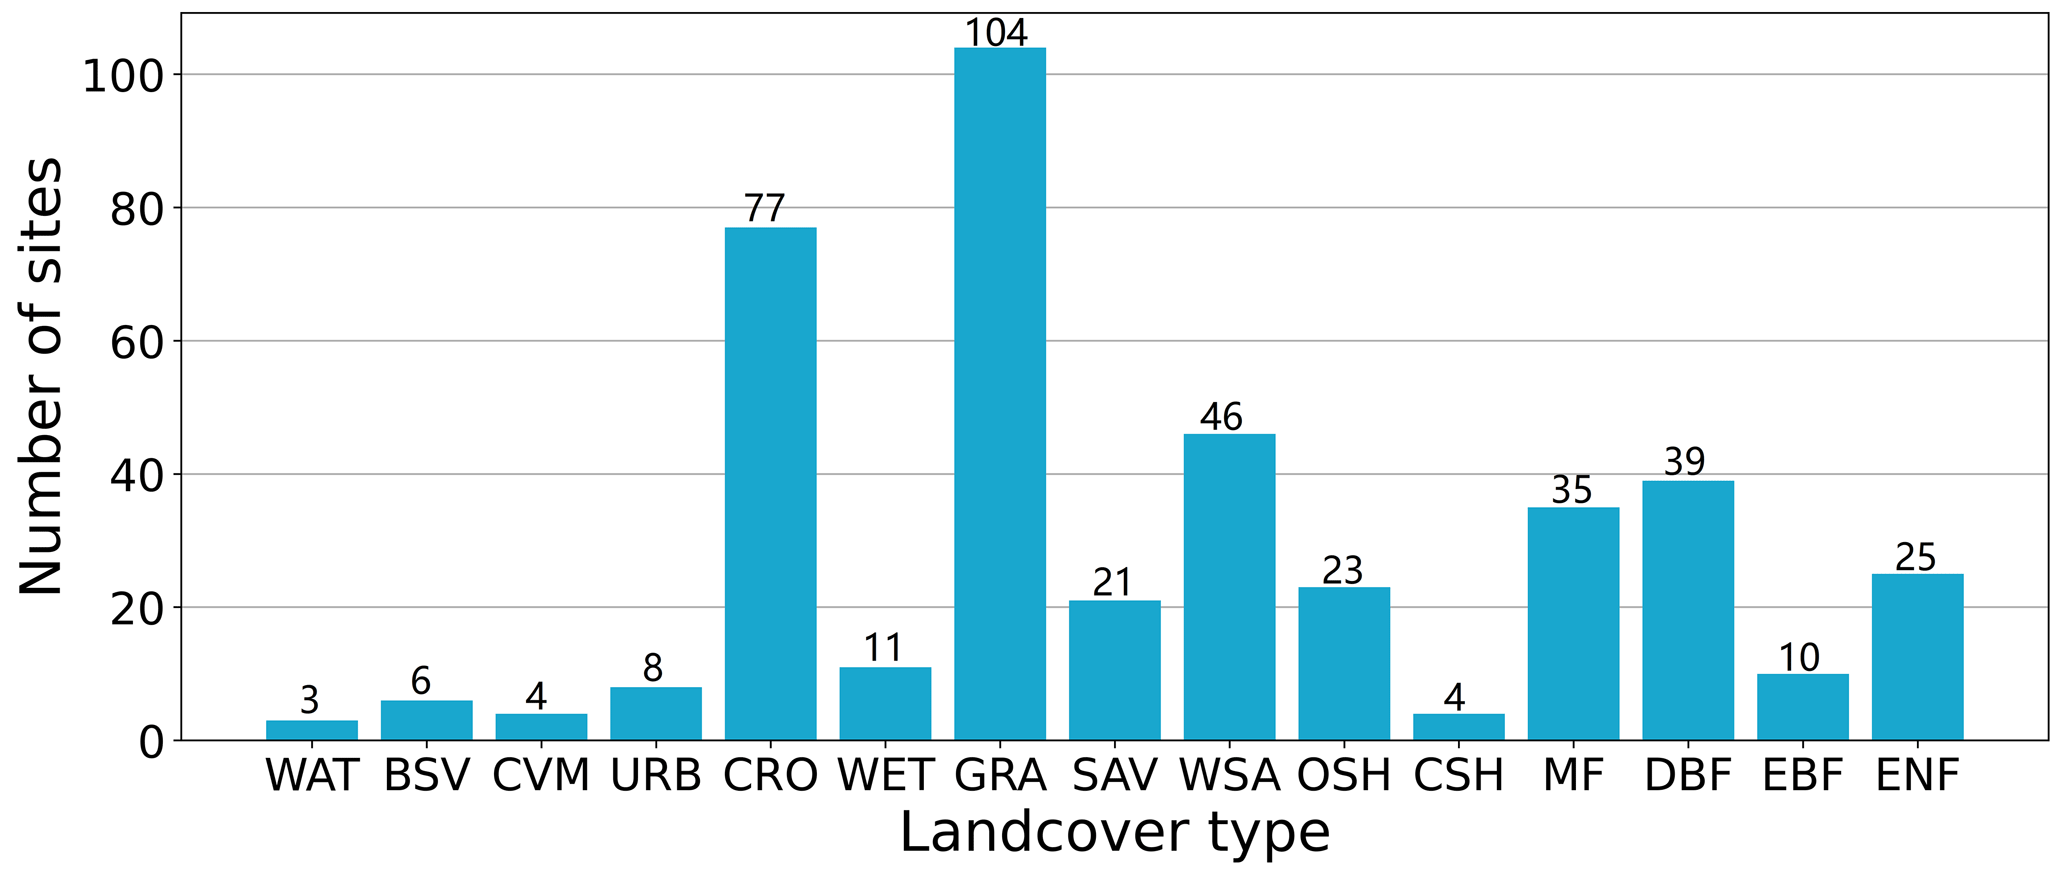
Figure 2The distribution of stations across 15 land cover types indicated by the International Geosphere-Biosphere Programme (IGBP). WAT, BSV, SNO, CVM, URB, CRO, WET, GRA, SAV, WSA, OSH, CSH, MF, DBF, EBF, and ENF are the abbreviations of water bodies, barren, snow and ice, cropland or natural vegetation mosaics, urban and built-up lands, cropland permanent wetlands, grassland, savanna, woody savanna, open shrubland, closed shrublands, mixed forest, deciduous broadleaf forest, evergreen broadleaf forest, and evergreen needleleaf forest. The numerical value displayed above each bar in the chart indicates the total number of stations associated with the corresponding land cover type.
These in situ sites were equipped with double pyranometers mounted back to back, one pointed downward and the other upward, measuring the downward radiation and the upward radiation. Surface albedo is typically measured in the spectral range 280–2800 nm (which accounts for over 98.5 % of the surface solar radiation according to the ASTM G-173 reference spectra), which is parallel to the broadband MODIS albedo (300–5000 nm). The slight inconsistency of the spectral range between in situ and satellite measurements is negligible because the downwelling solar energy in the spectral region below 0.35 µm or above 2.2 µm is very low (Wright et al., 2014). It should be noted that the footprint of in situ sites is variable due to the different measurement heights of the albedometers from the underlying surface, which typically depends on both the height of albedometers and the height of the canopy top. Furthermore, the field of view of the various sensors and the ideal and non-ideal cosine responses of the sensors need to be considered (Balzarolo et al., 2011; Cescatti et al., 2012; Song et al., 2019; Marion, 2021). To reduce the possible effects of unstable lighting on flux measurements and to align with satellite albedo products that generally report local solar noon albedo, the in situ site measured blue-sky albedo was calculated using the ratio of the mean upward radiation to the mean downward radiation around local solar noon (11:00–13:00) as suggested by Lin et al. (2022).
2.2 The high-resolution albedo
Landsat Enhanced Thematic Mapper Plus (ETM+) imagery with eight distinct bands, including three in the visible spectrum, four in the infrared spectrum, and one in the panchromatic band, was incorporated as the pivotal component to upscale ground measurements to the scale of the coarse pixel. This integration of ETM+ imagery served a twofold purpose, Firstly, it enabled the capture of spatial variability attributes at the coarse pixel scale surrounding each site, establishing the foundation for a robust upscaling model. Secondly, it facilitated coarse pixel-level aggregation within a 17 pixel × 17 pixel window (an approximately 510 m × 510 m area, considered a coarse-scale pixel), serving as the reference value of the coarse-pixel albedo. All Landsat ETM+ surface reflectance (SR) imagery from 2012 to 2018 were collected through the Google Earth Engine (GEE) platform. There are an average of 65 ETM+ images collected at each site. Each ETM+ image has been atmospherically and geometrically corrected (Teixeira et al., 2020). The bad pixels such as those associated with cloud, cloud shadow, and saturated pixels were identified and masked by the CFMask algorithm (Zhu et al., 2015; Zhu and Woodcock, 2012).
The retrieval of high-resolution surface albedo was carried out using the algorithm proposed by Liang (2001). It relies on a spectral reflectance library and simulations conducted under various atmospheric and surface conditions with the Lambertian assumption so that the surface reflectance numerically equals the spectral albedo (Liang et al., 2002). Notably, the anticipated accuracy of this algorithm approximates 0.02. The algorithm provides formulae for converting spectral information to broadband albedos for ETM+ imagery (Liang, 2001). In this study, we employed the following equation to calculate shortwave blue-sky albedo estimates.
αshort denotes the shortwave blue-sky surface albedo, and αi denotes the spectral albedo at the wavelength of the ith satellite spectral band.
2.3 Coarse pixel-scale satellite albedo product
The MCD43A3 V061 product was used in this paper to serve as an example of coarse-pixel satellite albedo products due to its wide acceptance. The shortwave (3000–5000 nm) albedo was extracted to match the spectral range of in situ measured albedo. It provides black-sky albedo (BSA) and white-sky albedo with a spatial resolution of 500 m and a temporal resolution of daily (Schaaf et al., 2002). The blue-sky albedo encompasses both direct and diffuse components characterizing the albedo of the surface under actual atmospheric conditions. It can be expressed as a linear combination of BSA and WSA with an assumption of an isotropic distribution of diffuse radiation. In this study, the following equation is used to calculate the MODIS blue-sky albedo (α) (Román et al., 2010; Lewis and Barnsley, 1994; Lucht et al., 2000; Pinty et al., 2005; Wang et al., 2019).
r is the proportion of diffuse irradiation at a certain solar zenith angle (SZA), and α, αWSA, and αBSA represent the blue-sky albedo, WSA, and BSA of MCD43A3, respectively. The proportion of diffuse radiation originates from light scattering and the reflection and transmission processes involving clouds and aerosols within a clear blue sky. In this study, we approximated the proportion of diffuse irradiation as a function of the cosine of the SZA at noon using an empirical statistical equation (i.e., Eq. 3). Although this equation is approximate, it avoids the excessive amount of calculation while capturing the major phenomenon (Pinker and Laszlo, 1992). In fact, this empirical function has been widely used by previous studies (An et al., 2022; Mao et al., 2022; Wang et al., 2014a; Lewis and Barnsley, 1994).
θ denotes the solar zenith angle at local solar noon.
2.4 The ancillary dataset
Auxiliary data were used to detect the potential control factors that influence the accuracy of coarse pixel-scale ground “truth”. In this study, several common surface parameters, including elevation, land cover type, and spatial heterogeneity, were considered, as they were believed to be related to albedo. Elevation data were obtained from the Multi-Error-Removed Improved-Terrain (MERIT) digital elevation model (DEM) (Mcclean et al., 2020; Yamazaki et al., 2017), with a high horizontal resolution of 3 arcsec (approximately 90 m). The MERIT DEM addresses a range of error components within the SRTM3 DEM, including stripe noise arising from sensor errors, speckle noise associated with surface reflectance, and absolute bias stemming from limited ground control points (Uuemaa et al., 2020). Land cover information was sourced from MCD12Q1, with a spatial resolution of 500 m at an annual time step from 2012 to 2018. The IGBP classification scheme was selected in this study based on its recognized precision and widespread acceptance. With the consideration of the slight difference in land cover types at certain sites across different years, we opted to select the dominant land cover type for each site.
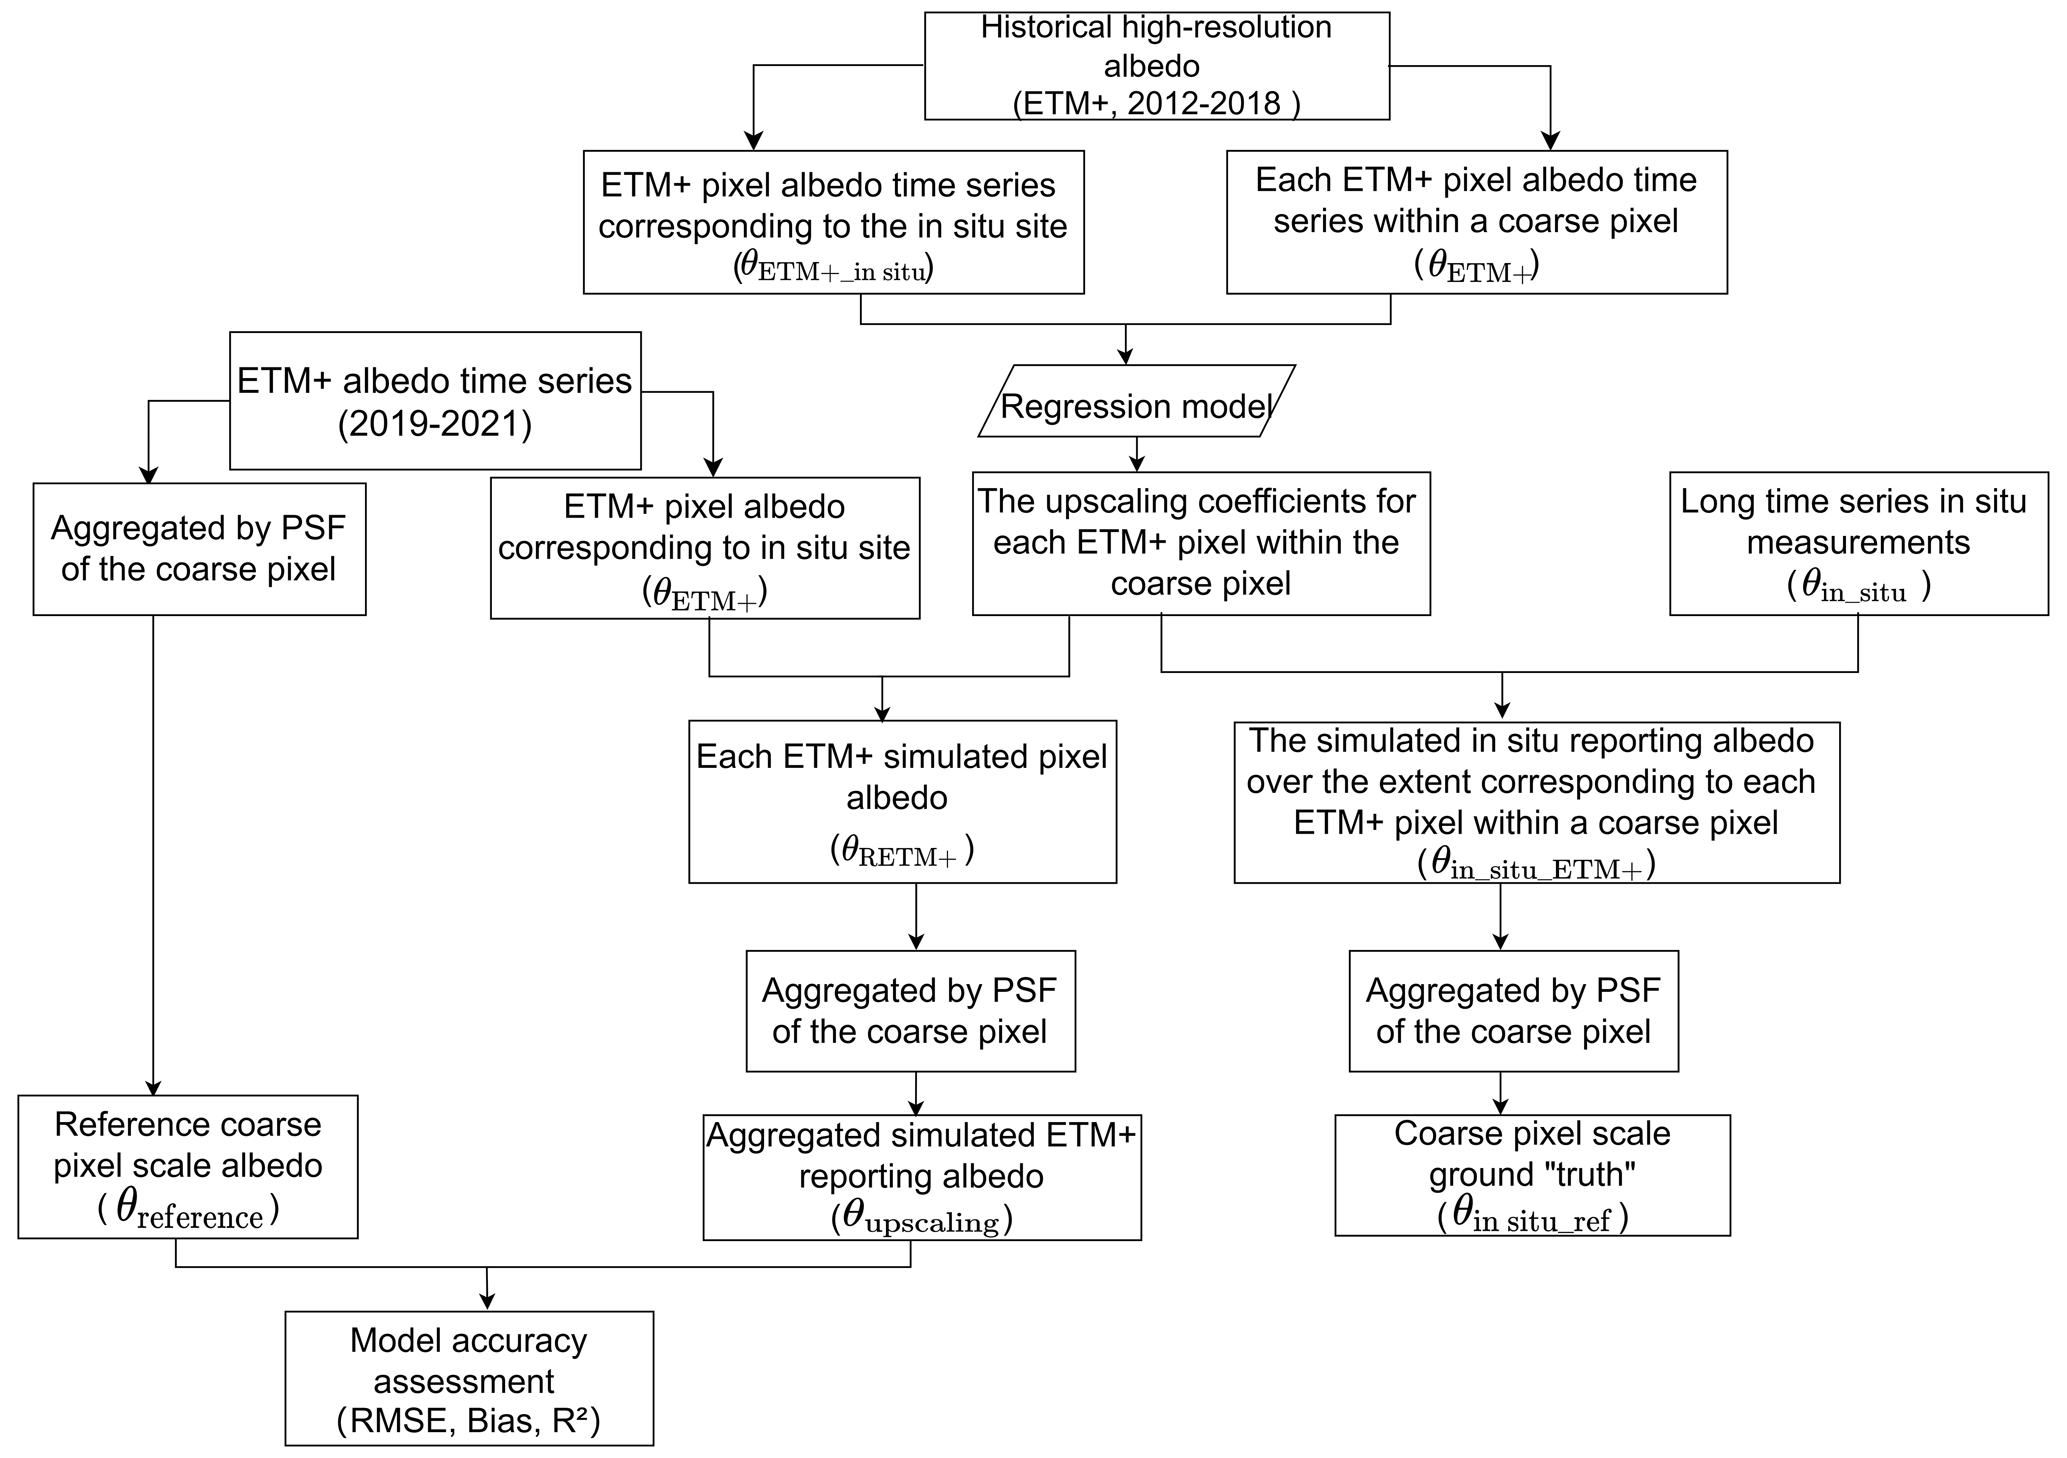
Figure 3The flowchart of generating the coarse pixel-scale ground “truth” based on the upscaling model.
3.1 The upscaling model specified for single in situ site measurements
In situ measurements taken at a single in situ site can provide accurate measurements on the point scale and offer continuous temporal variation information for long time series. However, they are insufficient for representing albedo at the coarse pixel scale due to the spatial heterogeneity within the coarse pixel. High-resolution albedo maps can capture the spatial variation information within the coarse pixel. The basic idea of the upscaling model is to derive the upscaling coefficients based on high-resolution albedo maps and to then apply these upscaling coefficients to long-term in situ measurements (Wu et al., 2020). In this way, both the spatial variation information and the temporal variation information of surface albedo can be captured through the combination of high-resolution albedo maps and long time series in situ measurements deriving the long time series pixel-scale ground “truth” data.
Since the high-resolution albedo maps serve as an important linkage between the in situ measurement scale and the satellite coarse pixel scale, they should meet several requirements. First, its spatial resolution should be minimal to ensure the surface homogeneity within the fine pixel scale and stable radiation acquisition. Second, approximately 80 % of the energy of the in situ observed signal originates from within 10–20 m of the flux tower (Cescatti et al., 2012; Wang et al., 2014a), and the pixel size of the high-resolution dataset should be near the footprint of in situ sites. Third, since the upscaling coefficients were determined by long time series high-resolution albedo maps and then were applied to long time series in situ measurements, the high-resolution albedo maps should cover at least one full cycle period, typically a year, to account for seasonal changes in surface heterogeneity caused by phenology and to guarantee the stability of the upscaling coefficients. For these reasons, the Landsat ETM+ albedo data were adopted in this study. In this paper, the Landsat ETM+ pixel is also called a subpixel relative to the coarse pixel.
The upscaling coefficients were calculated for each subpixel within the coarse pixel extent by establishing a regression relationship between one subpixel albedo time series and the subpixel albedo time series corresponding to the in situ site (Eq. 4). To avoid the uncertainty caused by different data sources, both of them were simulated by ETM+ albedo. Using the same data source can reduce the influence of errors in ETM+ albedo to a certain extent.
x and y correspond to the location of a single ETM+ pixel within a coarse pixel, while d denotes the date of the ETM+ albedo map. θETM+_in situ denotes the ETM+ albedo time series corresponding to the in situ site. The vector W represents the upscaling coefficients to be derived.
To ensure a robust estimation, a cost function J is established by combining all the ETM+ albedo data throughout the whole time series (i.e., 2012–2018).
Using the ordinary least-squares (OLS) algorithm, the vector of coefficients W can be obtained by minimizing the cost function.
When the upscaling coefficients were determined, they were applied to in situ site measurements (θin situ) to simulate the in situ reporting of surface albedo (θin situ_ETM+) over each ETM+ pixel within the coarse pixel.
Then the coarse-pixel ground “truth” (θin situ_ref) can be derived by aggregating all the θin situ_ETM+ within the coarse pixel using the point spread function (PSF) of the MODIS albedo characterized by Peng et al. (2015).
D denotes the spatial extent of the coarse pixel, and fPSF represents the PSF.
The upscaling coefficients in Eqs. (8)–(9) remain time-independent and can be used to upscale in situ measurements throughout the entire time series, except when sudden changes like wildfires or deforestation on the land surfaces occur. It is noteworthy that a high-resolution albedo map is no longer a prerequisite for the practical upscaling process once the upscaling coefficients have been obtained.
3.2 The evaluation of upscaling models and pixel-scale ground “truth”
3.2.1 The evaluation of the upscaling model
The accuracy of the generated albedo dataset hinges significantly on the quality of the upscaling model employed. In the study, a critical component of the upscaling approach involves the acquisition of upscaling coefficients derived from 30 m ETM+ albedo covering the period from 2012 to 2018. Consequently, the accuracy of the upscaling model is intricately tied to the performance of these coefficients. Inspired by the evaluation approach proposed by Wu et al. (2016), we conducted an assessment to gauge the accuracy and robustness of these upscaling coefficients. This evaluation involved a comparison between aggregated fine-scale albedo and reference coarse-scale albedo, utilizing ETM+ albedo data acquired from 2019 to 2021. The aggregated fine-scale albedo with the upscaling coefficients can be determined with Eqs. (10)–(11), and the reference coarse-scale albedo is the aggregated ETM+ albedo on the coarse pixel scale as recommended by Wu et al. (2016) (Eq. 12).
θETM+ and θRETM+ are the ETM+ albedo corresponding to the in situ site and each ETM+-simulated pixel albedo incorporating upscaling coefficients and θETM+. θupscaling denotes the upscaling results based on the θETM+ and upscaling coefficients. θreference represents the reference coarse pixel-scale albedo.
The similarity and consistency between θupscaling and θreference were evaluated by three metrics: bias, coefficient of determination (R2), and root-mean-square error (RMSE).
3.2.2 Assessment of the coarse pixel-scale ground “truth”
When the upscaling coefficients are determined, they can be applied to in situ measurements to derive the pixel-scale ground “truth” that aligns with the spatial resolution of coarse-resolution products. The evaluation process adheres to the previously outlined methodology (Sect. 3.2.1). That is, the reference coarse pixel-scale albedo (θreference) was also utilized to assess the accuracy of the coarse pixel-scale ground “truth” (θin situ_ref) as suggested by previous studies (Wu et al., 2016, 2020) as follows.
To eliminate the influence of the magnitude of surface albedo on accuracy indicators, the relative root-mean-square error (RRMSE) was used here, which is defined as the ratio of the RMSE to the mean surface albedo at the coarse pixel scale.
θin situ_ref and represent the coarse pixel-scale “truth” and the mean value of the coarse pixel-scale “truth”, and L denotes the length of the temporal sequence of data.
It is important to note that the θreference dataset used here is not necessarily the same as that in Sect. 3.2.1 due to the different match pairs in the temporal domain. In Sect. 3.2.1, θreference is the result of the match between θETM+ and θRETM+ as shown in Eqs. (11)–(12). By contrast, in this section, θreference is the result of the match between θETM+ and θin situ as shown in Eqs. (8)–(9) and Eq. (12). In addition to these accuracy indicators, the performance of the coarse pixel-scale ground “truth” was also assessed through the comparison with single in situ site measurements.
3.2.3 Measure of spatial heterogeneity
Spatial heterogeneity is a critical factor influencing the spatial-scale match between in situ and satellite measurements, because it reduces the spatial representativeness of in situ measurements (Wu et al., 2022). It refers to the uneven distribution of surface albedo within a coarse pixel. A pixel that exhibits spatial heterogeneity shows that the value of the surface albedo at one location is different from that of other locations. To quantify the spatial heterogeneity of surface albedo within a coarse pixel, the spatial variability (standard deviation, SD) of all subpixel albedos within a coarse pixel was calculated as recommended by previous studies (Colliander et al., 2017; Jin et al., 2003). Here, the subpixel albedos denote the high-resolution pixel albedo (i.e., the Landsat ETM+ pixel albedo) within the coarse pixel.
Zi denotes the high-resolution albedo, and is the averaged albedo of all high-resolution albedos within the extent of the coarse pixel. L refers to the number of high-resolution albedo pixels with a coarse pixel.
4.1 The performance of the upscaling model
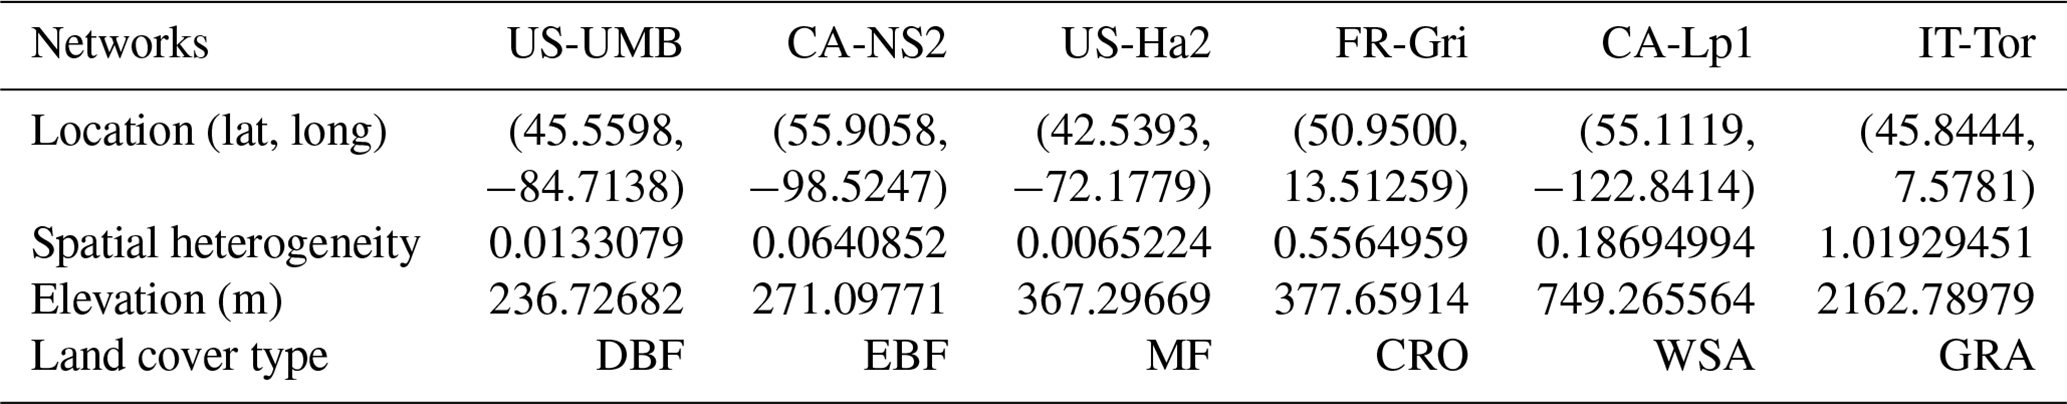
The performance of the upscaling coefficients has been comprehensively evaluated over the 416 in situ sites. The wide spread of in situ sites across different elevations, different land cover types, and different degrees of spatial heterogeneity can ensure the objectivity of the evaluation results. To show the agreement between θupscaling and θreference more intuitively, we present the scatterplots between them in Fig. 4. As shown in Fig. 4, the scatterplots between θupscaling and θreference are generally distributed around the 1:1 line, with R2 close to 0.9. The upscaling coefficients show no systematic error, indicated by the biases close to 0. However, the performance of the upscaling models is site-dependent. For instance, the accuracy of the upscaling models over the US-Ha2 site obviously outperforms that of the IT-Tor site (Fig. 4c vs. f). It is apparent that the RMSE, R2, and sample size are unrelated. For instance, US-UMB and CA-NS2 share comparable environmental conditions despite their dissimilar sample sizes, yet their RMSE and R2 are similar. To fully understand the performance of upscaling coefficients under different conditions, the accuracy indicators of the upscaling coefficients throughout these 416 in situ sites are summarized as the histograms (Fig. 5).
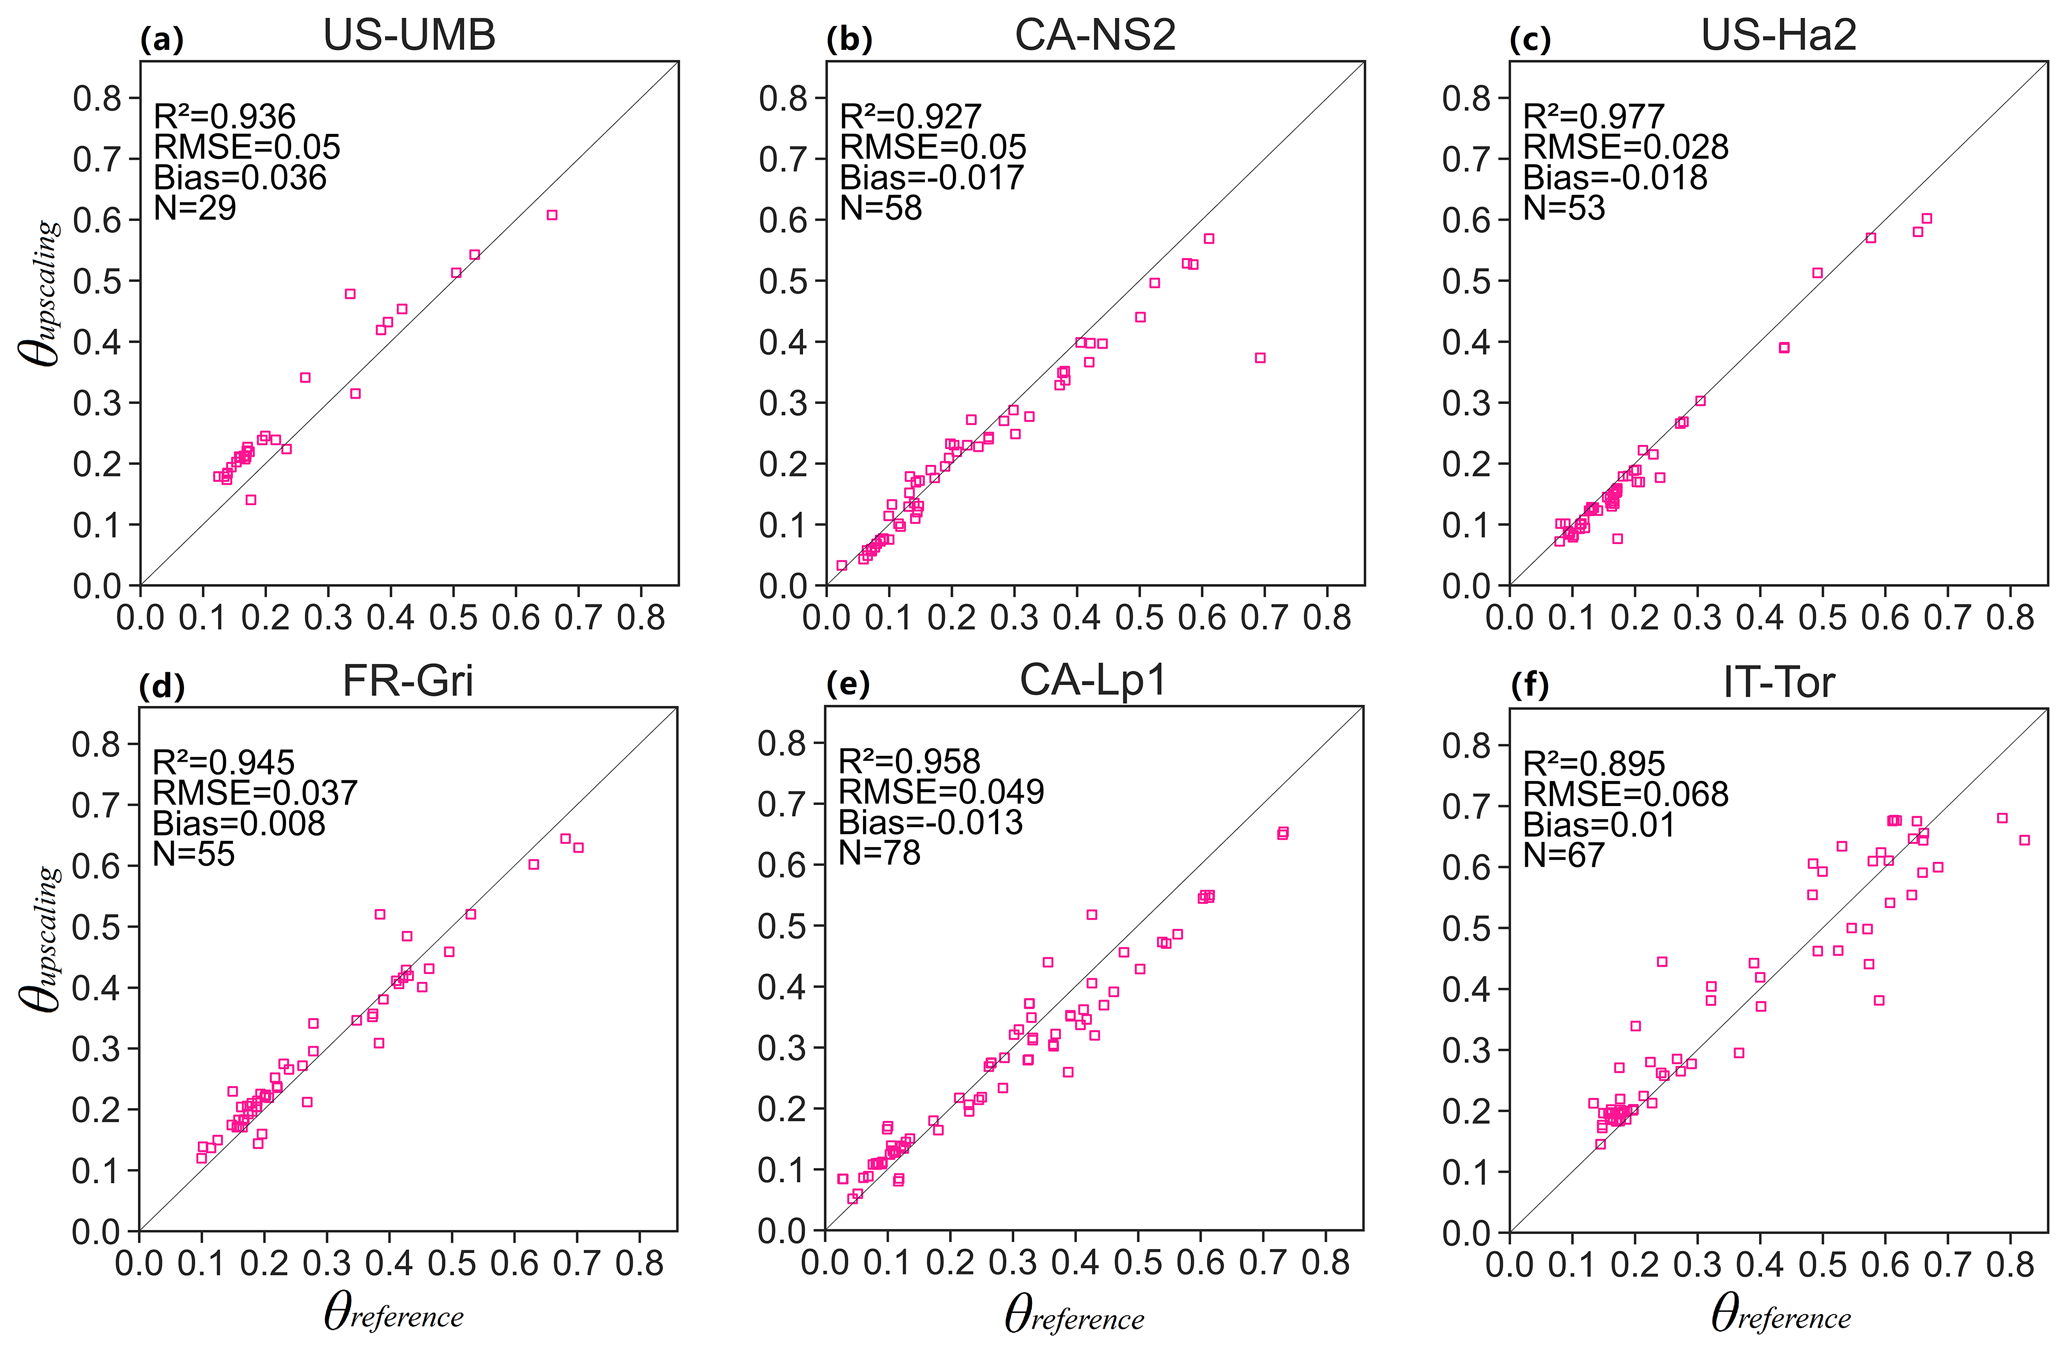
Figure 4The scatterplots between the upscaling results (θupscaling) with the upscaling models and the coarse pixel-scale reference (θreference). Only parts of the results are shown for conciseness. Specifically, only one in situ site is shown for each land cover type.
Table 1Description of the in situ sites used in the model performance analysis.
Based on the results presented in Fig. 5, it can be seen that the overall accuracy of the upscaling coefficients is satisfactory. The biases range from −0.06 to 0.10, and more than 90 % of them are within the range of ±0.02 (Fig. 5b). The highest density of R2 is between 0.9 and 1 as shown in Fig. 5c, and only a small part of the sites show a relatively small R2 of lower than 0.8 but larger than 0.5. Nevertheless, it should be noted that those sites exhibit a more scattered distribution of RMSE values, with a maximum of 0.1 and a minimum of 0.01 (Fig. 5a). The highest density is between 0.03 and 0.05 for the RMSE.
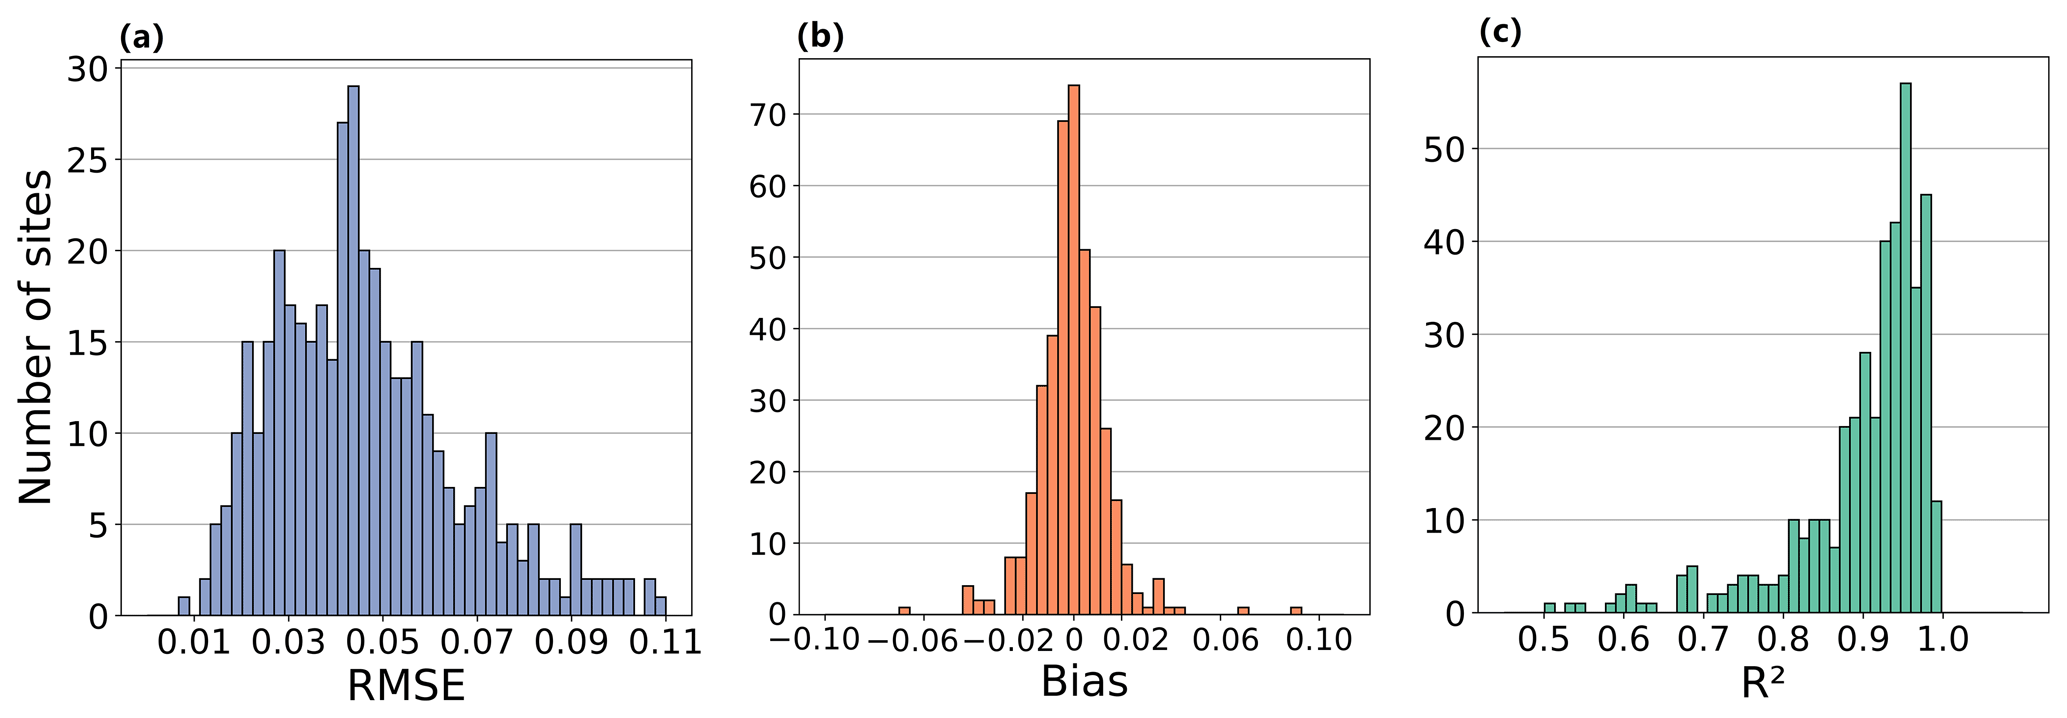
Figure 5Distribution of the RMSE (a), bias (b), and R2 (c) of the upscaling coefficients. The histograms presented here combine the results of the 416 in situ sites.
As can be seen from the accuracy distribution of the upscaling model, the proportion of the sites with a reasonable RMSE and R2 is more than 65 %. Moreover, the RMSE and R2 show consistent instructions about the performance of the upscaling model as shown in Fig. 6. For instance, in the case of optimal R2, the RMSE is very likely to be less than 0.05. By contrast, the poor RMSE is generally accompanied by the poor R2 of the model. The distribution of the sites with poor RMSE and R2 is dispersed and is not location-specific. Both GCOS (GCOS-154, 2011) and CEOS LPV albedo best-practice protocols (Wang et al., 2019) indicate the better performance of BSRN than the other networks. However, this phenomenon does not occur with this upscaling model given the comparable RMSE and R2 among the different networks.
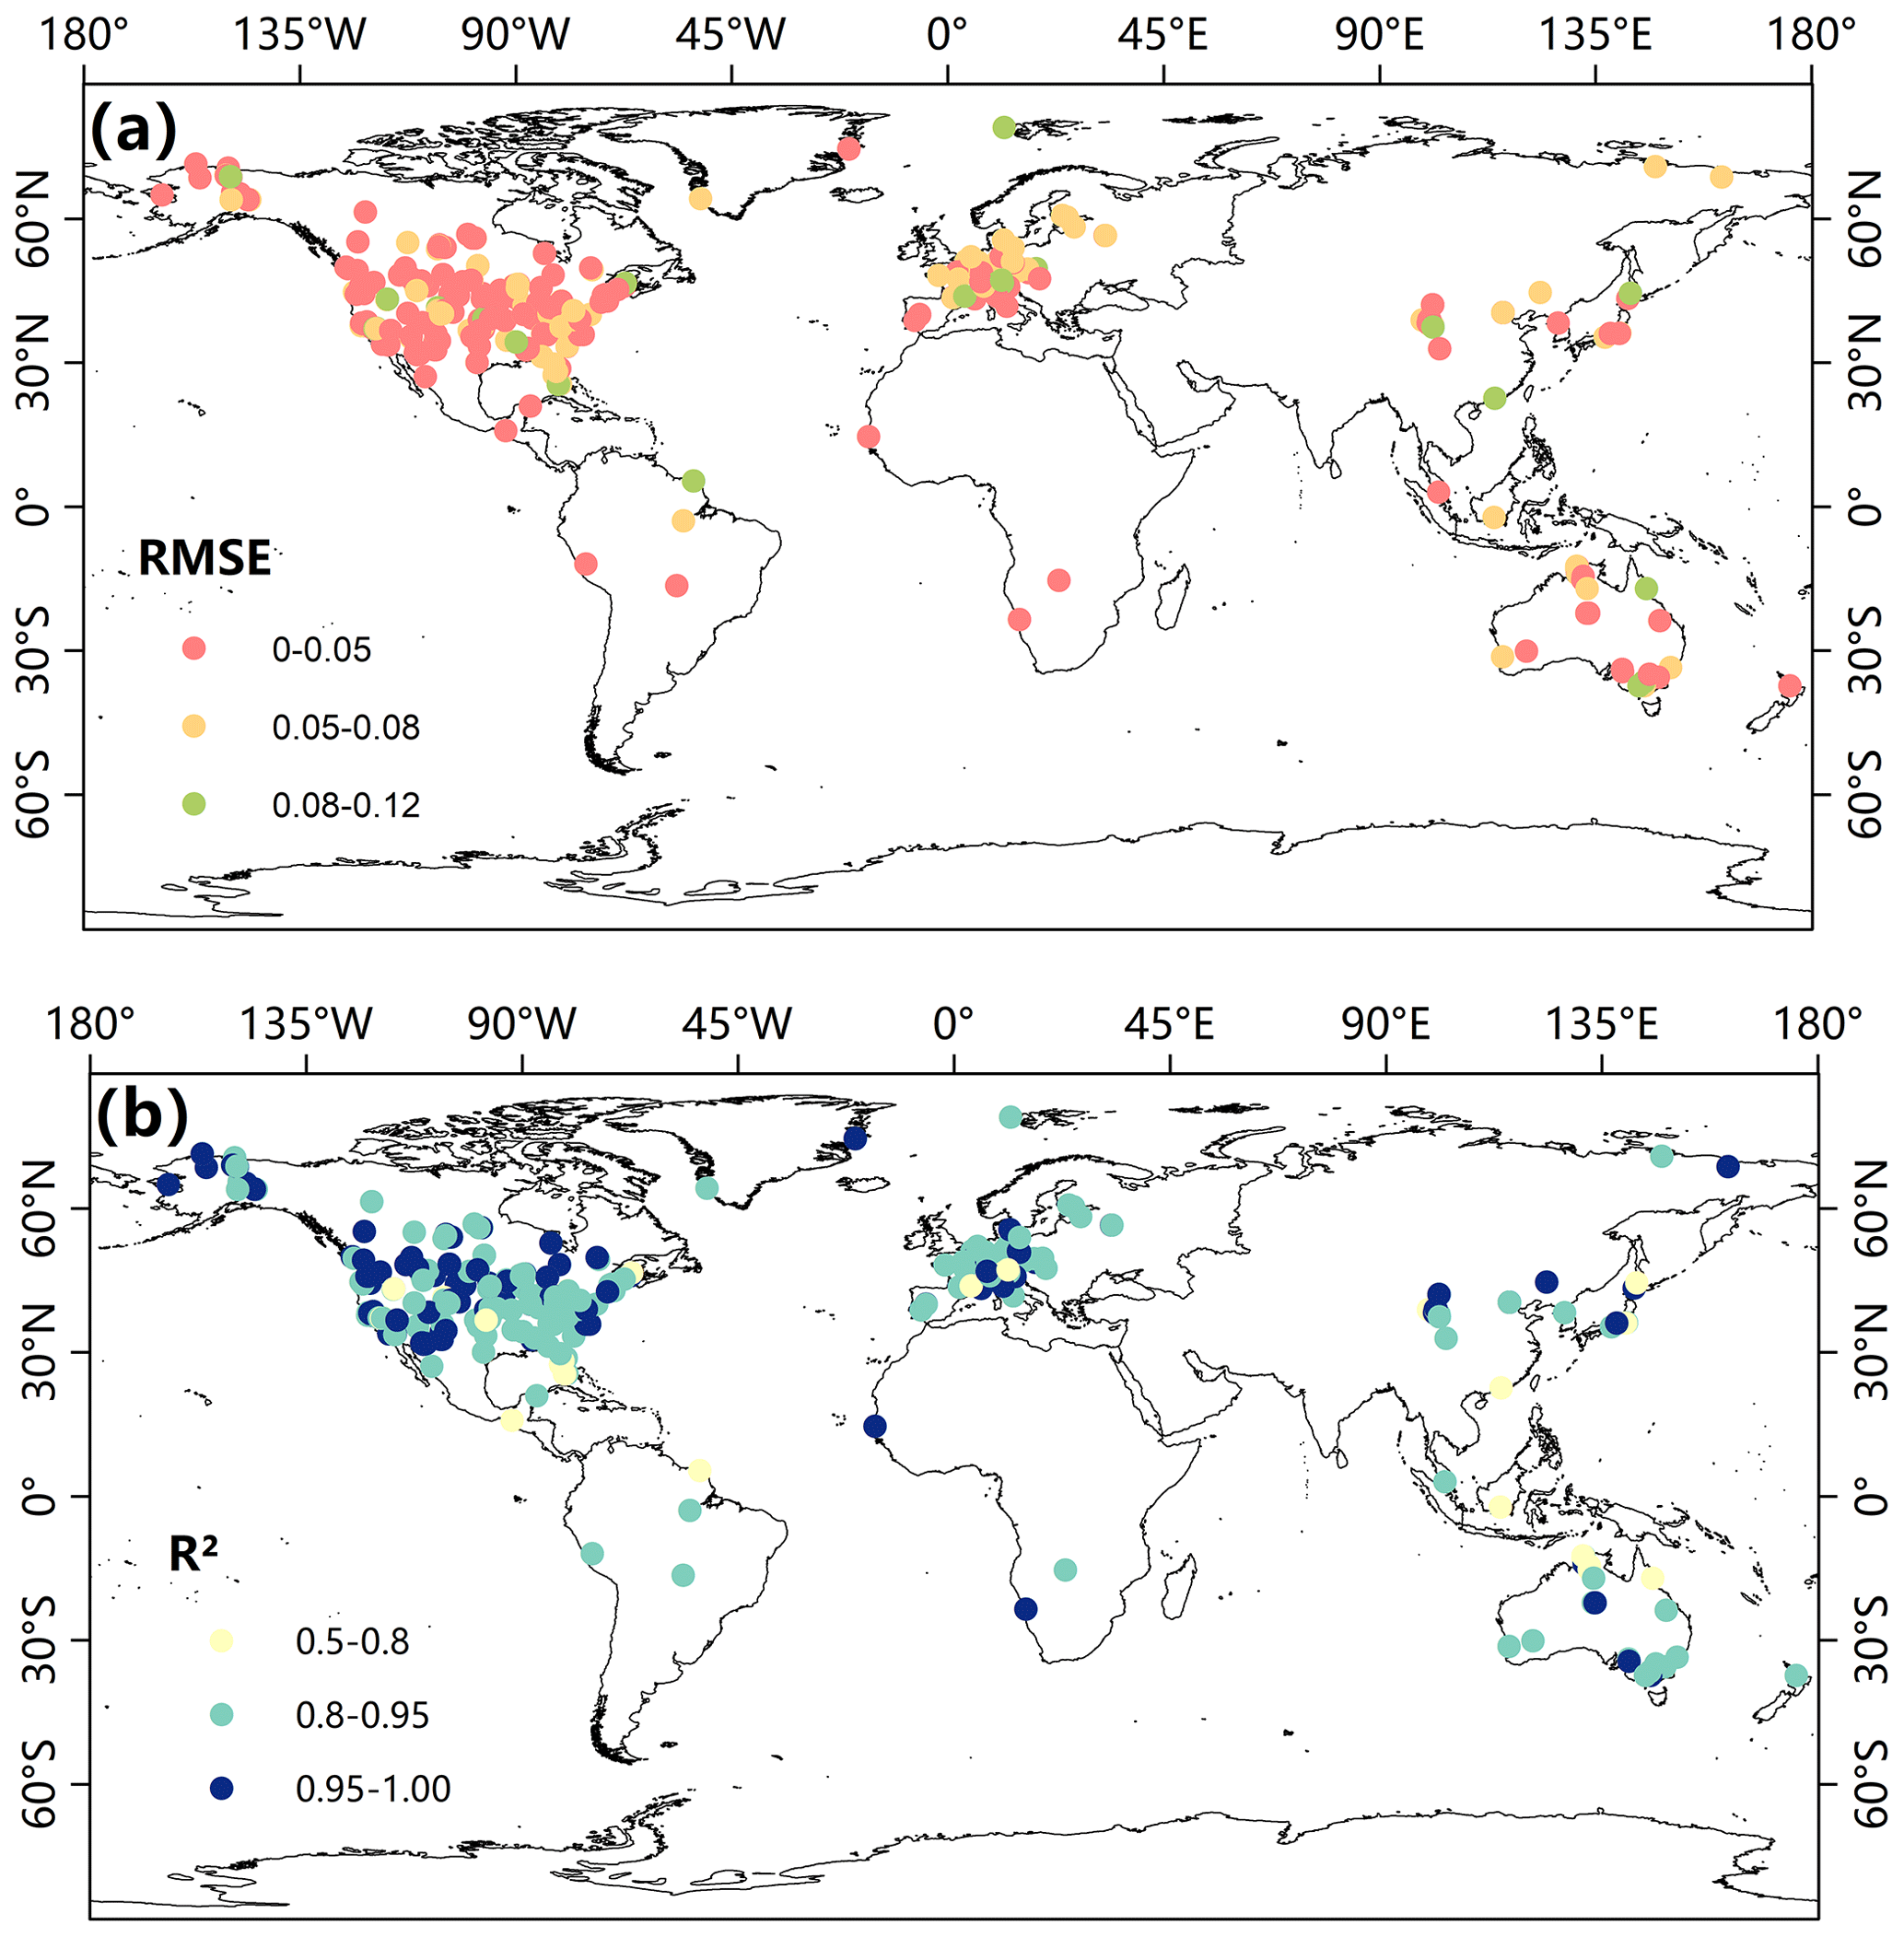
Figure 6Spatial distribution of the RMSE (a) and R2 (b) of the upscaling model.
Given the fact that the accuracy of the upscaling models shows great variability, it is necessary to explore the influencing factors on the performance of the upscaling models. In this study, the effects of land cover type, elevation, and spatial heterogeneity were considered. The influence of spatial heterogeneity on the accuracy of the upscaling model is displayed in Fig. 7. The RMSE exhibits a significant positive correlation with spatial heterogeneity (Fig. 7a), with superior performance often observed in areas with lower spatial heterogeneity. Similarly, the R2 of different sites typically decreases with the increase in spatial heterogeneity (Fig. 7b). It is worth noting that, when the spatial heterogeneity exceeds 0.1, the R2 of the model fluctuates considerably, indicated by the larger height of the boxplots. Based on these results, it can be seen that the spatial heterogeneity has enormous implications for the performance of the upscaling models. One possible reason is that the assumption of a linear relationship between the subpixel albedo of the other locations and the subpixel albedo containing the in situ site cannot be satisfied over the surface with large spatial heterogeneity.
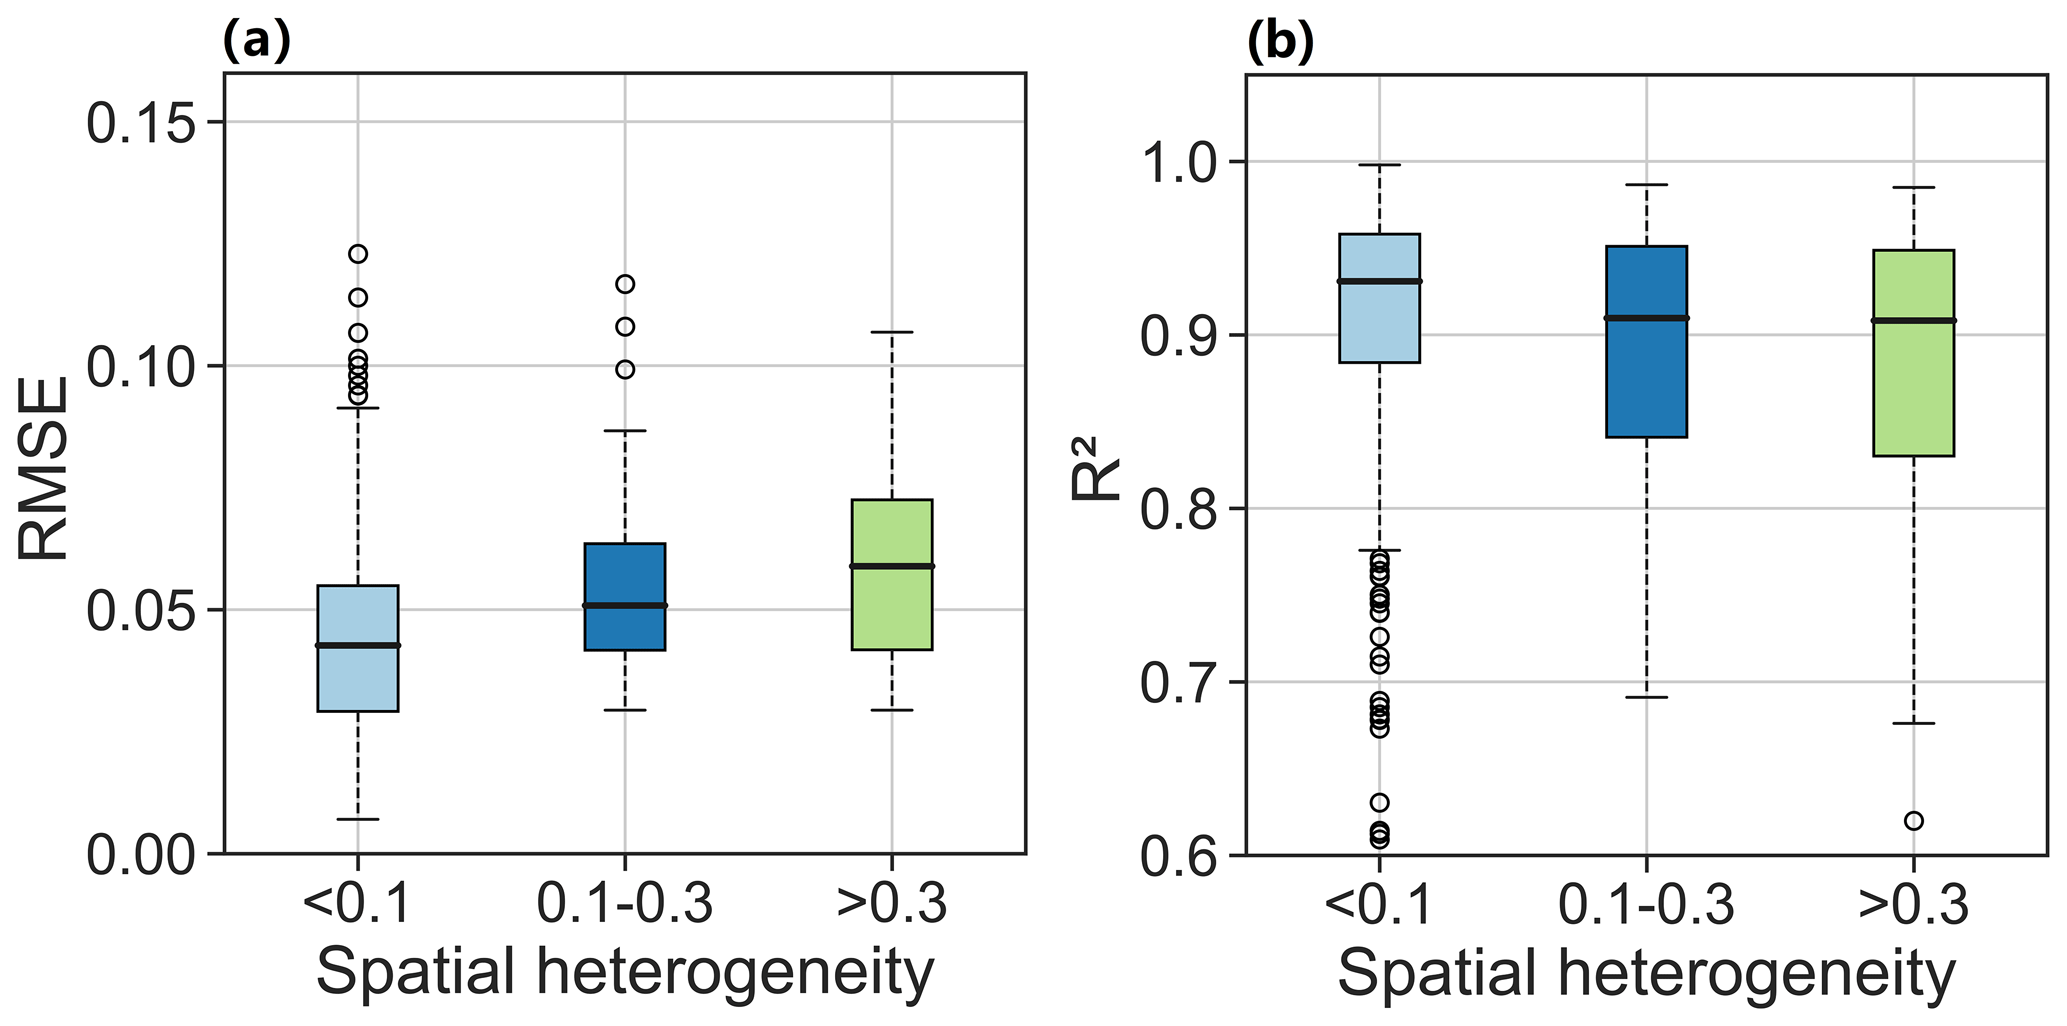
Figure 7Boxplots showing the dependence of the RMSE (a) and R2 (b) of the upscaled albedo on spatial heterogeneity. Three different degrees of spatial heterogeneity are marked by different colors. Black lines indicate median values. Outliers are values that are farther than the 1.5 interquartile ranges. The number of in situ sites with spatial heterogeneities of [0–0.1], [0.1–0.3], and [0.3–1.5] are 337, 49, and 30, respectively.
Figure 8 illustrates the RMSE and R2 of the upscaling model as a function of elevation. Notably, the upscaling model exhibits the highest accuracy at elevations below sea level, with the lowest median RMSE of about 0.03 and the highest median R2 of more than 0.95. In contrast, the model performs poorly at elevations exceeding 2500 m, with the highest RMSE and the lowest R2. However, there are no significant trends of RMSE and R2 in the areas with an altitude between 0 and 2500 m above sea level. There is merely a slight decreasing trend as the altitude increases from 0–200 m to 500–1500 m, but then a slightly increasing trend appears as the altitude increases from 500–1500 m to above 2500 m. Both RMSE and R2 exhibit significant variability, indicated by the large heights of the boxplot, except for regions where the elevation is less than 0 m. These results imply that the accuracy of the upscaling models is subject to a diverse array of factors. The good performance of the upscaled model in the area below sea level may be attributed to the limited spatial variability given that the spatial heterogeneity of the region below sea level is less than 0.1 as shown in Fig. 9. By contrast, the poor accuracy of the upscaling model above 2500 m may be partly attributed to the fact that the areas above 2500 m have complex and undulating topography with elevations ranging from 2500 to 4000 m. These results demonstrate that the substantial variation in elevation also significantly impacts the performance of the upscaling model.
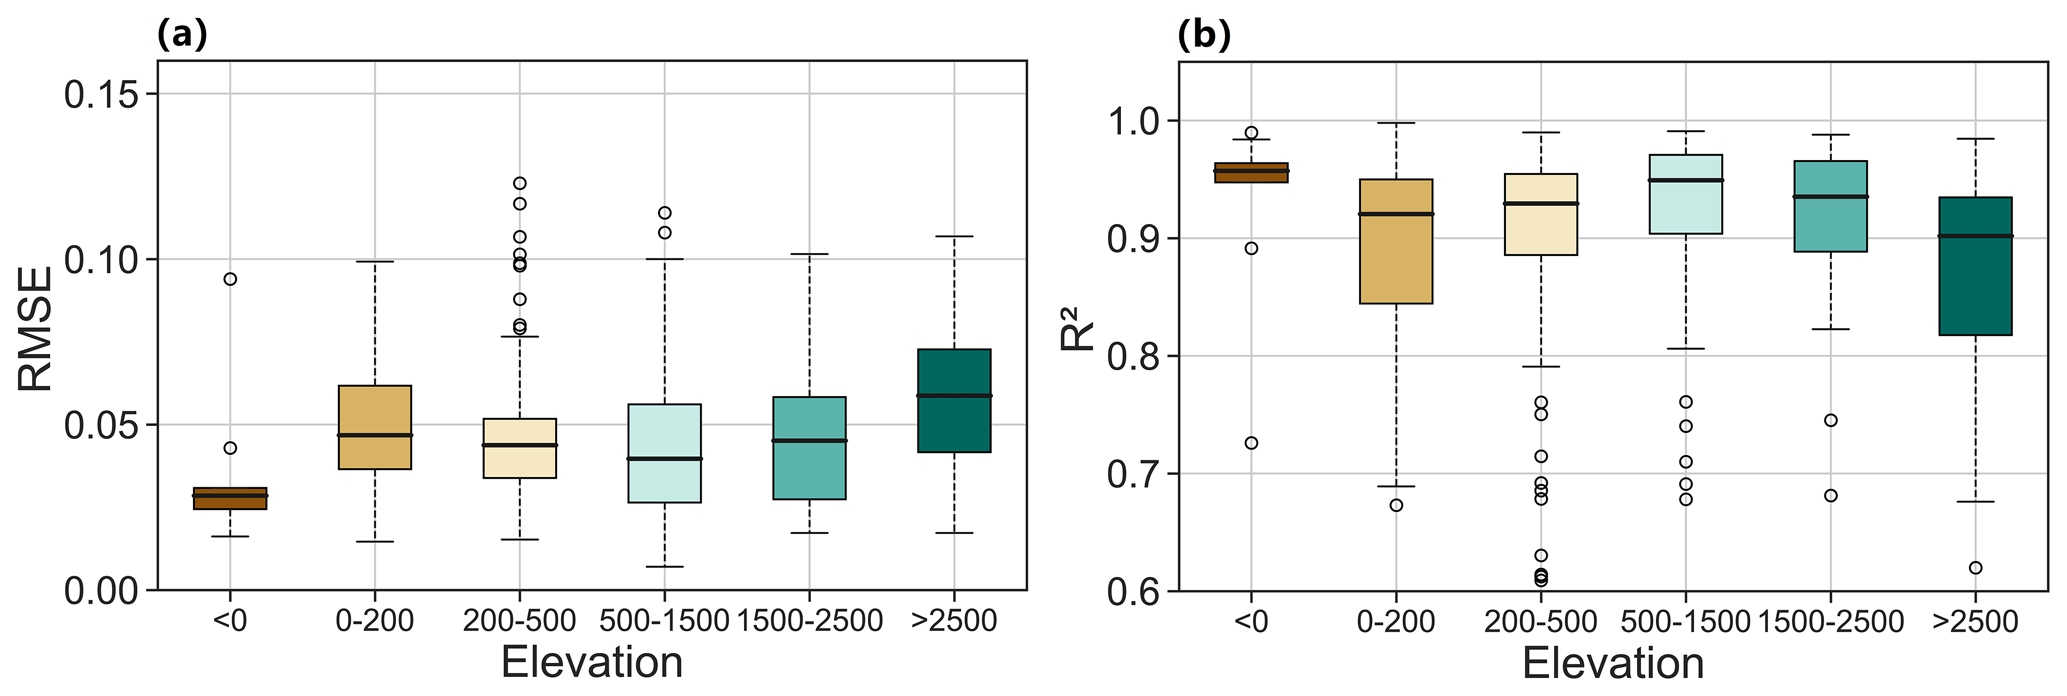
Figure 8The variations of RMSE (a) and R2 (b) with elevation. The accuracy of upscaling models responds to different elevations when the elevation is below sea level (n = 9), [0–200] (n = 114), [200–500] (n = 162), [500–1500] (n = 78), and [1500–2500] (n = 32), above 2500 m (n = 21). Black lines indicate the median values. Outliers are values that are farther than the 1.5 interquartile ranges.
As illustrated in Fig. 9, the RMSE significantly rises with the augmentation of spatial heterogeneity at each level of elevation. This indicates that spatial heterogeneity plays a dominant role in determining the performance of the upscaling models. Nevertheless, the influence of spatial heterogeneity seems to be related to the elevation. As shown in Fig. 9a, there is a tendency for the difference in the median RMSE between different levels of spatial heterogeneity, which increase gradually with the elevation, and a similar pattern is observed for R2. However, the trends of RMSE and R2 with altitude are not the same for each level of spatial heterogeneity. The trends for regions with low spatial heterogeneity (< 0.1) were not significant. In contrast, regions exhibiting high spatial heterogeneity (> 0.3) showed an increasing or decreasing trend for the RMSE or R2 with elevation, particularly for the area above 500 m.
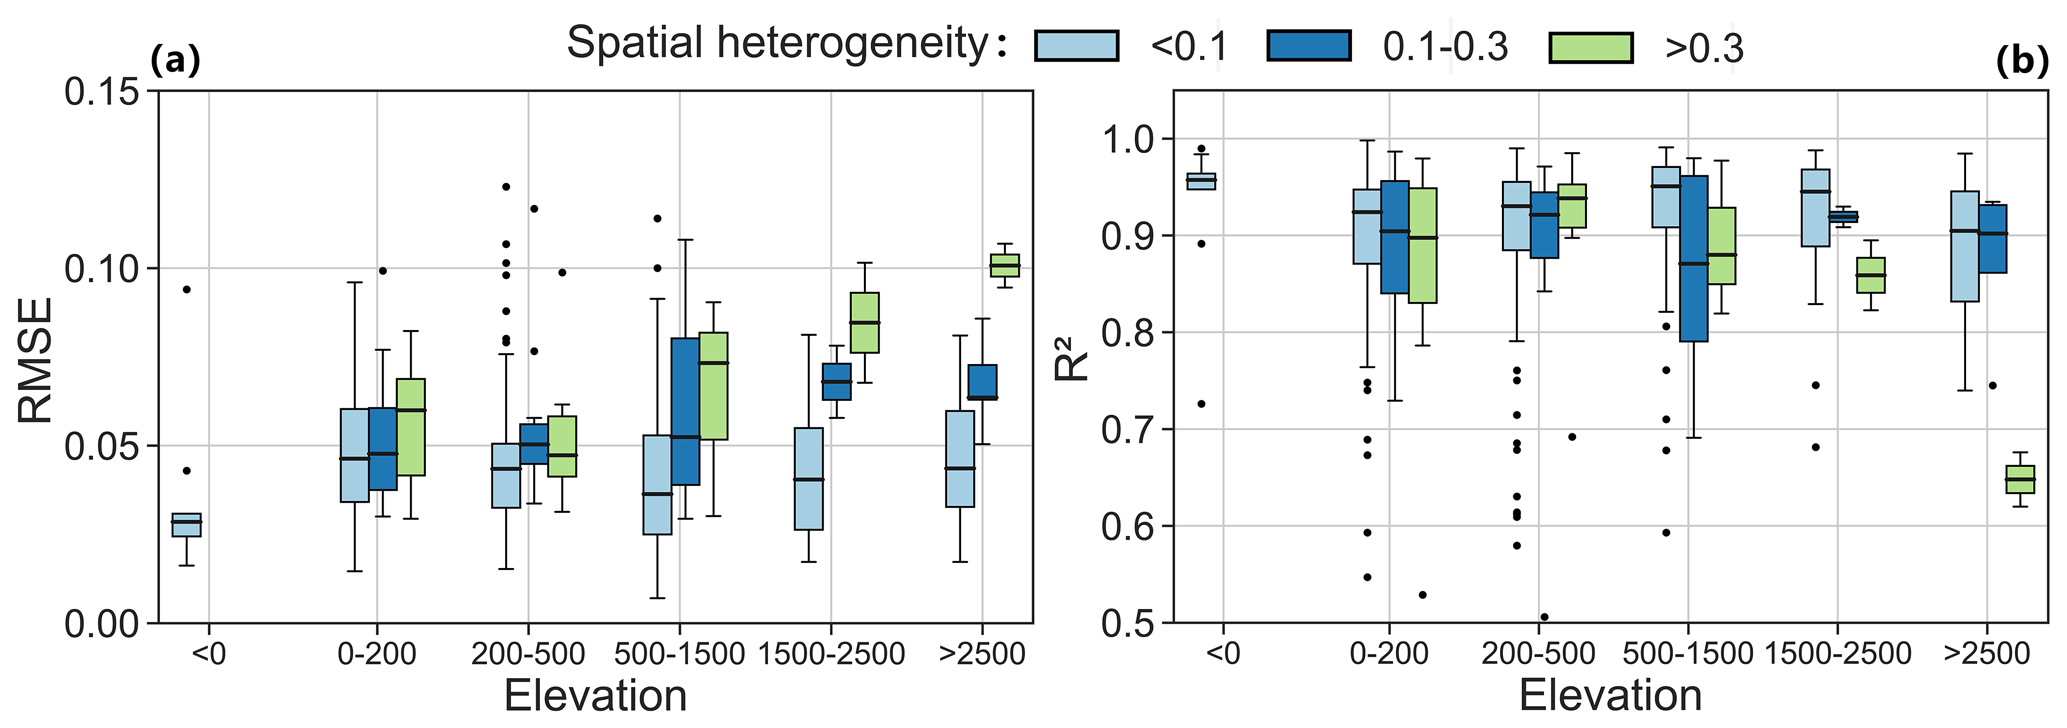
Figure 9The plots show the combined results of the RMSE (a) and R2 (b) variations based on elevation and spatial heterogeneity. Black lines indicate the median values. Outliers are values that are farther than the 1.5 interquartile ranges.
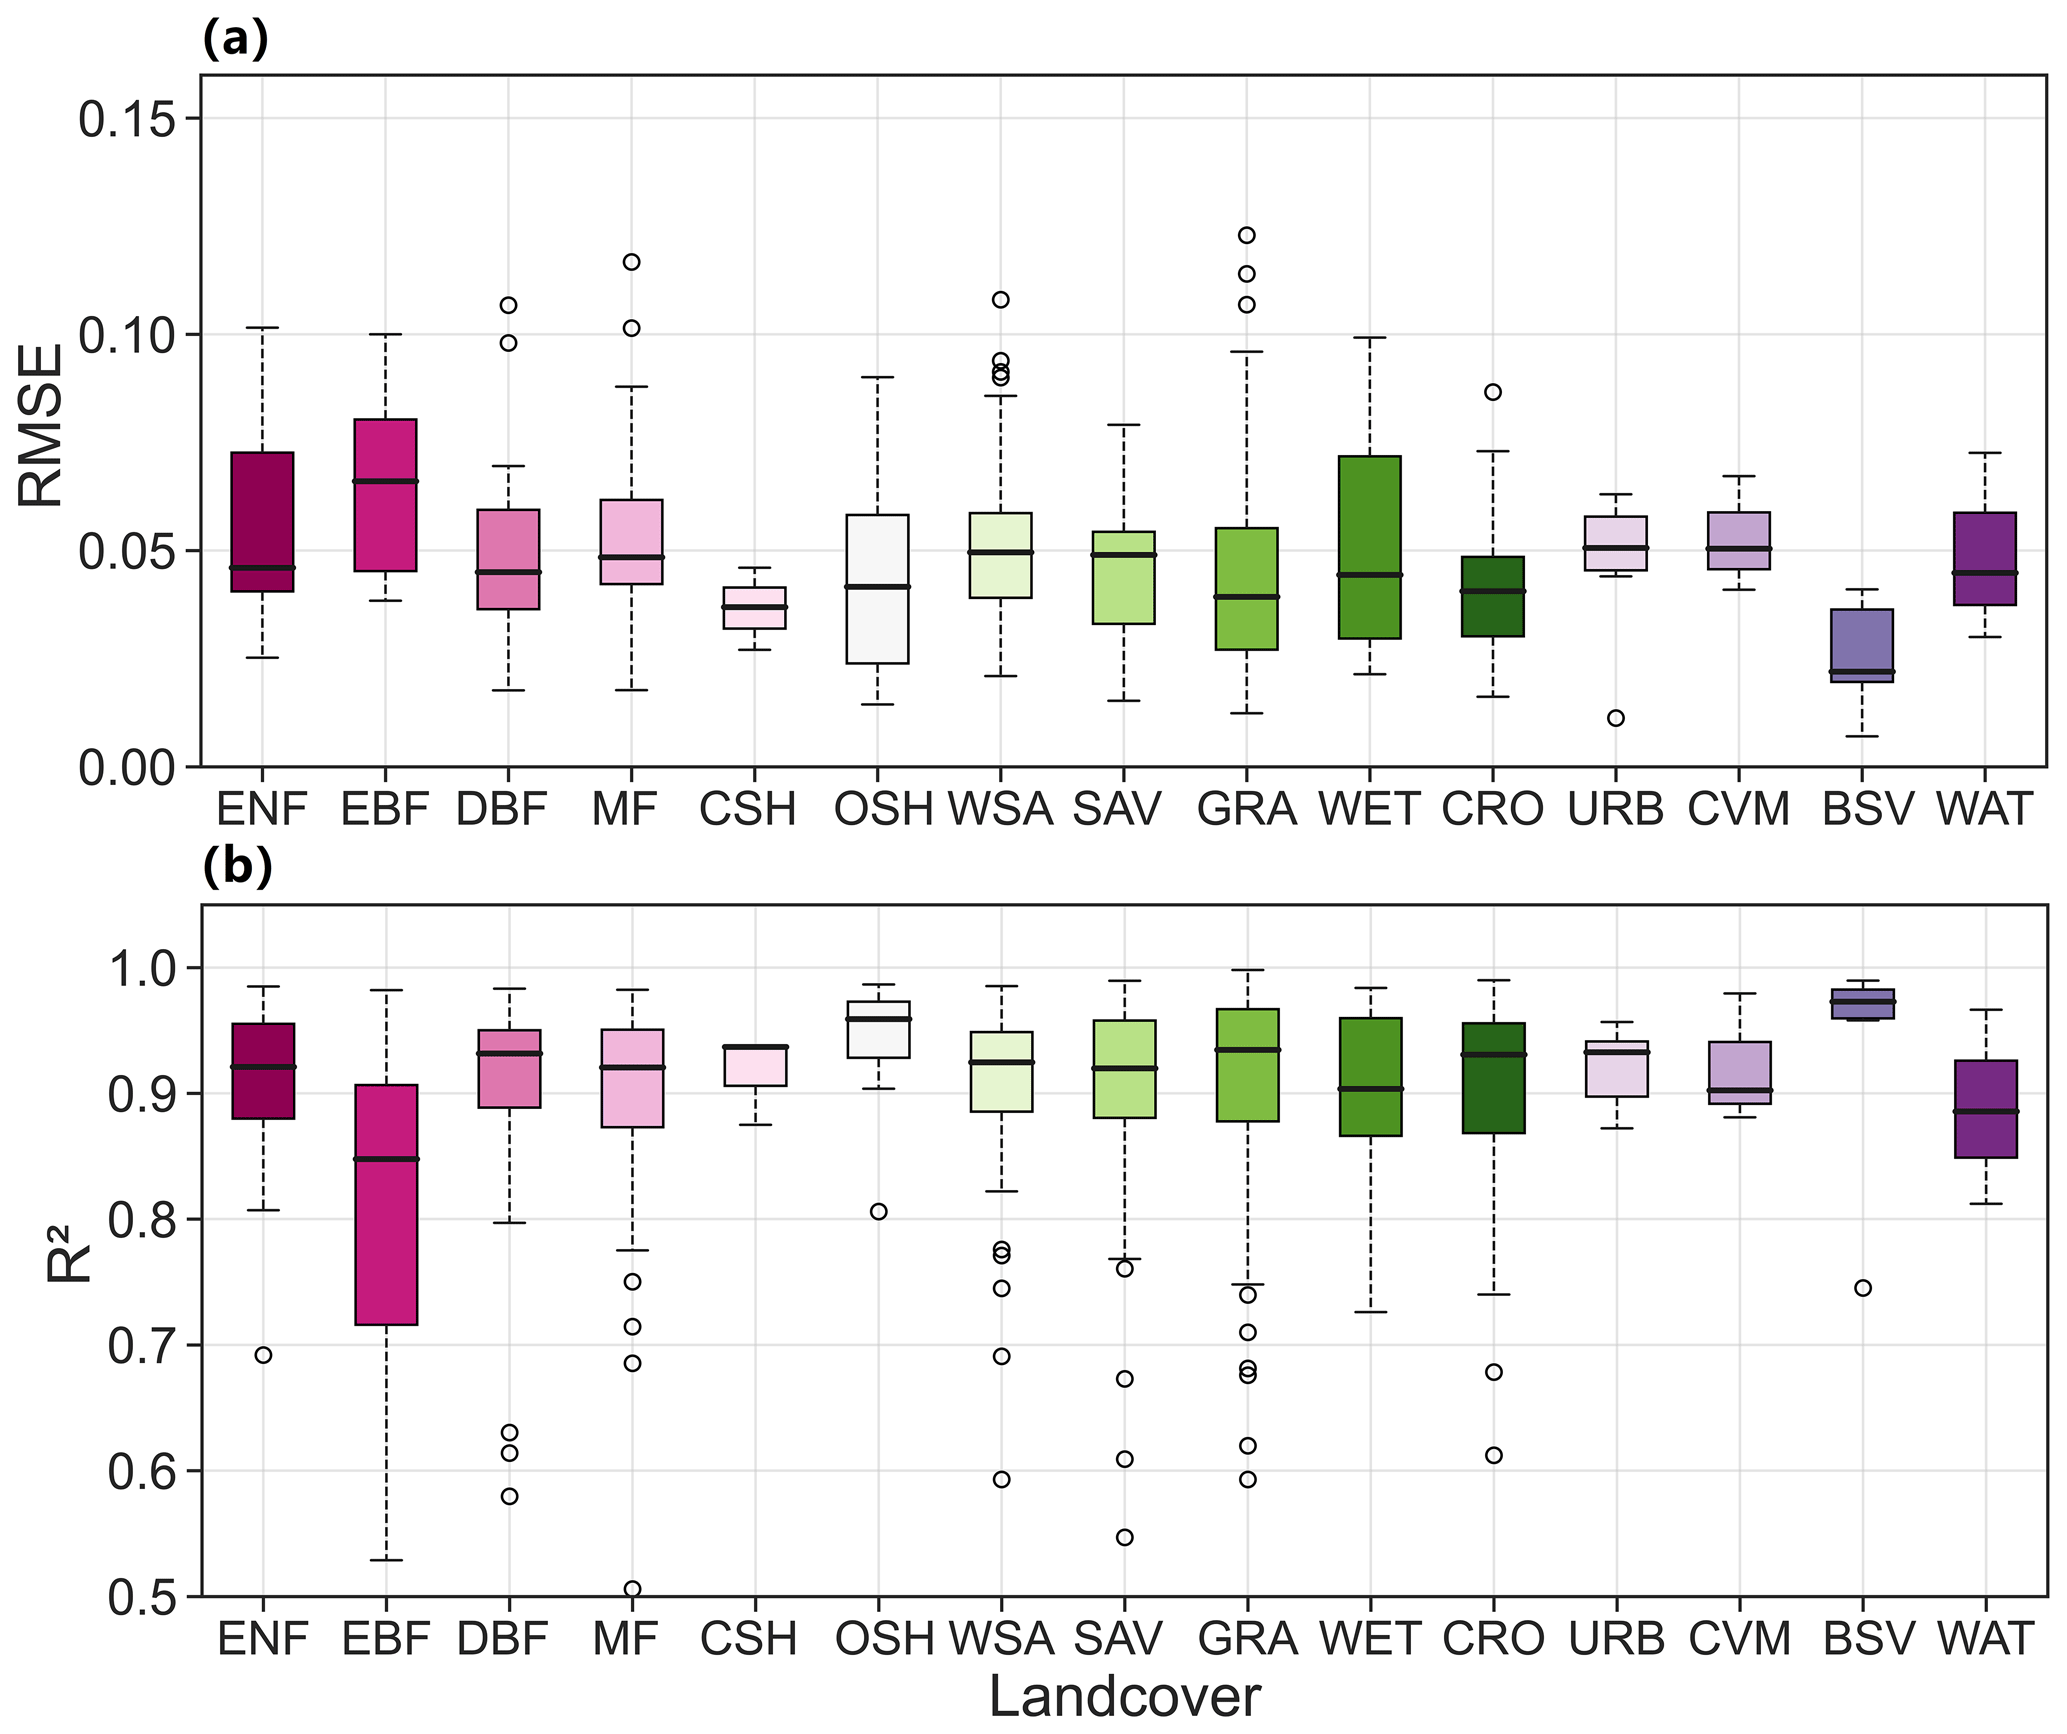
Figure 10The variations in RMSE (a) and R2 (b) are dependent on land cover. Different colors refer to the 15 different land cover types. The accuracy of the upscaling models responds to the different land cover types when the land cover types are ENF (n = 25), EBF (n = 10), DBF (n = 39), MF (n = 35), CSH (n = 4), OSH (n = 23), WSA (n = 46), SAV (n = 21), GRA (n = 104), WET (n = 11), CRO (n = 77), URB (n = 8), CVM (n = 4), BSV (n = 6), and WAT (n = 3). Black lines indicate median values. Outliers are values that are farther than the 1.5 interquartile ranges.
The influence of land cover type on the accuracy of the upscaling model is displayed in Fig. 10. It is revealed that the performance of the model is considerably insufficient for evergreen broadleaf forest (EBF), as most of the RMSEs exceed 0.05 and the R2 values are below 0.90. By contrast, the model delivers the optimal outcomes for barren (BSV), with the smallest RMSE being approximately 0.01 and with a relatively high R2 value of around 0.97. The accuracy of the model is comparable across all the other surface cover types, with RMSE and R2 values of approximately 0.05 and 0.90, respectively. Additionally, the accuracy remains consistent for CSH, URB, and CVM based on the small range of RMSE boxplots, indicating an overall stable model performance. On the other hand, the RMSE boxplots for ENF and EBF exhibited a significant range of values, highlighting the substantial variation in the model performance in these regions. Furthermore, the impact of the land cover type is elaborately connected to the influence of spatial heterogeneity. Figure 11 illustrates that there is limited spatial heterogeneity for the BSV, while considerable locations with EBF exhibit pronounced spatial heterogeneity.
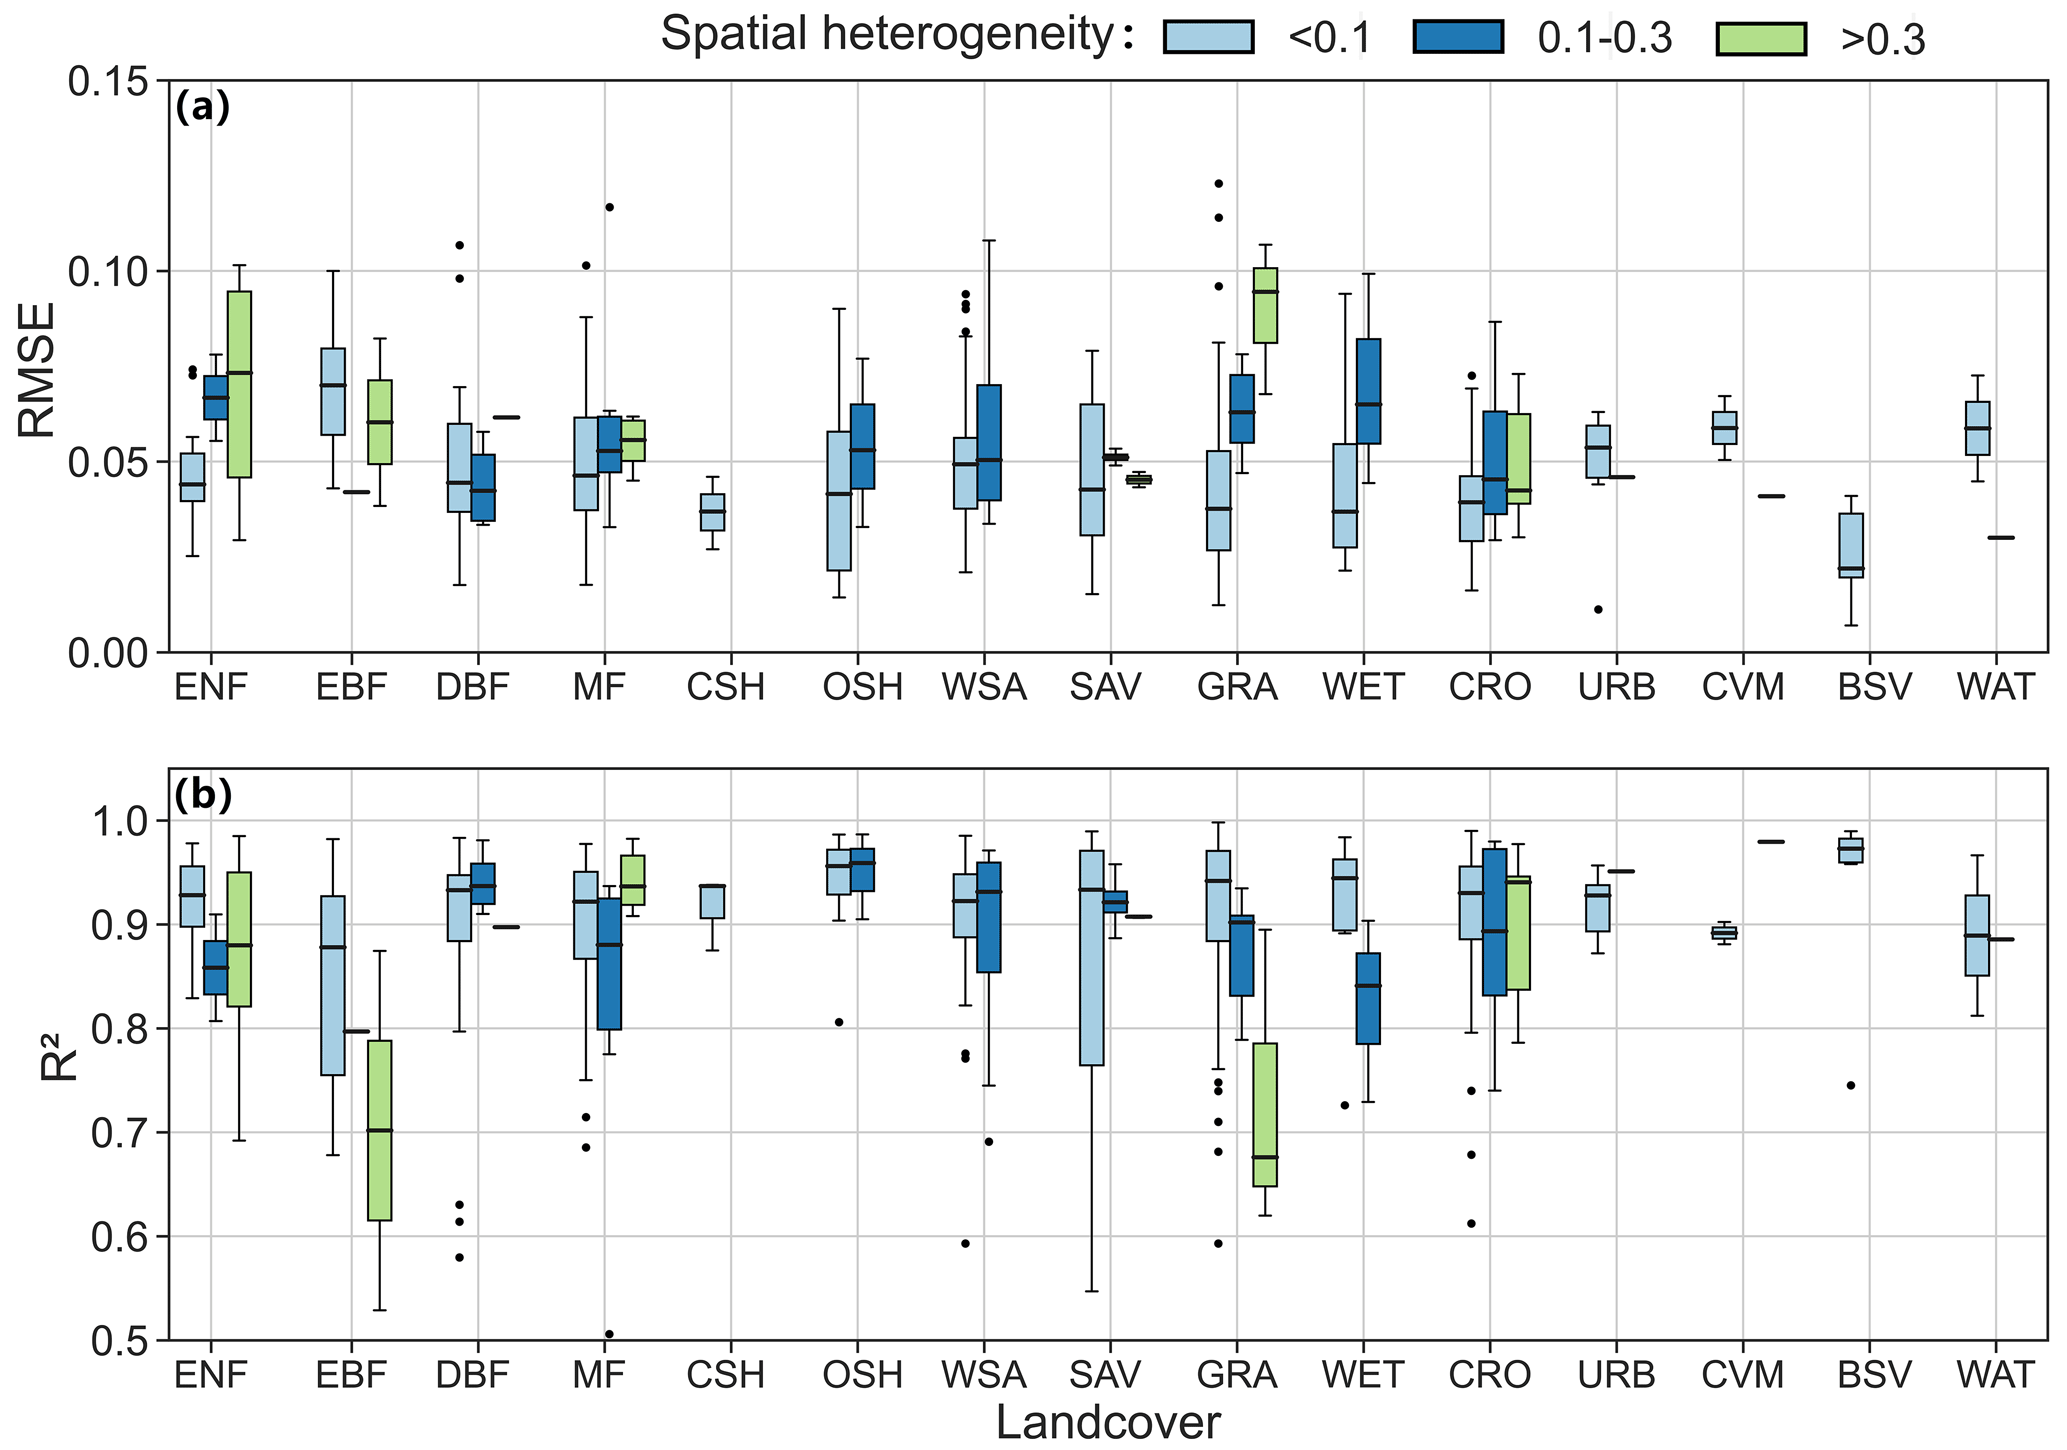
Figure 11The plots show combined results of the RMSE (a) and R2 (b) variations based on land cover and spatial heterogeneity. Black lines indicate median values. Outliers are values that are farther than the 1.5 interquartile ranges.
As shown in Fig. 11a, the RMSE of the upscaling model basically presents an increasing trend with spatial heterogeneity over each land cover type, further indicating the dominant role of spatial heterogeneity in determining the accuracy of the upscaling model. The stable accuracy of the upscaling models at OSH, URB, and CVM is attributed to fewer sites with a relatively large spatial heterogeneity. Nevertheless, the influence of spatial heterogeneity shows dependence on land cover type, which is most significant on GRA.
4.2 The accuracy of the pixel-scale ground “truth”
Since there are a considerable number of in situ sites, the accuracy of the pixel-scale ground “truth” was summarized as the boxplots (Fig. 12). For comparison purposes, the errors in single-site measurements when they were directly used as the pixel-scale reference were also calculated and summarized as the boxplots. It can be seen that the errors in the pixel-scale ground “truth” show a slight variation with spatial heterogeneity, with the median RRMSE ranging from 88.35 % to 113.69 % and then to 138.26 %, resulting in the overall RRMSE of 95.20 %. It is important to note that this variation pattern is not the same as the accuracy of the upscaling model, which shows a monotonous decreasing trend with the increase in spatial heterogeneity. The wide range of the boxplots shows that the accuracy of the pixel-scale ground “truth” is also influenced by other factors. Although the errors of the pixel-scale ground “truth” are not negligibly small, it is important to note that this kind of error cannot reveal the absolute accuracy of the pixel-scale ground “truth” given that the reference data themselves contain errors. In fact, the focus of this evaluation is not the value of RRMSEs but the difference in RRMSEs between the pixel-scale ground “truth” and single in situ site measurements. It can be seen that the accuracy of the pixel-scale ground “truth” is consistently better than the single-site measurements over the surfaces with different levels of spatial heterogeneity as shown in Fig. 12. The smaller RRMSE of the pixel-scale ground “truth” (95.20 % vs. 101.24 %) indicates that this dataset can improve the overall accuracy of pixel-scale reference data a lot compared to the single-site measurements. Nevertheless, the degree of improvement depends on the situation, which is most significant over the sites with the strongest spatial heterogeneity, with the RRMSE decreasing from 155.35 % to 138.26 %. The in situ sites with medium spatial heterogeneity follow, with the RRMSE decreasing from 127.91 % to 113.69 %. The improvements are smallest over the sites with the smallest spatial heterogeneity, with the RRMSE decreasing from 92.03 % to 88.35 %. Hence, it can be concluded that the degree of improvements of this dataset shows an increasing trend with spatial heterogeneity. Furthermore, the accuracy of the pixel-scale ground “truth” dataset is more stable than that of the single-site measurements, indicated by the smaller height of the boxplots of the former.
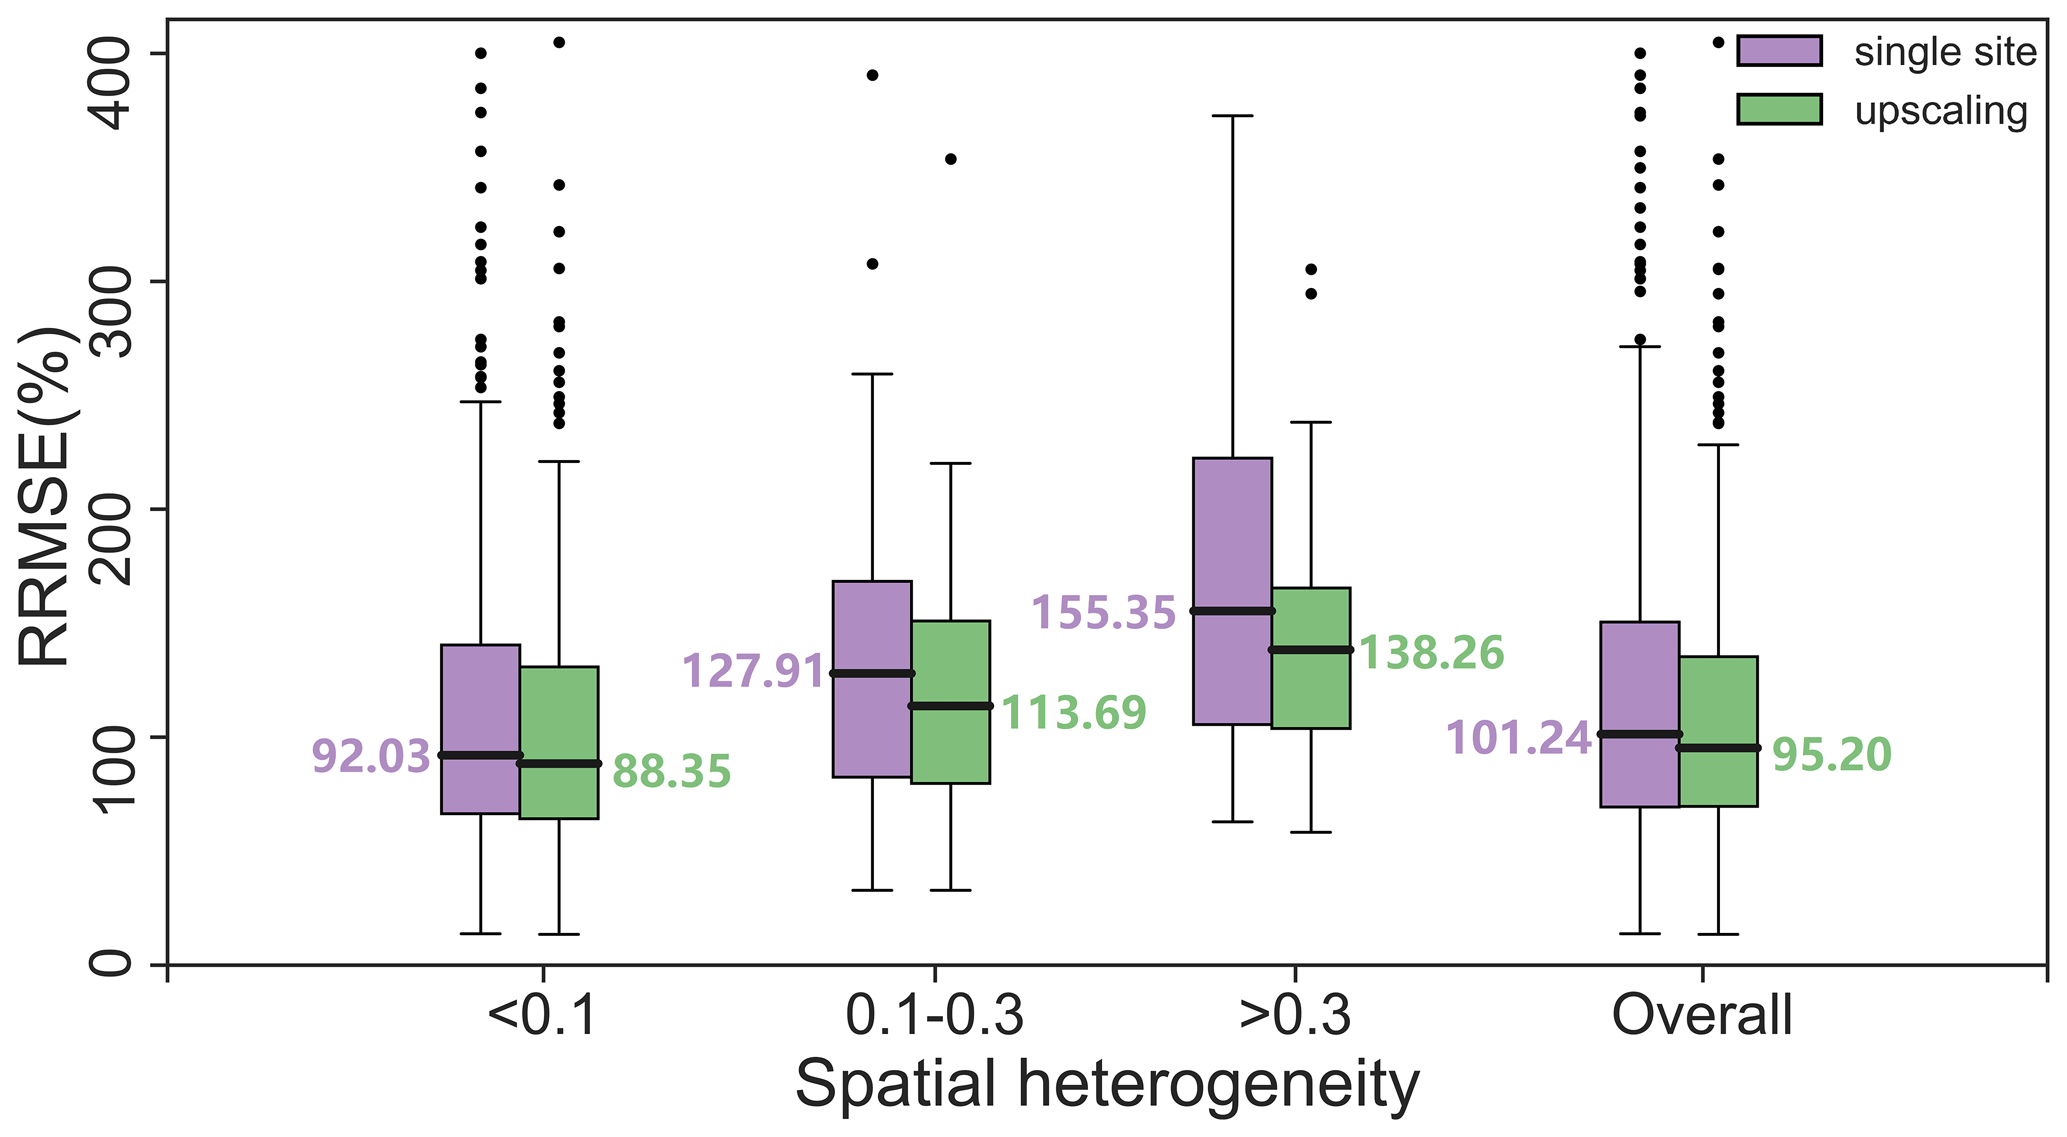
Figure 12The boxplots of the RRMSE of the pixel-scale ground “truth” and single-site measurements. The boxplots are categorized by different degrees of spatial heterogeneity and overall accuracy. The median of the boxplots is indicated by the numbers around the plots. Black lines indicate median values. Outliers are values that are farther than the 1.5 interquartile ranges.
The aforementioned results confirm the effectiveness of our pixel-scale ground “truth” dataset in different scenarios, which is superior to single-site measurements whether for sites with higher or lower spatial heterogeneity. The improvement of this dataset is more significant over the heterogeneous sites. Hence, it is highly helpful over heterogeneous surfaces in the validation or bias correction of satellite albedo products.
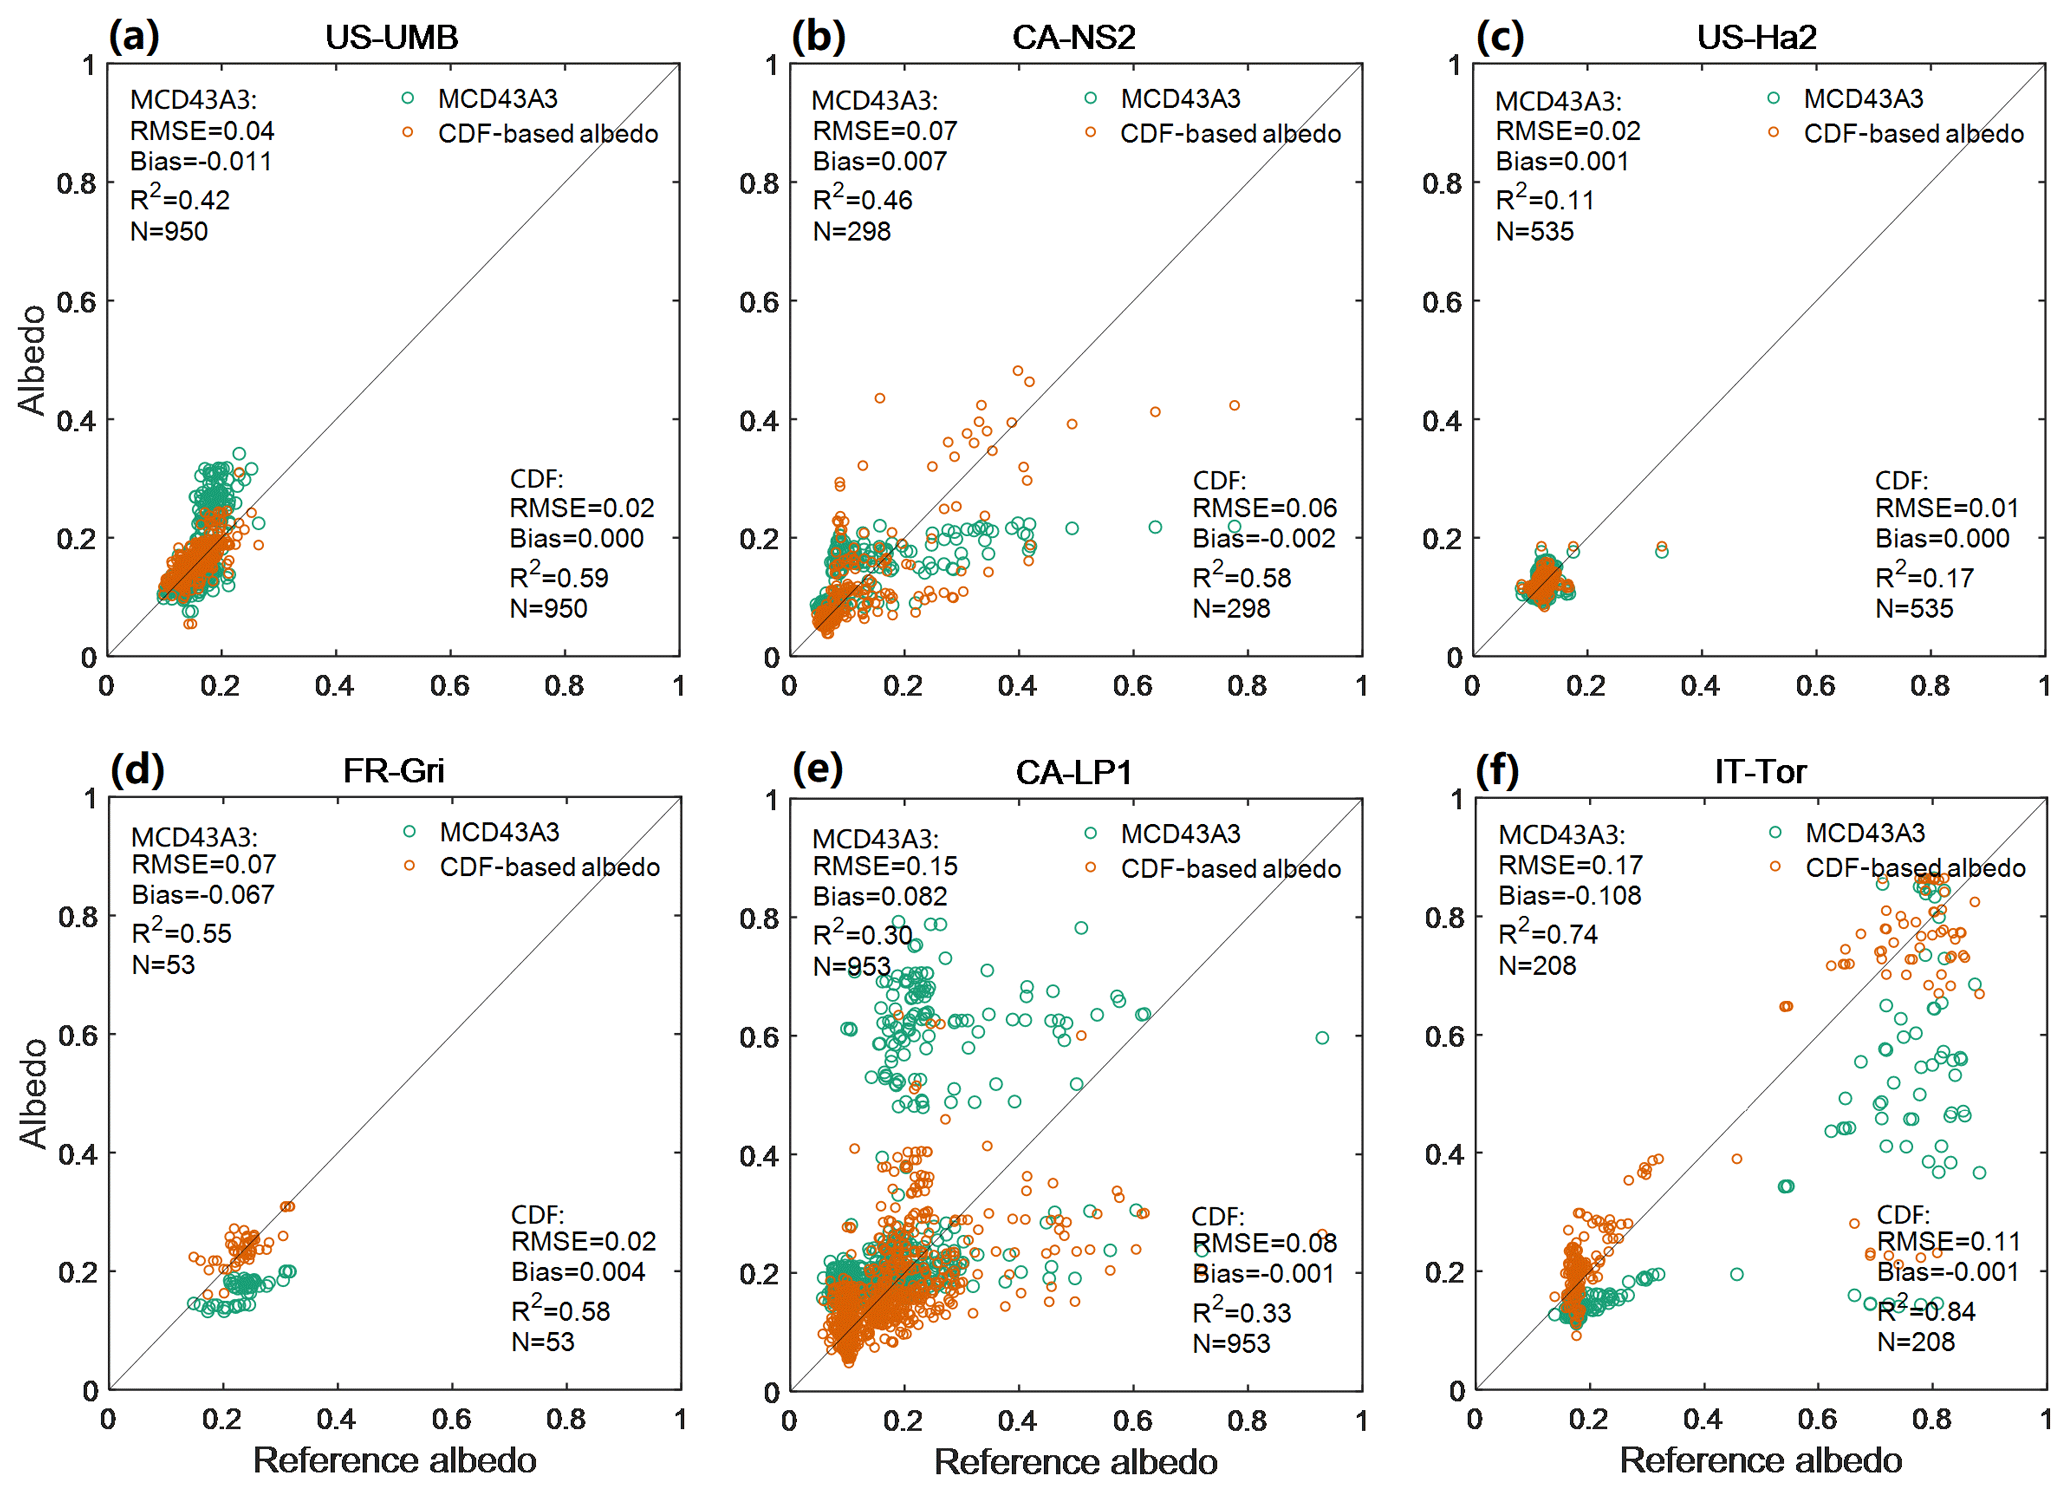
Figure 13The scatterplots between the MCD43A3 and pixel-scale ground “truth” (green dots) as well as the scatterplots between the CDF-corrected MCD43A3 and pixel-scale ground “truth” (brown dots). US-UMB, CA-NS2, and US-Ha2 represent the regions with small heterogeneity. FR-Gri, CA-LP1, and IT-Tor represent the regions with medium and strong heterogeneities.
4.3 The usage of the pixel-scale ground “truth” dataset
Validation is important for both satellite product manufacturers and end-users as it provides a quantitative assessment of the advantages and disadvantages of satellite products. However, due to diverse locations, coverage, scaling, and representation of in situ measurements, the accuracy of satellite products can vary greatly. As a result, direct comparisons of validation results are challenging, which ultimately limits the overall usefulness of satellite products. As highlighted by GCOS (GCOS-200, 2016), one solution to tackle this issue is to adopt a comprehensive and uniform validation process that relies on a standardized, consistent, and systematized reference dataset. The ground “truth” for the pixel scale was acquired using a standardized operational procedure that leveraged a considerable number of measurements collected from in situ sites scattered around the world. Such standardization enables fair comparison between the accuracy of various satellite products of the same essential climate variable (ECV). Thus, it provides a foundation for coordinating the use of diverse satellite albedo products and maximizing their potential capabilities. Figure 13 presents an example of the validation of MCD43A3 V0061 using the coarse pixel-scale ground “truth” dataset.
Apart from serving as the reference for evaluating the accuracy of satellite albedo products, the pixel-scale ground “truth” database can also be used as a reference for addressing the influence of biases in satellite albedo products. Various models have been developed for such bias corrections (Wang et al., 2022). For this research, the CDF (cumulative distribution function) approach (Calheiros and Zawadzki, 1987) has been employed to correct the bias in MCD43A3 V0061 as an example. As indicated in Fig. 13 and Table 1, correcting the bias generally makes satellite albedo products more accurate, especially in regions with significant heterogeneity (Fig. 13d–f). Therefore, it is reasonable to assume that this dataset could enhance the quality of satellite albedo products in regions with prominent surface heterogeneity.
The processed coarse pixel-scale ground “truth” dataset is publicly available and can be obtained through Zenodo (https://doi.org/10.5281/zenodo.8008454, Pan et al., 2023). The dataset files are available in machine-readable data format (.tab) and have been categorized separately into folders for FLUXNET, BSRN, SURFRAD, HIWATERWSN, and the Huailai station, facilitating easy accessibility and utilization.
The validation and correction of satellite reflectance products are essential for promoting reasonable use of such products in various scientific applications. Typically, these tasks depend on extensive in situ single-site-based albedo measurements. However, as satellite-based albedo and tower-based albedo are generated at different spatial scales, direct comparison can only be performed on certain homogeneous surfaces. Nevertheless, spatial heterogeneity is a fundamental feature of most land surfaces, which limits the spatial representativeness of measurements from single sites. Therefore, the most critical aspect of validation and correction is obtaining the ground “truth” albedo at the pixel level based on field measurements.
However, the methods used to acquire the ground “truth” at the pixel scale differ greatly with regard to field measurements, location, coverage, scale, and representation, leading to various accuracy levels of pixel-scale “truth” datasets. Consequently, most validation or correction outcomes are not easily comparable, thereby further hindering applications of satellite products. There is a requirement for a consistent, impartial, and representative coarse pixel-scale ground “truth” dataset of surface albedo. As far as is currently known, such a dataset with global coverage is currently lacking. Therefore, we have developed a coarse pixel-scale ground “truth” dataset using data collected from 416 in situ sites in sparsely distributed observational networks including SURFRAD, BSRN, and FLUXNET and a specified upscaling model for individual site measurements to fill this gap.
The suitability of the upscaling model for application to the in situ measurements was initially evaluated globally. The upscaling coefficients displayed an acceptable overall accuracy, with 90 % bias following a normal distribution within the range of ±0.02. The performance of the upscaling model is significantly influenced by the spatial heterogeneity. However, the impact of spatial diversity depends on the altitude and type of land coverage, and it becomes more significant as elevation increases and covers the land cover type of GRA.
It is important to note that the absolute truth on the coarse pixel scale is unattainable due to the limitations in instruments and measurement methods as well as the uncertainty in the upscaling model (Wu et al., 2019; Wen et al., 2022). Instead, the relative truth can be used to approximate the absolute truth. What can be done is to improve the accuracy of pixel-scale relative truth (also denoted as “truth”) as much as possible. For instance, the in situ measurements can be directly used as the pixel-scale reference over homogeneous surfaces or in the case that the satellite acquisition and in situ measurement footprints are similar, and the upscaling model is not necessary as it has its own source of uncertainty. However, the upscaling model is useful for heterogeneous areas when in situ measurement footprints are less than the satellite pixel size, because it increases the representativeness of the sampling for direct validation. The accuracy assessment results of the pixel-scale ground “truth” dataset demonstrate that the accuracy of the reference data can be enhanced by 17.09 % over the regions with strong spatial heterogeneity. However, the degree of improvement with this dataset displays a decreasing trend as the reduction in spatial heterogeneity. At a global scale, the pixel-scale ground “truth” dataset enhances the accuracy of pixel-scale reference data in general, with the overall RRMSE decreasing by 6.04 % compared to in situ single-site measurements.
Currently, a community-based validation tool such as SALVAL (Surface Albedo VALidation) (Sánchez-Zapero et al., 2023) could provide a framework for undertaking performance assessments through well-defined and uniform procedures, metrics, and reference observations for all the involved datasets, resulting in increased comparability in addition to the ability to import new product datasets. Our dataset, obtained through standardized operational procedures, permits expansion of established datasets to spatially underrepresented sites. This newly introduced dataset serves as a remedy to the inadequacy and inconsistency of the reference data currently employed in validation or correction efforts, thereby paving the way for the coordinated use of various satellite albedo products and unlocking the full capacity of different albedo products.
FP and XW were responsible for the main research ideas and writing the manuscript. JW, DY, XL, and QX contributed to the data collection. XW, RT, QZ, and JW supported the work with formal analysis, and XW contributed to the manuscript organization. All the authors worked on the writing, particularly for review and editing.
The contact author has declared that none of the authors has any competing interests.
Publisher’s note: Copernicus Publications remains neutral with regard to jurisdictional claims made in the text, published maps, institutional affiliations, or any other geographical representation in this paper. While Copernicus Publications makes every effort to include appropriate place names, the final responsibility lies with the authors.
The authors would like to thank the various site networks and services, i.e., FLUXNET, BSRN, SURFRAD, HiwaterWSN, and the Huailai station, for their dedicated efforts in providing the ground measurements that contributed to the generation of the coarse pixel-scale “truth” dataset.
This research has been supported by the National Natural Science Foundation of China, the National Science Fund for Distinguished Young Scholars (grant nos. 41971316 and 42071296), and the Fundamental Research Funds for the Central Universities (grant no. lzujbky-2020-72).
This paper was edited by Jing Wei and reviewed by three anonymous referees.
Augustine, J. A., Deluisi, J. J., and Long, C. N.: SURFRAD-A National Surface Radiation Budget Network for Atmospheric Research, B. Am. Meteorol. Soc., 81, 2341–2358, https://doi.org/10.1175/1520-0477(2000)081<2341:SANSRB>2.3.CO;2, 2000.
An, Y., Meng, X., Zhao, L., Li, Z., Wang, S., Shang, L., Chen, H., and Lyu, S.: Evaluation of surface albedo over the Tibetan Plateau simulated by CMIP5 models using in-situ measurements and MODIS, Int. J. Climatol., 42, 928–951, https://doi.org/10.1002/joc.7281, 2022.
Baldocchi, D., Falge, E., Gu, L., Olson, R., Hollinger, D., Running, S., Anthoni, P., Bernhofer, C., Davis, K., Evans, R., Fuentes, J., Goldstein, A., Katul, G., Law, B., Lee, X., Malhi, Y., Meyers, T., Munger, J., Oechel, W., Paw U, K. T., Pilegaard, K., Schmid, H. P., Valentini, R., Verma, S., Vesala, T., Wilson, K., and Wofsy, S.: FLUXNET: A New Tool to Study the Temporal and Spatial Variability of Ecosystem–Scale Carbon Dioxide, Water Vapor, and Energy Flux Densities, B. Am. Meteorol. Soc., 82, 2415–2434, https://doi.org/10.1175/1520-0477(2001)082<2415:FANTTS>2.3.CO;2, 2001.
Balzarolo, M., Anderson, K., Nichol, C., Rossini, M., Vescovo, L., Arriga, N., Wohlfahrt, G., Calvet, J.-C., Carrara, A., Cerasoli, S., Cogliati, S., Daumard, F., Eklundh, L., Elbers, J. A., Evrendilek, F., Handcock, R. N., Kaduk, J., Klumpp, K., Longdoz, B., Matteucci, G., Meroni, M., Montagnani, L., Ourcival, J., Sánchez-Cañete, E. P., Pontailler, J., Juszczak, R., Scholes, B., and Martín, M. P.: Ground-Based Optical Measurements at European Flux Sites: A Review of Methods, Instruments and Current Controversies, 11, 7954–7981, https://doi.org/10.3390/s110807954, 2011.
Calheiros, R. V. and Zawadzki, I.: Reflectivity-Rain Rate Relationships for Radar Hydrology in Brazil, J. Clim. Appl. Meteorol., 26, 118–132, https://doi.org/10.1175/1520-0450(1987)026<0118:RRRRFR>2.0.CO;2, 1987.
Cescatti, A., Marcolla, B., Santhana Vannan, S.K., Pan, J., Román, M.O., Yang, X., Ciais, P., Cook, R. B., Law, B. E., Matteucci, G., Migliavacca, M., Moors, E., Richardson, A.D., Seufert, G., and Schaaf, C. B.: Intercomparison of MODIS albedo retrievals and in situ measurements across the global FLUXNET network, Remote Sens. Environ., 121, 323–334, https://doi.org/10.1016/j.rse.2012.02.019, 2012.
Chu, H., Luo, X., Ouyang, Z., Chan, W. S., Dengel, S., Biraud, S. C., Torn, M. S., Metzger, S., Kumar, J., Arain, M. A., Arkebauer, T. J., Baldocchi, D., Bernacchi, C., Billesbach, D., Black, T. A., Blanken, P. D., Bohrer, G., Bracho, R., Brown, S., Brunsell, N. A., Chen, J., Chen, X., Clark, K., Desai, A.R., Duman, T., Durden, D., Fares, S., Forbrich, I., Gamon, J. A., Gough, C.M., Griffis, T., Helbig, M., Hollinger, D., Humphreys, E., Ikawa, H., Iwata,H., Ju, Y., Knowles, J.F., Knox, S.H., Kobayashi, H., Kolb, T., Law, B., Lee, X., Litvak, M., Liu, H., Munger, J. W., Noormets, A., Novick, K., Oberbauer, S. F., Oechel, W., Oikawa, P., Papuga, S. A., Pendall, E., Prajapati, P., Prueger, J., Quinton, W. L., Richardson, A. D., Russell, E. S., Scott, R. L., Starr, G., Staebler, R., Stoy, P. C., Stuart-Haëntjens, E., Sonnentag, O., ullivan, R. C., Suyker, A., Ueyama, M., Vargas, R., Wood, J. D., and Zona, D.: Representativeness of Eddy-Covariance flux footprints for areas surrounding AmeriFlux sites, Agr. Forest Meteorol., 301–302, 108350, https://doi.org/10.1016/j.agrformet.2021.108350, 2021.
Colliander, A., Jackson, T. J., Bindlish, R., Chan, S., Das, N., Kim, S. B., Cosh, M. H., Dunbar, R. S., Dang, L., Pashaian, L., Asanuma, J., Aida, K., Berg, A. Rowlandson, T. Bosch, D. Caldwell, T. Caylor, K. Goodrich, D., al Jassar, H., Lopez-Baeza, E., Martínez-Fernández, J., González-Zamora, A., Livingston, S., McNairn, H., Pacheco, A., Moghaddam, M., Montzka, C., Notarnicola, C., Niedrist, G., Pellarin, T., Prueger, J., Pulliainen, J., Rautiainen, K., Ramos, J., Seyfried, M., Starks, P., Su, Z., Zeng, Y., van der Velde, R., Thibeault, M., Dorigo, W., Vreugdenhil, M., Walker, J. P., Wu, X., Monerris, A., O'Neill, P. E., Entekhabi, D., Njoku, E. G., and Yueh, S.: Validation of SMAP surface soil moisture products with core validation sites, Remote Sens. Environ., 191, 215–231, https://doi.org/10.1016/j.rse.2017.01.021, 2017.
Driemel, A., Augustine, J., Behrens, K., Colle, S., Cox, C., Cuevas-Agulló, E., Denn, F. M., Duprat, T., Fukuda, M., Grobe, H., Haeffelin, M., Hodges, G., Hyett, N., Ijima, O., Kallis, A., Knap, W., Kustov, V., Long, C. N., Longenecker, D., Lupi, A., Maturilli, M., Mimouni, M., Ntsangwane, L., Ogihara, H., Olano, X., Olefs, M., Omori, M., Passamani, L., Pereira, E. B., Schmithüsen, H., Schumacher, S., Sieger, R., Tamlyn, J., Vogt, R., Vuilleumier, L., Xia, X., Ohmura, A., and König-Langlo, G.: Baseline Surface Radiation Network (BSRN): structure and data description (1992–2017), Earth Syst. Sci. Data, 10, 1491–1501, https://doi.org/10.5194/essd-10-1491-2018, 2018.
GCOS-154: Systematic Observation Requirements for Satellite based Products for Climate Supplemental details to the satellite based component of the Implementation Plan for the Global Ob serving System for Climate in Support of the UNFCCC, https://library.wmo.int/doc_num.php?explnum_id=3710 (last access: 23 September 2023), 2011.
GCOS-200: The Global Observing System for Climate: Implementation Needs, https://library.wmo.int/doc_num.php?explnum_id=3417 (last access: 23 September 2023), 2016.
Ghimire, B., Williams, C. A., Masek, J., Gao, F., Wang, Z., Schaaf, C., and He, T.: Global albedo change and radiative cooling from anthropogenic land cover change, 1700 to 2005 based on MODIS, land use harmonization, radiative kernels, and reanalysis, Geophys. Res. Lett., 41, 9087–9096, https://doi.org/10.1002/2014GL061671, 2014.
Jin, Y., Schaaf, C. B., Gao, F., Li, X., Strahler, A. H., Lucht, W., and Liang, S.: Consistency of MODIS surface bidirectional reflectance distribution function and albedo retrievals: 1. Algorithm performance, J. Geophys. Res.-Atmos., 108, 4158, https://doi.org/10.1029/2002JD002803, 2003.
Lei F., Crow, W. T., Shen, H., Su, C., Holmes, T. R. H., Parinissa, R. M., and Wang, G.: Assessment of the impact of spatial heterogeneity on microwave satellite soil moisture periodic error, Remote Sens. Environ., 205, 85–99, https://doi.org/10.1016/j.rse.2017.11.002, 2018.
Lewis, P. and Barnsley, M. J.: Influence of the sky radiance distribution on various formulations of the Earth surface albedo, International Symposium on Physical Measurements and Signatures in Remote Sensing, 17–22, 707–715, http://www2.geog.ucl.ac.uk/plewis/LewisBarnsley1994.pdf (last access: 23 September 2023), 1994.
Li, X., Cheng, G., Liu, S., Xiao, Q., Ma, M., Jin, R., Che, T., Liu, Q., Wang, W., Qi, Y., Wen, J., Li, H., Zhu, G., Guo, J., Ran, Y., Wang, S., Zhu, Z., Zhou, J., Hu, X., and Xu, Z.: Heihe Watershed Allied Telemetry Experimental Research (HiWATER): Scientific Objectives and Experimental Design, B. Am. Meteorol. Soc., 94, 1145–1160, https://doi.org/10.1175/BAMS-D-12-00154.1, 2013.
Liang, S.: Narrowband to broadband conversions of land surface albedo I: Algorithms, Remote Sens. Environ., 76, 213–238, https://doi.org/10.1016/S0034-4257(00)00205-4, 2001.
Liang, S., Fang, H., Chen, M., Shuey, C. J., Walthall, C., Daughtry, C., Morisette, J., Schaaf, C., and Strahler, A.: Validating MODIS land surface reflectance and albedo products: methods and preliminary results, Remote Sens. Environ., 83, 149–162 https://doi.org/10.1016/S0034-4257(02)00092-5, 2002.
Lin, X., Wu, S., Chen, B., Lin, Z., Yan, Z., Chen, X., Yin, G., You, D., Wen, J., Liu, Q., Xiao, Q., Liu, Q., and Lafortezza, R.: Estimating 10-m land surface albedo from Sentinel-2 satellite observations using a direct estimation approach with Google Earth Engine, ISPRS J. Photogramm., 194, 1–20, https://doi.org/10.1016/j.isprsjprs.2022.09.016, 2022.
Loew, A., Bennartz, R., Fell, F., Lattanzio, A., Doutriaux-Boucher, M., and Schulz, J.: A database of global reference sites to support validation of satellite surface albedo datasets (SAVS 1.0), Earth Syst. Sci. Data, 8, 425–438, https://doi.org/10.5194/essd-8-425-2016, 2016.
Lucht, W, Schaaf, C. B., and Strahler, A. H.: An algorithm for the retrieval of albedo from space using semiempirical BRDF models, IEEE Trans. Geosci. Remote Sens., 38, 977–998, https://doi.org/10.1109/36.841980, 2000.
Ma, M., Li, X., Weizhen, W., Xiao, Q., Zhao, K., and Xin, X.: Design on validation network of remote sensing products in China, ISPRS – Int. Arch. Photogramm., XL-2/W1, 1–6, https://doi.org/10.5194/isprsarchives-XL-2-W1-1-2013, 2013.
Mao, T., Shangguan, W., Li, Q., Li, L., Zhang, Y., Huang, F., Li, J., Liu, W., and Zhang, R.: A Spatial Downscaling Method for Remote Sensing Soil Moisture Based on Random Forest Considering Soil Moisture Memory and Mass Conservation, Remote Sens., 14, 3858, https://doi.org/10.3390/rs14163858, 2022.
Marion, B.: Measured and satellite-derived albedo data for estimating bifacial photovoltaic system performance, Sol. Energy, 215, 321-327, https://doi.org/10.1016/j.solener.2020.12.050, 2021.
Mcclean, F., Dawson, R., and Kilsby, C.: Implications of Using Global Digital Elevation Models for Flood Risk Analysis in Cities, Water Resour. Res., 56, e2020WR028241, https://doi.org/10.1029/2020WR028241, 2020.
Moustafa, S. E., Rennermalm A. K., Román, M. O., Wang, Z., Schaaf, C. B., Smith, L. C., Koeing, L. S., and Erb, A.: Evaluation of satellite remote sensing albedo retrievals over the ablation area of the southwestern Greenland ice sheet, Remote Sens. Environ., 98, 115–125, https://doi.org/10.1016/j.rse.2017.05.030, 2017.
Pan, F., Wu, X., Zeng, Q., Tang, R., Wang, J., Lin, X., You, D., Wen, J., and Xiao, Q.: A coarse pixel scale ground “truth” dataset based on the global in situ site measurements from 2000 to 2021, Zenodo [data set], https://doi.org/10.5281/zenodo.8008454, 2023.
Peng, J., Liu, Q., Wang, L., Liu, Q., Fan, W., Lu, M., and Wen, J.: Characterizing the Pixel Footprint of Satellite Albedo Products Derived from MODIS Reflectance in the Heihe River Basin, China, Remote Sens,, 7, 6886–6907, https://doi.org/10.3390/rs70606886, 2015.
Pinker, R. T., and Laszlo, I.: Modeling Surface Solar Irradiance for Satellite Applications on a Global Scale, J. Appl. Meteorol. Climatol., 31, 194–211, https://doi.org/10.1175/1520-0450(1992)031<0194:MSSIFS>2.0.CO;2, 1992
Pinty, B., Lattanzio, A., Martonchik, J. V., Verstraete, M. M., Gobron, N., Taberner, M., Widlowski, J. L., Dickinson, R. E., and Govaerts, Y.: Coupling Diffuse Sky Radiation and Surface Albedo, J. Atmos. Sci., 62, 2580–2591, https://doi.org/10.1175/JAS3479.1, 2005.
Román, M. O., Schaaf, C. B., Woodcock, C. E., Strahler, A. H., Yang, X., Braswell, R. H., Curtis, P. S., Davis, K. J., Dragoni, D., Goulden, M. L., Gu, L., Hollinger, D. Y., Kolb, T. E., Meyers, T. P., Munger, J. W., Privette, J. L., Richardson, A. D., Wilson, T. B., and Wofsy, S. C.: The MODIS (collection V005) BRDF/albedo product: Assessment of spatial representativeness over forested landscapes, Remote Sens. Environ., 113, 2476–2498, https://doi.org/10.1016/j.rse.2009.07.009, 2009.
Román, M. O., Schaaf, C. B., Lewis, P., Gao, F., Anderson, G. P., Privette, J. L., Strahler, A. H., Woodcock, C. E., and Barnsley, M.: Assessing the coupling between surface albedo derived from MODIS and the fraction of diffuse skylight over spatially-characterized landscapes, Remote Sens. Environ., 114, 738–760, https://doi.org/10.1016/j.rse.2009.11.014, 2010.
Sánchez-Zapero, J., Martínez-Sánchez, E., Camacho, F., Wang, Z., Carrer, D., Schaaf, C., García-Haro, F. J., Nickeson, J., and Cosh, M.: Surface ALbedo VALidation (SALVAL) Platform: Towards CEOS LPV Validation Stage 4 – Application to Three Global Albedo Climate Data Records, Remote Sens., 15, 1081, https://doi.org/10.3390/rs15041081, 2023.
Schaaf, C. B., Gao, F., Strahler, A. H., Lucht, W., Li, X., Tsang, T., Strugnell, Nicholas C., Zhang, X., Jin, Y., Muller, J. P., Lewis, P., Barnsley, M., Hobson, P., Disney, M., Roberts, G., Dunderdale, M., Doll, C., d'Entremont, R. P., Hu, B., Liang, S., Privette, J. L., and Roy, D.: First operational BRDF, albedo nadir reflectance products from MODIS, Remote Sens. Environ., 83, 135–148, https://doi.org/10.1016/S0034-4257(02)00091-3, 2002.
Song, R., Muller, J.-P., Kharbouche, S., and Woodgate, W.: Intercomparison of Surface Albedo Retrievals from MISR, MODIS, CGLS Using Tower and Upscaled Tower Measurements, Remote Sens., 11, 644, https://doi.org/10.3390/rs11060644, 2019.
Teixeira Pinto, C., Jing, X., and Leigh, L.:Evaluation Analysis of Landsat Level-1 and Level-2 Data Products Using In Situ Measurements, Remote Sens., 12, 2597, https://doi.org/10.3390/rs12162597, 2020.
Uuemaa, E., Ahi, S., Montibeller, B., Muru, M., and Kmoch, A.: Vertical Accuracy of Freely Available Global Digital Elevation Models (ASTER, AW3D30, MERIT, TanDEM-X, SRTM, and NASADEM), Remote Sens., 12, 3482, https://doi.org/10.3390/rs12213482, 2020.
Wang, L., Zheng, X., Sun L., Liu, Q., and Liu S.: Validation of GLASS albedo product through Landsat TM data and ground measurements, J. Remote Sens., 18, 547–558, https://doi.org/10.11834/jrs.20143130, 2014a.
Wang, Z., Schaaf, C. B., Strahler, A. H., Chopping, M. J., Román, M. O., Shuai, Y., Woodcock, C. E., Hollinger, D. Y., and Fitzjarrald, D. R.: Evaluation of MODIS albedo product (MCD43A) over grassland, agriculture and forest surface types during dormant and snow-covered periods, Remote Sens. Environ., 140, 60–77, https://doi.org/10.1016/j.rse.2013.08.025, 2014b.
Wang, Z., Schaaf, C., Lattanzio, A., Carrer, D., Grant, I., Román, M., Camacho, F., Yu, Y., Sánchez-Zapero, J., and Nickeson, J.: Good Practices for Satellite Derived Land Product Validation, Land Product Validation Subgroup (WGCV/CEOS), https://lpvs.gsfc.nasa.gov/PDF/CEOS_ALBEDO_Protocol_20190307_v1.pdf (last access: 23 September 2023), 2019.
Wen, J., Wu, X., Wang, J, Tang, R., Ma, D., Zeng, Q., Gong, B., and Xiao, Q.: Characterizing the effect of spatial heterogeneity and the deployment of sampled plots on the uncertainty of ground “truth” on a coarse grid scale: Case study for near-infrared (NIR) surface reflectance, J. Geophys. Res.-Atmos., 127, e2022JD036779, https://doi.org/10.1029/2022JD036779, 2022.
Williamson, M., Adams, J. R., Berg, A. A., Derksen, C., Toose, P., and Walker, A.: Plot-scale assessment of soil freeze/thaw detection and variability with impedance probes: Implications for remote sensing validation networks, Hydrol. Res., 49, 1–16, https://doi.org/10.2166/nh.2017.183, 2018.
Wright, P., Bergin, M., Dibb, J., Lefer, B., Domine, F., Carman, T., Carmagnola, C., Dumont, M., Courville, Z., Schaaf, C., and Wang, Z.: Comparing MODIS daily snow albedo to spectral albedo field measurements in Central Greenland, Remote Sens. Environ., 140, 118–129, 2014.
Wu, X., Wen, J., Xiao, Q., Liu, Q., Peng, J., Dou, B., Li, X., You, D., Tang, Y., and Liu, Q.: Coarse scale in situ albedo observations over heterogeneous snow-free land surfaces and validation strategy: A case of MODIS albedo products preliminary validation over northern China, Remote Sens. Environ., 184, 25–39, https://doi.org/10.1016/j.rse.2016.06.013, 2016.
Wu, X., Wen, J., Xiao, Q., and You, D.: Upscaling of Single-Site-Based Measurements for Validation of Long-Term Coarse-Pixel Albedo Products, IEEE T. Geosci. Remote Sens., 58, 3411–3425, https://doi.org/10.1109/TGRS.2019.2954879, 2020.
Wu, X., Wen, J., Xiao, Q., You, D., Gong, B., Wang, J., Ma, D., and Lin, X.: Spatial Heterogeneity of Albedo at Subpixel Satellite Scales and its Effect in Validation: Airborne Remote Sensing Results From HiWATER, IEEE T. Geosci. Remote Sens., 60, 1–14, https://doi.org/10.1109/TGRS.2021.3124026, 2022.
Wu, X., Xiao, Q., Wen, J., You, D., and Hueni, A.: Advances in quantitative remote sensing product validation: Overview and current status, Earth-Sci. Rev., 196, 102875, https://doi.org/10.1016/j.earscirev.2019.102875, 2019.
Xu, B., Li, J., Park, T., Liu, Q., Zeng, Y., Yin, G., Zhao, J., Fan, W., Yang, L., Knyazikhin, Y., and Myneni, R. B.: An integrated method for validating long-term leaf area index products using global networks of site-based measurements, Remote Sens. Environ., 209, 134–151, https://doi.org/10.1016/j.rse.2018.02.049, 2018.
Yamazaki, D., Ikeshima, D., Tawatari, R., Yamaguchi, T., O'Loughlin, F., Neal, J. C., Sampson, C. C., Kanae, S., and Bates, P. D.: A high-accuracy map of global terrain elevations, Geophys. Res. Lett., 44, 5844–5853, https://doi.org/10.1002/2017GL072874, 2017.
Zhu, Z. and Woodcock, C. E.: Object-based cloud and cloud shadow detection in Landsat imagery, Remote Sens. Environ., 118, 83–94, https://doi.org/10.1016/j.rse.2011.10.028, 2012.
Zhu, Z., Wang, S. X., and Woodcock, C. E.: Improvement and expansion of the Fmask algorithm: cloud, cloud shadow, and snow detection for Landsats 4–7, 8, and Sentinel 2 images, Remote Sens. Environ., 159, 269–277, https://doi.org/10.1016/j.rse.2014.12.014, 2015.