the Creative Commons Attribution 4.0 License.
the Creative Commons Attribution 4.0 License.
 | 07 Mar 2024
Dams in the Mekong: a comprehensive database, spatiotemporal distribution, and hydropower potentials
Wei Jing Ang
Yadu Pokhrel
Dung Duc Tran
Ho Huu Loc
Dams have proliferated along the Mekong, spurred by energy demands from economic development and capital from private companies. Swift dam evolution has rendered many databases outdated, in which mismatches arise from differing compilation methods. Without a comprehensive database, up-to-date spatial assessment of dam growth is unavailable. Looking at future development, hydropower potential specifically within the Mekong remains to be systematically evaluated. In this paper, we offer (1) an open-access and unified database of 1055 dams, (2) a spatiotemporal analysis of dams on a sub-basin and country level from the 1980s to the post-2020s, and (3) a grid-based assessment of the theoretical basin-wide hydropower potential using present-day discharge from the CaMa-Flood model (2011–2015, 0.05°) and future discharge from the WaterGAP2 model used for ISIMIP2b (2021–2040, 0.5°). The dam count of 1055 is more than twice the largest existing database, with 608 hydropower dams generating a boom in hydropower capacity from 1242 MW in the 1980s to 69 199 MW post-2020s. While China had the largest capacity increase from the 2000s to the 2010s (+16 854 MW), Laos has the most planned dams and the highest projected growth post-2020s (+18 223 MW). Based on present-day discharge, we estimate a basin-wide hydropower potential of 1 334 683 MW, where Laos is the highest at 514 887 MW. Based on future discharge modeled with climate change, hydropower potential could grow to over 2 000 000 MW. Laos and China are the highest at around 900 000 MW each, together forming over 80 % of the total potential. Our database facilitates research on dam-induced hydrological and ecological alterations, while spatiotemporal analysis of hydropower capacity could illuminate the complex transboundary electricity trade. Through both spatiotemporal and hydropower potential evaluation, we address the current and future vulnerability of countries to dam construction, highlighting the need for better planning and management in the future hydropower hotspot Laos. The Mekong dam database is publicly available at https://doi.org/10.21979/N9/ACZIJN (Ang et al., 2023).
- Article
(5819 KB) - Full-text XML
- BibTeX
- EndNote


Dams have been constructed to control and harness the flow of water for human needs over thousands of years. Within the Mekong Basin, the longest river in Southeast Asia, dams have burgeoned in response to rising energy demands for economic development and growing populations (Hecht et al., 2019; MRC, 2023; Zarfl et al., 2015). Despite being an attractive alternative to depleting fossil fuels, the proliferation of dams comes with environmental and social tradeoffs (Schmitt et al., 2018). Dams modify water flow and block migratory pathways, fragmenting habitats and disrupting the breeding and feeding patterns of aquatic species (Barbarossa et al., 2020; Grill et al., 2014). This has crippled the world's largest inland fishery and threatened the income of over 4 million Laotians and Cambodians in the fishing industry (Dugan et al., 2010). Dams reduce sediment and freshwater discharge downstream, and when coupled with rising sea levels, lead to erosion and saltwater intrusion in the Mekong Delta (Li et al., 2017; Park et al., 2022; Yoshida et al., 2020). Considering that the Mekong is home to two of the top five global rice exporters – Vietnam and Thailand – where the Vietnam Delta and the Khorat Plateau in Thailand produce 75 % of the rice in the Lower Mekong Basin (LMB), dam-induced agricultural losses are jeopardizing regional food security (Kang et al., 2021; The Anh et al., 2020). The livelihoods of locals are further affected by forced resettlements to make way for dams, especially with insufficient policies to assist locals in adapting to new living environments and finding alternative sources of income (Soukhaphon et al., 2021). This multitude of dam impacts, alongside disputes over water resources, has created a complex geopolitical landscape across the six countries that share the Mekong Basin (Cooley et al., 2009; Cronin, 2009; Hirsch, 2016).
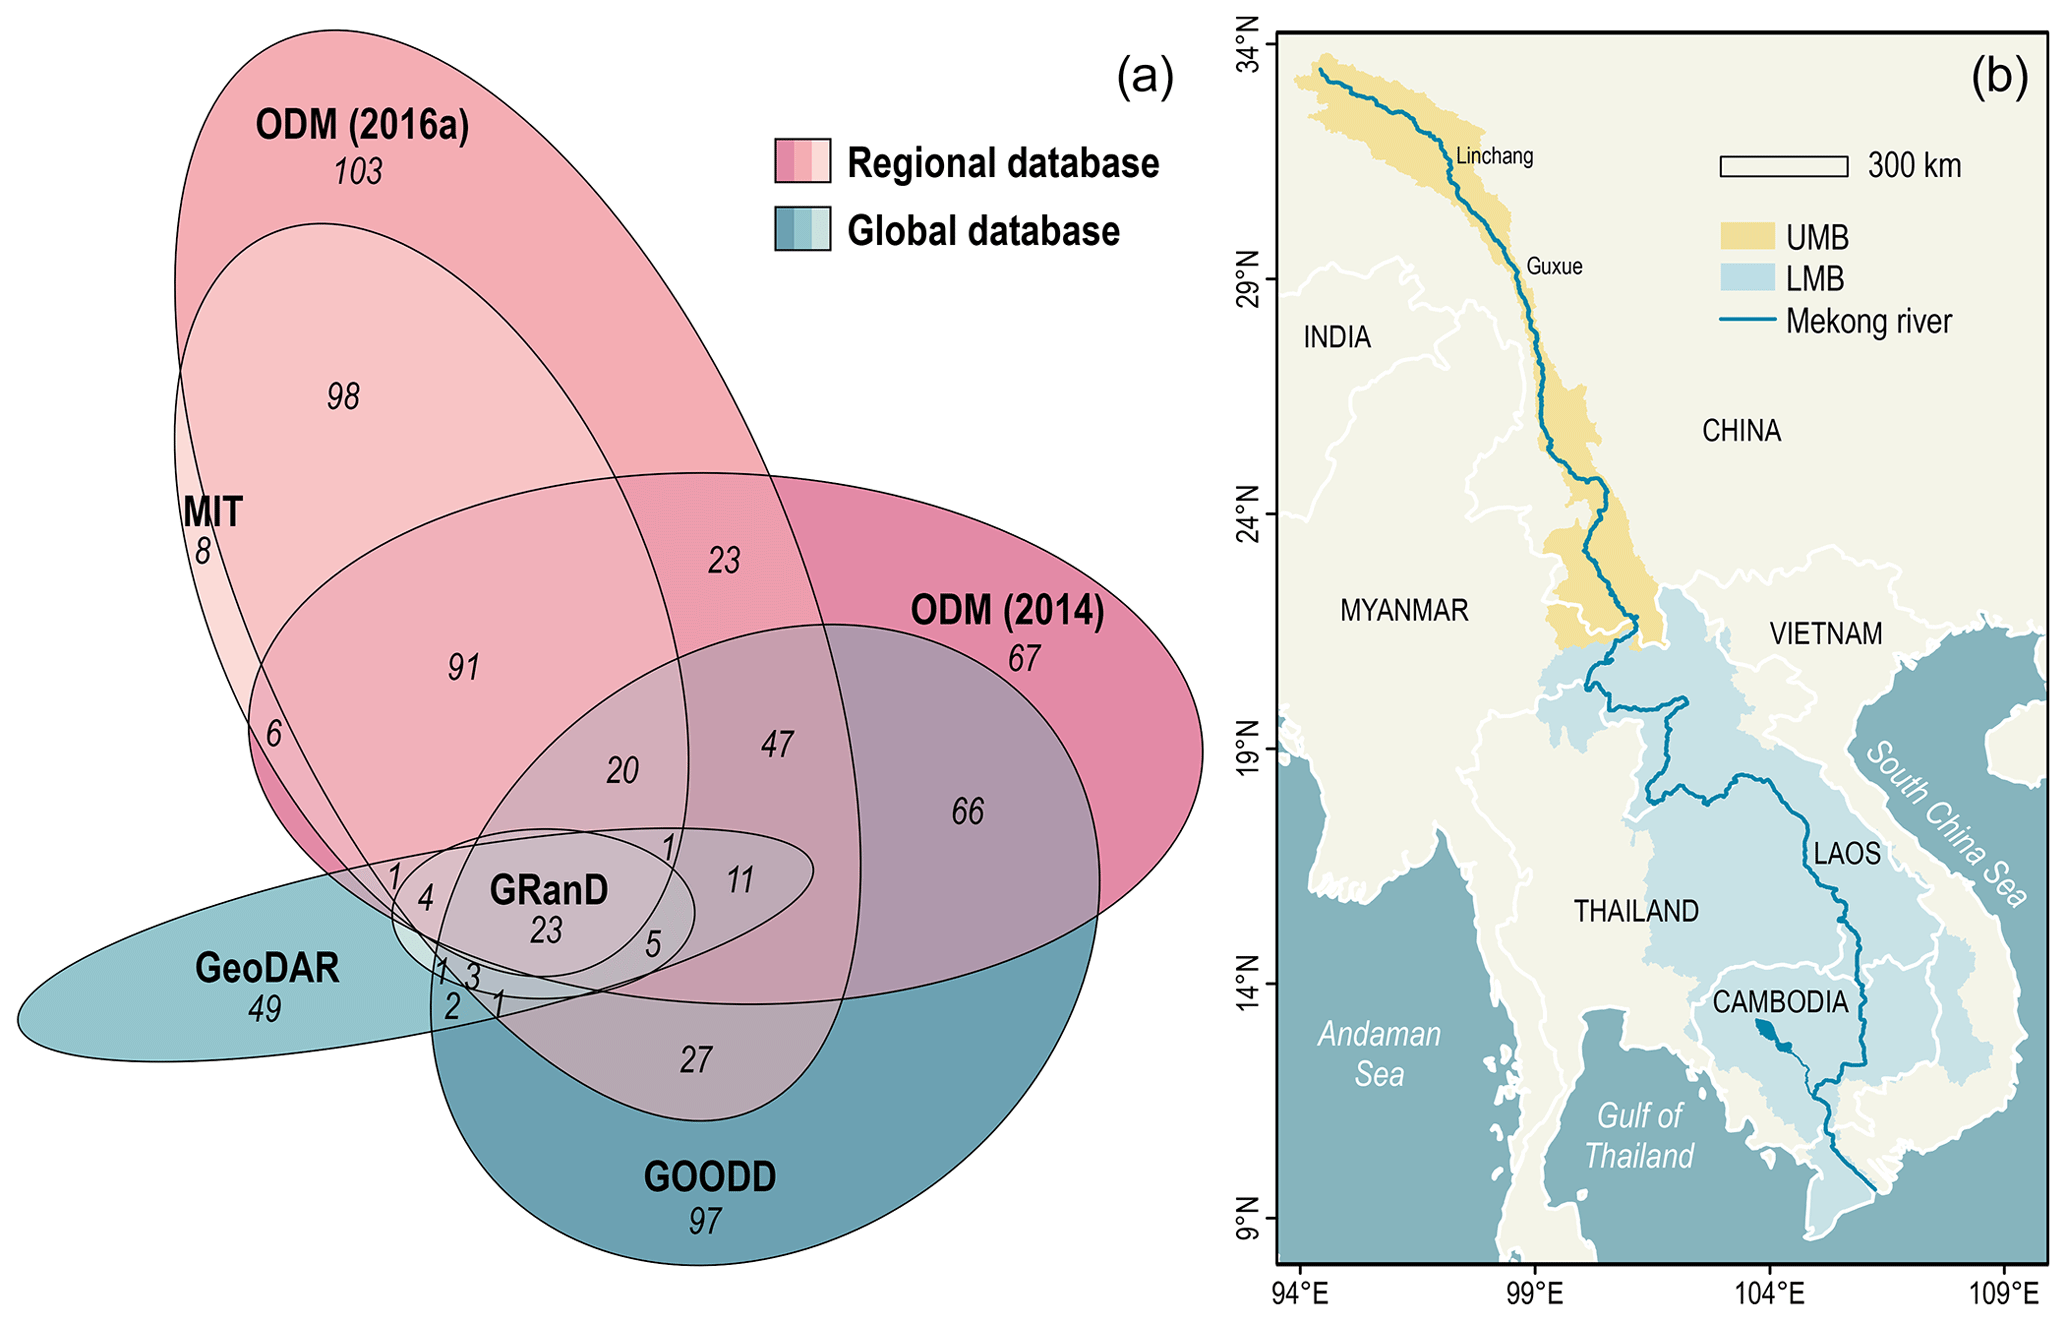
Figure 1(a) Venn diagram illustrating the overlaps and differences across the six main databases (Larsson, 2023). The pink ellipses are regional databases, while the blue ellipses are global databases corresponding to the color scheme in Fig. 2. (b) Map of the Mekong Basin, split into the Upper Mekong Basin (UMB) and Lower Mekong Basin (LMB).
The dam distribution in the Mekong is constantly evolving. Dams are a relatively low-cost electricity source, making them an attractive tool for economic development (IRENA, 2022). Nevertheless, poor planning and management, together with embezzlement of construction funds, leave dams just as easily canceled as they are approved (Matthews, 2012). The dam network therefore changes erratically, yet data on it are necessary to assess the socio-environmental implications of dams, manage operations across the network, and guide policy making regarding water and energy resources (Galelli et al., 2022; Speckhann et al., 2021). Various databases have been published to track dams. Globally, the AQUASTAT database of the United Nations Food and Agricultural Organization (FAO) contains 14 000 dams, of which only 31 lie in the Mekong, as updated in 2015 (X. Wang et al., 2022). More recently, the Global Reservoir and Dam Database (GRanD) updated in 2019 consists of detailed information on 7320 dams, although only 38 are in the Mekong (Lehner et al., 2011). The Global georeferenced Database of Dams (GOODD) contains 38 667 dams (319 in the Mekong), but the increase in quantity is compromised by a lack of dam attributes (Mulligan et al., 2020). With both quantity and details, the Georeferenced global Dams and Reservoirs (GeoDAR) consists of 24 783 dams (105 in the Mekong), yet its attributes from the paid-access World Register of Dams are not openly available (Wang et al., 2022a). On the regional and national scales, numerous databases are made available by Open Development Mekong (ODM, 2023; Tiwari et al., 2023). Even so, they are from different sources, resulting in mismatches across databases. As such, while much information on dams exists, they are scattered across different platforms, spatial scales, and time frames, complicating data collection and analysis. The mismatches across the six main databases are illustrated as a Venn diagram in Fig. 1a, emphasizing the need for an organized and integrated database (Larsson, 2023).
Without a comprehensive database, dam evolution over space and time to date remains to be assessed. Some studies have investigated the spatiotemporal impacts of dams, such as on land cover in the Lower Mekong (Cho and Qi, 2021) and geomorphological changes in the Mekong Delta (Li et al., 2017). However, such studies are limited by the availability and recency of dam data, and no existing study focuses directly on dam growth, which would highlight regions most concentrated with dams and encourage targeting of management efforts towards those regions and illuminate connectivity across the dam network, especially the cumulative impacts of cascades (Kummu and Varis, 2007). Spatiotemporal analysis of planned dams gauges upcoming dam development, but understanding distributions in hydropower potential could further highlight sites with greater potential for continued dam construction and provide insights into future dam growth. Hydropower potential has been estimated globally and regionally through grid-based assessments (e.g., Pokhrel et al., 2008; Tefera and Kasiviswanathan, 2022). Nonetheless, it has yet to be systematically evaluated across the Mekong, where only general estimates from a decade ago are available – 30 000 MW in the Lower Mekong and 28 930 MW in the Upper Mekong (Lebel et al., 2007; MRC, 2011).
In this paper, we offer (1) a publicly available and integrated database of 1055 dams in the Mekong, (2) a spatiotemporal analysis of dams on a decadal timescale, and (3) a grid-based assessment of the theoretical hydropower potential along the river network. We compile data across global, regional, and national databases, validated using satellite imagery in Google Earth and public literature like reports and news articles (Lehner et al., 2011; Mulligan et al., 2020; Wang et al., 2022a; Zarfl et al., 2015). Using our database and a GIS analysis of geographic and hydrological dam attributes, we evaluate the distribution of the dams on a sub-basin and country level from the 1980s to the post-2020s. With 608 hydropower dams, the hydropower capacity soars from 1242 MW in the 1980s to 69 199 MW post-2020s. While China had the most substantial expansion in installed capacity from the 2000s to the 2010s, Laos has the most planned dams and is expected to have the greatest increase post-2020s. We estimate a basin-wide hydropower potential of 1 334 683 MW based on discharge from the CaMa-Flood model (2011–2015, 0.05°) (Dang et al., 2022), where Laos is the highest at 514 887 MW (Meijer et al., 2012; Pokhrel et al., 2008). Hydropower potential could grow to over 2 000 000 MW with climate change based on future discharge from the WaterGAP2 model used for ISIMIP2b (2021–2040, 0.5°) (Gosling et al., 2023). Laos and China are the highest at around 900 000 MW each, together forming over 80 % of the total potential.
The significance of this study lies in three aspects. Firstly, our database provides one-stop access to data for research on dam-induced hydrological alterations, such as sediment trapping and river-bed incision associated with “hungry waters” and their implications for the hydrological modeling of parameters like discharge and water level (Ang et al., 2022; Dang et al., 2022; Kondolf et al., 2014; Shin et al., 2020). Comprehensive dam data are needed to calculate trapped sediments and hence the rate of erosion of the delta, which would affect agriculture and food security (Li et al., 2017). Secondly, we provide the first detailed and spatially explicit evaluation of dam evolution over time, which showcases the complications in managing the Mekong Basin due to its transboundary nature and complex regional electricity trade amidst high energy demands for economic growth (Galelli et al., 2022; Soukhaphon et al., 2021). The Mekong is a representative case study of a major river being transformed by anthropogenic activities, and thus evaluating the evolution of dam patterns in the Mekong has similar implications to large river basins worldwide. Thirdly, this paper illustrates vulnerability at the sub-basin and country levels, identifying dam hotspots that require stronger management and policies, such as more evidence-based dam planning, stricter criteria for project approval, more comprehensive environmental impact assessments, and proper resettlement of displaced locals (Zawahri and Hensengerth, 2012).
Flowing 4800 km from the Tibetan Plateau into the South China Sea, the Mekong is the third largest in Asia in terms of sediment load, emptying 160×106 t of sediment into the sea annually (Lu et al., 2014). The Mekong Basin of 795 000 km2 is shared across six countries (Gao et al., 2022) (Fig. 1b). China (21 % of the basin area) and Myanmar (3 %) lie in the Upper Mekong Basin (UMB), while four countries lie in the Lower Mekong Basin (LMB): Laos (25 %), Thailand (23 %), Cambodia (20 %), and Vietnam (8 %) (Hecht et al., 2019). The monsoonal rainfall in the LMB controls the annual flood pulse, with 85 % of the flow taking place in the wet season (May to October) (Li et al., 2017). The remaining 15 % of the flow occurs in the dry season (November to April) from snowmelt in the UMB (Binh et al., 2020). The Mekong can be divided into six physiographic homogenous subregions, with the (1) Tibetan Plateau and (2) Lancang Basin located in the UMB, the (3) Mekong Highlands mostly in Laos, the (4) Mekong Lowlands largely in Cambodia, (5) intensive cultivation mainly in Thailand, and (6) the Tonle Sap and Mekong Delta at the southernmost tip of the basin (Leinenkugel et al., 2013). The Mekong Delta is the third largest delta on earth, contributing 27 % of Vietnam's GDP and 40 % of its agricultural production as well as 15 % of international rice export (Tri, 2012; Xue et al., 2010).
Dam planning and construction began to intensify in the Mekong in the 1990s to 2000s due to energy demands from economic expansion, population growth, and rural–urban migration as well as a shift from public funding to commercial partnerships between governments and private companies that brought in capital supply for dam projects (Grumbine et al., 2012; Kondolf et al., 2014; Pearse-Smith, 2012). The dam cascade that first began construction on the mainstem is in the UMB in China (Wang et al., 2014). While 2 dams are under construction and 1 has been canceled, 11 operational dams now make up the cascade. The cascade will be expanded, with another canceled dam and seven planned dams lying further upstream (Grünwald et al., 2022). Downstream in the LMB, a cascade of 11 mainstem dams has been planned (MRC, 2011, 2016). Two of the dams are in Cambodia, while nine dams are in Laos, with two already operational (IR, 2023). Laos exports the majority of its energy to neighboring countries, aiming to become the “Battery of Southeast Asia” (Galelli et al., 2022; Soukhaphon et al., 2021). In 2020, Laos was the third largest exporter of electricity globally, exporting USD 1.93 billion in electricity, of which USD 1.76 billion was imported by Thailand (Observatory of Economic Complexity, 2023). Laos' current cross-border export of 6000 MW (90 % from the hydropower sector) is set to increase to 20 000 MW by 2030 (Chowdhury et al., 2020; Energy Market Authority, 2022; ODM, 2020c).
Table 1Global, regional, and national dam databases compiled.
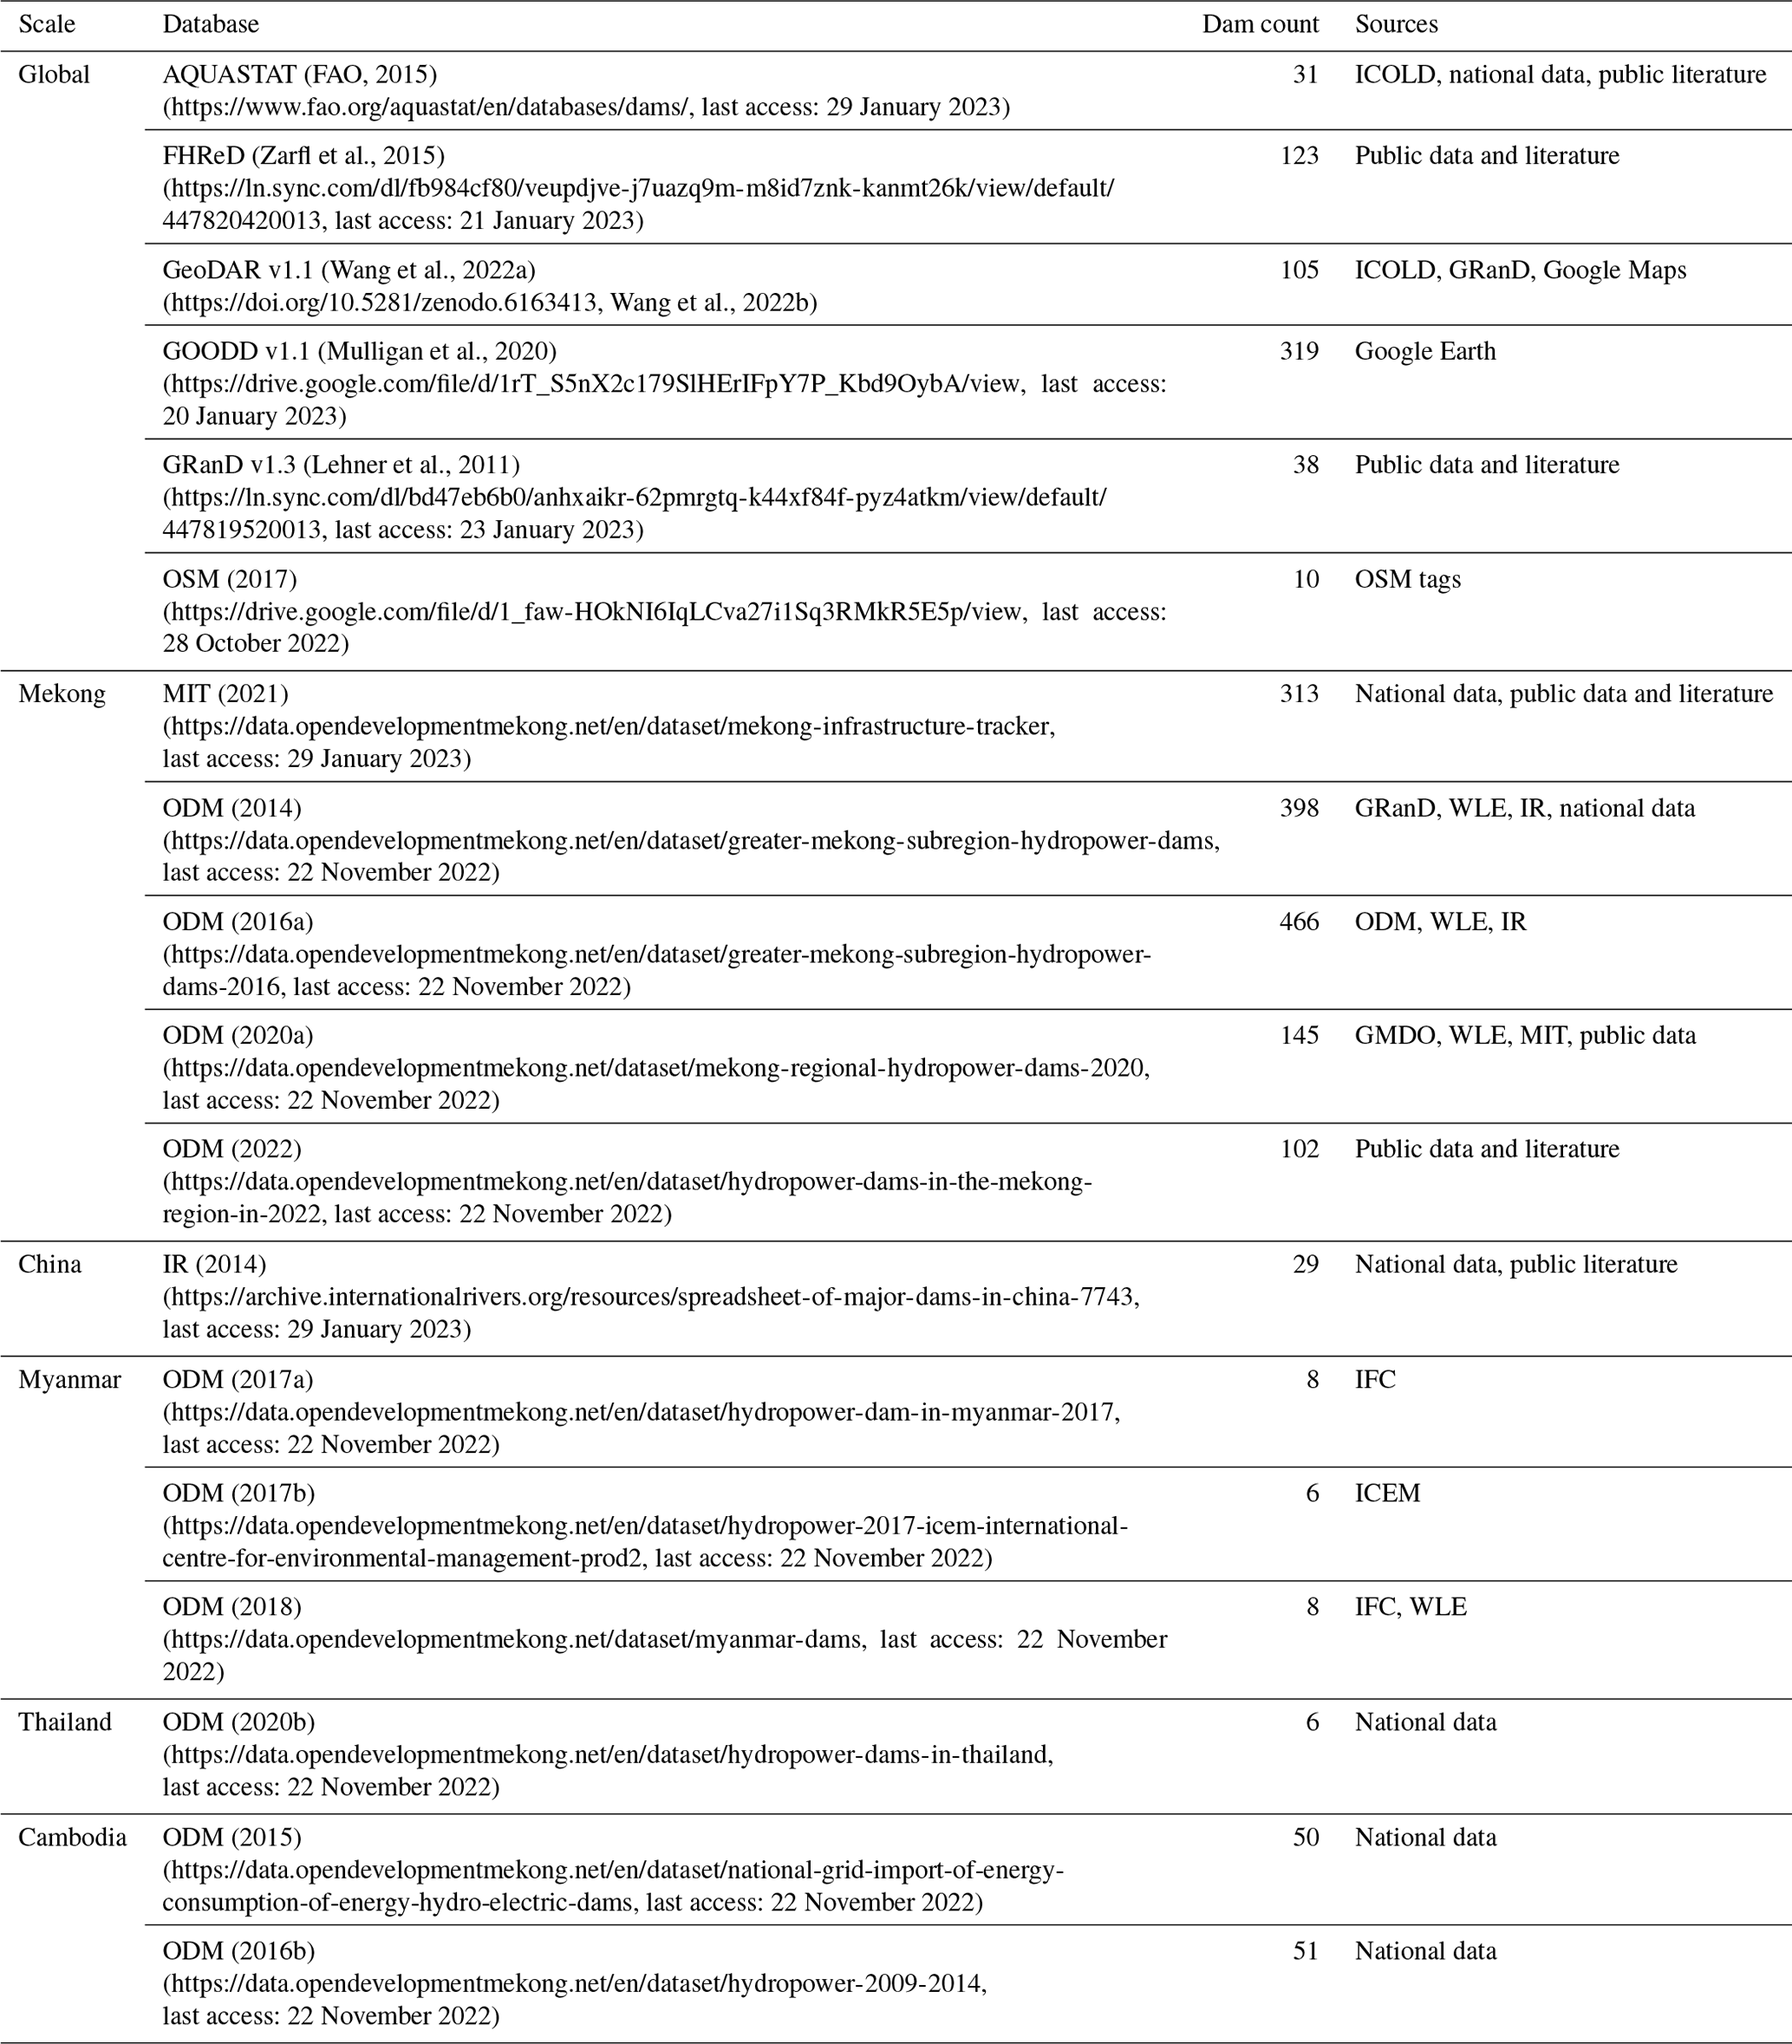
Abbreviations: Food and Agriculture Organisation of the United Nations (FAO), International Commission on Large Dams (ICOLD), Future Hydropower Reservoirs and Dams (FHReD), Georeferenced global Dams and Reservoirs (GeoDAR), Global Reservoir and Dam Database (GRanD), Global georeferenced Database of Dams (GOODD), Open Street Map (OSM), Mekong Infrastructure Tracker (MIT), Open Development Mekong (ODM), CGIAR's Research Program on Water, Land, and Ecosystems (WLE), International Rivers (IR), International Finance Corporation (IFC), and International Centre for Environmental Management (ICEM).
3.1 Initial compilation of dam databases
Dams across the Mekong are first compiled from georeferenced data. We accessed six global databases – the FAO AQUASTAT (FAO, 2015), Future Hydropower Reservoirs and Dams (FHReD) (Zarfl et al., 2015), GeoDAR (Wang et al., 2022a), GOODD (Mulligan et al., 2020), GRanD (Lehner et al., 2011), and the Open Street Map Dams (OSM). Regional and national databases used include the Stimson Mekong Infrastructure Tracker (MIT) (MIT, 2021), International Rivers (IR) (IR, 2014), and the datasets in the Open Development Mekong (ODM) Datahub (ODM, 2023). We extract dams within the Mekong and standardize file formats for cleaning, excluding entries with missing or duplicate coordinates. Considering that 0.0001 decimal degrees is approximately 11 m and that dams are larger than that, we standardize all coordinates to 4 decimal degrees. The databases reviewed and their respective dam counts (excluding duplicates within the same database) are summarized in Table 1.
3.2 Integration of dam coordinates
Extracting unique coordinates, we visualize the dam distribution in ArcGIS. Groups of coordinates are found close by, where each database records slightly different coordinates of the same dam. These differences are possibly due to (1) updates in satellite imagery used for georeferencing over the years, (2) variations in information sources used for each database (e.g., International Commission on Large Dams versus CGIAR's Research Program on Water, Land, and Ecosystems) (Table 1), and (3) human discretion in positioning dam points, such as at the center of the dam, side of the dam, or center of the associated reservoir. To account for such differences, points lying within 100 m of one another are merged and their average taken; 100 m was chosen after plotting buffers of different sizes and comparing them against the sizes of coordinate clusters and to avoid the merging of closely spaced irrigation dams and small dam cascades.
Subsequently, we extracted key attributes for inspection: name, country, year of operation, status, and purpose. Dam entries are merged based on identical or similar names through a manual check in Excel. If the same name is correlated with different coordinates, one coordinate was extracted based on one of the following: the most common coordinate, the coordinate from the most up-to-date database, or the average of all unique coordinates, excluding coordinates over 1 decimal degree away. We corrected any spelling mismatches in the names and standardized the naming conventions, such as for the attribute column headers, countries, and dam purposes. Dam statuses are simplified into five: operational, under construction, planned, canceled, and closed, where dams under study and proposed are considered planned. Should attributes across databases differ, the most common entry or information from the most up-to-date databases is prioritized.
3.3 Validation of dam coordinates
Coordinates of operational dams are validated using satellite imagery in Google Earth. Unvalidated coordinates are removed, misplaced coordinates are edited, and multiple coordinates referring to the same dam are merged. For reservoirs with multiple dams, all dams are considered one, as similarly done for GeoDAR (Wang et al., 2022a). Dam statuses are validated or updated, confirming operational dams and changing planned dams to under construction should construction works with barren ground be visible. Two dams are deemed closed, with the dam structure no longer visible and dam breach reported online (VietNamNet, 2013; VnExpress, 2017). At this stage, 776 unique dams are obtained.
Based on the coordinates, six representative databases (763 dams) – three global and three regional – are illustrated using a Venn diagram (Larsson, 2023) (Fig. 1a). Only 3.0 % of the 763 dams are in all six databases, yet nearly half are only in one database, suggesting a lack of corroboration across existing databases. Moreover, the scattered overlaps and differences in the dam entries complicate data collection, and thus a unified one-stop database is needed. The diagram illustrates 6 out of 18 dam databases to minimize visual complexity and to keep the error low at 2.1 % while still representing 97.2 % of the dams at this stage (755 dams). The slight error is due to the inherent limitations of Venn diagrams, but such figures are still the simplest and most intuitive to interpret (Chen and Boutros, 2011; Larsson and Gustafsson, 2018).
3.4 Incorporation of dam attributes
Including the remaining attributes in the 18 dam databases, such as dam height, dam length, reservoir volume, and plant factor (ratio between the actual and theoretical hydropower output), the dam attributes are verified with information from the public literature: reports (e.g., IR, 2013; MRC, 2016), research papers (e.g., Schmitt et al., 2018; Souter et al., 2020), news articles (e.g., Ezell, 2021; Poindexter, 2018), and websites (e.g., EDL-Generation Public Company, 2023; Hobo Maps, 2023; Power Technology, 2023). During the online search, 34 new dam entries were added, bringing the total dam count to 810. For dams with minimal information, attributes are estimated using Google Earth. The dam name is taken from the label of the dam, reservoir, or nearby locality; the river name is taken from the nearest labeled river (if any); and the year of completion (and year of closure, if any) is taken from the earliest imagery in which the dam structure is visible (and no longer visible). To estimate the dam's purpose, if the hydropower infrastructure is visible (e.g., powerhouse, penstock), the dam is deemed fit for hydropower. Nearby farmlands indicate an irrigation dam, a reservoir suggests a dam meant for water supply, and settlements downstream imply flood control (Yuen et al., 2023).
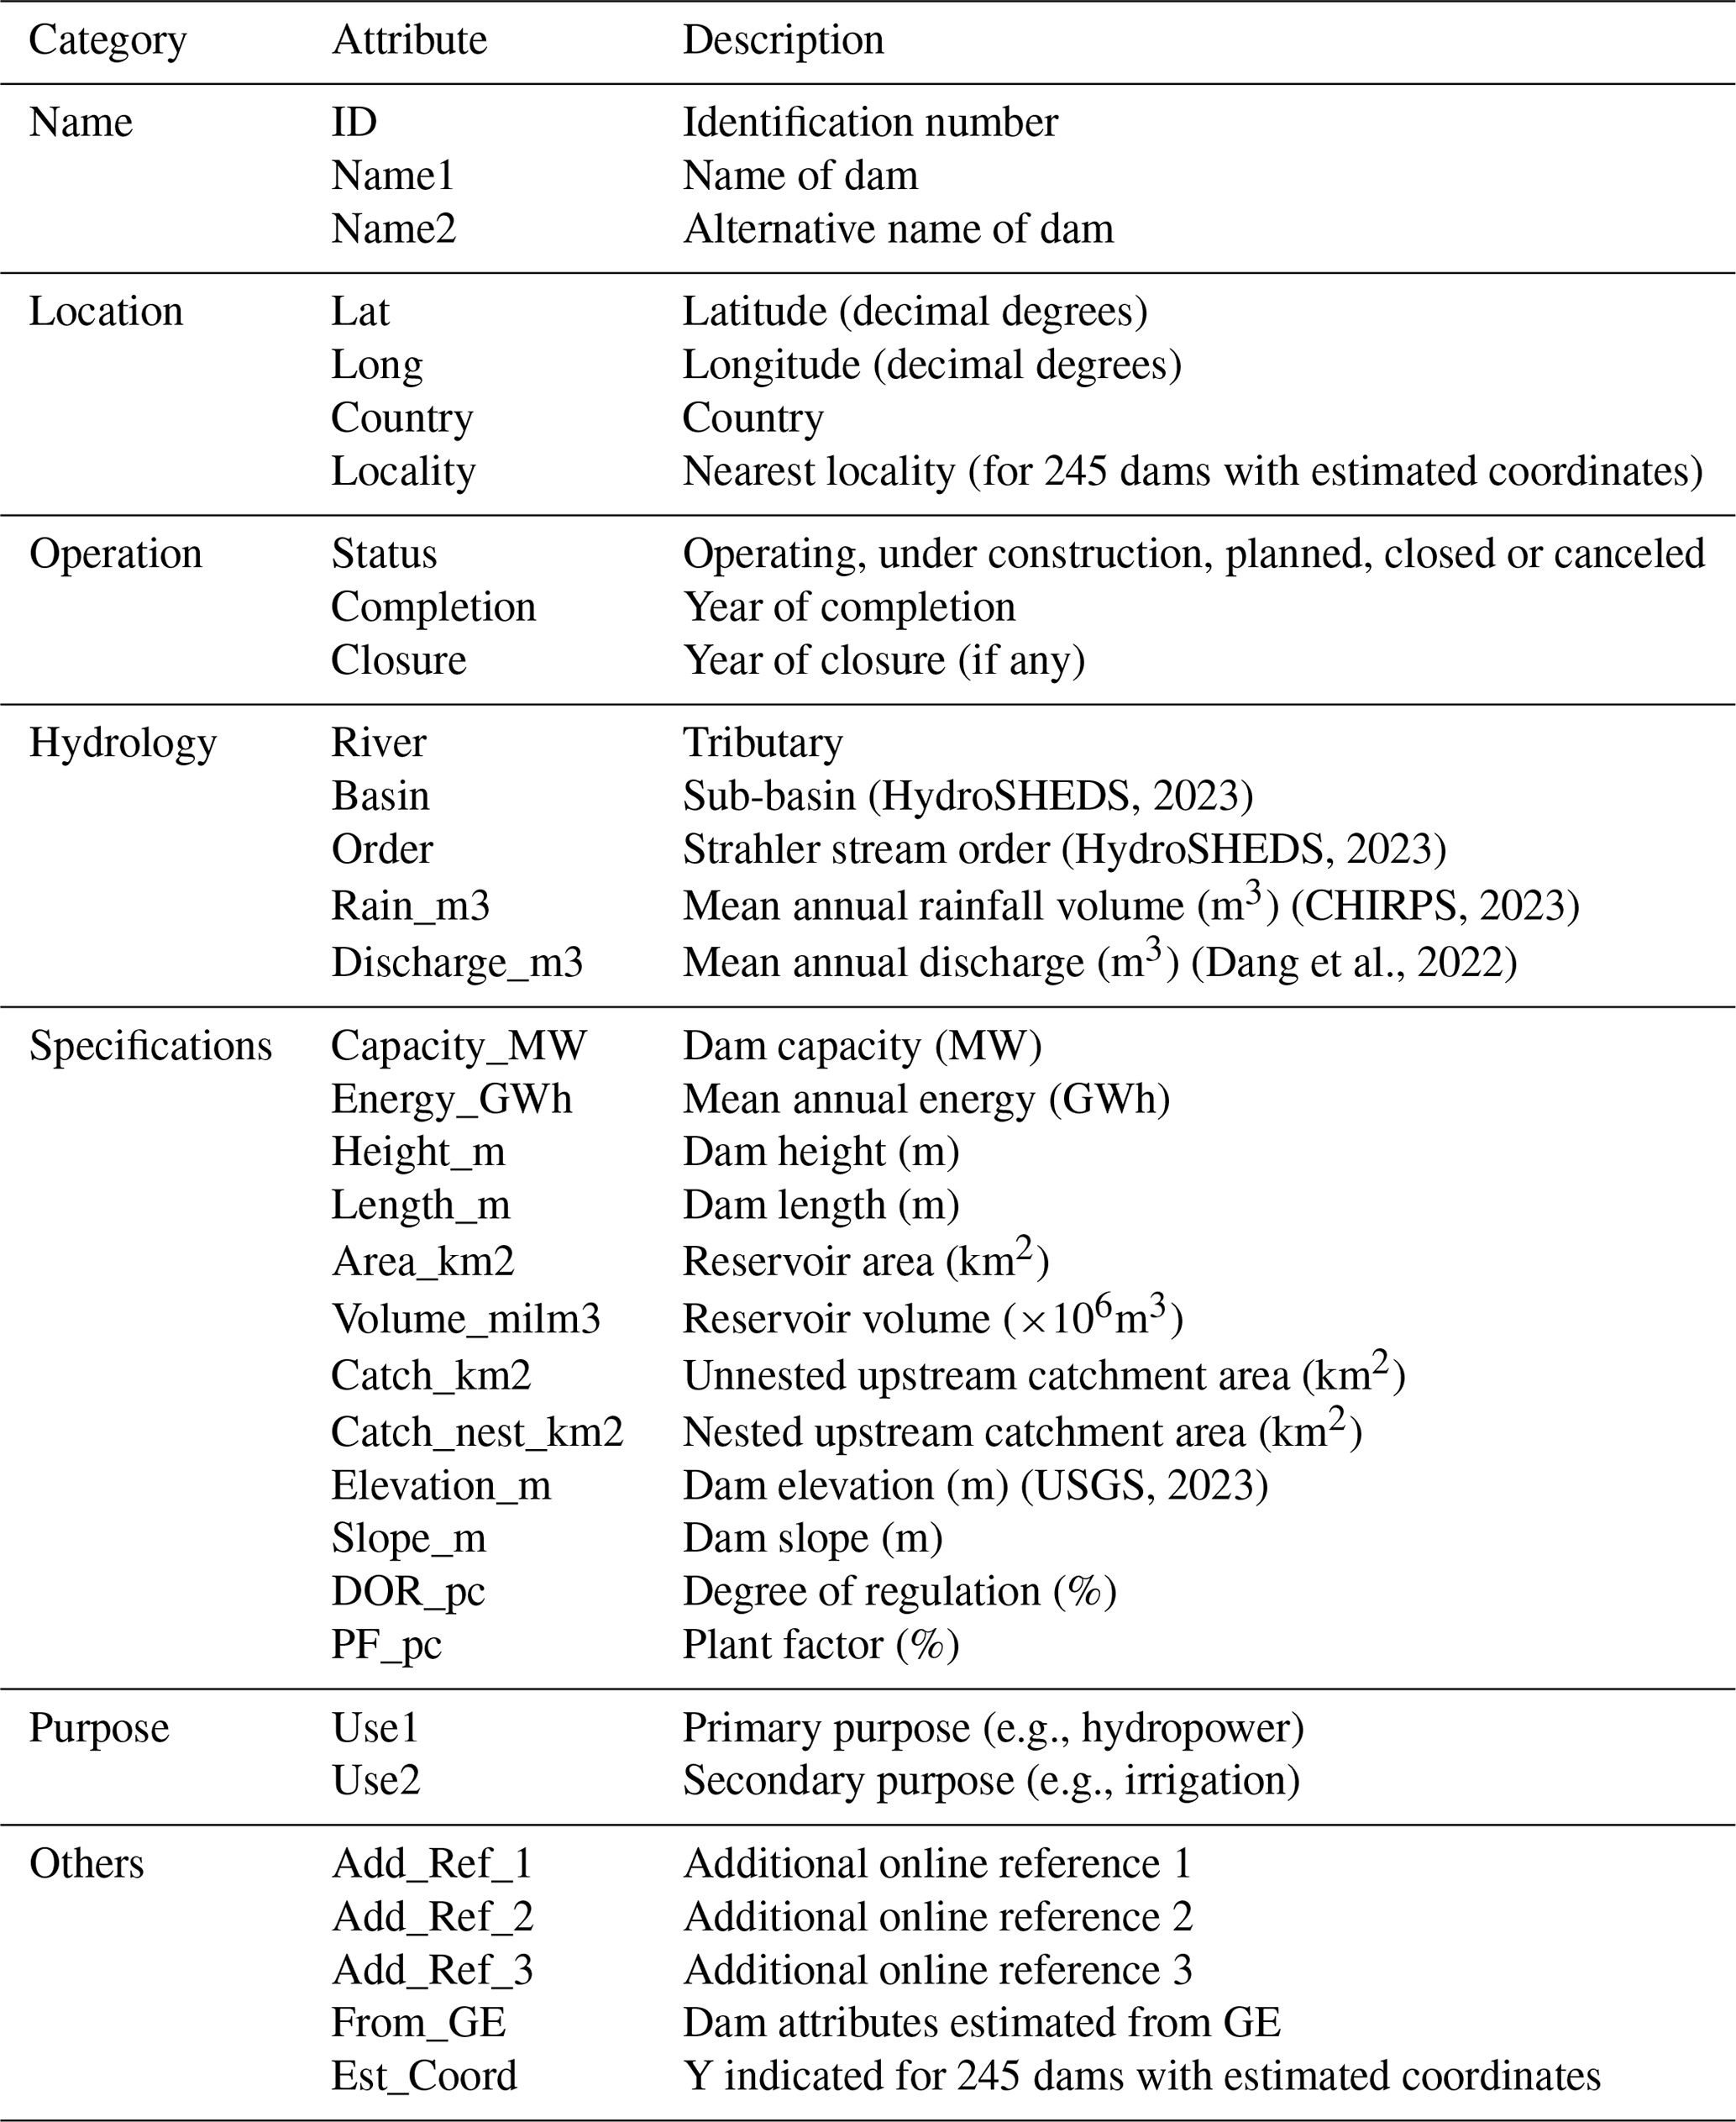
Additional attributes are added through GIS. We extract the elevation and slope from the 30 m SRTM DEM (USGS, 2023), the Strahler stream order from HydroRIVERS, and the sub-basin from HydroBASINS (Level 7), merged with reference to the Mekong River Commission's sub-basin delineation (HydroSHEDS, 2023; MRC, 2023). Although the elevation and sub-basin are available in some databases, not all the entries have such data, discrepancies exist across the databases, and hence we use GIS to compute the attributes of all the dams instead. To extract the catchment area of each dam, flow direction and accumulation are derived from the DEM using the D8 flow method, and dam points are snapped to a nearby cell of the highest accumulation. The snap distance for each dam is adjusted if necessary – 300 to 400 m for smaller dams and 800 to 2000 m for larger dams. Dam catchments are delineated as unnested, and hence we sum them to obtain the area of the nested catchments. The database includes the modeled mean annual discharge at each dam over 5 years (2011 to 2015) (Dang et al., 2022) and the mean total annual rainfall volume (2011 to 2015) in each dam catchment: mean annual rainfall from CHIRPS, a widely used rainfall product at 0.05° resolution (CHIRPS, 2023), multiplied by the nested catchment area. The degree of regulation is derived from the ratio between the total upstream reservoir volume and the discharge at each dam, which represents the impact of the dams on the downstream flow regime (Grill et al., 2014; Lehner et al., 2011). The list of attributes compiled in Excel is in Table 2.
While compiling from the dam databases and online literature, a portion of the dams was found to lack specific coordinates, but their names, hydropower capacity, status, and nearest locality (e.g., province) are known. These dams are mostly planned dams lying in Laos, as determined from the MIT database and corroborated with reports online (e.g., MRC, 2015; The World Bank, 2017). For the few operational dams, their year of completion was estimated from the year of the report they were found in. We identify the unique dams as much as possible based on their names and estimate the dam coordinates from the nearest known locality; 245 dams are obtained but set aside from the 810 dams with known specific coordinates, totaling a final count of 1055 dams in the database.
3.5 Spatiotemporal analysis
Using the year of completion (and year of closure, if any), dams are filtered by decade – 1980s, 1990s, 2000s, 2010s, or post-2020s. The first four groups include dams that are operational in each decade, while the last group includes dams that began operation in 2020 or later, dams under construction, and planned dams with available information. Canceled dams are excluded from analysis. The total or installed hydropower capacity is calculated per decade, defined as the sum of the hydropower capacity of all the hydropower dams in each decade. The spatiotemporal distribution of the dams is evaluated, including comparing the growth in the number of dams and hydropower capacity over the decades across countries and major sub-basins and identifying key regions with the largest growth thus far and regions with the highest projected growth. We visualize the distribution of dams in each country by their attributes, i.e., status, purpose, elevation, slope, rainfall, discharge, nested catchment area, stream order, and hydropower capacity. Focusing on the 810 dams with known specific coordinates, we analyze the relationship between hydropower capacity and the four parameters of elevation, slope, rainfall, and discharge. The nested catchment area of each dam is divided by the total area of the Mekong Basin to compare the distribution of upstream and downstream dams across countries.
3.6 Calculating hydropower potential
To calculate the theoretical hydropower potential, defined as all hydropower potentially available, including hydropower that has yet to be harnessed, we adopt the approach by Pokhrel et al. (2008):
where P is the hydropower potential (W), γ is the weight density of water (9810 N m−3), Q is the discharge (m3 s−1), h is the elevation (m), and η is the overall electrical efficiency. η, which accounts for energy losses from equipment like turbines and generators, ranges from 50 % to 95 % in studies, and thus we use an average efficiency of 70 % (Cuya et al., 2013; Zhou et al., 2015). γ×Q can also be understood as the gravitational acceleration (9.81 m s−2) multiplied by the mass of water flow (Q× 1000 kg m−3, where 1000 kg m−3 is the density of water).
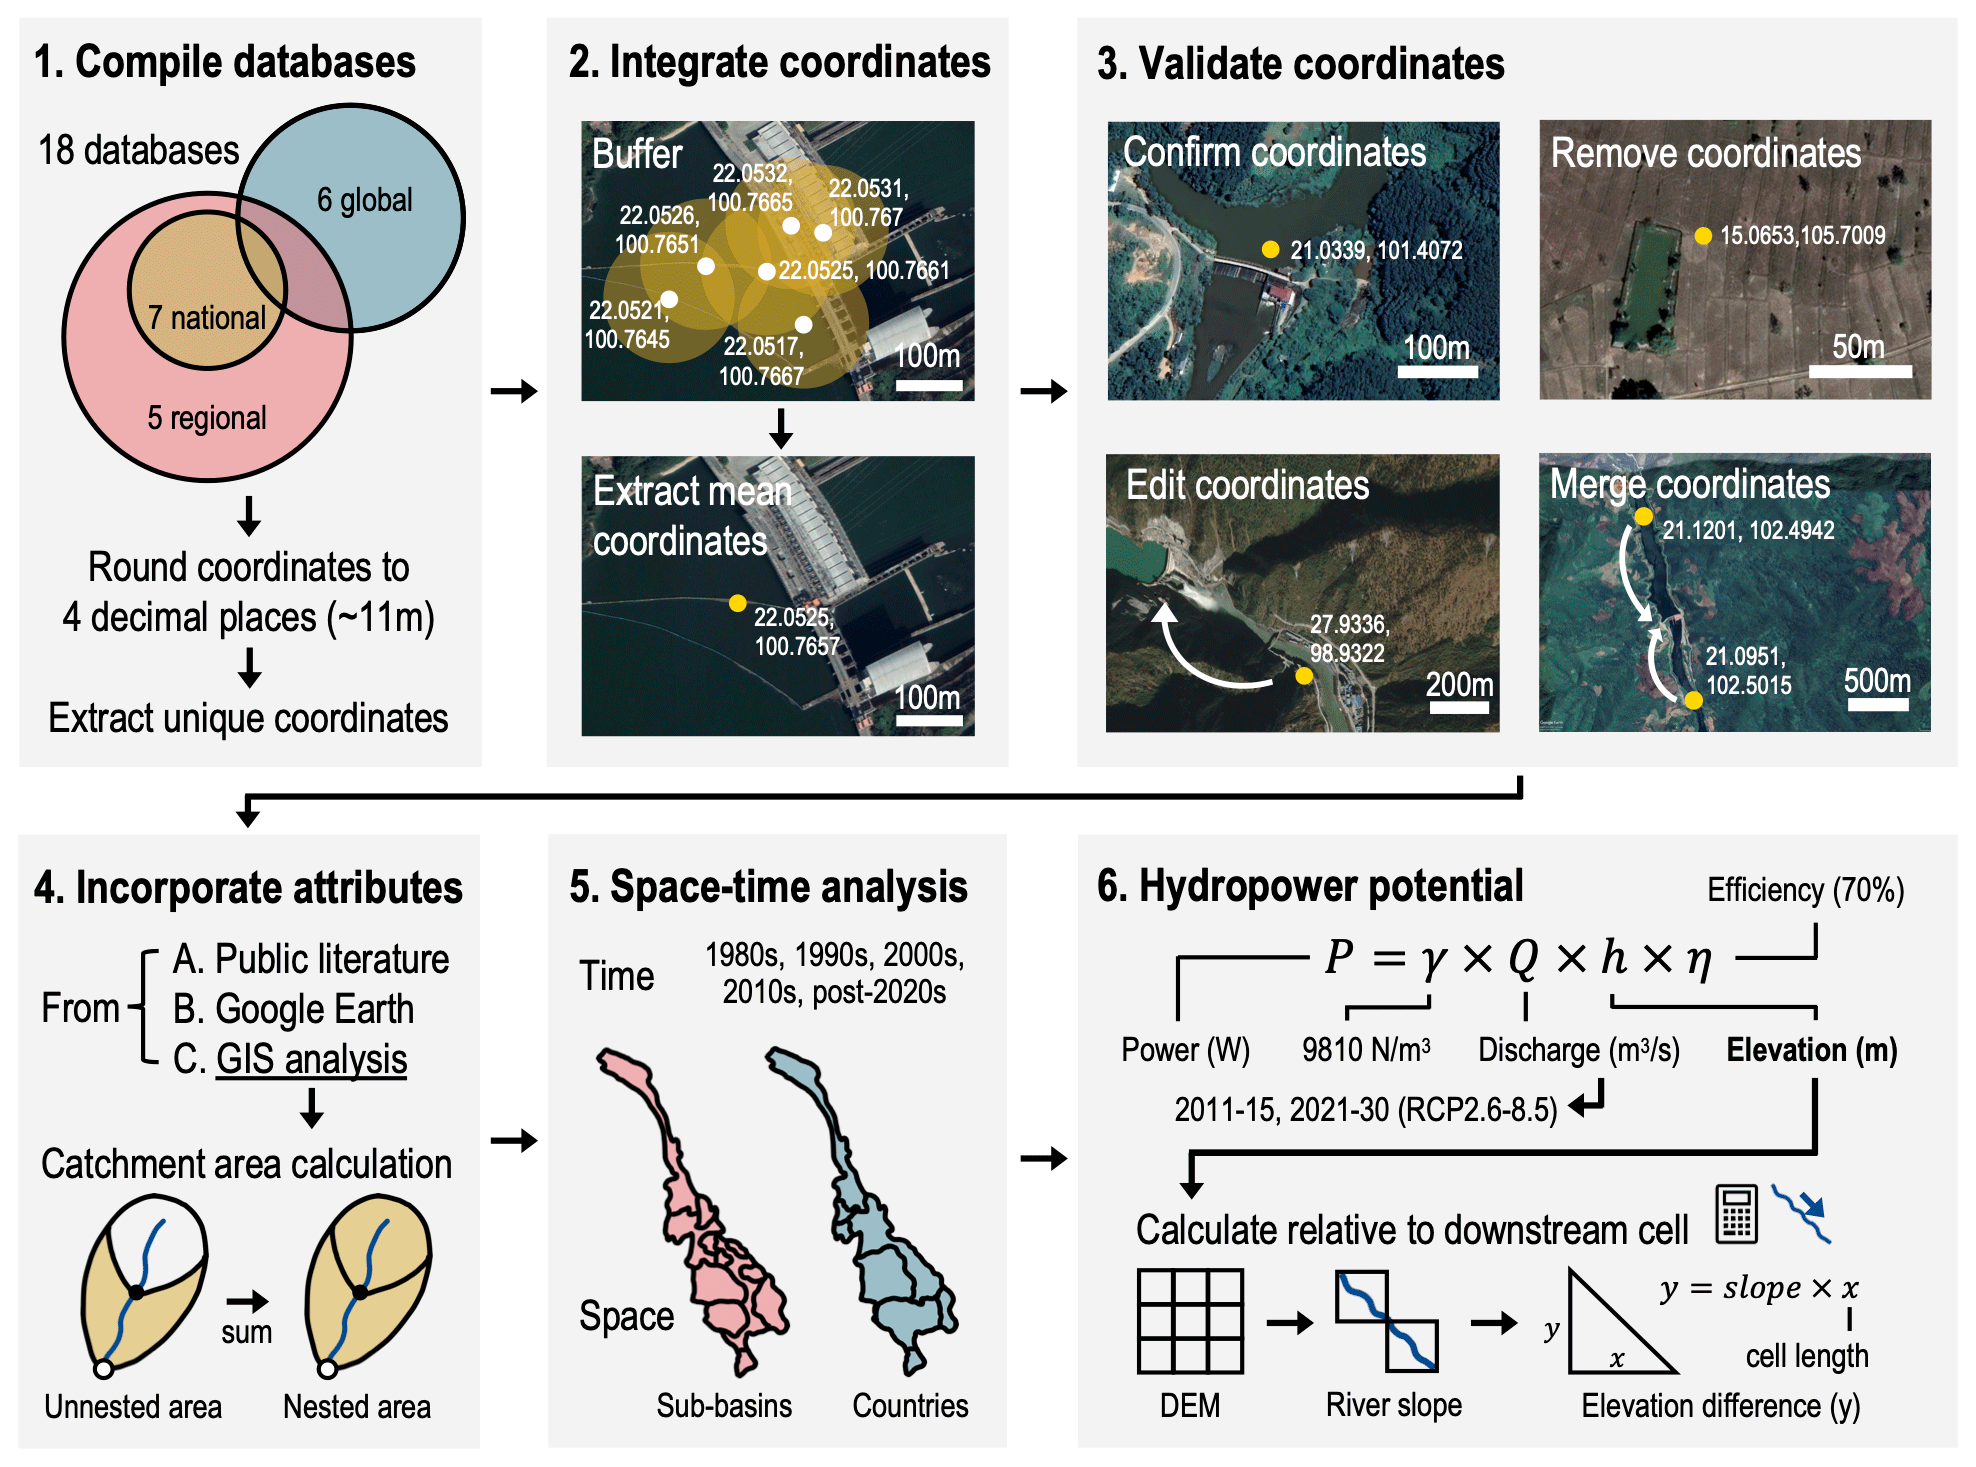
Figure 2Methodological flowchart outlining the six main steps in data cleaning, compilation, validation, and analysis. The simplified Venn diagram in step 1 reflects the observed hierarchy across the global, regional, and national databases. The images in steps 2 and 3 are taken from Google Earth to exemplify the process. Map data: Google, © 2023 Maxar Technologies, CNES/Airbus. For steps 4 to 6, selected key parts of the calculations are shown.
Elevation is defined relative to the downstream cell to take river flow into consideration. Using the 30 m SRTM DEM, we calculate the slope along the stream network before converting it to a raster matching the resolution and alignment of the discharge data and multiplying it by the cell length to obtain the elevation difference between each cell and its downstream cell (Meijer et al., 2012). We calculate hydropower potential using the present-day discharge simulated by the CaMa-Flood model (2011–2015, 0.05°), with the inundation mode turned on and driven by runoff simulated by the global hydrological model HiGW-MAT (Dang et al., 2022; Pokhrel et al., 2017). Future discharge is simulated by the WaterGAP2 model for the ISIMIP2b simulation round (2021–2040, 0.5°) using the GFDL-ESM2M climate model (Gosling et al., 2023). ISIMIP2b simulations are bias-corrected, and WaterGAP results have been used and validated globally (Gudmundsson et al., 2021; Hempel et al., 2013; Pokhrel et al., 2021). Datasets from both the CaMa-Flood model and the WaterGAP2 model consider the effect of dams on total annual discharge. Future discharge is affected by climate change, modeled based on four Representative Concentration Pathways (RCPs 2.6, 4.5, 6.0, and 8.5), which are greenhouse gas concentration scenarios used by the Intergovernmental Panel on Climate Change (IPCC). We perform one calculation per RCP, and for each calculation, we sum the grids to obtain the total hydropower potential in each country and across the whole basin. The flow of data processing is outlined in Fig. 2.
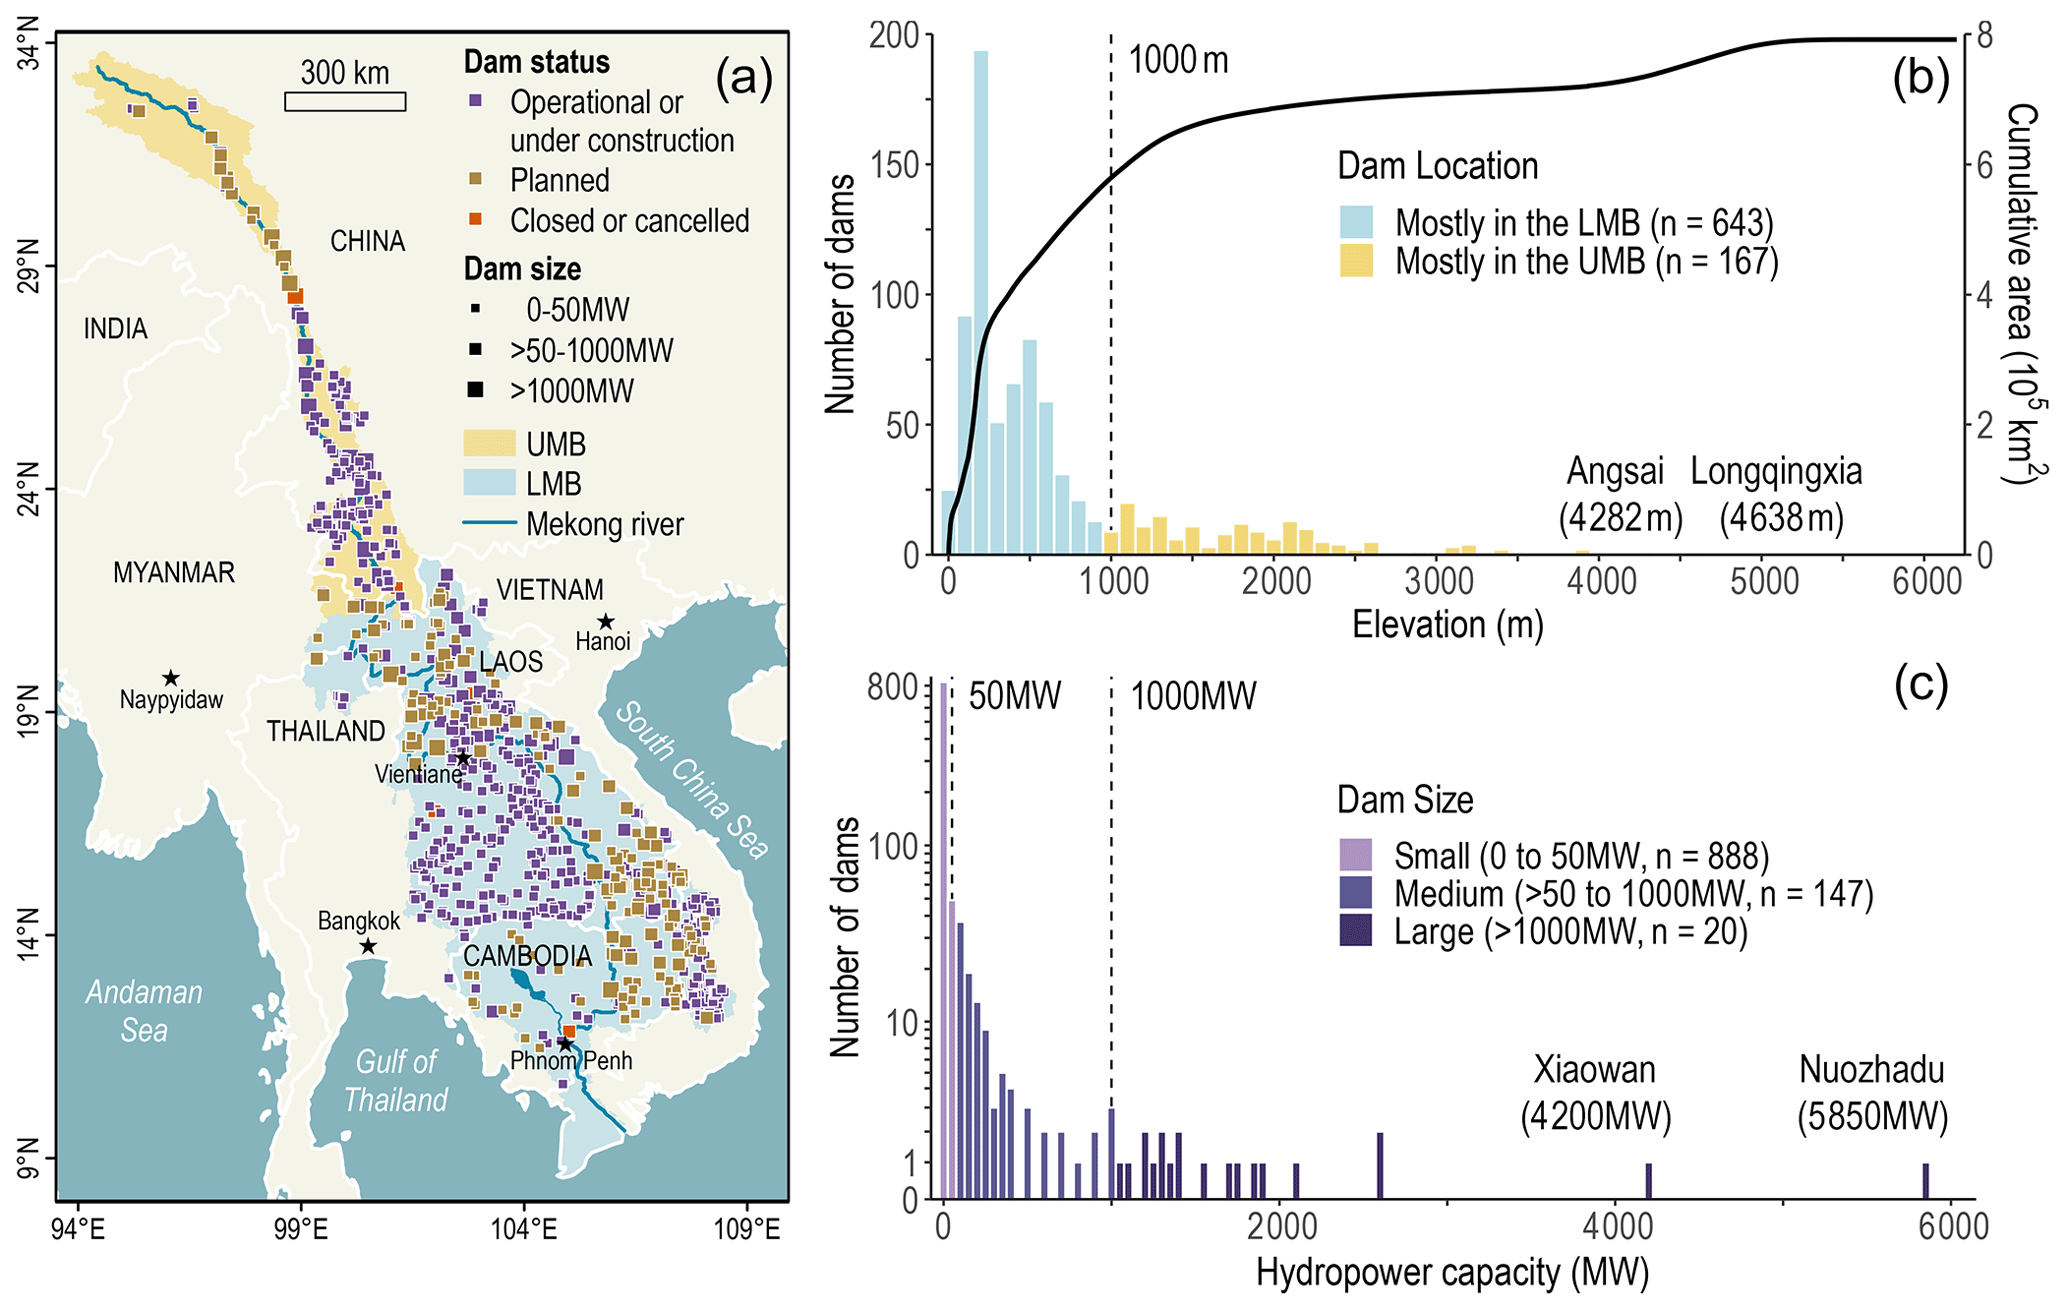
Figure 3(a) Map of the current dam network, with operational dams or dams under construction in purple, planned dams in yellow, and closed or canceled dams in red. (b) Distribution of dams based on their elevation. Most dams of elevation below 1000 m lie in the Lower Mekong Basin (LMB), while most dams of elevation above 1000 m lie in the Upper Mekong Basin (UMB). Around 75 % of the Mekong Basin is below 1000 m, as shown by the hypsometric curve of the cumulative area in the basin against elevation derived from the 30 m SRTM DEM. (c) Distribution of hydropower dams based on their size (hydropower capacity), including the 245 dams without known specific coordinates. Small dams are 0 to 50 MW, medium dams are over 50 to 1000 MW, while large dams are over 1000 MW.
4.1 Current distribution of dams
Based on our database, there are 1055 dams in the Mekong, including 661 operational, 54 under construction, 331 planned, 2 closed, and 7 canceled (Fig. 3a). The operational dams are mainly in Thailand and the downstream portion of China, while the planned dams are predominantly in Laos, Cambodia, and the upstream portion of China. The total dam count is more than twice that of the largest existing database of 466 dams last updated in 2016 (Table 1), reflecting the rapid rate at which the dam network is evolving; 79 % of the dams are found at lower elevations of 1000 m and below compared to 21 % of the dams found above 1000 m (Fig. 3b). Dams at lower elevations mostly lie in the LMB, while dams at higher elevations are generally in the mountainous UMB, with some lying in the Mekong Highlands of Laos (Leinenkugel et al., 2013). The two dams of the highest elevation are Longqingxia and Angsai in China, at 4638 and 4282 m, respectively. Most of the dams (84 %) are small dams with a hydropower capacity of 50 MW and below (Fig. 3c). These small dams include 447 non-hydropower dams classified into three purposes: water supply, flood control, and irrigation. Considering the monsoonal climate of the Mekong Basin with distinct dry and wet seasons, water supply and flood control dams are used in regulating water flow to provide water for nearby settlements in the dry season and to lower flood risk in the wet season (Yuen et al., 2023). Small irrigation dams are concentrated in Thailand, where the Khorat Plateau is intensively cultivated for agricultural exports (Kondolf et al., 2014; Li et al., 2017). As for the remaining hydropower dams, 14 % are medium dams of over 50 to 1000 MW, and 2 % are large dams of over 1000 MW (Fig. 3c). The two dams of the highest capacity are Nuozhadu and Xiaowan in China at 5850 MW and 4200 MW, respectively. Large dams are mainly located along the mainstream in China, Laos, and Cambodia (Fig. 3a). The dam cascade on the mainstem in the UMB in China has a total operational reservoir volume of 45×109 m3 and a hydropower capacity of 21 250 MW, which increases to 63×109 m3 and 30 566 MW, respectively, should dams under construction and planned dams be considered. Downstream in the LMB in Laos and Cambodia, the two operational mainstem dams have a combined reservoir volume of 2×10⁹ m3 and a hydropower capacity of 2085 MW, which is set to increase to 12×109 m3 and 13 326 MW after the planned cascade is completed.
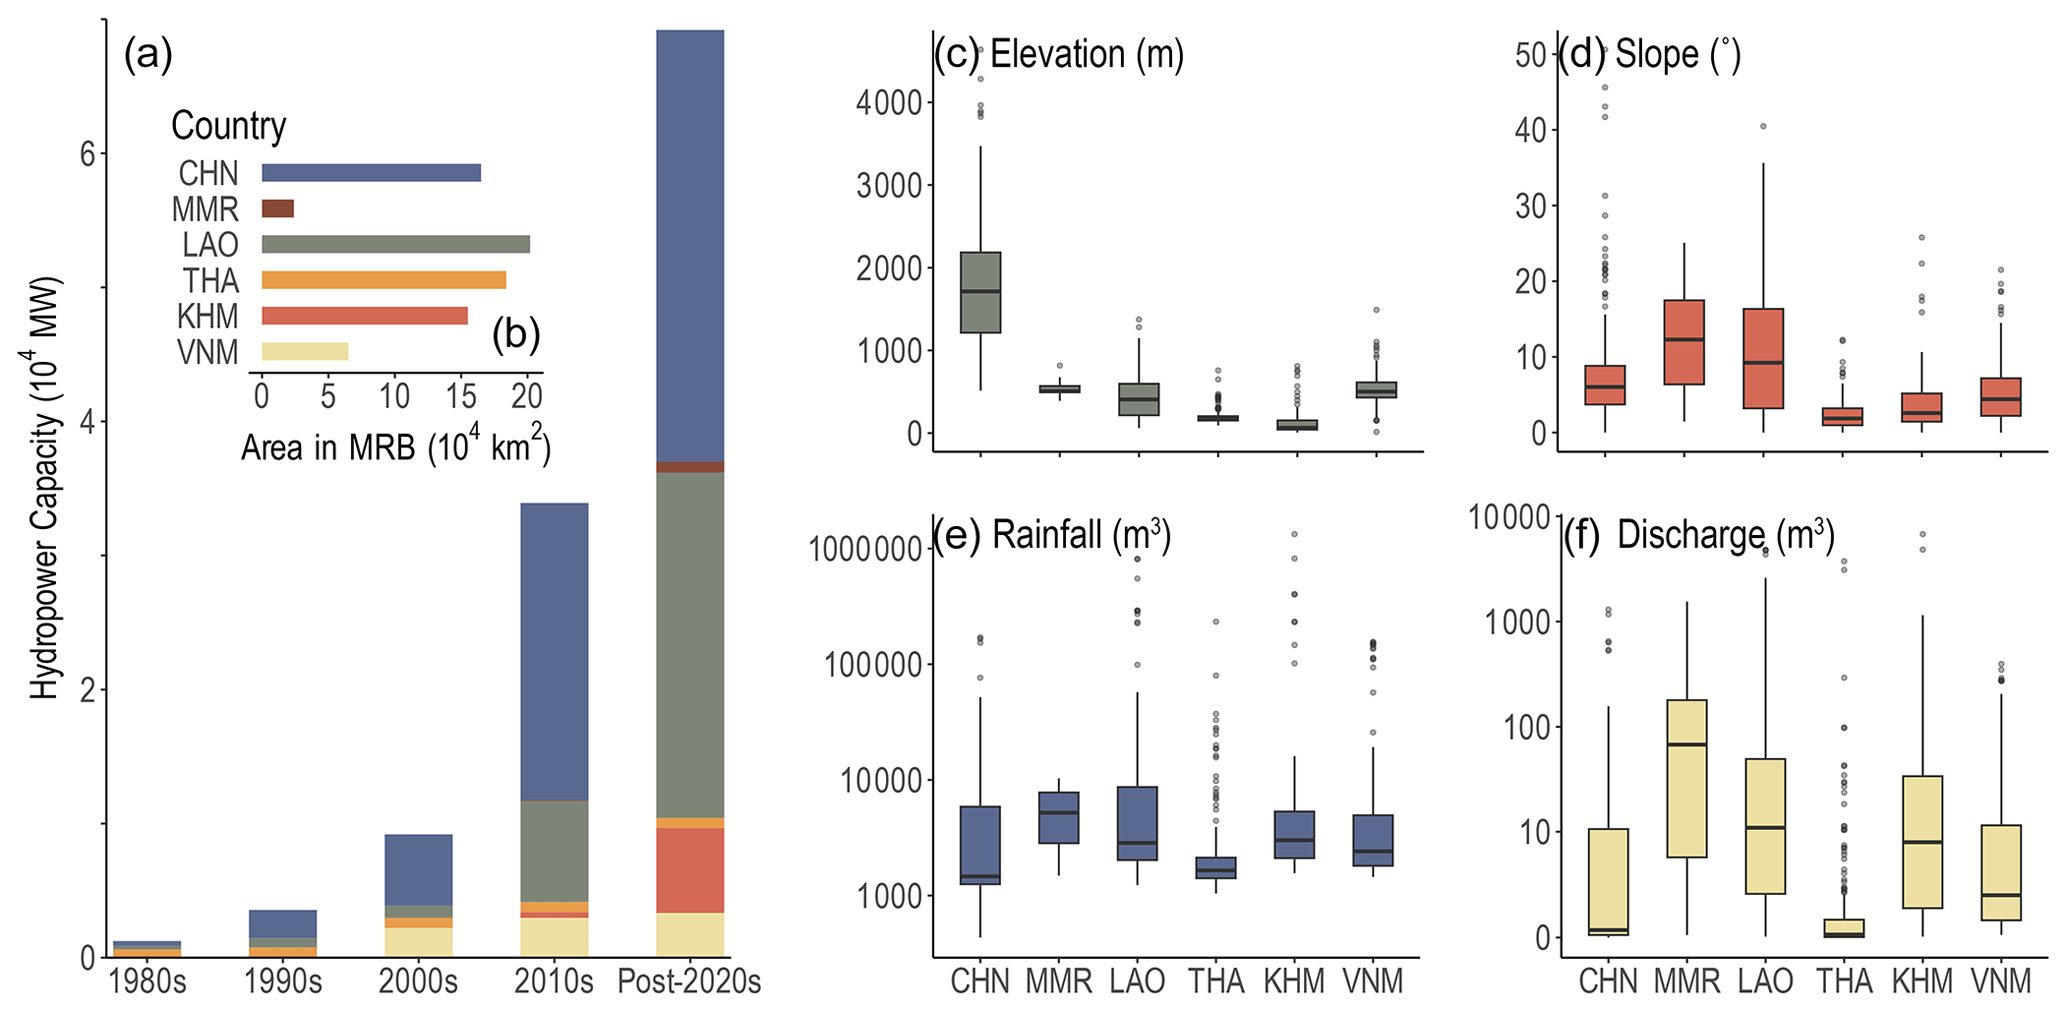
Figure 4(a) Total hydropower capacity of dams per country in each decade from the 1980s to post-2020s, of which 36 058 MW is the total hydropower capacity of currently operational dams. The color and order of each country are indicated in panel (b). (b) Area of each country within the Mekong River Basin (MRB) (Rossi et al., 2009). (c–f) Box plots per country showing the distribution of dam elevation, dam slope angle, mean total annual rainfall volume within each dam's nested catchment (2011–2015), and mean annual discharge at each dam (2011–2015) (Dang et al., 2022). Countries are labeled by their three-letter codes, ordered from upstream to downstream (similarly in Figs. 6 and 7).
4.2 Spatiotemporal analysis of dam growth
The total hydropower capacity has expanded exponentially from 1242 MW in the 1980s to 33 914 MW in the 2010s, with a jump of 24 717 MW from the 2000s to the 2010s (Fig. 4a). This corroborates a reported spike in hydropower dams after 2005 to 2010 associated with rising energy demands from increased economic development and demographic growth (Binh et al., 2020; Dugan et al., 2010; Hecht et al., 2019; Li et al., 2017). The total hydropower capacity of currently operational dams is 36 058 MW. Since hydropower remains an attractive low-cost energy source in a region rich in water resources (IRENA, 2022), the growth in dams is expected to continue – hydropower capacity is projected to nearly double to 69 199 MW post-2020s after taking dams under construction and planned dams into consideration (Fig. 4a). China has the largest capacity, with a notable increase from 5326 MW in the 2000s to 22 180 MW in the 2010s, being the earliest country to start harnessing the Mekong's hydropower potential (Cronin, 2009); 96 % of the capacity stems from the 11-dam cascade along the mainstream. Although China currently has the highest installed capacity, Laos has the most planned dams (61) and is expected to have the greatest growth from 7525 MW in the 2010s to 25 748 MW post-2020s (Figs. 3a and 4a). The expansion of the capacity in Laos is in line with the country's aim to become the Battery of Southeast Asia (Galelli et al., 2022; Soukhaphon et al., 2021).
Hydropower capacity relates to geography and hydrology, and hence we visualize the distribution of dams by elevation, slope, mean total annual rainfall, and mean annual discharge (Fig. 4c to f). Considering that potential energy depends on height and mass, elevation and slope reflect the height of the dam location, while rainfall and discharge reflect the mass of the water flowing through the dam (Lehner et al., 2005; Pokhrel et al., 2008). Since slope is a measurement of change in elevation, a fairly similar trend can be observed between elevation and slope. Likewise, since discharge is dependent on the available rainfall, a similar trend can be seen between rainfall and discharge, even though the rainfall data presented are not the rainfall data used to model discharge. This suggests that the trend is not due to any potential bias introduced by modeling and that the distribution pattern in rainfall on a basin-wide scale is similar across the different products. The elevation of dams and the total range in slope (including outliers) are highest in the UMB in China, which contributes to the large hydropower capacity of the country. The UMB, which includes part of the Tibetan Plateau and the Three Rivers Area, is highly mountainous and steep – along the Mekong mainstream in China, elevation drops 700 m within just 750 km (Biba, 2012; MRC, 2023). Significant elevation and slope are also observed in Laos, where the Mekong Highlands (Northern Mountains and Annamite Range or Eastern Highlands) generally lie (Leinenkugel et al., 2013). Together with high rainfall and high discharge along the mainstream, the estimates corroborate the large capacity in Laos. Myanmar also has a relatively high slope and discharge, but the hydropower capacity is limited by area: Myanmar only occupies 3 % of the 795 000 km2 of the basin area (Gao et al., 2022; Hecht et al., 2019) (Fig. 4b).
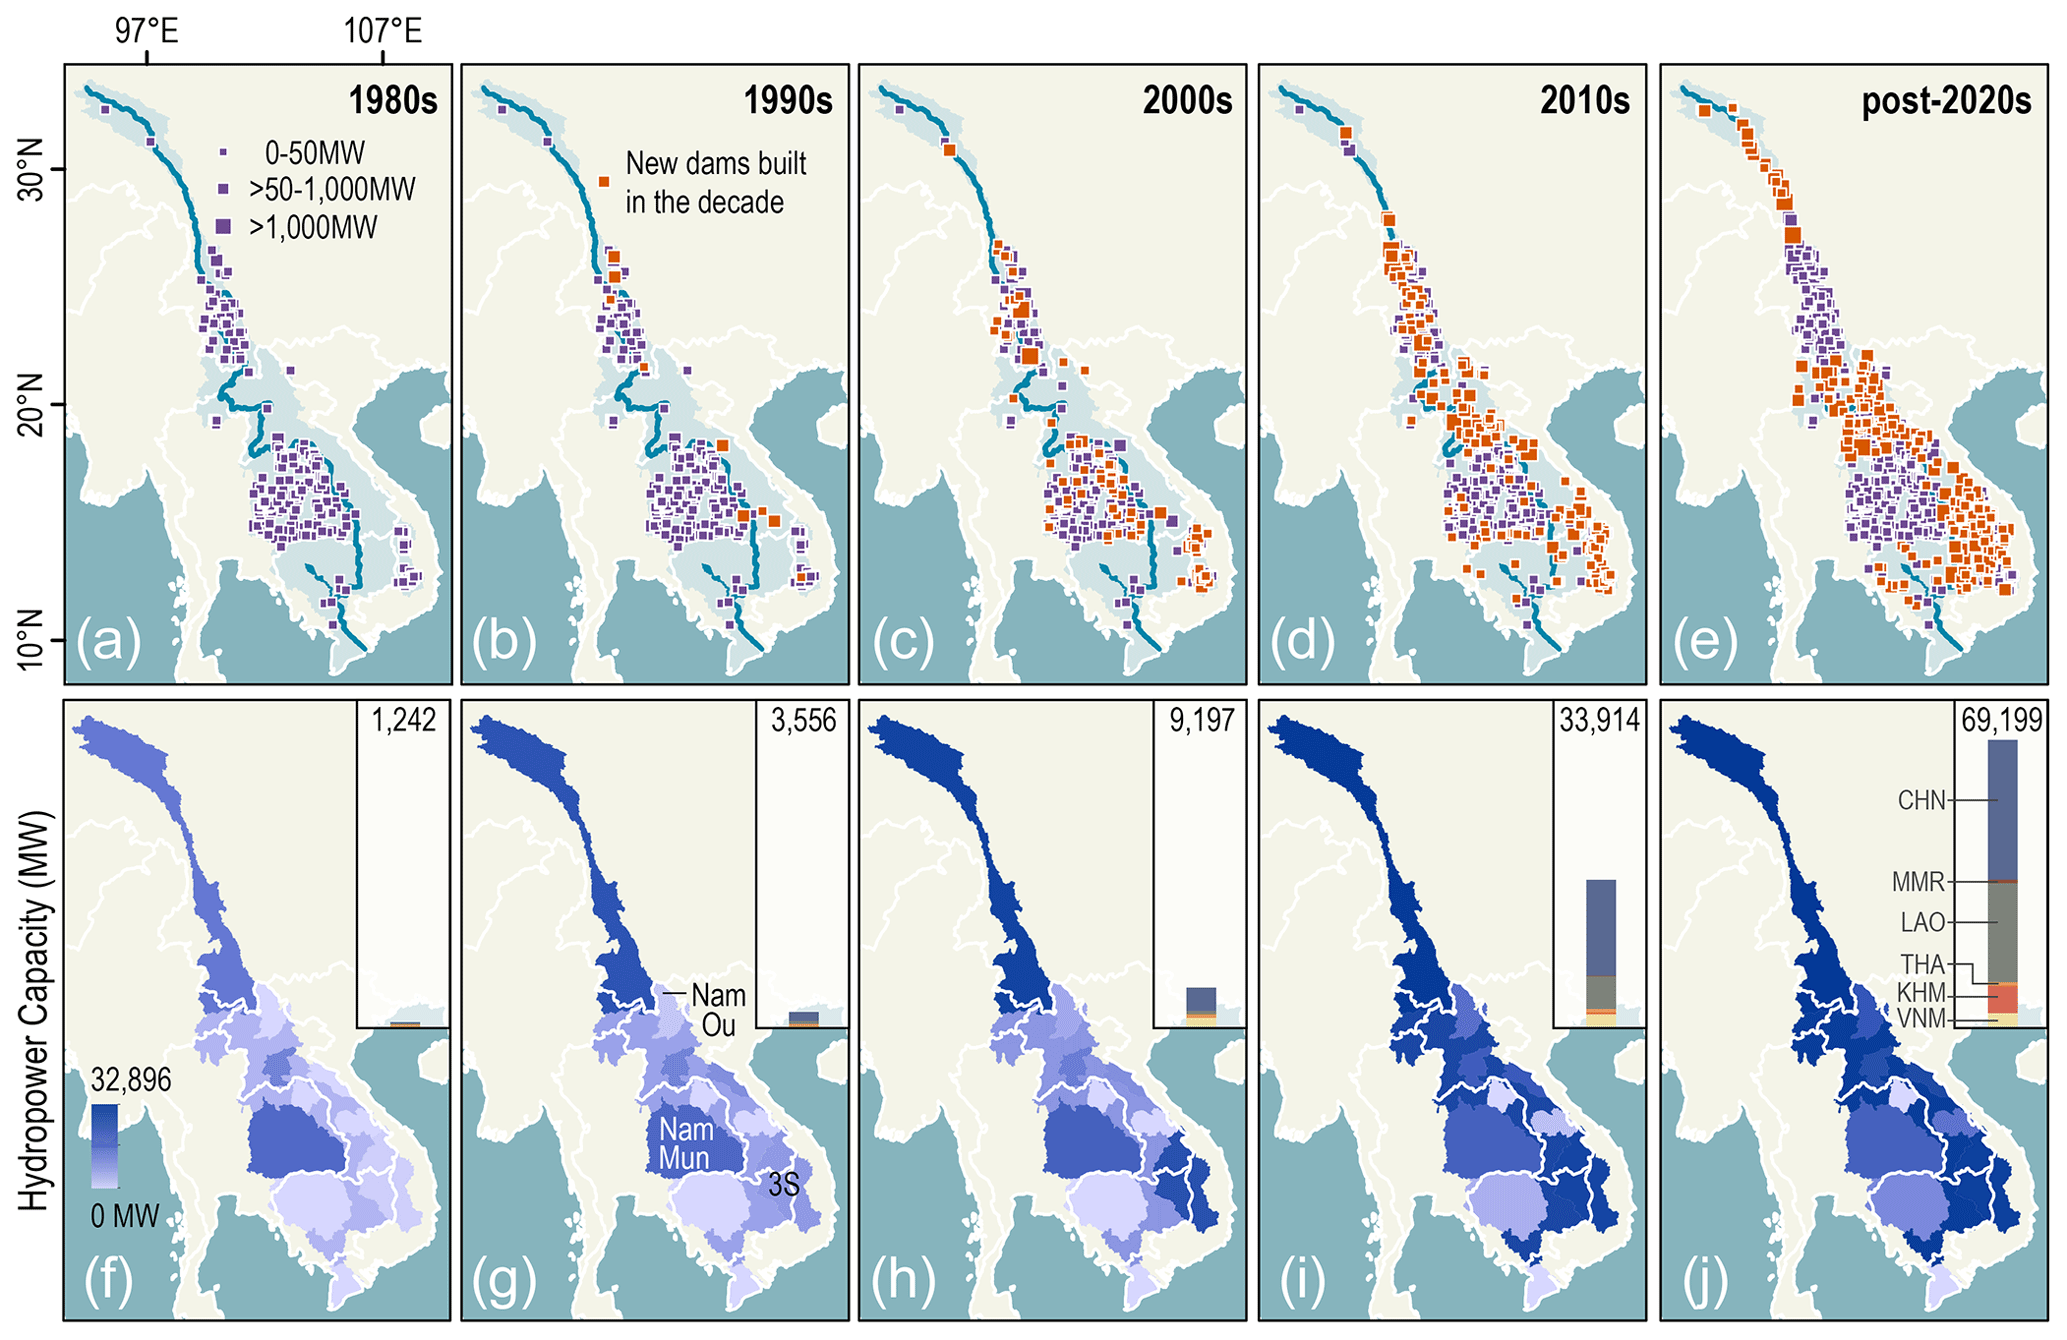
Figure 5(a–e) Distribution of the dams in each decade from the 1980s to post-2020s. Newly built dams in each decade are indicated in red. (f–j) Total hydropower capacity of operating dams per major sub-basin in each decade from the 1980s to post-2020s, with three notable basins labeled (Nam Ou, Nam Mun, 3S). Each sub-figure corresponds to each bar plot in Fig. 4a, labeled with the total hydropower capacity of the Mekong Basin per decade.
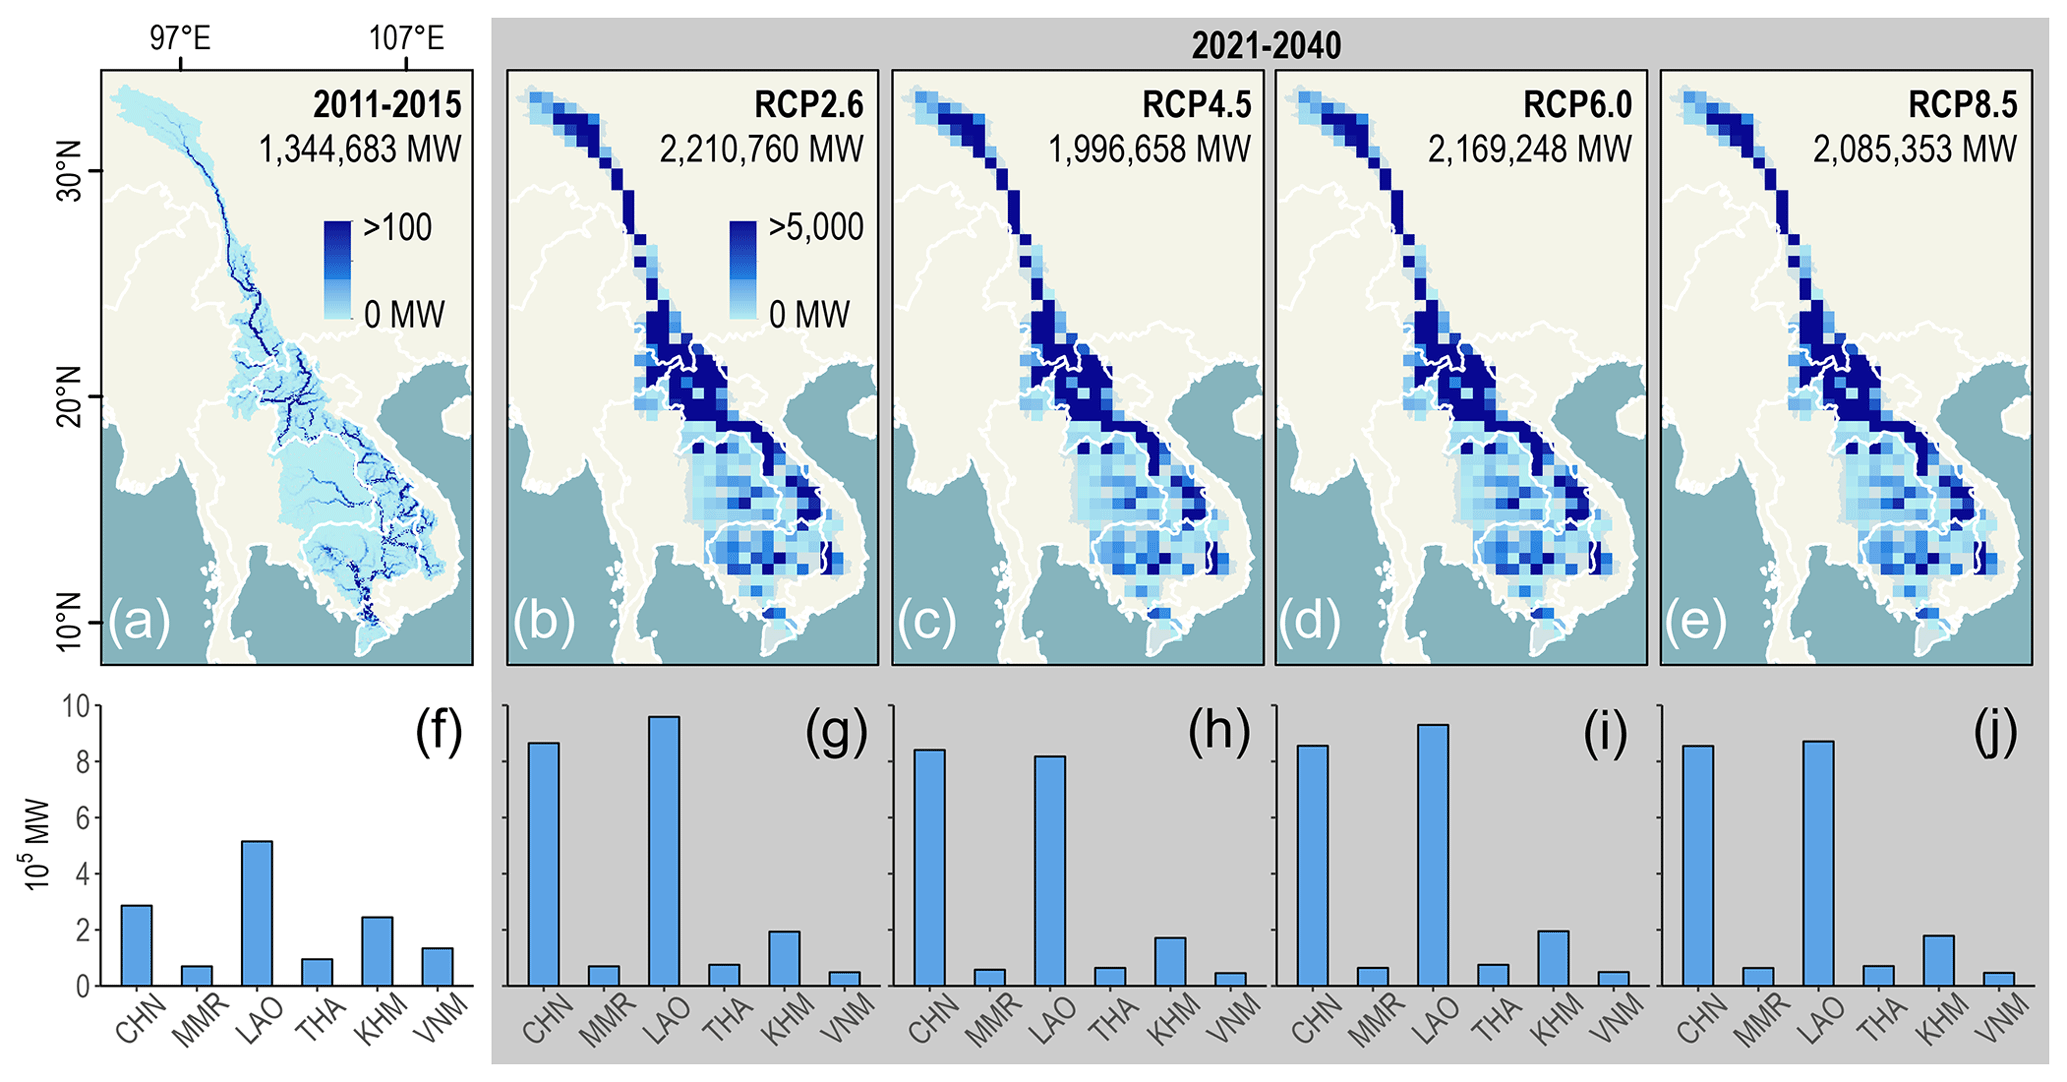
Figure 6(a) Theoretical hydropower potential in the Mekong Basin, estimated from gravity, elevation (relative to the downstream cell), and average annual discharge in 2011 to 2015. (b–e) Hydropower potential estimated from the average annual discharge in 2021 to 2040, modeled based on four Representative Concentration Pathways (b: 2.6, c: 4.5, d: 6.0, e: 8.5). (f–j) Bar graph of the total hydropower potential in each country, corresponding to panels (a)–(e).
The expanding dam network and hydropower capacity in China and Laos are mapped per decade from the 1980s to post-2020s in Fig. 5, a spatial representation of Fig. 4a – each sub-figure in Fig. 5 corresponds to each bar plot in Fig. 4a. Growth is evident in the 2010s and post-2020s, with numerous new large dams along the mainstream indicated in red in Fig. 5d and e and a sudden increase in the hydropower capacity of LMB sub-basins, such as Nam Ou (Fig. 5g), indicated in dark purple in Fig. 5i and j. Notable growth is also seen in Vietnam from the 2000s to post-2020s within the upstream portion of the 3S sub-basin (Fig. 5g to j), where a relatively high elevation and slope contribute to the hydropower capacity (Souter et al., 2020) (Fig. 4c and d). Nevertheless, the capacity in Vietnam is restricted by the country's area coverage (8 % of the basin) (Fig. 4b). Similarly, in Myanmar, the area limits the planned dams post-2020s (Figs. 4b and 5e). The dam network and hydropower capacity remain generally the same in Thailand and its major sub-basin Nam Mun (Fig. 5g), given that most of the dams have been for irrigation and operational since the 1980s (Figs. 4a and 5). For instance, the Khorat Plateau in Thailand is a key agricultural area producing large volumes of global exports like rice (Kang et al., 2021; Kondolf et al., 2014). The low capacity in Thailand is associated with its low dam elevation and slope and mostly low rainfall and discharge (Fig. 4c to f). While Cambodia has a minimal elevation and slope within the Mekong Lowlands, high rainfall and discharge allow for some hydropower capacity (Leinenkugel et al., 2013) (Fig. 4). Dam growth is concentrated in the downstream portion of the 3S basin and along the mainstream, where two large dams form part of the LMB cascade (Fig. 5e).
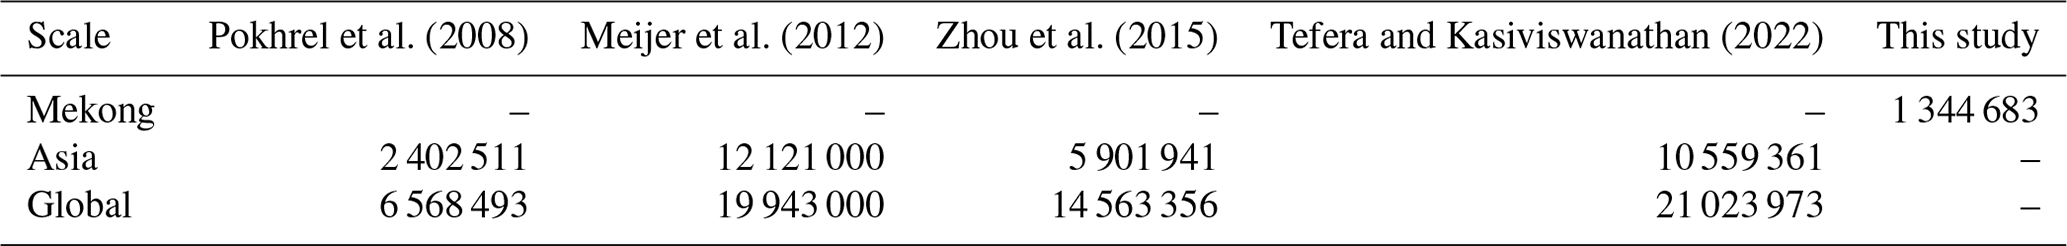
Table 3Literature values of theoretical hydropower potential (MW) globally and in Asia.
4.3 Hydropower potential
The total theoretical hydropower potential in the Mekong Basin based on present-day discharge (2011–2015) is an estimated 1 334 683 MW (Fig. 6a). Calculations of hydropower potential in Asia vary quite widely in previous studies, ranging from 2 402 511 to 12 121 000 MW (Meijer et al., 2012; Pokhrel et al., 2008) (Table 3). Asia is the continent richest in hydropower, contributing around half of the world's total potential (Table 3). Considering that the Mekong is the longest river in Southeast Asia and the third longest in Asia (MRC, 2023), our estimated 1 334 683 MW in the Mekong is largely comparable with previous estimates. Hydropower potential that can be harnessed in reality will be lower given restrictions such as economic feasibility, legal factors, and sociopolitical concerns, but our results suggest that the current estimates of 30 000 MW for the LMB and 28 930 MW for the UMB may be too low (Lebel et al., 2007; MRC, 2011; Tefera and Kasiviswanathan, 2022). Should the basin-wide potential be limited to 58 930 MW, more than half is already installed (36 058 MW), and it will soon be exceeded by the planned capacity post-2020s (69 199 MW). Moreover, just one large dam is over 1000 MW and the current largest operational dam is almost 6000 MW, and hence it is likely that the hydropower potential in the Mekong will exceed 58 930 MW (Fig. 3c).
Projecting into the future based on four RCPs, 2021–2040 discharge data from the ISIMIP2b WaterGAP2 model are observed to have higher values than the present-day discharge data, and hydropower potential may grow correspondingly to over 2 000 000 MW under the influence of climate change (Fig. 6b to e) (Gosling et al., 2023). This value may be exaggerated by the difference in resolution between the discharge data currently available for present-day and future calculations. The finer resolution (0.05°) of present-day calculations shows more localized differences, while the coarser resolution (0.5°) of future calculations obscures details, is not perfectly aligned with the Mekong Basin boundary, and introduces a larger elevation difference between each cell and its downstream cell. Nevertheless, the projected increase in hydropower potential suggests that the Mekong Basin may be even more vulnerable to dam construction and its associated environmental and social tradeoffs in the future (Grill et al., 2014; Park et al., 2022; Schmitt et al., 2018).
Comparing across the countries, almost 40 % (514 887 MW) of the present-day potential lies in Laos, while more than 80 % of the future potential lies in China and Laos (Fig. 6f to j). China has a mountainous terrain with high elevations and a steep slope along the UMB mainstream, while Laos has high discharge along the LMB mainstream and a relatively significant elevation and slope in the Mekong Highlands (Fig. 4c to f) (Biba, 2012; Leinenkugel et al., 2013). The hydropower potential distribution appears to be similar across the RCPs, but the total hydropower potential varies slightly with RCP – lower in RCP4.5 and RCP8.5 but higher in RCP2.6 and RCP6.0 (Fig. 6b to e). Matching this trend, hydropower potentials in China and Laos are similar for RCP4.5 and RCP8.5 but higher in Laos for RCP2.6 and RCP6.0 (Fig. 6i). These observations could be associated with the greenhouse gas concentration in each RCP scenario during 2021 to 2040 – higher in RCP4.5 and RCP8.5 but lower in RCP2.6 and RCP6.0 (IPCC, 2014; Hanna et al., 2019). Interestingly, the hydropower potential across the RCP scenarios remains generally constant in most of the countries but changes significantly in Laos (Fig. 6g to j). The large hydropower potential in Laos and its fluctuation with RCP suggest that Laos may be more vulnerable to climate change and the most implicated by future dam expansion.
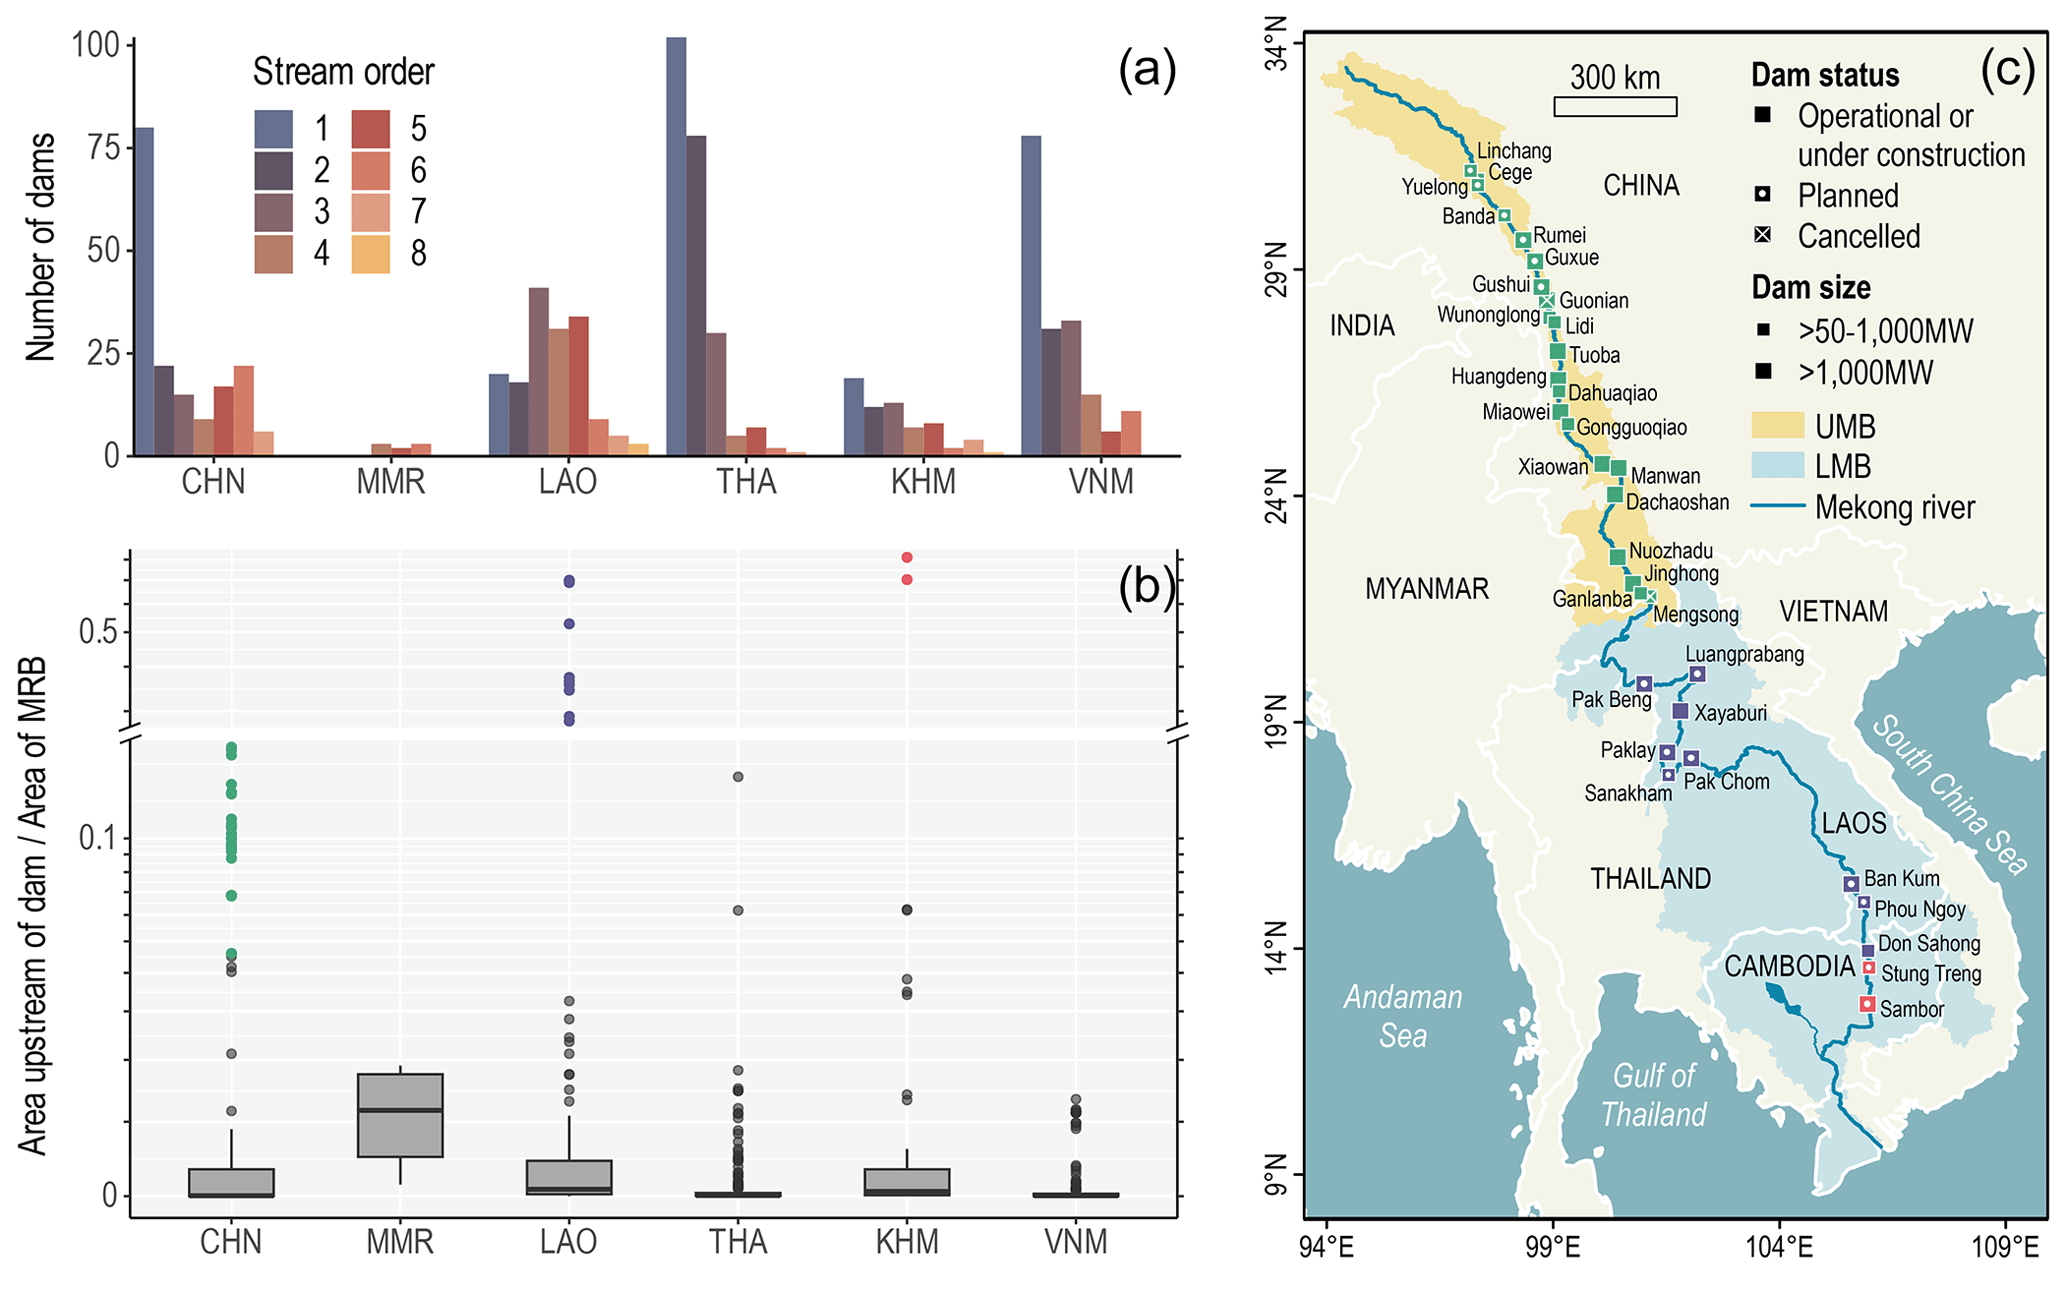
Figure 7(a) Distribution of dams based on the Strahler stream order per country. (b) Box plots per country showing the ratio of the area upstream of each dam to the total area of the Mekong River Basin (MRB) (Xu et al., 2021). The mainstream dams (as colored) have the highest ratios, located in China (green), Laos (purple), and Cambodia (red). (c) Map of dams along the mainstream, with colors corresponding to panel (b). Dam symbols are differentiated by status and size (capacity).
4.4 Comparison of the stream order of dams
Visualizing the distribution of dams by Strahler stream order, the number of dams generally decreases as stream order increases (Fig. 7a). Dams of low stream order are found in small tributaries, whereas dams of high stream order are along major tributaries and the Mekong mainstream, suggesting that the dams in the basin are predominantly smaller tributary dams. This corroborates Fig. 3c, where 84 % of the dams are small dams with a hydropower capacity of 50 MW and below. Some of the dams of lower stream order are in Vietnam and China, but most are irrigation dams in the Nam Mun sub-basin of Thailand – the largest tributary to the Mekong based on area and the site of the largest irrigation scheme in the basin (Cochrane et al., 2014; MRC, 2023). Dams of high stream order are mainly in China and Laos, as China has the most mainstream dams, while Laos has a significant number of both mainstream and major tributary dams. Few dams are of the highest stream order (8) and are only located along the LMB mainstream in Laos and Cambodia. Comparing the nested catchment area of each dam to the total area of the Mekong Basin, the derived ratios reflect the relative position of each dam in the basin, where dams with larger ratios are of a higher stream order and likely located further downstream (Fig. 7b). Dams with the highest ratios are along the mainstream, identified by the same colors in Fig. 7b and c. The 11 dams in the LMB mainstream cascade have the ratios 0.28–0.81, with the ratio increasing downstream from Pak Beng in Laos to Sambor in Cambodia. The next group with high ratios (0.05–0.18) are the 23 dams in the UMB mainstream cascade in China, where the planned dams upstream have lower ratios. Similar to how most dams have a low stream order (Fig. 7a), most of the dams have a low ratio, especially in Thailand and Vietnam.
This prevalence of tributary dams was first driven by energy needs and public funding (Hirsch, 2010). Thailand's electricity demands surged in the 1990s, while Laos endeavored to profit from selling its natural resources, spurring the development of tributary dams in Laos. Many of the dam projects were financed by public institutions like the Asian Development Bank, and the electricity produced was imported by Thailand. The situation likely served as a trigger, encouraging the spread of tributary dams across the basin. Nevertheless, with a continued growth in regional energy demands, the construction of the mainstream dam cascade in China, and a shift towards investment from private and Chinese institutions, there is now a renewed focus on building mainstream dams in the LMB (Grumbine et al., 2012; Pearse-Smith, 2012; Urban et al., 2013). Mainstream dams are usually perceived as having more devastating environmental and socioeconomic repercussions across the region, causing river fragmentation and threatening the species richness found at a higher stream order, in turn jeopardizing the agricultural and fishing industry dependent on the mainstream (Grill et al., 2014; Reyes-Gavilán et al., 1996). However, some suggest that tributary dams are also highly damaging, blocking alternative habitats crucial for fish migration, reproduction, and biodiversity – 169 out of 245 fish species decreased in population or disappeared upstream of the tributary Pak Mun Dam in Thailand (Amornsakchai et al., 2000; Tang et al., 2021). Small tributaries include headwater streams that make up 60 % to 80 % of the basin, and damming them could diminish important water and nutrient supplies from headwaters (MacDonald and Coe, 2007). These implications could be amplified through the cumulative effect of the widespread tributary dams (Sun et al., 2023; Ziv et al., 2012).
Similarly, such discussions exist when comparing the impacts of upstream and downstream dams. Concerns have traditionally focused on the transboundary effect of upstream dams on lower riparian countries. For example, upstream dams modify the volume and seasonality of discharge downstream, which reduces natural floods that give fish access to floodplain habitats and replenish floodplains with nutrients for agriculture (Biba, 2012; Grill et al., 2019; Poff and Hart, 2002). By trapping sediments, upstream dams can also cause far-reaching hydrological alterations like channel incision, bank retreat, and riverbed coarsening (Li et al., 2021). However, dams of the LMB cascade in Laos and Cambodia regulate the largest upstream area, as they are located on the Mekong mainstem of Strahler stream order 8 (Fig. 7). These dams could together contribute to the capture of up to 96 % of river sediments before they can be deposited at the delta (Kondolf et al., 2014). The decrease in sediment supply could lead to the shrinking of the Mekong Delta, threatening agricultural production and livelihoods (Li et al., 2017). Perhaps there is a tradeoff no matter where the dam is along the river network, and ultimately the scale of a dam's impact is dependent not only on its location, but also on other factors like how it is operated, whether mitigation efforts like fish ladders are in place, and its proximity to critical river junctions (Gao et al., 2022; Grill et al., 2014; Wang et al., 2014).
4.5 Implications: hydrology, ecology, and dam management
Our free-access database strives to improve both the number of dams identified and the quality of dam attributes recorded in the Mekong. With an extensive record of 1055 dams and detailed attributes including the nested catchment area and rainfall provided, the database can facilitate further research on the hydrology of the basin, such as quantifying the impact of dams on sediment loss, river fragmentation, downstream channel incision, and delta erosion (Grill et al., 2014; Li et al., 2021). These hydrological factors impact the livelihoods of people in the region, such as the rice-based farmers in the Vietnam Delta (Kang et al., 2021; Yoshida et al., 2020). Through our spatiotemporal analysis of dams, including planned dams post-2020s, the impacts on hydrology and local communities could be projected into the future to inform decisions made regarding sustainable dam planning, construction, and operation. The dam database can also be used in the hydrological modeling of river discharge and water level, taking into account the modification of discharge volume and seasonality by dams (Dang et al., 2022; Kondolf et al., 2014; Shin et al., 2020). This could aid in the prediction of extreme events and the adoption of mitigation approaches against droughts and floods (Le et al., 2007; Wang et al., 2017).
Hydrological impacts are closely tied to the ecological impacts of dams. River fragmentation disrupts migratory pathways for fish species and isolates populations, reducing breeding, gene flow, and biodiversity (Tang et al., 2021). Modified discharge seasonality and downstream river-bed incision alter the feeding patterns of aquatic species and limit river–floodplain connectivity, separating fishes in the main channel from floodplain habitats (Ang et al., 2022; Barbarossa et al., 2020; Poff and Hart, 2002). Our comprehensive dam database contributes to further understanding of the impacts of damming on the basin-wide river connectivity (upstream and downstream and between the river and floodplain), especially with the inclusion of smaller tributary dams, which are less represented in global dam databases (Grill et al., 2019; Sun et al., 2023). This could assist in fish monitoring, conservation, and mitigation measures like fish ladders and barrier removal, not only for regional ecology, but also to safeguard food security and the livelihoods of locals in the world's largest inland fishing industry (Dugan et al., 2010).
Besides facilitating research on dam impacts, this paper contributes to water resource and dam management in the basin by identifying vulnerable dam hotspots for targeted management. Through our spatiotemporal analysis of projected dam growth and hydropower potential assessment, Laos is likely the most vulnerable to future dam development. Thailand has the most operational (irrigation) dams and China has the highest hydropower capacity, and many discussions focus on the impact of upstream dams in China on the lower riparian states (Biba, 2012; Zawahri and Hensengerth, 2012). However, Laos has the most planned dams and the largest expected growth in capacity. With high hydropower potential, even more dams could be commissioned in Laos (Pholsena and Phonekeo, 2004). Compared to the 16 % of the Mekong River flow originating from China, Laos makes up 25 % of the total basin area and 35 % of the river flow, and thus intensive dam construction in Laos could devastate regional hydrology and ecology (Baird, 2007; MRC, 2011). With the highest projected dam growth in Laos and the environmental importance of Laos in the Mekong Basin, we suggest focusing planning and management in Laos, such as stricter protocols enforcing environmental impact assessments and proper resettlement of affected locals prior to construction, in order to harness the advantages of dams while protecting ecosystems and native communities (Barbarossa et al., 2020; Yoshida et al., 2020). Regionally, our spatiotemporal assessment could shed light on the complex power trade driven by high energy demands (Galelli et al., 2022; Soukhaphon et al., 2021). The electricity market involves partnerships between governments and companies, hydropower exports for national revenue, and cross-border investments in dam construction, while downstream countries are subjected to the impacts of upstream dams, entangling the countries in a mix of shared interests and water conflicts (Binh et al., 2020; Cronin, 2009). The Mekong is a characteristic example of a complex transboundary basin, where understanding of the electricity trade, water politics, and dam patterns could be applied to other large river basins worldwide.
The dam database of the Mekong Basin is available to the public at https://doi.org/10.21979/N9/ACZIJN (Ang et al., 2023), including one file of the dam database and five files for the spatiotemporal analysis, with each file corresponding to the dams in each decade from the 1980s to post-2020s. All the files are in comma-separated value (CSV) format. The dam attributes are detailed in Table 2.
This study presents (1) a comprehensive free-access database of 1055 dams in the Mekong, (2) a spatiotemporal analysis of the dams over sub-basins and countries by decade from the 1980s to post-2020s, and (3) a grid-based theoretical hydropower potential of the basin. We extracted unique dam records from six global, five regional, and seven local databases, visually validated using Google Earth. The dam records and attributes are supplemented with online information (e.g., reports, papers, or articles) and a GIS analysis of hydrological characteristics (e.g., catchment area, stream order, or rainfall). The final dam count of 1055 is more than twice that of the largest existing database, of which 661 are operational, 54 under construction, 331 planned, 2 closed, and 7 canceled. With 608 hydropower dams, hydropower capacity surged from 1242 MW in the 1980s to 33 914 MW in the 2010s and is expected to double to 69 199 MW post-2020s. Although capacity expanded by 16 854 MW in China from the 2000s to the 2010s, Laos has the most planned dams and is projected to have the highest growth of 18 223 MW post-2020s. Using present-day discharge from the CaMa-Flood model (2011–2015, 0.05°), we estimate a basin-wide hydropower potential of 1 334 683 MW, of which 514 887 MW lies in Laos. Using discharge from the ISIMIP2b WaterGAP2 model (2021–2040, 0.5°) based on four Representative Concentration Pathways (RCPs 2.6, 4.5, 6.0, and 8.5), future hydropower potential could grow to over 2 000 000 MW with climate change, where Laos and China are the highest at around 900 000 MW each. China's hydropower potential largely stems from high elevations and steep river slopes, while Laos has high discharge along the lower mainstream and a relatively high elevation and slope in the Mekong Highlands. Considering the large projected hydropower capacity and potential of Laos, it will likely become the country most vulnerable to dam construction, highlighting the need for better dam planning and mitigation measures in Laos. Our unified database aids in research on the implications of dams for the hydrology, ecology, and people in the region and contributes to sustainable water resource and dam management in the basin. The spatiotemporal analysis potentially furthers understanding of the dam patterns, electricity trade, and water politics in the Mekong, which could be applied to other transboundary basins fragmented by human water infrastructure.
WJA: data curation, formal analysis, investigation, methodology, visualization, writing – original draft, writing – review and editing. EP: conceptualization, data curation, funding acquisition, methodology, project administration, resources, supervision, writing – original draft, writing – review and editing. YP: data curation, resources, writing – review and editing. DDT: writing – review and editing. HHL: writing – review and editing.
The contact author has declared that none of the authors has any competing interests.
Publisher's note: Copernicus Publications remains neutral with regard to jurisdictional claims made in the text, published maps, institutional affiliations, or any other geographical representation in this paper. While Copernicus Publications makes every effort to include appropriate place names, the final responsibility lies with the authors.
Any opinion, finding, and conclusions or recommendations expressed in this research are those of the authors and do not reflect the views of the Ministry of Education, Singapore. This work is part of the Final Year Project of Wei Jing Ang under the supervision of Edward Park.
This research was supported by various grants from the Ministry of Education, Singapore, under its Academic Research Tier1 (RG142/22), Tier1 (2021-T1-001-056), Tier2 (MOE-T2EP402A20-0001), Tier2 (MOE-T2EP50222-0007), NIE AcRF (RI 10/22 EP), and the Earth Observatory of Singapore (EOS) via its funding from the National Research Foundation Singapore and the Singapore Ministry of Education under the Research Centres of Excellence initiative. This work comprises EOS contribution number 581. Yadu Pokhrel was funded by the National Science Foundation (award no. 1752729).
This paper was edited by Yuanzhi Yao and reviewed by Polina Lemenkova and one anonymous referee.
Amornsakchai, S., Annez, P., Vongvisessomjai, S., Choowaew, S., Thailand Development Research Institute (TDRI), Kunurat, P., Nippanon, J., Schouten, R., Sripapatrprasite, P., Vaddhanaphuti, C., Vidthayanon, C., Wirojanagud, W., and Watana, E.: Pak Mun Dam, Mekong River Basin, Thailand, A WCD Case Study prepared as an input to the World Commission on Dams, Cape Town, https://www.mrcmekong.org/assets/Publications/Council-Study/Amornsakchai-etal-2001-Case-Study-PakMunDam-MRB-Thailand.pdf (last access: 24 September 2023), 2000.
Ang, W. J., Park, E., and Yang, X.: Geomorphic control on stage-area hysteresis in three of the largest floodplain lakes, J. Hydrol., 614, 128574, https://doi.org/10.1016/j.jhydrol.2022.128574, 2022.
Ang, W. J., Park, E., Pokhrel, Y., Tran D. D., and Loc, H. H.: Replication Data for: Dams in the Mekong: A comprehensive database, spatiotemporal distribution, and hydropower potentials, DR-NTU [data set], https://doi.org/10.21979/N9/ACZIJN, 2023.
Baird, I. G.: Local Ecological Knowledge and Small-scale Freshwater Fisheries Management in the Mekong River in Southern Laos, in: Fishers' Knowledge in Fisheries Science and Management, edited by: Haggan, N., Neis, B., and Baird, I. G., UNESCO, 247–266, https://www.researchgate.net/publication/228734632_Local_ecological_knowledge_and_small-scale_freshwater_fisheries_management_in_the_Mekong_River_in_Southern_Laos (last access: 1 March 2024) 2007.
Barbarossa, V., Schmitt, R. J. P., Huijbregts, M. A. J., Zarfl, C., King, H., and Schipper, A. M.: Impacts of current and future large dams on the geographic range connectivity of freshwater fish worldwide, P. Natl. Acad. Sci. USA, 117, 3648–3655, https://doi.org/10.1073/pnas.1912776117, 2020.
Biba, S.: China's Continuous Dam-building on the Mekong River, J. Contemp. Asia, 42, 603–628, https://doi.org/10.1080/00472336.2012.712257, 2012.
Binh, D. V., Kantoush, S. A., Saber, M., Mai, N. P., Maskey, S., Phong, D. T., and Sumi, T.: Long-term alterations of flow regimes of the Mekong River and adaptation strategies for the Vietnamese Mekong Delta, J. Hydrol. Reg. Stud., 32, 100742, https://doi.org/10.1016/j.ejrh.2020.100742, 2020.
Chen, H. and Boutros, P. C.: VennDiagram: A package for the generation of highly-customizable Venn and Euler diagrams in R, BMC Bioinformatics, 12, 35, https://doi.org/10.1186/1471-2105-12-35, 2011.
CHIRPS: CHIRPS: Rainfall Estimates from Rain Gauge and Satellite Observations, https://www.chc.ucsb.edu/data/chirps (last access: 28 December 2023).
Cho, M. S. and Qi, J.: Quantifying spatiotemporal impacts of hydro-dams on land use/land cover changes in the Lower Mekong River Basin, Appl. Geogr., 136, 102588, https://doi.org/10.1016/j.apgeog.2021.102588, 2021.
Chowdhury, A. F. M. K., Dang, T. D., Bagchi, A., and Galelli, S.: Expected Benefits of Laos' Hydropower Development Curbed by Hydroclimatic Variability and Limited Transmission Capacity: Opportunities to Reform, J. Water Res. Plan. Man., 146, 05020019, https://doi.org/10.1061/(ASCE)WR.1943-5452.0001279, 2020.
Cochrane, T. A., Arias, M. E., and Piman, T.: Historical impact of water infrastructure on water levels of the Mekong River and the Tonle Sap system, Hydrol. Earth Syst. Sci., 18, 4529–4541, https://doi.org/10.5194/hess-18-4529-2014, 2014.
Cooley, H., Christian-Smith, J., Gleick, P., Allen, L., and Cohen, M.: Understanding and Reducing the Risks of Climate Change for Transboundary Waters, Pacific Institute, https://pacinst.org/wp-content/uploads/2009/12/transboundary_water_and_climate_report3.pdf (last access: 1 March 2024), 2009.
Cronin, R.: Mekong Dams and the Perils of Peace, Survival, 51, 147–160, https://doi.org/10.1080/00396330903461716, 2009.
Cuya, D. G. P., Brandimarte, L., Popescu, I., Alterach, J., and Peviani, M.: A GIS-based assessment of maximum potential hydropower production in La Plata basin under global changes, Renew. Energ., 50, 103–114, https://doi.org/10.1016/j.renene.2012.06.019, 2013.
Dang, H., Pokhrel, Y., Shin, S., Stelly, J., Ahlquist, D., and Du Bui, D.: Hydrologic balance and inundation dynamics of Southeast Asia's largest inland lake altered by hydropower dams in the Mekong River basin, Sci. Total Environ., 831, 154833, https://doi.org/10.1016/j.scitotenv.2022.15483, 2022.
Dugan, P. J., Barlow, C., Agostinho, A. A., Baran, E., Cada, G. F., Chen, D., Cowx, I. G., Ferguson, J. W., Jutagate, T., Mallen-Cooper, M., Marmulla, G., Nestler, J., Petrere, M., Welcomme, R. L., and Winemiller, K. O.: Fish Migration, Dams, and Loss of Ecosystem Services in the Mekong Basin, Ambio, 39, 344–348, https://doi.org/10.1007/s13280-010-0036-1, 2010.
EDL-Generation Public Company: Nam Mang 3 Hydro Power Plant, https://edlgen.com.la/project/nam-mang3-hpp/?lang=en (last access: 19 December 2023).
Energy Market Authority: Singapore commences first renewable energy electricity import via regional multilateral power trade [Press Release], https://www.ema.gov.sg/content/dam/corporate/news/media-releases/2022/20220623_MediaRelease_Singapore-commences-first-renewable-energy-electricity-imports-100MW.pdf.coredownload.pdf (last access: 29 January 2023), 2022.
Ezell, S.: 4 Dams on the Upper Mekong in Yunnan, China: 2011–2019, The Diplomat, https://thediplomat.com/2021/05/4-dams-on-the-upper-mekong-in-yunnan-china-2011-2019/ (last access: 11 October 2023), 2021.
FAO: AQUASTAT – FAO's Global Information System on Water and Agriculture, https://www.fao.org/aquastat/en/databases/dams (last access: 29 January 2023), 2015.
Galelli, S., Dang, T. D., Ng, J. Y., Chowdhury, A. F. M. K., and Arias, M. E.: Opportunities to curb hydrological alterations via dam re-operation in the Mekong, Nat. Sustain., 5, 1058–1069, https://doi.org/10.1038/s41893-022-00971-z, 2022.
Gao, Y., Sarker, S., Sarker, T., and Leta, O. T.: Analyzing the critical locations in response of constructed and planned dams on the Mekong River Basin for environmental integrity, Environ. Res. Commun., 4, 101001, https://doi.org/10.1088/2515-7620/ac9459, 2022.
Gosling, S. N., Schmied, H. M., Burek, P., Chang, J., Ciais, P., Döll, P., Eisner, S., Fink, G., Flörke, M., Franssen, W., Grillakis, M., Hagemann, S., Hanasaki, N., Koutroulis, A., Leng, G., Liu, X., Masaki, Y., Mathison, C., Mishra, V., Ostberg, S., Portmann, F., Qi, W., Sahu, R., Satoh, Y., Schewe, J., Seneviratne, S., Shah, H. L., Stacke, T., Tao, F., Telteu, C., Thiery, W., Trautmann, T., Tsanis, I., Wanders, N., Zhai, R., Büchner, M., Schewe, J., and Zhao, F.: ISIMIP2b Simulation Data from the Global Water Sector (v1.0), ISIMIP Repository [data set], https://doi.org/10.48364/ISIMIP.626689, 2023.
Grill, G., Ouellet Dallaire, C., Fluet Chouinard, E., Sindorf, N., and Lehner, B.: Development of new indicators to evaluate river fragmentation and flow regulation at large scales: A case study for the Mekong River Basin, Ecol. Indic., 45, 148–159, https://doi.org/10.1016/j.ecolind.2014.03.026, 2014.
Grill, G., Lehner, B., Thieme, M., Geenen, B., Tickner, D., Antonelli, F., Babu, S., Borrelli, P., Cheng, L., Crochetiere, H., Ehalt Macedo, H., Filgueiras, R., Goichot, M., Higgins, J., Hogan, Z., Lip, B., McClain, M. E., Meng, J., Mulligan, M., Nilsson, C., Olden, J. D., Opperman, J. J., Petry, P., Reidy Liermann, C., Sáenz, L., Salinas-Rodríguez, S., Schelle, P., Schmitt, R. J. P., Snider, J., Tan, F., Tockner, K., Valdujo, P. H., van Soesbergen, A., and Zarfl, C.: Mapping the world's free-flowing Rivers, Nature, 569, 215–221, https://doi.org/10.1038/s41586-019-1111-9, 2019.
Grumbine, R. E., Dore, J., and Xu, J.: Mekong hydropower: Drivers of change and governance challenges, Front. Ecol. Environ., 10, 91–98, https://doi.org/10.1890/110146, 2012.
Grünwald, R., Wang, W., and Feng, Y.: Politicization of the hydropower dams in the Lancang-Mekong Basin: A review of contemporary environmental challenges, Energies, 15, 1682, https://doi.org/10.3390/en15051682, 2022.
Gudmundsson, L., Boulange, J., Do, H. X., Gosling, S. N., Grillakis, M. G., Koutroulis, A. G., Leonard, M., Liu, J., Schmied, H. M., Papadimitriou, L., Pokhrel, Y., Seneviratne, S. I., Satoh, Y., Thiery, W., Westra, S., Zhang, X., and Zhao, F.: Globally observed trends in mean and extreme river flow attributed to climate change, Science, 371, 1159–1162, https://doi.org/10.1126/science.aba3996, 2021.
Hanna, J. W., Kim, M. S., Ramsey, A. C., Omdal, D. W., Mulvey, R. L., Goodrich, B. A., Ferguson, B. A., Bronson, J. J., Goheen, E. M., Chadwick, K. L., Kearns, H. S. J., Lockman, I. B., LaBarge, A. K. B., Stewart, J. E., Maffei, H. M., Oblinger, B. W., Smith, A. L., Ross-Davis, A. L., Shaw, D. C., LeBoldus, J. M., Bennett, P. I., Alveshere, B. C., Ashiglar, S. M., McDonald, G. I., Pitman, E. W. I., Donley, J. B., Bright, B. C., Warwell, M. V., and Klopfenstein, N. B.: Maximum entropy-based bioclimatic models predict areas of current and future suitable habitat for Armillaria species in western Oregon and western Washington, in: 66th Annual Western International Forest Disease Work Conference, Estes Park, 3–7 June 2019, 161–170, https://www.fs.usda.gov/research/treesearch/61283 (last access: 2 March 2024), 2019.
Hecht, J. S., Lacombe, G., Arias, M. E., Dang, T. D., and Piman, T.: Hydropower dams of the Mekong River basin: A review of their hydrological impacts, J. Hydrol., 568, 285–300, https://doi.org/10.1016/j.jhydrol.2018.10.045, 2019.
Hempel, S., Frieler, K., Warszawski, L., Schewe, J., and Piontek, F.: A trend-preserving bias correction – the ISI-MIP approach, Earth Syst. Dynam., 4, 219–236, https://doi.org/10.5194/esd-4-219-2013, 2013.
Hirsch, P.: The Changing Political Dynamics of Dam Building on the Mekong, Water Altern., 3, 312–323, 2010.
Hirsch, P.: The shifting regional geopolitics of Mekong dams, Polit. Geogr., 51, 63–74, https://doi.org/10.1016/j.polgeo.2015.12.004, 2016.
Hobo Maps: Home Page, https://hobomaps.com/ (last access: 18 July 2023).
HydroSHEDS: Data Products, https://www.hydrosheds.org/products (last access: 30 January 2023).
IPCC: Climate Change 2014: Synthesis Report, Contribution of Working Groups I, II and III to the Fifth Assessment Report of the Intergovernmental Panel on Climate Change [Core Writing Team, Pachauri, R. K. and Meyer, L. A. (Eds.)], IPCC, Geneva, Switzerland, 151 pp., 2014.
IR: Lancang River Dams: Threatening the Flow of the Lower Mekong, https://archive.internationalrivers.org/sites/default/files/attached-files/ir_lacang_dams_2013_5.pdf (last access: 17 February 2023), 2013.
IR: Spreadsheet of Major Dams in China, https://archive.internationalrivers.org/resources/spreadsheet-of-major-dams-in-china-7743 (last access: 29 January 2023), 2014.
IR: Pak Beng Dam, https://archive.internationalrivers.org/node/10852 (last access: 29 January 2023).
IRENA: Renewable Power Generation Costs in 2021, International Renewable Energy Agency, Abu Dhabi, https://www.irena.org/publications/2022/Jul/Renewable-Power-Generation-Costs-in-2021 (last access: 27 March 2023), 2022.
Kang, H., Sridhar, V., Mainuddin, M., and Trung, L. D.: Future rice farming threatened by drought in the Lower Mekong Basin, Sci. Rep.-UK, 11, 9383, https://doi.org/10.1038/s41598-021-88405-2, 2021.
Kummu, M. and Varis, O.: Sediment-related impacts due to upstream reservoir trapping, the Lower Mekong River, Geomorphology, 85, 275–293, https://doi.org/10.1016/j.geomorph.2006.03.024, 2007.
Kondolf, G. M., Rubin, Z. K., and Minear, J. T.: Dams on the Mekong: Cumulative sediment starvation, Water Resour. Res., 50, 5158–5169, https://doi.org/10.1002/2013WR014651, 2014.
Larsson, J.: eulerr: Area-Proportional Euler and Venn Diagrams with Ellipses, CRAN [code], https://CRAN.R-project.org/package=eulerr (last access: 1 March 2024), 2023.
Larsson, J. and Gustafsson, P.: A Case Study in Fitting Area-Proportional Euler Diagrams with Ellipses using eulerr, in: Proceedings of International Workshop on Set Visualization and Reasoning, Edinburgh, United Kingdom, 18 June 2018, 2116, 84–91, 2018.
Le, T. V. H., Nguyen, H. N., Wolanski, E., Tran, T. C., and Haruyama, S.: The combined impact on the flooding in Vietnam's Mekong River delta of local man-made structures, sea level rise, and dams upstream in the river catchment, Estuar. Coast. Shelf S., 71, 110–116, https://doi.org/10.1016/j.ecss.2006.08.021, 2007.
Lebel, L., Dore, J., Daniel, R., and Koma, Y. S.: Democratizing water governance in the Mekong Region, Mekong Press, http://www.mpowernetwork.org/Knowledge_Bank/Our_Books/PDF/Water_Governance.pdf (last access: 4 April 2023), 2007.
Lehner, B., Czisch, G., and Vassolo, S.: The impact of global change on the hydropower potential of Europe: A model- based analysis, Energ. Policy, 33, 839–855, https://doi.org/10.1016/j.enpol.2003.10.018, 2005.
Lehner, B., Liermann, C. R., Revenga, C., Vörösmarty, C., Fekete, B., Crouzet, P., Döll, P., Endejan, M., Frenken, K., Magome, J., Nilsson, C., Robertson, J. C., Rödel, R., Sindorf, N., and Wisser, D.: High-resolution mapping of the world's reservoirs and dams for sustainable river-flow management, Front. Ecol. Environ., 9, 494–502, https://doi.org/10.1890/100125, 2011.
Leinenkugel, P., Kuenzer, C., Oppelt, N., and Dech, S.: Characterisation of land surface phenology and land cover based on moderate resolution satellite data in cloud prone areas—A novel product for the Mekong Basin, Remote Sens. Environ., 136, 180–198, https://doi.org/10.1016/j.rse.2013.05.004, 2013.
Li, J., Xia, J., and Ji, Q.: Rapid and long-distance channel incision in the Lower Yellow River owing to upstream damming, Catena, 196, 104943, https://doi.org/10.1016/j.catena.2020.104943, 2021.
Lu, X., Kummu, M., and Oeurng, C.: Reappraisal of sediment dynamics in the Lower Mekong River, Cambodia, Earth Surf. Proc. Land., 39, 1855–1865, https://doi.org/10.1002/esp.3573, 2014.
Li, X., Liu, J. P., Saito, Y., and Nguyen, V. L.: Recent evolution of the Mekong Delta and the impacts of dams, Earth-Sci. Rev., 175, 1–17, https://doi.org/10.1016/j.earscirev.2017.10.008, 2017.
MacDonald, L. H. and Coe, D.: Influence of headwater streams on downstream reaches in forested areas, Forest Sci., 53, 148–168, https://www.nrel.colostate.edu/assets/nrel_files/labs/macdonald-lab/pubs/MacDonald_Coe_Forest_Science.pdf (last access: 25 January 2024), 2007.
Matthews, N.: Water Grabbing in the Mekong Basin-An Analysis of the Winners and Losers of Thailand's Hydropower Development in Lao PDR, Water Altern., 5, 392–411, 2012.
Meijer, L. J. J., van der Ent, R. J., Hoes, A. C., Mondeel, H., Pramana, K. E. R., and van de Giesen, N. C.: World hydropower capacity evaluation, Netherlands, http://resolver.tudelft.nl/uuid:49d8d013-9a48-4222-85a1-0ebb53f83dc8 (last access: 26 March 2023), 2012.
MIT: Stimson Mekong Infrastructure Tracker, https://www.stimson.org/project/mekong-infrastructure/ (last access: 29 January 2023), 2021.
MRC: Assessment of Basin-Wide Development Scenarios (Main Report), https://www.mrcmekong.org/resource/ajhykw (last access: 24 January 2023), 2011.
MRC: Briefing Notes Package 6th RTWG Meeting, https://www.mrcmekong.org/assets/Publications/Council-Study/6th-RTWG-Briefing-Notes-Package.pdf (last access: 18 September 2023), 2015.
MRC: Consultancy to assist the Hydropower Thematic in Council Study Development Scenarios, https://www.mrcmekong.org/assets/Publications/Council-Study/018-Hydropower-Development-Scenarios.pdf (last access: 21 December 2023), 2016.
MRC: Mekong Basin, https://www.mrcmekong.org/about/mekong-basin/ (last access: 23 September 2023).
Mulligan, M., van Soesbergen, A., and Sáenz, L.: GOODD, a global dataset of more than 38,000 georeferenced dams, Sci. Data, 7, 31, https://doi.org/10.1038/s41597-020-0362-5, 2020.
Observatory of Economic Complexity: Electricity in Laos, OEC – The Observatory of Economic Complexity, https://oec.world/en/profile/bilateral-product/electricity/reporter/lao (last access: 29 January 2023).
ODM: Greater Mekong Subregion hydropower dams, https://data.opendevelopmentmekong.net/en/dataset/greater-mekong-subregion-hydropower-dams (last access: 22 November 2022), 2014.
ODM: National grid, import of energy, consumption of energy, hydro-electric dams, https://data.opendevelopmentmekong.net/en/dataset/national-grid-import-of-energy-consumption-of-energy-hydro-electric-dams (last access: 22 November 2022), 2015.
ODM: Greater Mekong Subregion hydropower dams (2016), https://data.opendevelopmentmekong.net/en/dataset/greater-mekong-subregion-hydropower-dams-2016 (last access: 22 November 2022), 2016a.
ODM: Hydropower dam (1993–2020), https://data.opendevelopmentmekong.net/en/dataset/hydropower-2009-2014 (last access: 22 November 2022), 2016b.
ODM: Hydropower Dams in Myanmar 2017, https://data.opendevelopmentmekong.net/en/dataset/hydropower-dam-in-myanmar-2017 (last access: 22 November 2022), 2017a.
ODM: Hydropower 2017, ICEM (International Centre for Environmental Management) Prod2, https://data.opendevelopmentmekong.net/en/dataset/hydropower-2017-icem-international-centre-for-environmental-management-prod2 (last access: 22 November 2022), 2017b.
ODM: Myanmar Dams, https://data.opendevelopmentmekong.net/dataset/myanmar-dams (last access: 22 November 2022), 2018.
ODM: Mekong Regional Hydropower Dams 2020, https://data.opendevelopmentmekong.net/dataset/mekong-regional-hydropower-dams-2020 (last access: 22 November 2022), 2020a.
ODM: Hydropower Dams in Thailand, https://data.opendevelopmentmekong.net/en/dataset/hydropower-dams-in-thailand (last access: 22 November 2022), 2020b.
ODM: Laos to export 20,000 MW of electricity by 2030, https://opendevelopmentmekong.net/news/laos-to-export-20000-mw-of-electricity-by-2030/ (last access: 29 January 2023), 2020c.
ODM: Hydropower dams on primary rivers in the Mekong basin in 2022, https://data.opendevelopmentmekong.net/en/dataset/hydropower-dams-in-the-mekong-region-in-2022, last access: 22 November 2022.
ODM: Open Development Mekong Datahub, https://data.opendevelopmentmekong.net/dataset, last access: 29 January 2023.
Park, E., Loc, H. H., Van Binh, D., and Kantoush, S.: The worst 2020 saline water intrusion disaster of the past century in the Mekong Delta: Impacts, causes, and management implications, Ambio, 51, 691–699, https://doi.org/10.1007/s13280-021-01577-z, 2022.
Pearse-Smith, S. W. D.: The Impact of Continued Mekong Basin Hydropower Development on Local Livelihoods, Consilience, 7, 73–86, https://www.jstor.org/stable/26167837 (last access: 7 April 2023), 2012.
Pholsena, S. and Phonekeo, D. D.: Lao hydropower potential and policy in the GMS context, United Nations Symposium on Hydropower and Sustainable Development, Beijing International Convention Centre, 1–7, https://www.un.org/esa/sustdev/sdissues/energy/op/hydro_phonekeoLaoPDR.pdf (last access: 2 March 2024), 27 October 2004.
Poff, N. L. and Hart, D. D.: How dams vary and why it matters for the emerging science of dam removal: an ecological classification of dams is needed to characterize how the tremendous variation in the size, operational mode, age, and number of dams in a river basin influences the potential for restoring regulated rivers via dam removal, BioScience, 52, 659–668, https://doi.org/10.1641/0006-3568(2002)052[0659:HDVAWI]2.0.CO;2, 2002..
Poindexter, G.: 86-MW Nam Phay hydropower project in Lao PDR officially commissioned, Hydro Review, https://www.hydroreview.com/world-regions/86-mw-nam-phay-hydropower-project-in-laos-officially-commissioned/ (last access: 15 February 2023), 2018.
Pokhrel, Y. N., Oki, T., and Kanae, S.: A Grid Based Assessment of Global Theoretical Hydropower Potential, Prooceedings of Hydraulic Engineering, 52, 7–12, https://doi.org/10.2208/prohe.52.7, 2008.
Pokhrel, Y. N., Felfelani, F., Shin, S., Yamada, T. J., and Satoh, Y.: Modeling large-scale human alteration of land surface hydrology and climate, Geosci. Lett., 4, 1–13, https://doi.org/10.1186/s40562-017-0076-5, 2017.
Pokhrel, Y., Felfelani, F., Satoh, Y., Boulange, J., Burek, P., Gädeke, A., Gosling, S. N., Grillakis, M., Gudmundsson, L., Hanasaki, N., Kim, H., Koutroulis, A., Liu, J., Papadimitriou, L., Schewe, J., Schmied, H. M., Stacke, T., Telteu, C., Thiery, W., Veldkamp, T., Zhao, F., and Wada, Y.: Global terrestrial water storage and drought severity under climate change, Nat. Clim. Change, 11, 226–233, https://doi.org/10.1038/s41558-020-00972-w, 2021.
Power Technology: Home, https://www.power-technology.com/ (last access: 19 December 2023).
Reyes-Gavilán, F. G., Garrido, R., Nicieza, A. G., Toledo, M. M., and Brana, F.: Fish community variation along physical gradients in short streams of northern Spain and the disruptive effect of dams, Hydrobiologia, 321, 155–163, https://doi.org/10.1007/BF00023171, 1996.
Rossi, C. G., Srinivasan, R., Jirayoot, K., Le Duc, T., Souvannabouth, P., Binh, N., and Gassman, P. W.: Hydrologic evaluation of the Lower Mekong River Basin with the soil and water assessment tool model, Int. Agric. Eng. J., 18, 1–13, https://handle.nal.usda.gov/10113/48579 (last access: 20 March 2023), 2009.
Schmitt, R. J. P., Bizzi, S., Castelletti, A., and Kondolf, G. M.: Improved trade-offs of hydropower and sand connectivity by strategic dam planning in the Mekong, Nat. Sustain., 1, 96–104, https://doi.org/10.1038/s41893-018-0022-3, 2018.
Shin, S., Pokhrel, Y., Yamazaki, D., Huang, X., Torbick, N., Qi, J., Pattanakiat, S., Ngo-Duc, T., and Nguyen, T. D.: High resolution modeling of river- floodplain-reservoir inundation dynamics in the Mekong River Basin, Water Resour. Res., 56, e2019WR026449, https://doi.org/10.1029/2019WR026449, 2020.
Soukhaphon, A., Baird, I. G., and Hogan, Z. S.: The Impacts of Hydropower Dams in the Mekong River Basin: A Review, Water, 13, 265, https://doi.org/10.3390/w13030265, 2021.
Souter, N. J., Shaad, K., Vollmer, D., Regan, H. M., Farrell, T. A., Arnaiz, M., Meynell, P.-J., Cochrane, T. A., Arias, M. E., Piman, T., and Andelman, S. J.: Using the Freshwater Health Index to Assess Hydropower Development Scenarios in the Sesan, Srepok and Sekong River Basin, Water, 12, 788, https://doi.org/10.3390/w12030788, 2020.
Speckhann, G. A., Kreibich, H., and Merz, B.: Inventory of dams in Germany, Earth Syst. Sci. Data, 13, 731–740, https://doi.org/10.5194/essd-13-731-2021, 2021.
Sun, J., Du, W., Lucas, M. C., Ding, C., Chen, J., Tao, J., and He, D.: River fragmentation and barrier impacts on fishes have been greatly underestimated in the upper Mekong River, J. Environ. Manage., 327, 116817, https://doi.org/10.1016/j.jenvman.2022.116817, 2023.
Tang, L., Mo, K., Zhang, J., Wang, J., Chen, Q., He, S., Zhu, C., and Lin, Y.: Removing tributary low-head dams can compensate for fish habitat losses in dammed rivers, J. Hydrol., 598, 126204, https://doi.org/10.1016/j.jhydrol.2021.126204, 2021.
Tefera, W. M. and Kasiviswanathan, K. S.: A global-scale hydropower potential assessment and feasibility evaluations, Water Resour. Econ., 38, 100198, https://doi.org/10.1016/j.wre.2022.100198, 2022.
The Anh, D., Van Tinh, T., and Ngoc Vang, N.: The Domestic Rice Value Chain in the Mekong Delta, in: White Gold: The Commercialisation of Rice Farming in the Lower Mekong Basin, edited by: Cramb, R., Springer Nature, 375–395, https://doi.org/10.1007/978-981-15-0998-8_18, 2020.
The World Bank: Small Hydro Resource Mapping in LAO PDR Inception Report (Project ID. 1239196), https://documents1.worldbank.org/curated/en/160621508232662247/pdf/120466-ESM-P163979-PUBLIC-LaoPDRHydropowerMappingInceptionReportWBESMAPJuly.pdf (last access: 19 December 2023), 2017.
Tiwari, A. D., Pokhrel, Y., Kramer, D., Akhter, T., Tang, Q., Liu, J., Qi, J., Loc, H. H., and Lakshmi, V.: A synthesis of hydroclimatic, ecological, and socioeconomic data for transdisciplinary research in the Mekong, Sci. Data, 10, 283, https://doi.org/10.1038/s41597-023-02193-0, 2023.
Tri, V. K.: Hydrology and Hydraulic Infrastructure Systems in the Mekong Delta, Vietnam, in: The Mekong Delta System: Interdisciplinary Analyses of a River Delta, edited by: Renaud, F. G. and Kuenzer, C., Springer Netherlands, 49–81, https://doi.org/10.1007/978-94-007-3962-8_3, 2012.
Urban, F., Nordensvärd, J., Khatri, D., and Wang, Y.: An analysis of China's investment in the hydropower sector in the Greater Mekong Sub-Region, Environ. Dev. Sustain., 15, 301–324, https://doi.org/10.1007/s10668-012-9415-z, 2013.
USGS: EarthExplorer, https://earthexplorer.usgs.gov/ (last access: 30 January 2023).
VietNamNet: Hydro-power dam broken in Central Highlands, https://vietnamnet.vn/en/hydro-power-dam-broken-in-central-highlands-E76563.html (last access: 11 October 2023), 2013.
VnExpress: Confessions of a hydropower calamity in Vietnam, https://e.vnexpress.net/projects/confessions-of-a-hydropower-calamity-in-vietnam-3655314/index.html (last access: 11 October 2023), 2017.
Wang, J., Walter, B. A., Yao, F., Song, C., Ding, M., Maroof, A. S., Zhu, J., Fan, C., McAlister, J. M., Sikder, S., Sheng, Y., Allen, G. H., Crétaux, J.-F., and Wada, Y.: GeoDAR: georeferenced global dams and reservoirs dataset for bridging attributes and geolocations, Earth Syst. Sci. Data, 14, 1869–1899, https://doi.org/10.5194/essd-14-1869-2022, 2022a.
Wang, J., Walter, B. A., Yao, F., Song, C., Ding, M., Maroof, A. S., Zhu, J., Fan, C., McAlister, J. M., Safat Sikder, M., Sheng, Y., Allen, G. H., Crétaux, J.-F., and Wada, Y.: GeoDAR: Georeferenced global Dams And Reservoirs dataset for bridging attributes and geolocations, In Earth System Science Data (v1.1; v1.0, Bd. 14, Nummer 4, S. 1869–1899), Zenodo [data set], https://doi.org/10.5281/zenodo.6163413, 2022b.
Wang, P., Dong, S., and Lassoie, J.: The Large Dam Dilemma: An Exploration of the Impacts of Hydro Projects on People and the Environment in China, Springer Netherlands, https://doi.org/10.1007/978-94-007-7630-2, 2014.
Wang, W., Lu, H., Ruby Leung, L., Li, H. Y., Zhao, J., Tian, F., Yang, K., and Sothea, K.: Dam construction in Lancang–Mekong River Basin could mitigate future flood risk from warming-induced intensified rainfall, Geophys. Res. Lett., 44, 10–378, https://doi.org/10.1002/2017GL075037, 2017.
Wang, X., Xiao, X., Qin, Y., Dong, J., Wu, J., and Li, B.: Improved maps of surface water bodies, large dams, reservoirs, and lakes in China, Earth Syst. Sci. Data, 14, 3757–3771, https://doi.org/10.5194/essd-14-3757-2022, 2022.
Xu, S., Chen, M., Feng, T., Zhan, L., Zhou, L., and Yu, G.: Use ggbreak to effectively utilize plotting space to deal with large datasets and outliers, Front. Genet., 12, 2122, https://doi.org/10.3389/fgene.2021.774846, 2021.
Xue, Z., Liu, J. P., DeMaster, D., Van Nguyen, L., and Ta, T. K. O.: Late Holocene Evolution of the Mekong Subaqueous Delta, Southern Vietnam, Mar. Geol., 269, 46–60, https://doi.org/10.1016/j.margeo.2009.12.005, 2010.
Yoshida, Y., Lee, H. S., Trung, B. H., Tran, H.-D., Lall, M. K., Kakar, K., and Xuan, T. D.: Impacts of Mainstream Hydropower Dams on Fisheries and Agriculture in Lower Mekong Basin, Sustainability, 12, 2408, https://doi.org/10.3390/su12062408, 2020.
Yuen, K. W., Park, E., Hazrina, M., Taufik, M., Santikayasa, P., Latrubesse, E., and Lee, J. S. H.: A Comprehensive Database of Indonesian Dams and Its Spatial Distribution, Remote Sens.-Basel, 15, 925, https://doi.org/10.3390/rs15040925, 2023.
Zarfl, C., Lumsdon, A. E., Berlekamp, J., Tydecks, L., and Tockner, K.: A global boom in hydropower dam construction, Aquat. Sci., 77, 161–170, https://doi.org/10.1007/s00027-014-0377-0, 2015.
Zawahri, N. A. and Hensengerth, O.: Domestic environmental activists and the governance of the Ganges and Mekong Rivers in India and China, Int. Environ. Agreem.-P., 12, 269–298, https://doi.org/10.1007/s10784-012-9179-9, 2012.
Zhou, Y., Hejazi, M., Smith, S., Edmonds, J., Li, H., Clarke, L., Calvin, K., and Thomson, A.: A comprehensive view of global potential for hydro-generated electricity, Energy Environ. Sci., 8, 2622–2633, https://doi.org/10.1039/C5EE00888C, 2015.
Ziv, G., Baran, E., Nam, S., Rodríguez-Iturbe, I., and Levin, S. A.: Trading-off fish biodiversity, food security, and hydropower in the Mekong River Basin, P. Natl. Acad. Sci. USA, 109, 5609–5614, https://doi.org/10.1073/pnas.1201423109, 2012.