the Creative Commons Attribution 4.0 License.
the Creative Commons Attribution 4.0 License.
 | 01 Mar 2023
Natural gas supply from Russia derived from daily pipeline flow data and potential solutions for filling a shortage of Russian supply in the European Union (EU)
Chuanlong Zhou
Biqing Zhu
Steven J. Davis
Antoine Halff
Simon Ben Arous
Hugo de Almeida Rodrigues
Philippe Ciais
Russia is the largest natural gas supplier to the European Union (EU). The invasion of Ukraine was followed by a cutoff of gas supplies from Russia to many EU countries, and the EU is planning to ban or drastically reduce its dependence on Russia. We provide a dataset of daily gas consumption in five sectors (household and public building heating, power, industry, and other sectors) with supply source shares in the EU27 (27 EU member countries) and UK from 2016 to 2022. The datasets are available at Zenodo platform: https://doi.org/10.5281/zenodo.7549233 (Zhou et al., 2022). The dataset separates the contributions of Russian imports, liquefied natural gas (LNG) imports, and other supply sources to both direct supply and storage supply for gas consumption estimations. The dataset was developed with a gas network flow simulation model based on mass flow balance by combining data from multiple datasets including daily ENTSOG (European Network of Transmission System Operators for Gas) pipeline gas transport and storage, ENTSOE (European Network of Transmission System Operators for Electricity) daily power production from gas, and Eurostat monthly gas consumption statistics per sector. The annual consumption data were validated against the BP Statistical Review of World Energy and Eurostat datasets. We secondly analyzed the share of gas supplied by Russia in each country to quantify the “gap” that would result from a cessation of all Russian exports to Europe. Thirdly, we collected multiple data sources to assess how national gaps could be alleviated by (1) reducing the demand for heating in a plausible way using the lower envelope of gas empirical consumption – temperature functions, (2) increasing power generation from sources other than gas, (3) transferring gas savings from countries with surplus to those with deficits, and (4) increasing imports from other countries like Norway, the USA, Australia, and northern African countries from either pipelines or LNG imports, accounting for existing capacities. Our results indicate that it should be theoretically possible for the EU to collectively make up for a sudden shortfall of Russian gas by combining the four solutions together, provided a perfect collaboration between EU countries and the UK to redistribute gas from countries with surplus to those with deficits. Further analyses are required to investigate the implications with respect to the costs, including social, economic, and institutional dimensions; political barriers; and negative impacts on climate policies, with inevitable increases in CO2 emissions if the use of coal is ramped up in the power sector.
- Article
(2402 KB) - Full-text XML
- Companion paper
-
Supplement
(2715 KB) - BibTeX
- EndNote


Russia is the largest natural gas supplier to the European Union (EU), where gas is used for household and public building heating, cooking and hot water production, power production, and industry (International Energy Agency, 2022). In 2020, EU countries consumed 155×109m3 of natural gas from Russia, which represented more than one-third of their total gas consumption (Eurostat, 2022a). The invasion of Ukraine was followed by a cutoff of gas supplies from Russia to Bulgaria, Poland, and France. The EU is further planning to drastically reduce its imports of gas from Russia (McPhie et al., 2022). Articles published in the media show diverging estimates of Russian gas dependence across the EU. These analysis lack high time resolution and detailed sector-based analysis (Mcwilliams et al., 2022a, b).
In addition to assessing the amount of Russian gas used in EU countries and its variation over time, it is also important to investigate how a shortage of this gas supply source can be alleviated. Significant reshaping of supply–demand structures of gas would be inevitable in case of a shortage of Russian gas, which could impact (1) energy prices, economic growth, and household income; (2) energy structure and environmental and climate goals, e.g., if countries seek to use more coal power (Eddy, 2022; AFP, 2022) to compensate for a shortage of gas or excessive prices; and (3) global energy markets and security, if the increasing demand of gas in the EU raises the global gas price.
To quantify the magnitude of the use of Russian gas in different countries and sectors, we present a new methodology based on daily data of pipeline gas flow, production, storage, and consumption of gas across the EU27 (27 EU member countries) and the UK. The data include daily pipeline gas flows across gas balancing zones of the pipeline network and storage facilities (ENTSOG, 2022b), daily power production from gas (ENTSOE, 2022), and the monthly/annual partitioning of gas used to different sectors, including households, commercial and public buildings, industry, and power (Eurostat, 2022a, b, c). The supply–storage–consumption amounts and shares from Russian supply and all other supply sources were calculated from the above data based on mass balance. We then investigate how a shortage of Russian gas equivalent to a complete stop of supply could be filled by reducing demand for heating, increasing power generation from other sources, increasing production in the EU, and increasing international imports both at liquefied natural gas (LNG) terminals and pipelines from non-EU countries other than Russia. We further consider existing transmission constraints on the intra-EU gas reallocation with the current pipeline infrastructure.
We provide two datasets, the “EU27&UK daily gas supply–consumption” (EUGasSC) with the share of different supply sources including Russia imports, LNG imports, EU gas production, and pipeline imports from other countries, and the “EU27&UK daily gas reduction potential” (EUGasRP). The EUGasSC data give the country- and sector-specific natural gas supply–storage–consumption at a daily resolution. These data allow us to quantify the shortfalls if Russian imports were to terminate. The EUGasSC data can be used for the country- and sector-based policy decision-making and further socioeconomic analysis. The EUGasRP shows the daily gas consumption saving potential that would be achieved by reducing demand for heating and increasing power generation from coal, nuclear, and biomass. Based on EUGasRP, we discuss whether demand reductions in heating, shifts in power generation towards nuclear and coal, and intra-EU and international coordination, particularly with the UK, the USA, Australia, Norway, and northern African countries, could allow the EU to make up for sudden termination of Russian gas imports.
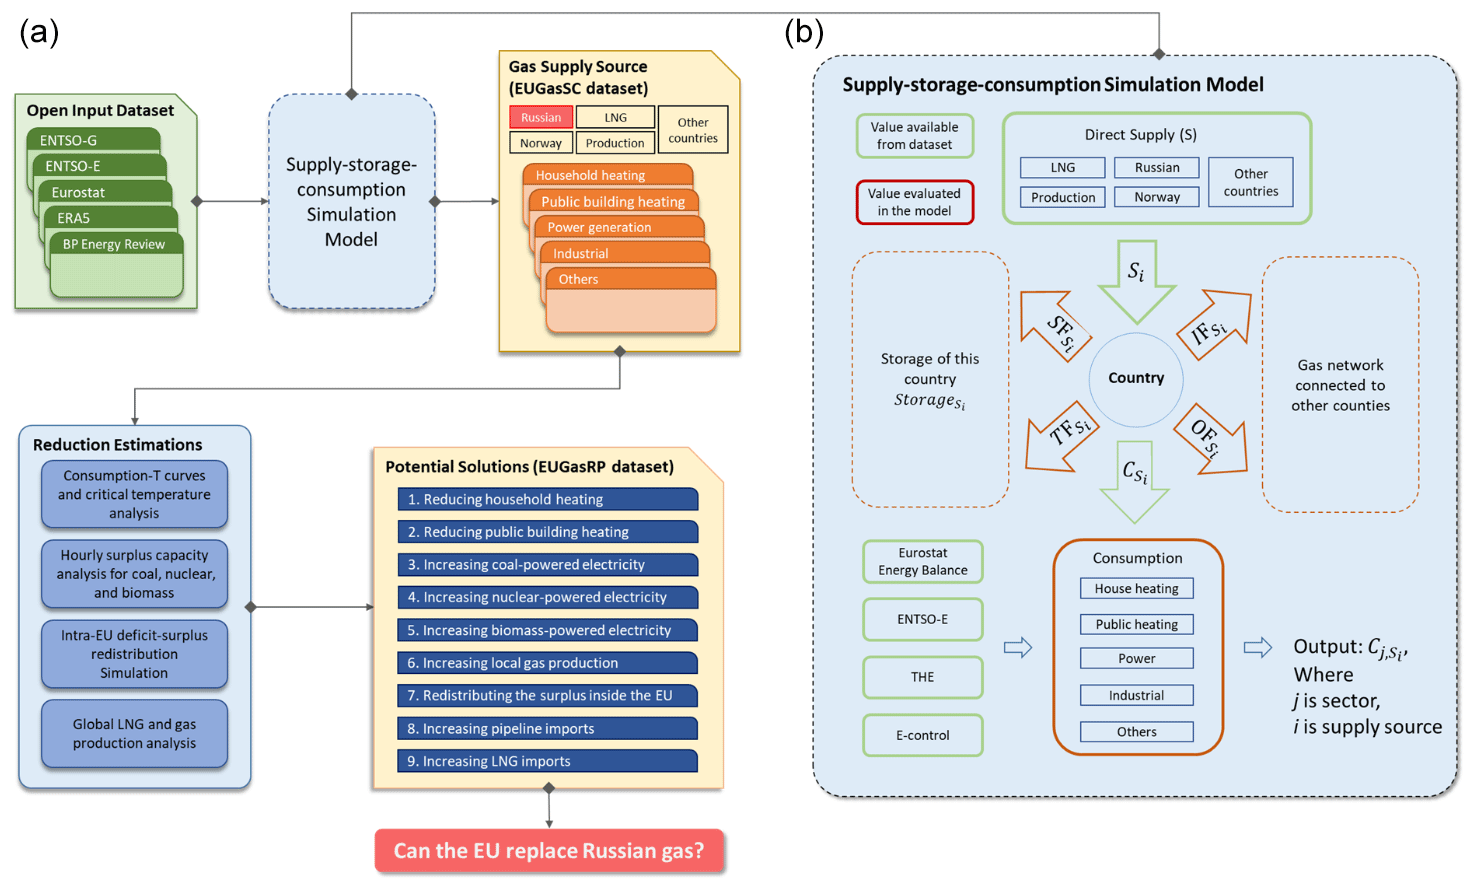
Figure 1Workflow and model concept of this study. (a) The workflow of this study, including the input datasets, their usage in models, and the output datasets. (b) The concept of the supply–storage–consumption simulation model used in this study.
2.1 Data collection
The workflow of this study is shown in Fig. 1a. We collect several open datasets as input data: (1) ENTSOG (European Network of Transmission System Operators for Gas) daily physical pipeline flow (ENTSOG, 2022b), which was used to simulate gas transmission, consumption, storage, and imports; (2) hourly ENTSOE (European Network of Transmission System Operators for Electricity) electricity generation (ENTSOE, 2022; Liu et al., 2020), which was used to estimate how the Russian gas gap could be alleviated by increasing coal and nuclear power (Sect. 2.3.2); (3) gas import and energy balance datasets from Eurostat, which were used to adjust/complete sectoral consumption values for ENTSOG data and as cross-validation of annual consumption totals; (4) BP Statistical Review of World Energy (BP, 2022), which was used to estimate the potential global increment capacity for LNG import and within-EU production as well as for data cross-validation; and (5) ERA5 daily 2 m air temperature data (Hersbach et al., 2018), which were used to estimate the potential reduction in gas consumption from the heating sector based on temperature–consumption curves (Sect. 2.3.1). All of the datasets were collected from application programming interfaces (APIs) or manually download from websites.
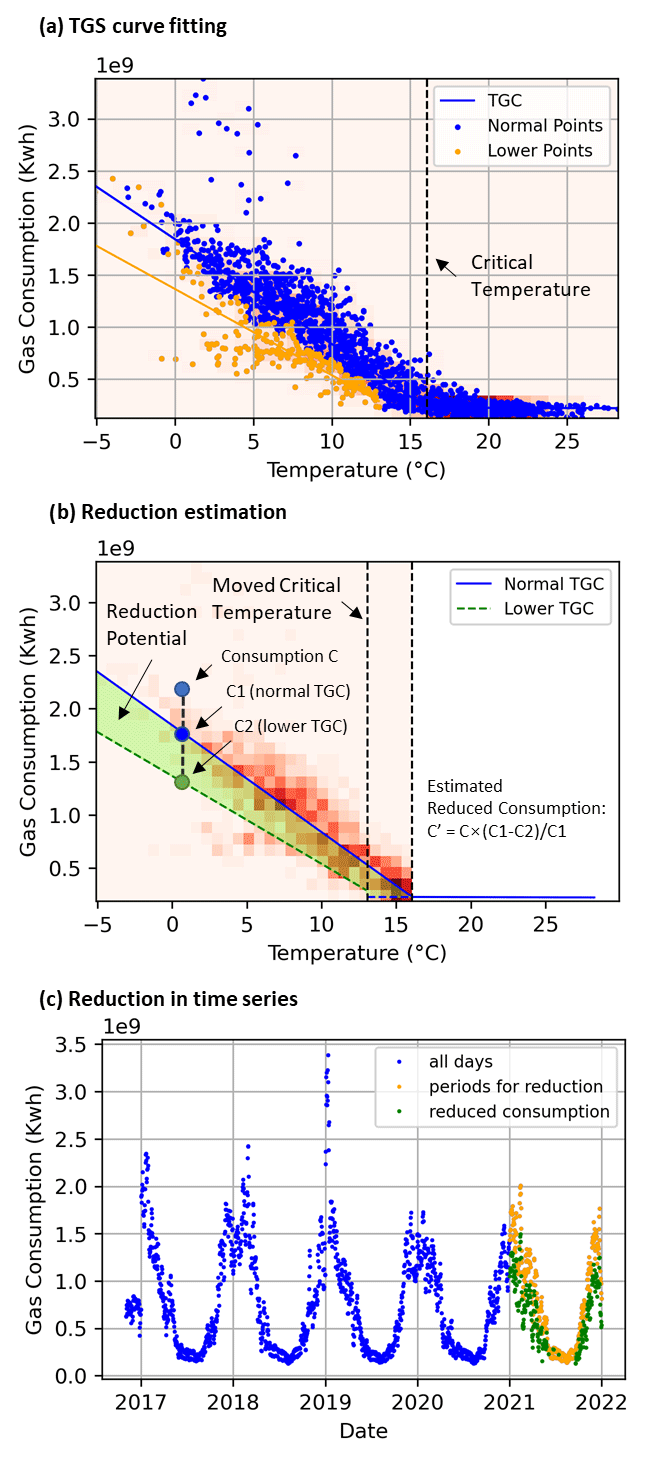
Figure 2Example of temperature–gas consumption (TGC) curves and estimated reduced consumption. The figure panels show an example of house heating reduction estimations for France, outlining (a) TGC curve fitting for normal consumption and the lower 20 % percentile of consumption, (b) how the consumption reduction was estimated for each daily data point, and (c) the estimated heating reduction time series from 2021 to 2022.
2.2 Daily gas supply and consumption
To quantify country- and sector-specific gas supply and consumption, we built a graph network simulation model of daily physical gas flows for the 2016–2022 period. The model simulates gas supply, temporary storage, and consumption sources for households and public buildings, power generation, industry, and other sectors in each country, as shown in Fig. 1b. The detailed equations and the model are presented in the Supplement. As model input data, we completed the raw ENTSOG data with Trading Hub Europe (THE) for German consumption (Trading Hub Europe, 2022) and with E-control for Austria consumption (E-Control, 2022). Briefly, the simulation evaluates the daily share of the supply/consumption source of nodes (country or region) and edges (pipeline) by iteratively solving the mass balance of the physical gas flow in the network. We assumed that the mass balance of each supply source is achieved daily for the transmission network and storage so that the simulation results from the previous day are used as initial values for the next day. The gas consumption in the simulation was split into five sectors based on the Eurostat energy balance datasets (Eurostat, 2022b, c): household buildings, public buildings, power, industry, and other sectors. The simulated sector splitting values are validated with data reported by a few counties for which ENTSOG data directly provide details on usage splitting for the distribution (DIS, covering heating and other sectors) and final consumer (FNC, covering power and industrial sectors) groups of sectors. The details are presented in the Supplement. We performed the simulation from 1 January 2016 to 28 February 2022 for each EU27 country and the UK with a daily resolution, and we separated the share of different supply sources (Russia, Norway, Algeria, Azerbaijan, Libya, Serbia, Turkey, LNG imports, and EU production) in the consumption sectors listed above, which yields the EUGasSC dataset.
2.3 Potential solutions to overcome a Russian gas supply shortfall
The magnitude and temporal variation of a Russian gas supply shortfall – the “gap” – was diagnosed from EUGasSC as the share of Russian gas consumed each day. We then investigated the capacity of potential solutions that could fill within-country gaps or create surpluses in one country that could be reallocated to fill gaps in other countries. Our goal is to estimate the upper bounds for different solutions in order to alleviate the Russian gas gap, not to predict future midterm changes in gas demand. The potential solutions considered include the following: (1) reducing demand for heating; (2) increasing power generation from coal, nuclear, and biomass sources; and (3) increasing international imports and European production, as discussed below. The daily maximum potential gas saving capacity of the first two solutions define the second dataset: EUGasRP. Note that we only investigated short-term solutions that could be immediately implemented (e.g., for the upcoming year) given strong assumptions that (1) the gas supply for the industry will be prioritized and remains at current levels and (2) that no massive increase in power production from renewable energy will happen in the next year, although long-term investments could partly substitute Russian gas use by renewables.
2.3.1 Reduced gas use in the residential household and public building sectors
The potential gas consumption reductions due to reduced heating in buildings were estimated for each country based on empirical temperature–gas consumption (TGC) curves, similar to those shown by Ciais et al. (2022). The TGC curves were constructed using daily consumption from EUGasSC and daily population-weighted air temperatures based on the Eurostat population dataset (Eurostat, 2022d) and ERA5 daily 2 m air temperature data (Hersbach et al., 2018). Figure 2 shows an example for France, outlining the TGC curve fitting (Fig. 2a), how the consumption reduction was estimated (Fig. 2b), and a time series of reduced gas consumption (Fig. 2c). The TGC curves were fitted with a two-segment linear regression separated by a critical temperature (the start-heating temperature), as shown in Fig. 2a. We then constructed plausible reduction scenarios, as shown in Fig. 2b, by modifying two parameters of the TGC curves: (1) we assumed a lower start-heating temperature and (2) computed a plausible lower slope below the critical temperature – the slope representing the increase in gas consumption per unit of air temperature decrease. Lower slopes were estimated using only data below a low threshold percentile of the observed consumption data. The lower thresholds resulted in flatter slopes and larger gas consumption savings for heating. Finally, the actual reductions in daily consumption were calculated as the difference between the original and the modified TGC curves, as shown in Fig. 2c. Similar plots for building consumption reductions in other countries and for other reduction parameters are presented in Figs. S3–S5 in the Supplement.
We designed a moderate and a drastic reduction scenario for gas saving in residential and public buildings: (1) households adopt a 1 ∘C lower critical start-heating temperature (2 ∘C for the drastic case) on weekdays, and the lower 30th percentile of TGC curves (the 20th percentile for the drastic case) is used to define the slope; (2) households adopt a 1 ∘C lower critical temperature (2 ∘C for the drastic case) on weekends, and the lower 50th percentile of TGC curves (40th percentile for severe case) is used to define the slope (based on the assumption that heating gas consumption is systematically lower on weekends compared with weekdays); and (3) public buildings adopt a 2 ∘C lower critical temperature (4 ∘C for the drastic case), and the lower 30th percentile of the TGC curves (20th percentile for the drastic case) is used to define the slope.
2.3.2 Reduced gas use in the power sector
The gas consumption reduction in the power sector was estimated by substituting gas with coal, nuclear, and biomass consumption. This assumes that EU coal-producing countries like Germany and Poland will be able to increase their coal production or that coal imports will be increased. Oil was not considered as an alternative fuel because Russia is also the largest oil supplier to the EU, although some gas-fired power plants can easily switch to oil. To evaluate the gas consumption reduction capacity in the power sector, we assumed that the electricity generated with gas can be substituted by boosting hourly electricity generated by coal, nuclear, and biomass sources up to a maximum level defined by recently observed data since 2019. We estimate this maximum level as 75 % of the maximum observed hourly power generation capacity for coal, nuclear, and biomass sources of each country for a moderate gas reduction scenario (95 % for a drastic reduction scenario), based on observed ENTSOE electricity production data from 2019 to 2021 (presented in Fig. S6). The capacity of each alternative power supply source is estimated from the hourly difference between actual electricity generation and the maximum assumed level. Finally, we aggregate hourly coal, nuclear, and biomass power capacities to a daily resolution and convert them to an equivalent reduction in gas consumption using an average gas power plant efficiency for each country. Those efficiencies are estimated based on regressions between gas consumed by final consumers (from ENTSOG) and gas-powered electricity (from ENTSOE), as presented in Table S2.
2.3.3 Increased supply from import and EU production
Potential increases in LNG imports, pipeline imports, and production within the EU27 and UK were estimated based on the BP Statistical Review of World Energy (BP, 2022). To do so, we calculate maximum supply (imports or production) values by comparing (1) the historical maximum capacity of a list of countries that could export gas to Europe (based on the period from 2010 to 2020) and (2) the recent increment capacity, which is calculated as the 2020 value multiplied by the 2020 growth rate. We consider increased supply from counties that are currently supplying LNG or pipeline gas to the EU as the supply-side solution for filling the Russian gas gap. For LNG, these are the USA and Australia. For pipeline imports, supplier countries are Algeria, Norway, Azerbaijan, and Libya. For increased domestic production, we considered the Netherlands, the UK, Romania, Denmark, Germany, Italy, and Poland. Potential supply increments from other counties, such as Egypt, are not considered as firm solutions; however, they will be discussed in the following sections.
2.3.4 Intra-EU transmission constraints
Some EU countries are not only able to reduce their gas consumption in order to alleviate a domestic shortage of Russian gas but can also generate a surplus of gas, which we assumed could be transferred to other countries with a deficit (i.e., those that could not fully alleviate a shortage of gas from Russia). This implies that one must consider transmission constraints on the intra-EU gas reallocation based on the pipeline directional capacities given by ENTSOG (ENTSOG, 2022c). We performed gas redistribution simulations (as described below) to evaluate the fraction of the Russian gas gap that could be alleviated at the EU scale by intra-EU gas transmission from counties with a gas surplus to counties with a deficit. The gas redistribution simulation was performed by modifying the model described in Sect. 2.2 as follows: (1) adding the estimated capacity/gap to each node, (2) constraining the pipeline transmission capacity for the edges, (3) creating redistribution flows if nodes had extra capacity and the connected pipelines had extra capacity to transmit gas, and (4) solving the maximal redistribution capacity in the network based on ENTSOG flow and redistribution flows. The transmitted surpluses or deficits for each country were then calculated after the redistribution simulation.
The gas transmission by the current ENTSOG gas pipeline network can be unidirectional between some EU countries, which will result in “bottlenecks” with respect to gas surplus redistribution (ENTSOG, 2022c). For example, there is a large transmission capacity (614 GW h d−1) from Germany to France, whereas there is zero capacity from France to Germany due to different systems for gas odorization (ENTSOG, 2022a, c). We simulated the gas redistribution for both the current network and for a network that allows bidirectional flow (as shown in Table S2). The bidirectional network was also evaluated because gas companies have been working on short-term and long-term solutions to reverse the gas flows, although technical uncertainties currently remain (ENTSOG, 2022a).
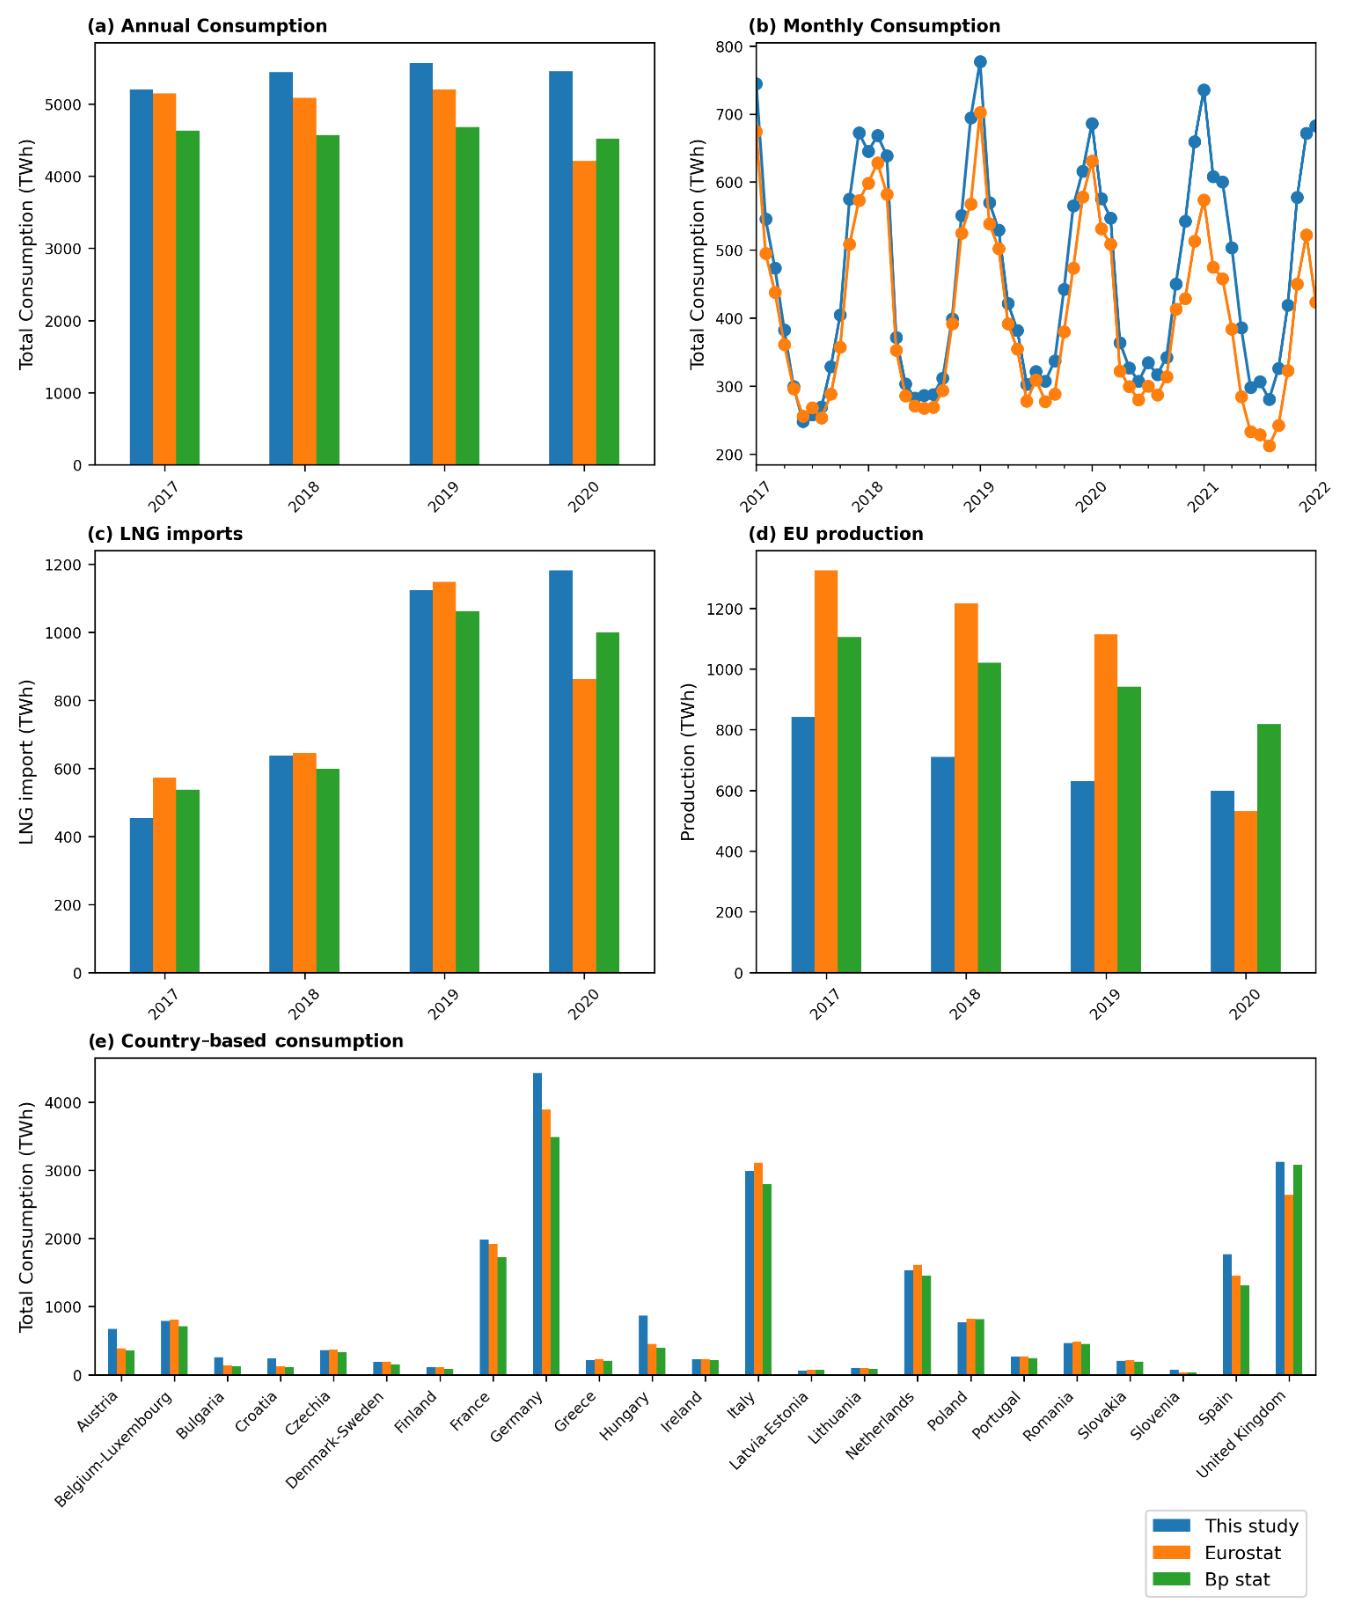
Figure 3Data comparisons among the dataset in this study, Eurostat, and BP Statistical Review of World Energy. The figure panels show the comparisons for (a) total annual consumption, (b) total monthly consumption, (c) total annual LNG imports, (d) total annual EU gas production, and (e) total country-based consumption from 2017 to 2022.
We validate the EUGasSC dataset with the Eurostat (Eurostat, 2022a, b, c) and BP Statistical Review of World Energy datasets for the following variables: (1) annual total gas consumption (Fig. 3a), (2) monthly total gas consumption (Fig. 3b), (3) annual total LNG imports (Fig. 3c), (4) annual total EU gas production (Fig. 3d), and (5) total gas consumption in each country (Fig. 3e). The results show low discrepancies for the annual total consumption (12±5 %, where ± denotes the standard deviation across years or all EU countries), monthly total gas consumption (11±7 %), annual total LNG imports (0±14 %), and total gas consumption in each country (9±7 %, excluding Spain and Latvia–Estonia), whereas large differences were found for the annual total EU gas production ( %), Spain (−65 %), and Latvia–Estonia (−153 %). A negative difference means that our dataset has lower values than Eurostat or BP data. The validations of our dataset with Eurostat are done for the total consumption, even though Eurostat was used for splitting the consumption sectors in EUGasSC (Sect. 2.2). Thus, the use of Eurostat data for consumption attribution and the national total cross-validation is not circular in our approach.
The larger differences between EUGasSC and Eurostat were found for the year 2020 because the UK data were not provided in the Eurostat dataset due to the withdrawal of the UK from the EU. Although our validation results indicate an overall good quality of our dataset, the following uncertainties still exist: (1) we might underestimate the EU production, as EUGasSC has significantly smaller production values compared with both the Eurostat and BP datasets (Fig. 3d), and (2) the consumption differences in each country might bias our analysis of potential solutions for the Russian gap, particularly in Latvia–Estonia as our dataset underestimates their gas consumption. Other uncertainties from collecting, processing, and analysis mainly arise from the fact that (1) values and figures in this paper follow the ENTSOG data collected in April 2022, but the ENTSOG database is regularly corrected and updated, even for very early data (we will also update the EUGasSC and EUGasRP datasets regularly); (2) we estimate the daily Russian supply share based on a simulation that assumes a daily balance of the pipeline network, which might oversimplify gas balancing processes; (3) our estimation of sectoral consumption might not be able to reproduce unusual daily consumption variations, as our values were estimated based on daily temporal total consumption variation patterns from ENTSOG and monthly (thus smoothed) sectoral Eurostat energy balance to attribute total consumption to each sector; and (4) we estimate potential solutions for alleviating the Russian supply gap based on empirical capacities using a number of assumptions and without considering social, economic, international cooperation, and geopolitical barriers (as they are important but not within the scope of this study).

Figure 4Gas supply and sectoral consumptions in each country for 2021. The figure panels show the country-based data for (a) the sectoral consumption amount including the Russian supply amount, (b) the sectoral consumption including the Russian supply share, and (c) the supply source amount (the inset plot). The countries are sorted by the amount of Russian supply.
4.1 Sectoral and country-based differences in Russian gas consumption
The sectoral and country-based gas supply–consumption patterns for the EU27 and UK are shown in Fig. 4. For 2021, the sectoral gas consumption in the EU27 and UK in decreasing order are as follows: household heating (1677 TW h, 29 % of total) > industrial (1648 TW h, 29 % of total) > power (1648 TW h, 22 % of total) > public building heating (672 TW h, 12 % of total) > others (461 TW h, 8 % of total). Consumption patterns of Russian gas are highly country dependent. The five largest Russian gas consumers in 2021 were Germany, Italy, Hungary, Poland, and Austria, which together consumed 77 % of total Russian imports. Considering their relatively high Russian gas share (from 53 % to 89 %), obstacles to alleviating the Russian gas gap might be serious in those countries. On the other hand, France, Netherlands, and Belgium–Luxembourg consumed altogether relatively large absolute amounts of Russian gas (40 % of the Russian supply excluding the largest five countries), but gas from Russia nevertheless represents a small relative share of their total gas consumption (from 12 % to 19 %). Southern and northern European countries that are close to Russia, including Czechia, Slovakia, Croatia, Slovenia, Denmark, Sweden, Finland, Latvia, Estonia, and Lithuania, consume less Russian gas in absolute amounts due to their small country and population sizes, but Russian gas comprises a large share of their total consumption (from 56 % to 92 %). The rest of the countries, including Romania, the UK, Spain, Ireland, Bulgaria, Portugal, and Greece, use a small absolute and relative amount of Russian gas. These results suggest that the solutions and difficulties related to shifting energy supply sources and resolving the gas supply gap can be significantly different among the EU27 and UK. Therefore, we combined countries with similar patterns and closer distances together when discussing potential solutions in the following sections.
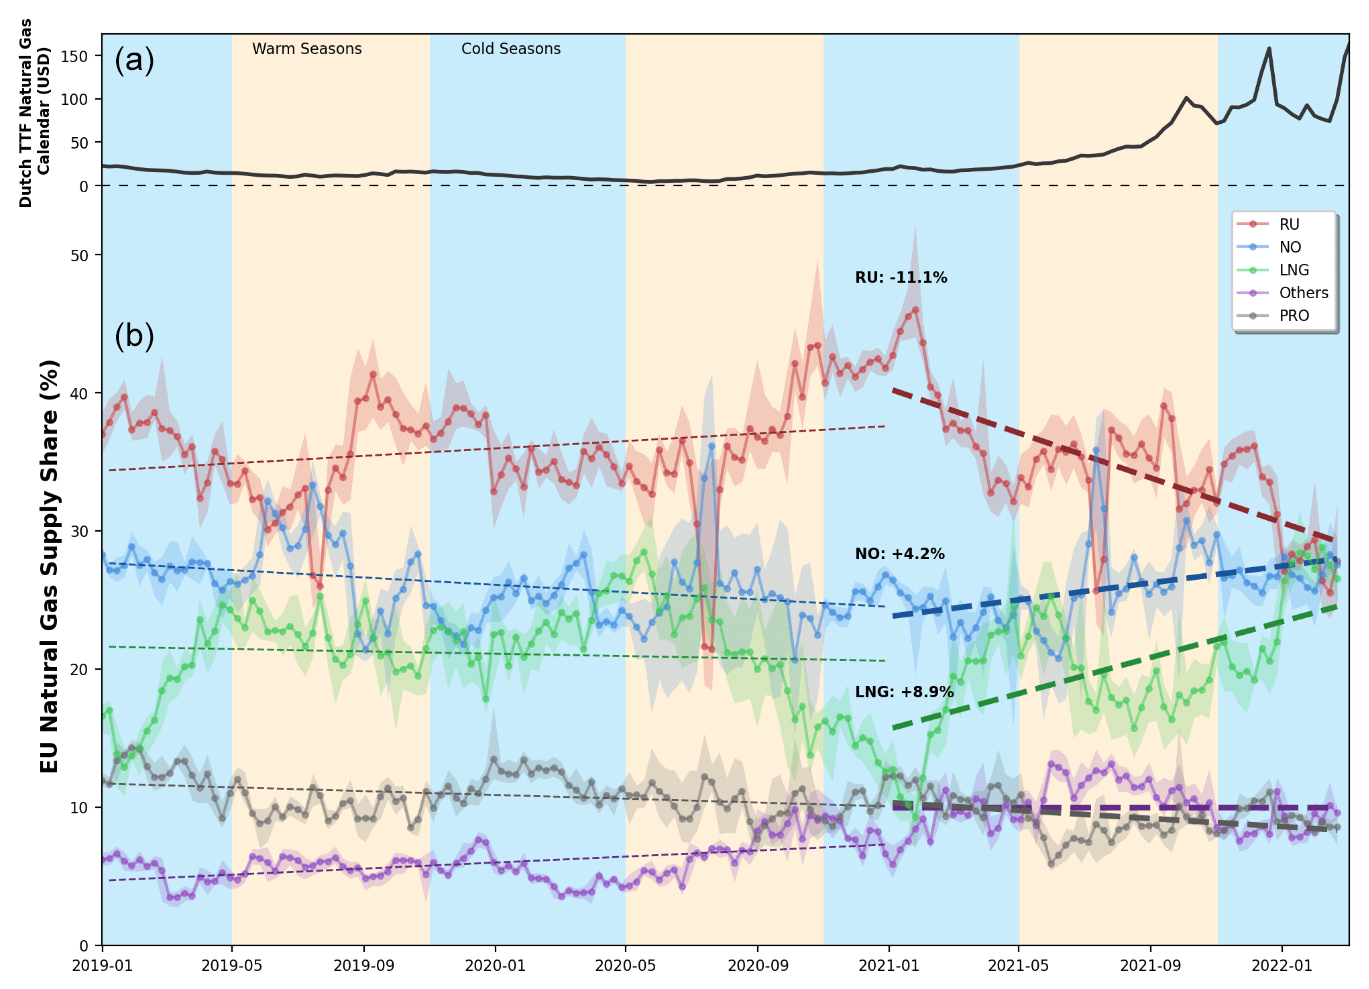
Figure 5Weekly natural gas supply share trends in the EU27 and UK with the EU gas price. Panel (a) shows the Dutch TTF (Title Transfer Facility) Natural Gas Calendar price as the EU gas price, and panel (b) shows the weekly natural gas supply shares and trends for Russian imports (RU), Norwegian imports (NO), LNG imports (LNG), other imports (Other), and EU production (PRO). The linear trends in different supply sources for the periods from 2019 to 2021 and after 2021 (shown as dashed lines) are also presented. The confidence intervals show the weekly variation.
4.2 Gas supply shares and recent trends
We analyzed the gas supply shares and trends based on the EUGasSC dataset for pipeline imports from Russia (RU), Norway (NO), LNG imports (LNG), other imports through pipelines connected to the EU (Other, such as from Azerbaijan and Algeria), and EU production (PRO) from 1 January 2019 to 28 February 2022 at the breakout of the Russian invasion of Ukraine. As shown in Fig. 5, we found that there was a relatively constant gas supply structure before 2021. Annual changes for all of the supply sources ranged from −1.6 % to 1.6 %. The supply shares before 2021 in decreasing order were as follows: Russian (36±4 %) > Norwegian (26±3 %) > LNG (21±4 %) > EU production (10±2 %) > other exporters (5±2 %). However, significant changes in supply sources occurred after 2021, particularly for Russia (decreased by 11 %), LNG (increased by 9 %), and Norway (increased by 4 %). The EU gas price value, based on the Dutch Title Transfer Facility (TTF) Natural Gas Calendar (Fig. 5a), shows three distinct periods: (1) relatively constant before 2021, suggesting a stable gas supply structure; (2) gradually increasing from the start of 2021 to the middle of 2021 with a shift in gas supply sources; and (3) a sudden peak and high variability as well as a high plateau as tensions over the situation in Ukraine increased (Investing.Com, 2022).
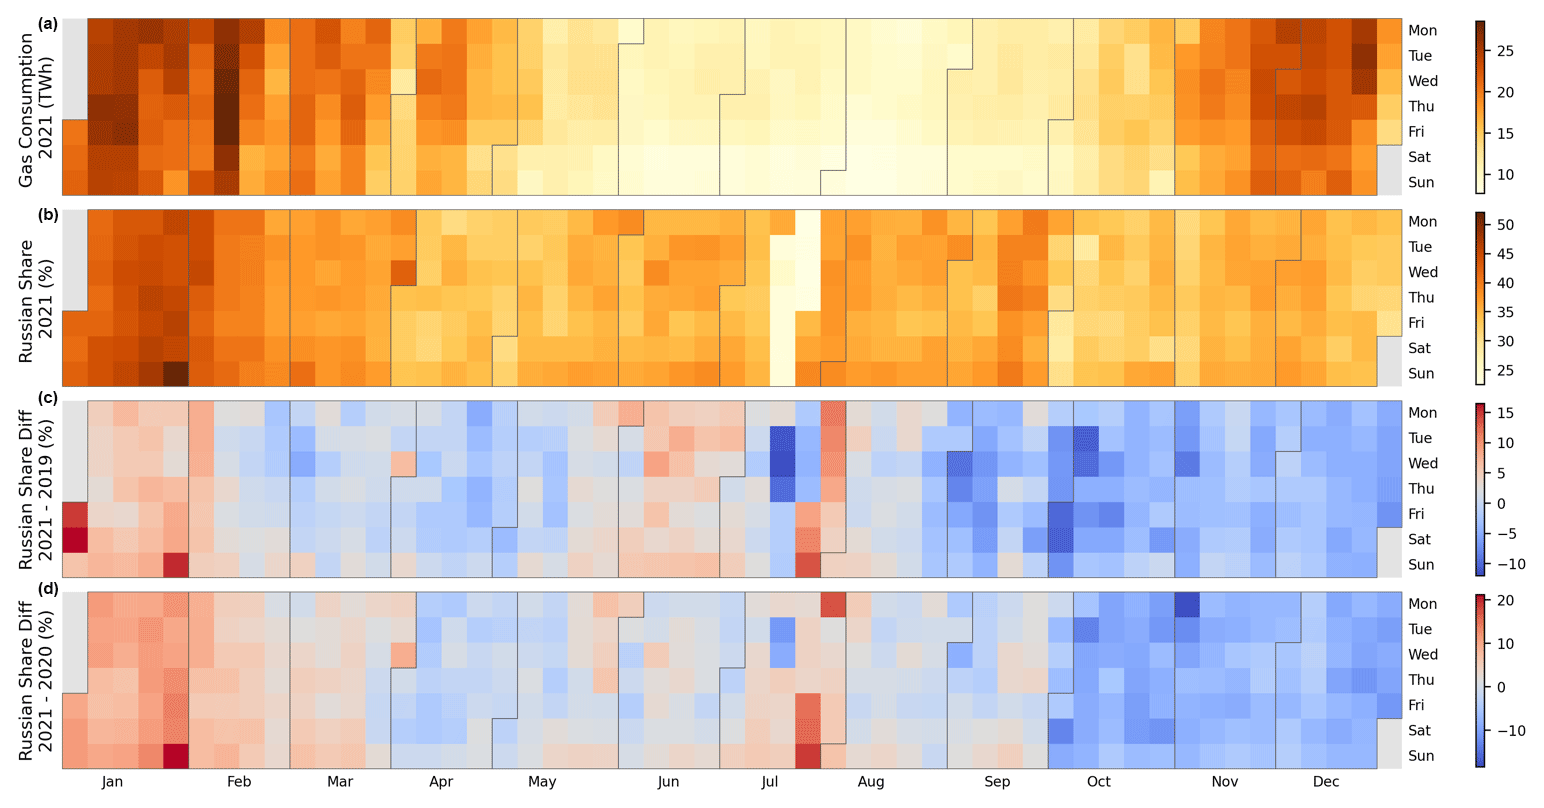
Figure 6Calendar plot of 2021 for the gas consumption and Russian supply shares in the EU27 and UK. The figure panels show the calendar plot (each box represents a day, and each column present a week) for gas consumption in the EU27 and UK (a), the mean Russian supply share (b), the difference in the mean Russian supply share between 2021 and 2019 (as the non-COVID period) (c), and the difference between 2021 and 2020 (as the peak-COVID period) (d).
The daily gas consumption and Russian supply share for 2021 are presented in Fig. 6. Gas consumption is systematically lower on weekends and during warm seasons (from May to October) due to less heating and lower industrial requirements (Fig. 6a). Although it varied with the total gas consumption, the Russian supply declined less than the total gas consumption in the warm seasons, during which time the EU imports and stores gas at a lower price (Fig. 6b). Rapid Russian gas supply changes can be observed between the first half of 2021 (left end of Fig. 6c and d) and the second half of 2021 (right end of Fig. 6c and d). Comparing the Russian share in 2021 with previous years (2020 and 2019), the EU27 and UK had a higher reliance on Russian gas supply in the first half of 2021, but this reliance sharply declined at the end of the 2021 because of the war. Comparing the non-COVID period (difference between 2021 and 2019) and the COVID period (difference between 2021 and 2020), the EU27 and UK relied more on Russian gas supply during the COVID period for the cold season before the war (first 3 months in Fig. 6c and d).
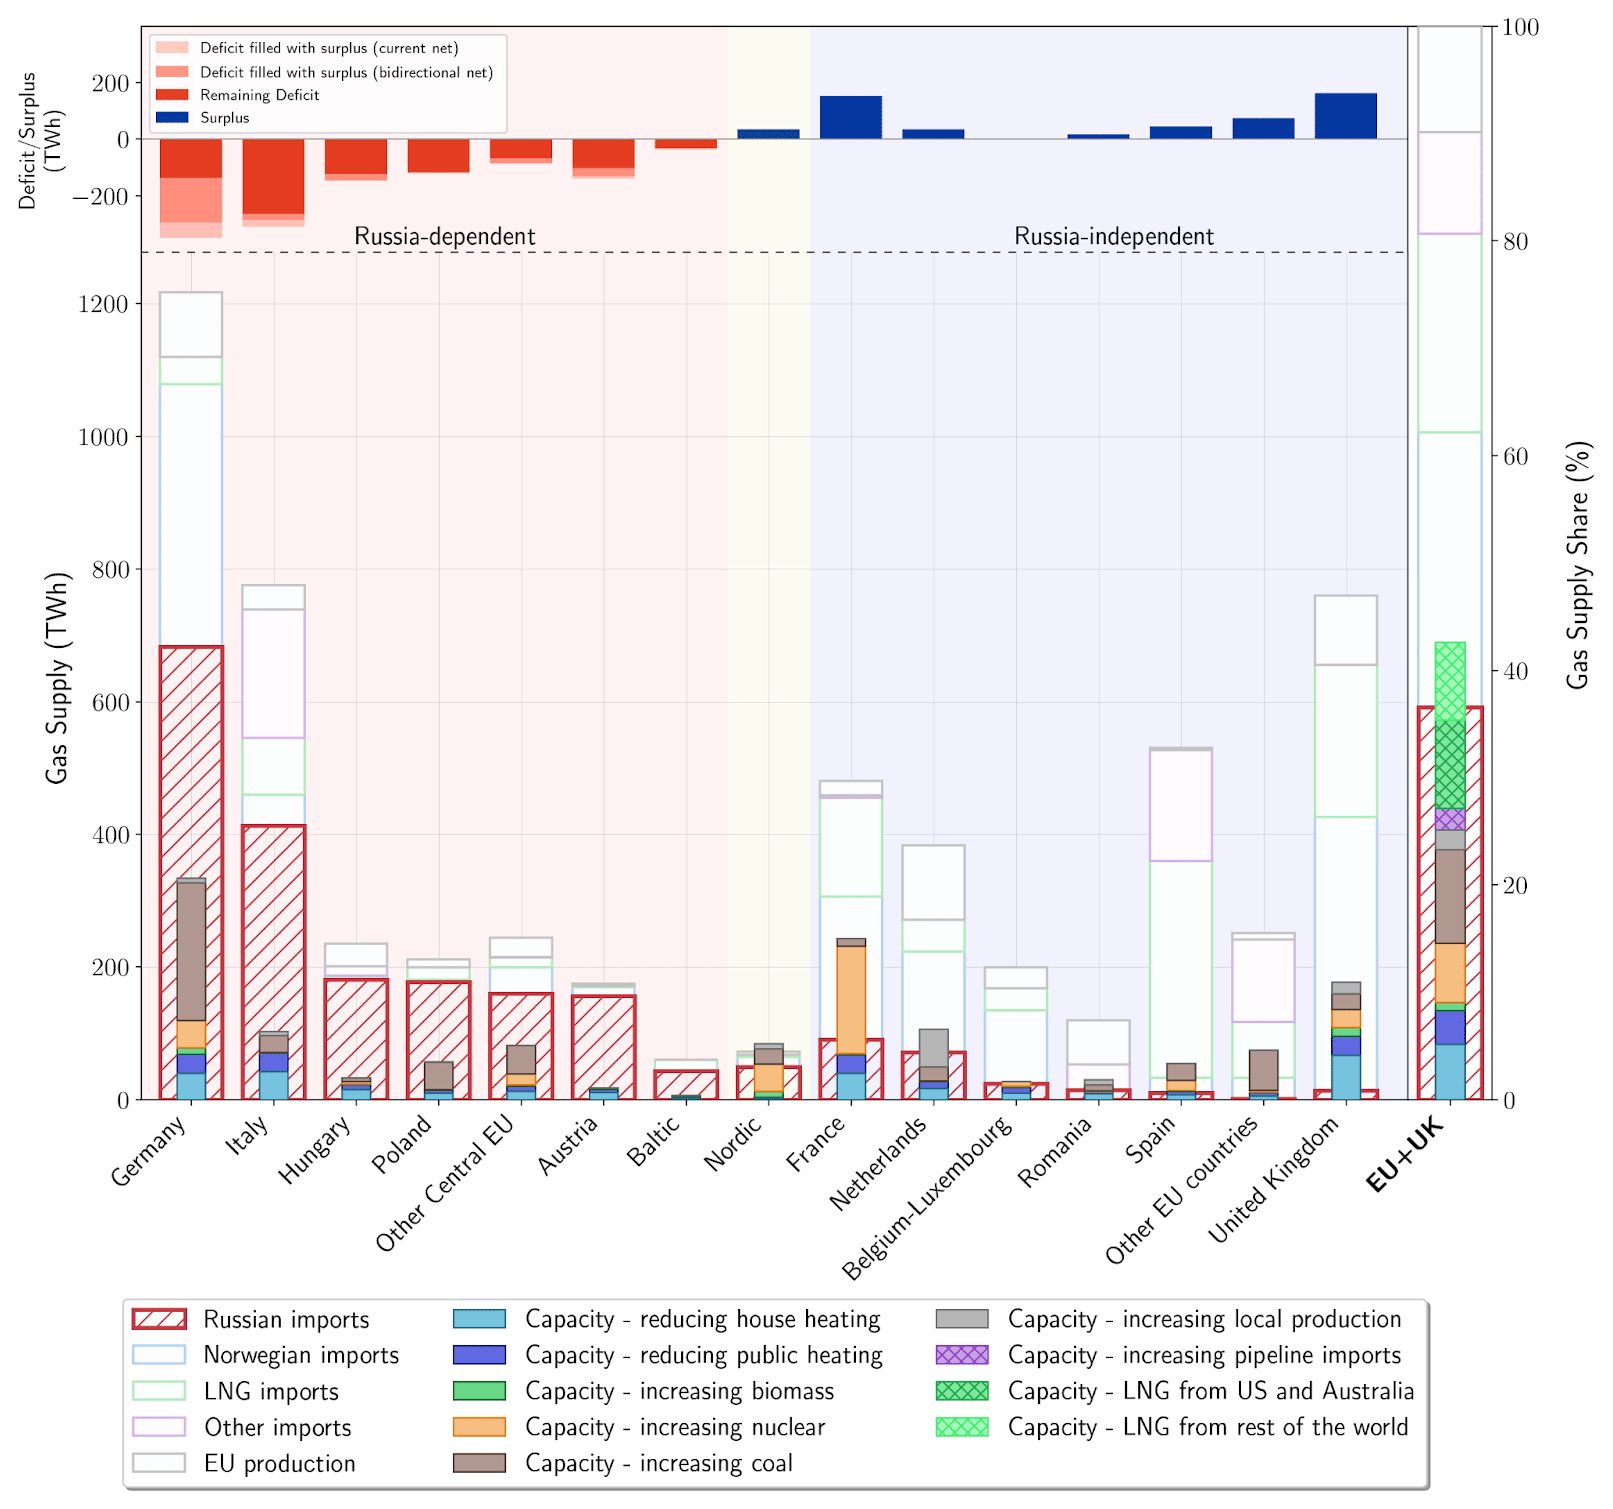
Figure 7The Russian gas gap and potential solutions in the EU. The wider bars display the gas supply from Russia (red hatching), Norway, LNG imports, other pipeline imports, and EU gas production. The narrower bars present the maximal capacity from different sectors to potentially fill the gap (see text). The EU and UK gap is presented as a percentage of total consumption (right y axis). The top bars present the deficit and surplus, and the amount can be transferred inside the EU. “Baltic” includes Estonia, Latvia, and Lithuania. “Nordic” includes Denmark, Sweden, and Finland. “Other central EU countries” includes Slovakia, Slovenia, Czechia, and Croatia. “Other EU countries” includes Ireland, Bulgaria, Portugal, and Greece. The Russia-dependent countries have high Russian gas shares (>20 %) with remaining gaps. Russia-independent countries have low Russian gas shares (<20 %) with no remaining gaps. Nordic countries have higher Russian gas shares but no remaining gap.
4.3 Russian gas gaps
The magnitude of country-level and regional shortfalls in Russian gas supplies if imports from Russia were to terminate are shown in Fig. 4c and summarized in Fig. 7 (hatched red bars). In 2021, the total consumption of Russian gas in the EU and UK was 2090 TW h, corresponding to 36.6 % of total gas consumption. Germany and Italy consumed the largest quantities of Russian gas, accounting for 52.4 % of all Russian gas consumed in the EU and UK (1096 TW h). Less Russian gas was consumed in Hungary, Poland, and Austria; in Baltic and Nordic countries; and in other central European countries, such as Slovakia, Croatia, Slovenia, and Czechia (totalling 768 TW h). Nevertheless, Russian gas represented the dominant share of gas used in these countries (77.0 %). The UK and other EU countries (Ireland, Bulgaria, Portugal, and Greece) have smaller dependencies on Russian gas in both absolute and relative amounts.
4.4 Potential solutions
We present the country-based capacities for alleviating the Russian gas gap with a daily resolution from the EUGasRP dataset. These potential solutions (Sect. 2.3) include demand-side reduction for household and public buildings; increasing power production from coal, nuclear, and biomass; and increasing EU production as well as LNG and pipeline imports. An overview is presented in Fig. 7. We found that, according to our demand reduction scenarios, saving gas with respect to space heating in buildings could cover 17 %–23 % of the total Russia gap. TGC curves and reduction estimations for each country and scenario are presented in Figs. S3–S5 in the Supplement. An additional fraction of 18 %–41 % of the total Russian gas gap could be replaced by substituting gas with coal, nuclear, and biomass sources for power generation. Increasing coal-fired power would save 218–497 TW h of natural gas, and nuclear power would save another 142–317 TW h. In our scenarios, France alone contributes 40 %–51 % to the nuclear power capacity. The uncertainty ranges of the solutions are estimated from the different scenarios presented in Sect. 2.3.1 (for the heating sector) and Sect. 2.3.2 (for the power sector). On the supply side, we estimate, from recent data on production and production change (Sect. 2.3.3), that increased natural gas production in EU countries and the UK could only fill up to 5 % of the gap. However, our dataset might underestimate European gas production, as discussed in Sect. 3. We further estimate that the USA and Australia might be able to produce up to an extra 470 TW h of LNG, and the rest of the world might be able to produce up to an extra 414 TW h of LNG; moreover, other exporters, including Norway, might be able to produce up to an extra 115 TW h of gas carried by pipelines (Table S2). Northern African counties could also play a game-changing role as new gas suppliers due to their vicinity to continental Europe and relatively large boosted supply capacities (109 TW h; Table S2). For example, Egypt, which is currently not a major gas supplier to the EU, has now signed contracts to maximize production and increase exports (Español, 2022). Those extra international supplies, on top of reduced heating consumption and increased power from non-gas sources, would be sufficient to almost entirely cover the remaining gap, leaving less than 4 % of the total Russian gas gap. This might entail substantial changes to the global gas market and LNG prices and could potentially exacerbate economic inequalities in the EU and globally; however, this is outside the scope of this study.
4.5 Challenges and uncertainties
Our two datasets document, for the first time, the spatial–temporal–sectoral gas supply sources and potential solutions (at the time of publication) from both the demand and supply sides that can alleviate the Russian gas shortage in EU countries, with a relatively high temporal resolution. However, our estimates do not contend with the social, economic, or political factors; with the international gas/LNG market; nor with other international cooperation. Our proposed solutions are highly country dependent. For example, some countries can easily overcome small shortfalls in Russian gas (the less Russian-gas-dependent countries in Fig. 7), while other countries might be able to use less gas because of their particular energy structure (e.g., France may switch to more nuclear power). However, Germany, Italy, Austria, and Hungary cannot readily replace Russian gas. Our analysis assumed a perfect cooperation between EU27 members and the UK as well as with the USA, Australia, and Norway to maximize the gas consumption reduction, production, exports, and optimally redistribute the gas surplus. However, such perfect cooperation might be vulnerable to unforeseen events, such as the recent gas workers' strike in Norway (Harrington and Cooban, 2022). Cooperation within the EU can also be affected by other competing factors, such as the gas needs of other regions (e.g., Japan) also being affected by a shortage of Russian gas supply (Energynews, 2022).
The solutions presented in this study also assume that countries that generate more power without using gas could fully transfer their gas surplus to those with gaps, thereby ignoring the constraints of intra-European pipeline transmission capacities. However, optimally redistributing gas from countries with surpluses to those with deficits could be another barrier. Only an 85 TW h capacity could be transmitted to Russian-dependent countries with the current pipeline infrastructure network (light red at the top of Fig. 7), which would leave a 1094–1624 TW h Russian gap (19 %–28 % of the total gas consumption). This gap is much larger than the extra gas that we estimate could be brought in from the global market. The major issue causing transmission limitations is the current pipeline directions. For example, the total remaining gap could be reduced to 844 TW h (dark red at the top of Fig. 7), which could be resolvable by global LNG imports only, if transmission could be redirected from France to Germany, based on the current transmission capacity from Germany to France (see details in the Supplement).
Increasing nuclear power back to the high levels achieved in the past may also be challenging. Germany may not reopen nor boost output from nuclear power plants (World Nuclear Association, 2022b), and the current nuclear capacity in France is much smaller than its designed capacity due to routine maintenance or preventive inspections of reactors (World Nuclear Association, 2022a; Seabrook, 2022). Currently, 12 nuclear power reactors in France (out of a fleet of 56) are offline and being inspected for stress corrosion (World Nuclear News, 2022a; EDF, 2022a), and 15 more reactors were reported (by the media) to not be supplying energy this summer because of regular maintenance (Parisien, 2022; EDF, 2022a). These shutdowns of the nuclear reactors in France resulted in a significantly smaller cumulative output in June 2022, 15.2 % smaller than that in 2021 (EDF, 2022b), which might become an important limitation for filling the Russian gas gap in the EU (as we estimated that France can create a considerable gas surplus by switching from gas to nuclear power). Last but not least, options to increase coal use, although supported by some recent political declarations, may jeopardize the emission reduction targets of the EU if sustained for several years (AFP, 2022; Eddy, 2022). We estimate that our scenario of increased coal power would result in an additional 70–159 Mt of CO2 emissions per year, which would be equivalent to 3 %–6 % of the total EU fossil CO2 emissions in 2020 (Statista, 2022).
We published the two datasets (EUGasSC and EUGasRP) as CSV files, and they are hosted on the Zenodo platform: https://doi.org/10.5281/zenodo.7549233 (Zhou et al., 2022). The datasets are open access and are licensed under a Creative Commons Attribution 4.0 International license. The column headings of the data dictionary files as well as the unit of each variable are listed in Table S3.
Our datasets provide daily gas supply–storage–consumption of five consumption sectors for the EU27 and UK as well as the potential gas reduction capacity from the heating and power sectors of each country as solutions for resolving Russian gaps. They can be used as either input or reference datasets for further research in various fields, such as gas/energy modeling, carbon emission, climate change, geopolitical policy discussions, and the international gas/energy market. Chuanlong Zhou, who collected the data and performed the analysis, and Philippe Ciais, who is an expert on the background of this study, are at the disposal of researchers wishing to reuse the datasets.
We presented two datasets for the EU27 and UK at daily resolutions: (1) the EUGasSC dataset, describing the sectoral and country-based daily natural gas supply–storage–consumption, and (2) the EUGasRP dataset, describing the daily sectoral and country-based natural gas reduction capacities for the heating and power sectors, increased EU production, and foreign imports. They can be applied to various fields and topics for future research, such as gas/energy consumption and market modeling, carbon emission and climate change research, and policy decision-making.
We used these two datasets to analyze the gas supply–consumption patterns and trends, thereby quantifying how the Russian gas gap could be alleviated if Russian imports were to terminate. Our results indicate that a full and sudden loss of Russian gas for the EU could be theoretically filled with short-term solutions, including plausible demand reductions for heating; higher power generation from nuclear and coal sources; and intra-EU and international coordination, particularly with the UK, the USA, Australia, and Norway, albeit with numerous challenges and uncertainties.
The supplement related to this article is available online at: https://doi.org/10.5194/essd-15-949-2023-supplement.
CZ contributed to model development, the ENTSOG and climate data collection, analysis of result, and drafting the paper. BZ and ZL contributed to the ENTSOE data collection and cleaning. SBA and HdAR contributed to partial ENTSOG data collection. SJD and AH reviewed the paper. PC contributed to the methodology and to drafting and reviewing the paper. All authors have read and approved the paper.
The contact author has declared that none of the authors has any competing interests.
Publisher's note: Copernicus Publications remains neutral with regard to jurisdictional claims in published maps and institutional affiliations.
This paper was edited by David Carlson and reviewed by two anonymous referees.
AFP: Dutch join Germany, Austria, in reverting to coal, Agence France-Presse (AFP), https://www.france24.com/en/live-news/20220620-dutch-join-germany-austria-in-reverting-to-coal?ref=tw (last access: 17 February 2023), 2022.
BP: Statistical Review of World Energy, BP [data set], https://www.bp.com/content/dam/bp/business-sites/en/global/corporate/xlsx/energy-economics/statistical-review/bp-stats-review-2022-all-data.xlsx (last access: 17 February 2023), 2022.
Ciais, P., Bréon, F. M., Dellaert, S., Wang, Y., Tanaka, K., Gurriaran, L., Françoise, Y., Davis, S. J., Hong, C., Penuelas, J., Janssens, I., Obersteiner, M., Deng, Z., and Liu, Z.: Impact of Lockdowns and Winter Temperatures on Natural Gas Consumption in Europe, Earth's Future, 10, https://doi.org/10.1029/2021ef002250, 2022.
E-control: https://www.e-control.at/ (last access: 17 February 2023), 2022, updated regularly.
Eddy, M.: Germany will fire up coal plants again in an effort to save natural gas, The New York Times, https://www.nytimes.com/2022/06/19/world/europe/germany-russia-gas.html#:~:text=Invasion of Ukraine-,Germany will fire up coal plants again,effort to save natural gas.&text=BERLIN %E2%80%94 Germany will restart coal,deliveries to Europe this wee (last access: 17 February 2023), 2022.
EDF: List of outages and messages, EDF [data set], https://doaat.edf.fr/en/doaat/export/light/csv?t=1676470620 (last access: 17 February 2023), 2022a.
EDF: Nuclear output in France: https://www.edf.fr/en/the-edf-group/dedicated-sections/investors-shareholders/financial-and-extra-financial-performance/nuclear-generation (last access: 17 February 2023), 2022b, updated regularly.
Energynews: Japan Plans to Limit Gas Use, Energynews, https://energynews.pro/en/japan-plans-to-limit-gas-use/ (last access: 17 February 2023), 2022.
ENTSOE: Transparency Platform: https://transparency.entsoe.eu/ (last access: 17 February 2023), 2022, updated regularly.
ENTSOG: ENTSOG Summer Supply Outlook 2022, https://www.entsog.eu/sites/default/files/2022-04/SO0035-22_Summer_Supply_Outlook_2022_BOA_Rev8.1_220427 for publication.pdf (last access: 17 February 2023), 2022a.
ENTSOG: Transparency Platform: https://transparency.entsog.eu/ (last access: 17 February 2023), 2022b.
ENTSOG: Transmission Capacity and System Development Maps, https://www.entsog.eu/sites/default/files/2021-11/ENTSOG_CAP_2021_A0_1189x841_FULL_066_FLAT.pdf (last access: 17 February 2023), 2022c.
Español, M.: Italy's ENI to tap North African gas for Europe, AL-Monitor, https://www.al-monitor.com/originals/2022/04/italys-eni-tap-north-african-gas-europe (last access: 17 February 2023), 2022.
Eurostat: Imports of natural gas by partner country, Eurostat [data set], https://ec.europa.eu/eurostat/web/products-datasets/-/nrg_ti_gas (last access: 17 February 2023), 2022a.
Eurostat: Supply, transformation and consumption of gas, Eurostat [data set], https://ec.europa.eu/eurostat/web/products-datasets/-/nrg_cb_gas (last access: 17 February 2023), 2022b.
Eurostat: Supply, transformation and consumption of gas – monthly data, Eurostat [data set], https://ec.europa.eu/eurostat/web/products-datasets/-/nrg_cb_gasm (last access: 17 February 2023), 2022c.
Eurostat: Average annual population to calculate regional GDP data (thousand persons) by NUTS 3 regions, Eurostat [data set], https://ec.europa.eu/eurostat/web/products-datasets/-/nama_10r_3popgdp (last access: 17 February 2023), 2022d.
Harrington, G. and Cooban, A.: Norway's government steps in to end oil and gas strike, averting a new energy shock for Europe, CNN, https://edition.cnn.com/2022/07/05/energy/norwegian-gas-strike-europe-energy-crisis/index.html (last access: 17 February 2023), 2022.
Hersbach, H., Bell, B., Berrisford, P., Biavati, G., Horányi, A., Muñoz Sabater, J., Nicolas, J., Peubey, C., Radu, R., and Rozum, I.: ERA5 hourly data on single levels from 1979 to present, Copernicus climate change service (c3s) climate data store (cds) [data set], https://cds.climate.copernicus.eu/cdsapp#!/dataset/reanalysis-era5-single-levels?tab=overview (last access: 17 February 2023), 2018, updated regularly.
International Energy Agency: Reliance on Russian Fossil Fuels in OECD and EU Countries, International Energy Agency [data set], https://www.iea.org/data-and-statistics/data-product/reliance-on-russian-fossil-fuels-in-oecd-and-eu-countries (last access: 17 February 2023), 2022.
Investing.com: Dutch TTF Natural Gas Futures, https://www.investing.com/commodities/dutch-ttf-gas-c1-futures, last access: 17 February 2023, updated regularly.
Liu, Z., Ciais, P., Deng, Z., Davis, S. J., Zheng, B., Wang, Y., Cui, D., Zhu, B., Dou, X., Ke, P., Sun, T., Guo, R., Zhong, H., Boucher, O., Breon, F. M., Lu, C., Guo, R., Xue, J., Boucher, E., Tanaka, K., and Chevallier, F.: Carbon Monitor, a near-real-time daily dataset of global CO2 emission from fossil fuel and cement production, Sci. Data, 7, 392, https://doi.org/10.1038/s41597-020-00708-7, 2020.
McPhie, T., Parrondo, A. C., and Bedini, G.: REPowerEU: Joint European action for more affordable, secure and sustainable energy, European Commission, https://ec.europa.eu/commission/presscorner/detail/en/IP_22_1511 (last access: 17 February 2023), 2022.
Mcwilliams, B., Sgaravatti, G., Tagliapietra, S., and Zachmann, G.: Can Europe survive painlessly without Russian gas?, Bruegel, https://www.bruegel.org/blog-post/can-europe-survive-painlessly-without-russian-gas (last access: 17 February 2023), 2022a.
Mcwilliams, B., Sgaravatti, G., Tagliapietra, S., and Zachmann, G.: Preparing for the first winter without Russian gas, Bruegel, https://www.bruegel.org/blog-post/preparing-first-winter-without-russian-gas (last access: 17 February 2023), 2022b.
Parisien, P. L.: Canicule: avec des réacteurs nucléaires à l'arrêt, la France doit importer de l'électricité, Le Parisien, https://www.leparisien.fr/economie/canicule-avec-des-reacteurs-nucleaires-a-larret-la-france-doit-importer-de-lelectricite-16-06-2022-OV3P5HH46RHV7CQHCHNGINPOJ4.php (last access: 17 February 2023), 2022.
Seabrook, V.: Half of France's nuclear reactors taken offline, adding to electricity demand on European grid, Sky News, https://news.sky.com/story/nearly-half-of-frances-nuclear-reactors-taken-offline-adding-to-electricity-demand-on-european-grid-12600662#:~:text=On Friday 28 of France's,demand amid the gas crisis (last access: 17 February 2023), 2022.
Statistica: Carbon dioxide (CO2) emissions in the European Union from 1965 to 2020, https://www.statista.com/statistics/450017/CO2-emissions-europe-eurasia/#:~:text=Carbon dioxide emissions in the European Union 1965%2D2020&text=This was a reduction of,at 3.99 billion metric tons (last access: 17 February 2023), 2022.
Trading Hub Europe: https://www.tradinghub.eu/en-gb/(last access: 17 February 2023), 2022, updated regularly.
World Nuclear Association: Nuclear Power in France, https://www.world-nuclear.org/country/default.aspx/France (last access: 17 February 2023), 2022a, updated regularly.
World Nuclear Association: Nuclear Power in Germany, https://www.world-nuclear.org/country/default.aspx/Germany (last access: 17 February 2023), 2022b, updated regularly.
World Nuclear News: EDF revises up cost of nuclear power plant outages: https://world-nuclear-news.org/Articles/EDF-revises-up-cost-of-nuclear-plant-outages (last access: 17 February 2023), 2022.
Zhou, C., Zhu, B., Ciais, P., Arous, S. B., Davis, S. J., and Liu, Z.: EU27 & UK gas supply-storage-consumption and potential solutions to fill Russian gap with daily resolutions, Zenodo [data set], https://doi.org/10.5281/zenodo.7549233, 2022.