the Creative Commons Attribution 4.0 License.
the Creative Commons Attribution 4.0 License.
 | 21 Feb 2023
Maps with 1 km resolution reveal increases in above- and belowground forest biomass carbon pools in China over the past 20 years
Yongzhe Chen
Xiaoming Feng
Bojie Fu
Haozhi Ma
Constantin M. Zohner
Thomas W. Crowther
Yuanyuan Huang
Xutong Wu
Fangli Wei
To quantify the ecological consequences of recent nationwide restoration efforts in China, spatially explicit information on forest biomass carbon stock changes over the past 20 years is critical. However, long-term biomass tracking at the national scale remains challenging as it requires continuous and high-resolution monitoring. Here, we characterize the changes in the above- and belowground biomass carbon (AGBC and BGBC) of forests in China between 2002 and 2021 at 1 km spatial resolution by integrating multiple types of remote sensing observations with intensive field measurements through regression and machine learning approaches. On average, 8.6 ± 0.6 and 2.2 ± 0.1 PgC were stored in above- and belowground live forests in China. Over the last 20 years, the total forest biomass carbon pool in China has increased at a rate of 114.5 ± 16.3 TgC yr−1 (approximately 1.1 % yr−1). The most pronounced forest biomass carbon stock gains occurred in central to southern China, including the southern Loess Plateau, Qinling mountains, southwestern karsts and southeastern forests. While the combined use of multi-source remote sensing data provides a powerful tool to assess the forest biomass carbon changes, future research is also needed to explore the drivers of the observed woody biomass trends and to evaluate the degree to which biomass gains will translate into biodiverse, healthy ecosystems that are sustainable. Annual forest above- and belowground biomass maps for China are now available at https://doi.org/10.6084/m9.figshare.21931161.v1 (Chen, 2023).
- Article
(8604 KB) - Full-text XML
-
Supplement
(1169 KB) - BibTeX
- EndNote


Forest biomass carbon stock contributes to over 90 % of the global vegetation biomass carbon pool (Ma et al., 2021). As a net outcome of carbon gains from photosynthesis and carbon losses from respiration, mortality and disturbances, forest biomass carbon stock (approximately 50 % of biomass) is a critical indicator of ecosystem function and ecosystem services, such as carbon sequestration, wood production and resource allocation (Kumar and Mutanga, 2017). Accurate forest biomass carbon stock monitoring over space and time is thus essential for assessing ecosystem management strategies and mitigation policies (Kumar and Mutanga, 2017).
In recent decades, remote sensing tools have been integral in our efforts to map aboveground biomass (AGB) or carbon stock (AGBC). By combining satellite imagery (e.g. MODIS) and airborne lidar signals, forest cover and canopy height can be mapped across large spatial scales (Hu et al., 2016; Saatchi et al., 2011; Su et al., 2016; Tong et al., 2020; Xu et al., 2021). Apart from optical images and lidar signals, microwaves can provide more detailed insights into subcanopy forest structure and AGBC due to their ability to penetrate the canopy. Active microwave techniques, i.e. Synthetic Aperture Radar (SAR) backscatters, facilitate high-resolution (e.g. 100 m) AGB mapping, but the temporal coverage is limited (Cartus et al., 2012; Bouvet et al., 2018). Conversely, vegetation optical depth (VOD) retrieved from multiple passive microwave sensors can be used to produce long-term continuous AGB maps (Frappart et al., 2020; Liu et al., 2011, 2015), yet at a coarse spatial resolution (e.g. 0.25∘). Because different remote sensing techniques have their advantages and pitfalls, combining these techniques and complementing them with direct ground measurements is integral to maximizing the accuracy and precision of biomass carbon estimations across space and time.
Another source of uncertainty in vegetation biomass carbon stocks is the extent of biomass that is stored belowground as roots. While AGBC mapping is facilitated by a suite of emerging remote sensing techniques, investigating the spatiotemporal variation in the belowground biomass carbon pool (BGBC) remains challenging despite the large contribution of roots to total carbon storage (Huang et al., 2021; Ma et al., 2021). To map BGBC, the commonly used approach is to combine aboveground biomass information with vegetation-type-specific ratios of belowground biomass (BGB) to AGB (i.e. root–shoot ratio or RSR; Xu et al., 2021; Saatchi et al., 2011). Because field studies indicate a near-linear relationship between log-transformed BGB and AGB (Enquist Brian and Niklas Karl, 2002), BGB variations at large scales have often been approximated using this relationship (Spawn et al., 2020). To capture the complex relationship between BGB and biotic or abiotic variables (e.g. stand age, heat and water availability), machine learning algorithms have been applied to map BGB (Huang et al., 2021) and root mass fractions (Ma et al., 2021) globally. However, the reference plots were unevenly distributed across the world and limited in developing countries, leading to some uncertainties in BGB and BGBC estimation within those regions (Huang et al., 2021).
China has been implementing national-scale afforestation and reforestation programmes since the late 1990s (Lu et al., 2018), promoting vegetation cover and carbon storage in the Loess Plateau and the southwestern karst regions, etc. (C. Chen et al., 2019; Niu et al., 2019; Tong et al., 2018). A spatial understanding of forest biomass trends can help evaluate the efficiency of ecological restoration programmes. High-quality, high-resolution and long-term continuous woody biomass monitoring in China has remained challenging (Zhang et al., 2019; Huang et al., 2019).
In this study, by integrating multi-source remote sensing data with large quantities of plot measurements, we produced 1 km resolution above- and belowground forest biomass carbon pool maps for China during the past 20 years (2002–2021). This dataset, which is available at https://doi.org/10.6084/m9.figshare.21931161.v1 (Chen, 2023) could provide new insights into forest carbon stock changes in China over the past 2 decades.
To map above- and belowground forest biomass carbon stock in China during 2002–2021, we (1) calibrated a SAR-based high-resolution forest aboveground biomass map in China based on massive field measurements of AGBC during 2011–2015, (2) extended the AGBC time series to 2002–2021 by referring to the tree and short vegetation cover retrieved from optical remote sensing, (3) calibrated the AGBC time series in some specific areas using a long-term, integrated microwave-based VOD dataset and (4) mapped forestlands' BGBC through a random forest model developed based on the in situ records in the published literature. The basic procedure is shown in Fig. 1 and described below.
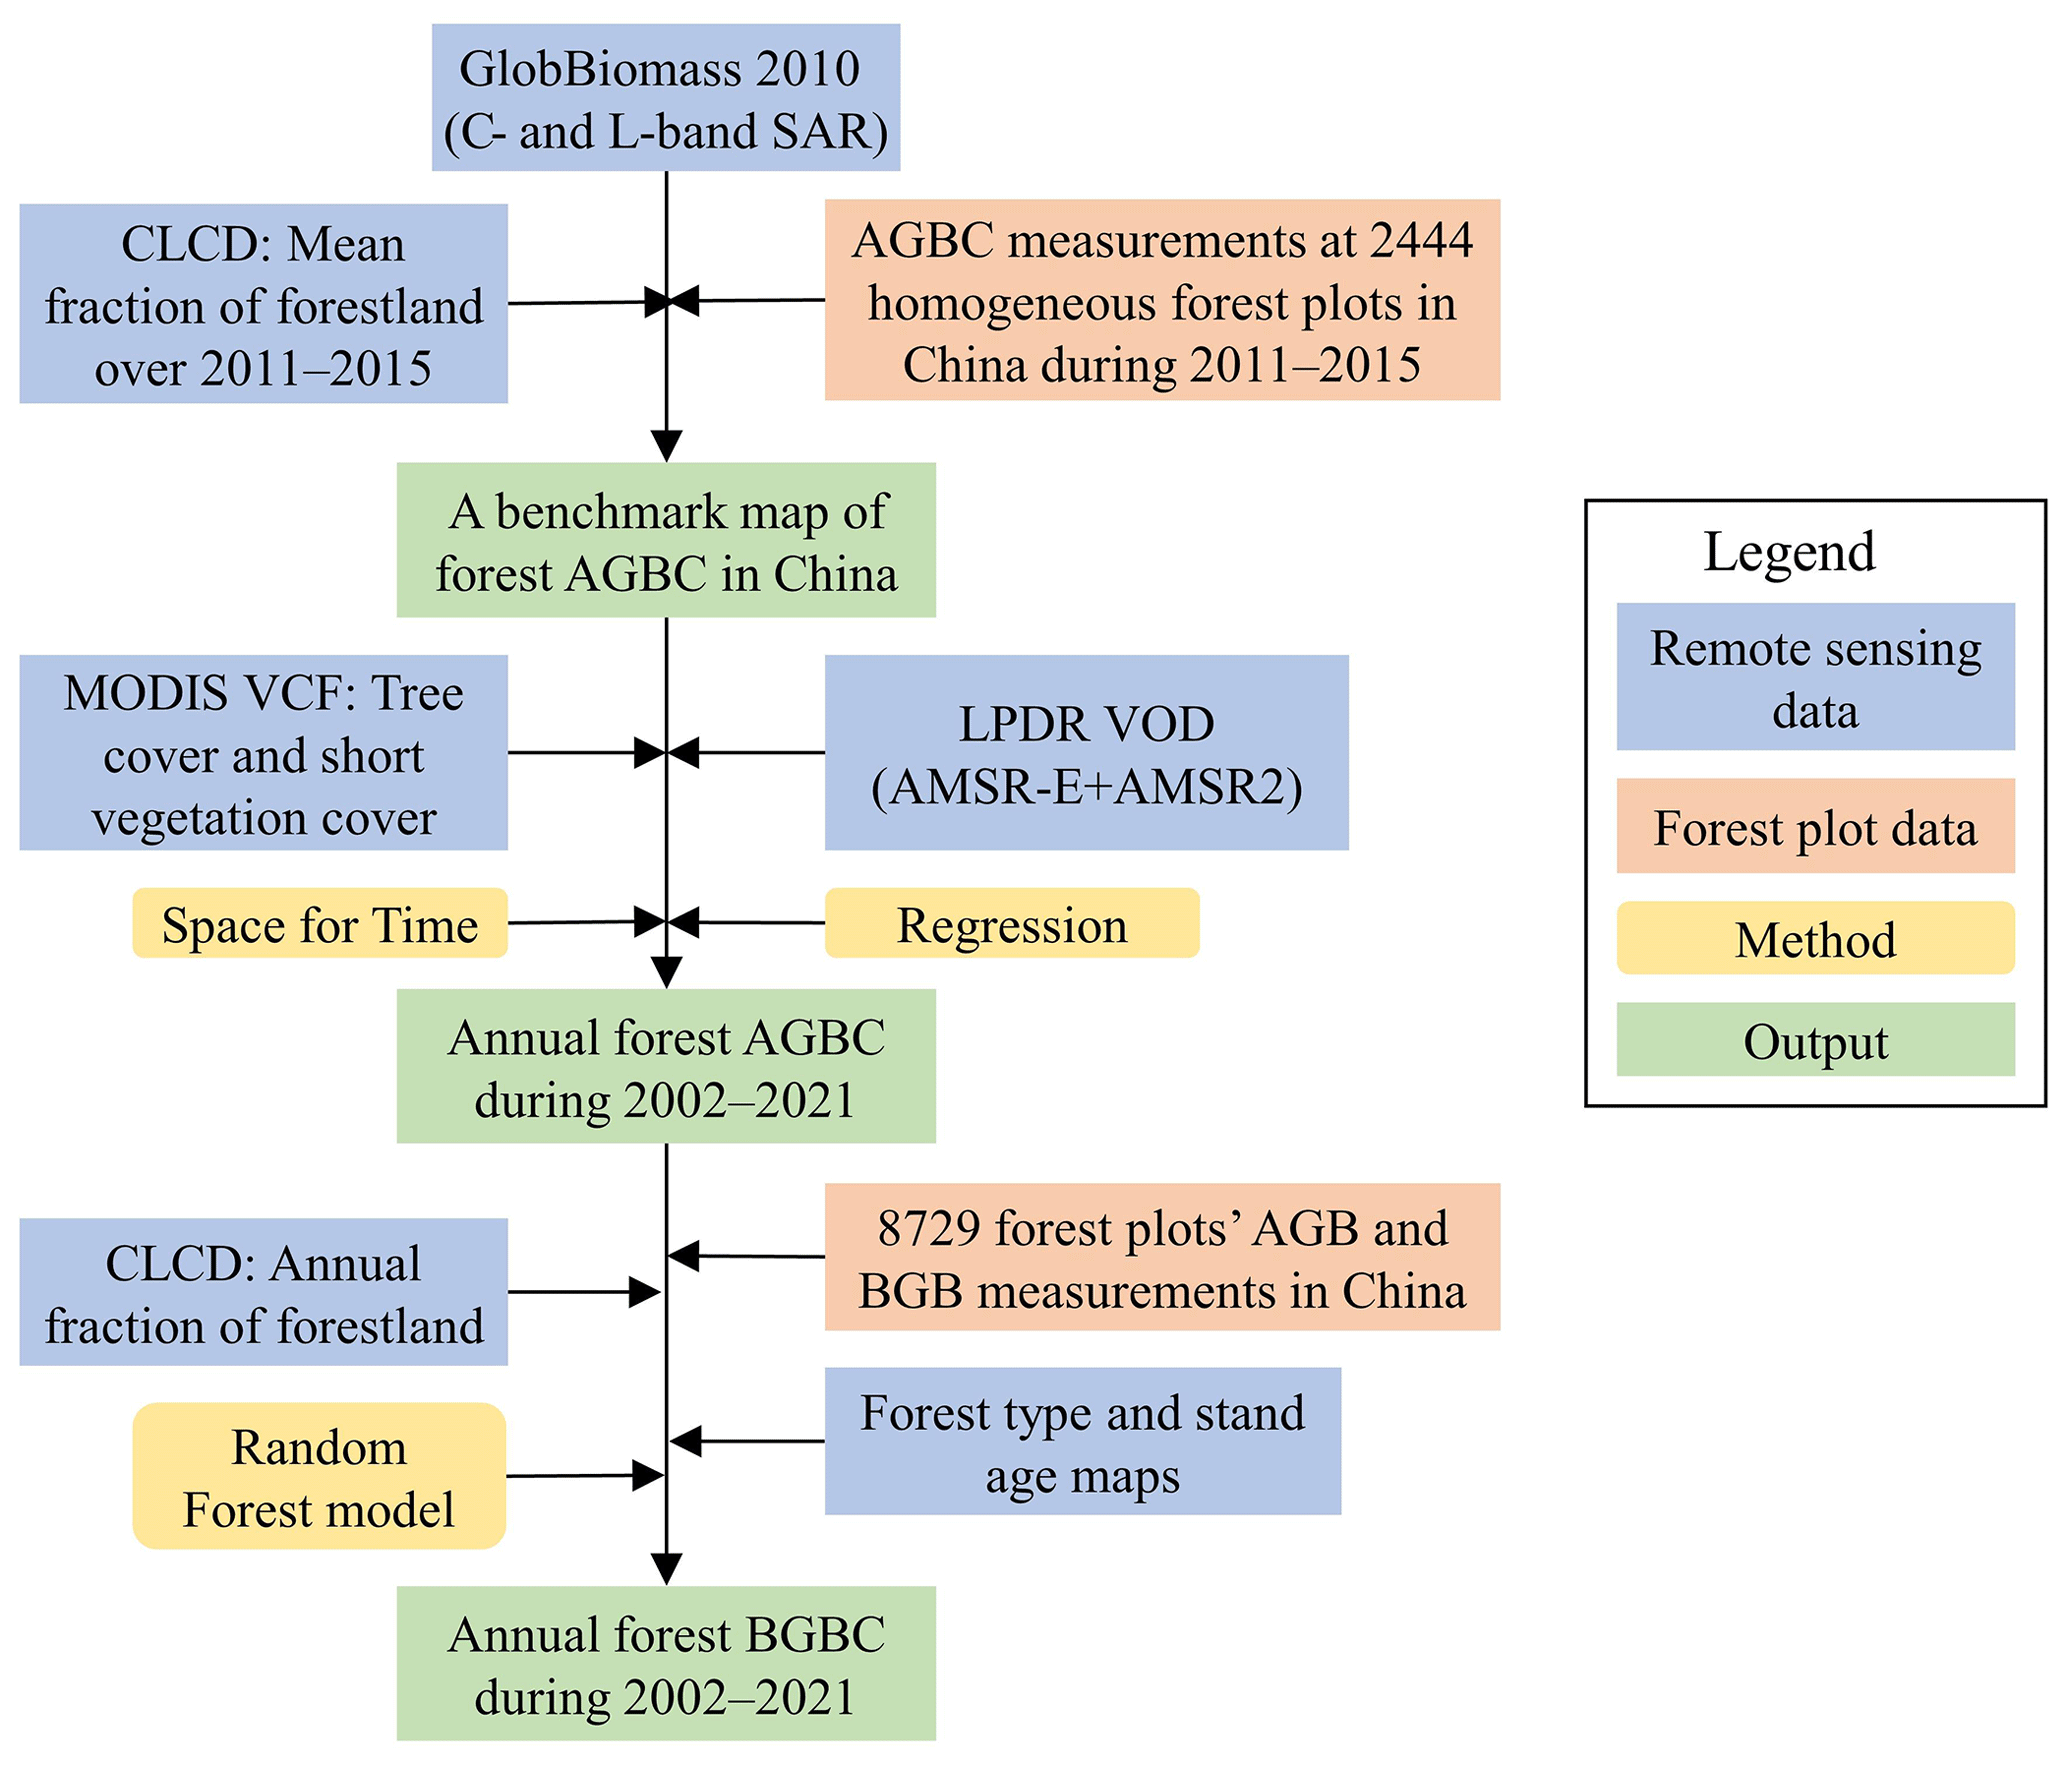
Figure 1Workflow of forest biomass carbon pool monitoring in China during 2002–2021. AGBC and BGBC are the aboveground and belowground biomass carbon, VCF is the vegetation continuous field, LPDR VOD is the global land parameter data record vegetation optical depth, and CLCD is the China land cover dataset.
2.1 A benchmark map of forest aboveground biomass carbon (AGBC) in China
By combining multiple satellite observations of SAR backscatter, including the L-band ALOS PALSAR (Advanced Land Observing Satellite Phased Array L-band Synthetic Aperture Radar) and C-band Envisat ASAR (Advanced Synthetic Aperture Radar) around the year 2010, the first global high-resolution (100 m) forest AGB dataset, GlobBiomass 2010, was published through the European Space Agency (ESA)'s Data User Element (DUE) project (Santoro et al., 2021), whose relative root mean square error (RMSE) was below 30 % (Mialon et al., 2020). Apart from GlobBiomass 2010, another high-resolution (30 m) forest AGB for China was produced by relating the (lidar)-derived ICESat/GLAS (Ice, Cloud and land Elevation Satellite/Geoscience Laser Altimeter System) footprint AGB to various variables derived from Landsat optical images (Huang et al., 2019). Because the ICESat data in 2006 were applied as the training target of the random forest model, Huang et al. (2019)'s dataset refers to the AGB status in 2006. According to a recent validation study, GlobBiomass and Huang et al. (2019)'s AGB performed the best among all existing AGB datasets in China (Chang et al., 2021). Mean forest canopy heights and tree coverage are also good indicators of the spatial pattern of forest biomass. The high-resolution (30 m) forest canopy height map for China was developed by interpolating the ICESat-2 and Global Ecosystem Dynamics Investigation (GEDI) data in 2019 through a neural network (Liu et al., 2022), while the tree cover map at the same resolution was derived from cloud-free growing season composite Landsat 7 data in around 2010 (Hansen et al., 2013). We resampled GlobBiomass from 100 m resolution (∘) to ∘ (approximately 90 m) and averaged Huang et al. (2019)'s AGB map, canopy height map and tree cover map to the same resolution.
A reviewable, consistent ecosystem carbon stock inventory was conducted in China between 2011 and 2015 (Tang et al., 2018). We requested the AGB carbon stock (AGBC) data at more than 5000 30 × 30 m sized forest plots from the authors. Due to the scale mismatch between the maps of biomass, canopy height or tree cover and the field measurements, we dropped out the data within the ∘ resolution grids in which the standard deviation of tree cover was greater than 15 % (according to Chang et al., 2021), leaving 2444 homogeneous forest plots remaining (see Fig. 2 for the spatial distribution of these forest plots and Fig. S1a–b in the Supplement for the cumulative frequency curve and histogram of the AGBC records). The AGBC records in these forest plots were further multiplied by the mean fraction of forestland over 2011–2015 in the corresponding grid, which was computed from the annual 30 m resolution China land cover dataset (CLCD) (Yang and Huang, 2021). By comparison, GlobBiomass 2010 AGB matches the best with the grid-scale forest AGBC derived from plot measurements, with a correlation coefficient (CC) of 0.50, followed by tree cover (CC = 0.42), the product of canopy height and tree cover (CC = 0.38) and, finally, the canopy height (0.27) and Huang et al. (2019)'s AGB (0.25). Therefore, to obtain an improved benchmark map of forest AGBC in China for the period of 2011–2015, we chose the GlobBiomass 2010 dataset as our basis and calibrated it against the in situ observation-based, grid-scale forest AGBC. To build an equation for the calibration, we divided the grid-scale AGBC values into 16 equidistant subranges (0–15, 15–30, …, 225–240 tC ha−1), calculated the median of grid-scale AGBC values that are within each subrange and then the median of GlobBiomass AGB values in the corresponding grids. According to previous studies, an exponential function would be suitable for calibrating the GlobBiomass map in a region such as China (Mialon et al., 2020). After the calibration, we averaged the benchmark AGBC map from to ∘ (approximately 1 km) to further reduce the uncertainties.
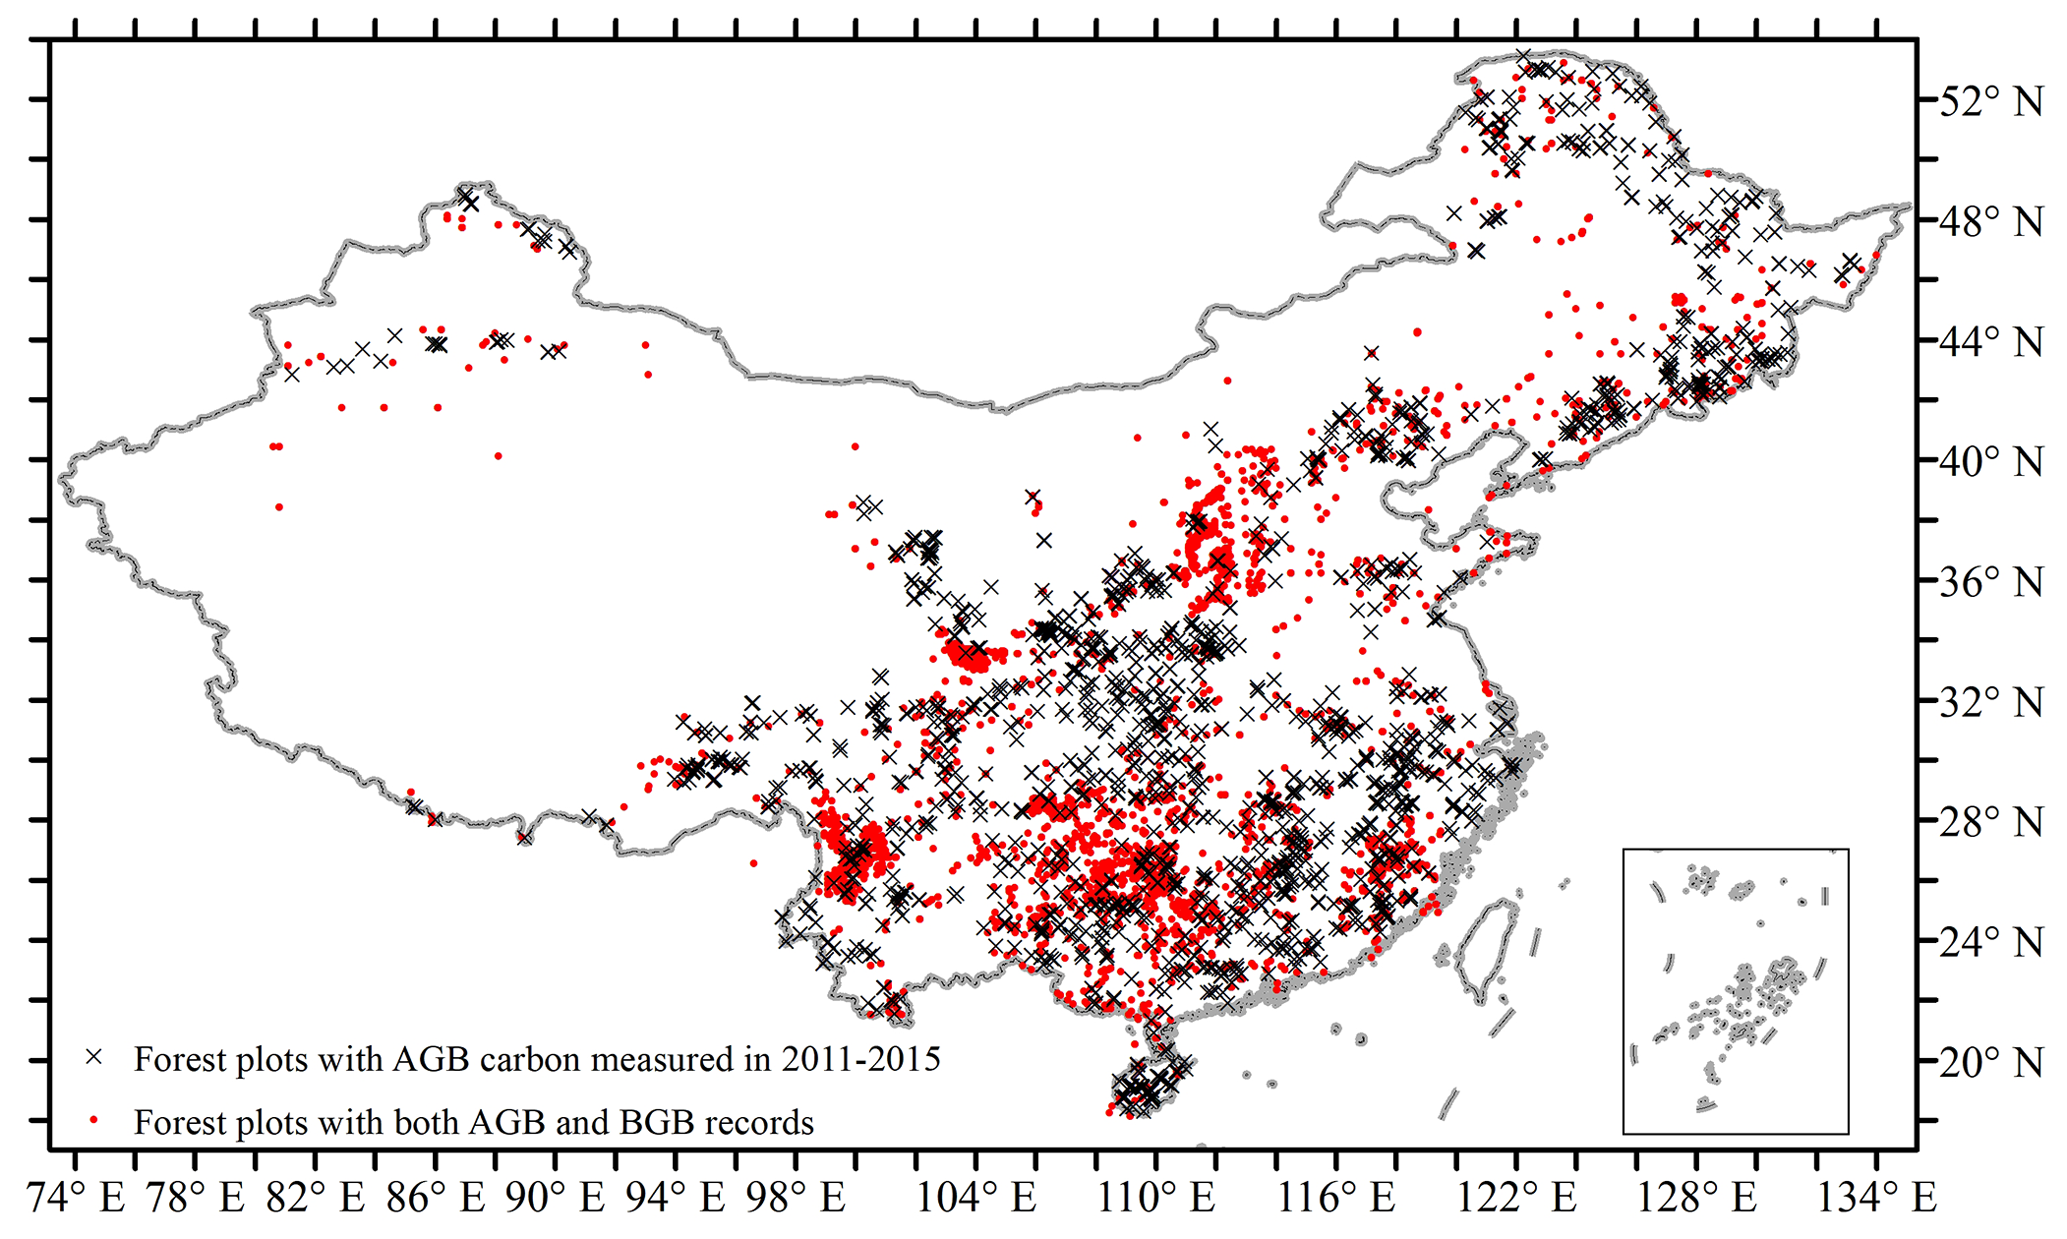
Figure 2The spatial distribution of (1) 2444 homogeneous forest plots with aboveground ground biomass carbon stock measured between 2011 and 2015 and (2) 8182 forest plots with both above- and belowground biomass records collated in this study.
2.2 Temporally continuous forest AGBC mapping during 2002–2021
Because the benchmark AGBC was mapped based on SAR data, the spatial pattern accuracy is guaranteed, but the temporal coverage is limited to just a few years. Hence, to create a forest AGBC time series over the past 20 years, we integrated the benchmark AGBC with long-term continuous optical and passive microwave remote sensing data.
The spatial resolution of optical remote sensing is higher and is thus preferred in this study. By adopting the MODIS vegetation continuous field (VCF) data (MOD44B v061), which includes three ground cover components, we obtain the percent tree cover, percent non-tree vegetation (i.e. short vegetation) cover and percent non-vegetated area (DiMiceli et al., 2022). We first calculated the mean tree cover (hereinafter TCmean) and short vegetation cover (hereinafter SVCmean) during 2011–2015 and resampled them from 250 m to ∘, which is the same resolution as the benchmark AGBC map for 2011–2015. Because the canopy heights of trees are usually similar within a small area, the regional AGBC per TCmean can be assumed to be the same, which is referred to as the “homogeneous assumption” hereinafter. Accordingly, for each grid, we searched the TCmean, SVCmean and AGBC within a 3 × 3 window (∘ × 1/40∘) and then regressed the AGBC values in nine grids against both TCmean (the primary, or key, predictor of AGBC) and SVCmean (assumed as a supplementary predictor) linearly. Specifically, when the regression coefficient of SVCmean was negative or the fitting efficiency was low (R2<0.5; significance p value > 0.05), we excluded the supplementary predictor from the regression and only explored the linear relationship between TCmean and AGBC. Afterwards, if the regression between TCmean and AGBC was still invalid, we enlarged the searching window size to 5 × 5, then 7 × 7 and, finally, 9 × 9 until the regression and the coefficients became valid. Then, the grid annual AGBC from 2002 to 2021 can be estimated from the TC or both the TC and SVC in each year, following the regression results. If the regression failed even if the window size reached 9 × 9, we stopped expanding the searching window to avoid the homogeneous assumption being invalid. In those grids, following a previous study (Xu et al., 2021), we divided the estimated AGBC by the TCmean during 2011–2015 and then multiplied the TC in each year to obtain the AGBC time series. The above method utilized spatial information to estimate the temporal variation, and can thus be referred to as the “space-for-time” method.
Long-term continuous microwave VOD can also reflect forest biomass changes, although the relationship was nonlinear (Jackson and Schmugge, 1991; O'Neill et al., 2021; Liu et al., 2015; Wigneron et al., 1995). We selected the global land parameter data record (LPDR) v3, 0.25∘ resolution, VOD product, which was generated using similar calibrated, X-band brightness temperature retrieved from the Advanced Microwave Scanning Radiometer for Earth Observing System (AMSR-E) and the Advanced Microwave Scanning Radiometer 2 (AMSR2; Du et al., 2017). As revealed by a recent evaluation study, LPDR VOD is better correlated with AGB than other long-term VOD products, especially in less-vegetated areas (Li et al., 2021). Because X-band VODs are still more sensitive to canopy cover than stem biomass, and there is a data gap between October 2010 and June 2011, while the plot investigations were all conducted in summer (Tang et al., 2018). We averaged the VOD data from mid-July (the 206th day) until the end of September (the 274th day) in each year to represent the annual AGB status. We also aggregated the benchmark AGBC map and the VCF data (TCmean and SVCmean) to 0.25∘ resolution. After each round of searching, we applied the shape language modelling algorithm (D'Errico, 2022), to fit the nonlinear but monotonous relationship between AGBC and VOD values within the searching window, and then fitted the bivariate linear regression between AGBC and VCF. If the nonlinear regression between AGBC and VOD is valid, and the R2 is superior to the regression between AGBC and VCF data, then the LPDR VOD data are expected to outperform VCF in predicting the interannual AGBC changes in the corresponding 0.25∘ grid. Therefore, in these areas, we calibrated the VCF-derived high-resolution (∘) annual AGBC by incorporating the ratio between the VOD-derived 0.25∘ AGBC and the aggregated VCF-derived AGBC in that year.
2.3 Forest belowground biomass carbon (BGBC) mapping during 2002–2021
This study mapped belowground forest biomass carbon (BGBC) following the random forest (RF) model approach (Huang et al., 2021). To reveal the forest above- and belowground biomass allocation rules in China, this study collated both AGB and BGB records at 8729 forest plots throughout China, which were obtained using allometric equations or clear-cutting methods from published papers, including Luo (1996), Luo et al. (2014), Guo and Ren (2014) and Wang et al. (2014). Because forest stand age and tree species (forest type) information are also available at 8182 plots, while the climatic backgrounds are available from the WorldClim v2.1 dataset (Fick and Hijmans, 2017), the forest plot AGB, forest type (hereinafter FOR_T), stand age, mean annual temperature (MAT), temperature seasonality (standard deviation of monthly temperature × 100; abbreviated as Tsea), mean annual precipitation (MAP) and precipitation seasonality (coefficient of variation in monthly precipitation; Psea) were applied as predictors of the forest plot BGB. For simplicity, we distinguished all forests into the following five types: evergreen broadleaf forest (EBF), deciduous broadleaf forest (DBF), evergreen needleleaf forest (ENF), deciduous needleleaf forest (DNF), and mixed forest (MF). Using the data records at these 8182 plots (see Fig. 2 for the locations of these forest plots and Fig. S1c–f for the cumulative frequency curves and histograms of the AGB and BGB data), we trained 10-fold RF models using MATLAB R2021a. The number of regression trees was set to 500.
Because the ∘ resolution grids in which forest AGBC data were available are often mixed with forestland and some other land cover types, e.g. waterbodies, bare ground and croplands, we converted the annual grid-average AGBC into the AGBC per area forestland by incorporating the annual fraction of forestland computed from the CLCD at 30 m resolution. Considering the potential uncertainties in the forestland fraction and the inclusion of shrub or herbaceous plant AGB in the SAR-derived AGB, we only calculated the annual AGBC per area forestland in grids that were dominated by forestland (forestland fractions were consistently over 50 %). In these forestland grids, we simulated the forest BGBC per area forestland during 2002–2021 by inputting the estimated annual AGB (approximately 2 times the AGBC) per forestland, annual forest type map derived from the ESA Climate Change Initiative's land cover classification dataset (Li et al., 2018), forest stand age (Besnard et al., 2021) and climatic background variables into the RF model. Afterwards, we multiplied the simulation results in every forestland grid with the annual forestland fractions to obtain the forest BGB and BGBC (0.5 × BGB) time series. Finally, for grids with forests, but which are not dominated by forestlands, we sequentially searched for at least five valid RSR values (the ratio of forest BGBC to AGBC) nearby (Y. Chen et al., 2019) and then multiplied the annual forest AGBC in the grid with the median of nearby RSR values in each year to estimate the annual forest BGBC.
2.4 Evaluation and assessment
We compared the interannual trend of forest biomass carbon calculated in this study against that of existing global/regional long-term woody biomass datasets, including the well-received global long-term terrestrial biomass data between 1993–2012, which were developed mainly based on a long-term integrated VOD dataset (Liu et al., 2015), and an updated woody biomass dataset covering 2001–2019, whose long time series was derived from optical remote sensing data (i.e. MODIS VCF dataset; Xu et al., 2021).
To justify the random forest models for BGBC predictions, we drew partial dependence plots (PDPs) in MATLAB R2021a to show the marginal effect that one predictor has on the training target (e.g. BGB at forest plots; Hastie et al., 2009). Here, for each predictor, we excluded the extreme values (the lowest 1 % and the highest 1 %) before calculating the corresponding PDP to avoid roughly extending the PDP lines to data-scarce areas. We performed 10-fold RF training to derive the mean PDP values and the standard deviations.
3.1 Evaluation of forest AGBC and BGBC estimation
First, according to Fig. 3a, an exponential function, y = 1.63 × x0.73, can fit the relationship between the actual grid-scale forest AGBC over 2011–2015 (y) and the AGB values predicted by GlobBiomass 2010 (x). Hence, this function was applied to derive the benchmark map of forest AGBC across China.
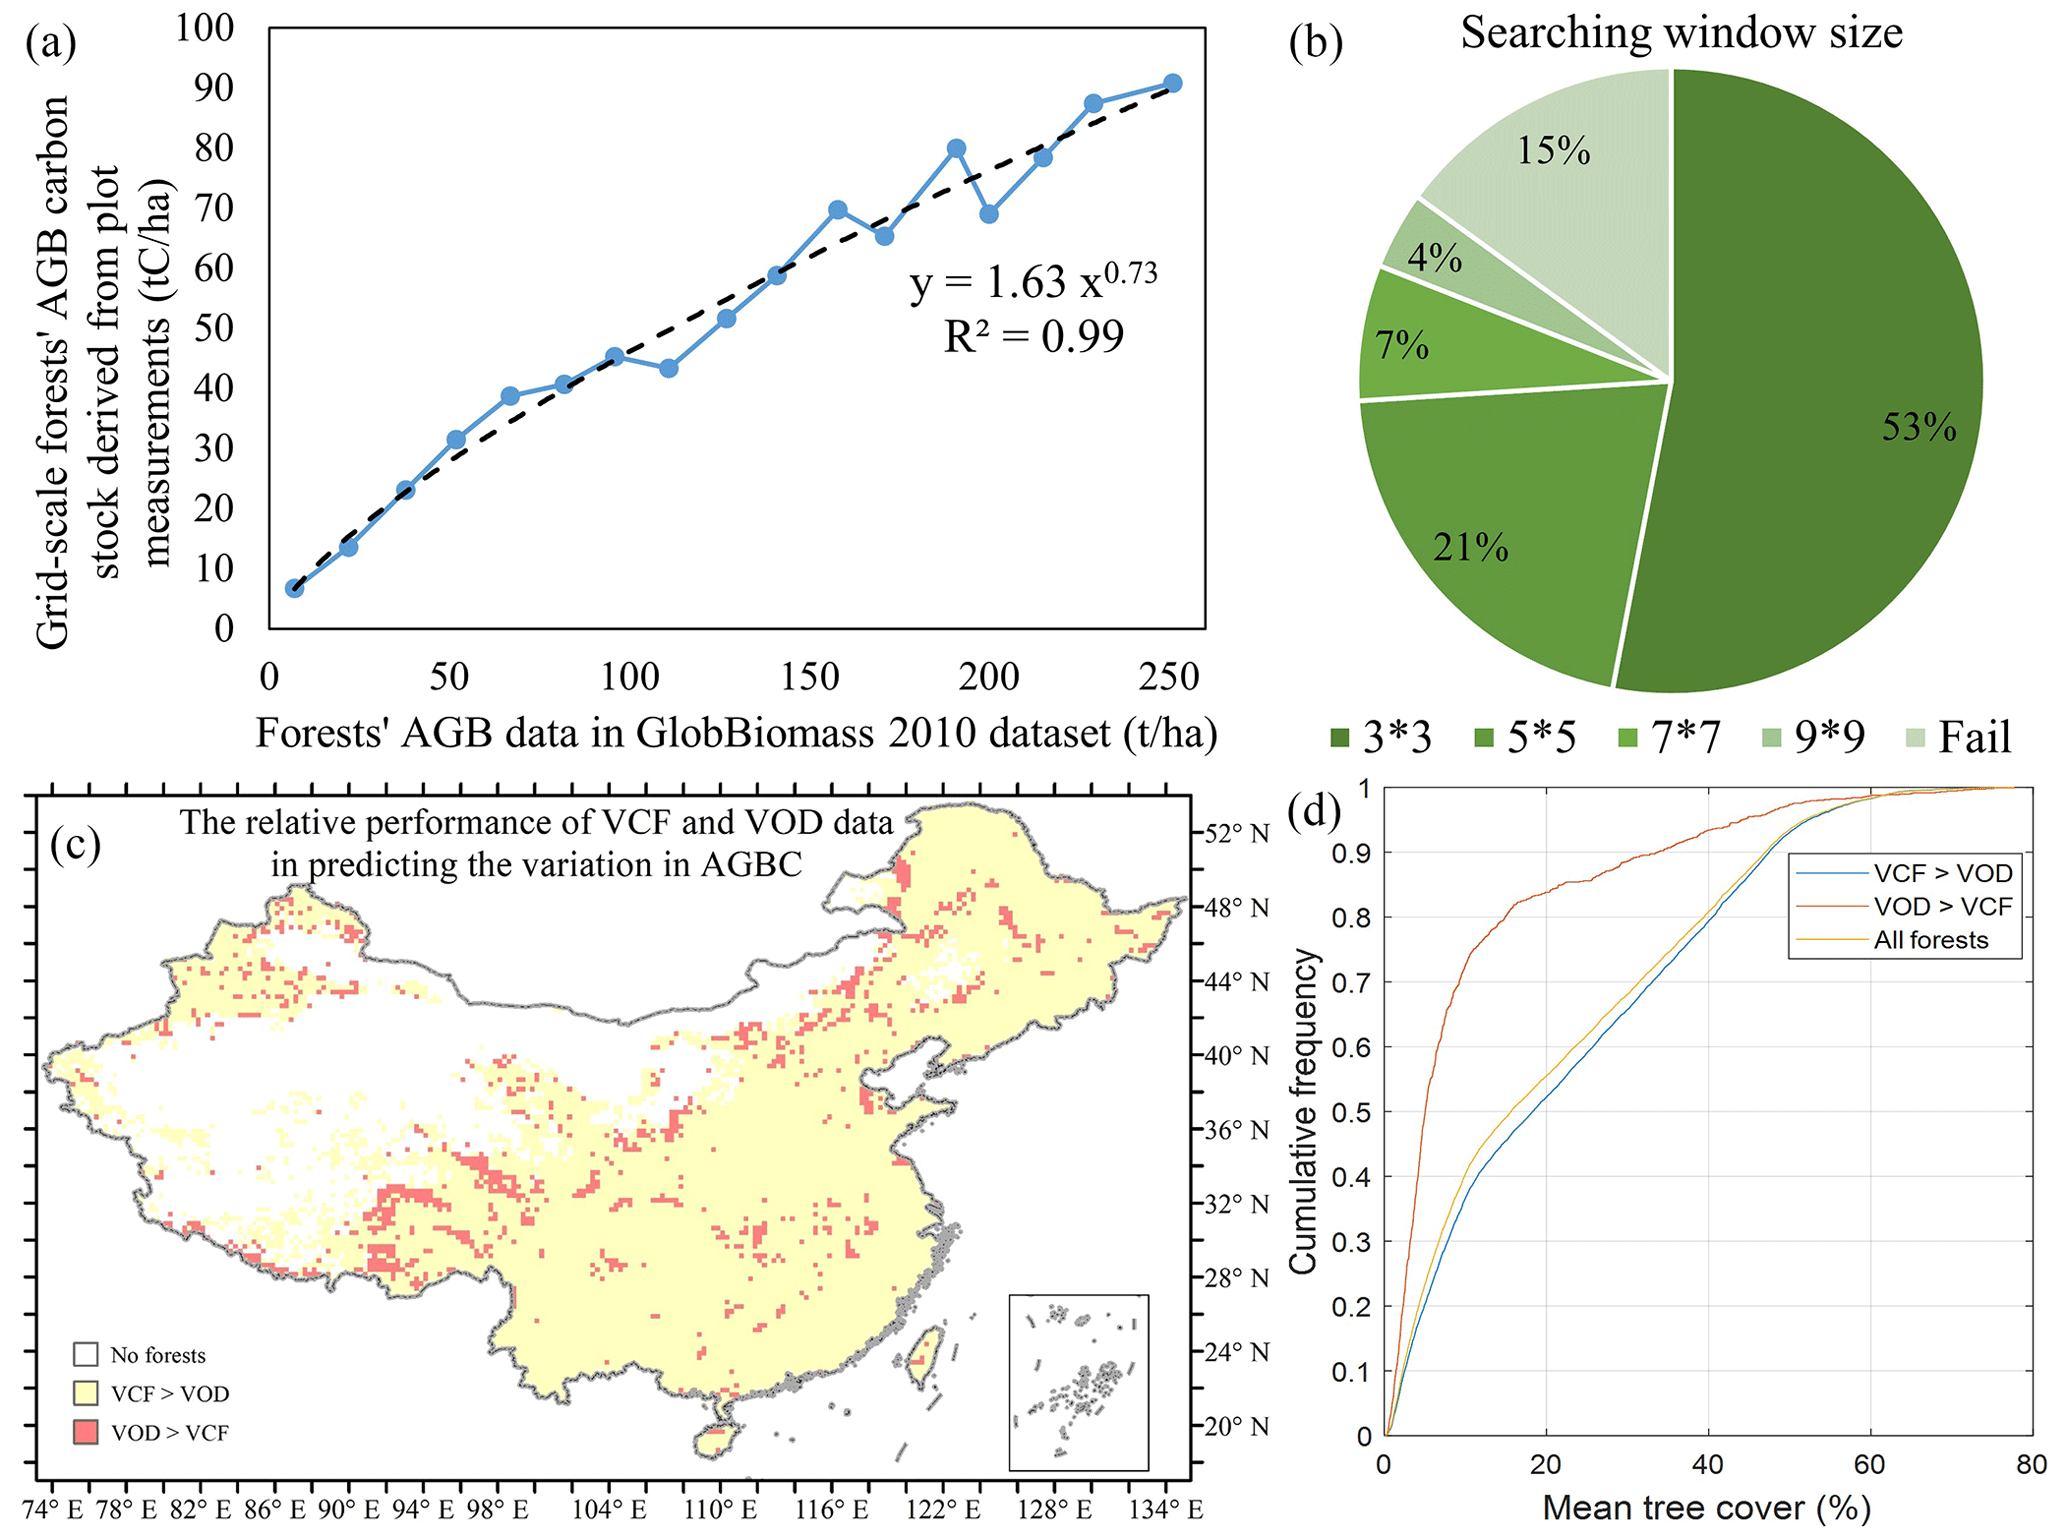
Figure 3Evaluation of the forest AGBC and BGBC mapping in this study. (a) The regression relationship between the grid-scale forest AGB carbon stock derived from plot measurements during 2011–2015 and the GlobBiomass AGB dataset for 2010. (b) The minimum searching window sizes of every ∘ grid when the spatial variation in MODIS VCF was applied as the predictor of AGBC changes. (c) The spatial pattern of the relative performances of MODIS VCF and LPDR VOD data in predicting the variation in AGBC. (d) Comparison of the mean tree cover between the grids where VOD data were more suitable for predicting the variation in AGBC and the grids where VCF data were the better predictor.
Second, when using the spatial information of tree cover and short vegetation cover to estimate the temporal variation in AGBC in each grid, the spatial searching window was at its minimum of 3 × 3 in most (53 %) grids with forests. Across China, the temporal extension of AGBC in only 15 % of all grids with forest cannot be achieved, even when the searching window was enlarged to 9 × 9 (Fig. 3b).
Next, as shown in Fig. 3c and d, the grids in which the LPDR X-band VOD performed better than MODIS VCF in predicting the temporal change in forest AGBC are usually located in regions with low tree cover. These grids account for just 10.4 % of all grids with forests and may suffer from high uncertainty within the optical-based variation in tree cover. Therefore, microwave-based VOD is supposed to be more suitable for estimating the forest AGBC changes in these regions.
The RF model designed for forest plot BGB estimation (see Sect. 2.3) achieved a predictive R2 of 0.89 ± 0.02, while the RMSE was 6.3 ± 0.5 t ha−1. AGB explained 53 % of the variation in BGB among different plots. Long-term climate backgrounds, i.e. mean annual temperature, temperature seasonality, annual precipitation and precipitation seasonality accounted for 8 %, 6 %, 8 % and 7 %, respectively. Forest type and stand age also contributed 12 % and 8 % to the training efficiency, indicating that the effects of these factors are nonnegligible. The selection of predictors of BGB basically followed the existing knowledge (Huang et al., 2021), and the seasonality of temperature and precipitation made sense in the prediction (see Text S1 in the Supplement). On the other hand, although previous studies incorporated many edaphic factors as predictors of BGB (Huang et al., 2021), by comparing the training efficiencies with whether these edaphic factors are incorporated or not, we could justify the reasonability of our simplified set of predictors (Text S1).
According to the collected woody plot data, AGB is a key driver of BGB (Fig. 4). Yet, RSR changes among different forest growth stages, decreasing in general, as previously reported (Mokany et al., 2006). The overall negative impact of mean temperature on BGB or RSR agrees with the mechanism that higher heat promotes nutrient accessibility (Luo et al., 2012; Ma et al., 2021) and increases the turnover rates of roots at a higher magnitude than stems (Reich et al., 2014). The U-shaped relationship between precipitation and belowground biomass allocation follows the optimal biomass allocation theory because arid climates promote root extension, yet too heavy rainfall reduces nutrient availability through leaching and dilution effects (Luo et al., 2012). Other factors, including temperature seasonality, precipitation seasonality and forest type, have supplementary effects on biomass allocation (Fig. S2).
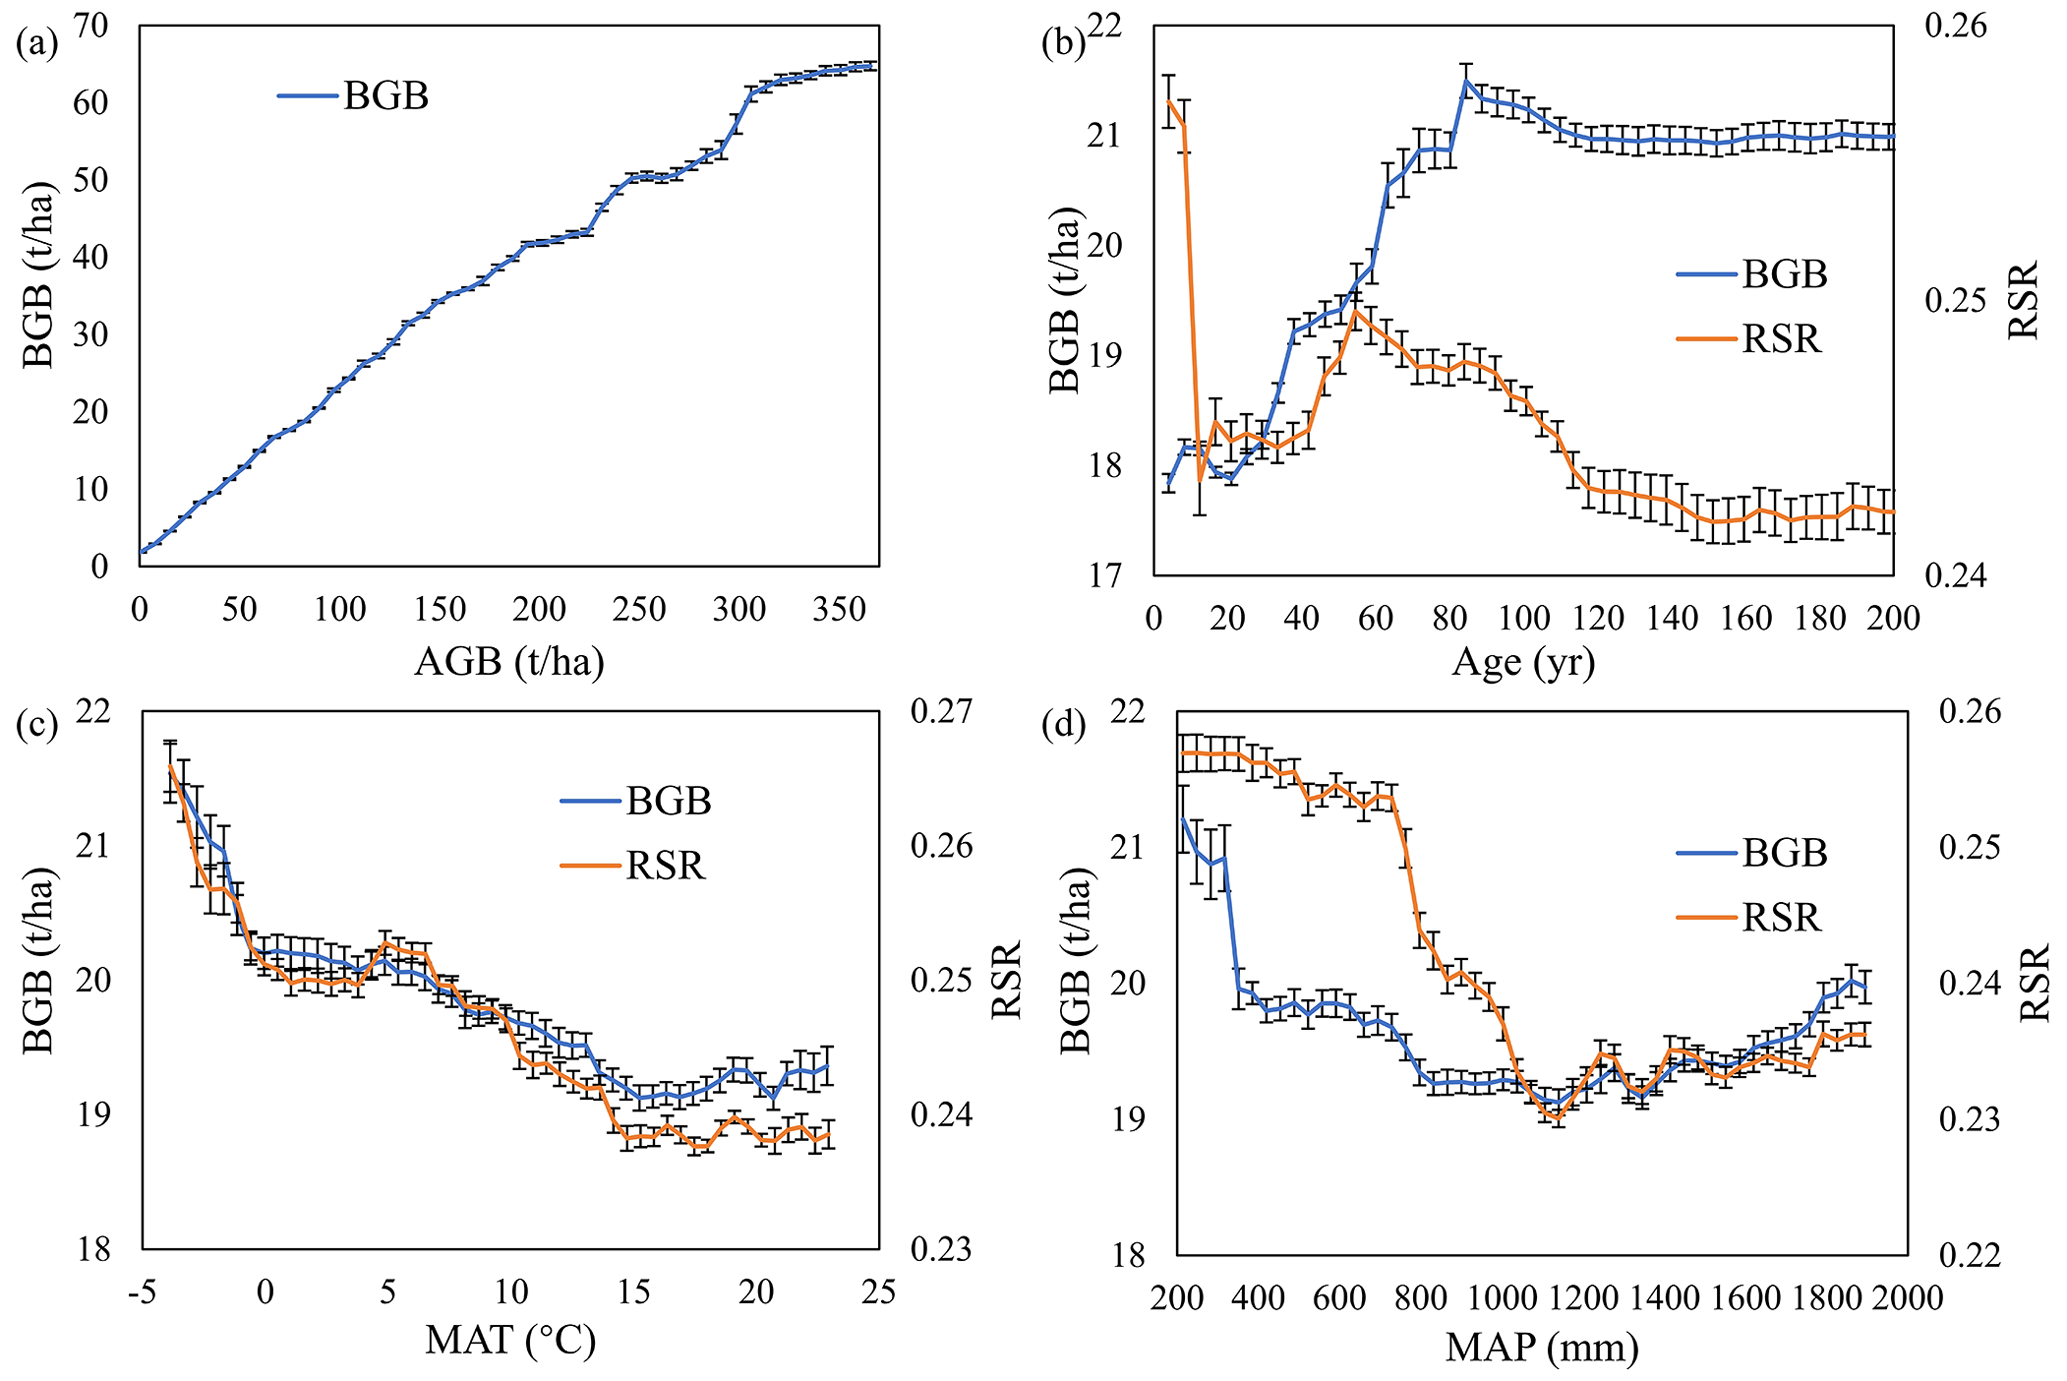
Figure 4Influence of key factors on forest belowground biomass (BGB) and root–shoot ratio (RSR) in China. Subfigures (a–d) show partial influences of (a) AGB, (b) stand age, (c) MAT and (d) MAP on BGB and RSR values of all forest plots. The error bars represent the standard deviations of the 10-fold training. We did not draw the PDP for the impact of AGB on RSR, since the dividend of RSR calculation is AGB.
3.2 Forest biomass carbon pool, allocation and change in China
Between 2002 to 2021, the forest above- and belowground biomass carbon (AGBC and BGBC) pools in China were 8.6 ± 0.6 and 2.2 ± 0.1 PgC, respectively (Table 1). The mean RSR for all forests was 0.25, basically equal to the global average (Huang et al., 2021). Separated by forest type, evergreen conifer forests (ENFs) occupy the highest biomass carbon pool per unit area, mainly because ENFs are mainly located in southwestern China and are more mature and natural (Yu et al., 2020; Zhang et al., 2017). Deciduous forests (DBF and DNF) in northern China (see Fig. S3 for the distribution of different forest ecosystems) harbour less biomass carbon but higher BGBC (Fig. 5a), which can be attributed to the higher RSR values (Table 1).
The forest biomass carbon stock in China increased at an average rate of 114.5 ± 16.3 TgC yr−1 (p<0.01) during 2002–2021, and the annual biomass carbon gains were the greatest from 2014 to 2015, reaching 736 TgC (Fig. 5b). Changes in AGB and BGB accounted for 81.9 % and 18.1 %, respectively, of the forest carbon stock gains over the past 20 years.
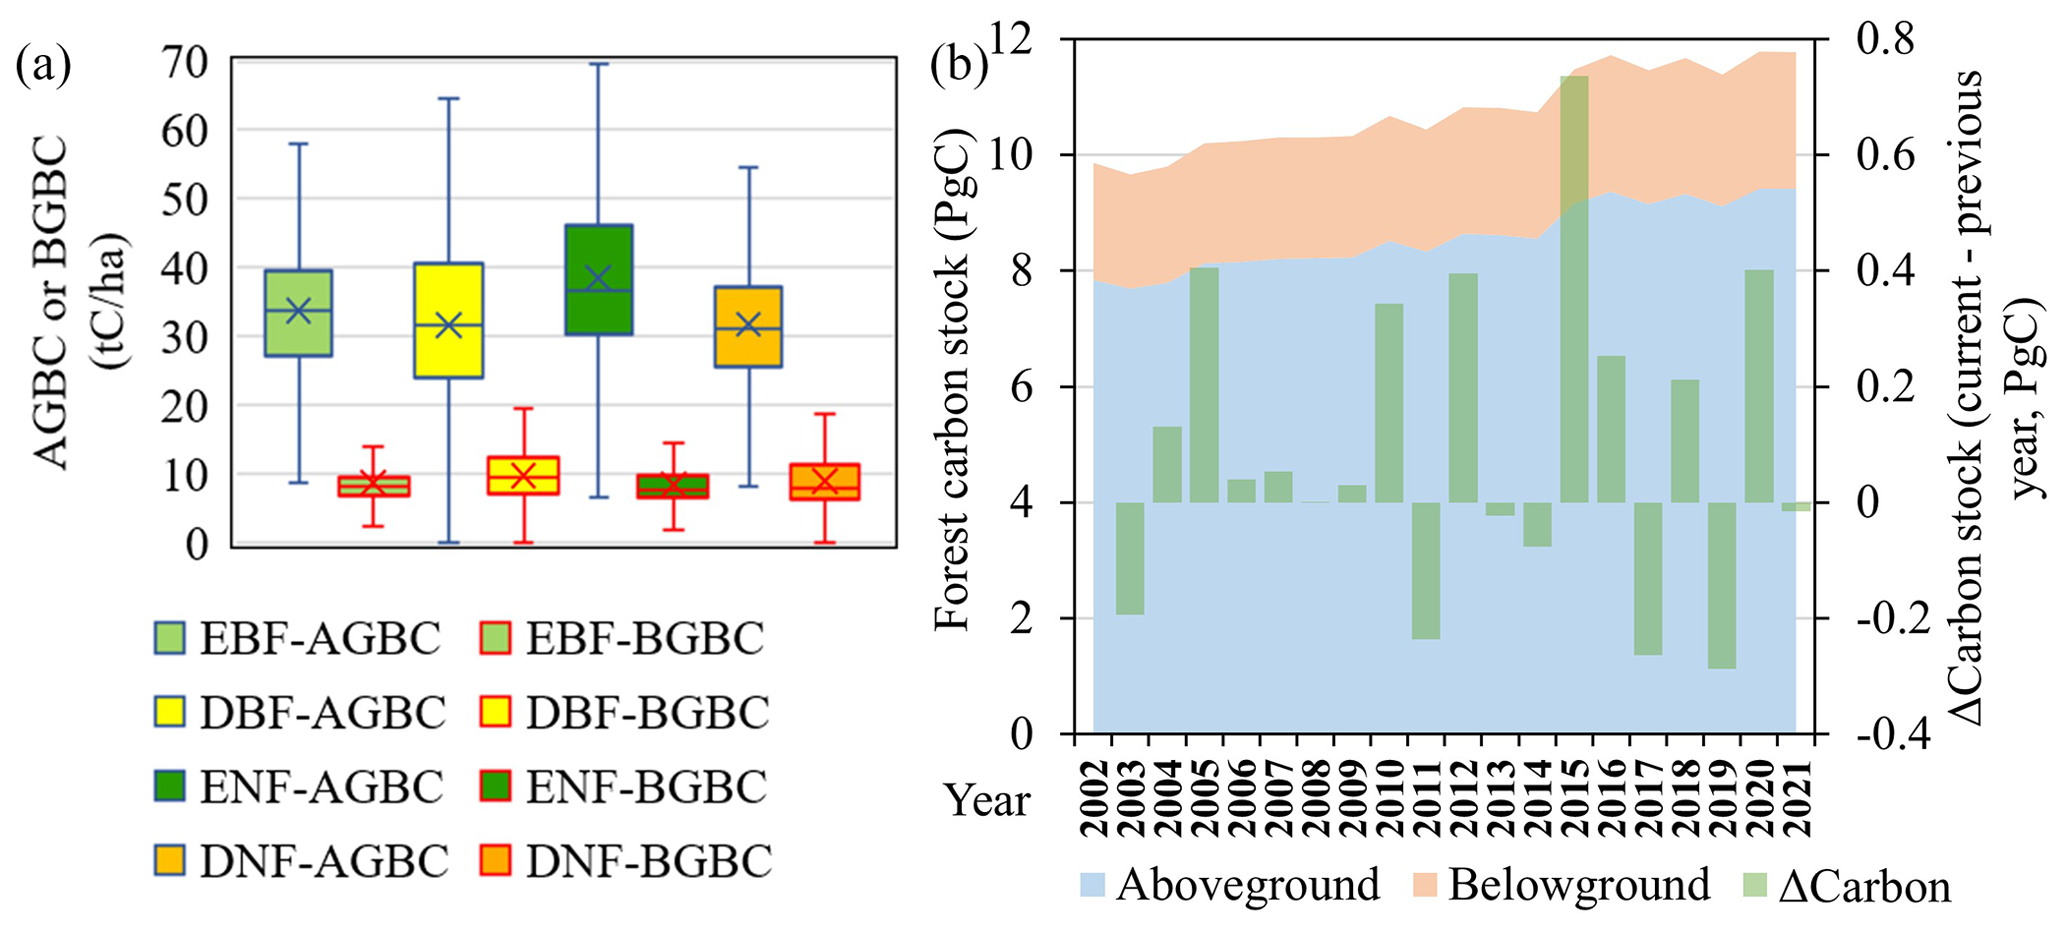
Figure 5Forest biomass allocation and biomass change in China during 2002–2021. (a) Aboveground biomass carbon (AGBC) and belowground biomass carbon (BGBC) density of different forest ecosystems in China. (b) The interannual changes in forest AGBC and BGBC in China. Total forest biomass carbon stock changes from the previous to the current year are represented by green columns.
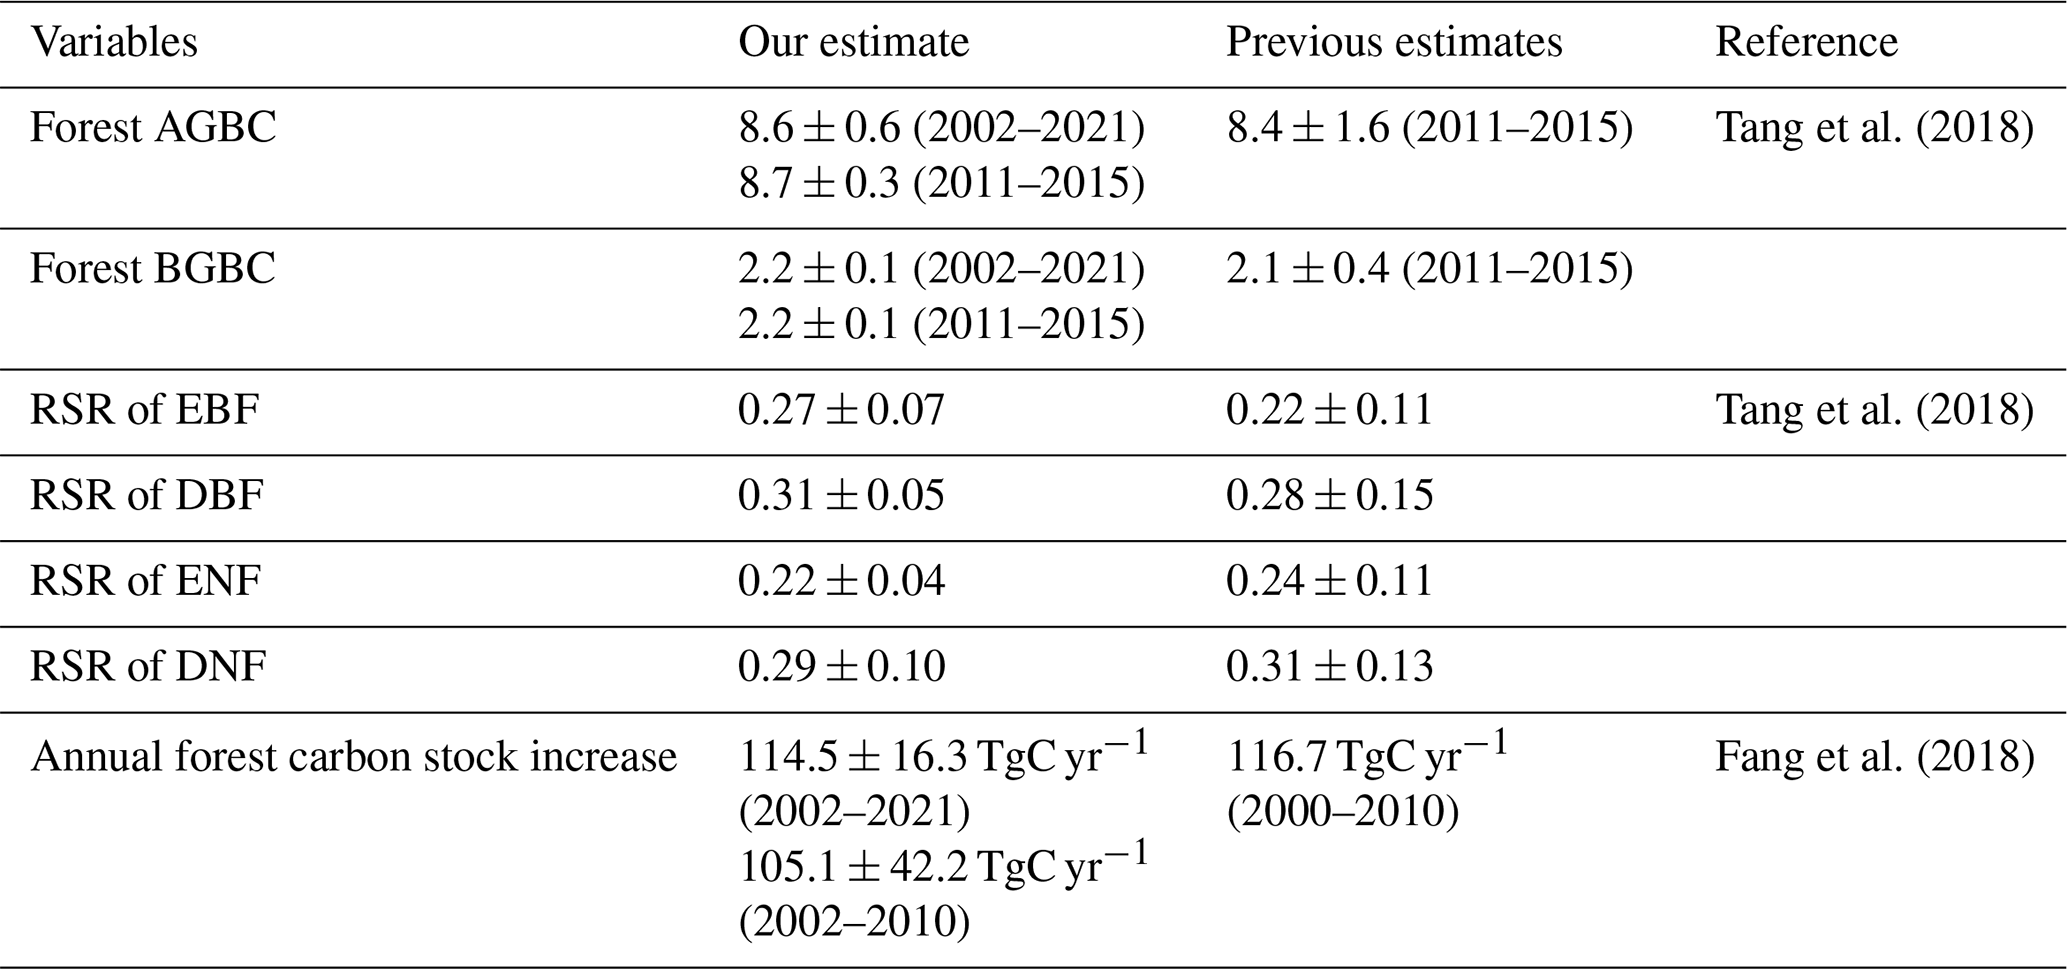
Our estimates of the forest biomass carbon pool, forest RSR and the recent interannual trend of forest biomass carbon are generally consistent with previous estimates based on massive field investigations (Table 1).
Table 1Agreement of the estimated various forest RSR and the trend of forest biomass carbon in China with existing studies.
3.3 Spatial pattern of the forest biomass carbon stock trend in China
The highest forest biomass carbon pools during 2002–2021 were observed in northeastern and southwestern China, especially South Tibet. Forest biomass carbon stocks were also high in the natural or semi-natural forests in the Qinling mountains, Hengduan Mountains, Hainan and Taiwan (Fig. 6a). Above- and belowground forest biomass allocation varies significantly among regions. RSR is highest in northeastern deciduous conifer forests and northern China's deciduous broadleaf forests but low in southern China (Fig. 6b). The strongest forest biomass carbon increases were found in central to southern China, including the Loess Plateau, Qinling mountains, southwestern karst region and southeastern forests. Slight declines in forest biomass carbon only occurred in some mature and natural forests, e.g. those in the Greater Khingan mountain, Hengduan Mountains and South Tibet (Fig. 6c). A total of 40.3 % of all forests in China showed significant biomass carbon stock gains over the past 20 years, whereas only 3.3 % of forests experienced significant biomass carbon losses (Fig. 6d).
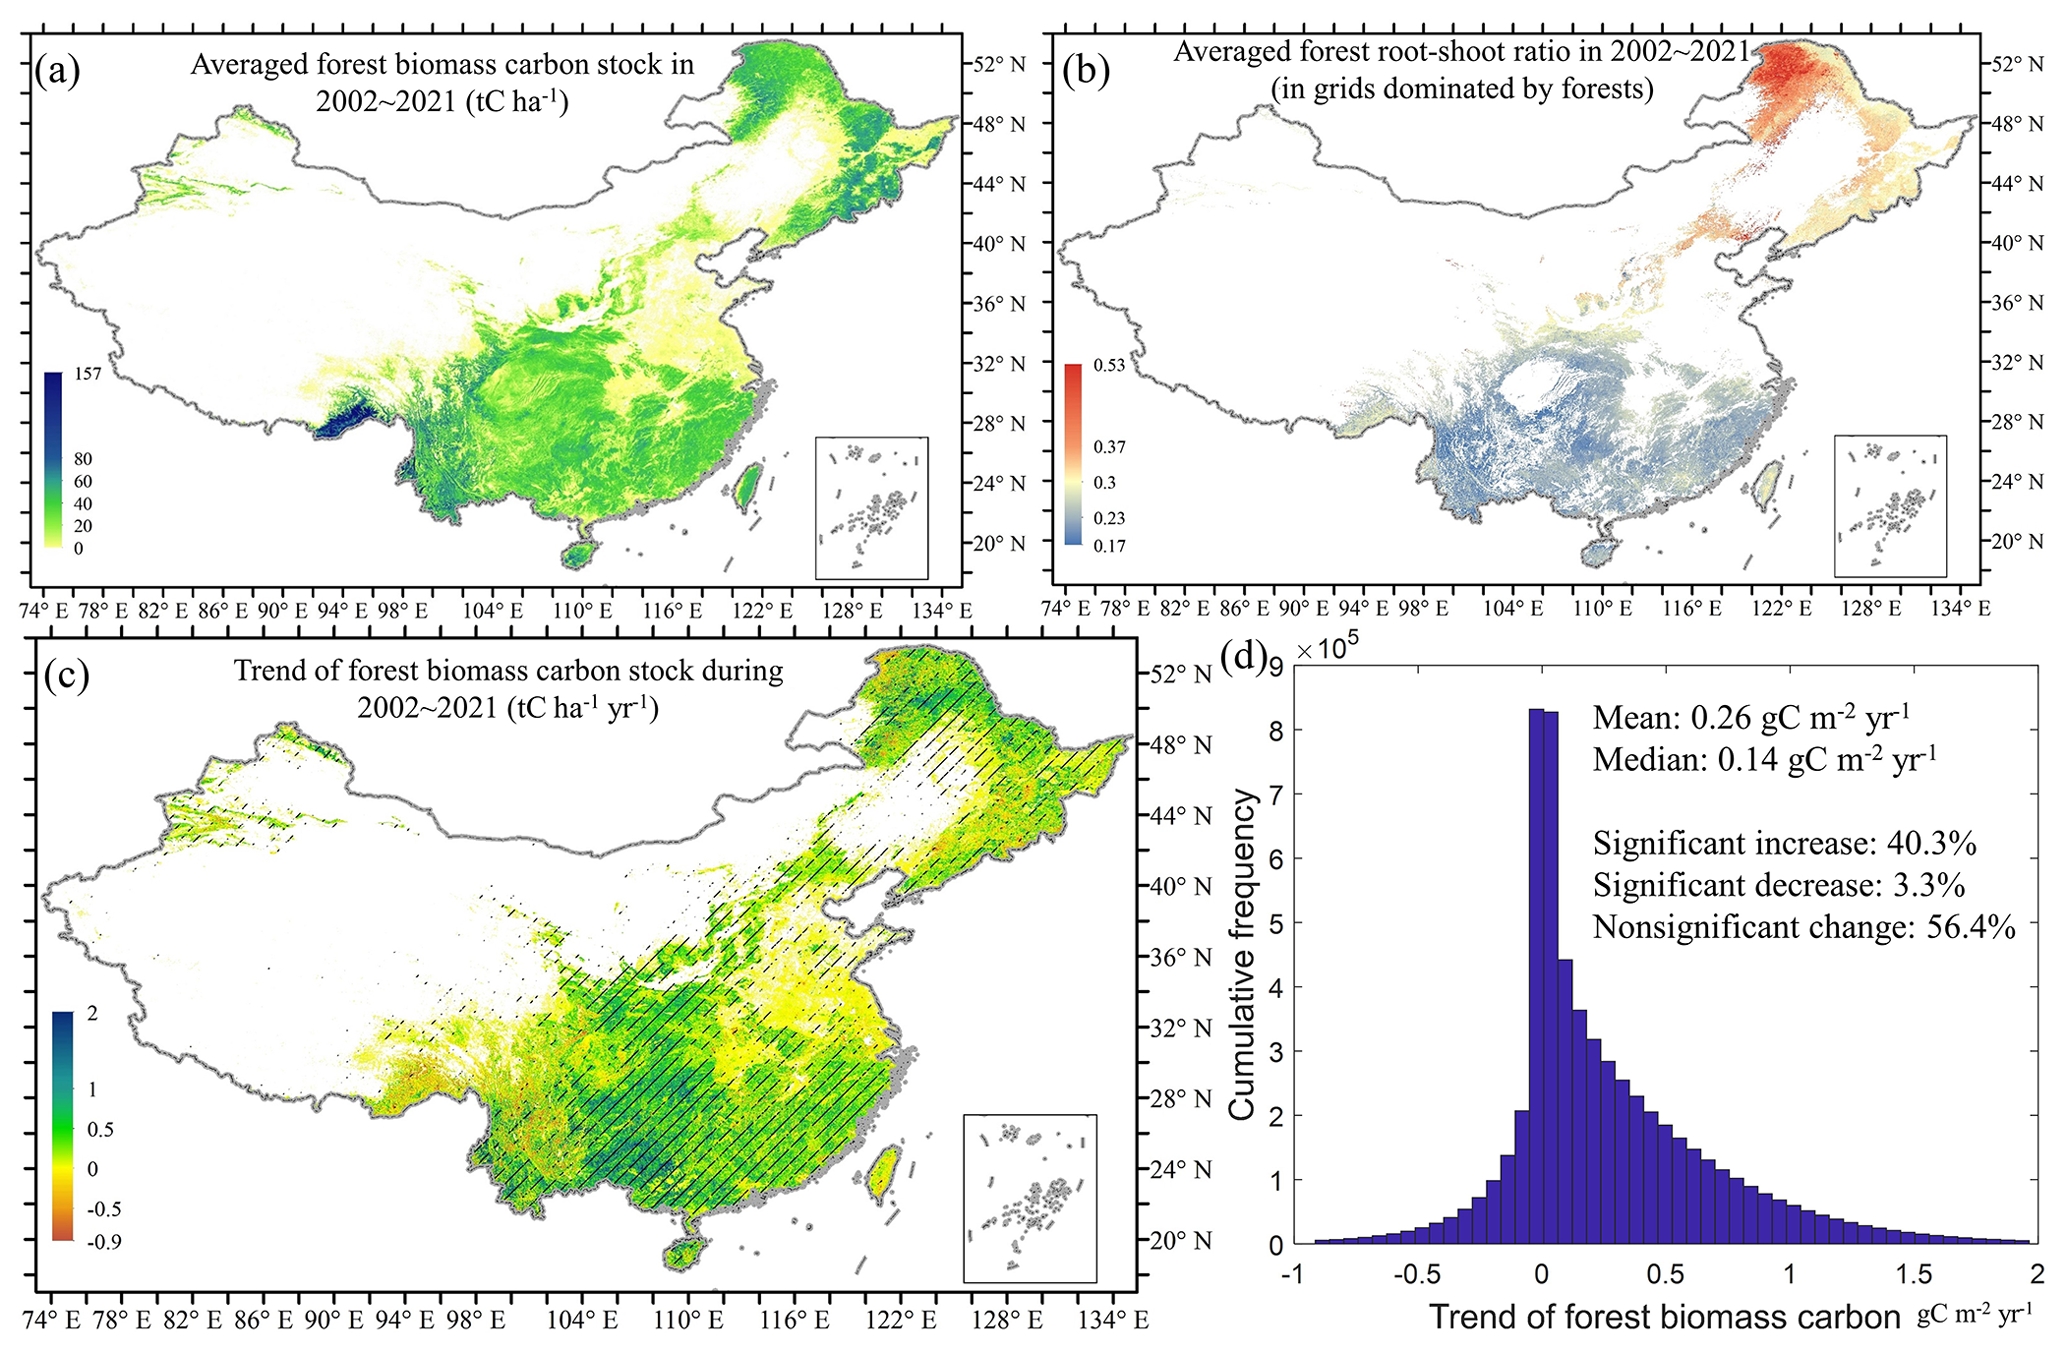
Figure 6Maps of forest biomass carbon pool, allocation and trend in China during 2002–2021. (a) Spatial pattern of the forest biomass carbon pool in China. (b) RSR of all forestland pixels. (c) Map of the forest biomass carbon stock trend from 2002 to 2021, with shaded areas representing statistically significant trends at the 95 % confidence level. (d) histogram and basic statistics of all forest biomass carbon stock trend.
Annual forest above- and belowground biomass maps in China between 2002 and 2021 are now available at https://doi.org/10.6084/m9.figshare.21931161.v1 (Chen, 2023). This dataset is also available on PANGAEA (https://doi.org/10.1594/PANGAEA.955074, Chen et al., 2023) and will also be available on the National Tibetan Plateau/Third Pole Environment website. Other open datasets that made this research possible, and the related references, are attached in the Supplement (Text S2).
5.1 Comparison of the estimated forest biomass carbon pool change in this study against the existing datasets
Although there is potential overestimation, the interannual variation in forest AGBC in China, according to Liu et al. (2015), and that of total biomass carbon, according to Xu et al. (2021), are both highly correlated with our results (R2=0.65 and 0.88). Liu et al. (2015) predicted a forest AGBC increase rate of 102.2 ± 35.8 Tg yr−1 (p<0.01), which is slightly higher than our estimate of 80.8 ± 25.1 Tg yr−1 during 2002–2012, while Xu et al. (2021) indicated a biomass carbon stock trend of 99.4 ± 23.2 Tg yr−1 (p<0.01) from 2002 to 2019, which is slightly lower than the rate of 115.6 ± 20.2 Tg yr−1 in this study (Fig. 7a–b). The spatial maps of the forest biomass carbon trends estimated by Xu et al. (2021) and Liu et al. (2015) were slightly patchy (Fig. 7c–d). Compared to this study, the two existing datasets (i.e. the datasets of Liu et al., 2015, and Xu et al., 2021) predicted higher biomass carbon stock trends in the Qinling mountains and the mature deciduous conifer forests in northeastern China. Meanwhile, they predicted lower carbon sinks in southern China (Fig. 7c–f), where reforestation and forest-management-induced short-term extensive carbon uptake (Tong et al., 2020) have been confirmed by atmospheric inversions (Wang et al., 2020; Yang et al., 2021).
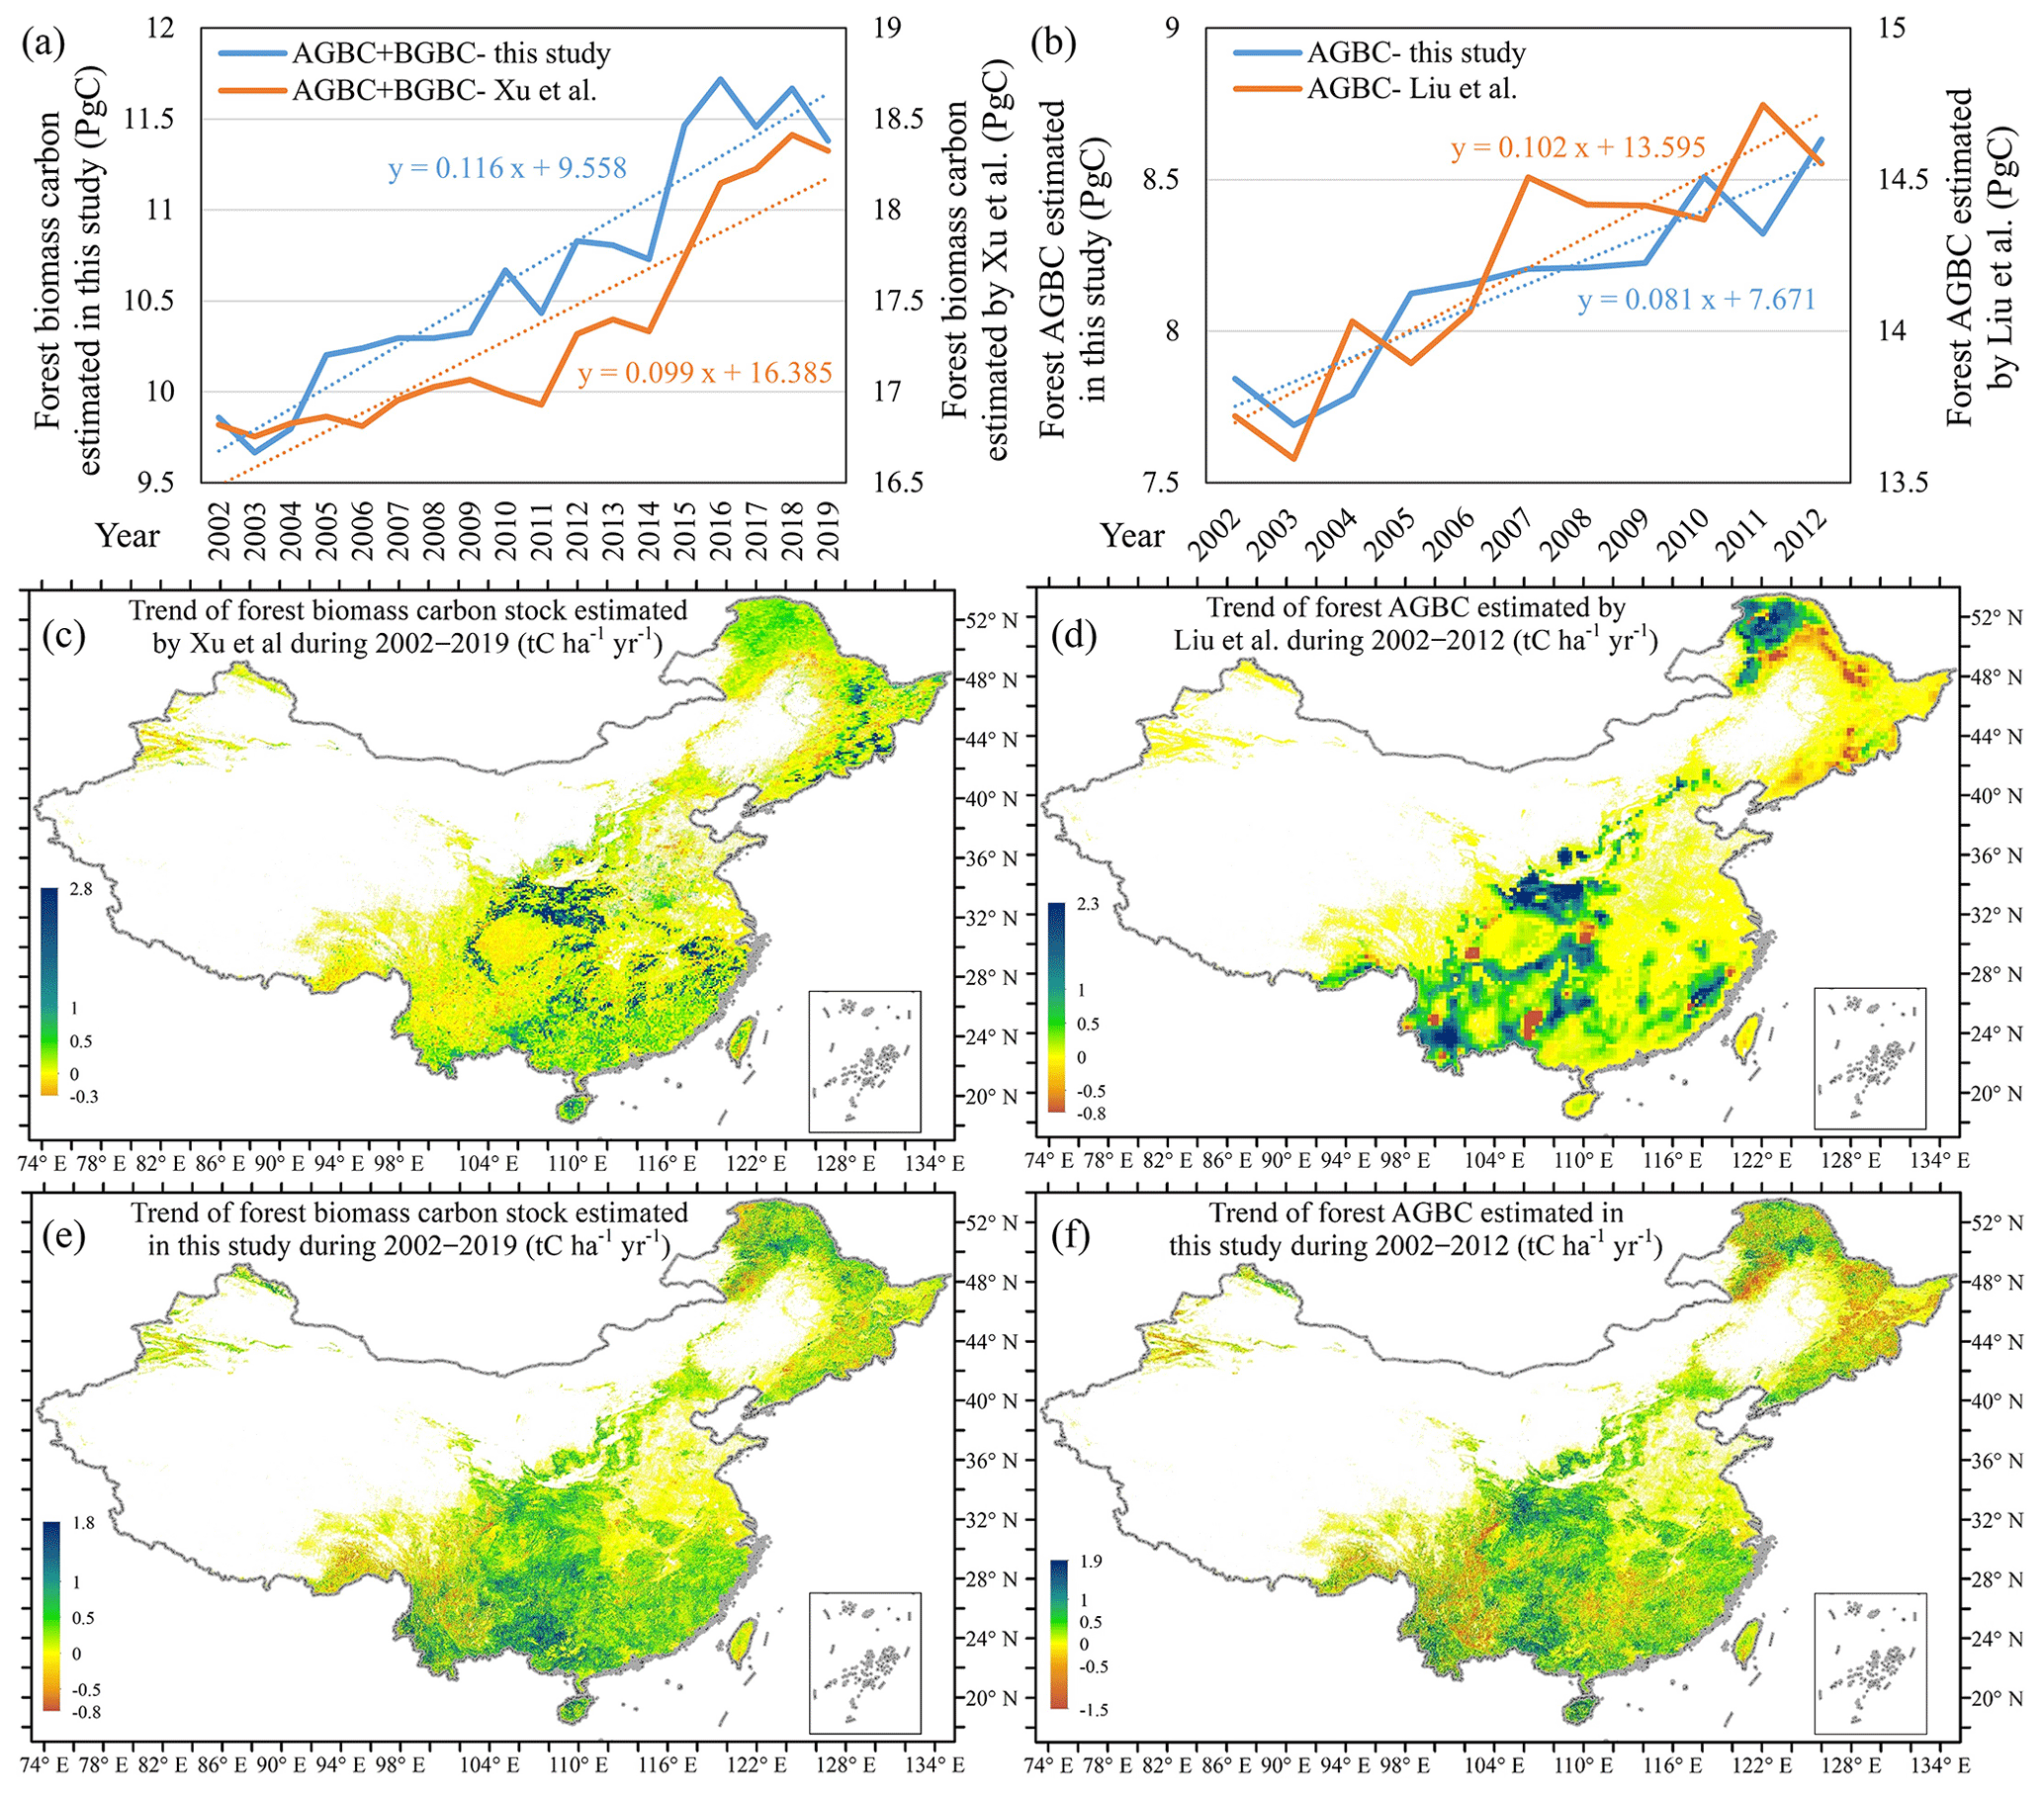
Figure 7Comparison of the estimated forest biomass carbon pool change in this study with two existing datasets. (a) Comparison of the interannual variation in forest biomass carbon in this study with the estimate by Xu et al. (2021) during 2002–2019. (b) Comparison of the interannual variation in forest AGBC calculated in this study with the estimate by Liu et al. (2015) over 2002–2012. (c) Map of the interannual trend of forest biomass carbon stock in China during 2003–2019, according to Xu et al. (2021). (d) Map of the forest AGBC trend in China during 2003–2012, according to Liu et al. (2015). (e) Map of the estimated trend of forest biomass carbon stock over 2002–2019 in this study. (f) Map of the estimated forest AGBC trend over 2002–2012 in this study.
Finally, by comparing Fig. 7e and f, we could also notice that the hot spot of forest biomass carbon gains has moved from the Loess Plateau over the first decade of our study period (2002–2012) to southern China (e.g. Guangxi province) later. This change was probably due to the large-scale implementation of the “Grain for Green” project on the Loess Plateau (Liu et al., 2020; Wu et al., 2019) before 2012 and the massive plantation of fast-growing trees in southern China after 2010 (Tong et al., 2020).
5.2 Some uncertainties in the forest biomass carbon dataset and future prospects
During benchmark AGBC mapping, we converted the in situ AGBC data at forest plots into the grid-scale average AGBC by multiplying by the fraction of forestland during the time period of field investigation. Considering the overall high quality of the China's land use/cover datasets developed via the human–computer interactive interpretation of Landsat images (Liu et al., 2014; Yang and Huang, 2021), and that the producer's accuracy (PA) and user's accuracy (UA) for forestland classification in the CLCD dataset used in this study were 73 % and 85 %, respectively, the errors within the benchmark AGBC mapping induced by the scale conversion based on the forestland area fraction were generally limited.
The variation in climatic conditions in the short term may have subtle influences on that in the BGB, but explicit knowledge on this effect is lacking. Instead, woody vegetation BGB is much more driven by AGB (vegetation density), as indicated by the very strong relationship between BGB and AGB (R2≥0.85). Moreover, the long-term climatic background is expected to have a stronger influence on the RSR of perennial woody plants than the meteorological conditions in only a few years, since above- and belowground biomass allocation is the result of plants' long-term adjustment to the environment (Qi et al., 2019). Therefore, it is reasonable not to consider the influence of the specific climatic conditions in a year on the variation in BGB.
In the near future, P-band microwave sensors, which have higher penetrability into the canopy than L-band microwaves, will further improve AGB mapping. For example, Biomass (Biomass Monitoring Mission for Carbon Assessment), a fully polarimetric P-band SAR, is scheduled to be launched in 2024 (Le Toan et al., 2011). Therefore, in the future, the relationship between P-band microwave retrievals and biomass should be addressed, in addition to the calibration of historical AGB datasets (e.g. the long-term AGB dataset in this study) against the P-band SAR-based AGB benchmark map to extend the time series. In addition, an intercalibration between the AMSR-E-based VOD and the AMSR2-based VOD will further reduce the potential bias within the long-term integrated VOD datasets (Wang et al., 2021a, b). On the other hand, more in situ AGB and BGB measurements in larger plots are needed to further improve the estimation of belowground biomass allocation.
The supplement related to this article is available online at: https://doi.org/10.5194/essd-15-897-2023-supplement.
YC designed and conducted the research. BF and XF funded the research. YZ wrote the draft of the paper. XF and all other co-authors read and revised the paper.
The contact author has declared that none of the authors has any competing interests.
Publisher's note: Copernicus Publications remains neutral with regard to jurisdictional claims in published maps and institutional affiliations.
This work has been supported by the National Science Foundation of China (grant no. 41991233) and the CAS Project for Young Scientists in Basic Research (grant no. YSBR-037). We are grateful to all the data contributors, especially Xuli Tang, for sharing in situ measurements of forest aboveground biomass carbon stock across China, and Huabing Huang, for sharing his forest aboveground biomass map.
This work has been supported by the National Science Foundation of China (grant no. 41991233) and the CAS Project for Young Scientists in Basic Research (grant no. YSBR-037).
This paper was edited by Jia Yang and reviewed by Jean-Pierre Wigneron and three anonymous referees.
Besnard, S., Koirala, S., Santoro, M., Weber, U., Nelson, J., Gütter, J., Herault, B., Kassi, J., N'Guessan, A., Neigh, C., Poulter, B., Zhang, T., and Carvalhais, N.: Mapping global forest age from forest inventories, biomass and climate data, Earth Syst. Sci. Data, 13, 4881–4896, https://doi.org/10.5194/essd-13-4881-2021, 2021.
Bouvet, A., Mermoz, S., Le Toan, T., Villard, L., Mathieu, R., Naidoo, L., and Asner, G. P.: An above-ground biomass map of African savannahs and woodlands at 25 m resolution derived from ALOS PALSAR, Remote Sens. Environ., 206, 156–173, https://doi.org/10.1016/j.rse.2017.12.030, 2018.
Cartus, O., Santoro, M., and Kellndorfer, J.: Mapping forest aboveground biomass in the Northeastern United States with ALOS PALSAR dual-polarization L-band, Remote Sens. Environ., 124, 466–478, https://doi.org/10.1016/j.rse.2012.05.029, 2012.
Chang, Z., Hobeichi, S., Wang, Y.-P., Tang, X., Abramowitz, G., Chen, Y., Cao, N., Yu, M., Huang, H., Zhou, G., Wang, G., Ma, K., Du, S., Li, S., Han, S., Ma, Y., Wigneron, J.-P., Fan, L., Saatchi, S. S., and Yan, J.: New Forest Aboveground Biomass Maps of China Integrating Multiple Datasets, Remote Sens., 13, 2892, https://doi.org/10.3390/rs13152892, 2021.
Chen, C., Park, T., Wang, X., Piao, S., Xu, B., Chaturvedi, R. K., Fuchs, R., Brovkin, V., Ciais, P., Fensholt, R., Tømmervik, H., Bala, G., Zhu, Z., Nemani, R. R., and Myneni, R. B.: China and India lead in greening of the world through land-use management, Nat. Sustain., 2, 122–129, https://doi.org/10.1038/s41893-019-0220-7, 2019.
Chen, Y.: 1 km-resolution maps reveal increases in above- and belowground forest biomass carbon pools in China over the past 20 years, figshare [data set], https://doi.org/10.6084/m9.figshare.21931161.v1 2023.
Chen, Y., Feng, X., Fu, B., Shi, W., Yin, L., and Lv, Y.: Recent Global Cropland Water Consumption Constrained by Observations, Water Resour. Res., 55, 3708–3738, https://doi.org/10.1029/2018WR023573, 2019.
Chen, Y., Feng, X., Fu, B., Ma, H., Zohner, C. M., Crowther, T. W., Huang, Y., Wu, X., and Wei, F.: Above- and belowground forest biomass carbon in China from 2002 to 2021 (version 2), PANGAEA [data set], https://doi.org/10.1594/PANGAEA.955074, 2023.
D'Errico, J.: SLM – Shape Language Modeling MATLAB Central File Exchange [code], https://www.mathworks.com/matlabcentral/fileexchange/24443-slm-shape-language-modeling, last access: 15 November 2022.
DiMiceli, C., Sohlberg, R., and Townshend, J.: MODIS/Terra Vegetation Continuous Fields Yearly L3 Global 250m SIN Grid V061, NASA EOSDIS Land Processes DAAC [data set], https://doi.org/10.5067/MODIS/MOD44B.061, 2022.
Du, J., Kimball, J. S., Jones, L. A., Kim, Y., Glassy, J., and Watts, J. D.: A global satellite environmental data record derived from AMSR-E and AMSR2 microwave Earth observations, Earth Syst. Sci. Data, 9, 791–808, https://doi.org/10.5194/essd-9-791-2017, 2017.
Enquist Brian, J. and Niklas Karl, J.: Global Allocation Rules for Patterns of Biomass Partitioning in Seed Plants, Science, 295, 1517–1520, https://doi.org/10.1126/science.1066360, 2002.
Fang, J., Yu, G., Liu, L., Hu, S., and Chapin, F. S.: Climate change, human impacts, and carbon sequestration in China, P. Natl. Acad. Sci. USA, 115, 4015, https://doi.org/10.1073/pnas.1700304115, 2018.
Fick, S. E. and Hijmans, R. J.: WorldClim 2: new 1-km spatial resolution climate surfaces for global land areas, Int. J. Climatol., 37, 4302–4315, https://doi.org/10.1002/joc.5086, 2017.
Frappart, F., Wigneron, J.-P., Li, X., Liu, X., Al-Yaari, A., Fan, L., Wang, M., Moisy, C., Le Masson, E., Aoulad Lafkih, Z., Vallé, C., Ygorra, B., and Baghdadi, N.: Global Monitoring of the Vegetation Dynamics from the Vegetation Optical Depth (VOD): A Review, Remote Sens., 12, 2915, https://doi.org/10.3390/rs12182915, 2020.
Guo, Q. and Ren, H.: Productivity as related to diversity and age in planted versus natural forests, Global Ecol. Biogeogr., 23, 1461–1471, https://doi.org/10.1111/geb.12238, 2014.
Hansen, M. C., Potapov, P. V., Moore, R., Hancher, M., Turubanova, S. A., Tyukavina, A., Thau, D., Stehman, S. V., Goetz, S. J., Loveland, T. R., Kommareddy, A., Egorov, A., Chini, L., Justice, C. O., and Townshend, J. R. G.: High-Resolution Global Maps of 21st-Century Forest Cover Change, Science, 342, 850–853, https://doi.org/10.1126/science.1244693, 2013.
Hastie, T., Tibshirani, R., and Friedman, J.: The Elements of Statistical Learning Data Mining, Inference, and Prediction, 2nd Edn., Section 10.13.2, Springer, ISBN 978-0-387-84857-0, 2009.
Hu, T., Su, Y., Xue, B., Liu, J., Zhao, X., Fang, J., and Guo, Q.: Mapping Global Forest Aboveground Biomass with Spaceborne LiDAR, Optical Imagery, and Forest Inventory Data, Remote Sens., 8, 565, https://doi.org/10.3390/rs8070565, 2016.
Huang, H., Liu, C., Wang, X., Zhou, X., and Gong, P.: Integration of multi-resource remotely sensed data and allometric models for forest aboveground biomass estimation in China, Remote. Sens. Environ., 221, 225–234, https://doi.org/10.1016/j.rse.2018.11.017, 2019.
Huang, Y., Ciais, P., Santoro, M., Makowski, D., Chave, J., Schepaschenko, D., Abramoff, R. Z., Goll, D. S., Yang, H., Chen, Y., Wei, W., and Piao, S.: A global map of root biomass across the world's forests, Earth Syst. Sci. Data, 13, 4263–4274, https://doi.org/10.5194/essd-13-4263-2021, 2021.
Jackson, T. J. and Schmugge, T. J.: Vegetation effects on the microwave emission of soils, Remote. Sens. Environ., 36, 203–212, https://doi.org/10.1016/0034-4257(91)90057-D, 1991.
Kumar, L. and Mutanga, O.: Remote Sensing of Above-Ground Biomass, Remote Sens., 9, 935, https://doi.org/10.3390/rs9090935, 2017.
Le Toan, T., Quegan, S., Davidson, M. W. J., Balzter, H., Paillou, P., Papathanassiou, K., Plummer, S., Rocca, F., Saatchi, S., Shugart, H., and Ulander, L.: The BIOMASS mission: Mapping global forest biomass to better understand the terrestrial carbon cycle, Remote. Sens. Environ., 115, 2850–2860, https://doi.org/10.1016/j.rse.2011.03.020, 2011.
Li, W., MacBean, N., Ciais, P., Defourny, P., Lamarche, C., Bontemps, S., Houghton, R. A., and Peng, S.: Gross and net land cover changes in the main plant functional types derived from the annual ESA CCI land cover maps (1992–2015), Earth Syst. Sci. Data, 10, 219–234, https://doi.org/10.5194/essd-10-219-2018, 2018.
Li, X., Wigneron, J.-P., Frappart, F., Fan, L., Ciais, P., Fensholt, R., Entekhabi, D., Brandt, M., Konings, A. G., Liu, X., Wang, M., Al-Yaari, A., and Moisy, C.: Global-scale assessment and inter-comparison of recently developed/reprocessed microwave satellite vegetation optical depth products, Remote. Sens. Environ., 253, 112208, https://doi.org/10.1016/j.rse.2020.112208, 2021.
Liu, J., Kuang, W., Zhang, Z., Xu, X., Qin, Y., Ning, J., Zhou, W., Zhang, S., Li, R., Yan, C., Wu, S., Shi, X., Jiang, N., Yu, D., Pan, X., and Chi, W.: Spatiotemporal characteristics, patterns and causes of land use changes in China since the late 1980s, Dili Xuebao/Acta Geogr. Sin., 69, 3–14, https://doi.org/10.11821/dlxb201401001, 2014.
Liu, X., Su, Y., Hu, T., Yang, Q., Liu, B., Deng, Y., Tang, H., Tang, Z., Fang, J., and Guo, Q.: Neural network guided interpolation for mapping canopy height of China's forests by integrating GEDI and ICESat-2 data, Remote. Sens. Environ., 269, 112844, https://doi.org/10.1016/j.rse.2021.112844, 2022.
Liu, Y. Y., de Jeu, R. A. M., McCabe, M. F., Evans, J. P., and van Dijk, A. I. J. M.: Global long-term passive microwave satellite-based retrievals of vegetation optical depth, Geophys. Res. Lett., 38, L18402, https://doi.org/10.1029/2011GL048684, 2011.
Liu, Y. Y., van Dijk, A. I. J. M., de Jeu, R. A. M., Canadell, J. G., McCabe, M. F., Evans, J. P., and Wang, G.: Recent reversal in loss of global terrestrial biomass, Nat. Clim. Change, 5, 470–474, https://doi.org/10.1038/nclimate2581, 2015.
Liu, Z., Wang, J., Wang, X., and Wang, Y.: Understanding the impacts of “Grain for Green” land management practice on land greening dynamics over the Loess Plateau of China, Land Use Policy, 99, 105084, https://doi.org/10.1016/j.landusepol.2020.105084, 2020.
Lu, F., Hu, H., Sun, W., Zhu, J., Liu, G., Zhou, W., Zhang, Q., Shi, P., Liu, X., Wu, X., Zhang, L., Wei, X., Dai, L., Zhang, K., Sun, Y., Xue, S., Zhang, W., Xiong, D., Deng, L., Liu, B., Zhou, L., Zhang, C., Zheng, X., Cao, J., Huang, Y., He, N., Zhou, G., Bai, Y., Xie, Z., Tang, Z., Wu, B., Fang, J., Liu, G., and Yu, G.: Effects of national ecological restoration projects on carbon sequestration in China from 2001 to 2010, P. Natl. Acad. Sci. USA, 115, 4039–4044, https://doi.org/10.1073/pnas.1700294115, 2018.
Luo, T.: Patterns of net primary productivity for Chinese major forest types and their mathematical models, Doctoral dissertation, Chinese Academy of Sciences, 1996.
Luo, Y., Zhang, X., Wang, X., and Lu, F.: Biomass and its allocation of Chinese forest ecosystems, Ecology, 95, 2026–2026, https://doi.org/10.1890/13-2089.1, 2014.
Luo, Y., Wang, X., Zhang, X., Booth, T. H., and Lu, F.: Root:shoot ratios across China's forests: Forest type and climatic effects, Forest Ecol. Manag., 269, 19–25, https://doi.org/10.1016/j.foreco.2012.01.005, 2012.
Ma, H., Mo, L., Crowther, T. W., Maynard, D. S., van den Hoogen, J., Stocker, B. D., Terrer, C., and Zohner, C. M.: The global distribution and environmental drivers of aboveground versus belowground plant biomass, Nat. Ecol. Evol., 5, 1110–1122, https://doi.org/10.1038/s41559-021-01485-1, 2021.
Mialon, A., Rodríguez-Fernández, N. J., Santoro, M., Saatchi, S., Mermoz, S., Bousquet, E., and Kerr, Y. H.: Evaluation of the Sensitivity of SMOS L-VOD to Forest Above-Ground Biomass at Global Scale, Remote Sens., 12, 1450, https://doi.org/10.3390/rs12091450, 2020.
Mokany, K., Raison, R. J., and Prokushkin, A. S.: Critical analysis of root: shoot ratios in terrestrial biomes, Glob. Change Biol., 12, 84–96, https://doi.org/10.1111/j.1365-2486.2005.001043.x, 2006.
Niu, Q., Xiao, X., Zhang, Y., Qin, Y., Dang, X., Wang, J., Zou, Z., Doughty, R. B., Brandt, M., Tong, X., Horion, S., Fensholt, R., Chen, C., Myneni, R. B., Xu, W., Di, G., and Zhou, X.: Ecological engineering projects increased vegetation cover, production, and biomass in semiarid and subhumid Northern China, Land Degrad. Dev., 30, 1620–1631, https://doi.org/10.1002/ldr.3351, 2019.
O'Neill, P. E., Chan, S., Njoku, E. G., Jackson, T., Bindlish, R., and Chaubell, J.: SMAP Enhanced L3 Radiometer Global Daily 9 km EASE-Grid Soil Moisture, Version 5, NASA National Snow and Ice Data Center Distributed Active Archive Center [data set], https://doi.org/10.5067/4DQ54OUIJ9DL, 2021.
Qi, Y., Wei, W., Chen, C., and Chen, L.: Plant root-shoot biomass allocation over diverse biomes: A global synthesis, Glob Ecol. Conserv., 18, e00606, https://doi.org/10.1016/j.gecco.2019.e00606, 2019.
Reich, P. B., Luo, Y., Bradford, J. B., Poorter, H., Perry, C. H., and Oleksyn, J.: Temperature drives global patterns in forest biomass distribution in leaves, stems, and roots, P. Natl. Acad. Sci. USA, 111, 13721, https://doi.org/10.1073/pnas.1216053111, 2014.
Saatchi, S. S., Harris, N. L., Brown, S., Lefsky, M., Mitchard, E. T. A., Salas, W., Zutta, B. R., Buermann, W., Lewis, S. L., Hagen, S., Petrova, S., White, L., Silman, M., and Morel, A.: Benchmark map of forest carbon stocks in tropical regions across three continents, P. Natl. Acad. Sci. USA, 108, 9899, https://doi.org/10.1073/pnas.1019576108, 2011.
Santoro, M., Cartus, O., Carvalhais, N., Rozendaal, D. M. A., Avitabile, V., Araza, A., de Bruin, S., Herold, M., Quegan, S., Rodríguez-Veiga, P., Balzter, H., Carreiras, J., Schepaschenko, D., Korets, M., Shimada, M., Itoh, T., Moreno Martínez, Á., Cavlovic, J., Cazzolla Gatti, R., da Conceição Bispo, P., Dewnath, N., Labrière, N., Liang, J., Lindsell, J., Mitchard, E. T. A., Morel, A., Pacheco Pascagaza, A. M., Ryan, C. M., Slik, F., Vaglio Laurin, G., Verbeeck, H., Wijaya, A., and Willcock, S.: The global forest above-ground biomass pool for 2010 estimated from high-resolution satellite observations, Earth Syst. Sci. Data, 13, 3927–3950, https://doi.org/10.5194/essd-13-3927-2021, 2021.
Spawn, S. A., Sullivan, C. C., Lark, T. J., and Gibbs, H. K.: Harmonized global maps of above and belowground biomass carbon density in the year 2010, Sci. Data, 7, 112, https://doi.org/10.1038/s41597-020-0444-4, 2020.
Su, Y., Guo, Q., Xue, B., Hu, T., Alvarez, O., Tao, S., and Fang, J.: Spatial distribution of forest aboveground biomass in China: Estimation through combination of spaceborne lidar, optical imagery, and forest inventory data, Remote. Sens. Environ., 173, 187–199, https://doi.org/10.1016/j.rse.2015.12.002, 2016.
Tang, X., Zhao, X., Bai, Y., Tang, Z., Wang, W., Zhao, Y., Wan, H., Xie, Z., Shi, X., Wu, B., Wang, G., Yan, J., Ma, K., Du, S., Li, S., Han, S., Ma, Y., Hu, H., He, N., Yang, Y., Han, W., He, H., Yu, G., Fang, J., and Zhou, G.: Carbon pools in China's terrestrial ecosystems: New estimates based on an intensive field survey, P. Natl. Acad. Sci. USA, 115, 4021, https://doi.org/10.1073/pnas.1700291115, 2018.
Tong, X., Brandt, M., Yue, Y., Horion, S., Wang, K., Keersmaecker, W. D., Tian, F., Schurgers, G., Xiao, X., Luo, Y., Chen, C., Myneni, R., Shi, Z., Chen, H., and Fensholt, R.: Increased vegetation growth and carbon stock in China karst via ecological engineering, Nat. Sustain., 1, 44–50, https://doi.org/10.1038/s41893-017-0004-x, 2018.
Tong, X., Brandt, M., Yue, Y., Ciais, P., Rudbeck Jepsen, M., Penuelas, J., Wigneron, J.-P., Xiao, X., Song, X.-P., Horion, S., Rasmussen, K., Saatchi, S., Fan, L., Wang, K., Zhang, B., Chen, Z., Wang, Y., Li, X., and Fensholt, R.: Forest management in southern China generates short term extensive carbon sequestration, Nat. Commun., 11, 129, https://doi.org/10.1038/s41467-019-13798-8, 2020.
Wang, J., Feng, L., Palmer, P. I., Liu, Y., Fang, S., Bösch, H., O'Dell, C. W., Tang, X., Yang, D., Liu, L., and Xia, C.: Large Chinese land carbon sink estimated from atmospheric carbon dioxide data, Nature, 586, 720–723, https://doi.org/10.1038/s41586-020-2849-9, 2020.
Wang, L., Li, L., Chen, X., Tian, X., Wang, X., and Luo, G.: Biomass Allocation Patterns across China's Terrestrial Biomes, PLoS One, 9, e93566, https://doi.org/10.1371/journal.pone.0093566, 2014.
Wang, M., Fan, L., Frappart, F., Ciais, P., Sun, R., Liu, Y., Li, X., Liu, X., Moisy, C., and Wigneron, J.-P.: An alternative AMSR2 vegetation optical depth for monitoring vegetation at large scales, Remote. Sens. Environ., 263, 112556, https://doi.org/10.1016/j.rse.2021.112556, 2021a.
Wang, M., Wigneron, J.-P., Sun, R., Fan, L., Frappart, F., Tao, S., Chai, L., Li, X., Liu, X., Ma, H., Moisy, C., and Ciais, P.: A consistent record of vegetation optical depth retrieved from the AMSR-E and AMSR2 X-band observations, Int. J. Appl. Earth Obs., 105, 102609, https://doi.org/10.1016/j.jag.2021.102609, 2021b.
Wigneron, J.-P., Chanzy, A., Calvet, J.-C., and Bruguier, N.: A simple algorithm to retrieve soil moisture and vegetation biomass using passive microwave measurements over crop fields, Remote. Sens. Environ., 51, 331–341, https://doi.org/10.1016/0034-4257(94)00081-W, 1995.
Wu, X., Wang, S., Fu, B., Feng, X., and Chen, Y.: Socio-ecological changes on the Loess Plateau of China after Grain to Green Program, Sci. Total Environ., 678, 565–573, https://doi.org/10.1016/j.scitotenv.2019.05.022, 2019.
Xu, L., Saatchi, S. S., Yang, Y., Yu, Y., Pongratz, J., Bloom, A. A., Bowman, K., Worden, J., Liu, J., Yin, Y., Domke, G., McRoberts, R. E., Woodall, C., Nabuurs, G.-J., de-Miguel, S., Keller, M., Harris, N., Maxwell, S., and Schimel, D.: Changes in global terrestrial live biomass over the 21st century, Sci. Adv., 7, eabe9829, https://doi.org/10.1126/sciadv.abe9829, 2021.
Yang, D., Liu, Y., Feng, L., Wang, J., Yao, L., Cai, Z., Zhu, S., Lu, N., and Lyu, D.: The First Global Carbon Dioxide Flux Map Derived from TanSat Measurements, Adv. Atmos. Sci., 38, 1433–1443, https://doi.org/10.1007/s00376-021-1179-7, 2021.
Yang, J. and Huang, X.: The 30 m annual land cover dataset and its dynamics in China from 1990 to 2019, Earth Syst. Sci. Data, 13, 3907–3925, https://doi.org/10.5194/essd-13-3907-2021, 2021.
Yu, Z., Zhao, H., Liu, S., Zhou, G., Fang, J., Yu, G., Tang, X., Wang, W., Yan, J., Wang, G., Ma, K., Li, S., Du, S., Han, S., Ma, Y., Zhang, D., Liu, J., Liu, S., Chu, G., Zhang, Q., and Li, Y.: Mapping forest type and age in China's plantations, Sci. Total Environ., 744, 140790, https://doi.org/10.1016/j.scitotenv.2020.140790, 2020.
Zhang, R., Zhou, X., Ouyang, Z., Avitabile, V., Qi, J., Chen, J., and Giannico, V.: Estimating aboveground biomass in subtropical forests of China by integrating multisource remote sensing and ground data, Remote. Sens. Environ., 232, 111341, https://doi.org/10.1016/j.rse.2019.111341, 2019.
Zhang, Y., Yao, Y., Wang, X., Liu, Y., and Piao, S.: Mapping spatial distribution of forest age in China, Earth Space Sci., 4, 108–116, https://doi.org/10.1002/2016EA000177, 2017.