the Creative Commons Attribution 4.0 License.
the Creative Commons Attribution 4.0 License.
 | 14 Feb 2023
AsiaRiceYield4km: seasonal rice yield in Asia from 1995 to 2015
Huaqing Wu
Jing Zhang
Zhao Zhang
Jichong Han
Juan Cao
Liangliang Zhang
Yuchuan Luo
Qinghang Mei
Fulu Tao
Rice is the most important staple food in Asia. However, high-spatiotemporal-resolution rice yield datasets are limited over this large region. The lack of such products greatly hinders studies that are aimed at accurately assessing the impacts of climate change and simulating agricultural production. Based on annual rice maps in Asia, we incorporated multisource predictors into three machine learning (ML) models to generate a high-spatial-resolution (4 km) seasonal rice yield dataset (AsiaRiceYield4km) for the 1995–2015 period. Predictors were divided into four categories that considered the most comprehensive rice growth conditions, and the optimal ML model was determined based on an inverse probability weighting method. The results showed that AsiaRiceYield4km achieves good accuracy for seasonal rice yield estimation (single rice: R2=0.88, RMSE = 920 kg ha−1; double rice: R2=0.91, RMSE = 554 kg ha−1; and triple rice: R2=0.93, RMSE = 588 kg ha−1). Compared with single rice from the Spatial Production Allocation Model (SPAM), the R2 of AsiaRiceYield4km was improved by 0.20, and the RMSE was reduced by 618 kg ha−1 on average. In particular, constant environmental conditions, including longitude, latitude, elevation and soil properties, contributed the most (∼ 45 %) to rice yield estimation. For different rice growth periods, we found that the predictors of the reproductive period had greater impacts on rice yield prediction than those of the vegetative period and the whole growing period. AsiaRiceYield4km is a novel long-term gridded rice yield dataset that can fill the unavailability of high-spatial-resolution seasonal yield products across major rice production areas and promote more relevant studies on agricultural sustainability worldwide. AsiaRiceYield4km can be downloaded from the following open-access data repository: https://doi.org/10.5281/zenodo.6901968 (Wu et al., 2022).
- Article
(12352 KB) - Full-text XML
-
Supplement
(575 KB) - BibTeX
- EndNote


As one major staple crop, rice (Oryza sativa L.) provides more than a quarter of calories for approximately half of the population but accounts for only 11 % of the arable land on Earth (Maclean et al., 2002; Alexandratos and Bruinsma, 2012; Birla et al., 2017; Qian et al., 2020). Asia produces and consumes more than 90 % of the global rice (Bandumula, 2018). The rice production is dominated by poor smallholder farmers. . Therefore, information on the rice yield in Asia is essential to maintain food security and farmers' livelihoods (Laborte et al., 2017). In the last half-century, the growth of rice yields has contributed more to an increase in production than the expansion of cultivation areas (Blomqvist et al., 2020), and yield will remain a dominant factor considering land-use policies aimed at reducing environmental pressure (Lambin and Meyfroidt, 2011; Kim et al., 2021). In addition, Asia has complex rice-cropping systems, and rice may be cultivated multiple times within 1 year (G. Zhang et al., 2020). It is critically necessary to identify the long-term and seasonal Asian rice yields – at high spatial resolution – to monitor and guide agricultural production.
Previous global-scale crop yield datasets, including the Harvester Area and Yields of 175 crops (M3-Crops) (Monfreda et al., 2008), the Spatial Production Allocation Model (SPAM) (You and Wood, 2006; Yu et al., 2020), the Global Dataset of Historical Yields of Major Crops (GDHY) (Iizumi et al., 2014; Iizumi and Sakai, 2020) and the Global Gridded Crop Model Intercomparison (GGCMI) phase 1 (Müller et al., 2019), have been produced and widely employed in many studies (Folberth et al., 2020; Kaltenegger and Winiwarter, 2020; Iizumi et al., 2021; Lin et al., 2021; W. Liu et al., 2021). However, due to the different research goals and technical restrictions, their spatial resolutions are relatively coarser (e.g., ∼ 10 km for M3-Crops and SPAM; ∼ 55 km for GDHY and GGCMI phase 1), and their temporal resolutions are mostly annual (Laborte et al., 2017). Only a few datasets have seasonal temporal information (e.g., GDHY), but they still cannot cover all rice seasons (Kim et al., 2021). In addition, the time spans are limited (e.g., only 1 year for M3-Crops; every 5 years for SPAM). For the long-term rice yield dataset (GDHY), the authors used a fixed rice area base map that did not provide the interannual spatial dynamics of the rice yield. To the best of our knowledge, a long-term seasonal rice yield dataset with higher spatial resolution and a dynamic spatial distribution is currently unavailable for the major rice cultivation regions in the world.
To address the above issues, there is a significant need to acquire multisource data and wiser technologies for rice yield estimation (Chlingaryan et al., 2018; Cao et al., 2020; van Klompenburg et al., 2020; Z. Zhang et al., 2020; Chen et al., 2022). With the rapid development of remote sensing technology in recent years, large-scale and long-term high-spatiotemporal-resolution observations provide ample and timely phenological and growing information for rice. Ground-based data, such as climate and soil, also provide more key environmental information (Folberth et al., 2016; Zhang et al., 2021). Many publications that have successfully combined satellite-derived data and ground environmental information for yield estimation have expanded our knowledge (Huang et al., 2013; Mosleh et al., 2015; Cao et al., 2021; Fernandez-Beltran et al., 2021). Nevertheless, to date, few studies have employed annual rice paddy areas for yield estimation. Moreover, machine learning (ML) models, such as random forest (RF), extreme gradient boosting (XGBoost) and long short-term memory (LSTM), have been increasingly and successfully used in crop yield estimation (Cai et al., 2019; van Klompenburg et al., 2020; Sakamoto, 2020; Luo et al., 2022). Such ML models can overcome the drawbacks of two traditional estimation methods: process-based crop models (PCMs) and statistical regression methods (SRMs). Compared with PCMs, ML can wisely select input variables according to the actual requirements and local geographical environmental conditions without complicated parameters (Jeong et al., 2022). Due to the complex functions with higher efficiency and flexibility, the yield estimation results of ML are always better than those of SRMs (Chlingaryan et al., 2018). In addition, ML has a good spatial generalization. Therefore, ML models combined with multisource data potentially provide a good chance for large-scale gridded yield estimation and associated accuracy improvement.
In this work, we integrate multisource data and annual rice maps into ML models in order to generate a seasonal rice yield dataset at a 4 km resolution across Asia (AsiaRiceYield4km) for the period from 1995 to 2015. AsiaRiceYield4km will better support agricultural monitoring systems and related research over a large scale because of its higher spatiotemporal resolution and longer time span.
2.1 Study area
Asia is the most important rice-producing area, accounting for 89 % of the cultivation area and 91 % of global production (FAO, 2022). Considering the accessibility of local census-based rice yield data, 14 main rice-producing countries in Asia were selected and then divided into 27 cases (one case refers to one specific rice-cropping period in a country) based on different rice-cropping systems (single, double or triple rice), as shown in Fig. 1.
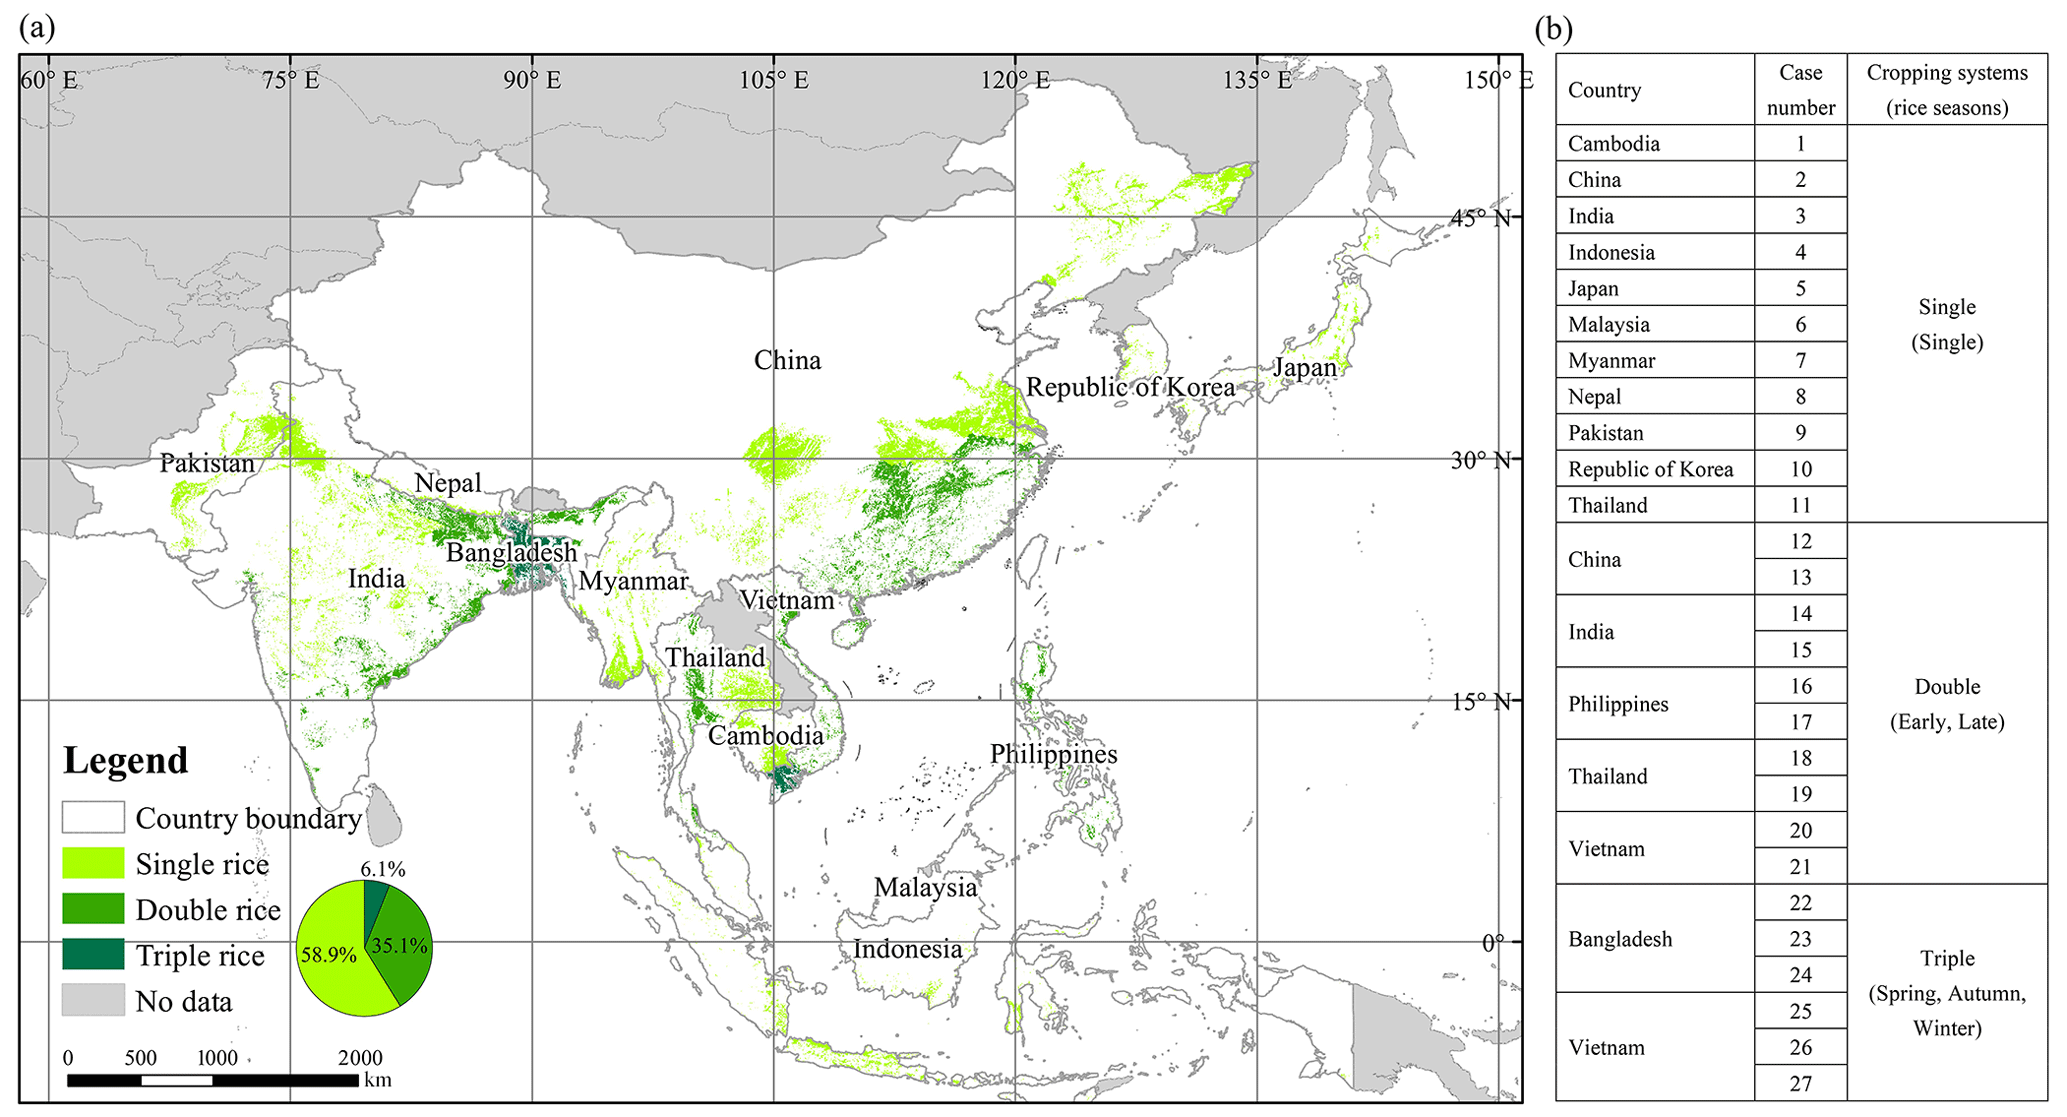
Figure 1(a) Rice cultivation areas with different cropping systems in the main rice-producing countries of Asia. The green area represents the maximum rice paddy area where paddy rice grew for at least 1 year during the 1995–2015 period (Han et al., 2021, 2022). The pie chart represents the area proportion of different rice-cropping systems. Panel (b) presents the case numbers and cropping system for each country. Double rice follows the order of early before late (e.g., 12 and 13 represent the early-season rice and late-season rice in China, respectively), and triple rice follows the order of spring, autumn and winter (e.g., 25, 26 and 27 represent the spring season rice, autumn season rice and winter season rice in Vietnam, respectively).
2.2 Data
Multisource data were collected for rice yield estimation, including annual rice area maps, the rice yield of 1400 administrative units (minimum administrative-division-scale units for each country with available rice yield), leaf area index (LAI) information (from remote sensing products) and rice growth environmental conditions (location, time, soil and climate). In addition, considering the necessity for phenological information, we also produced gridded key phenological dates from LAI data based on inflection-based and threshold-based methods (Sect. 2.3.1). Except for yield records at the administrative unit scale from official statistics (Table S1), the other data were resampled to a 4 km × 4 km resolution using the nearest-neighbor resampling method in ArcMap 10.2 (the original spatial information is listed in Table S2).
2.2.1 Rice area maps
We selected the latest public rice distribution map dataset, APRA500 (an annual dataset of rice paddy area at a 500 m resolution from 2000 to 2020), in this study (Han et al., 2021, 2022). APRA500 provides annual rice distribution information, which can reduce the influence of other land-cover types. Due to the topographic conditions, cloud contamination and the mixed-pixel effects owing to fragmented cropland fields, the rice area in APRA500 was somehow underestimated (Han et al., 2022). To reduce this effect, we used the combined rice area of 3 years (the current year, the previous year and the following year) to represent the rice area of the current year (e.g., the area of 2005 was the union of 2004, 2005 and 2006). Specifically, the union of area information from 2000, 2001 and 2002 was also applied to the years from 1995 to 2000 due to unavailable area maps.
2.2.2 Seasonal rice yield
Rice seasons were mainly determined based on RiceAtlas (Laborte et al., 2017). RiceAtlas is the most comprehensive and detailed database with respect to the rice season and has been widely used in many studies (van Oort and Zwart, 2018; Muehe et al., 2019; Fritz et al., 2019). The United States Department of Agriculture (USDA, https://ipad.fas.usda.gov/ogamaps/cropcalendar.aspx, last access: 7 April 2022) and the national statistics of each country were also referenced for rice season determination. The rice seasons have various names in different countries, such as “Aman”, “Aus” and “Boro” for triple rice in Bangladesh and “Rabi” and “Kharif” for double rice in India. To make the data more readable and consistent, we used single rice (single season), double rice (early and late seasons) and triple rice (spring, autumn and winter seasons) to refer to the three rice-cropping systems in our study, as shown in Fig. 1b. A few rice seasons (e.g., the early season in Cambodia, Malaysia, Myanmar and Indonesia as well as the winter season in India) were not considered due to the lack of yield records.
We collected seasonal rice yield data from the Food and Agriculture Organization (FAO) of the United Nations and other governmental websites (Table S1). Over 45 000 rice yield records from 1400 administrative units were collected for the period from 1995 to 2015. The quality of these data has been checked, and some yield outliers were filtered out according to the following rules: (a) they exceeded the actual biophysically attainable yields, and (b) they were beyond the average ± 2 times the variance during the 1995–2015 period (Zhang et al., 2014; Cao et al., 2020, 2021).
2.2.3 Key phenological dates
The transplanting, heading and maturity dates are the three most important phenological dates during the rice growing period. The whole growing period (WGP) is divided into two subperiods, according to the three key phenological dates, as follows: the vegetative period (VEP; from transplanting to heading) and the reproductive period (REP; from heading to maturity). However, most rice phenology datasets are provided at the administrative scale and lack information on interannual variation. For example, the United States Department of Agriculture (USDA) provides country-scale growing phenological information, and RiceAtlas provides subnational phenology information but disregards the annual dynamics (Laborte et al., 2017). In addition, these datasets lack heading date information for rice. Here, we retrieved the three dynamic key rice phenological dates from remote sensing data in Asia during the 1995–2015 period at a 4 km × 4 km grid scale using inflection-based and threshold-based methods (Sect. 2.3.1). The USDA and RiceAtlas datasets provided a threshold range for phenology and were used to validate our extracted phenological dates.
2.2.4 Location and time
Location information includes latitude (lat), longitude (long) and elevation (ele). The Global 30 arcsec (1 km) gridded digital elevation model (DEM) dataset (GLOBE Task Team et al., 1999) from the National Oceanic and Atmospheric Administration (NOAA) was employed in this study. The latitude and longitude information was collected from the centroid of each resampled 4 km pixel by ArcMap 10.2. The temporal information is represented by the year (1995–2015).
2.2.5 Soil data
Soil properties are important factors controlling rice growth and final yield. The Harmonized World Soil Database (HWSD, v1.2) provides key soil property variables, including the topsoil sand fraction (T_Sand), the topsoil silt fraction (T_SILT), the topsoil clay fraction (T_CLAY), the topsoil reference bulk density, (T_BULK_DEN), topsoil organic carbon (T_OC) and topsoil pH (H2O) (T_PH_H2O) (https://www.fao.org/soils-portal/soil-survey/soil-maps-and-databases/harmonized-world-soil-database-v12/en/, last access: 7 April 2022; Wieder et al., 2014).
2.2.6 Climate data
TerraClimate (Abatzoglou et al., 2018), a monthly high-spatial-resolution (4 km) meteorological dataset (https://doi.org/10.7923/G43J3B0R, Abatzoglou et al., 2017) for the period from 1995 to 2015, was used in our study. This dataset provides climate and water balance information for Asian rice (Salvacion, 2022), including the Palmer drought severity index (PDSI), precipitation accumulated (Pre), downward surface shortwave radiation (Srad), maximum temperature (Tmax), minimum temperature (Tmin), vapor pressure (Vap) and wind speed (Ws).
2.2.7 LAI
Remote sensing indices have been widely used in rice yield estimation (Son et al., 2020; Arumugam et al., 2021), but few studies were conducted before 2000 (C. Liu et al., 2021). To extend the period of the gridded yield dataset from 1995 in this study, we adopted Global Land Surface Satellite (GLASS) Advanced Very High Resolution Radiometer (AVHRR) LAI data (http://glass.umd.edu/Download.html, last access: 7 April 2022; Xiao et al., 2013, 2016, 2017), which begun from 1981 with a fine spatial resolution of 4 km and a temporal resolution of 8 d. Compared with other similar products, GLASS AVHRR LAI has the highest accuracy and lowest uncertainty (Liang et al., 2021). The GLASS AVHRR LAI was used for rice phenological information extraction and yield estimation.
2.3 Methods
We applied three steps to generate AsiaRiceYield4km by incorporating multisource data into three ML methods: determining phenological dates, categorizing and selecting predictors, and developing the optimal models and generating the gridded rice yield (Fig. 2). Details of each step are provided in the following sections.
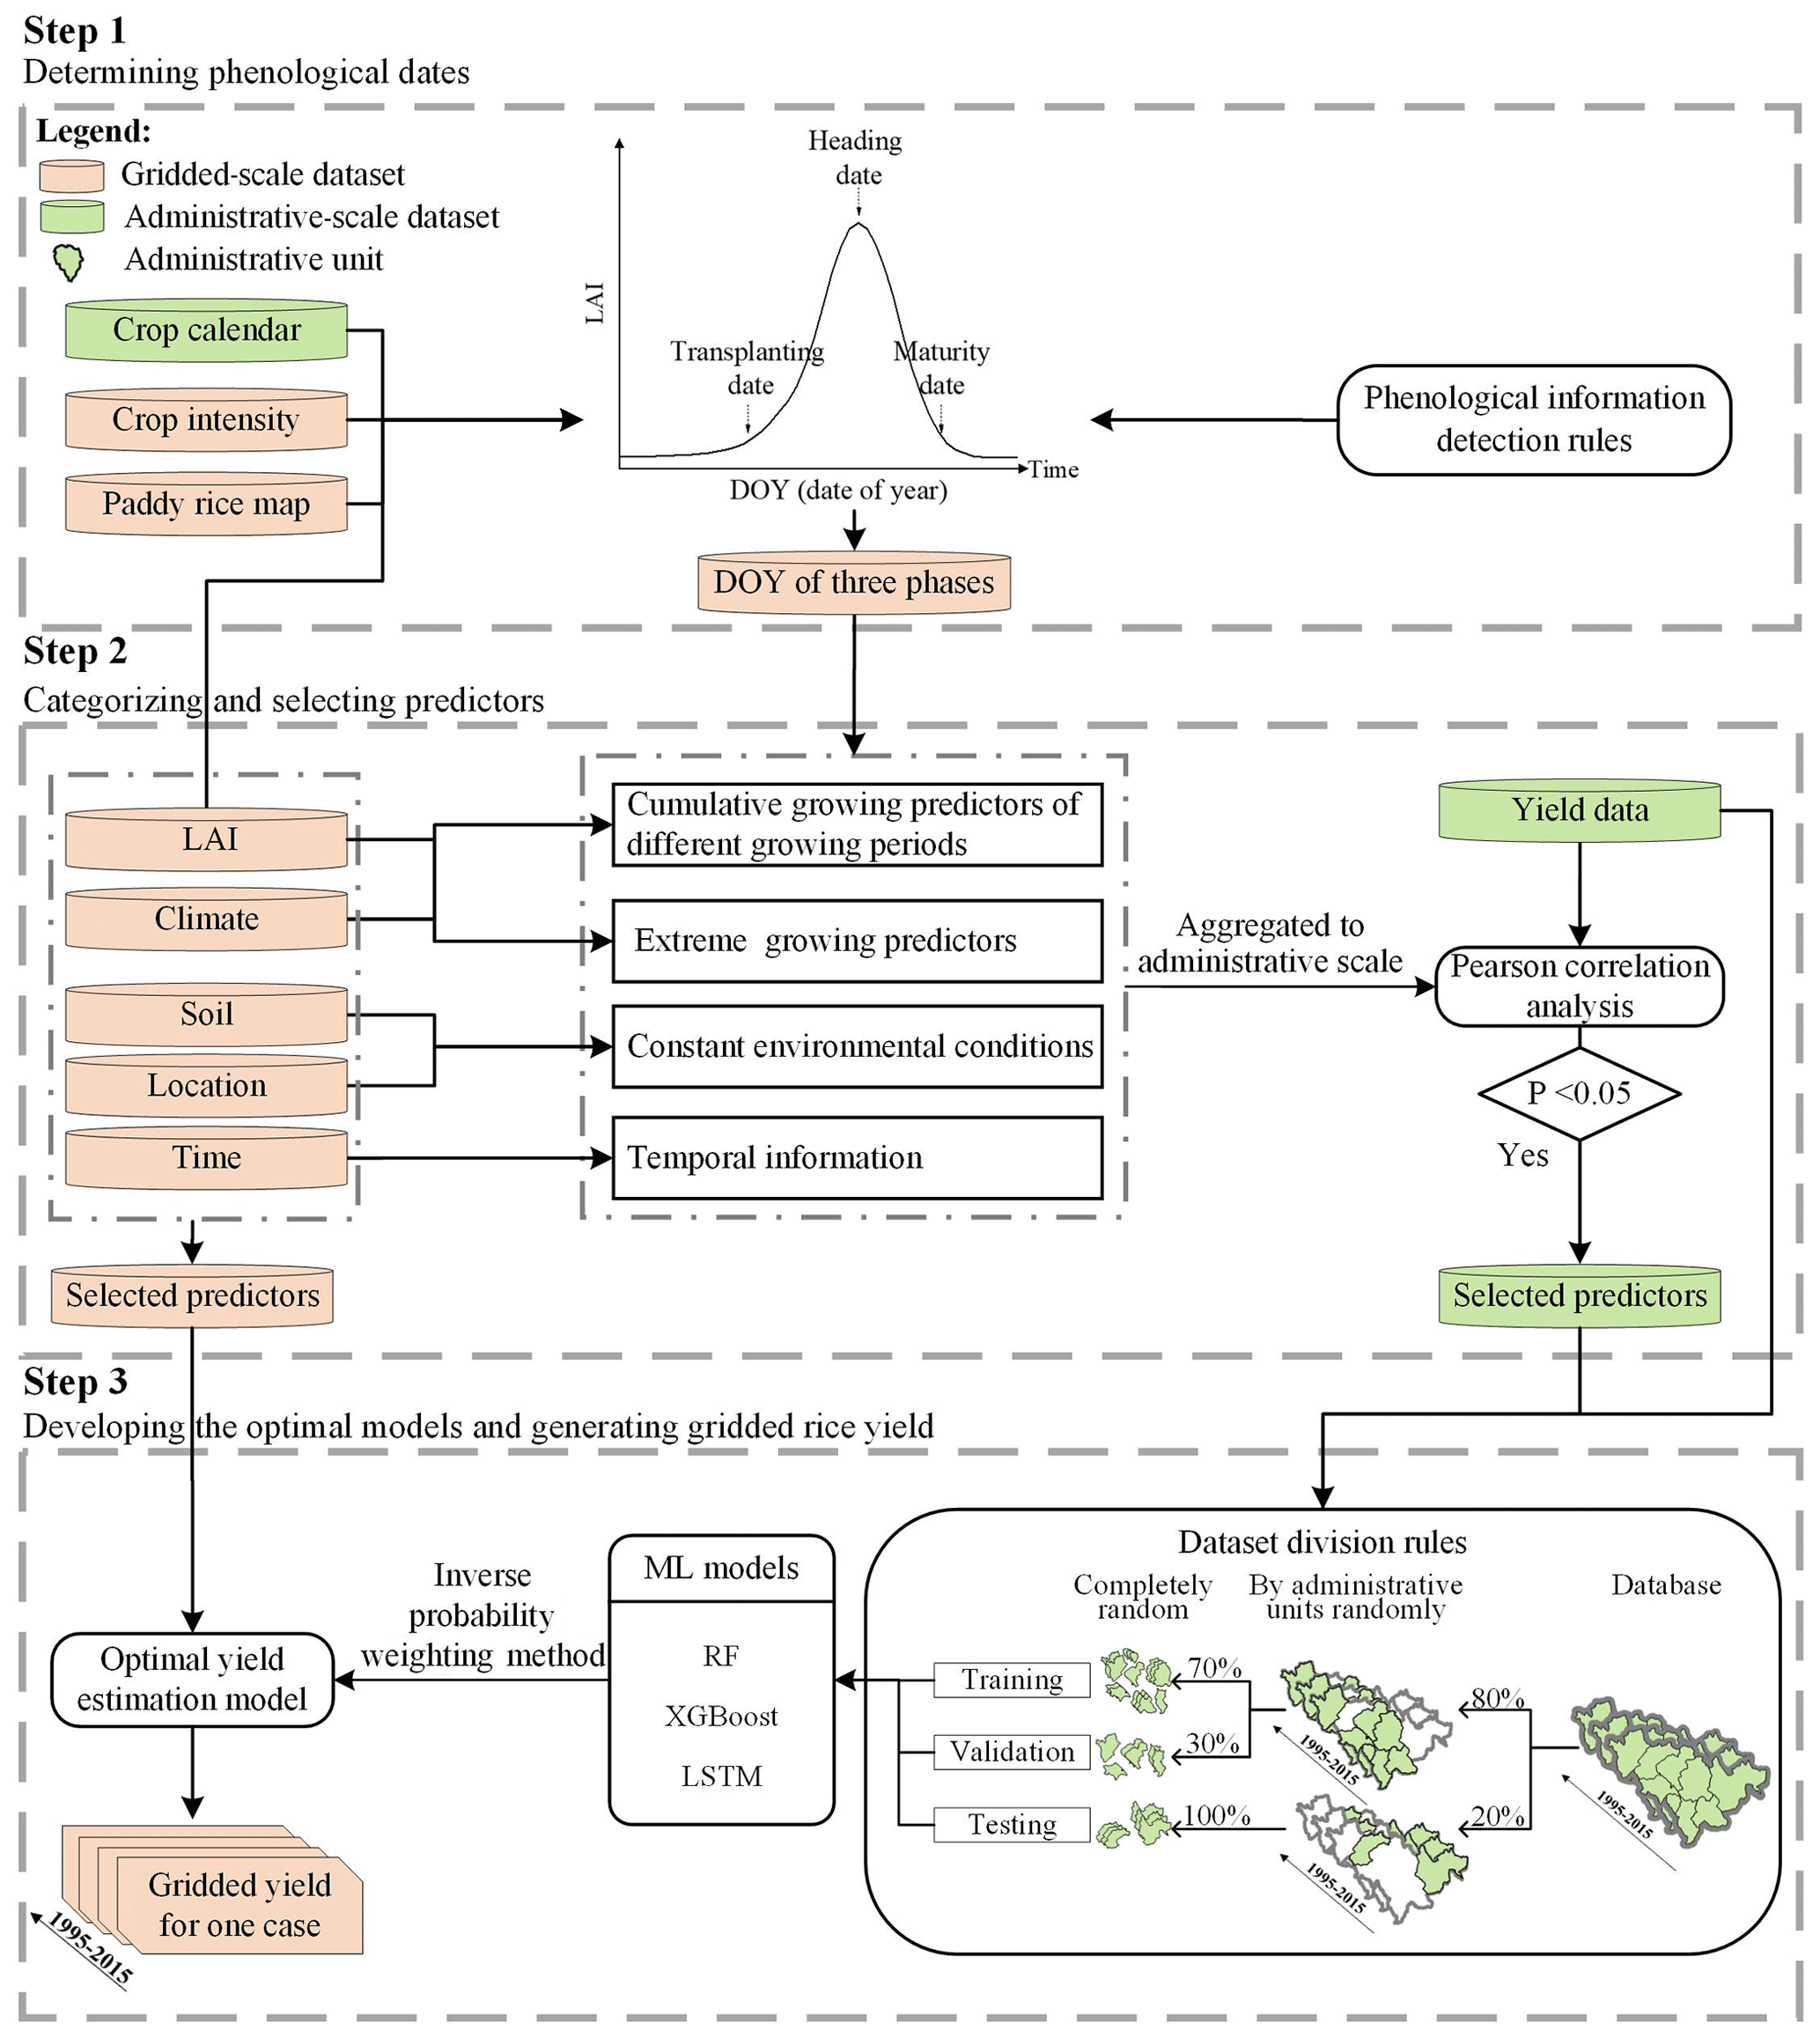
Figure 2Flowchart for generating long-term and high-resolution gridded rice yields by incorporating multisource data into ML models for one case. All 27 cases followed these steps and were combined to obtain the AsiaRiceYield4km dataset.
2.3.1 Determining phenological dates
Inflection-based (Chen et al., 2016; Luo et al., 2020a) and threshold-based (Manfron et al., 2017) methods were employed to detect rice phenological dates (Fig. 2, Step 1) according to the following rules:
-
For transplanting dates, the LAI always maintains a low value for a period before the transplanting date and dramatically increases after this date (Sakamoto et al., 2005; Chen et al., 2018). Therefore, if there is one point in the LAI curve where the following first derivative is >0 or its second derivative is equal to 0, this point is defined as the transplanting date.
-
For heading dates, the inflection point from VEP to REP (Wang et al., 2018) is characterized by the maximum value of the LAI between the transplanting date and the maturity date (Son et al., 2013).
-
For maturity dates, the physiological activity of rice will sharply drop during the harvesting period. The first inflection point at the LAI curve where its first derivative becomes negative is considered the maturity date. In addition, LAI values of pixels beyond the average ± 2 times the standard deviation (SD) were filtered (Zhang et al., 2022).
If the phenological dates in some grids cannot be detected nor filtered using the above rules, the average value of the administrative unit where the grids are located is applied.
2.3.2 Categorizing and selecting predictors
To provide comprehensive rice growth information for the ML models, we divided the multisource data into four categories including 50 predictors (Table S3): cumulative growing predictors (CGPs) of different growing periods, extreme growing predictors (EGPs), constant environmental conditions (CECs) and temporal information (TI) (Fig. 2, Step 2). A CGP includes the sum of each LAI and climate variable in different growing periods (the VEP, REP and WGP), reflecting the overall growing and weather difference among the three continuous growing periods. An EGP consists of the maximum and minimum of each climate and LAI variable, considering the impact of extreme events. CEC predictors reflect the influence of the geographical environment on rice growth. TI reflects long-term agronomic technological improvements and variety renewal (Huntington et al., 2020). All of these predictors were aggregated to the administrative scale. The predictor values of grids located in one administrative unit were averaged to this administrative unit.
High-dimensional predictors often affect the accuracy and computational efficiency of ML methods (LeCun et al., 2015; Zhang et al., 2019). To reduce this effect, Pearson correlation analysis was employed to estimate the relationship between yield and other variables for each case. The variables with a significant correlation (p<0.05) were selected as predictors (Cao et al., 2021). The yield and selected predictors of one case were input into one model. Specifically, the four predictors (long, lat, ele and year) were considered to have a stable impact on rice yield and were included in all 27 estimation models for the 27 cases (Ray et al., 2019; Huntington et al., 2020). Considering the covariate relation of CGPs for the WGP and the remaining two periods, the predictors of the WGP would be selected if its Pearson R was higher than that in the remaining two periods, or vice versa.
2.3.3 Developing the optimal models and generating gridded rice yield
The optimal yield estimation models were developed and used for gridded rice yield dataset generation according to the following process:
-
Dataset division rules. To effectively reduce overfitting effects (Dinh and Aires, 2022), we divided all of the data into three sets (training, validation and testing) that were used to optimize the ML parameters, select the optimal model and evaluate its generalization ability, respectively (Ripley, 2007). A diagram of the database division process is shown in Fig. 2 (Step 3). For each case, the whole database contained the selected predictors from all administrative-scale units during 1995–2010. The database was randomly divided into two subsets by the administrative unit: 20 % of the samples were used for testing, and the remaining 80 % of the samples were randomly re-split into 70 % for training and 30 % for validation without considering the administrative units. Thus, the training, validation and testing sets contained 56 % (80 % × 70 %), 24 % (80 % × 30 %) and 20 % (20 % × 100 %) of the dataset, respectively. Such rules with respect to division avoid information leaking from the testing set to the training set (Meroni et al., 2021) and enhance the robustness of the model.
-
ML models. ML can develop transfer functions based on the relationships between predictors and target variables for rice yield estimation (Chlingaryan et al., 2018; Shahhosseini et al., 2020). Three widely employed ML models, RF, XGBoost and LSTM, were selected for rice yield estimation. The RF model is based on the bagging ensemble model, which generates multiple decision trees and obtains predictions by voting on all individual trees (Breiman, 1996, 2001). In addition, extra randomness is introduced to the RF when generating trees and searching for the best tree stages (Shahhosseini et al., 2020). It provides more diversity for trees and can generate overall better model performance (Zhang et al., 2019). XGBoost uses optimized gradient boosting for decision trees, which tries to make weak learners strong (Chen and Guestrin, 2016). This method adopts an updated strategy to train the estimated model, and the updated model minimizes loss by reducing errors from previous models (Obsie et al., 2020). LSTM is a special recurrent neural network (RNN) that was proposed to overcome the vanishing and exploding gradient problems of RNNs (Hochreiter and Schmidhuber, 1997; Sak et al., 2014; Tian et al., 2021). LSTM contains input, hidden and output layers, and the hidden layers consist of memory cells (He et al., 2019; Zhang et al., 2019). Tuning hyperparameters can effectively improve the accuracy for rice yield estimation (Shahhosseini et al., 2021). The hyperparameter tuning details and Python library information for the ML algorithm are given in the Supplement.
-
Model evaluation. The coefficient of determination (R2) and root-mean-square error (RMSE) were adopted to evaluate the performance of each model for each case.
Here, i is the number of administrative units, n is the total number of administrative units and j is the year. is the observed rice yield from governmental websites or the FAO website in the ith administrative unit of year j, is the average of the observed rice yield in the ith administrative unit of year j and is the AsiaRiceYield4km yield in the ith administrative unit of year j.
-
Optimal yield estimation model selection. In this study, three ML models can generate three different yield estimation results. Previous studies have recommend the weighted ensemble method of combining the estimation results of different methods; this technique aims for a relatively stable result but sacrifices some accuracy (Shahhosseini et al., 2020, 2021). Moreover, many studies have also selected the optimal ML model by comparing only the accuracy of validation and/or testing sets (Zhang et al., 2021; Chen et al., 2022; Luo et al., 2022). Here, to conduct a comprehensive evaluation of different ML models and datasets, we developed an inverse proportional weight (IPW) method to assign weights for training, validation and testing accuracy in order to calculate the adjusted accuracy for each ML model (Eqs. 3–7). The ML model with the best adjusted accuracy was selected as the optimal ML model.
Here, tr, va and te are abbreviations for training, validation and testing, respectively; ptr, pva and pte are the inverse proportions for the sizes of the training, validation and testing sets, respectively, and are equal to , and , respectively; and wtr, wva and wte are the weights of the training, validation and testing sets, respectively. and RMSEad represent the adjusted R2 and RMSE, respectively. , and are the R2 values of the training, validation and testing sets, respectively; RMSEtr, RMSEva and RMSEte are the RMSE values of the training, validation and testing sets, respectively. The ML model with the highest and lowest RMSEad is regarded as the optimal model for each season in Fig. 1b.
-
Gridded rice yield generation. For each case, predictors of gridded scale consistent with administrative-scale selected predictors (Sect. 2.3.2) were input into the optimal model, and the gridded rice yield was generated for the period from 1995 to 2015. All 27 cases followed this process and were combined to generated the AsiaRiceYield4km dataset.
-
Uncertainty spatialization. To provide the spatial uncertainty, the relative RMSE (RRMSE; Eq. 8) of AsiaRiceYield4km was calculated according to Luo et al. (2020b). The RRMSE of each administrative unit was allocated to the centroid of the unit, and the kriging interpolation method was used to spatialize the distribution of uncertainty.
where m is the total number of years.
3.1 Performance of the estimated models
After selecting the optimal ML model for each case, we plotted the scatter of the seasonal training, validation, testing and adjusted accuracy (Fig. 3). The training R2 is higher than 0.9 for all cases; validation and testing R2 values average 0.78 and 0.69, respectively. The ranges from 0.60 to 0.90 (average of 0.77), with the lowest found for the single season in Malaysia and the highest found for the winter season in Bangladesh (Fig. 3c). As for the RMSE, the average values for training, validation and testing are 105, 408 and 489 kg ha−1, respectively. The RMSEad ranges from 162 to 817 kg ha−1, and its average is 396 kg ha−1. The highest RMSEad is for single rice in China (Fig. 3d). The rice yields in China are mostly higher than those of other countries, which might cause more modeling uncertainty. For double-rice systems (Fig. 3b, e), no significant difference is found between their modeling accuracies, with values of approximately 0.77 for the and 410 kg ha−1 for the RMSEad. For triple rice, the winter season in Bangladesh has the highest (0.90; dot no. 24 in Fig. 3c), and the spring season in Vietnam has the lowest RMSEad (327 kg ha−1; dot no. 25 in Fig. 3c). Additionally, the 27 optimal models consist of two types of ML models – XGBoost for 15 seasons and RF for 12 seasons – but no LSTM models. The 27 optimal models and their hyperparameters are listed in Table S5.
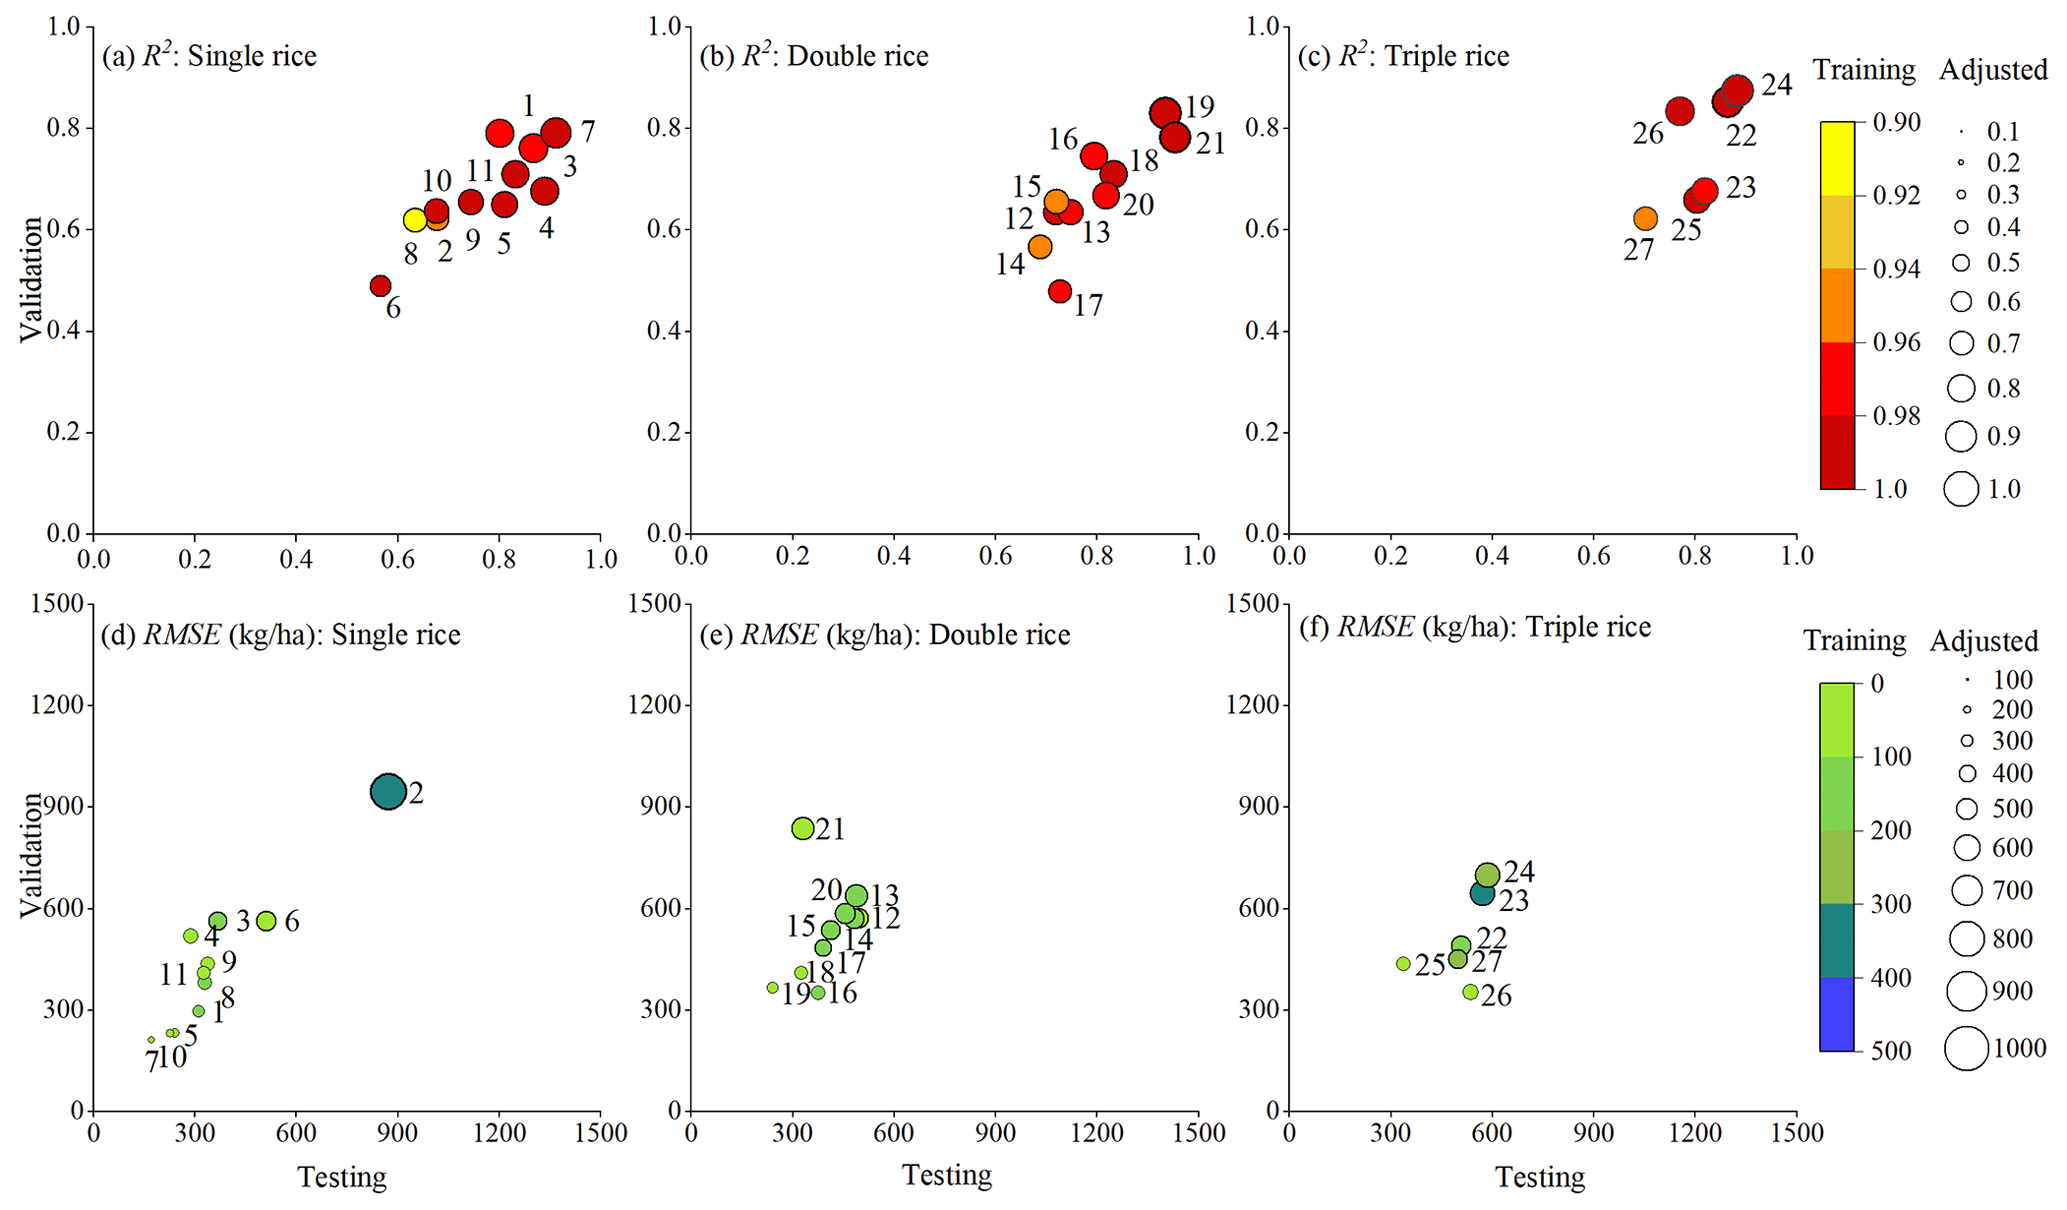
Figure 3Accuracy, with respect to the R2 (a–c) and RMSE (d–f) of the estimated yields for seasonal rice in each region. The color of the dots indicates different training accuracy ranks. The testing accuracy is given on the x axis, and the validation accuracy is given on the y axis. The size of dots represents the adjusted accuracy. Note that the numbers beside each dot represent each case shown in Fig. 1b.
3.2 Comparing AsiaRiceYield4km products with the observations
After aggregating AsiaRiceYield4km into administrative units, we compared them with the observed yield at administrative and annual scales. At the administrative scale, comparisons were separately conducted for single, double and triple rice, as shown in Fig. 4. The estimated and observed yields are close to the 1:1 line. The overall R2 is higher than 0.87, and the RMSE is lower than 921 kg ha−1, suggesting that AsiaRiceYield4km is mostly identical to the observations. The accuracy of single rice (R2 = 0.88, RMSE = 920 kg ha−1) is slightly lower than that of double rice (R2 = 0.91, RMSE = 554 kg ha−1) and triple rice (R2 = 0.93, RMSE = 494 kg ha−1), mainly because some high-yielding units are not well estimated for single rice (Fig. 4a). Moreover, late rice shows higher accuracy than early rice (R2 = 0.92>0.89, RMSE = 553 kg ha−1 <556 kg ha−1), which is consistent with previous work (Cao et al., 2021). As for triple rice, winter rice has higher accuracy than spring and autumn rice, even though its yield range was the greatest.
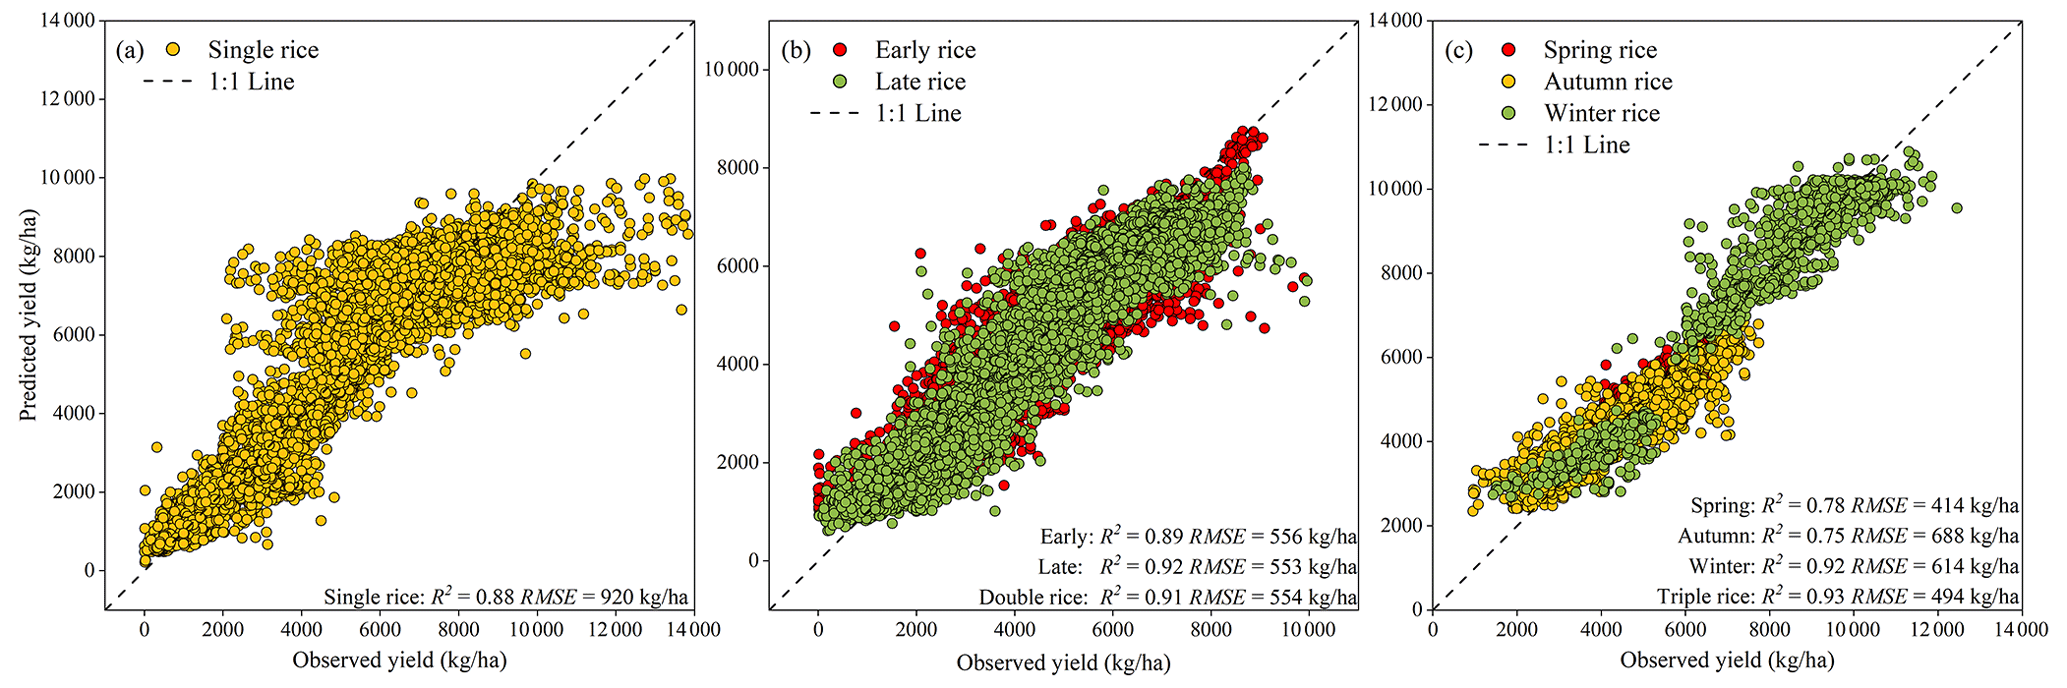
Figure 4Comparison of AsiaRiceYield4km with observed yields at the administrative-unit scale for (a) single rice, (b) double rice and (c) triple rice.
At the interannual scale, the annual average yield from AsiaRiceYield4km and the observed yields for each case are presented. All seasons are statistically highly significant (p<0.001), and the R2 value of all of the results is higher than 0.8. In addition, the differences of the SD are also presented in Fig. 5. The largest difference is the early season for double rice in Vietnam and is mainly attributed to the underestimation in AsiaRiceYield4km after 2006. All SD differences are lower than 200 kg ha−1, indicating that AsiaRiceYield4km can estimate and capture the interannual variations in observed yields well.
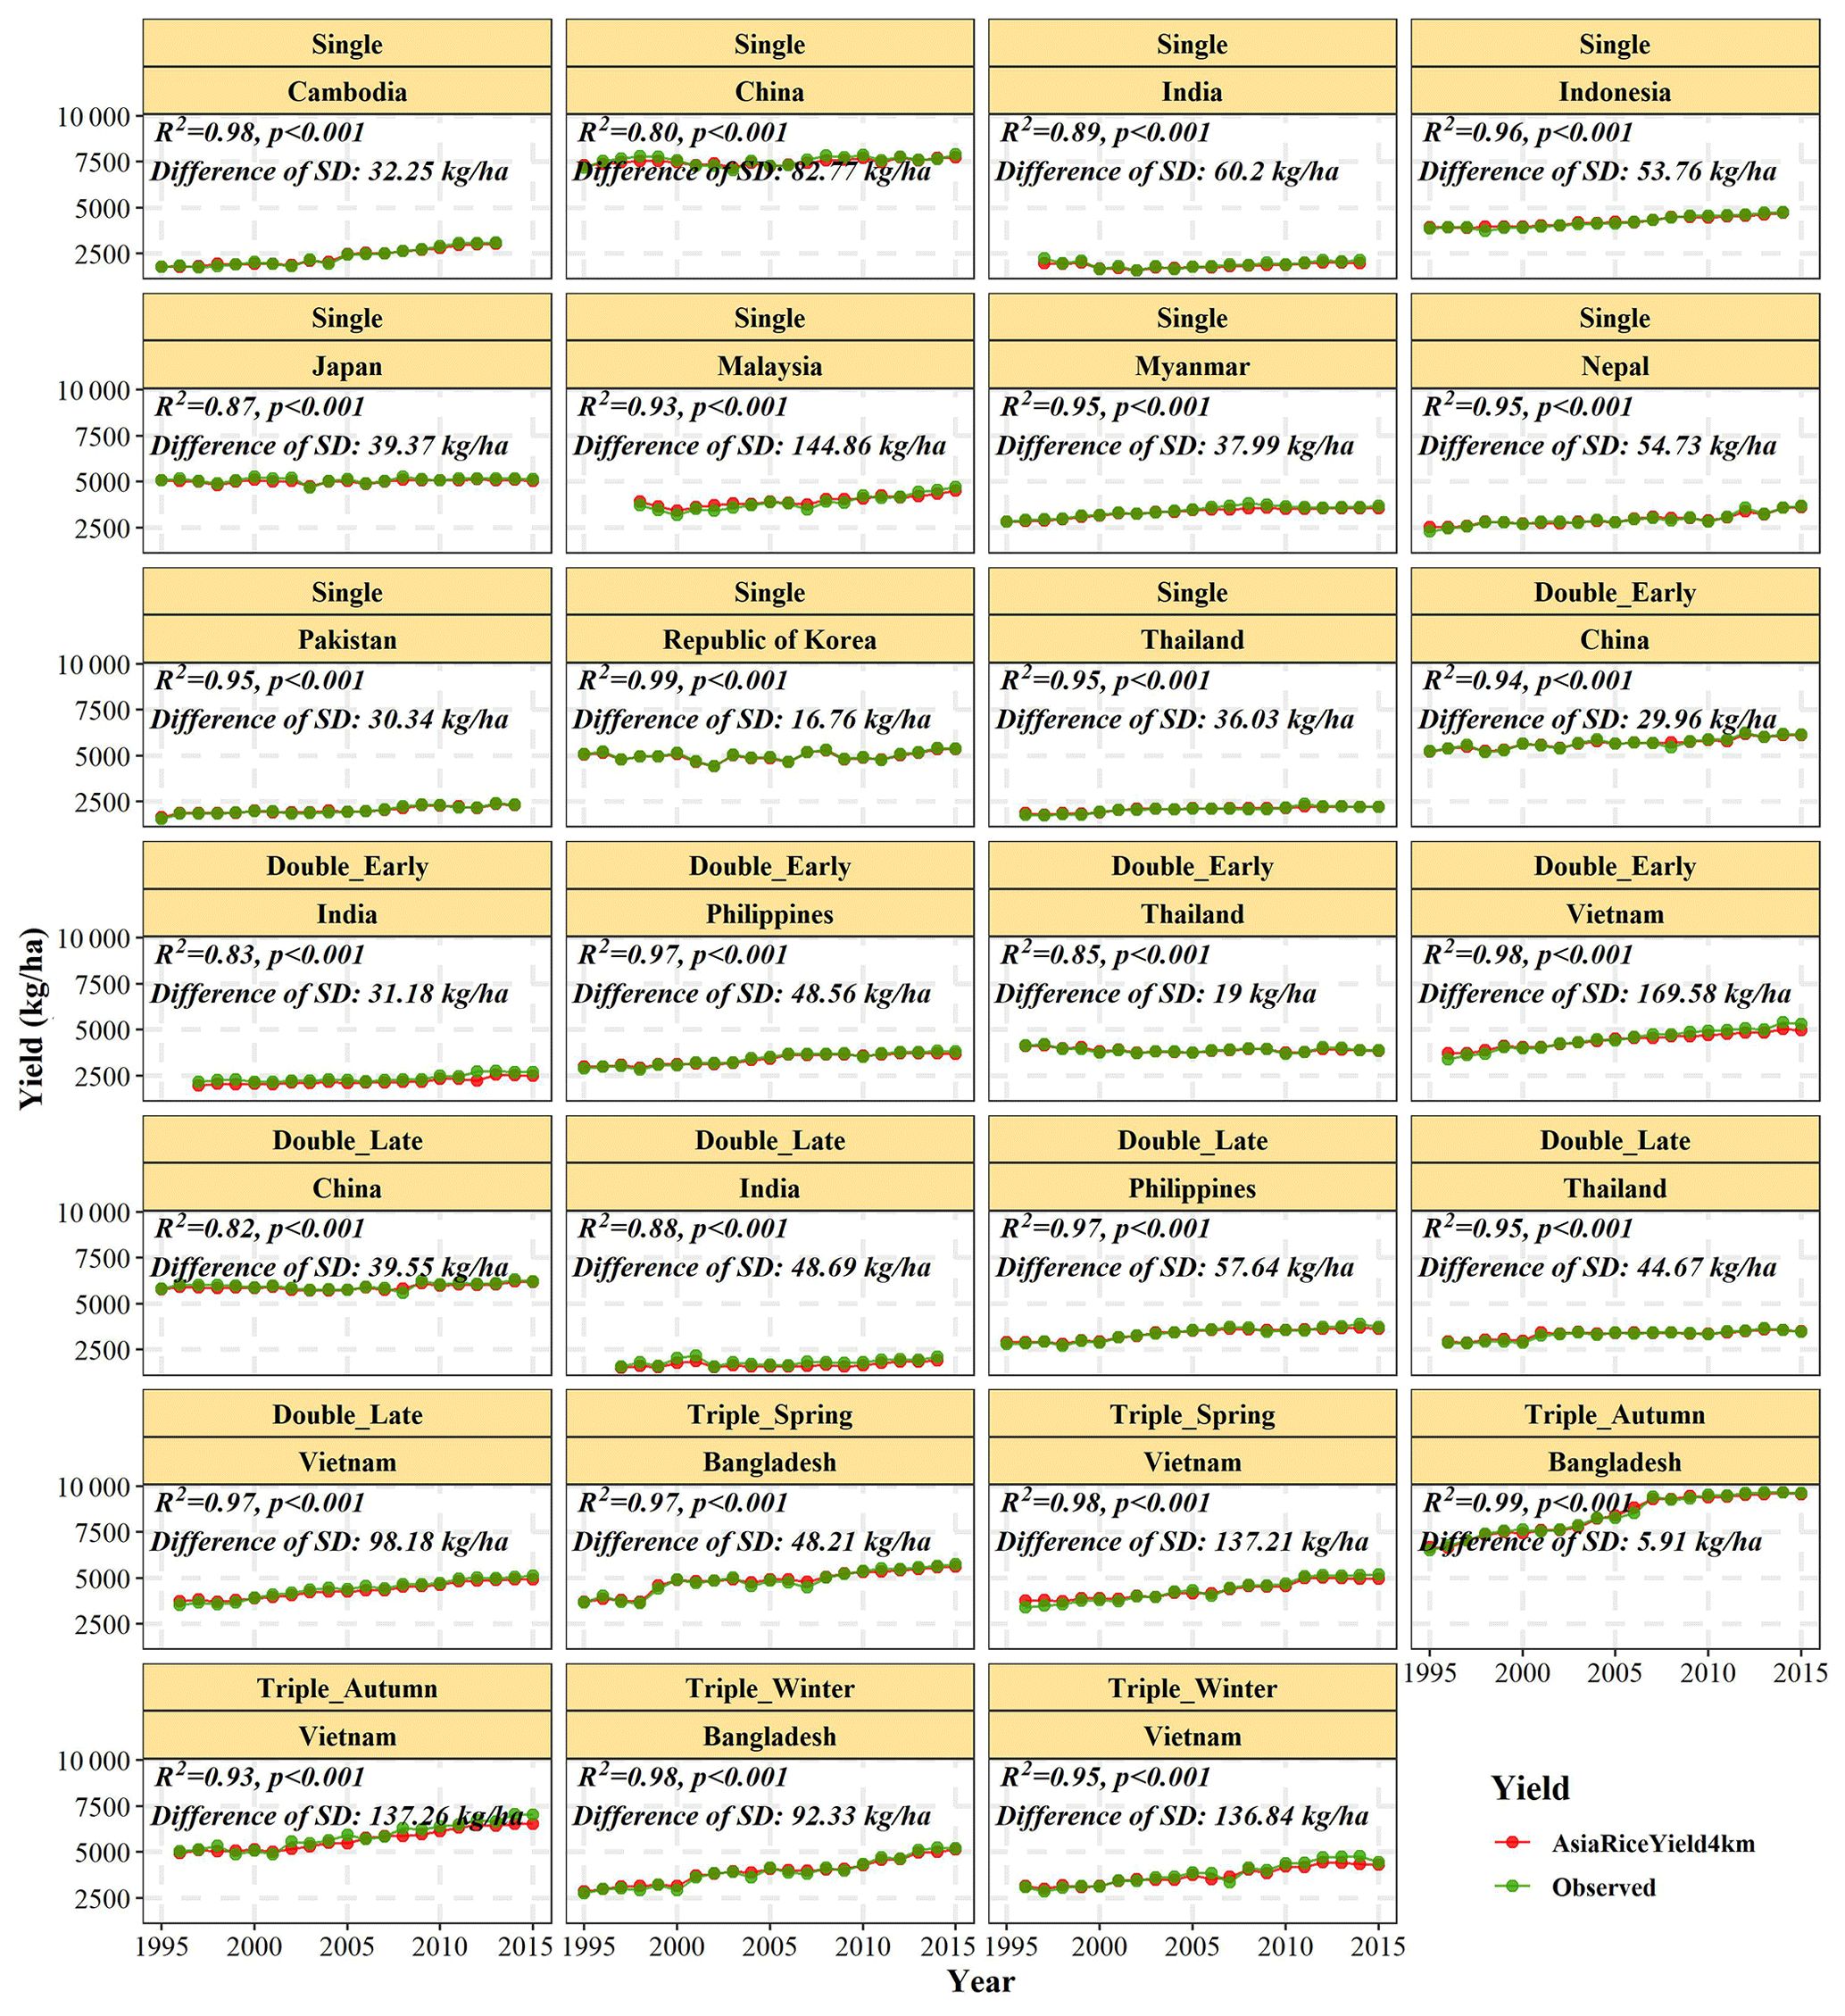
Figure 5Interannual comparison of AsiaRiceYield4km with the observed yield from 1995 to 2015.
3.3 Comparing AsiaRiceYield4km products with SPAM
Due to the limited temporal coverage and rice season information in SPAM, only single-rice systems in 2000, 2005 and 2010 were compared between AsiaRiceYield4km and SPAM. The spatial distribution of the rice yield in AsiaRiceYield4km and SPAM as well as the observed yield in 2005 are presented in Fig. 6a–c, with zoomed in views of the Indo-Gangetic Plain (IGP) in Pakistan and India (Fig. 6a1–c1). After aggregating AsiaRiceYield4km and SPAM data to administrative units, both products were also quantitatively compared with the observed yield for 2005 (Fig. 6d). Similar comparisons for 2000 and 2010 are shown in Fig. S1. Compared with SPAM, AsiaRiceYield4km has a higher R2 and a lower RMSE. Specifically, the R2 values of AsiaRiceYield4km are 0.18, 0.23 and 0.20 higher in 2000, 2005 and 2010 than those of SPAM, respectively, and the corresponding RMSE values are 570, 692 and 592 kg ha−1 lower than those of SPAM. Moreover, AsiaRiceYield4km shows better spatial consistency with the observed yield across the whole area. The spatial variation in the yield in AsiaRiceYield4km and the observed yield are identical in the IGP, whereas some administrative unit yields are overestimated in SPAM (Fig. 6a1–c1).
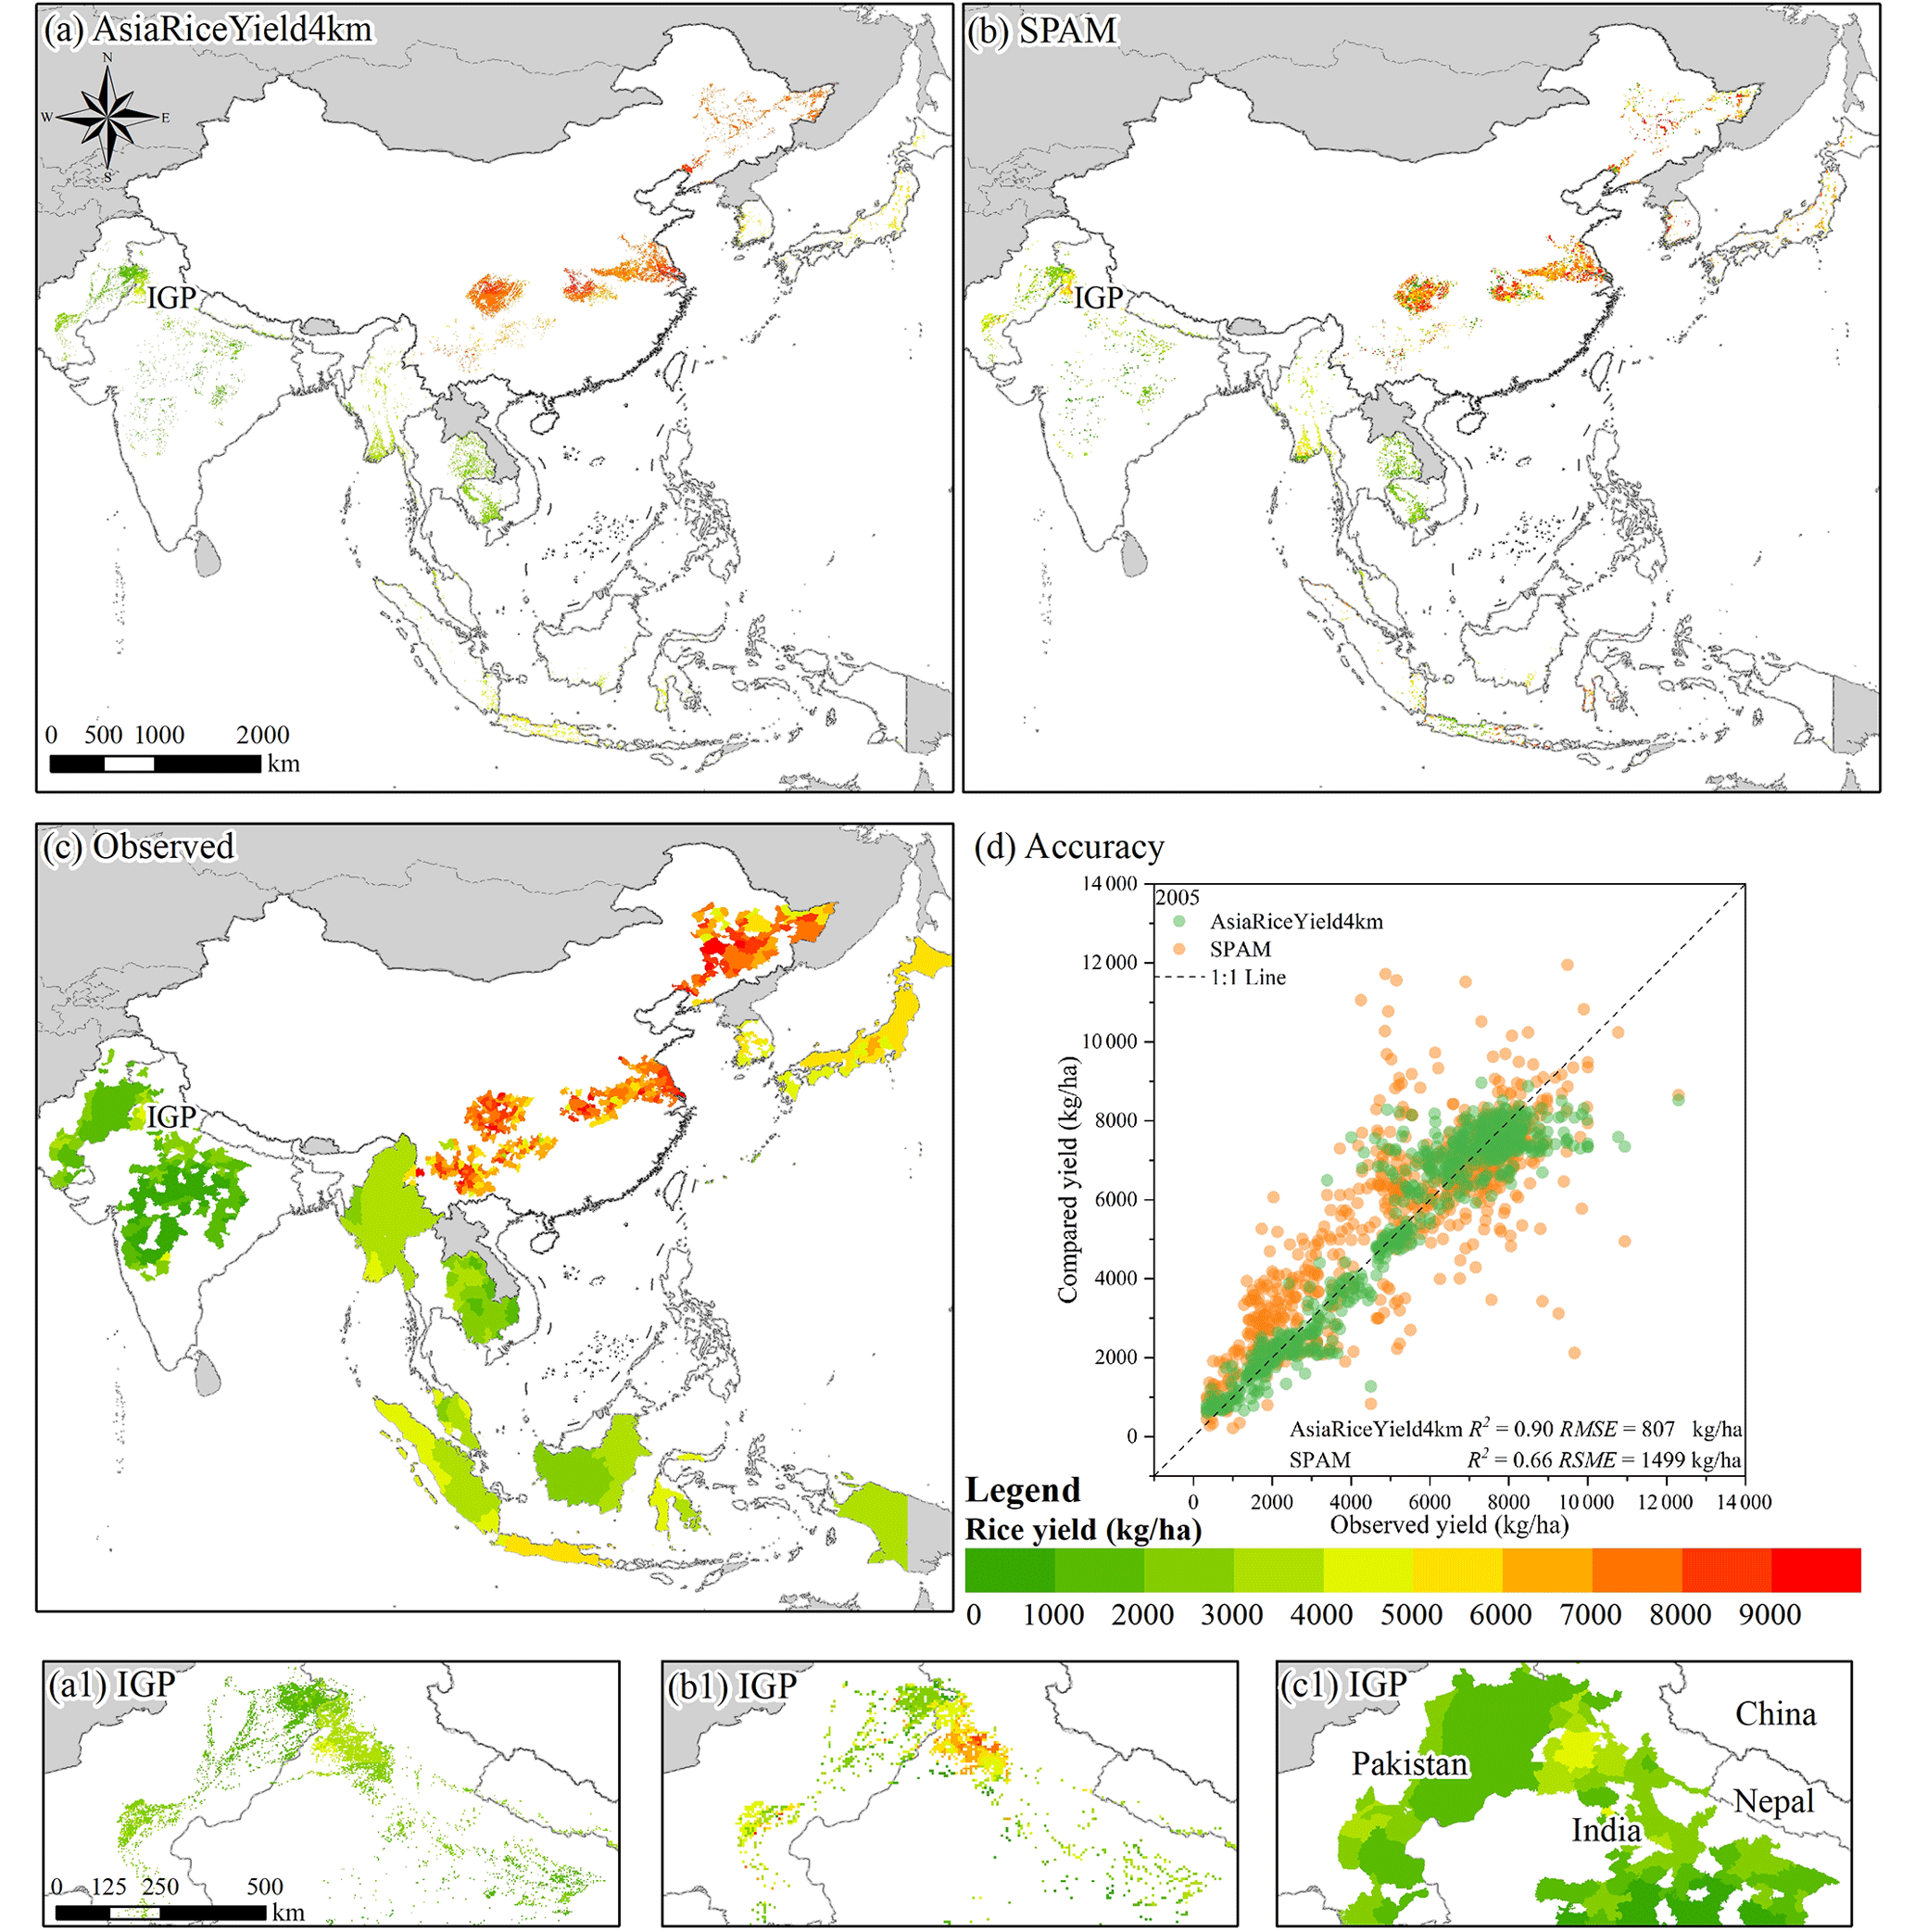
Figure 6Yield distribution of (a) AsiaRiceYield4km, (b) SPAM and (c) observed yields in 2005 as well as (d) quantitative comparisons with the observed yields in 2005. Panels (a1) to (c1) are the zoomed in views of the IGP in Pakistan and India for (a1) AsiaRiceYield4km, (b1) SPAM and (c1) the observed yields.
3.4 Spatiotemporal characterizations of AsiaRiceYield4km
Based on the estimated seasonal yields from optimal ML models, we characterized the spatiotemporal patterns of rice yields during the 1995–2015 period. Spatially, single rice is widely distributed in 11 countries across the whole area, where its yield varies greatly from 400 to 10 000 kg ha−1 with an average of 5428 kg ha−1. Specifically, the highest average yield is in China (7384 kg ha−1), and the lowest yield is in India (1889 kg ha−1). Such a large difference might be ascribed to better irrigation in China (Dawe et al., 2010) and relatively low-level soil fertility, investment and technology in India (Srivastava and Mahapatra, 2012). Double rice is mostly distributed between 30∘ N and the Equator. Double rice shows insignificant differences between the early yield and late yield: the early-season rice yield ranges from 1041 to 8347 kg ha−1 with an average yield of 4598 kg ha−1, whereas the late-season rice yield ranges from 666 to 7977 kg ha−1 with an average yield of 4539 kg ha−1. Three rice seasons (triple rice) exist in Bangladesh and Vietnam. The rice yield for spring, autumn and winter ranges from 3034 to 6249, from 2690 to 6986 and from 2514 to 10 870 kg ha−1, respectively, with corresponding averages of 4153, 4716 and 7794 kg ha−1. Notably, the highest average yield is 8597 kg ha−1 for winter rice in Bangladesh, due to high-yielding hybrid rice varieties and well-managed fieldwork (e.g., fully irrigated and increasing fertilizer, pesticide and herbicide applications) (Meroni et al., 2021).
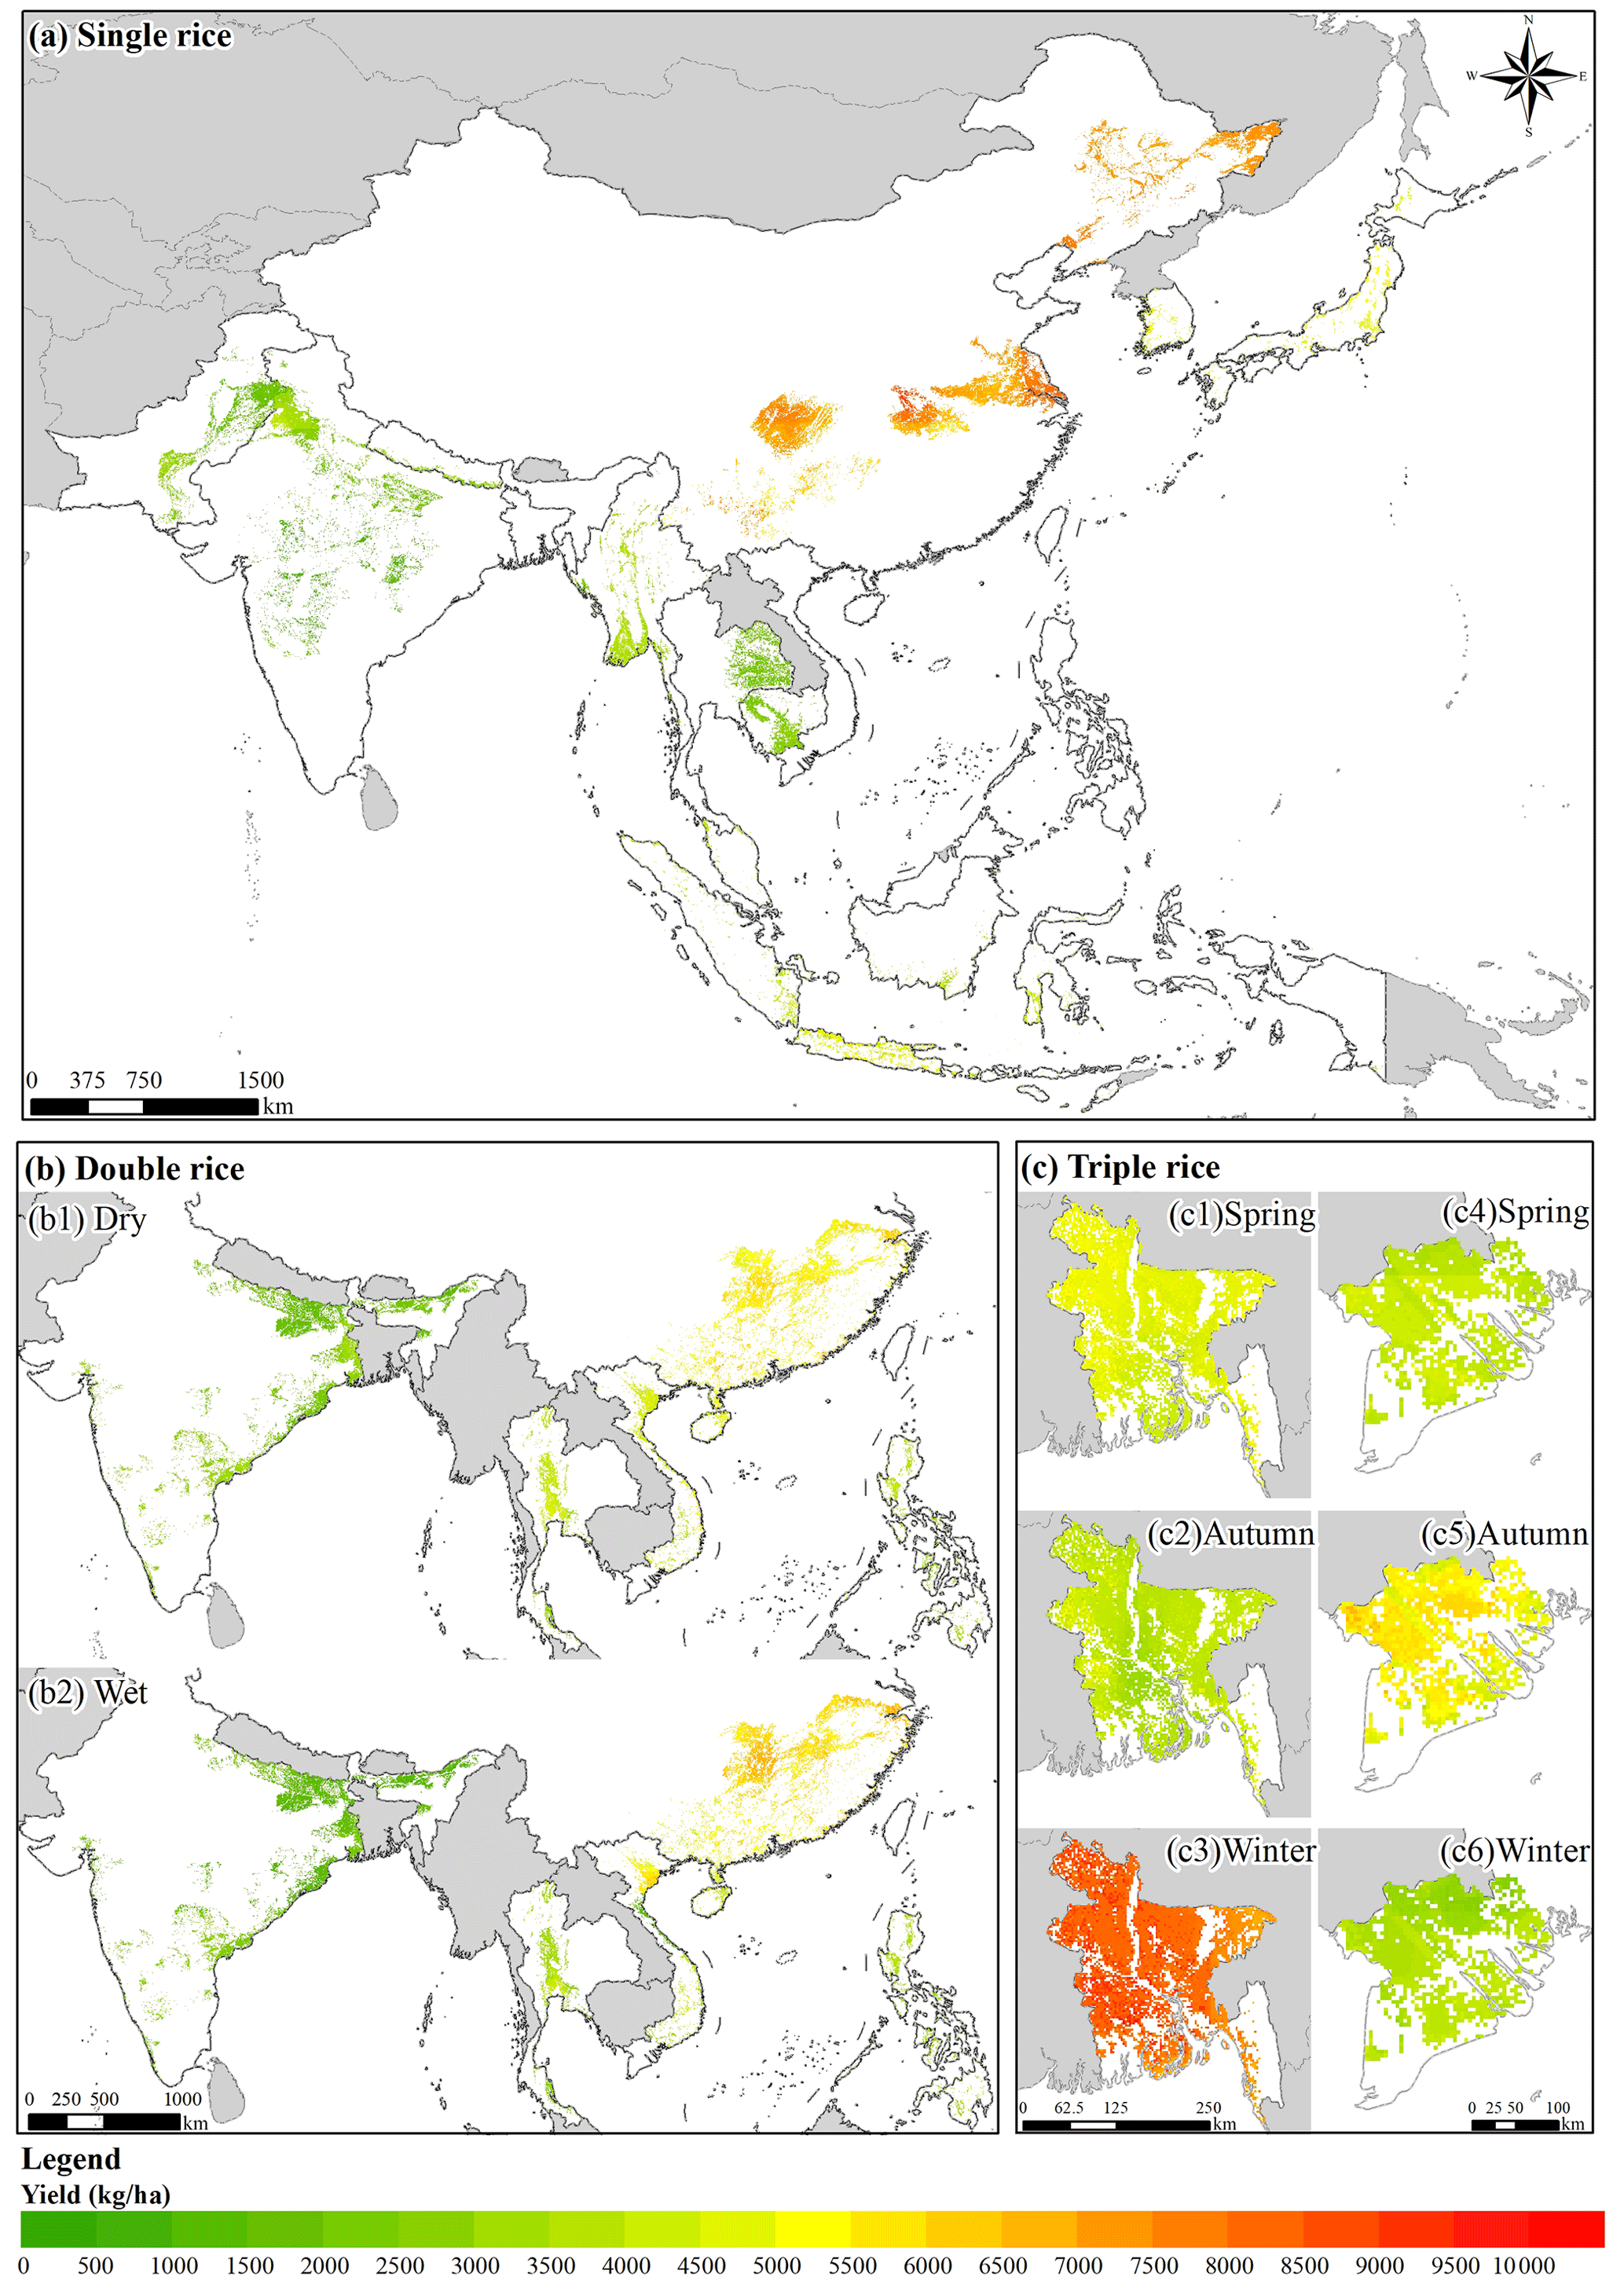
Figure 7Spatial patterns of the estimated rice yields (averages for the 1995–2015 period) for different seasons.
Temporally, the interannual rate of yield change (defined as the yield difference between the previous year and the current year divided by the yield of the previous year) from 1995 to 2015 for each case is shown in Fig. 8. The annual rate ranges from −18.55 % to 25.57 %. The average interannual rate during the 1995–2015 period increases in most cases, with the exception of single rice in Japan (−0.01 %) and the early season of double-rice systems in Thailand (−0.11 %). Among all cases, the greatest average rate is 2.65 % in Cambodia.
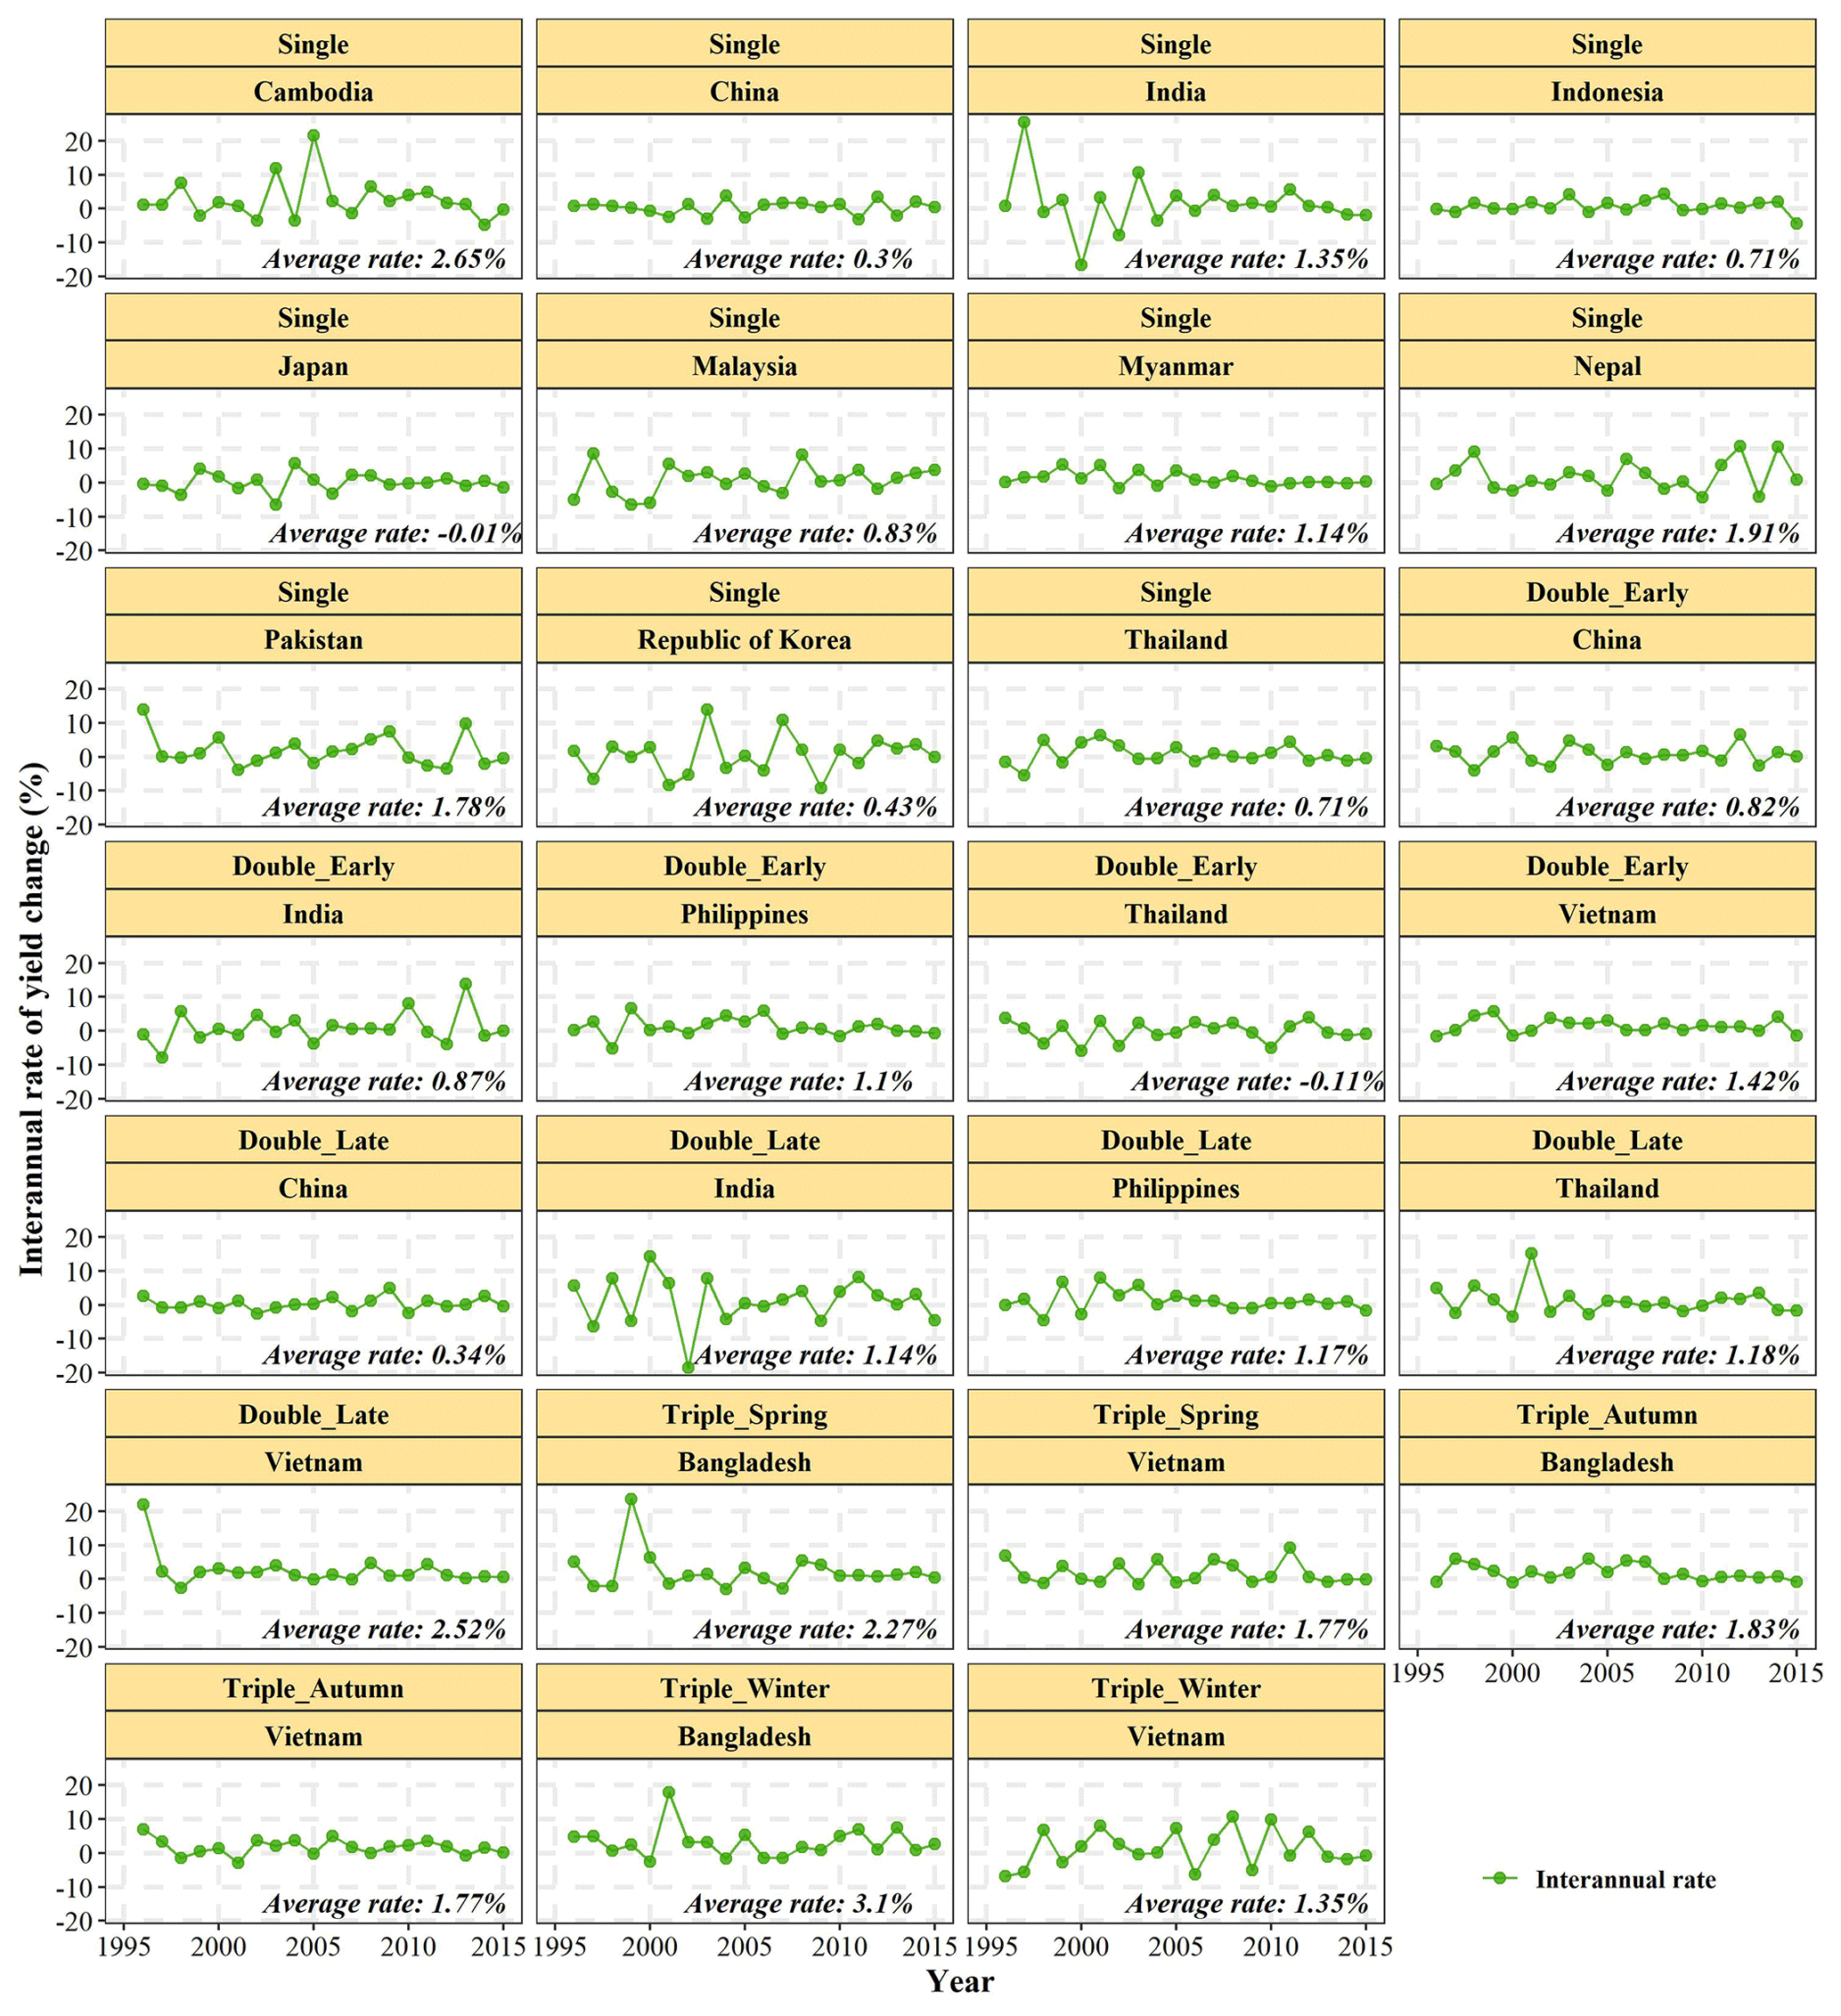
Figure 8Temporal variation in the estimated rice yield change for different seasons from 1995 to 2015.
4.1 The frequency and importance of the predictors in ML models
In this study, 50 predictors were used in ML models, but their contributions greatly varied. First, only predictors with a significant correlation with yields were selected for ML models, with the exception of temporal and spatial predictors (year, long, lat and ele) (see Sect. 2.3.2 for details). As a result, the selection frequency of temporal and spatial predictors was 27 times, and the selection frequency of other predictors ranged from 2 to 25 times (Fig. 9a). Using the selected predictors, ML models then estimated rice yields and ranked the importance of each predictor (Fig. 9a). The results show that temporal and spatial predictors had relatively greater average importance (>0.05) and that the importance of the remaining predictors was lower than 0.03 (Fig. 9a).
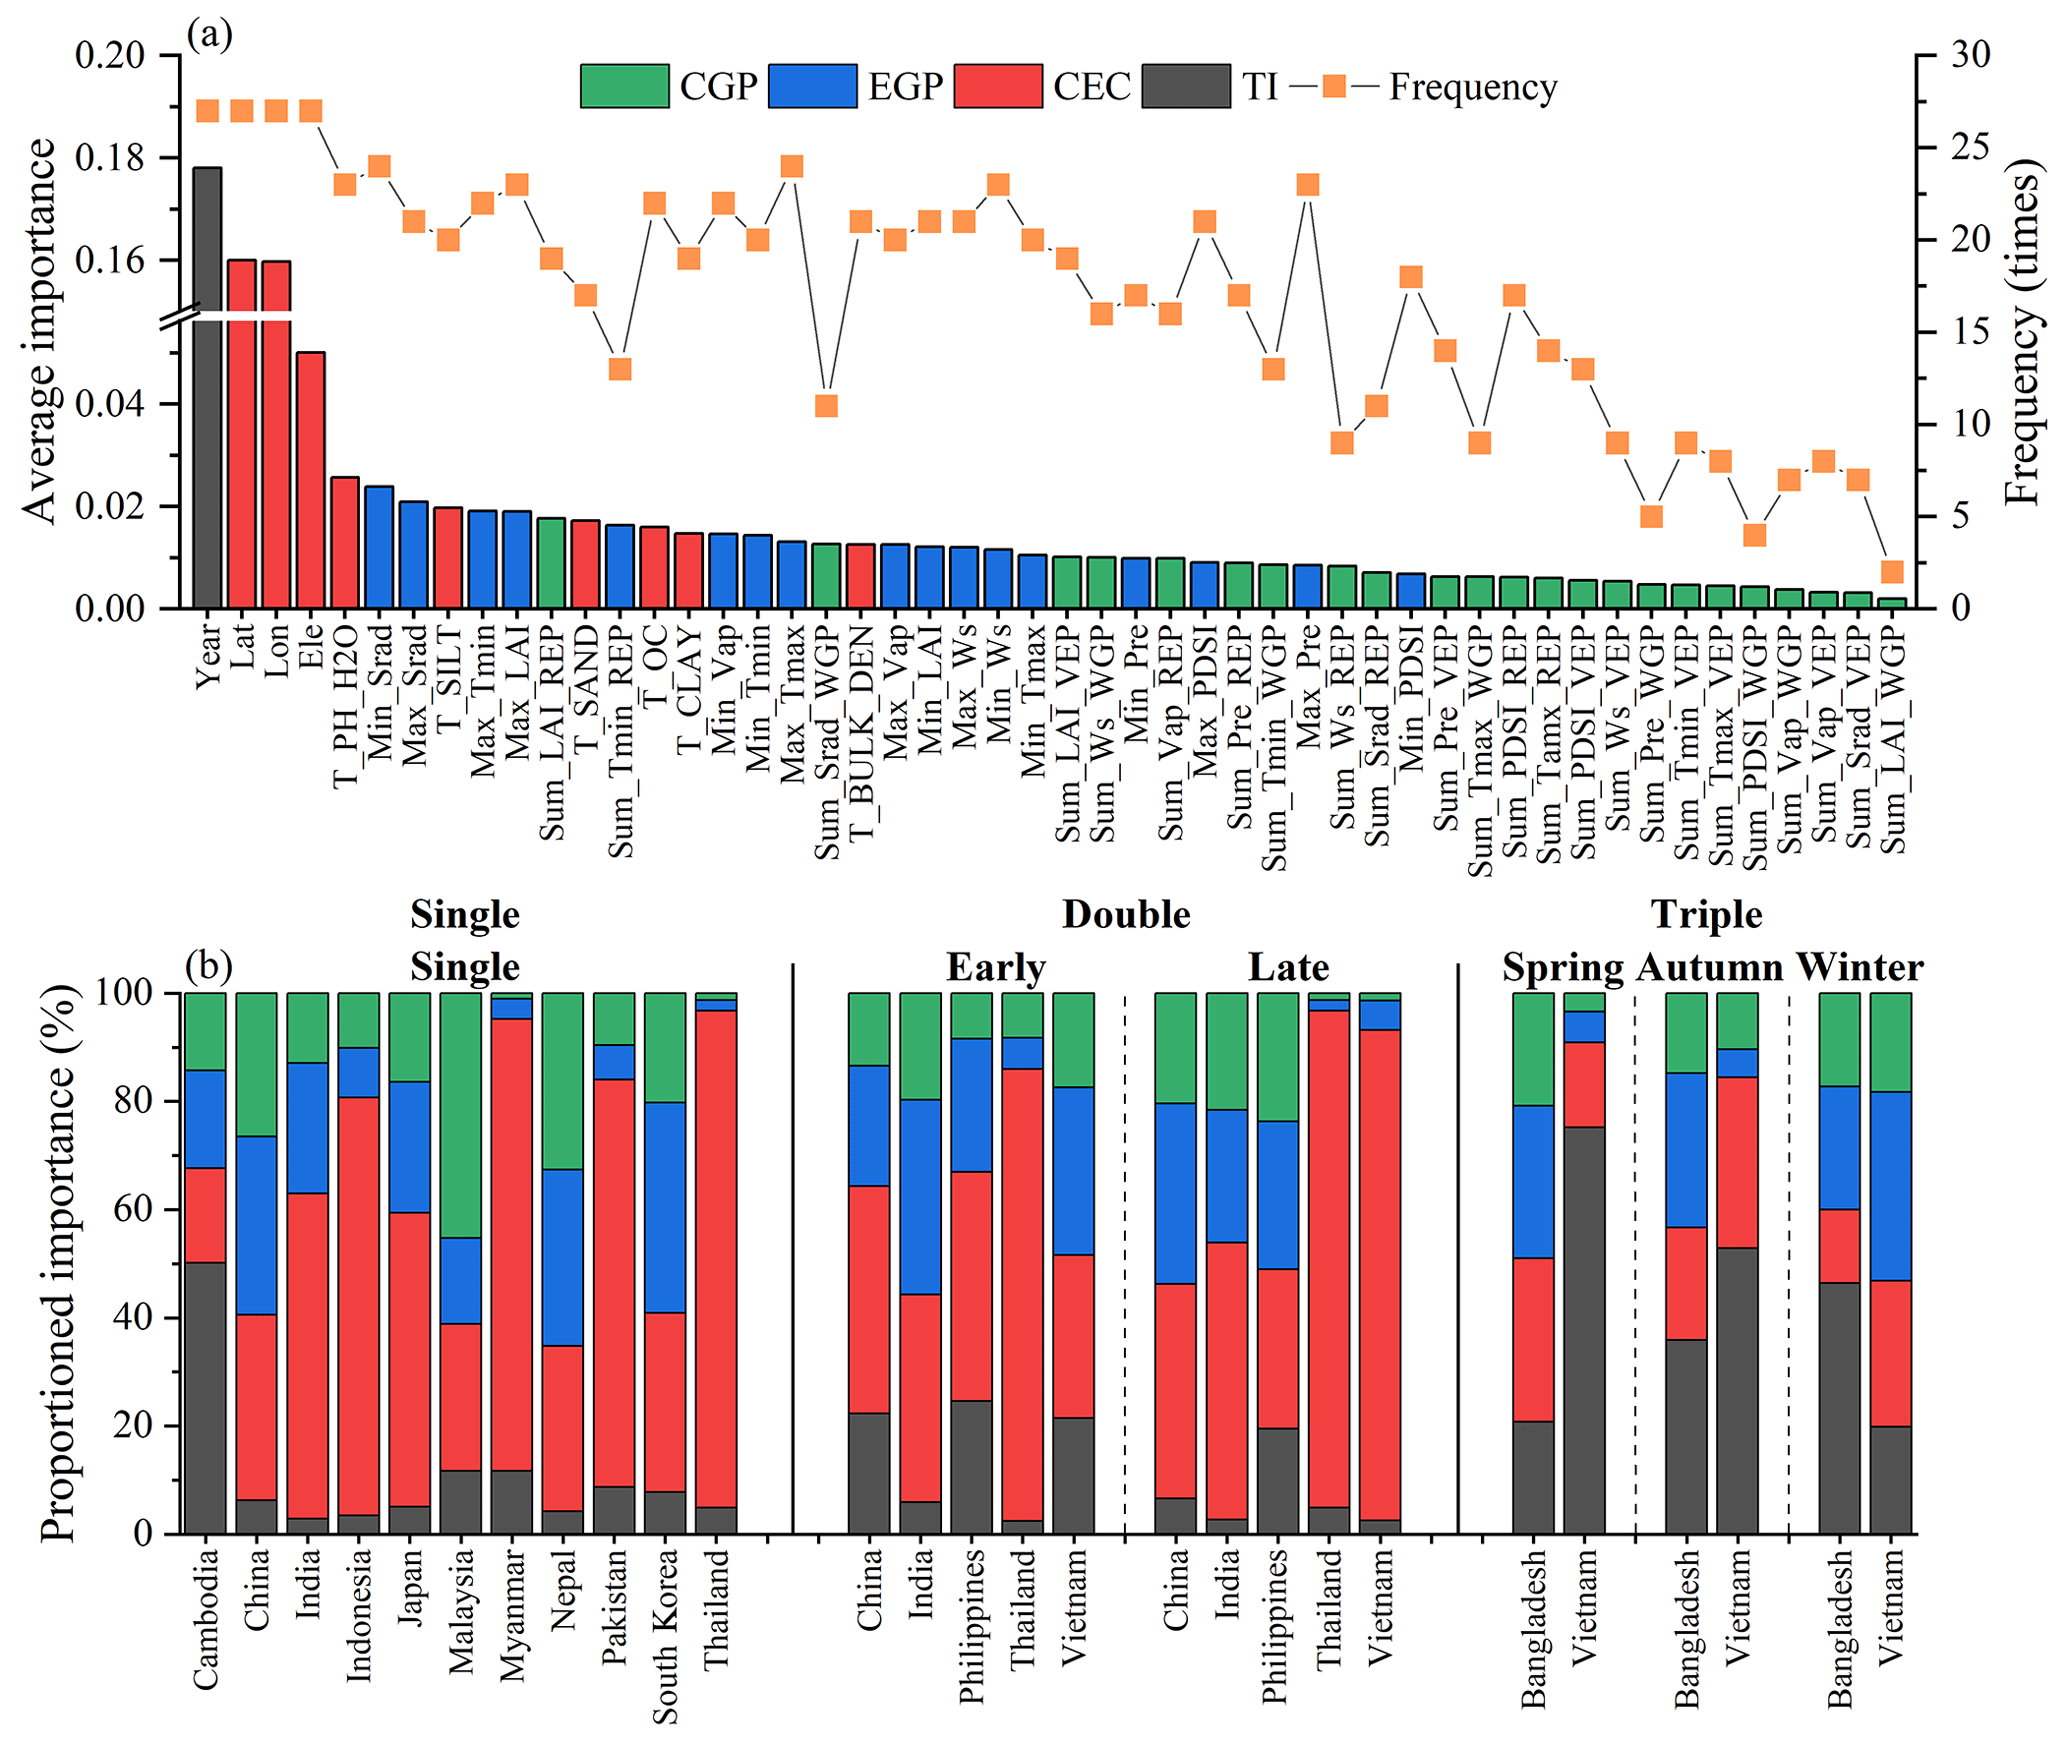
Figure 9Panel (a) shows the average frequency and importance of each predictor, and panel (b) presents the proportioned importance of each predictor category for seasonal rice.
For different growing periods, the REP predictors had greater average importance (0.010) in ML models, followed by the WGP and VEP predictors (0.007 and 0.005, respectively). The average selection frequency for the WGP and VEP predictors (8.4 and 10.9 times, respectively) was much lower than that of REP (14.5 times). Therefore, REP predictors contributed the most to yield estimation, which was also consistent with previous studies (Chang et al., 2005; Nazir et al., 2021). In addition, we also found that EGPs had greater average importance and selection frequency (0.014 and 21.3 times, respectively) than CGPs (0.007 and 11.3 times, respectively), indicating the stronger response of rice yields to extreme growth conditions.
Figure 9b further shows the proportioned importance of the four predictor categories for each rice season. Although the proportioned importance varied for different rice seasons, the overall contribution was highest for CECs (45 %), followed by EGPs (21 %), TI (18 %) and CGPs (16 %). CECs had the greatest proportioned importance for most countries, which suggested the great importance of the geographical environment for rice yield estimation. More interestingly, the importance of CECs for Myanmar, Thailand and the late season of Vietnam exceeded 0.8.
4.2 Improvements in AsiaRiceYield4km
AsiaRiceYield4km is a seasonal rice yield product with a high spatiotemporal resolution and a long time span across the dynamic rice cultivation areas in the main rice-producing countries of Asia. Compared with SPAM, the spatial resolution of AsiaRiceYield4km is 4 km, which is the current highest resolution among all rice yield datasets. Additionally, the product period covers the years from 1995 to 2015, includes multi-seasonal rice yields within 1 year and incorporates more information than most other rice yield datasets. Similarly, AsiaRiceYield4km considers both the annual dynamic change in rice cultivation areas and phenological information at the grid scale, rather than a constant cultivation area map and a fixed growing period. Such dynamic information assisted us in capturing better spatial and temporal variations in rice yields and, consequently, greatly improved the accuracy of our product. Moreover, we applied four predictor categories and the optimal ML models to estimate seasonal yields. Four predictor categories provided comprehensive rice growth information to ensure the accuracy of yield estimations. The optimal models for each rice season are determined by the IPW method. As it is a weighted ensemble assessment that fully considers training, validation and testing accuracy, we are certain that the IPW method is more robust and reasonable with respect to selecting the optimal model for seasonal rice yield in Asia.
4.3 Uncertainty analysis
With respect to the spatial uncertainty, the RRMSE values in most areas were below 30 %, indicating the low uncertainty in AsiaRiceYield4km. High uncertainty in the RRMSE (above 50 %) was distributed in northeastern China and western India for single rice and in central Bangladesh for the winter season of triple rice (Fig. 10).
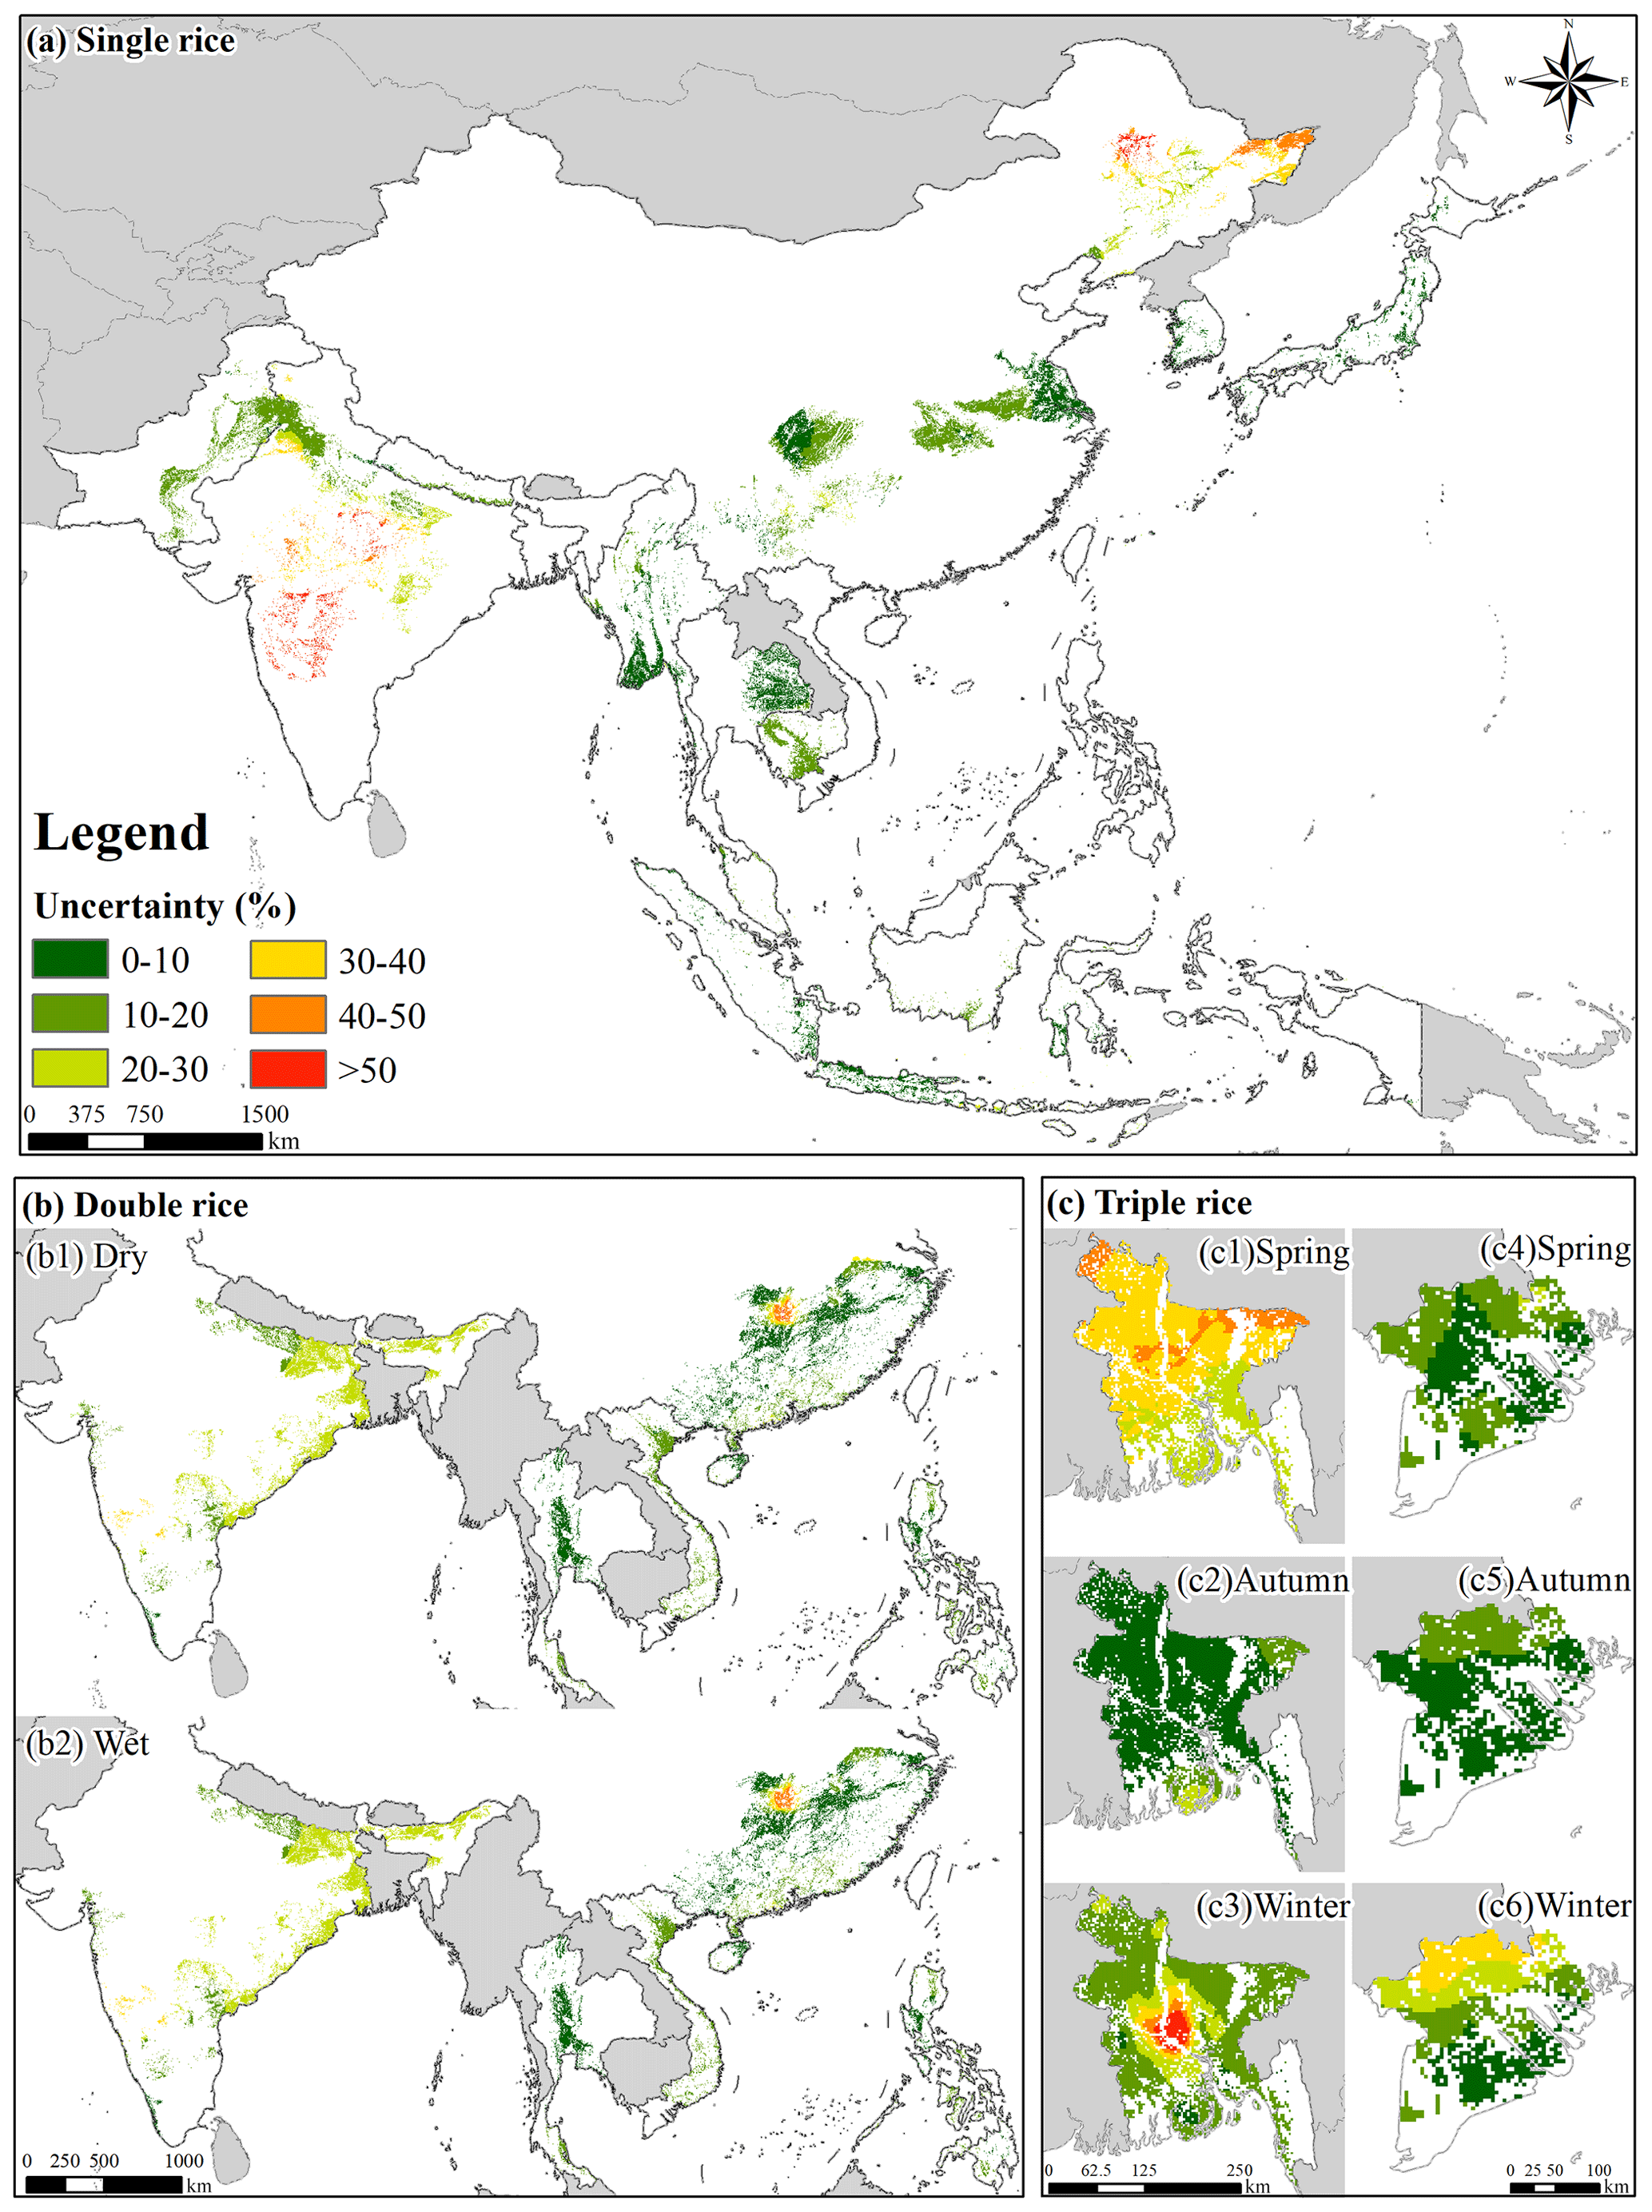
Figure 10The spatial distribution of uncertainty (RRMSE, %) in AsiaRiceYield4km.
In this study, we have improved the yield prediction processes in order to ensure the accuracy of the AsiaRiceYield4km product as much as possible; however, several factors might still negatively impact its accuracy. Due to the limitations of remote sensing techniques (e.g., clouds and topography), some rice paddy areas cannot be recognized, leading to map errors (Han et al., 2022). Moreover, the use of rice areas before 2000, based on the combined rice area from 2000 to 2002, also introduces some uncertainty due to the unavailability of specific information on these rice areas. The spatial resolutions of multisource data also cause uncertainty. For example, given that the rice cultivation areas in Asia are always fragmented (Lowder et al., 2016) but the LAI resolution in this study is somewhat coarser (0.05∘), mixed-pixel effects will inevitably influence the accuracy of AsiaRiceYield4km in small rice cultivation areas. Although the GLASS LAI has highest accuracy and lowest uncertainty, and we have made several efforts to mitigate the uncertainty, there is still uncertainty and inevitable effects on the rice yield estimation (Liu et al., 2018; Li et al., 2018; Fang et al., 2019; Chen et al., 2020). In addition, the crop intensity used in this study is an administrative-scale value. The annual crop intensity variation in rice still alters the yield estimation results. Finally, due to the lack of a process-based mechanism, ML is weakly traceable and interpretable for rice yield variability (Muruganantham et al., 2022), especially for extreme rice yields. Nevertheless, compared with other public products (Fig. 6), our methods still generated better seasonal rice yield predictions at a higher spatiotemporal resolution for a longer period.
The seasonal rice yield product for Asia during the 1995–2015 period (AsiaRiceYield4km) is available at https://doi.org/10.5281/zenodo.6901968 (Wu et al., 2022). We encourage users to independently verify data products before using them.
We produced a long-term seasonal rice yield dataset with a high spatiotemporal resolution on dynamic rice paddy areas in Asia by using multisource data and ML models. Our AsiaRiceYield4km dataset has higher accuracy than other public datasets and shows more spatial consistency with the observed yield. We attributed such improvements to more dynamic information (e.g., rice area and phenological dates), full consideration of rice growth conditions and the novel IPW method to select the optimal ML model. Moreover, we discovered that constant environmental conditions contributed the most (∼ 45 %) to rice yield prediction compared with other growing conditions. REP predictors had a higher impact on yield predictions than those in the WGP and VEP. Our dataset can address the lack of seasonal rice yield datasets and support studies related to agricultural production and development.
The supplement related to this article is available online at: https://doi.org/10.5194/essd-15-791-2023-supplement.
The author contributions are as follows: ZZ and FT – conceptualization; YL and JH – data curation; HW and JZ – formal analysis; JZ, ZZ and FT – funding acquisition; JC, JH, HW, JZ, LZ and YL – investigation; JZ and HW – methodology; HW and JZ – software; ZZ, FT and JX – supervision; JZ and JH – validation; HW and JZ – visualization; HW and JZ – original draft preparation; JZ, ZZ and QM – reviewing and editing the manuscript. All authors have read and agreed to the published version of the paper.
The contact author has declared that none of the authors has any competing interests.
Publisher’s note: Copernicus Publications remains neutral with regard to jurisdictional claims in published maps and institutional affiliations.
The authors would like to thank the editors and anonymous reviewers for their valuable comments. We are also grateful for support from the open project of the Key Laboratory of Environmental Change and Natural Disasters, Ministry of Education, Beijing Normal University.
This research has been supported by the National Key Research and Development Program of China (grant no. 2020YFA0608201), the National Postdoctoral Program for Innovative Talents (grant no. BX20200064) and the National Natural Science Foundation of China (grant nos. 42061144003, 41977405 and 42101095).
This paper was edited by Hao Shi and reviewed by two anonymous referees.
Abatzoglou, J. T., Dobrowski, S. Z., Parks, S. A., and Hegewisch, K. C.: Monthly climate and climatic water balance for global terrestrial surfaces from 1958–2015, Northwest Knowledge Network [data set], https://doi.org/10.7923/G43J3B0R, 2017.
Abatzoglou, J. T., Dobrowski, S. Z., Parks, S. A., and Hegewisch, K. C.: TerraClimate, a high-resolution global dataset of monthly climate and climatic water balance from 1958–2015, Sci. Data, 5, 170191, https://doi.org/10.1038/sdata.2017.191, 2018.
Alexandratos, N. and Bruinsma, J.: World agriculture towards 2030/2050: the 2012 revision, Food and Agriculture Organization of the United Nations, https://doi.org/10.22004/ag.econ.288998, 2012.
Arumugam, P., Chemura, A., Schauberger, B., and Gornott, C.: Remote Sensing Based Yield Estimation of Rice (Oryza Sativa L.) Using Gradient Boosted Regression in India, Remote Sens., 13, 2379, https://doi.org/10.3390/rs13122379, 2021.
Bandumula, N.: Rice production in Asia: Key to global food security, Proc. Natl. Acad. Sci. India Sect. B Biol. Sci., 88, 1323–1328, https://doi.org/10.1007/s40011-017-0867-7, 2018.
Birla, D. S., Malik, K., Sainger, M., Chaudhary, D., Jaiwal, R., and Jaiwal, P. K.: Progress and challenges in improving the nutritional quality of rice (Oryza sativa L.), Crit. Rev. Food Sci. Nutr., 57, 2455–2481, https://doi.org/10.1080/10408398.2015.1084992, 2017.
Blomqvist, L., Yates, L., and Brook, B. W.: Drivers of increasing global crop production: A decomposition analysis, Environ. Res. Lett., 15, 0940b6, https://doi.org/10.1088/1748-9326/ab9e9c, 2020.
Breiman, L.: Bagging predictors, Mach. Learn., 24, 123–140, https://doi.org/10.1007/BF00058655, 1996.
Breiman, L.: Random forests, Mach. Learn., 45, 5–32, https://doi.org/10.1023/A:1010933404324, 2001.
Cai, Y., Guan, K., Lobell, D., Potgieter, A. B., Wang, S., Peng, J., Xu, T., Asseng, S., Zhang, Y., and You, L.: Integrating satellite and climate data to predict wheat yield in Australia using machine learning approaches, Agric. For. Meteorol., 274, 144–159, https://doi.org/10.1016/j.agrformet.2019.03.010, 2019.
Cao, J., Zhang, Z., Tao, F., Zhang, L., Luo, Y., Han, J., and Li, Z.: Identifying the Contributions of Multi-Source Data for Winter Wheat Yield Prediction in China, Remote Sens., 12, 750, https://doi.org/10.3390/rs12050750, 2020.
Cao, J., Zhang, Z., Tao, F., Zhang, L., Luo, Y., Zhang, J., Han, J., and Xie, J.: Integrating Multi-Source Data for Rice Yield Prediction across China using Machine Learning and Deep Learning Approaches, Agric. For. Meteorol., 297, 108275, https://doi.org/10.1016/j.agrformet.2020.108275, 2021.
Chang, K.-W., Shen, Y., and Lo, J.-C.: Predicting rice yield using canopy reflectance measured at booting stage, Agron. J., 97, 872–878, https://doi.org/10.2134/agronj2004.0162, 2005.
Chen, H., Zhu, G., Zhang, K., Bi, J., Jia, X., Ding, B., Zhang, Y., Shang, S., Zhao, N., and Qin, W.: Evaluation of evapotranspiration models using different LAI and meteorological forcing data from 1982 to 2017, Remote Sens., 12, 2473, https://doi.org/10.3390/rs12152473, 2020.
Chen, S., Liu, W., Feng, P., Ye, T., Ma, Y., and Zhang, Z.: Improving Spatial Disaggregation of Crop Yield by Incorporating Machine Learning with Multisource Data: A Case Study of Chinese Maize Yield, Remote Sens., 14, 2340, https://doi.org/10.3390/rs14102340, 2022.
Chen, T. and Guestrin, C.: Xgboost: A scalable tree boosting system, in: Proceedings of the 22nd ACM SIGKDD International Conference on Knowledge Discovery and Data Mining, San Francisco, CA, USA, 13–17 August 2016, 785–794, https://doi.org/10.1145/2939672.2939785, 2016.
Chen, Y., Song, X., Wang, S., Huang, J., and Mansaray, L. R.: Impacts of spatial heterogeneity on crop area mapping in Canada using MODIS data, ISPRS J. Photogramm. Remote Sens., 119, 451–461, https://doi.org/10.1016/j.isprsjprs.2016.07.007, 2016.
Chen, Y., Zhang, Z., Tao, F., Palosuo, T., and Rötter, R. P.: Impacts of heat stress on leaf area index and growth duration of winter wheat in the North China Plain, Field Crops Res., 222, 230–237, https://doi.org/10.1016/j.fcr.2017.06.007, 2018.
Chlingaryan, A., Sukkarieh, S., and Whelan, B.: Machine learning approaches for crop yield prediction and nitrogen status estimation in precision agriculture: A review, Comput. Electron. Agric., 151, 61–69, https://doi.org/10.1016/j.compag.2018.05.012, 2018.
Dawe, D., Pandey, S., and Nelson, A.: Emerging trends and spatial patterns of rice production, in: Rice in the global economy: Strategic research and policy issues for food security, edited by: Sushil, P., Derek, B., David, D., Achim, D., Samarendu, M., Scott, R., and Bill, H., International Rice Research Institute (IRRI), Los Baños, Philippines, 15–36, ISBN 978-971-22-0258-2, 2010.
Dinh, T. L. A. and Aires, F.: Nested leave-two-out cross-validation for the optimal crop yield model selection, Geosci. Model Dev., 15, 3519–3535, https://doi.org/10.5194/gmd-15-3519-2022, 2022.
Fang, H., Zhang, Y., Wei, S., Li, W., Ye, Y., Sun, T., and Liu, W.: Validation of global moderate resolution leaf area index (LAI) products over croplands in northeastern China, Remote Sens. Environ., 233, 111377, https://doi.org/10.1016/j.rse.2019.111377, 2019.
Fernandez-Beltran, R., Baidar, T., Kang, J., and Pla, F.: Rice-yield prediction with multi-temporal sentinel-2 data and 3D CNN: A case study in Nepal, Remote Sens., 13, 1391, https://doi.org/10.3390/rs13071391, 2021.
Folberth, C., Skalský, R., Moltchanova, E., Balkovič, J., Azevedo, L. B., Obersteiner, M., and Van Der Velde, M.: Uncertainty in soil data can outweigh climate impact signals in global crop yield simulations, Nat. Commun., 7, 11872, https://doi.org/10.1038/ncomms11872, 2016.
Folberth, C., Khabarov, N., Balkovič, J., Skalsk?, R., Visconti, P., Ciais, P., Janssens, I. A., Peñuelas, J., and Obersteiner, M.: The global cropland-sparing potential of high-yield farming, Nat. Sustain., 3, 281–289, https://doi.org/10.1038/s41893-020-0505-x, 2020.
Food and Agriculture Organization of the United Nations (FAO): Crops and livestock products, https://www.fao.org/faostat/en/#data/QCL/visualize, last access: 6 April 2022.
Fritz, S., See, L., Bayas, J. C. L., Waldner, F., Jacques, D., Becker-Reshef, I., Whitcraft, A., Baruth, B., Bonifacio, R., and Crutchfield, J.: A comparison of global agricultural monitoring systems and current gaps, Agric. Syst., 168, 258–272, https://doi.org/10.1016/j.agsy.2018.05.010, 2019.
GLOBE Task Team and others: The Global Land One-kilometer Base Elevation (GLOBE) Digital Elevation Model, Version 1.0., National Oceanic and Atmospheric Administration, National Geophysical Data Center [data set], http://www.ngdc.noaa.gov/mgg/topo/globe.html (last access: 13 February 2023), 1999.
Han, J., Zhang, Z., Luo, Y., Cao, J., Zhang, L., Cheng, F., Zhuang, H., and Zhang, J.: APRA500: a 500 m annual paddy rice dataset for monsoon Asia using multisource remote sensing data, Zenodo [data set], https://doi.org/10.5281/zenodo.5555721, 2021.
Han, J., Zhang, Z., Luo, Y., Cao, J., Zhang, L., Zhuang, H., Cheng, F., Zhang, J., and Tao, F.: Annual paddy rice planting area and cropping intensity datasets and their dynamics in the Asian monsoon region from 2000 to 2020, Agric. Syst., 200, 103437, https://doi.org/10.1016/j.agsy.2022.103437, 2022.
He, T., Xie, C., Liu, Q., Guan, S., and Liu, G.: Evaluation and comparison of random forest and A-LSTM networks for large-scale winter wheat identification, Remote Sens., 11, 1665, https://doi.org/10.3390/rs11141665, 2019.
Hochreiter, S. and Schmidhuber, J.: Long short-term memory, Neural Comput., 9, 1735–1780, https://doi.org/10.1162/neco.1997.9.8.1735, 1997.
Huang, J., Wang, X., Li, X., Tian, H., and Pan, Z.: Remotely sensed rice yield prediction using multi-temporal NDVI data derived from NOAA's-AVHRR, PloS ONE, 8, e70816, https://doi.org/10.1371/journal.pone.0070816, 2013.
Huntington, T., Cui, X., Mishra, U., and Scown, C. D.: Machine learning to predict biomass sorghum yields under future climate scenarios, Biofuels Bioprod. Biorefining, 14, 566–577, https://doi.org/10.1002/bbb.2087, 2020.
Iizumi, T. and Sakai, T.: The global dataset of historical yields for major crops 1981–2016, Sci. Data, 7, 97, https://doi.org/10.1038/s41597-020-0433-7, 2020.
Iizumi, T., Yokozawa, M., Sakurai, G., Travasso, M. I., Romanenkov, V., Oettli, P., Newby, T., Ishigooka, Y., and Furuya, J.: Historical changes in global yields: major cereal and legume crops from 1982 to 2006, Glob. Ecol. Biogeogr., 23, 346–357, https://doi.org/10.1111/geb.12120, 2014.
Iizumi, T., Hosokawa, N., and Wagai, R.: Soil carbon-food synergy: sizable contributions of small-scale farmers, CABI Agric. Biosci., 2, 43, https://doi.org/10.1186/s43170-021-00063-6, 2021.
Jeong, S., Ko, J., and Yeom, J.-M.: Predicting rice yield at pixel scale through synthetic use of crop and deep learning models with satellite data in South and North Korea, Sci. Total Environ., 802, 149726, https://doi.org/10.1016/j.scitotenv.2021.149726, 2022.
Kaltenegger, K. and Winiwarter, W.: Global gridded nitrogen indicators: influence of crop maps, Glob. Biogeochem. Cycles, 34, e2020GB006634, https://doi.org/10.1029/2020GB006634, 2020.
Kim, K.-H., Doi, Y., Ramankutty, N., and Iizumi, T.: A review of global gridded cropping system data products, Environ. Res. Lett., 16, 093005, https://doi.org/10.1088/1748-9326/ac20f4, 2021.
Laborte, A. G., Gutierrez, M. A., Balanza, J. G., Saito, K., Zwart, S. J., Boschetti, M., Murty, M. V. R., Villano, L., Aunario, J. K., Reinke, R., Koo, J., Hijmans, R. J., and Nelson, A.: RiceAtlas, a spatial database of global rice calendars and production, Sci. Data, 4, 170074, https://doi.org/10.1038/sdata.2017.74, 2017.
Lambin, E. F. and Meyfroidt, P.: Global land use change, economic globalization, and the looming land scarcity, P. Natl. Acad. Sci. USA, 108, 3465–3472, https://doi.org/10.1073/pnas.1100480108, 2011.
LeCun, Y., Bengio, Y., and Hinton, G.: Deep learning, Nature, 521, 436–444, https://doi.org/10.1038/nature14539, 2015.
Li, X., Lu, H., Yu, L., and Yang, K.: Comparison of the spatial characteristics of four remotely sensed leaf area index products over China: Direct validation and relative uncertainties, Remote Sens., 10, 148, https://doi.org/10.3390/rs10010148, 2018.
Liang, S., Cheng, J., Jia, K., Jiang, B., Liu, Q., Xiao, Z., Yao, Y., Yuan, W., Zhang, X., and Zhao, X.: The global land surface satellite (GLASS) product suite, B. Am. Meteorol. Soc., 102, E323–E337, https://doi.org/10.1175/BAMS-D-18-0341.1, 2021.
Lin, T.-S., Song, Y., Lawrence, P., Kheshgi, H. S., and Jain, A. K.: Worldwide Maize and Soybean Yield Response to Environmental and Management Factors Over the 20th and 21st Centuries, J. Geophys. Res.-Biogeo., 126, e2021JG006304, https://doi.org/10.1029/2021JG006304, 2021.
Liu, C., Huang, H., and Sun, F.: A Pixel-Based Vegetation Greenness Trend Analysis over the Russian Tundra with All Available Landsat Data from 1984 to 2018, Remote Sens., 13, 4933, https://doi.org/10.3390/rs13234933, 2021.
Liu, W., Dugar, S., McCallum, I., Thapa, G., See, L., Khadka, P., Budhathoki, N., Brown, S., Mechler, R., Fritz, S., and Shakya, P.: Integrated Participatory and Collaborative Risk Mapping for Enhancing Disaster Resilience, Isprs Int. J. Geo-Inf., 7, 68, https://doi.org/10.3390/ijgi7020068, 2018.
Liu, W., Ye, T., Jägermeyr, J., Müller, C., Chen, S., Liu, X., and Shi, P.: Future climate change significantly alters interannual wheat yield variability over half of harvested areas, Environ. Res. Lett., https://doi.org/10.1088/1748-9326/ac1fbb, 2021.
Lowder, S. K., Skoet, J., and Raney, T.: The number, size, and distribution of farms, smallholder farms, and family farms worldwide, World Dev., 87, 16–29, https://doi.org/10.1016/j.worlddev.2015.10.041, 2016.
Luo, Y., Zhang, Z., Chen, Y., Li, Z., and Tao, F.: ChinaCropPhen1km: a high-resolution crop phenological dataset for three staple crops in China during 2000–2015 based on leaf area index (LAI) products, Earth Syst. Sci. Data, 12, 197–214, https://doi.org/10.5194/essd-12-197-2020, 2020a.
Luo, Y., Zhang, Z., Li, Z., Chen, Y., Zhang, L., Cao, J., and Tao, F.: Identifying the spatiotemporal changes of annual harvesting areas for three staple crops in China by integrating multi-data sources, Environ. Res. Lett., 15, 074003, https://doi.org/10.1088/1748-9326/ab80f0, 2020b.
Luo, Y., Zhang, Z., Cao, J., Zhang, L., Zhang, J., Han, J., Zhuang, H., Cheng, F., and Tao, F.: Accurately mapping global wheat production system using deep learning algorithms, Int. J. Appl. Earth Obs. Geoinformation, 110, 102823, https://doi.org/10.1016/j.jag.2022.102823, 2022.
Maclean, J. L., Dawe, D. C., Hettel, G. P., and Hettel, G. P. (Eds.): Rice almanac: Source book for the most important economic activity on earth, 3rd edn., CABI Publishing, Wallingford, UK, ISBN 0851996361, 2002.
Manfron, G., Delmotte, S., Busetto, L., Hossard, L., Ranghetti, L., Brivio, P. A., and Boschetti, M.: Estimating inter-annual variability in winter wheat sowing dates from satellite time series in Camargue, France, Int. J. Appl. Earth Obs. Geoinformation, 57, 190–201, https://doi.org/10.1016/j.jag.2017.01.001, 2017.
Meroni, M., Waldner, F., Seguini, L., Kerdiles, H., and Rembold, F.: Yield forecasting with machine learning and small data: what gains for grains?, Agric. For. Meteorol., 308, 108555, https://doi.org/10.1016/j.agrformet.2021.108555, 2021.
Monfreda, C., Ramankutty, N., and Foley, J. A.: Farming the planet: 2. Geographic distribution of crop areas, yields, physiological types, and net primary production in the year 2000, Glob. Biogeochem. Cycles, 22, 259–277, https://doi.org/10.1029/2007GB002947, 2008.
Mosleh, M. K., Hassan, Q. K., and Chowdhury, E. H.: Application of remote sensors in mapping rice area and forecasting its production: A review, Sensors, 15, 769–791, https://doi.org/10.3390/s150100769, 2015.
Muehe, E. M., Wang, T., Kerl, C. F., Planer-Friedrich, B., and Fendorf, S.: Rice production threatened by coupled stresses of climate and soil arsenic, Nat. Commun., 10, 4985, https://doi.org/10.1038/s41467-019-12946-4, 2019.
Müller, C., Elliott, J., Kelly, D., Arneth, A., Balkovic, J., Ciais, P., Deryng, D., Folberth, C., Hoek, S., Izaurralde, R. C., Jones, C. D., Khabarov, N., Lawrence, P., Liu, W., Olin, S., Pugh, T. A. M., Reddy, A., Rosenzweig, C., Ruane, A. C., Sakurai, G., Schmid, E., Skalsky, R., Wang, X., de Wit, A., and Yang, H.: The Global Gridded Crop Model Intercomparison phase 1 simulation dataset, Sci. Data, 6, 50, https://doi.org/10.1038/s41597-019-0023-8, 2019.
Muruganantham, P., Wibowo, S., Grandhi, S., Samrat, N. H., and Islam, N.: A Systematic Literature Review on Crop Yield Prediction with Deep Learning and Remote Sensing, Remote Sens., 14, 1990, https://doi.org/10.3390/rs14091990, 2022.
Nazir, A., Ullah, S., Saqib, Z. A., Abbas, A., Ali, A., Iqbal, M. S., Hussain, K., Shakir, M., Shah, M., and Butt, M. U.: Estimation and Forecasting of Rice Yield Using Phenology-Based Algorithm and Linear Regression Model on Sentinel-II Satellite Data, Agriculture, 11, 1026, https://doi.org/10.3390/agriculture11101026, 2021.
Obsie, E. Y., Qu, H., and Drummond, F.: Wild blueberry yield prediction using a combination of computer simulation and machine learning algorithms, Comput. Electron. Agric., 178, 105778, https://doi.org/10.1016/j.compag.2020.105778, 2020.
Qian, H., Huang, S., Chen, J., Wang, L., Hungate, B. A., van Kessel, C., Zhang, J., Deng, A., Jiang, Y., and van Groenigen, K. J.: Lower-than-expected CH4 emissions from rice paddies with rising CO2 concentrations, Glob. Change Biol., 26, 2368–2376, https://doi.org/10.1111/gcb.14984, 2020.
Ray, D. K., West, P. C., Clark, M., Gerber, J. S., Prishchepov, A. V., and Chatterjee, S.: Climate change has likely already affected global food production, PloS One, 14, e0217148, https://doi.org/10.1371/journal.pone.0217148, 2019.
Ripley, B. D.: Pattern recognition and neural networks, 1st edn., Cambridge University Press, New York, USA, ISBN 9780521717700, 2007.
Sak, H., Senior, A., and Beaufays, F.: Long short-term memory based recurrent neural network architectures for large vocabulary speech recognition, arXiv [preprint], https://doi.org/10.48550/arXiv.1402.1128, 5 February 2014.
Sakamoto, T.: Incorporating environmental variables into a MODIS-based crop yield estimation method for United States corn and soybeans through the use of a random forest regression algorithm, ISPRS J. Photogramm. Remote Sens., 160, 208–228, https://doi.org/10.1016/j.isprsjprs.2019.12.012, 2020.
Sakamoto, T., Yokozawa, M., Toritani, H., Shibayama, M., Ishitsuka, N., and Ohno, H.: A crop phenology detection method using time-series MODIS data, Remote Sens. Environ., 96, 366–374, https://doi.org/10.1016/j.rse.2005.03.008, 2005.
Salvacion, A. R.: Chapter 11 – Multiscale drought hazard assessment in the Philippines, in: Computers in Earth and Environmental Sciences, edited by: Pourghasemi, H. R., Elsevier, Amsterdam, Netherlands, 169–179, https://doi.org/10.1016/B978-0-323-89861-4.00024-5, 2022.
Shahhosseini, M., Hu, G., and Archontoulis, S. V.: Forecasting Corn Yield With Machine Learning Ensembles, Front. Plant Sci., 11, 1120, https://doi.org/10.3389/fpls.2020.01120, 2020.
Shahhosseini, M., Hu, G., Huber, I., and Archontoulis, S. V.: Coupling machine learning and crop modeling improves crop yield prediction in the US Corn Belt, Sci. Rep., 11, 1606, https://doi.org/10.1038/s41598-020-80820-1, 2021.
Son, N. T., Chen, C. F., Chen, C. R., Chang, L. Y., Duc, H. N., and Nguyen, L. D.: Prediction of rice crop yield using MODIS EVI- LAI data in the Mekong Delta, Vietnam, Int. J. Remote Sens., 34, 7275–7292, https://doi.org/10.1080/01431161.2013.818258, 2013.
Son, N.-T., Chen, C.-F., Chen, C.-R., Guo, H.-Y., Cheng, Y.-S., Chen, S.-L., Lin, H.-S., and Chen, S.-H.: Machine learning approaches for rice crop yield predictions using time-series satellite data in Taiwan, Int. J. Remote Sens., 41, 7868–7888, https://doi.org/10.1080/01431161.2020.1766148, 2020.
Srivastava, V. C. and Mahapatra, I. C.: Advances in Rice Production Technology: Theory and Practice, Agrobios Publishing, Jodhpur, India, ISBN 9788177544626, 2012.
Tian, H., Wang, P., Tansey, K., Zhang, J., Zhang, S., and Li, H.: An LSTM neural network for improving wheat yield estimates by integrating remote sensing data and meteorological data in the Guanzhong Plain, PR China, Agric. For. Meteorol., 310, 108629, https://doi.org/10.1016/j.agrformet.2021.108629, 2021.
van Klompenburg, T., Kassahun, A., and Catal, C.: Crop yield prediction using machine learning: A systematic literature review, Comput. Electron. Agric., 177, 105709, https://doi.org/10.1016/j.compag.2020.105709, 2020.
van Oort, P. A. and Zwart, S. J.: Impacts of climate change on rice production in Africa and causes of simulated yield changes, Glob. Change Biol., 24, 1029–1045, https://doi.org/10.1111/gcb.13967, 2018.
Wang, C., Zhang, Z., Chen, Y., Tao, F., Zhang, J., and Zhang, W.: Comparing different smoothing methods to detect double-cropping rice phenology based on LAI products – a case study in the Hunan province of China, Int. J. Remote Sens., 39, 6405–6428, https://doi.org/10.1080/01431161.2018.1460504, 2018.
Wieder, W. R., Boehnert, J., Bonan, G. B., and Langseth, M.: Regridded Harmonized World Soil Database v1.2, ORNL DAAC [data set], https://doi.org/10.3334/ORNLDAAC/1247, 2014.
Wu, H., Zhang, J., Zhang, Z., Han, J., Cao, J., Zhang, L., Luo, Y., Mei, Q., Xu, J., and Tao, F.: AsiaRiceYield4km: Seasonal Rice Yield in Asia from 1995 to 2015, Zenodo [data set], https://doi.org/10.5281/zenodo.6901968, 2022.
Xiao, Z., Liang, S., Wang, J., Chen, P., Yin, X., Zhang, L., and Song, J.: Use of general regression neural networks for generating the GLASS leaf area index product from time-series MODIS surface reflectance, IEEE T. Geosci. Remote, 52, 209–223, https://doi.org/10.1109/TGRS.2013.2237780, 2013.
Xiao, Z., Liang, S., Wang, J., Xiang, Y., Zhao, X., and Song, J.: Long-time-series global land surface satellite leaf area index product derived from MODIS and AVHRR surface reflectance, IEEE T. Geosci. Remote, 54, 5301–5318, https://doi.org/10.1109/TGRS.2016.2560522, 2016.
Xiao, Z., Liang, S., and Jiang, B.: Evaluation of four long time-series global leaf area index products, Agric. For. Meteorol., 246, 218–230, 2017.
You, L. and Wood, S.: An entropy approach to spatial disaggregation of agricultural production, Agric. Syst., 90, 329–347, https://doi.org/10.1016/j.agsy.2006.01.008, 2006.
Yu, Q., You, L., Wood-Sichra, U., Ru, Y., Joglekar, A. K. B., Fritz, S., Xiong, W., Lu, M., Wu, W., and Yang, P.: A cultivated planet in 2010 – Part 2: The global gridded agricultural-production maps, Earth Syst. Sci. Data, 12, 3545–3572, https://doi.org/10.5194/essd-12-3545-2020, 2020.
Zhang, G., Xiao, X., Dong, J., Xin, F., Zhang, Y., Qin, Y., Doughty, R. B., and Moore, B.: Fingerprint of rice paddies in spatial–temporal dynamics of atmospheric methane concentration in monsoon Asia, Nat. Commun., 11, 554, https://doi.org/10.1038/s41467-019-14155-5, 2020.
Zhang, J., Wu, H., Zhang, Z., Zhang, L., Luo, Y., Han, J., and Tao, F.: Asian Rice Calendar Dynamics Detected by Remote Sensing and Their Climate Drivers, Remote Sens., 13, 4189, https://doi.org/10.3390/rs14174189, 2022.
Zhang, L., Zhang, Z., Luo, Y., Cao, J., and Tao, F.: Combining Optical, Fluorescence, Thermal Satellite, and Environmental Data to Predict County-Level Maize Yield in China Using Machine Learning Approaches, Remote Sens., 12, 21, https://doi.org/10.3390/rs12010021, 2019.
Zhang, L., Zhang, Z., Luo, Y., Cao, J., Xie, R., and Li, S.: Integrating satellite-derived climatic and vegetation indices to predict smallholder maize yield using deep learning, Agric. For. Meteorol., 311, 108666, https://doi.org/10.1016/j.agrformet.2021.108666, 2021.
Zhang, T., Yang, X., Wang, H., Li, Y., and Ye, Q.: Climatic and technological ceilings for C hinese rice stagnation based on yield gaps and yield trend pattern analysis, Glob. Change Biol., 20, 1289–1298, https://doi.org/10.1111/gcb.12428, 2014.
Zhang, Z., Li, Z., Chen, Y., Zhang, L., and Tao, F.: Improving regional wheat yields estimations by multi-step-assimilating of a crop model with multi-source data, Agric. For. Meteorol., 290, 107993, https://doi.org/10.1016/j.agrformet.2020.107993, 2020.