the Creative Commons Attribution 4.0 License.
the Creative Commons Attribution 4.0 License.
 | 08 Feb 2023
TPHiPr: a long-term (1979–2020) high-accuracy precipitation dataset (1∕30°, daily) for the Third Pole region based on high-resolution atmospheric modeling and dense observations
Yaozhi Jiang
Youcun Qi
Xin Li
Yingying Chen
Xiaodong Li
Bingrong Zhou
Ali Mamtimin
Changkun Shao
Xiaogang Ma
Jiaxin Tian
Jianhong Zhou
Reliable precipitation data are highly necessary for geoscience research in the Third Pole (TP) region but still lacking, due to the complex terrain and high spatial variability of precipitation here. Accordingly, this study produces a long-term (1979–2020) high-resolution (∘, daily) precipitation dataset (TPHiPr) for the TP by merging the atmospheric simulation-based ERA5_CNN with gauge observations from more than 9000 rain gauges, using the climatologically aided interpolation and random forest methods. Validation shows that TPHiPr is generally unbiased and has a root mean square error of 5.0 mm d−1, a correlation of 0.76 and a critical success index of 0.61 with respect to 197 independent rain gauges in the TP, demonstrating that this dataset is remarkably better than the widely used datasets, including the latest generation of reanalysis (ERA5-Land), the state-of-the-art satellite-based dataset (IMERG) and the multi-source merging datasets (MSWEP v2 and AERA5-Asia). Moreover, TPHiPr can better detect precipitation extremes compared with these widely used datasets. Overall, this study provides a new precipitation dataset with high accuracy for the TP, which may have broad applications in meteorological, hydrological and ecological studies. The produced dataset can be accessed via https://doi.org/10.11888/Atmos.tpdc.272763 (Yang and Jiang, 2022).
- Article
(12939 KB) - Full-text XML
- BibTeX
- EndNote


The Third Pole (TP) region is one of the most complex terrain regions with high elevations and heterogeneous land surfaces, and strong water and energy exchanges between land surface and atmosphere exist in this region (Chen et al., 2021). Moreover, it is the source of many large Asian rivers, providing abundant water resources and hydropower within and beyond this region (Yao et al., 2022). Meanwhile, the TP suffers from frequent natural hazards (e.g., flash floods, debris flows, landslides), especially in the periphery of the TP (Cui and Jia, 2015). Reliable gridded precipitation data are essential for understanding hydrological processes, planning water resources and preventing natural hazards in the TP (Gao et al., 2021; Wang et al., 2018).
At present, quasi-global and regional precipitation datasets, including gauge-based products, satellite-based products and reanalysis products, have played an important role over the TP. These datasets include the Asian Precipitation – Highly-Resolved Observational Data Integration Towards Evaluation (APHRODITE; Yatagai et al., 2012), the Integrated Multi-satellitE Retrievals for Global Precipitation Measurement (IMERG; Huffman et al., 2019), the TRMM Multisatellite Precipitation Analysis (TMPA; Huffman et al., 2007), the China Meteorological Forcing Dataset (CMFD; He et al., 2020), the fifth-generation ECMWF atmospheric reanalysis (ERA5; Hersbach et al., 2020) and its downscaled version for land applications (ERA5-Land; Muñoz-Sabater et al., 2021), the High Asia Refined analysis (HAR; Maussion et al., 2014) and its version 2 (HAR v2; X. Wang et al., 2020), et al. Among these products, gauge-based products may have large errors in the TP, since they are mostly interpolated based on sparse gauge observations. Satellite or satellite–gauge-combined products are most widely used in the TP. However, they are proven to misrepresent solid precipitation and orographic precipitation and show large uncertainties in winter and in the western and southeastern TP (Gao et al., 2020; Lu and Yong, 2018; Xu et al., 2017). Atmospheric simulation with fine spatial resolution can give reasonable atmospheric water transport and precipitation spatial variability in complex terrain (Curio et al., 2015; Maussion et al., 2014; Norris et al., 2017; Ouyang et al., 2021; Sugimoto et al., 2021; Y. Wang et al., 2020b; Zhou et al., 2021); moreover, it is skillful in estimating solid precipitation (Lundquist et al., 2019; Maussion et al., 2014). However, current atmospheric simulation-based datasets consistently overestimate precipitation amount in the TP (Gao et al., 2015; Y. Wang et al., 2020b; Zhou et al., 2021). As a result, substantial differences exist among these datasets in the TP in terms of both amount and spatial variability of precipitation (Li et al., 2020; Lu and Yong, 2018; Tan et al., 2020; Wang and Zeng, 2012; You et al., 2012). In addition, these datasets typically have a horizontal resolution coarser than 10 km, which is insufficient to represent the fine-scale precipitation variability and cannot be applied locally.
Errors in precipitation products hinder the correct understanding of water cycle processes in the TP. For example, Immerzeel et al. (2015) found that the simulated runoff in the upper Indus using APHRODITE is much smaller than the observations and further confirmed that APHRODITE severely underestimates precipitation amount in this region. Savéan et al. (2015) pointed out that precipitation from rain gauges with poor spatial representativeness leads to irrational runoff component simulations in the central Himalayas. Jiang et al. (2022a) demonstrated that currently widely used satellite-based precipitation products cannot close the basin-scale water budget in the eastern edge of the TP. Some other studies also demonstrated the high uncertainties in current precipitation products for simulations of snow cover (Gao et al., 2020), soil moisture (Yang et al., 2020) and river discharge (Alazzy et al., 2017).
Merging multiple precipitation products is an effective way to mitigate precipitation uncertainties. The most commonly used strategy for improving the accuracy of satellite or modeling precipitation is bias correction with gauge observation-based data. For example, Shen et al. (2014) combined the probability density matching and the optimal interpolation to merge the CMORPH and rain gauge data and produced a high-accuracy precipitation dataset over China. Ma et al. (2020, 2022) produced the AIMERG and AERA5-Asia datasets by applying APHRODITE to correct IMERG and ERA5-Land, respectively. Another strategy is merging multiple precipitation products by assigning different weights to these products, in which the weights can be determined by Bayesian-based methods (K. Li et al., 2021; Ma et al., 2018), machine learning or the inverse of errors against gauge data (Hong et al., 2021; Zhu et al., 2022). These methods are flexible and are able to integrate information from multiple sources. Recently, many efforts have been made to merge different precipitation products over the TP; e.g., K. Li et al. (2021) produced a high-accuracy precipitation dataset for the southern TP by merging three satellite-based precipitation datasets with high-density rain gauge data. Y. Wang et al. (2020a) developed a long-term precipitation dataset for the Yarlung Tsangpo River basin by merging data from satellites, reanalysis and rain gauges. Although encouraging progress has been made, there are still some limitations. First, these works either corrected gridded precipitation with data from sparse rain gauge networks or were conducted in sub-regions of the TP. Second, most works have merged satellite products with rain gauge data, while both the two sources of precipitation perform poorly in reflecting heterogeneous precipitation in complex terrain. Therefore, substantial improvements are still needed for producing high-accuracy precipitation data in the TP.
Therefore, the main goal of this study is to produce a long-term high-resolution precipitation dataset with high accuracy for the TP, by merging dense rain gauge data with high-resolution atmospheric simulation-based precipitation. Different from many previous works that usually merged satellite datasets with rain gauge data, our study uses an atmospheric simulation-based precipitation with very high horizontal resolution (∘) as the background field, mainly due to its advanced skill in giving the spatial variability of precipitation in complex terrain, which is especially important in high mountains and the western TP. In addition, we collected observations from more than 9000 rain gauges to generate the merged data, including observations from rain gauges in the central and western TP that are set up by this study. To the best of our knowledge, such a gauge density is the highest among the works of precipitation merging over the TP that have usually used a portion of data from the China Meteorological Administration (CMA) or the Ministry of Water Resources in China (MWR) stations that are mainly distributed in the eastern TP.
2.1 Rain gauge data
Rain gauge data used in this study are obtained from several sources, including the CMA, the MWR, the Department of Hydrology and Meteorology of Nepal (DHM), the Global Historical Climatology Network (GHCN; Menne et al., 2012), and some other field observation networks (Chen et al., 2014, 2015; Luo, 2018; Wei and Wang, 2019; Wang, 2021; Yang, 2018; Yang et al., 2017; Zhang, 2018; Zhao, 2018; Zhao et al., 2017). These networks provide either daily or sub-daily precipitation records. In addition, our group has set up more than 80 rain gauges over the TP since 2017, deployed in the Yadong Valley, on the south slope of the Gangdise Range, on the eastern edge of the TP, in the surroundings of Namco and in the inner TP. These rain gauges record precipitation every hour, and observations from this network are also used in this study. All the sub-daily records are aggregated into daily sums so that they can be merged with gridded data at a daily scale.
A series of quality control procedures are applied to the rain gauge data, following the method of Hamada et al. (2011), including an outlier check, a repetition check and a spatial consistency check. Detailed judgment criteria for each check can be referred to in Hamada et al. (2011). In addition, for each rain gauge, data records for a certain year with less than 60 d are removed, since they are likely to suffer from technical breakdowns. After the quality control, data from 9798 rain gauges are eventually selected for precipitation merging, and these data have temporal coverages ranging from a few months to more than 40 years. Figure 1b shows the spatial distribution and temporal extent of these rain gauges, and Fig. 1d gives the number of available rain gauges in each year.
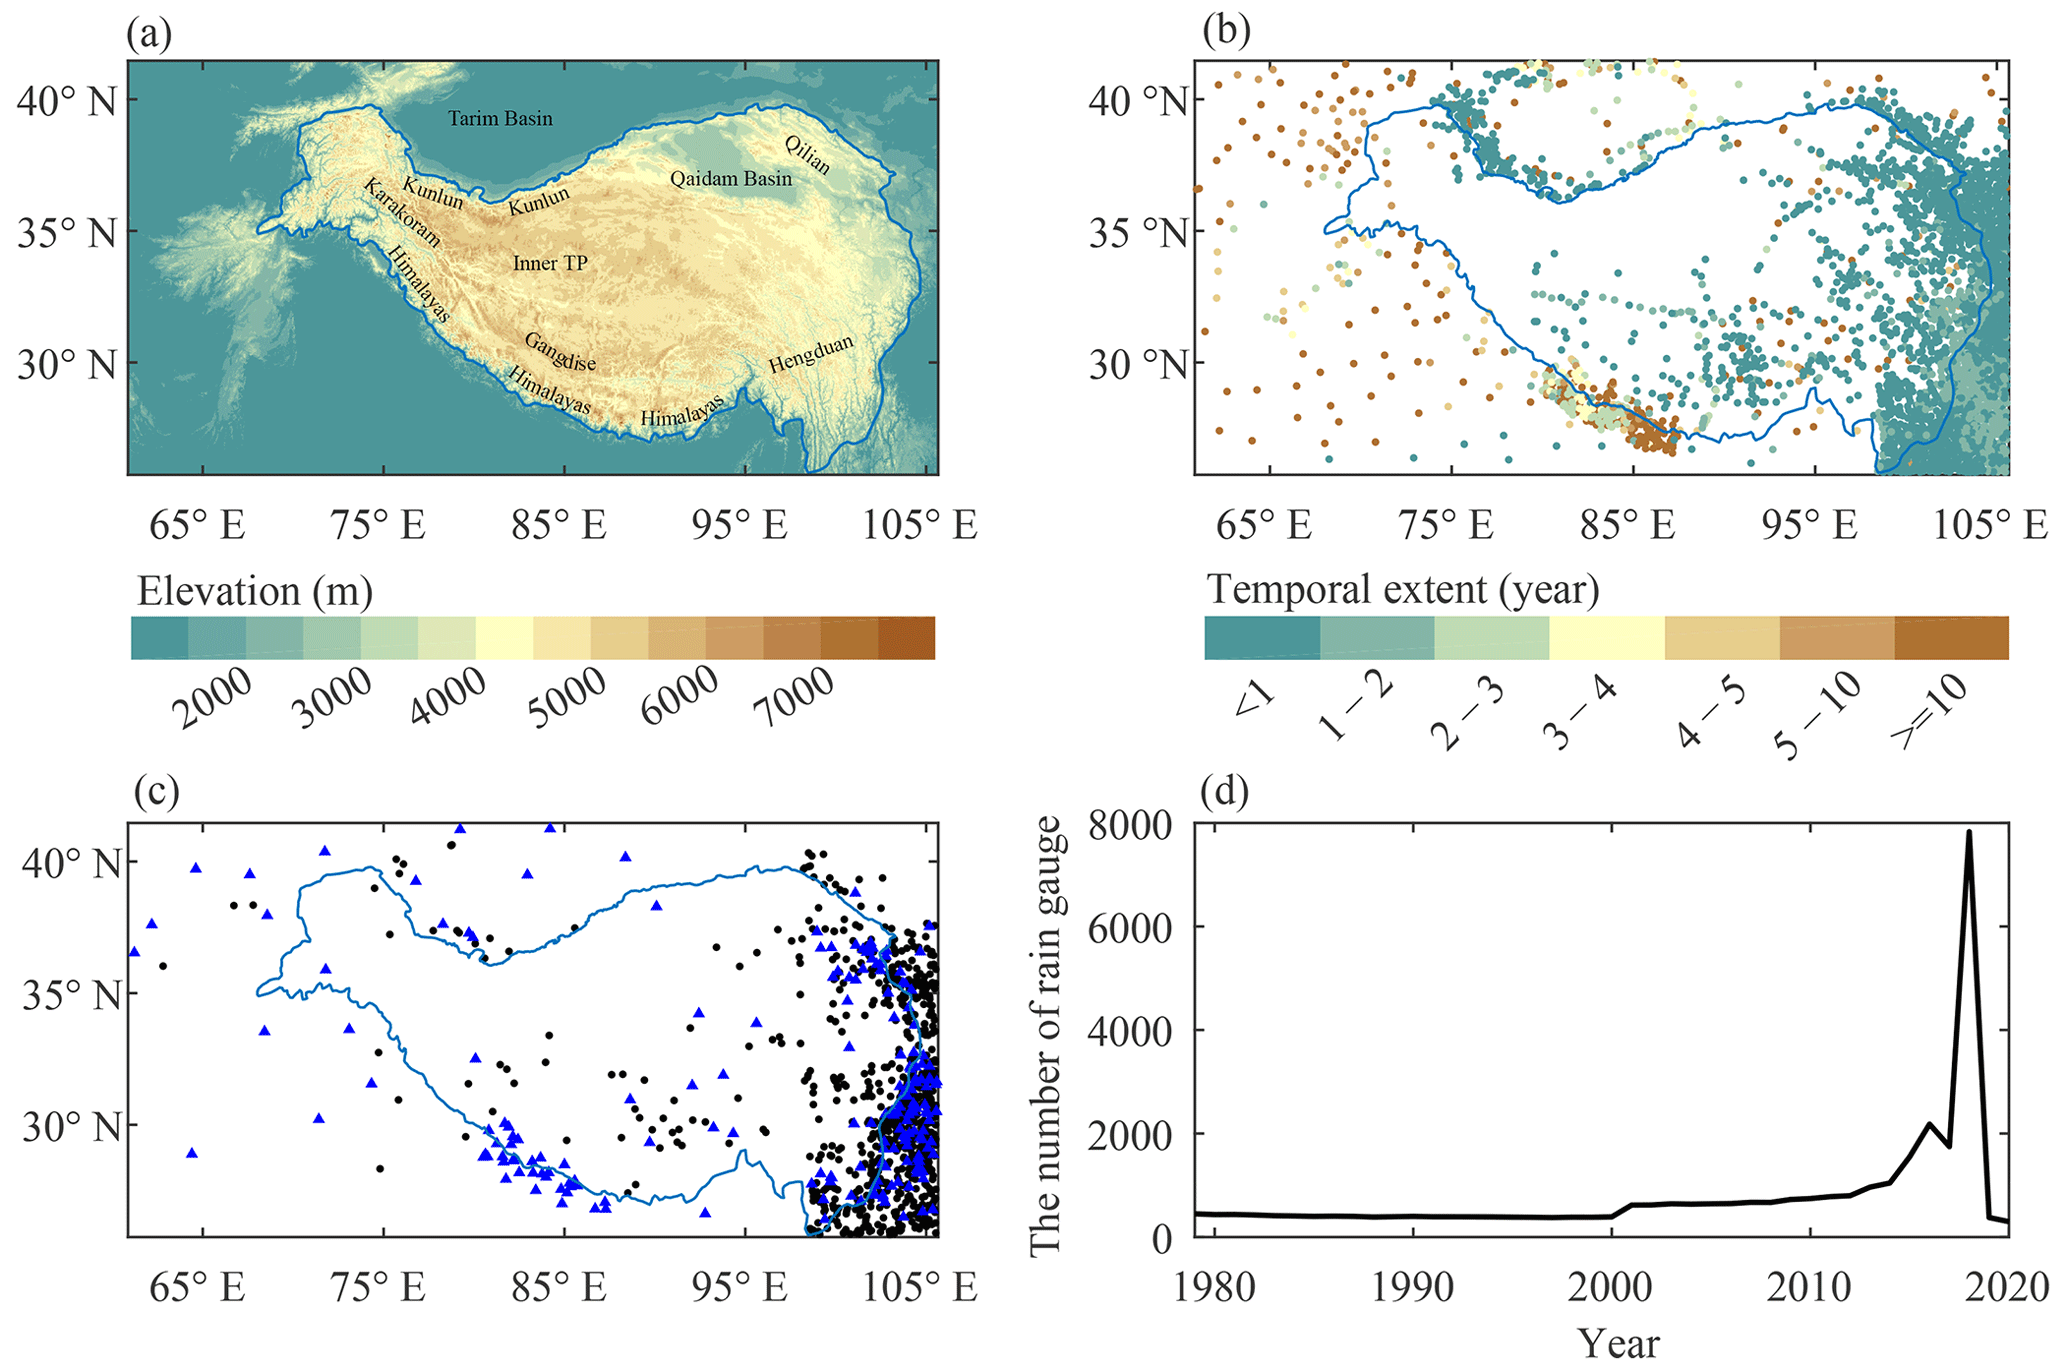
Figure 1(a) Topography of the Third Pole region. (b) Spatial distribution of rain gauges used in this study and their temporal extent. (c) The independent rain gauges used for validation, in which rain gauges marked by both black dots and blue triangles are used in the analysis period of 1979–2020 (Sect. 4.1.2), and rain gauges marked by blue triangles are used in the analysis period of 2008–2015 (Sect. 4.2). (d) The number of available rain gauges in each year. The blue line denotes the 2500 m contour of elevation, which is obtained from Zhang (2019).
Rain gauge observations usually suffer from measurement errors, including wind-induced undercatch, wet loss and evaporation loss. This especially happens in the TP where the wind is strong and solid precipitation accounts for a large proportion of the total precipitation. Therefore, the measurement errors are corrected in this study. For gauges where observed wind speed and air temperature are provided, the empirical relationships provided by Ye et al. (2007) and Ma et al. (2015) are used to correct the measurements. For gauges without wind speed and air temperature observations, the random forest (RF; Breiman, 2001) model is used to correct precipitation. This is achieved with the following steps: first, the RF model is trained at the above-corrected gauges, using wind speed and air temperature from ERA5 and original observed daily precipitation as model input and the corrected precipitation as the target; then, the trained model is applied to gauges without wind speed and air temperature observations to estimate corrected precipitation, using wind speed and air temperature from ERA5. ERA5 is used here mainly because our evaluation with gauge observations showed that ERA5 could give reliable wind speed and air temperature estimates over the TP, as well as reported by Huai et al. (2021), who demonstrated that ERA5 is superior to other global reanalysis datasets for most near-surface meteorological variables in the northeastern TP.
2.2 Gridded precipitation dataset
The background precipitation dataset used in this study is called ERA5_CNN, an atmospheric simulation-based dataset, derived from combining a short-term high-resolution WRF (Weather Research and Forecasting) simulation (Zhou et al., 2021) with ERA5 reanalysis. More specifically, a 2-year high-resolution WRF simulation is first obtained and used for training a convolutional neural network (CNN)-based downscaling model. Then, the trained model is used to downscale the long-term ERA5 precipitation to generate ERA5_CNN (Jiang et al., 2021). ERA5_CNN has a daily temporal resolution, covering the period from 1979 to 2020. Compared with ERA5, ERA5_CNN has a higher horizontal resolution of ∘ and smaller wet biases over the TP. Our previous evaluations showed that ERA5_CNN can give fine-scale spatial variability of precipitation over the complex-terrain TP with high spatial correlations with rain gauge data. Moreover, ERA5_CNN is more skillful in reproducing the elevation dependence of precipitation in the TP than the coarse HAR v2 and the satellite-based IMERG (Jiang et al., 2022b). However, ERA5_CNN still overestimates precipitation in the TP, which is inherited from atmospheric simulation (Jiang et al., 2021). Therefore, its accuracy needs to be further improved by merging it with high-density gauge observations.
For comparison, three widely used global precipitation datasets, including ERA5-Land (hereafter ERA5L), IMERG and the Multi-Source Weighted-Ensemble Precipitation version 2 (MSWEP v2; Beck et al., 2019), as well as one regional dataset (AERA5-Asia, hereafter AERA5), are also utilized in this study. ERA5L is the latest-generation reanalysis of the ECMWF for land applications, which provides 0.1∘ precipitation data at 1 h intervals, compared to 0.25∘ of ERA5. According to Muñoz-Sabater et al. (2021), the precipitation of ERA5L is produced by interpolating ERA5 with a linear model; thus, the precipitation of ERA5L and ERA5 is slightly different, as shown in the results of Xu et al. (2022). IMERG is a satellite precipitation dataset retrieved from the combination of both microwave and infrared observations and is currently the most widely used in the world, with a horizontal resolution of 0.1∘ and the highest temporal resolution of 0.5 h. The IMERG Final Run v6 (hereafter IMERG), which has been corrected with monthly rain gauge data, is used in this study. The MSWEP v2 with a horizontal resolution of 0.1∘ is a merged dataset that has combined multiple satellite, gauge and reanalysis precipitation datasets. Moreover, it is corrected with observed discharge from many catchments worldwide. AERA5 is a regional precipitation dataset for Asia, which is produced by combining ERA5L with the APHRODITE dataset. It has a horizontal resolution of 0.1∘ and temporal resolution of 1 h, covering the period from 1951 to 2015. Previous evaluations showed that AERA5 has a higher accuracy than ERA5L and IMERG, in terms of several metrics involved in precipitation amounts, events and extremes (Ma et al., 2022).
3.1 Merging algorithm
3.1.1 General flowchart
This study merges the ERA5_CNN precipitation with high-density rain gauge data based on the idea of the climatologically aided interpolation (CAI; Willmott and Robeson, 1995), in which the anomalies/ratios of meteorological variables are interpolated and then added/multiplied to the climatology, instead of directly interpolating the meteorological variables. The CAI method has been widely applied for gridding precipitation and has shown good performance (Contractor et al., 2020; Schamm et al., 2014; Xie et al., 2007). Figure 2 shows the flowchart for merging ERA5_CNN and rain gauge data. The merging procedures include the construction of monthly precipitation climatology, monthly precipitation and daily precipitation. Details are listed below.
-
Construction of monthly precipitation climatology. Since the length of the data records varies from gauge to gauge, it is undesirable to obtain monthly climatology fields via directly interpolating the observed multi-year average monthly precipitation. Therefore, we first construct monthly precipitation climatology at gauge locations based on the monthly precipitation climatology of ERA5_CNN, using the following formula:
where Pco is the constructed monthly precipitation climatology at a gauge location; Pce is the monthly precipitation climatology of ERA5_CNN averaged over 1979–2020; Pco1 is the monthly precipitation of rain gauge averaged over the observing period, which varies from gauge to gauge; and Pce1 is the monthly precipitation of ERA5_CNN averaged over the same observing period at the collocated grids.
The precipitation climatology fields for the 12 months are then constructed by interpolating the monthly climatology at gauge locations using a RF- and kriging-based method, in which the monthly climatology of ERA5_CNN is taken as an auxiliary and will be introduced in Sect. 3.1.2.
-
Construction of gridded monthly precipitation. In this study, the ratios of monthly precipitation to its climatology are adopted for constructing monthly precipitation fields. There are four steps for constructing monthly precipitation fields. First, the ratios of observed monthly precipitation (Pmo) to the precipitation climatology (Pco) are calculated at gauge locations (i.e., Rmo in Fig. 2); second, the ratios are gridded using the RF method by taking the monthly precipitation ratios of ERA5_CNN () and static variables (Y) as auxiliaries; third, the gridded ratios are multiplied by the gridded monthly precipitation climatology (Pc) obtained in step (1) to construct the first guess of gridded monthly precipitation fields; finally, the residuals (εm) of the first guess against gauge observations are gridded using the kriging method and added to the first guess to construct the final monthly precipitation fields (Pm).
-
Construction of gridded daily precipitation. The procedures for constructing daily precipitation fields are similar to monthly precipitation, with only two differences. First, the ratios are daily precipitation to monthly climatology (i.e., and ) in this part. Second, the daily precipitation fields after residual correction (Pd1) are further adjusted to ensure that the sum of the daily precipitation amount in a month is equal to the corresponding monthly precipitation amount obtained in step (2), given that monthly precipitation fields are more reliable due to their smaller spatial variability than daily fields (He et al., 2020). The adjustment can be expressed as follows:
where Pd,i is the adjusted precipitation for the ith day in a month, Pd1,i is the precipitation after residual correction for the ith day, Pm is the monthly precipitation and n is the number of days in that month. When the monthly precipitation (Pm) is non-zero, but the sum () of the daily precipitation amount in that month is zero, we will search the nearest grid that has a non-zero and then disaggregate Pm to daily precipitation according to the day-to-day variation in precipitation in the nearest grid.
In the above procedures, gridding multiple variables, including the monthly climatology, the ratios of monthly/daily precipitation to monthly climatology and the monthly/daily residuals, is achieved based on the RF and ordinary kriging, which will be introduced in Sect. 3.1.2.
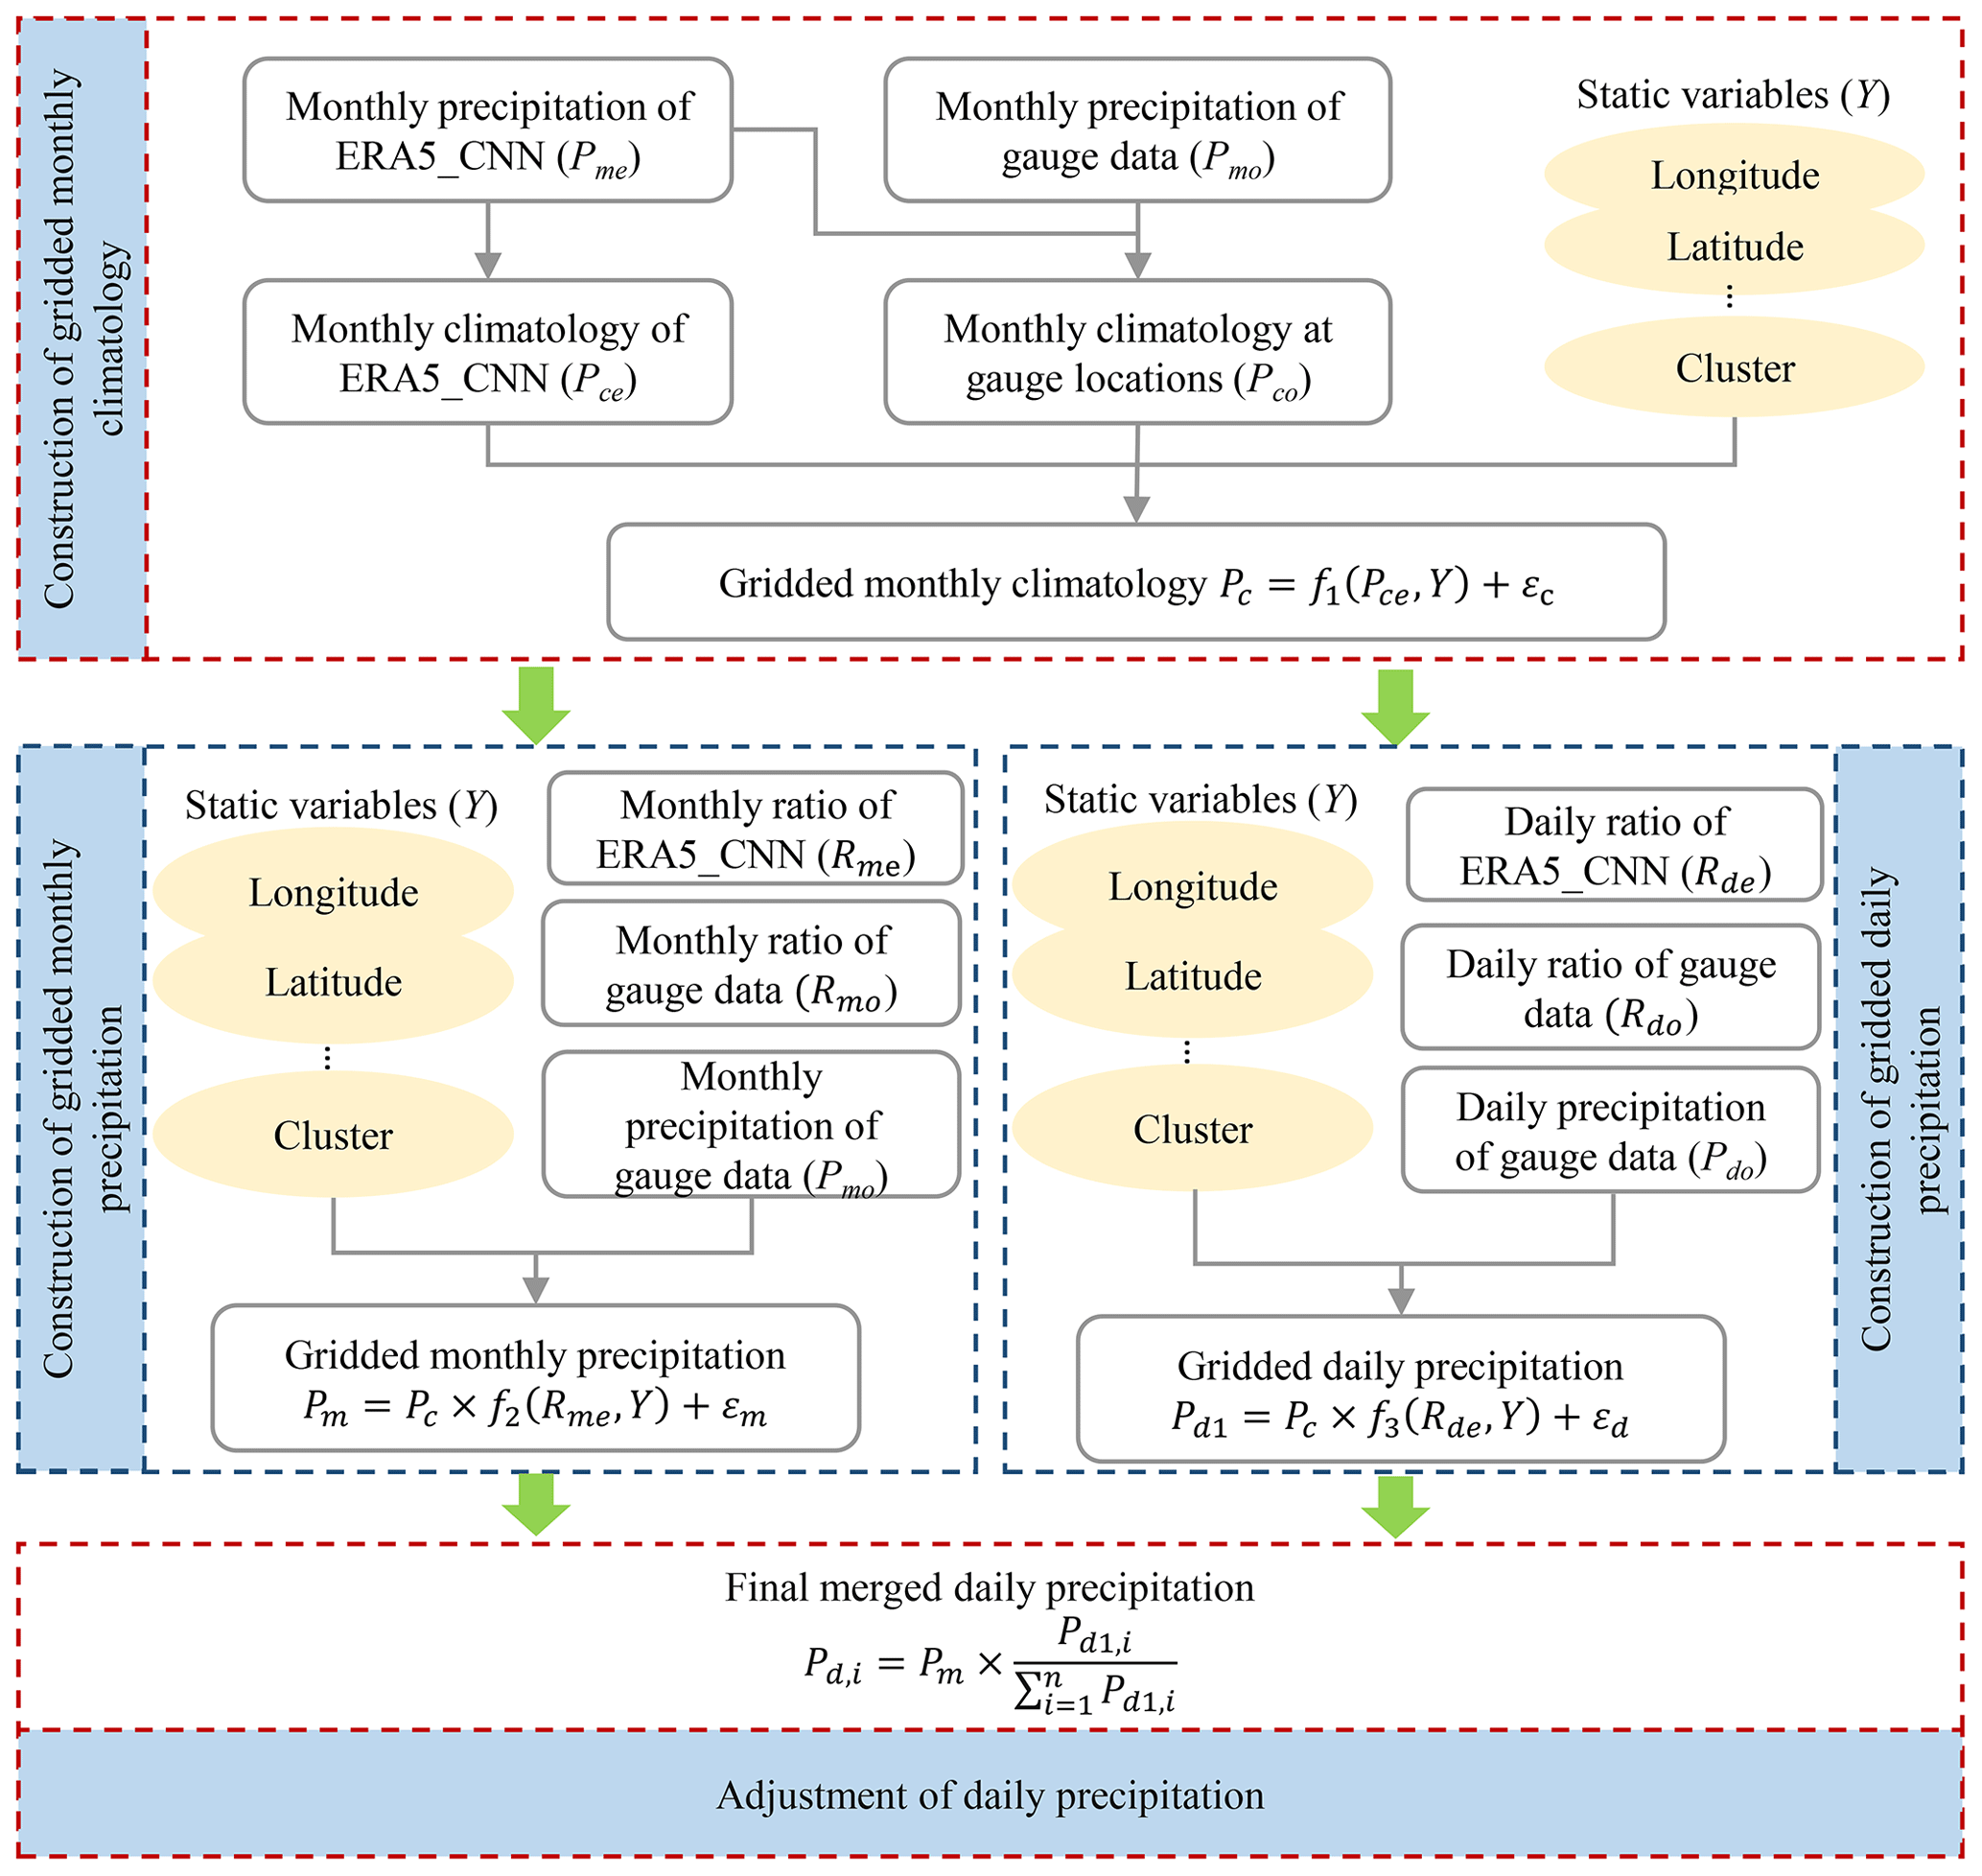
Figure 2General flowchart of the merging algorithm. The static variables include the longitude, latitude, elevation, standard deviation of elevation and identifier of the clusters with different precipitation characteristics. The subscript “o” represents observation, “e” represents ERA5_CNN, “c” represents climatology, “m” represents monthly, “d” represents daily, “n” represents the number of days in a month and “i” represents the ith day in a month. f1, f2 and f3 denote the regression models based on random forest. εc, εm and εd represent the residuals of estimations from RF, which are interpolated using the kriging method.
3.1.2 Gridding method
Gridding monthly precipitation climatology, precipitation ratio and the residual is the key for merging ERA5_CNN and rain gauge data. In this study, the RF is combined with the ordinary kriging to interpolate these variables, which is inspired by the regression kriging method, in which the interpolated target is assigned to the spatial trend (deterministic) and the stochastic component (residual). A regression model is applied to predict the spatial trend, and the ordinary kriging is used to estimate the stochastic component that is expected to be a Gaussian distribution. In this method, various regression methods can be combined with kriging, including machine learning methods. Machine-learning-based regression models combined with kriging were widely applied in earth science and proved to have good performance, as reported in many previous works (Araki et al., 2015; Cellura et al., 2008; Demyanov et al., 1998). The machine learning method used in this study is the RF model, which is an ensemble machine learning model based on the decision tree algorithm and can learn the complex non-linear relationships between multiple covariates and the target variable. It randomly selects samples for training each decision tree and aggregates estimates from multiple decision trees. Compared to other machine learning methods, the RF is less sensitive to hyperparameters, less likely to suffer from overfitting and has good generalization capability. Moreover, the RF is easy to implement and has robust prediction accuracy, thus making it a widely used method for the correction and downscaling of meteorological variables (Baez-Villanueva et al., 2020; He et al., 2016; Sekulić et al., 2021; Zhang et al., 2021). The general formulation for constructing precipitation at multiple timescales based on RF and kriging can be expressed as follows:
where Pc is the monthly precipitation climatology; Pm and Pd1 are the monthly and daily precipitation, respectively; f1, f2, and f3 are the non-linear regressive relationships built with the RF model; Pce is the monthly precipitation climatology from ERA5_CNN; Rme and Rde are the ratio of monthly and daily precipitation to the climatology from ERA5_CNN, respectively; Y is the static variables; and εc, εm, and εd are the residuals of the estimated precipitation.
Multiple covariates are used to build the RF model. For gridding monthly precipitation climatology, the target for training the RF model is the monthly precipitation climatology at the gauge locations (Pco), and the inputs are monthly precipitation climatology from ERA5_CNN (Pce) at nine grids around the target location, longitude, latitude, elevation and standard deviation of elevation around the target location. In addition, the study area is divided into 25 clusters according to the monthly variation in precipitation, and the identifier for the cluster is also input into the RF model. For gridding the ratio of monthly/daily precipitation to monthly climatology, the training target is the observed ratio of monthly/daily precipitation to monthly climatology (Rmo or Rdo), and the inputs are the same as those for gridding precipitation climatology except that the ratios of monthly/daily precipitation to monthly climatology from ERA5_CNN (Rme or Rde) are input to the model rather than monthly climatology. Model training is performed for each month; i.e., samples from all gauges and all years in a month are gathered together and used for model training.
In Eq. (3), the residuals are calculated as follows: first, we calculate the differences between the gauge observations (Pmo or Pdo) and the precipitation estimates from RF at gauge locations; then, the ordinary kriging is used to interpolate the differences. The difference fields are added to the precipitation estimates from RF to obtain the final estimates of precipitation.
3.2 Evaluation metrics
Several metrics are used for validating the merged precipitation, including relative bias (Rbias), root mean square error (RMSE), correlation coefficient (CC), probability of detection (POD), false alarm ratio (FAR) and critical success index (CSI). The formulas and perfect values for these metrics are listed in Table 1. These metrics are calculated at a daily scale by comparing the gauge observations with the gridded precipitation from the nearest grid to the rain gauge.
Table 1The error metrics used in this study.
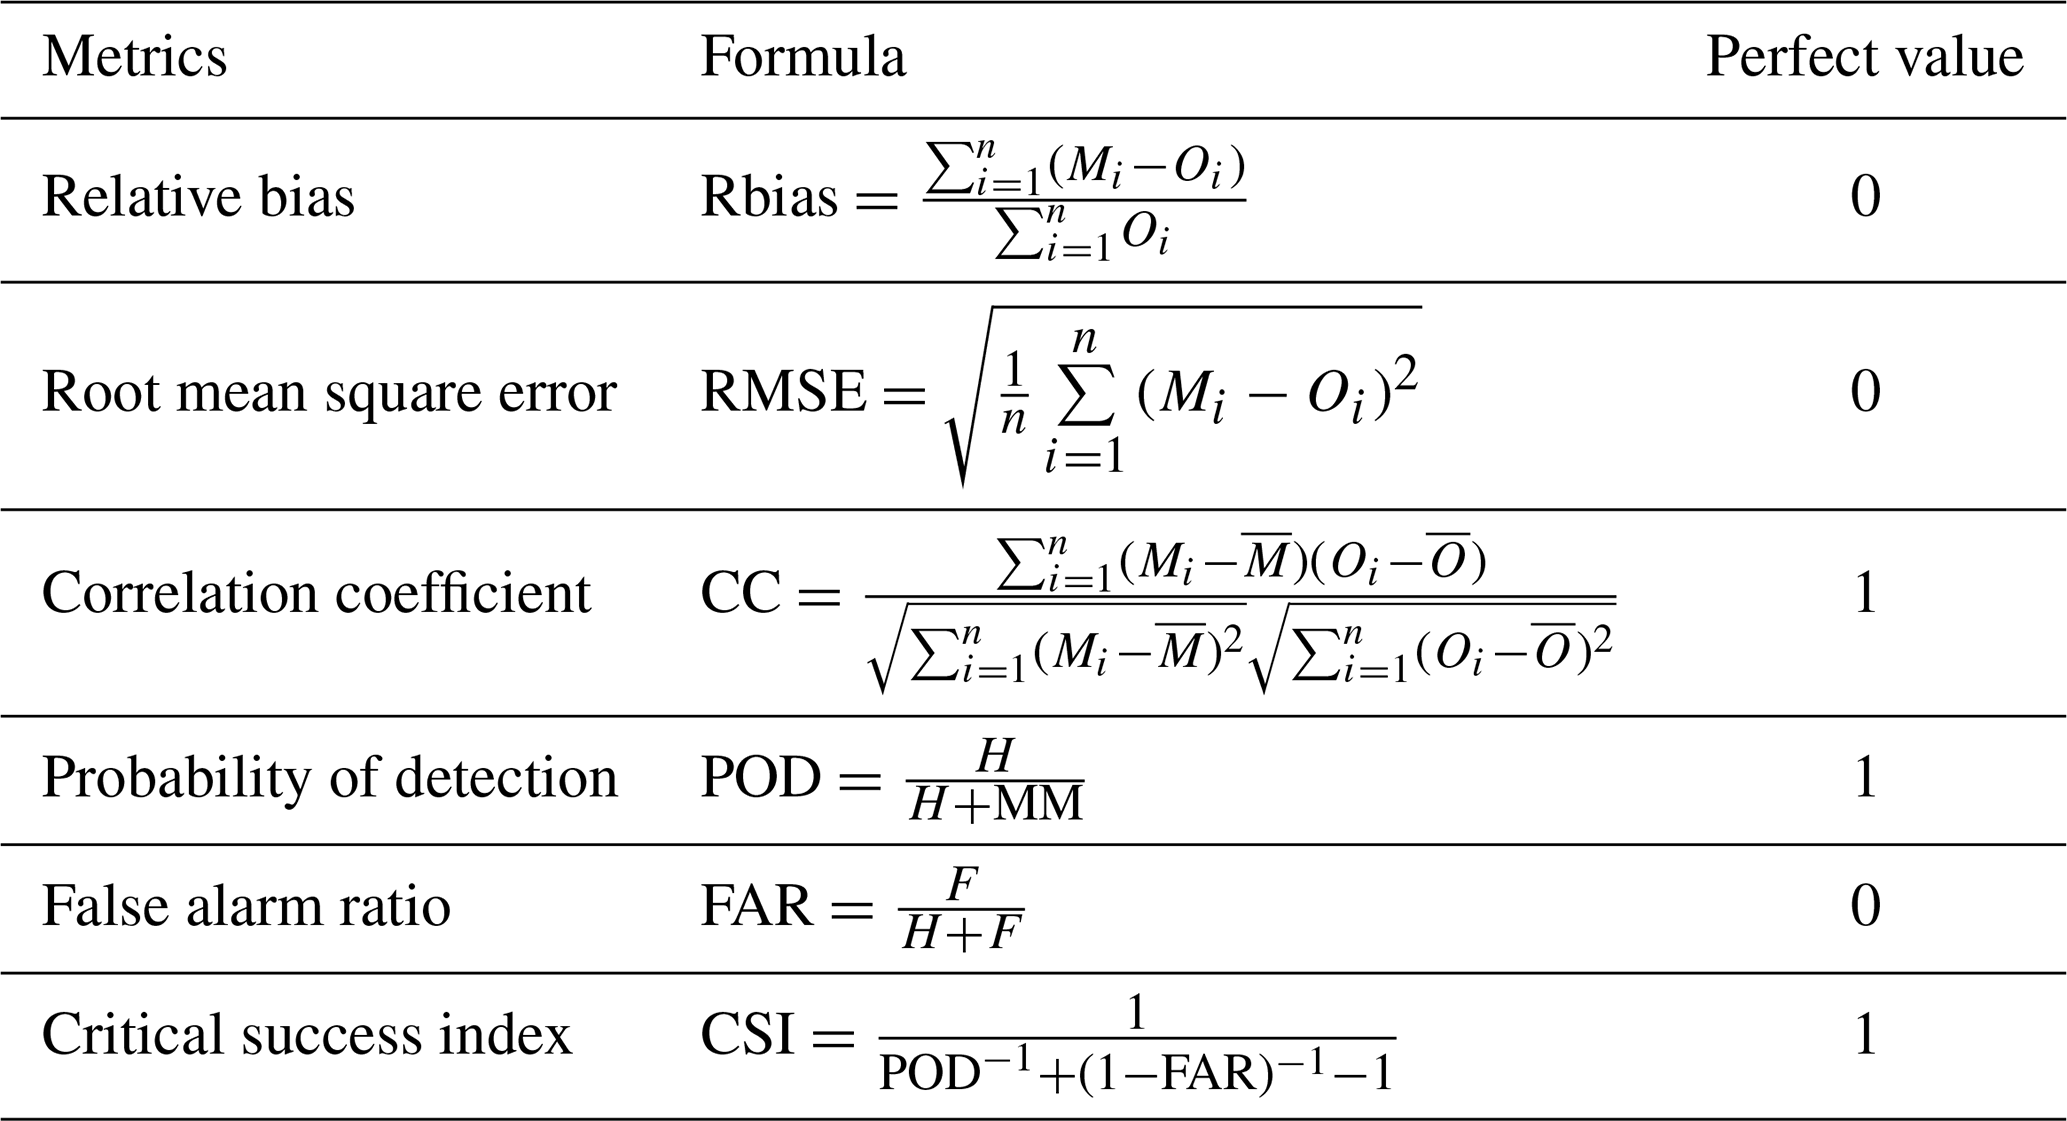
Here n is the number of days; Mi and Oi are the merged and observed precipitation on a specific day, respectively; and and are the mean values of merged and observed precipitation, respectively. H is the days when both merged data and observation have precipitation. MM is the days when only observation has detected precipitation. F is the days when only merged data have detected precipitation. For calculating POD, FAR and CSI, a threshold of 0.1 mm d−1 is adopted for distinguishing precipitation and non-precipitation days.
4.1 Validation of the merging algorithm
4.1.1 Merging effect on precipitation amount and spatial pattern
The spatial patterns of average annual precipitation from ERA5_CNN and the merged data (TPHiPr) during 1979–2020 are shown in Fig. 3a and b. It can be found that ERA5_CNN and TPHiPr have similar spatial patterns of precipitation in the TP. Both have large precipitation amounts in the southeast of the TP and along the Himalayas while having small precipitation amounts in the Qaidam Basin, the Tarim Basin and the inner TP. The similar spatial patterns of ERA5_CNN and TPHiPr demonstrate that the merging algorithm generally retains the spatial characteristics of precipitation from ERA5_CNN.
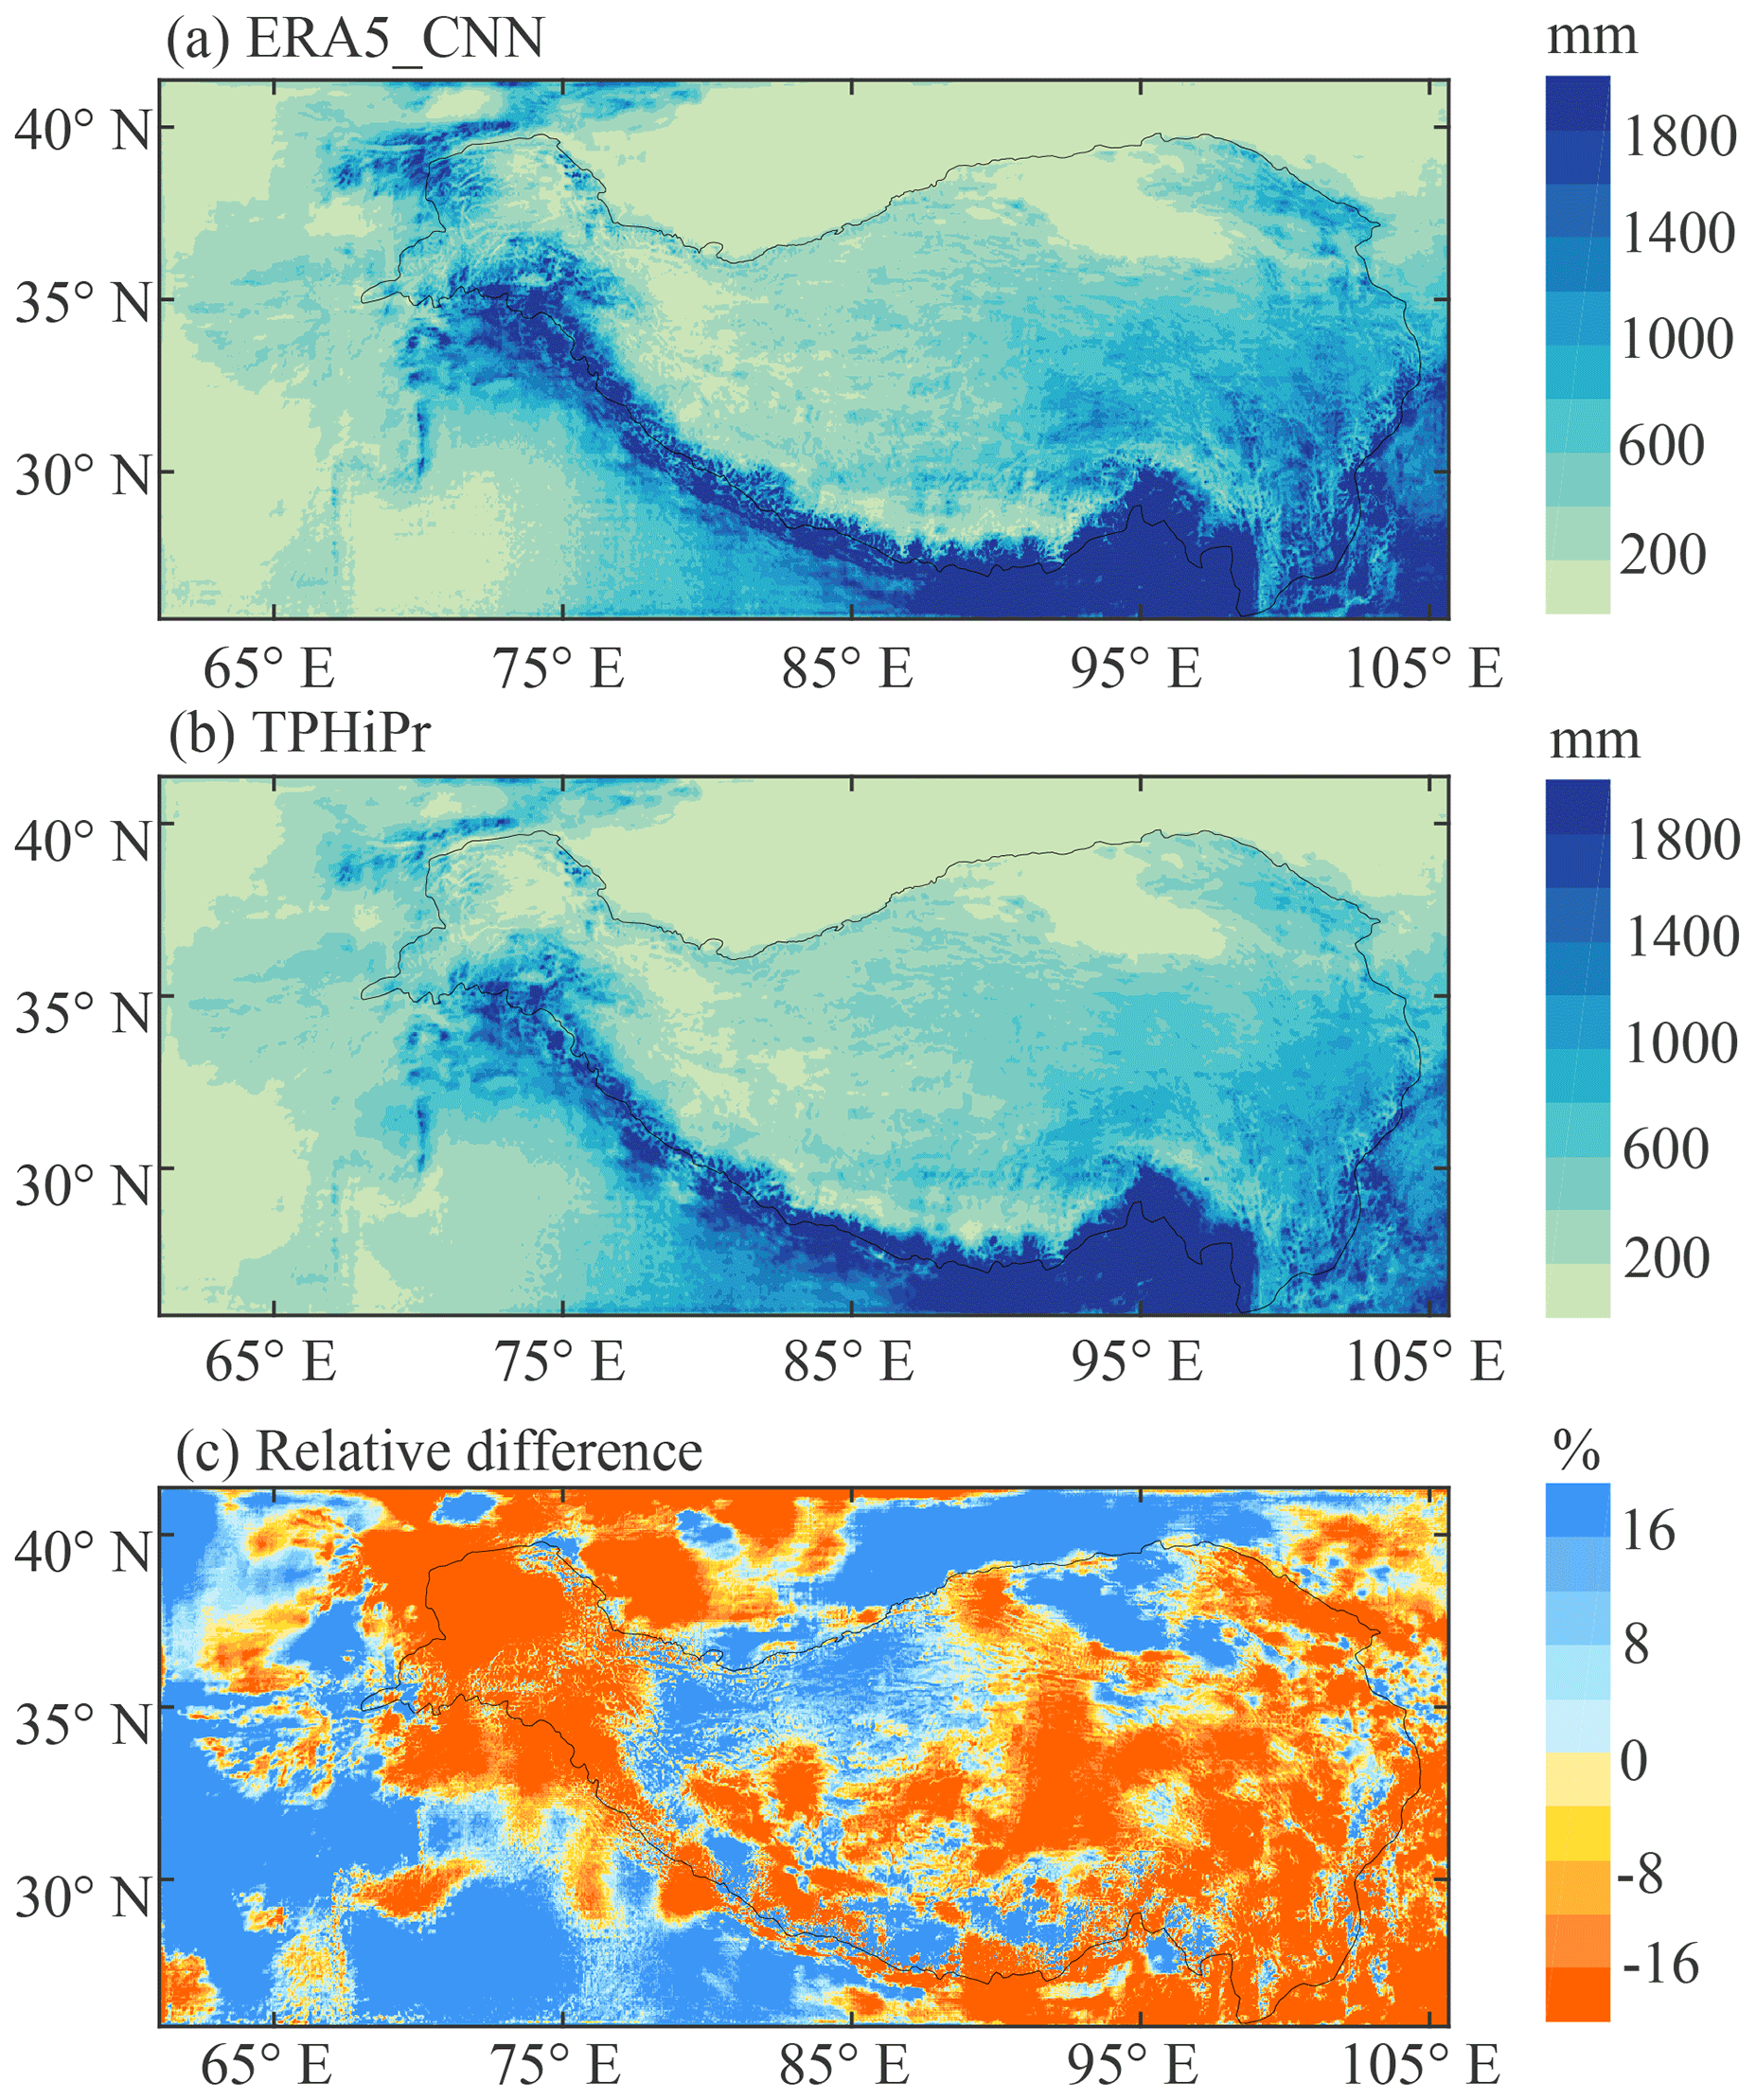
Figure 3Spatial patterns of the annual average precipitation from (a) ERA5_CNN and (b) the merged data (TPHiPr), as well as (c) the relative difference between them. The precipitation is averaged over the period from 1979 to 2020. The relative difference is calculated by subtracting ERA5_CNN from TPHiPr and then dividing by ERA5_CNN.
The relative difference between ERA5_CNN and TPHiPr is also calculated and shown in Fig. 3c. Generally, by merging it with rain gauge data, the precipitation amount is reduced in the TP. The precipitation amount averaged over the study area decreases from 696.4 mm yr−1 of ERA5_CNN to 600.9 mm yr−1 of TPHiPr. This corresponds to previous works that have demonstrated the overestimation in the atmospheric simulation-based precipitation datasets (Gao et al., 2015; Jiang et al., 2021; Y. Wang et al., 2020b; Zhou et al., 2021). Spatially, the precipitation decrease is evident (up to 20 %) in the central and eastern TP, the western Himalayas, the Karakoram, and the Tarim Basin, while precipitation amount increases in the Qaidam Basin and its north, the southwest of the TP, and the eastern Kunlun.
4.1.2 Validation with independent gauge data
In this study, about 10 % of the total rain gauges are randomly excluded for independent validation of TPHiPr, and several metrics against rain gauge data are calculated for ERA5_CNN and TPHiPr at these rain gauges based on daily precipitation.
Figure 4 compares the boxplot of these metrics for ERA5_CNN and TPHiPr. TPHiPr has remarkably better performance than ERA5_CNN. In terms of the Rbias, ERA5_CNN generally overestimates precipitation in the TP, with a median Rbias value of 16.6 % for all these rain gauges. In comparison, the overestimation is largely reduced in TPHiPr, which has a median value of 0.5 %. Also, TPHiPr shows smaller RMSE values (with a median value of 4.5 mm d−1) than ERA5_CNN (with a median value of 8.6 mm d−1). Regarding CC, ERA5_CNN has values between 0.40 and 0.60 at most rain gauges (the median value is 0.53), while they are generally larger than 0.70 for TPHiPr with a median value of 0.84, indicating that precipitation from TPHiPr has highly consistent temporal variations with rain gauge data. In addition, it can be seen that the Rbias (Fig. 4a) and RMSE (Fig. 4b) for TPHiPr are less divergent than those for ERA5_CNN, implying that TPHiPr has more spatially homogeneous accuracy than ERA5_CNN.
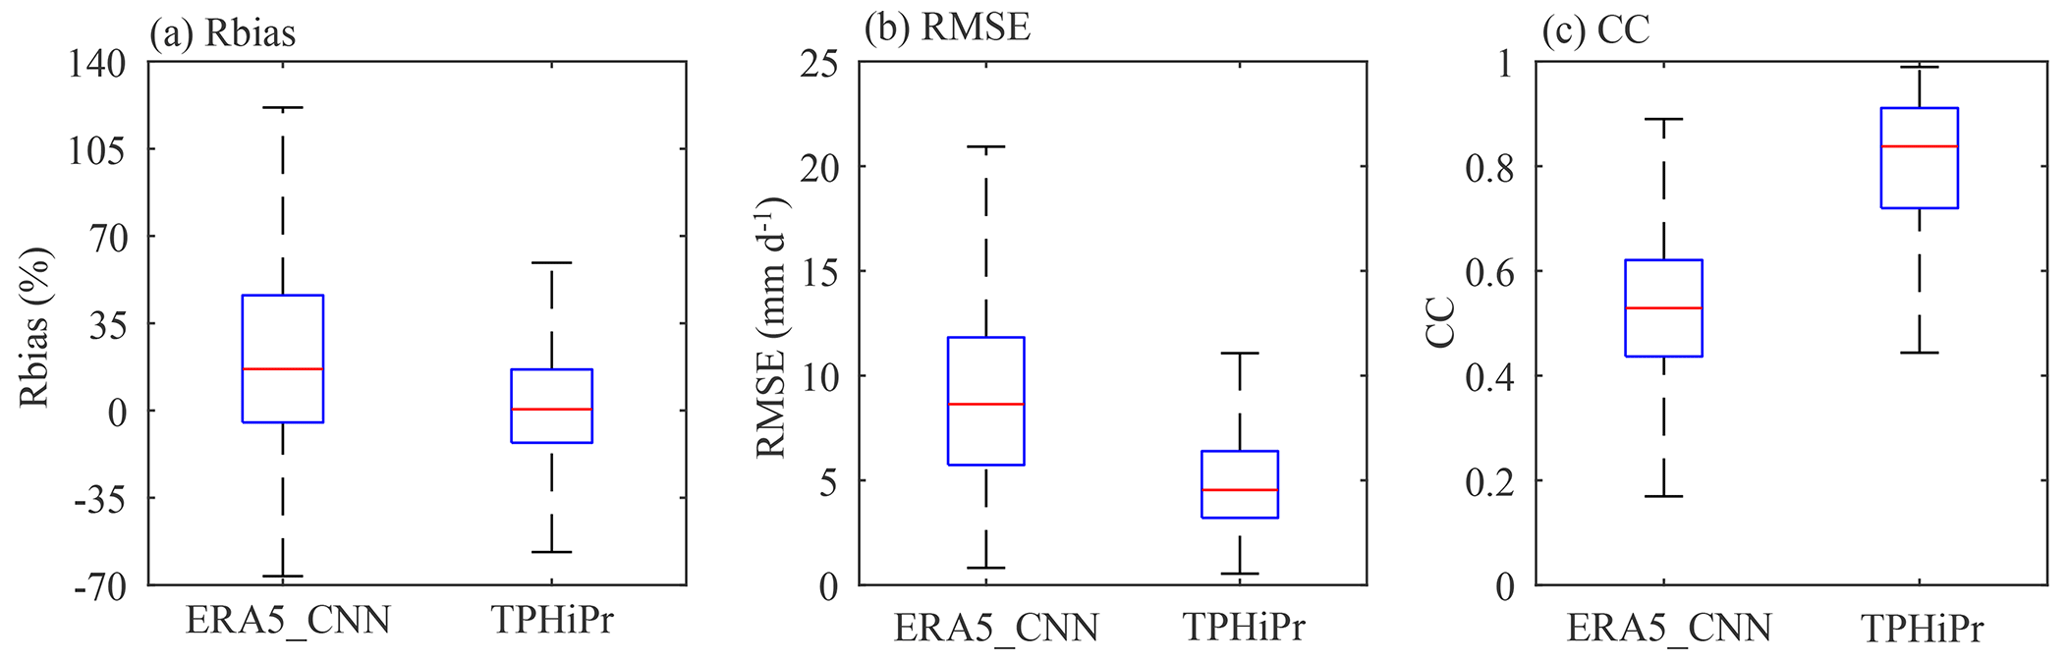
Figure 4Comparison of error metrics for ERA5_CNN and TPHiPr at 966 independent rain gauges. The box represents the distribution of the metrics for all the independent rain gauges in the TP.
Figure 5 shows the differences in the three metrics between ERA5_CNN and TPHiPr at each rain gauge. After the merging, the rain gauges with better Rbias, RMSE and CC account for 68 %, 97 % and 96 % of the total validation rain gauges, respectively. More than 50 % of the rain gauges have RMSE reductions larger than 3.0 mm d−1, and about 67 % of the rain gauges have CC improved by more than 0.2. Moreover, obvious improvements can be found at many east rain gauges. In the western region, improvements can also be found at many rain gauges in the high elevations, while the metrics show little change at some rain gauges outside the 2500 m contour.
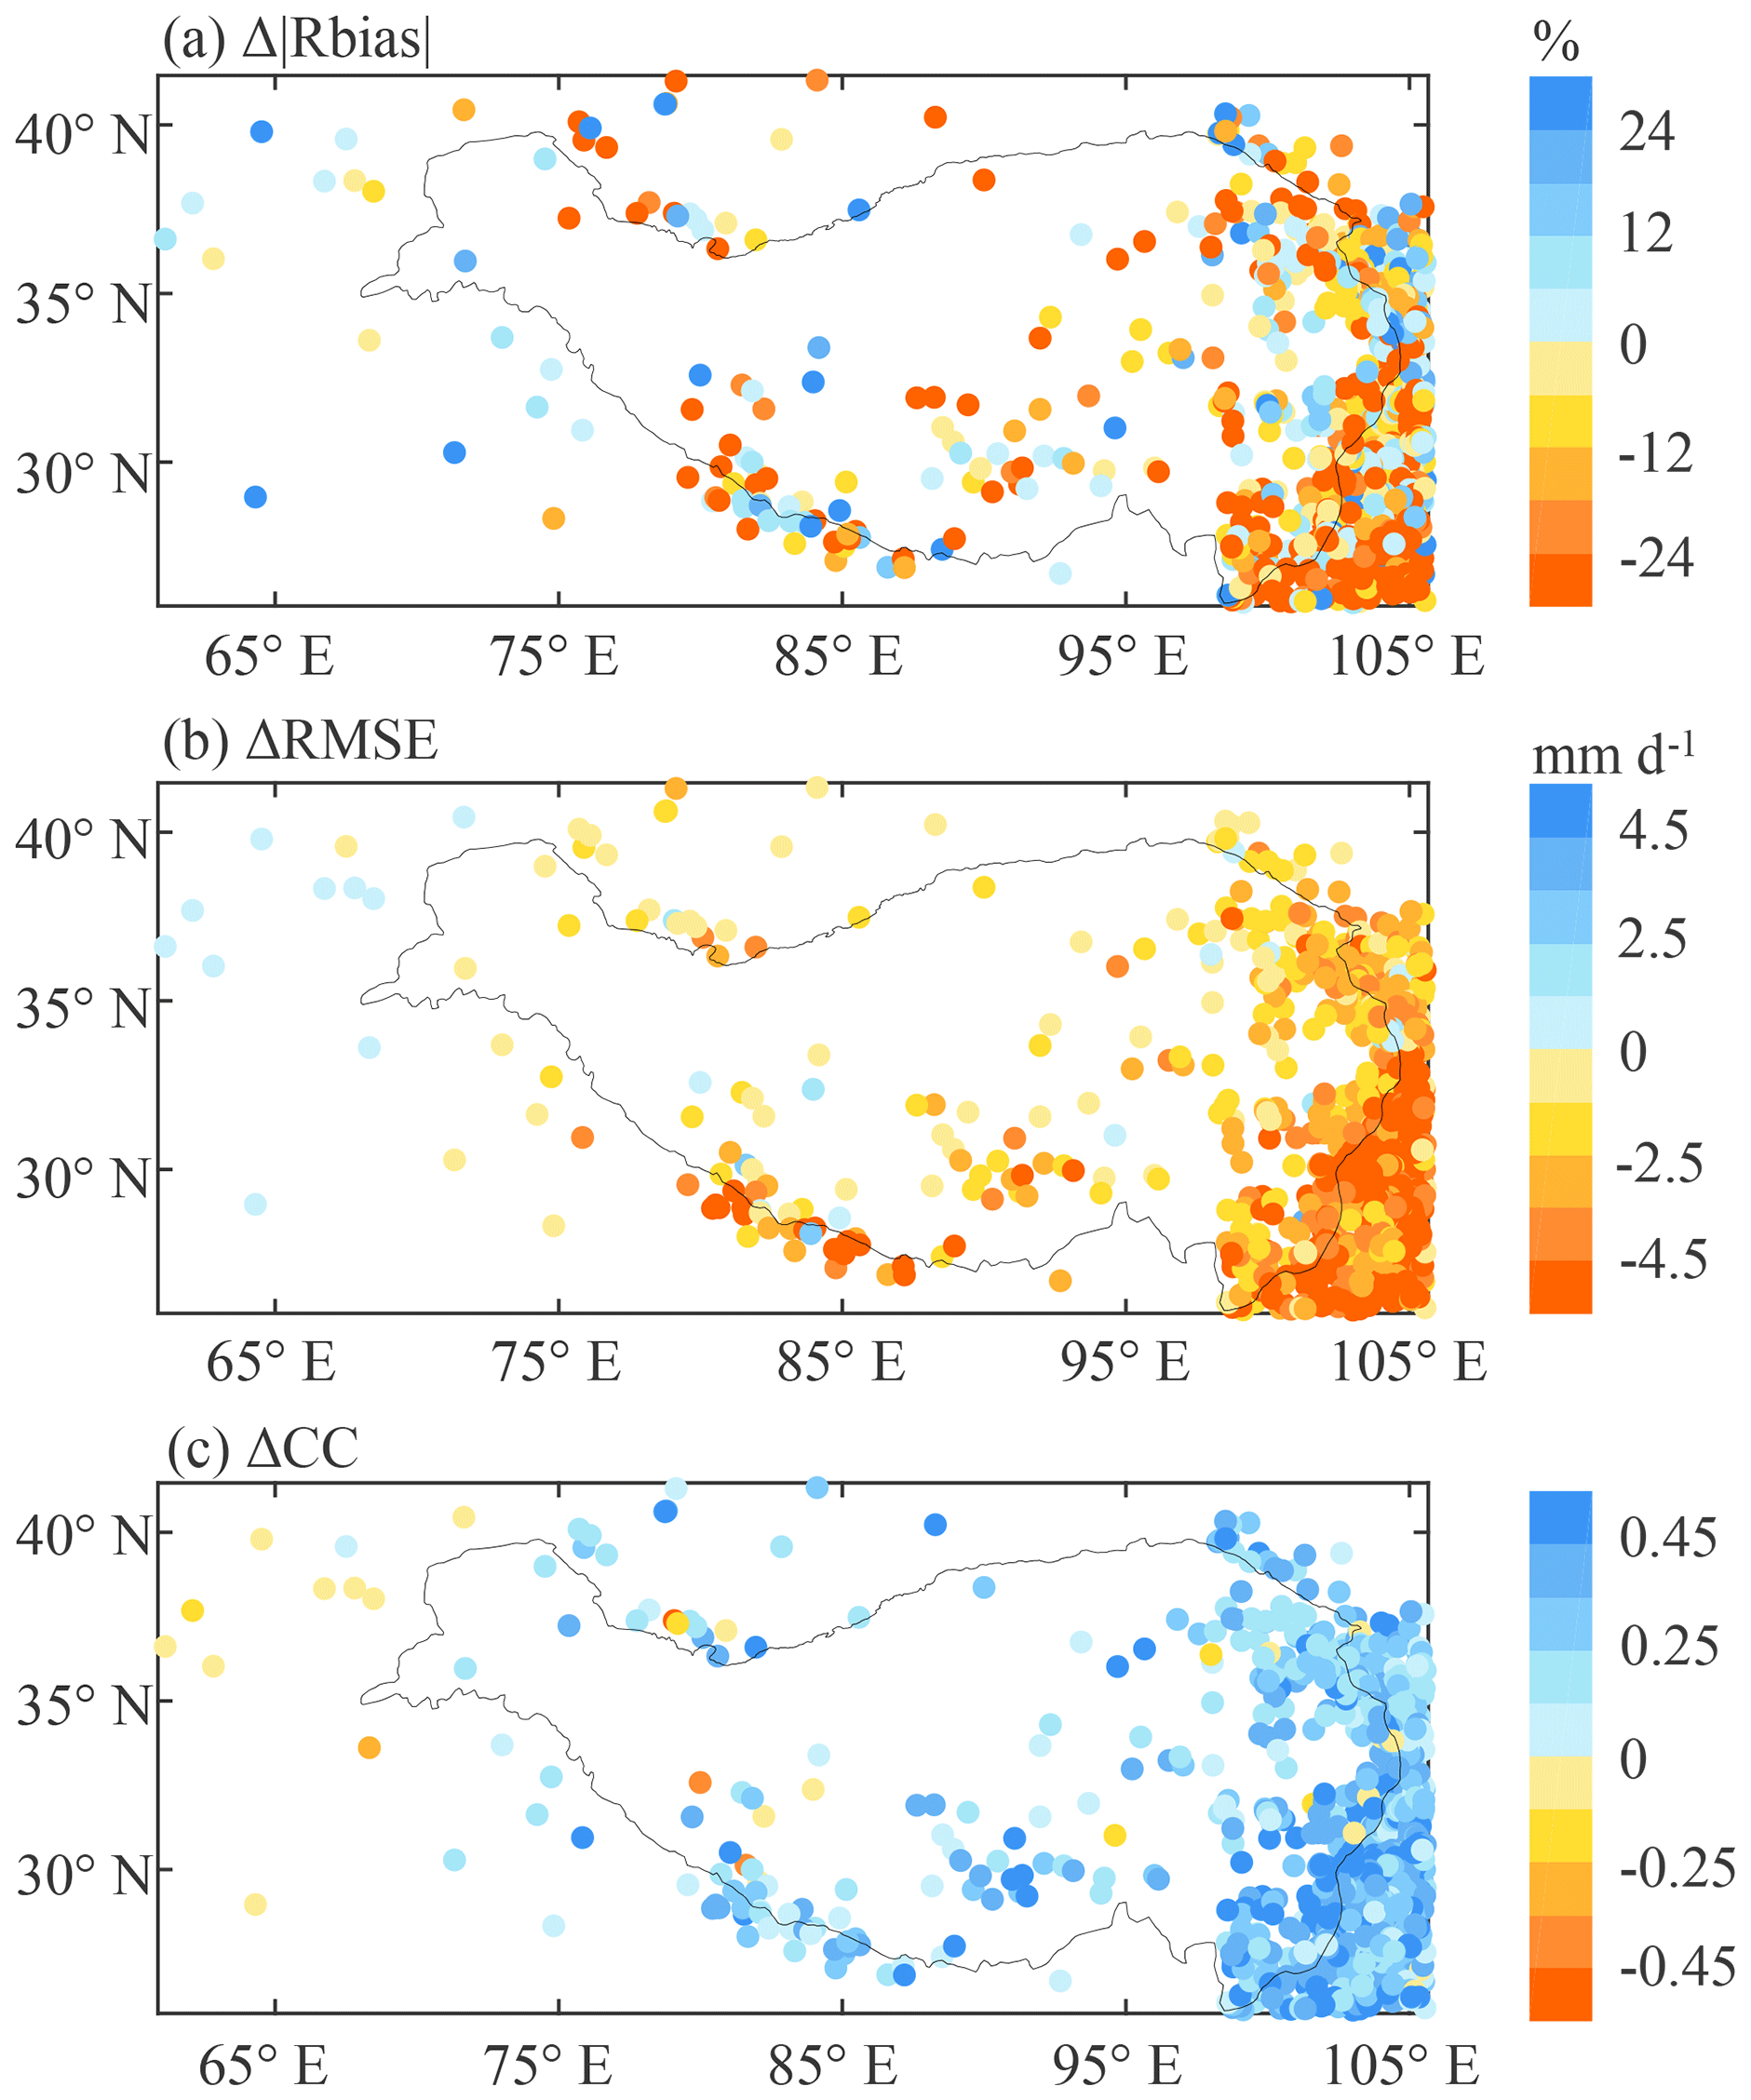
Figure 5Spatial distribution of error metric differences between ERA5_CNN and TPHiPr. The differences are calculated by subtracting the metrics of ERA5_CNN from those of TPHiPr.
In summary, by merging ERA5_CNN with rain gauge data, the accuracy of ERA5_CNN is well improved in the TP, especially in regions where high-density rain gauges are located.
4.2 Comparison with other datasets
We also compare the merged precipitation data with other widely used precipitation products. The comparison focuses mainly on three aspects: the amount and spatial patterns of precipitation, the error metrics against rain gauge data, and the ability to reproduce precipitation extremes. Because the AERA5 dataset is only available before 2015, the comparison between these datasets is conducted for the period from 2008 to 2015.
4.2.1 Precipitation amount and spatial patterns
Figure 6 shows the spatial patterns of the average annual precipitation during 2008–2015 from the five precipitation datasets, along with the relative differences between TPHiPr and the other four datasets. For calculating the differences between them, the coarser datasets are first resampled to the same horizontal resolution as TPHiPr using bilinear interpolation. Generally, the average annual precipitation (Fig. 6a–e) from all four datasets decreases from the southeast to the northwest, because the monsoon has brought abundant water vapor to the southeastern region of the study area, while its impact is reduced in the northwest. In addition, high mountains along the Himalayas block the northward moisture and result in large precipitation amounts in this region, which is revealed by all these datasets. As shown in Fig. 6a–e, precipitation from IMERG, MSWEP v2 and AERA5 varies more smoothly in space than that from TPHiPr and ERA5L. Moreover, compared with ERA5L, TPHiPr presents more details related to local topography. For example, the dry belt in the northern slope of the central Himalayas (around 29∘ N, 90∘ E), which was proved in the results of Wang et al. (2019), is more evident in TPHiPr than in ERA5L. Besides, TPHiPr shows greater spatial variability of precipitation than ERA5L in the Hengduan Mountains where the topography is very complex with many large mountain ranges and valleys. In terms of the total precipitation amounts, as shown in Fig. 6f–i, ERA5L generally has larger precipitation amounts than TPHiPr, while the opposite is true for the other three datasets. The precipitation amounts averaged over the study area from ERA5L, IMERG, MSWEP v2, AERA5 and TPHiPr are 712.72, 490.50, 496.79, 481.74 and 614.11 mm, respectively. Particularly, it can be noted from Fig. 6f–i that the differences between these datasets are relatively small in the eastern TP but are remarkable in the south of the Kunlun Mountains (around 35∘ N, 85∘ E) where almost no rain gauges are located, highlighting the high uncertainties of precipitation in ungauged regions.
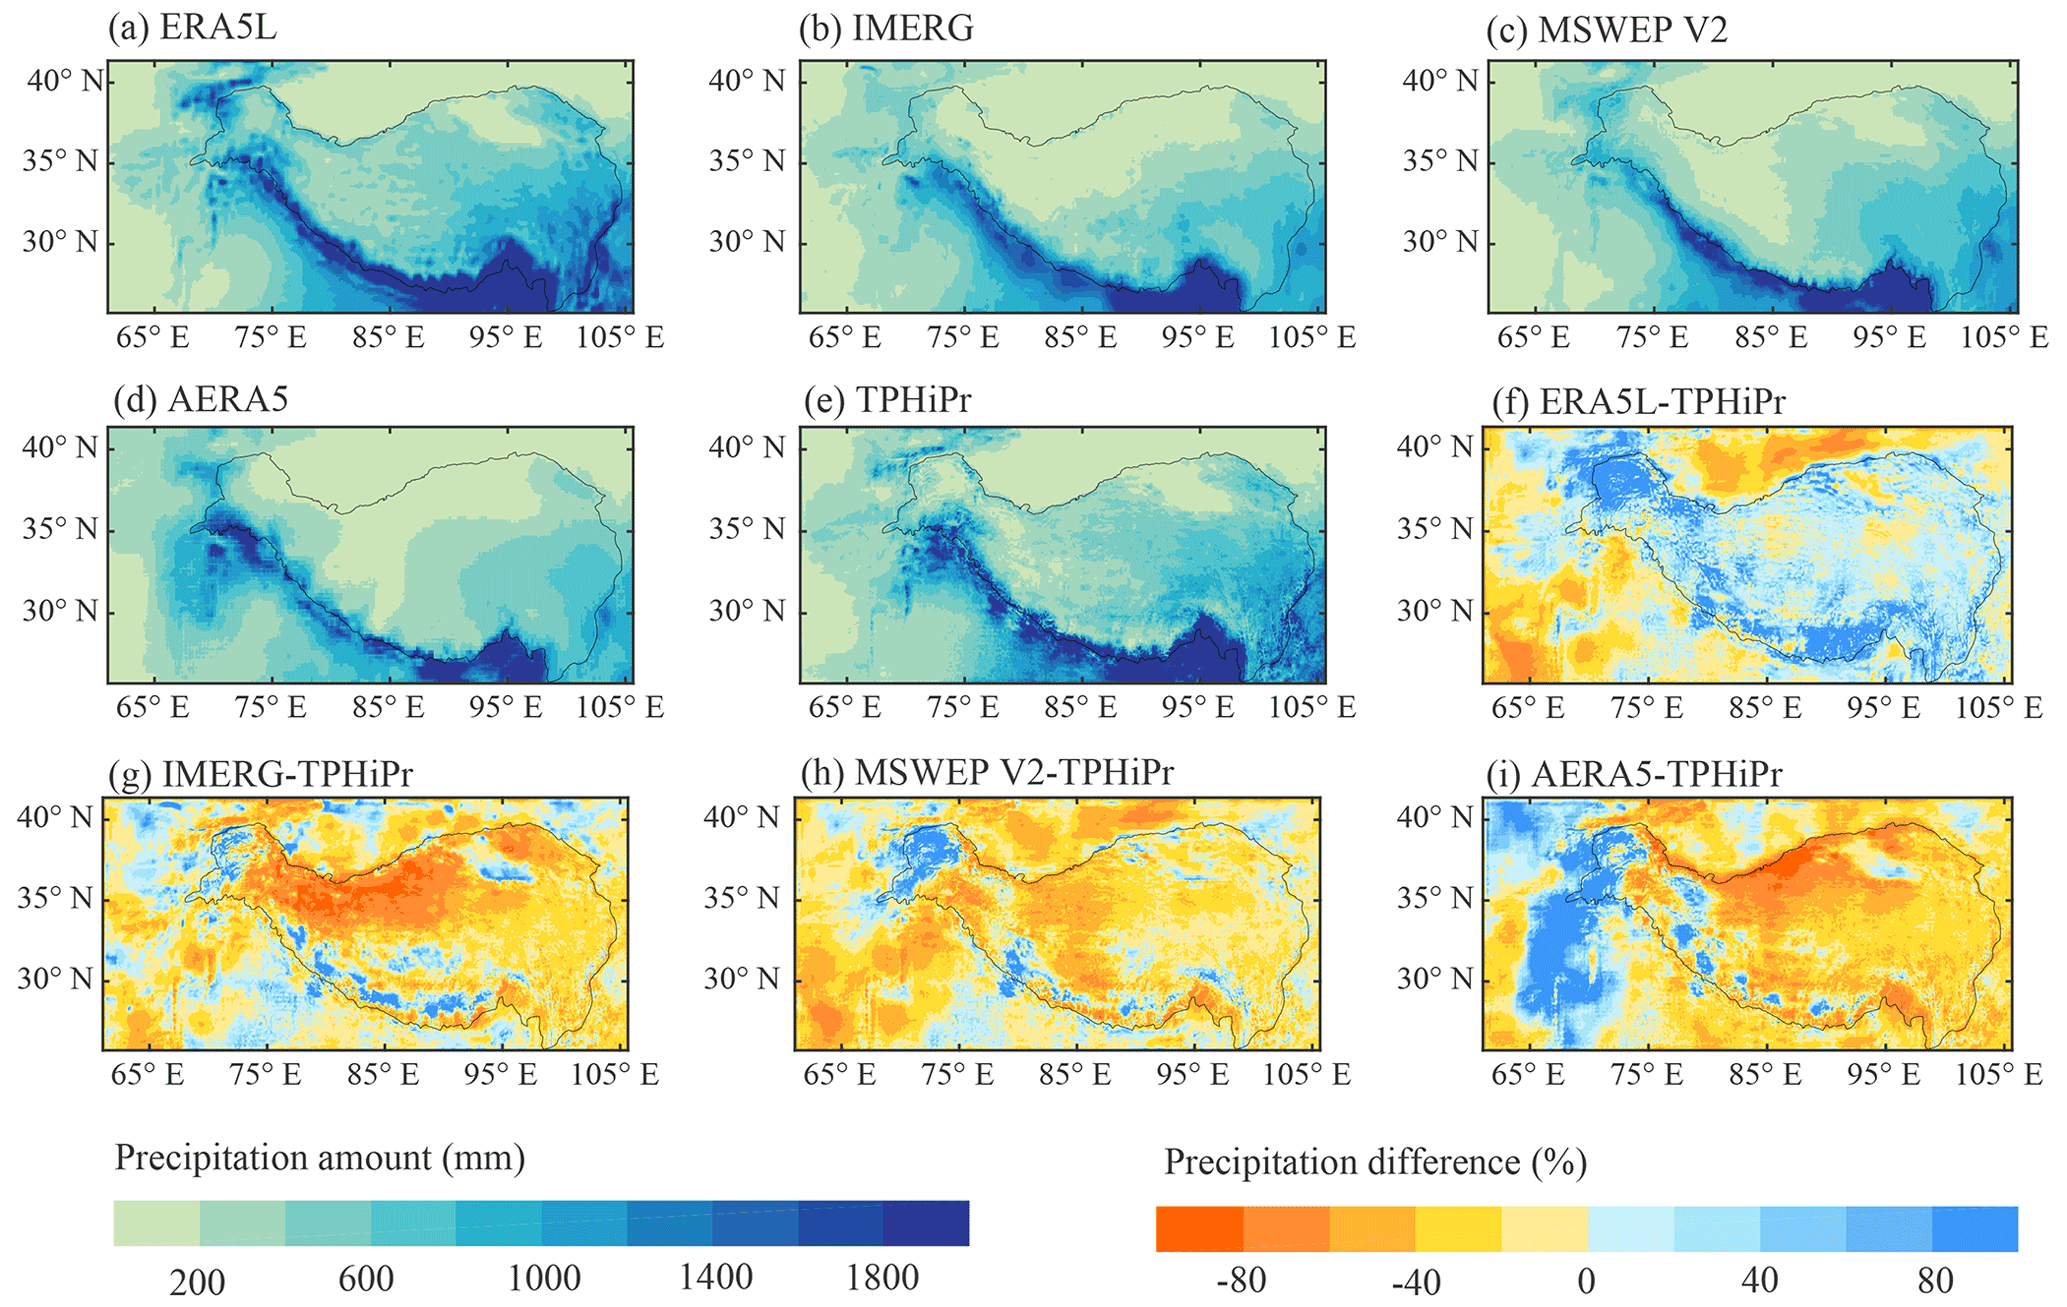
Figure 6Spatial patterns of (a–e) the average annual precipitation during 2008–2015 from the five datasets and (f–i) the relative differences between TPHiPr and the other four datasets. The differences are calculated by subtracting TPHiPr from the other four datasets and then dividing by TPHiPr.
With respect to the seasonal variations in precipitation, affected by the monsoon climate, most parts of the TP have large precipitation in summer but small precipitation in winter. In the westerly dominant western TP, the precipitation is large in spring and winter but small in summer. All these datasets can generally capture the seasonal cycles of precipitation in the TP (Fig. 7). The precipitation differences among these datasets in spring, summer and autumn are generally similar to those of annual precipitation, with ERA5L having a larger precipitation amount than TPHiPr but the other three datasets having a smaller precipitation amount. Apparent differences between these datasets occur in winter (fourth column in Fig. 8), in which the relative differences between ERA5L and TPHiPr are larger than 80 % in most regions, while most regions have relative differences between IMERG and TPHiPr of less than −80 %. The large differences in winter can likely be ascribed to solid precipitation, which is challenging for current precipitation datasets, especially for satellite-based datasets (Li et al., 2020; Lu and Yong, 2018).

Figure 7Spatial patterns of average seasonal precipitation from ERA5L (first row), IMERG (second row), MSWEP v2 (third row), AERA5 (fourth row) and TPHiPr (fifth row). The precipitation is averaged over the period from 2008 to 2015.
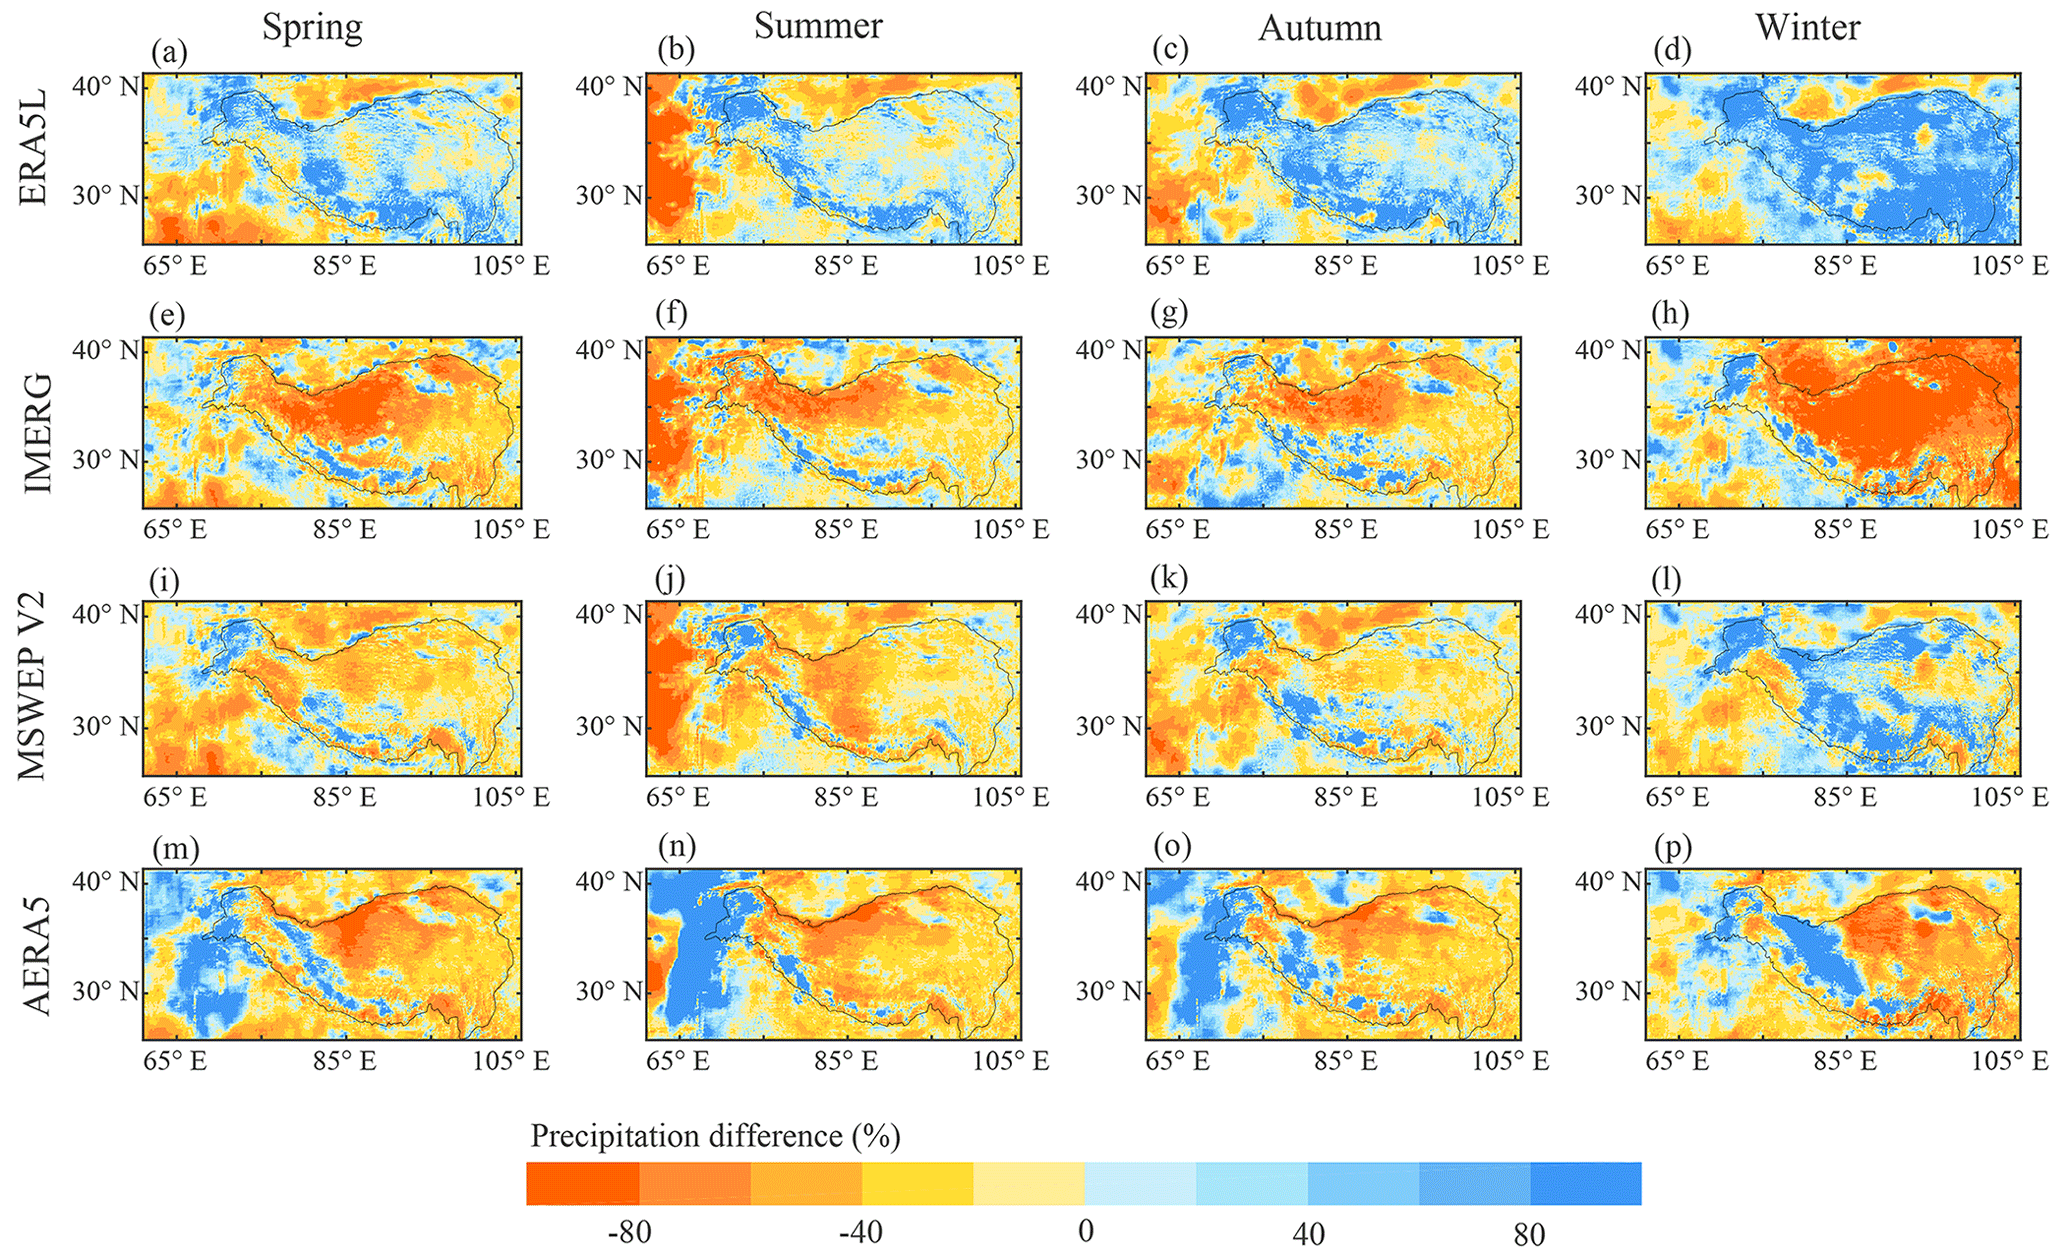
Figure 8Spatial patterns of the relative differences in average seasonal precipitation between TPHiPr and the other four datasets. The differences are calculated by subtracting TPHiPr from the other four datasets and then dividing by TPHiPr.
4.2.2 Comparison of error metrics
The performance of the four widely used datasets is evaluated with the rain gauge data used for independent validation in Sect. 4.1.2 and compared with that of TPHiPr in this study. Note that the evaluation in this section spans a shorter period from 2008 to 2015, considering the availability of the AERA5 data and that there were only 197 independent rain gauges (blue triangles in Fig. 1c) during this period.
Figure 9 compares the boxplots of the Rbias, RMSE and CC of the five datasets. In terms of the Rbias (Fig. 9a and the first column in Fig. 10), ERA5L overestimates precipitation at most rain gauges in the TP with a median value of 14.5 %, while AERA5 underestimates precipitation with a median value of −15.4 %. The other three datasets generally have small relative biases, and the median values for IMERG, MSWEP v2 and TPHiPr are −5.1 %, −0.0 % and 0.9 %, respectively. For RMSE (Fig. 9b and the second column in Fig. 10), the three global/quasi-global datasets have relatively large RMSE values in the TP, with a median value of 7.8 mm d−1 for ERA5L, 8.0 mm d−1 for IMERG and 6.9 mm d−1 for MSWEP v2. By merging with APHRODITE, AERA5 has a well-improved accuracy in the TP compared to the original ERA5L dataset, with a median RMSE value of 6.1 mm d−1. TPHiPr has a median RMSE value of 5.0 mm d−1, which is remarkably smaller than those of the other datasets. Particularly, TPHiPr and AERA5 have remarkably higher correlations with rain gauge data compared to the other three datasets, with more than 70 % of the rain gauges having CC values larger than 0.6 (Fig. 9c and the third column in Fig. 10). The median values of CC for TPHiPr and AERA5 are 0.76 and 0.71, respectively, followed by MSWEP v2 (0.63) and IMERG (0.57). ERA5L has the lowest correlations with rain gauge data, with CC values between 0.30 and 0.60 at most gauges and a median value of 0.55.
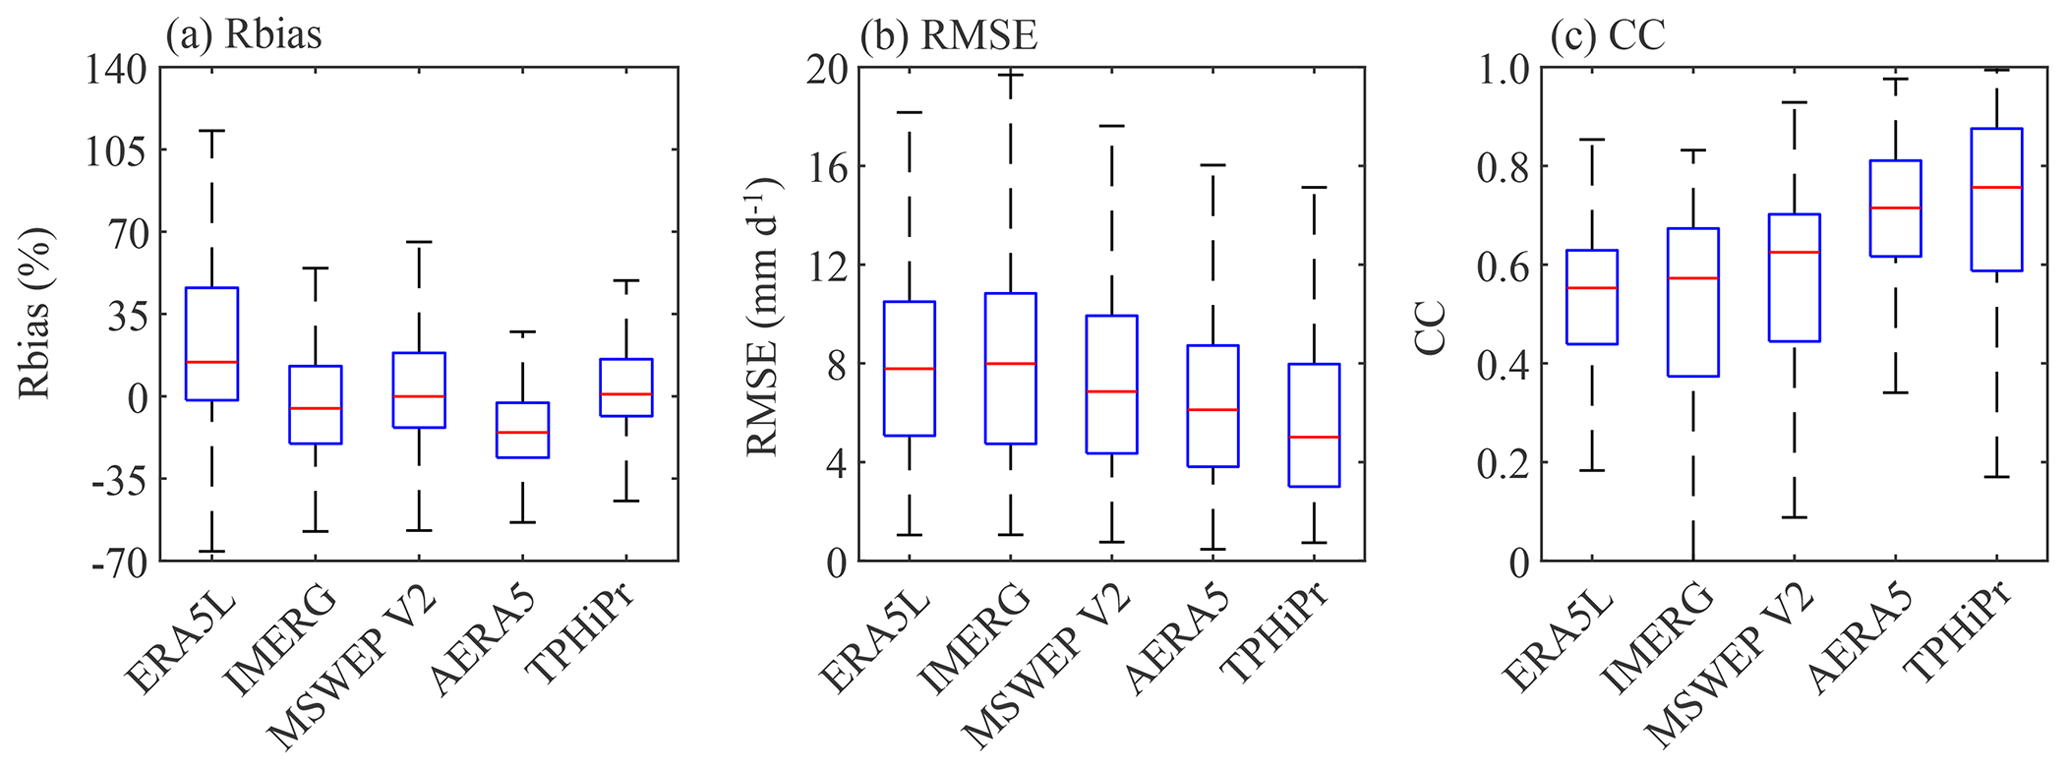
Figure 9Comparison of (a) Rbias, (b) RMSE and (c) CC for ERA5L, IMERG, MSWEP v2, AERA5 and TPHiPr. The box represents the distribution of the metrics for all 197 independent rain gauges in the TP.
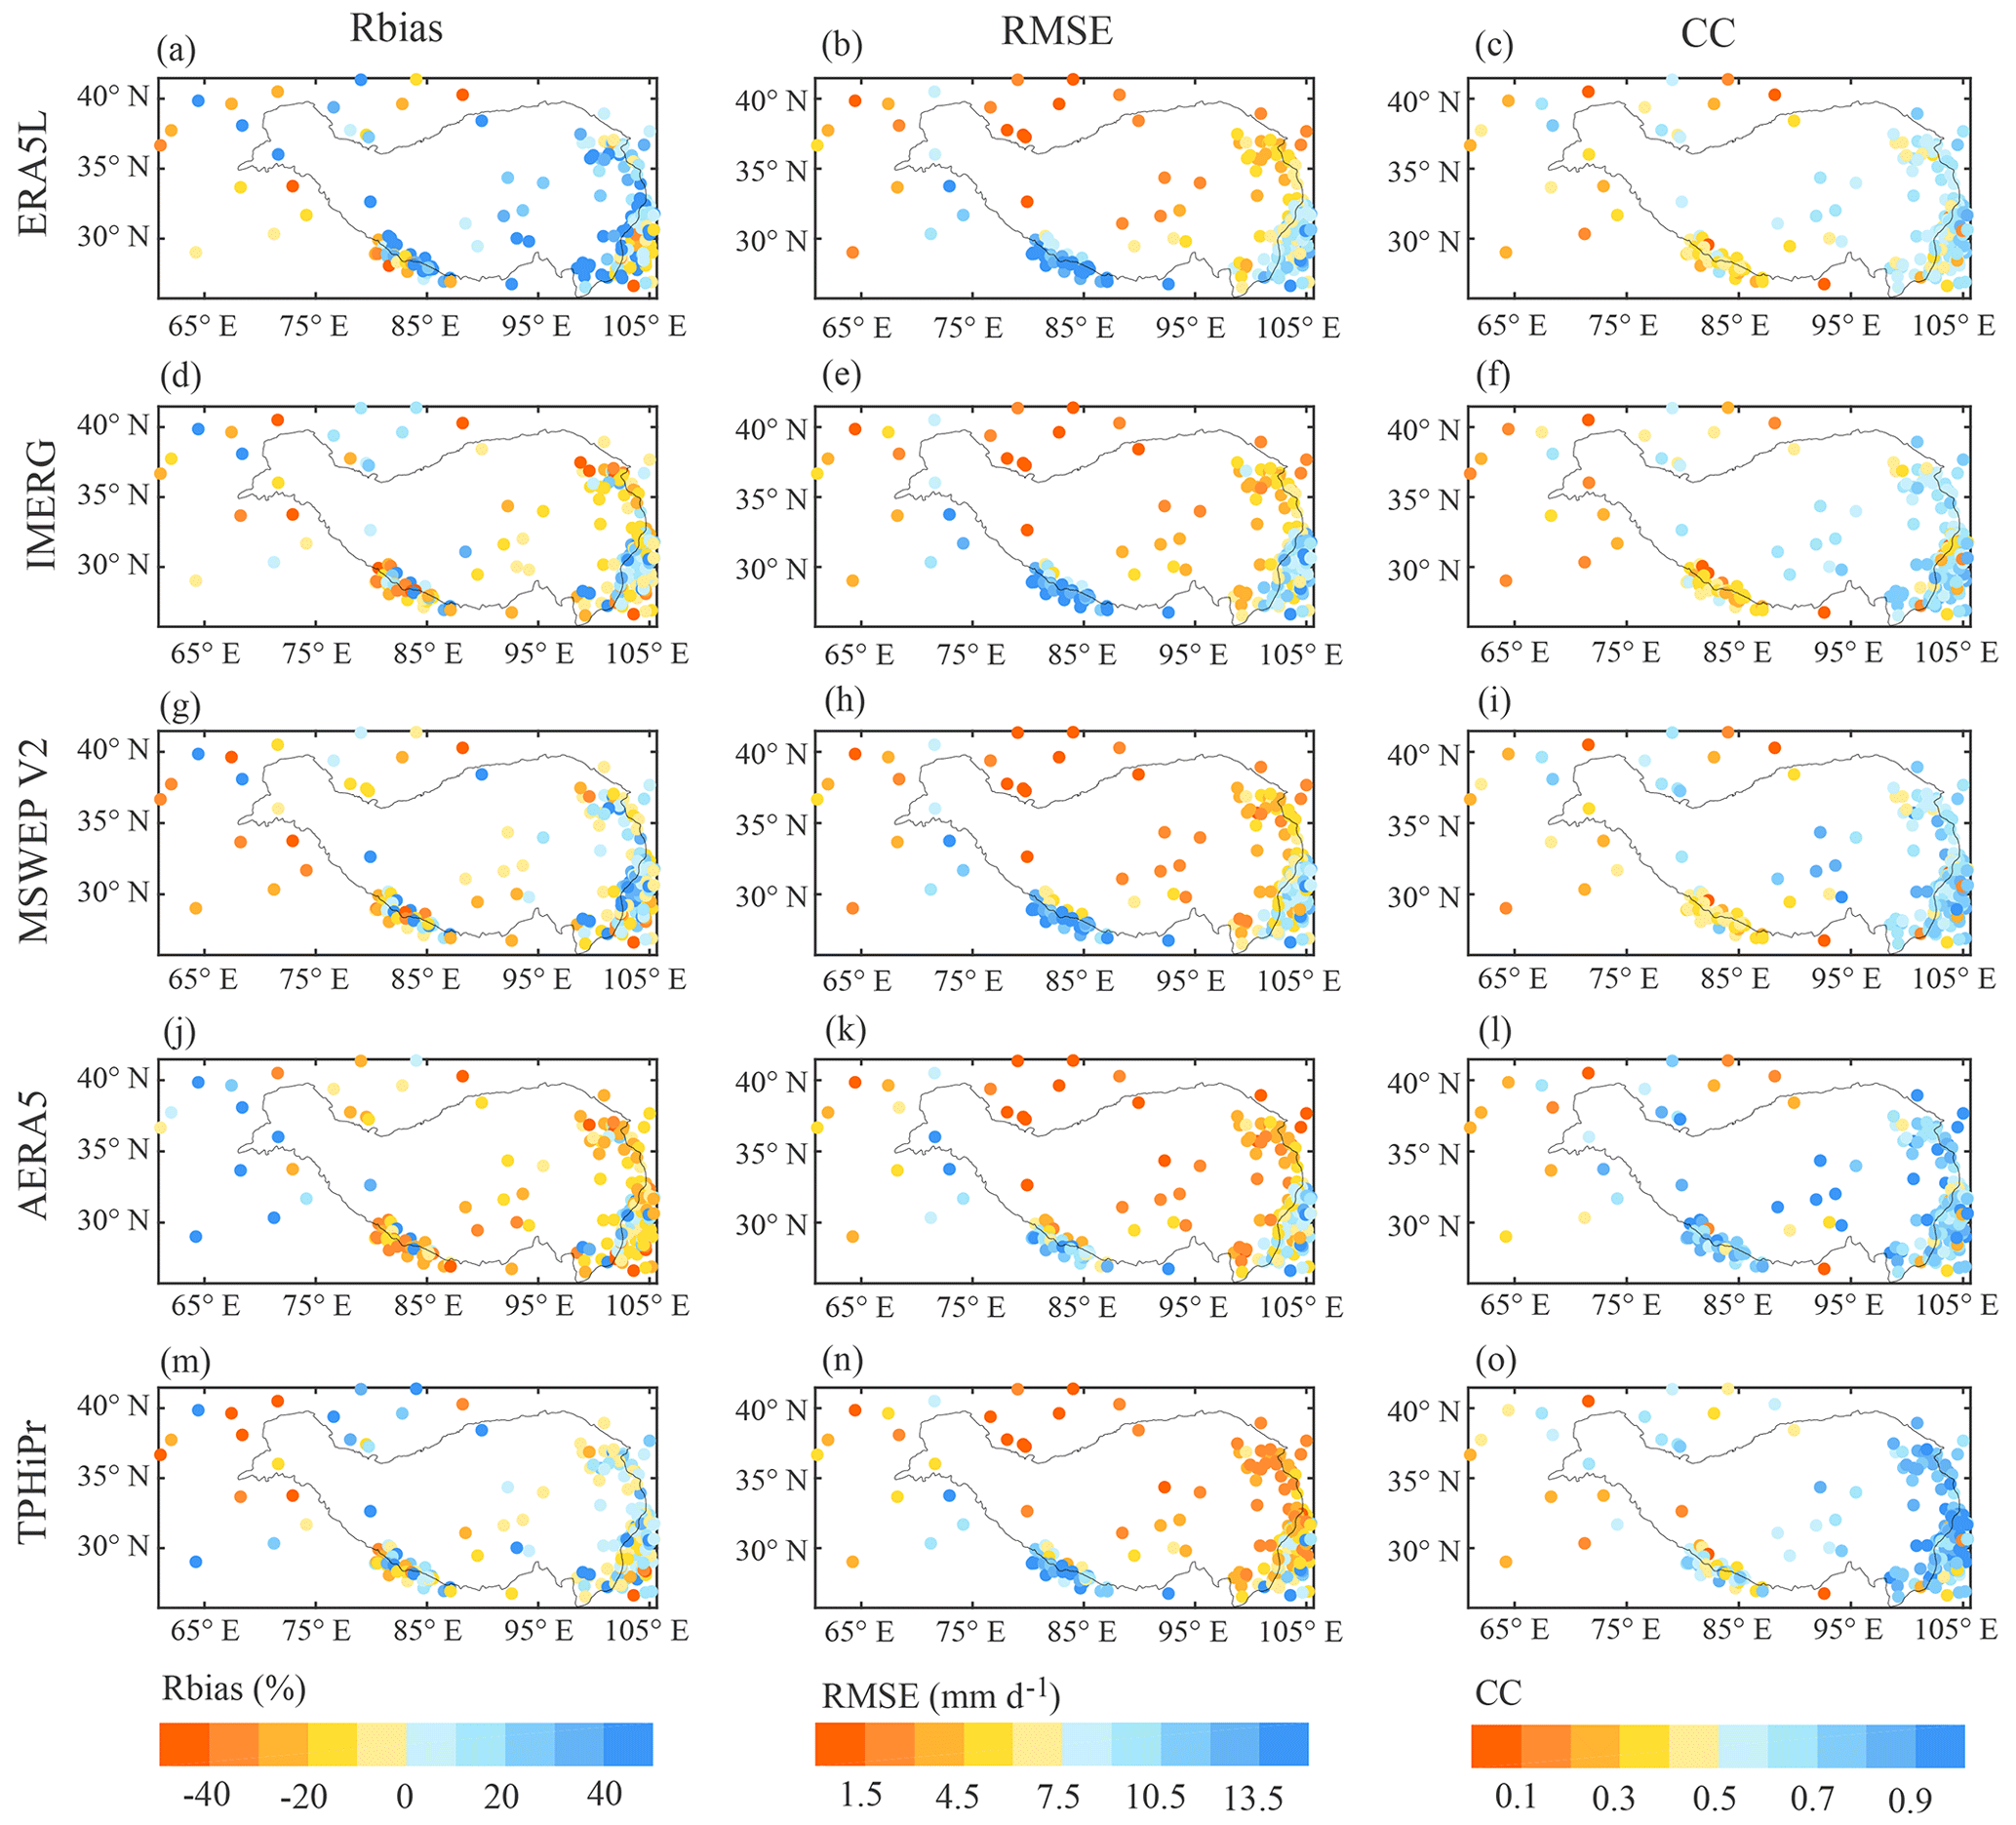
Figure 10Spatial distribution of Rbias (first column), RMSE (second column) and CC (third column) for (a–c) ERA5L, (d–f) IMERG, (g–i) MSWEP v2, (j–l) AERA5 and (m–o) TPHiPr. The metrics are calculated at a daily scale.
This study also calculates the POD, FAR and CSI for these datasets to compare their performance in detecting precipitation occurrence. In this section, a threshold of 0.1 mm d−1 is used to distinguish rain and no-rain days. Figure 11 compares the boxplots of these metrics for these datasets, and the spatial distributions for these metrics are shown in Fig. 12. Among the five datasets, ERA5L, MSWEP v2 and AERA5 have high values of POD (all have a median value of 0.97). However, it can be seen from Figs. 11b and 12 that ERA5L and MSWEP v2 also have large FAR values. This is mainly because ERA5L is atmospheric reanalysis that tends to overestimate precipitation frequency in the TP (Hu and Yuan, 2021), while the MSWEP v2 is produced by weighted averaging multiple datasets, which can also increase the precipitation occurrence. However, AERA5 shows relatively low FAR values, mainly ascribed to the correction with gauge data at a daily scale. In contrast, IMERG, mainly based on satellite estimates, has lower values of POD and FAR. With respect to TPHiPr, Fig. 11 shows that it has relatively high POD values (the median value is 0.93) and the lowest FAR (the median value is 0.36). As a result, TPHiPr gains high CSI values, with a median value of 0.61 that is close to AERA5 (0.59), while the other three datasets have a median CSI value of about 0.50.
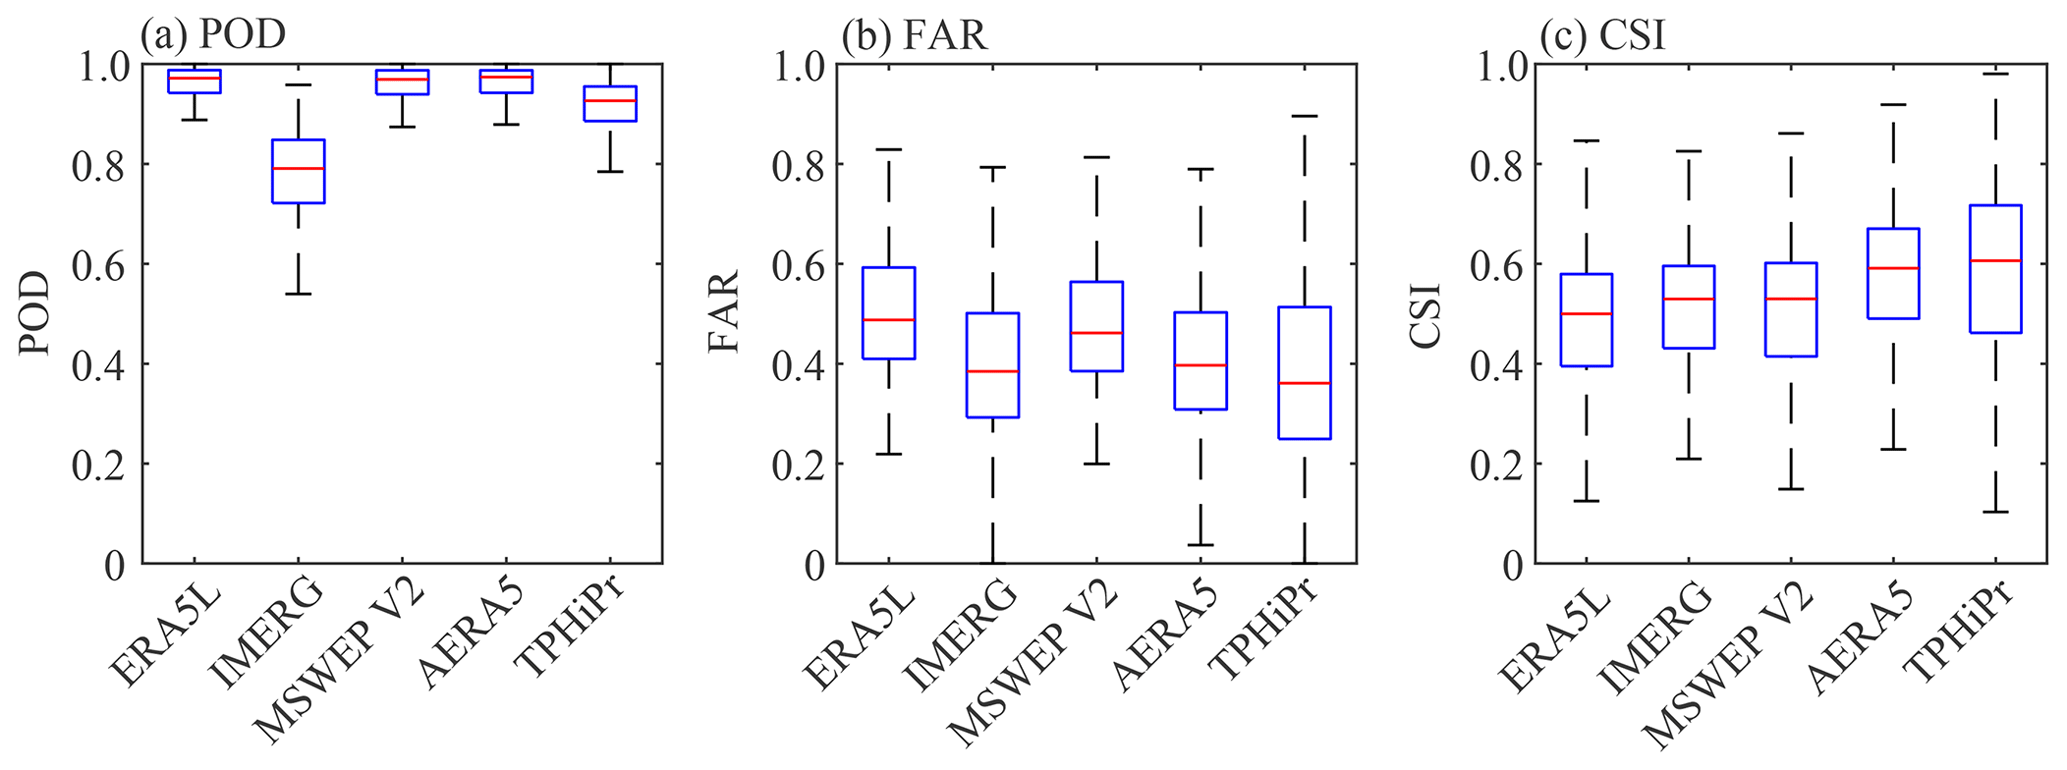
Figure 11Similar to Fig. 9 but for (a) POD, (b) FAR and (c) CSI. These metrics are calculated using a threshold of 0.1 mm d−1.

Figure 12Similar to Fig. 10 but for POD (first column), FAR (second column) and CSI (third column).
In summary, the comparison of these error metrics shows that TPHiPr generally has better performance than the widely used reanalysis data (ERA5L) and satellite-based data (IMERG) and even performs better than the multiple-source merged data (MSWEP v2) and AERA5. In addition, it should be noted that some validation data from the CMA, DHM and GHCN have been used to produce IMERG, MSWEP v2 and AERA5. Therefore, if these data are removed from the validation, more evident superiority of TPHiPr is expected.
4.2.3 Comparison of precipitation extremes
Extreme precipitation is the leading cause of many water-related disasters. Therefore, this study also evaluates the performance of TPHiPr to reproduce extreme precipitation. Following some previous works (Katsanos et al., 2016; Li et al., 2022; Lockhoff et al., 2014), the 90th percentile of daily precipitation on wet days is set as the threshold for extreme precipitation in this study. Due to discontinuous temporal coverages of gauge observations, this study only evaluates the extreme precipitation of these datasets at 91 rain gauges with at least 2-year precipitation records and covering a complete seasonal cycle.
Figure 13 compares the detection skill of these precipitation datasets for extreme precipitation. Compared with the detection skill for all precipitation events (Fig. 11), the detection skill of all the datasets for extreme precipitation is obviously reduced, with lower POD and CSI but higher FAR. Nevertheless, TPHiPr also shows good performance. The median value of CSI for TPHiPr is 0.27, which is the highest among these datasets.
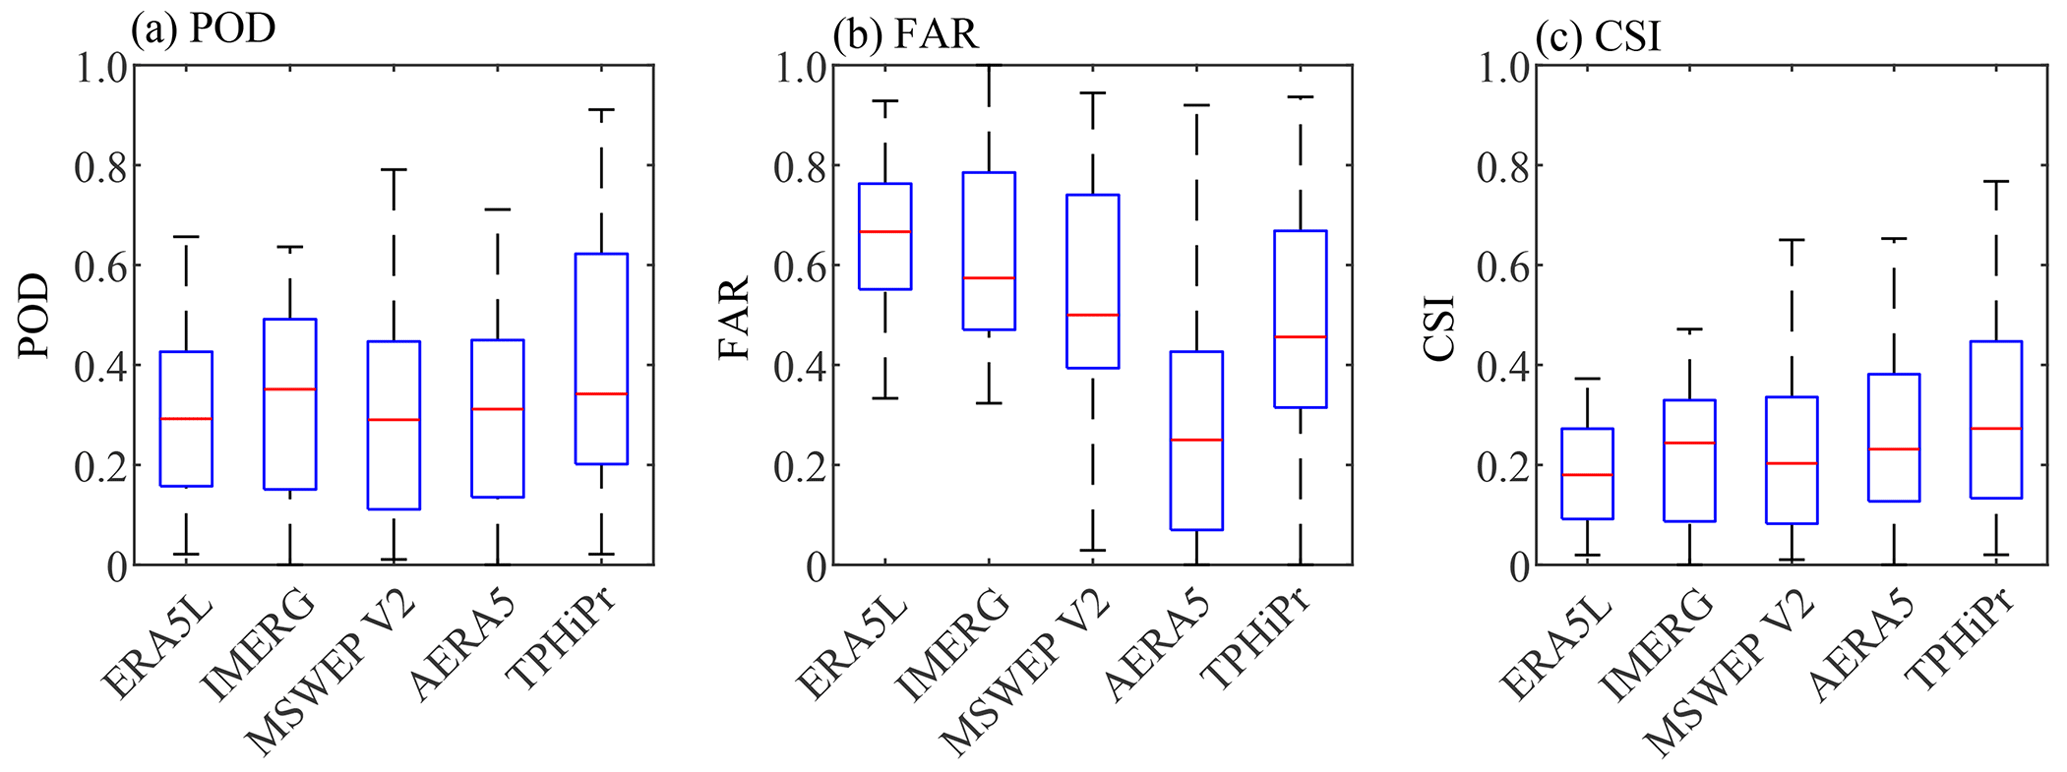
Figure 13Similar to Fig. 11 but for extreme precipitation. The 90th percentile of observed daily precipitation at each rain gauge is taken as the threshold for calculating these metrics.
The 90th percentile (R90p) of daily precipitation on wet days, the average intensity (R90p_INT) and the frequency (R90p_FRQ) of precipitation greater than R90p are also calculated for each dataset and compared with those of rain gauge data. Figure 14 shows that all these datasets have smaller R90p and R90p_INT but higher R90p_FRQ compared to the gauge data, indicating all these datasets underestimate the intensity but overestimate the frequency of extreme precipitation. TPHiPr has a worse performance than IMERG; however, it performs better than the other three datasets.
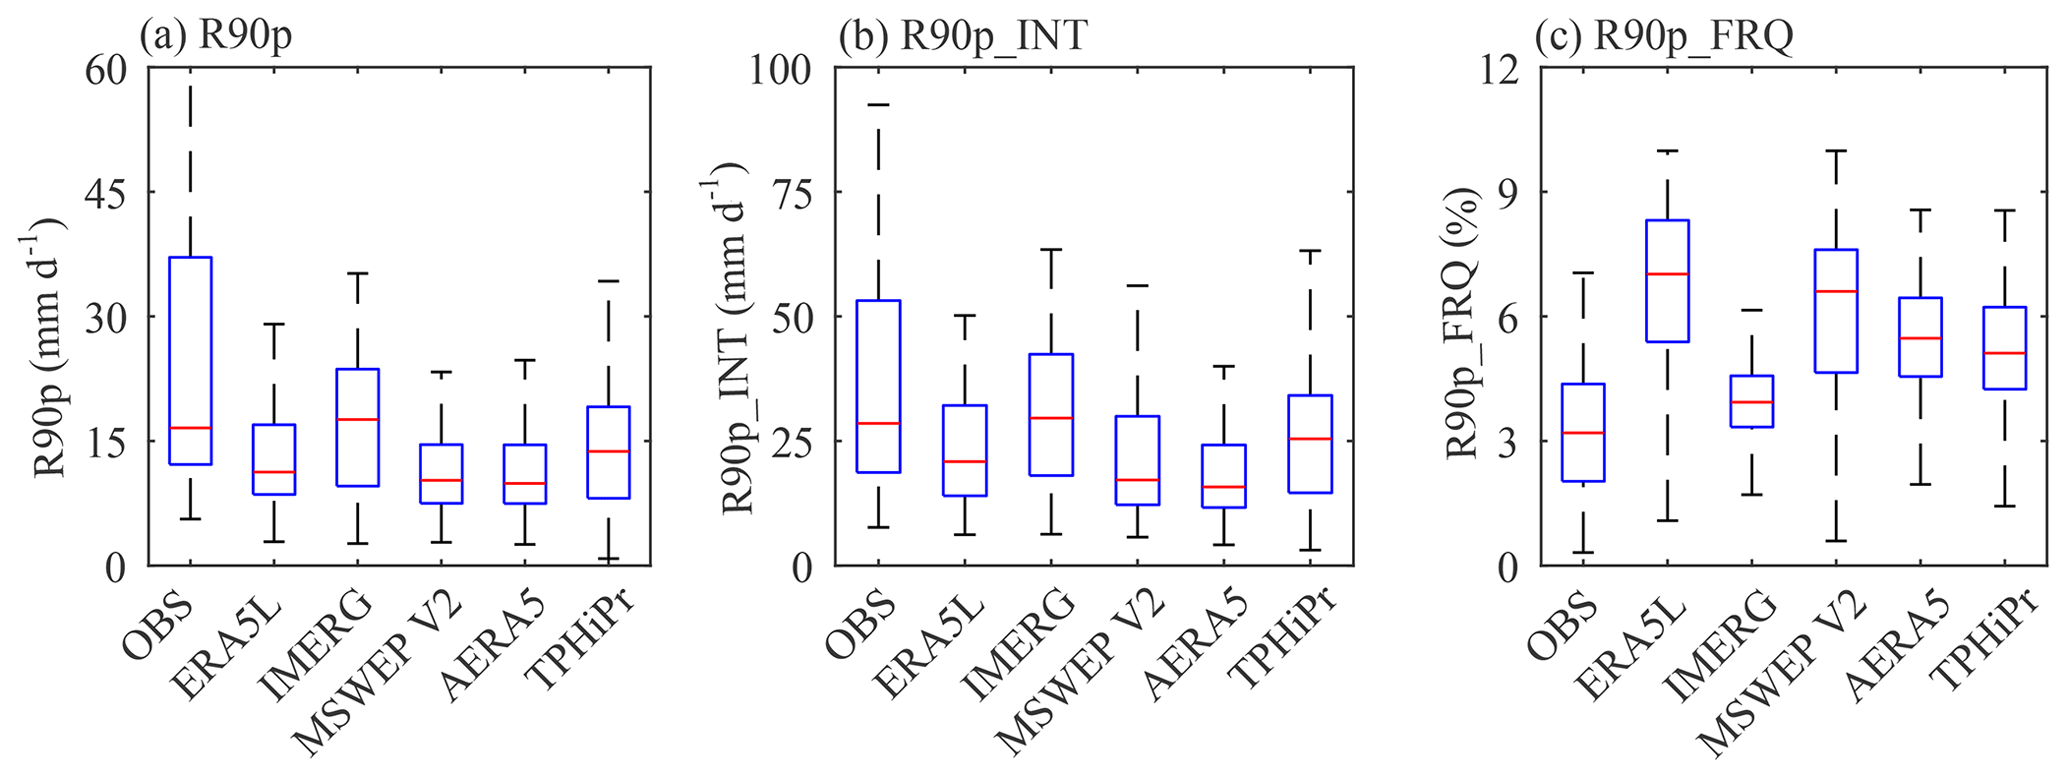
Figure 14Comparison of (a) R90p, (b) R90p_INT and (c) R90p_FRQ for rain gauge data (OBS), ERA5L, IMERG, MSWEP v2, AERA5 and TPHiPr. R90p represents the 90th percentile of daily precipitation on wet days for each dataset. R90p_INT represents the average precipitation intensity of daily precipitation larger than R90p. R90p_FRQ represents the frequency of daily precipitation larger than R90p.
In summary, although TPHiPr underestimates the intensity but overestimates the frequency of extreme precipitation, it has better performance than the other four datasets in detecting the occurrence of extreme precipitation.
The above analysis shows that TPHiPr produced in this study generally has high accuracy in the TP and is superior to the most widely used precipitation datasets. However, there are still some limitations in TPHiPr that need to be clarified.
As shown in Fig. 5, by merging the gridded data with the rain gauge data, the accuracy of the gridded data is generally improved, but the improvements vary greatly in space. In the eastern TP, the improvement is evident; however, the accuracy at some western rain gauges outside the 2500 m contour changes little and even gets worse. This highlights the importance of high-density rain gauge data for precipitation merging, as demonstrated in many previous works that rain gauge density greatly impacts the accuracy of the produced dataset (Berndt et al., 2014; Girons et al., 2015; Xie et al., 2007). Therefore, TPHiPr may still have large uncertainties in the west of the TP and regions where rain gauges are sparse.
Besides, previous studies have reported that atmospheric simulation-based datasets generally overestimate the precipitation frequency (Hu and Yuan, 2021; P. Li et al., 2021). Therefore, we investigate the probability distribution function (PDF) of both precipitation frequency and amount in TPHiPr with respect to different precipitation intensities. As shown in Fig. 15, TPHiPr largely overestimates the frequency of light precipitation (less than 5 mm d−1), although the overestimation is smaller than that in ERA5L, MSWEP v2 and AERA5. In addition, we can find from Fig. 15b that TPHiPr overestimates the amount of light to moderate precipitation but underestimates the amount of heavy precipitation, and the same is also found in ERA5L, MSWEP v2 and AERA5. Particularly, Fig. 15 shows that the satellite-based IMERG has relatively good performance in reproducing the PDF of precipitation frequency and amount, indicating that IMERG can be an effective data source for correcting the PDF of precipitation. Besides, some previous works have reported that considering both occurrence and amount of precipitation could contribute to better precipitation merging results compared to only correcting the precipitation amount (Zhang et al., 2021; Zhu et al., 2022); therefore, methods including both precipitation occurrence and amount correction should be considered in precipitation merging in the future.
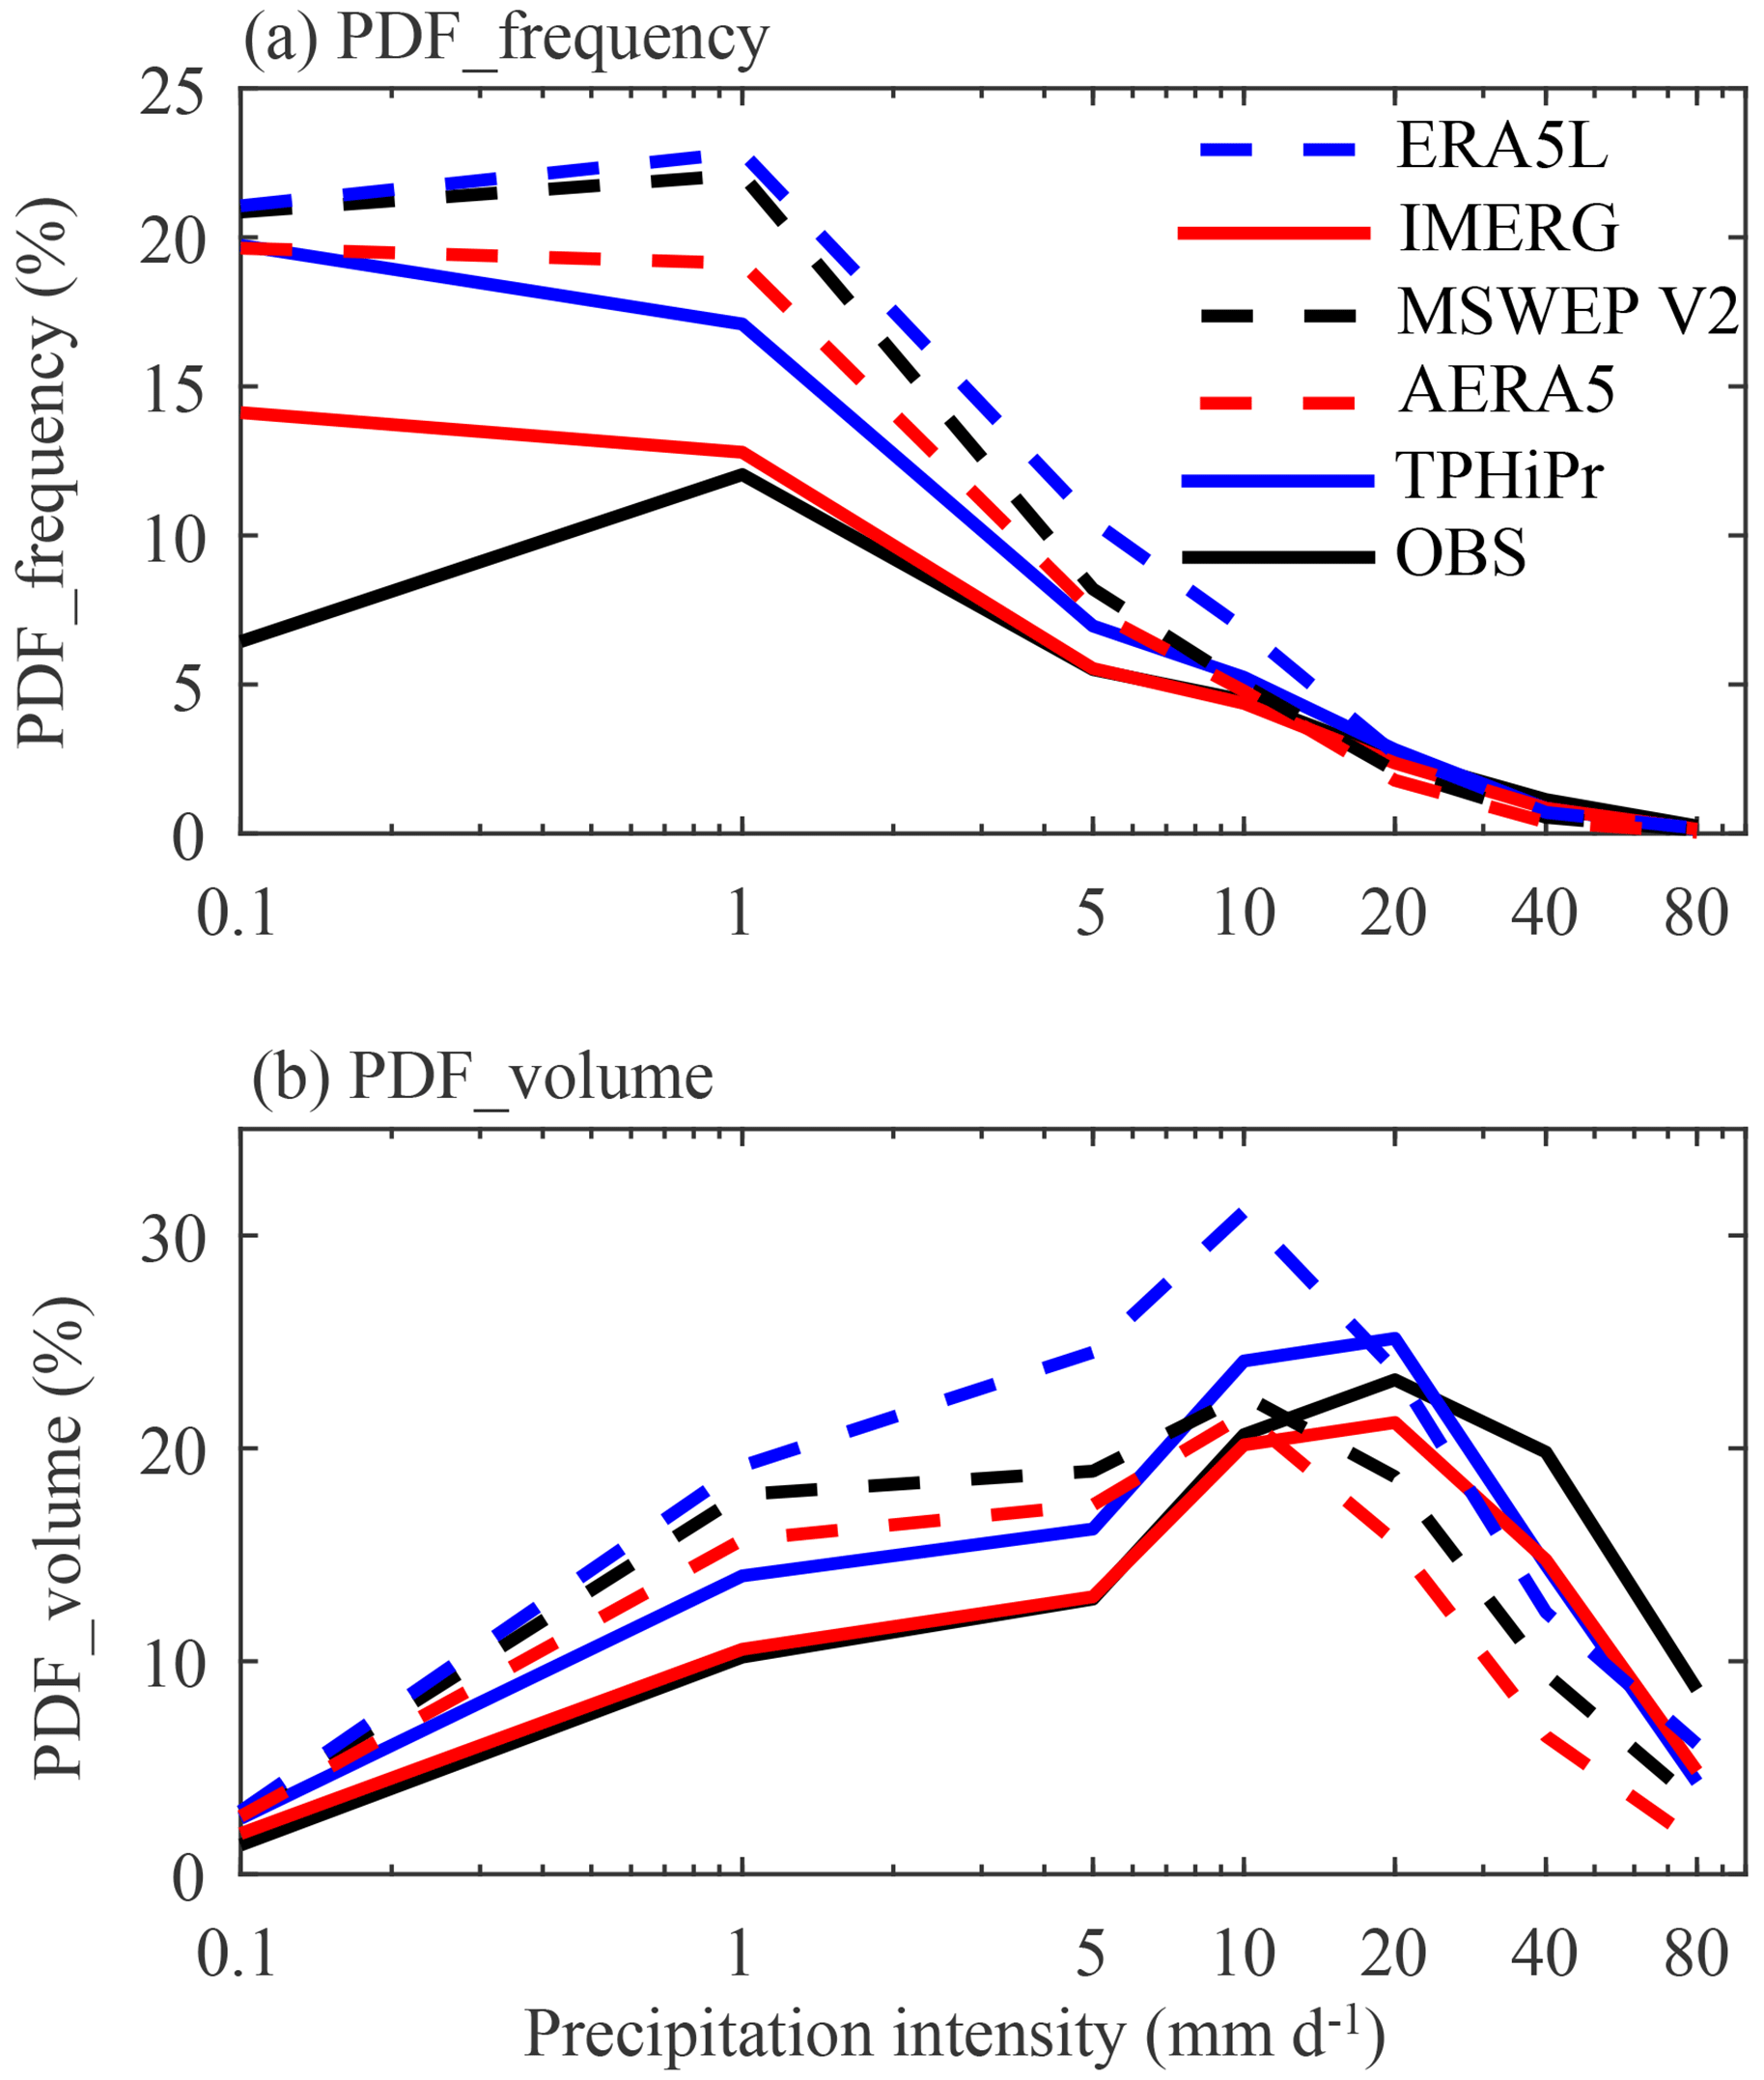
Figure 15Comparison of the probability density function by (a) precipitation frequency and (b) amount for rain gauge data and the four datasets. The x axis is in the log space.
The TPHiPr precipitation dataset in NetCDF format is available at the National Tibetan Plateau Data Center, which can be accessed at https://doi.org/10.11888/Atmos.tpdc.272763 (Yang and Jiang, 2022). The codes used for producing this dataset are available upon request to the authors.
This study collects more than 9000 rain gauges over and around the Third Pole (TP) region from multiple sources. Then, the following steps are applied for merging the high-density gauge observations and the atmospheric simulation-based ERA5_CNN: first, the monthly precipitation climatology at gauge locations is obtained by correcting the climatology of ERA5_CNN with rain gauge data, and the monthly climatology at gauge locations is interpolated using a RF- and kriging-based method; second, the ratios of observed monthly/daily precipitation to the climatology at gauge locations are interpolated for each month/day using the RF-based method; third, the monthly/daily precipitation fields are obtained by multiplying the interpolated monthly climatology by the interpolated monthly/daily ratios and then adding the residual fields; finally, the daily precipitation fields are further adjusted using the monthly precipitation. Eventually, a long-term (1979–2020) high-resolution (∘, daily) precipitation dataset (TPHiPr) is produced for the TP.
We compare the performance of the merged TPHiPr with the original ERA5_CNN data and four widely used precipitation datasets, including ERA5L, IMERG, MSWEP v2 and AERA5. Results show that TPHiPr retains the general spatial patterns of precipitation from ERA5_CNN but has a reduced wet bias in the TP, resulting in better error metrics than ERA5_CNN at most validation gauges. Meanwhile, TPHiPr generally performs better than the four widely used precipitation datasets in the TP, with respect to errors in both precipitation amount and detection skill. Validation with 197 independent gauges shows that TPHiPr has a small relative bias (0.9 %), low RMSE (5.0 mm d−1), high correlation (0.76) and high detection skill (CSI = 0.61). In addition, TPHiPr is skillful in detecting extreme precipitation events, although it overestimates the frequency but underestimates the intensity of extreme precipitation.
In summary, a new high-accuracy precipitation dataset is produced for the data-sparse TP, which can be used for land surface modeling, water resource management, water-related disaster assessment, climate change research, etc. This dataset is expected to deepen our understanding of land surface processes and water cycles in the TP. Nevertheless, further efforts (e.g., setting up more rain gauges in remote regions and developing more skillful merging methods) are still needed for obtaining higher-accuracy precipitation datasets for the TP; as clarified in Sect. 5, the produced data may still have large uncertainties in data-sparse regions and cannot reproduce the observed frequency and intensity of precipitation well.
YJ: conceptualization, investigation, formal analysis, methodology, software, visualization, writing – original draft preparation; KY: conceptualization, data curation, funding acquisition, project administration, resources, supervision, writing – review and editing; YQ: data curation, validation, writing – review and editing; XZ and JH: methodology, writing – review and editing; HL and XinL: supervision, writing – review and editing; YC: data curation, writing – review and editing; XiaL: data curation; BZ, AM, CS, XM, JT, and JZ: writing – review and editing.
The contact author has declared that none of the authors has any competing interests.
Publisher's note: Copernicus Publications remains neutral with regard to jurisdictional claims in published maps and institutional affiliations.
The authors would like to thank all the data contributors who shared their research data that supported the completion of this work and thank our group members for maintaining rain gauge networks and collecting observational data. We are also grateful to the reviewers and editors for their efforts in reviewing and editing our manuscript.
This research has been supported by the Second Tibetan Plateau Scientific Expedition and Research Program (STEP) (grant no. 2019QZKK0206), the Basic Science Center for Tibetan Plateau Earth System of the National Science Foundation of China (grant no. 41988101), and the National Key Research and Development Program of China (grant no. 2018YFC1507505).
This paper was edited by Qingxiang Li and reviewed by two anonymous referees.
Alazzy, A. A., Lü, H., Chen, R., Ali, A. B., Zhu, Y., and Su, J.: Evaluation of Satellite Precipitation Products and Their Potential Influence on Hydrological Modeling over the Ganzi River Basin of the Tibetan Plateau, Adv. Meteorol., 2017, 3695285, https://doi.org/10.1155/2017/3695285, 2017.
Araki, S., Yamamoto, K., and Kondo, A.: Application of regression kriging to air pollutant concentrations in Japan with high spatial resolution, Aerosol Air Qual. Res., 15, 234–241, https://doi.org/10.4209/aaqr.2014.01.0011, 2015
Baez-Villanueva, O. M., Zambrano-Bigiarini, M., Beck, H. E., McNamara, I., Ribbe, L., Nauditt, A., Birkel, C., Verbist, K., Giraldo-Osorio, J. D., and Xuan Thinh, N.: RF-MEP: A novel Random Forest method for merging gridded precipitation products and ground-based measurements, Remote Sens. Environ., 239, 111606, https://doi.org/10.1016/j.rse.2019.111606, 2020.
Beck, H. E., Wood, E. F., Pan, M., Fisher, C. K., Miralles, D. G., Van Dijk, A. I. J. M., McVicar, T. R., and Adler, R. F.: MSWEP v2 Global 3-hourly 0.1∘ precipitation: Methodology and quantitative assessment, B. Am. Meteorol. Soc., 100, 473–500, https://doi.org/10.1175/BAMS-D-17-0138.1, 2019.
Berndt, C., Rabiei, E., and Haberlandt, U.: Geostatistical merging of rain gauge and radar data for high temporal resolutions and various station density scenarios, J. Hydrol., 508, 88–101, https://doi.org/10.1016/j.jhydrol.2013.10.028, 2014.
Breiman, L.: Random Forests, Mach. Learn., 45, 5–32, https://doi.org/10.1007/978-3-030-62008-0_35, 2001.
Cellura, M., Cirrincione, G., Marvuglia, A., and Miraoui, A.: Wind speed spatial estimation for energy planning in Sicily: A neural kriging application, Renew. Energy, 33, 1251–1266, https://doi.org/10.1016/j.renene.2007.08.013, 2008.
Chen, F., Ding, L., Piao, S., Zhou, T., Xu, B., Yao, T., and Li, X.: The Tibetan Plateau as the engine for Asian environmental change: the Tibetan Plateau Earth system research into a new era, Sci. Bull., 66, 1263–1266, https://doi.org/10.1016/j.scib.2021.04.017, 2021.
Chen, R., Song, Y., Kang, E., Han, C., Liu, J., Yang, Y., Qing, W., and Liu, Z.: A cryosphere-hydrology observation system in a small alpine watershed in the Qilian mountains of China and its meteorological gradient, Arctic, Antarct. Alp. Res., 46, 505–523, https://doi.org/10.1657/1938-4246-46.2.505, 2014.
Chen, R., Song, Y., Liu, J., Yang, Y., Qing, W., Liu, Z., and Han, C.: Evaporation and precipitation dataset in Hulugou outlet in Upstream of Heihe River (2011), Natl. Tibet. Plateau Data Cent. [data set], https://doi.org/10.3972/heihe.110.2013.db, 2015.
Contractor, S., Donat, M. G., Alexander, L. V., Ziese, M., Meyer-Christoffer, A., Schneider, U., Rustemeier, E., Becker, A., Durre, I., and Vose, R. S.: Rainfall Estimates on a Gridded Network (REGEN) – a global land-based gridded dataset of daily precipitation from 1950 to 2016, Hydrol. Earth Syst. Sci., 24, 919–943, https://doi.org/10.5194/hess-24-919-2020, 2020.
Cui, P. and Jia, Y.: Mountain hazards in the Tibetan Plateau: Research status and prospects, Natl. Sci. Rev., 2, 397–399, https://doi.org/10.1093/nsr/nwv061, 2015.
Curio, J., Maussion, F., and Scherer, D.: A 12-year high-resolution climatology of atmospheric water transport over the Tibetan Plateau, Earth Syst. Dynam., 6, 109–124, https://doi.org/10.5194/esd-6-109-2015, 2015.
Demyanov, V., Kanevsky, M., Chernov, S., Savelieva, E., and Timonin, V.: Neural Network Residual Kriging Application for Climatic Data, J. Geogr. Inf. Decis. Anal., 2, 215–232, 1998.
Gao, H., Wang, J., Yang, Y., Pan, X., Ding, Y., and Duan, Z.: Permafrost Hydrology of the Qinghai-Tibet Plateau: A Review of Processes and Modeling, Front. Earth Sci., 8, 576838, https://doi.org/10.3389/feart.2020.576838, 2021.
Gao, Y., Xu, J., and Chen, D.: Evaluation of WRF mesoscale climate simulations over the Tibetan Plateau during 1979–2011, J. Climate, 28, 2823–2841, https://doi.org/10.1175/JCLI-D-14-00300.1, 2015.
Gao, Y., Chen, F., and Jiang, Y.: Evaluation of a convection-permitting modeling of precipitation over the Tibetan Plateau and its influences on the simulation of snow-cover fraction, J. Hydrometeorol., 21, 1531–1548, https://doi.org/10.1175/JHM-D-19-0277.1, 2020.
Girons, L. M., Wennerström, H., Nordén, L.Å., and Seibert, J.: Location and density of rain gauges for the estimation of spatial varying precipitation, Geogr. Ann. Ser. A Phys. Geogr., 97, 167–179, https://doi.org/10.1111/geoa.12094, 2015.
Hamada, A., Arakawa, O., and Yatagai, A.: An automated quality control method for daily rain-gauge data, Glob. Environ. Res., 15, 183–192, 2011.
He, J., Yang, K., Tang, W., Lu, H., Qin, J., Chen, Y., and Li, X.: The first high-resolution meteorological forcing dataset for land process studies over China, Sci. Data, 7, 25, https://doi.org/10.1038/s41597-020-0369-y, 2020.
He, X., Chaney, N. W., Schleiss, M., and Sheffield, J.: Spatial downscaling of precipitation using adaptable random forests, Water Resour. Res., 52, 8217–8237, https://doi.org/10.1002/2016WR019034, 2016.
Hersbach, H., Bell, B., Berrisford, P., Hirahara, S., Horányi, A., Muñoz-Sabater, J., Nicolas, J., Peubey, C., Radu, R., Schepers, D., Simmons, A., Soci, C., Abdalla, S., Abellan, X., Balsamo, G., Bechtold, P., Biavati, G., Bidlot, J., Bonavita, M., De Chiara, G., Dahlgren, P., Dee, D., Diamantakis, M., Dragani, R., Flemming, J., Forbes, R., Fuentes, M., Geer, A., Haimberger, L., Healy, S., Hogan, R.J., Hólm, E., Janisková, M., Keeley, S., Laloyaux, P., Lopez, P., Lupu, C., Radnoti, G., de Rosnay, P., Rozum, I., Vamborg, F., Villaume, S., and Thépaut, J.-N.: The ERA5 global reanalysis, Q. J. Roy. Meteor. Soc., 146, 1999–2049, https://doi.org/10.1002/qj.3803, 2020.
Hong, Z., Han, Z., Li, X., Long, D., Tang, G., and Wang, J.: Generation of an improved precipitation dataset from multisource information over the tibetan plateau, J. Hydrometeorol., 22, 1275–1295, https://doi.org/10.1175/JHM-D-20-0252.1, 2021.
Hu, X. and Yuan, W.: Evaluation of ERA5 precipitation over the eastern periphery of the Tibetan plateau from the perspective of regional rainfall events, Int. J. Climatol., 41, 2625–2637, https://doi.org/10.1002/joc.6980, 2021.
Huai, B., Wang, J., Sun, W., Wang, Y., and Zhang, W.: Evaluation of the near-surface climate of the recent global atmospheric reanalysis for Qilian Mountains, Qinghai-Tibet Plateau, Atmos. Res., 250, 105401, https://doi.org/10.1016/j.atmosres.2020.105401, 2021.
Huffman, G. J., Adler, R. F., Bolvin, D. T., Gu, G., Nelkin, E. J., Bowman, K. P., Hong, Y., Stocker, E. F., and Wolff, D. B.: The TRMM Multisatellite Precipitation Analysis (TMPA): Quasi-global, multiyear, combined-sensor precipitation estimates at fine scales, J. Hydrometeorol., 8, 38–55, https://doi.org/10.1175/JHM560.1, 2007.
Huffman, G. J., Bolvin, D. T., Braithwaite, D., Hsu, K., Kidd, R. J. C., Nelkin, E. J., Sorooshian, S., Tan, J., and Xie, P.: NASA Global Precipitation Measurement (GPM) Integrated Multi-satellitE Retrievals for GPM (IMERG), Algorithm Theoretical Basis Document (ATBD) Version 06, NASA/GSFC, Greenbelt, MD, USA, 38 pp., 2019.
Immerzeel, W. W., Wanders, N., Lutz, A. F., Shea, J. M., and Bierkens, M. F. P.: Reconciling high-altitude precipitation in the upper Indus basin with glacier mass balances and runoff, Hydrol. Earth Syst. Sci., 19, 4673–4687, https://doi.org/10.5194/hess-19-4673-2015, 2015.
Jiang, Y., Yang, K., Shao, C., Zhou, X., Zhao, L., and Chen, Y.: A downscaling approach for constructing high-resolution precipitation dataset over the Tibetan Plateau from ERA5 reanalysis, Atmos. Res., 256, 105574, https://doi.org/10.1016/j.atmosres.2021.105574, 2021.
Jiang, Y., Yang, K., Li, X., Zhang, W., Shen, Y., Chen, Y., and Li, X.: Atmospheric simulation-based precipitation datasets outperform satellite-based products in closing basin-wide water budget in the eastern Tibetan Plateau, Int. J. Climatol., 42, 7252–7268, https://doi.org/10.1002/joc.7642, 2022a.
Jiang, Y., Yang, K., Yang, H., Lu, H., Chen, Y., Zhou, X., Sun, J., Yang, Y., and Wang, Y.: Characterizing basin-scale precipitation gradients in the Third Pole region using a high-resolution atmospheric simulation-based dataset, Hydrol. Earth Syst. Sci., 26, 4587–4601, https://doi.org/10.5194/hess-26-4587-2022, 2022b.
Katsanos, D., Retalis, A., Tymvios, F., and Michaelides, S.: Analysis of precipitation extremes based on satellite (CHIRPS) and in situ dataset over Cyprus, Nat. Hazards, 83, 53–63, https://doi.org/10.1007/s11069-016-2335-8, 2016.
Li, D., Yang, K., Tang, W., Li, X., Zhou, X., and Guo, D.: Characterizing precipitation in high altitudes of the western Tibetan plateau with a focus on major glacier areas, Int. J. Climatol., 40, 5114–5127, https://doi.org/10.1002/joc.6509, 2020.
Li, K., Tian, F., Khan, M. Y. A., Xu, R., He, Z., Yang, L., Lu, H., and Ma, Y.: A high-accuracy rainfall dataset by merging multiple satellites and dense gauges over the southern Tibetan Plateau for 2014–2019 warm seasons, Earth Syst. Sci. Data, 13, 5455–5467, https://doi.org/10.5194/essd-13-5455-2021, 2021.
Li, P., Furtado, K., Zhou, T., Chen, H., and Li, J.: Convection-permitting modelling improves simulated precipitation over the central and eastern Tibetan Plateau, Q. J. Roy. Meteor. Soc., 147, 341–362, https://doi.org/10.1002/qj.3921, 2021.
Li, Y., Pang, B., Ren, M., Shi, S., Peng, D., Zhu, Z., and Zuo, D.: Evaluation of Performance of Three Satellite-Derived Precipitation Products in Capturing Extreme Precipitation Events over Beijing, China, Remote Sens, 14, 2698, https://doi.org/10.3390/rs14112698, 2022.
Lockhoff, M., Zolina, O., Simmer, C., and Schulz, J.: Evaluation of satellite-retrieved extreme precipitation over Europe using gauge observations, J. Climate, 27, 607–623, https://doi.org/10.1175/JCLI-D-13-00194.1, 2014.
Lu, D. and Yong, B.: Evaluation and hydrological utility of the latest GPM IMERG V5 and GSMaP V7 precipitation products over the Tibetan Plateau, Remote Sens., 10, 2022, https://doi.org/10.3390/rs10122022, 2018.
Lundquist, J., Hughes, M., Gutmann, E., and Kapnick, S.: Our skill in modeling mountain rain and snow is bypassing the skill of our observational networks, B. Am. Meteorol. Soc., 2473–2490, https://doi.org/10.1175/BAMS-D-19-0001.1, 2019.
Luo, L.: Meteorological observation data from the integrated observation and research station of the alpine environment in Southeast Tibet (2007–2017), Natl. Tibet. Plateau Data Cent. [data set], https://doi.org/10.11888/AtmosphericPhysics.tpe.68.db, 2018.
Ma, Y., Zhang, Y., Yang, D., and Farhan, S. B.: Precipitation bias variability versus various gauges under different climatic conditions over the Third Pole Environment (TPE) region, Int. J. Climatol., 35, 1201–1211, https://doi.org/10.1002/joc.4045, 2015.
Ma, Y., Hong, Y., Chen, Y., Yang, Y., Tang, G., Yao, Y., Long, D., Li, C., Han, Z., and Liu, R.: Performance of Optimally Merged Multisatellite Precipitation Products Using the Dynamic Bayesian Model Averaging Scheme Over the Tibetan Plateau, J. Geophys. Res.-Atmos., 123, 814–834, https://doi.org/10.1002/2017JD026648, 2018.
Ma, Z., Xu, J., Zhu, S., Yang, J., Tang, G., Yang, Y., Shi, Z., and Hong, Y.: AIMERG: a new Asian precipitation dataset (0.1∘/half-hourly, 2000–2015) by calibrating the GPM-era IMERG at a daily scale using APHRODITE, Earth Syst. Sci. Data, 12, 1525–1544, https://doi.org/10.5194/essd-12-1525-2020, 2020.
Ma, Z., Xu, J., Ma, Y., Zhu, S., He, K., Zhang, S., Ma, W., and Xu, X.: A Long-Term Asian Precipitation Dataset (0.1∘, 1-hourly, 1951–2015, Asia) Anchoring the ERA5-Land under the Total Volume Control by APHRODITE, B. Am. Meteorol. Soc., 1146–1171, https://doi.org/10.1175/BAMS-D-20-0328.1, 2022.
Maussion, F., Scherer, D., Mölg, T., Collier, E., Curio, J., and Finkelnburg, R.: Precipitation seasonality and variability over the Tibetan Plateau as resolved by the high Asia reanalysis, J. Climate, 27, 1910–1927, https://doi.org/10.1175/JCLI-D-13-00282.1, 2014.
Menne, M. J., Durre, I., Vose, R. S., Gleason, B. E., and Houston, T. G.: An overview of the global historical climatology network-daily database, J. Atmos. Ocean. Technol., 29, 897–910, https://doi.org/10.1175/JTECH-D-11-00103.1, 2012.
Muñoz-Sabater, J., Dutra, E., Agustí-Panareda, A., Albergel, C., Arduini, G., Balsamo, G., Boussetta, S., Choulga, M., Harrigan, S., Hersbach, H., Martens, B., Miralles, D. G., Piles, M., Rodríguez-Fernández, N. J., Zsoter, E., Buontempo, C., and Thépaut, J.-N.: ERA5-Land: a state-of-the-art global reanalysis dataset for land applications, Earth Syst. Sci. Data, 13, 4349–4383, https://doi.org/10.5194/essd-13-4349-2021, 2021.
Norris, J., Carvalho, L. M. V., Jones, C., Cannon, F., Bookhagen, B., Palazzi, E., and Tahir, A. A.: The spatiotemporal variability of precipitation over the Himalaya: evaluation of one-year WRF model simulation, Clim. Dynam., 49, 2179–2204, https://doi.org/10.1007/s00382-016-3414-y, 2017.
Ouyang, L., Lu, H., Yang, K., Leung, L. R., Wang, Y., Zhao, L., Zhou, X., LaZhu, Chen, Y., Jiang, Y., and Yao, X.: Characterizing uncertainties in ground “truth” of precipitation over complex terrain through high-resolution numerical modeling, Geophys. Res. Lett., 48, e2020GL091950, https://doi.org/10.1029/2020gl091950, 2021.
Savéan, M., Delclaux, F., Chevallier, P., Wagnon, P., Gonga-Saholiariliva, N., Sharma, R., Neppel, L., and Arnaud, Y.: Water budget on the Dudh Koshi River (Nepal): Uncertainties on precipitation, J. Hydrol., 531, 850–862, https://doi.org/10.1016/j.jhydrol.2015.10.040, 2015.
Schamm, K., Ziese, M., Becker, A., Finger, P., Meyer-Christoffer, A., Schneider, U., Schröder, M., and Stender, P.: Global gridded precipitation over land: a description of the new GPCC First Guess Daily product, Earth Syst. Sci. Data, 6, 49–60, https://doi.org/10.5194/essd-6-49-2014, 2014.
Sekulić, A., Kilibarda, M., Protić, D., and Bajat, B.: A high-resolution daily gridded meteorological dataset for Serbia made by Random Forest Spatial Interpolation, Sci. Data, 8, 123, https://doi.org/10.1038/s41597-021-00901-2, 2021.
Shen, Y., Xiong, A., Hong, Y., Yu, J., Pan, Y., Chen, Z., and Saharia, M.: Uncertainty analysis of five satellite-based precipitation products and evaluation of three optimally merged multi-algorithm products over the Tibetan Plateau, Int. J. Remote Sens., 35, 6843–6858, https://doi.org/10.1080/01431161.2014.960612, 2014.
Sugimoto, S., Ueno, K., Fujinami, H., Nasuno, T., Sato, T., and Takahashi, H. G.: Cloud-Resolving-Model Simulations of Nocturnal Precipitation over the Himalayan Slopes and Foothills, J. Hydrometeorol., 22, 3171–3188, https://doi.org/10.1175/JHM-D-21-0103.1, 2021.
Tan, X., Ma, Z., He, K., Han, X., Ji, Q., and He, Y.: Evaluations on gridded precipitation products spanning more than half a century over the Tibetan Plateau and its surroundings, J. Hydrol., 582, https://doi.org/10.1016/j.jhydrol.2019.124455, 2020.
Wang, A. and Zeng, X.: Evaluation of multireanalysis products with in situ observations over the Tibetan Plateau, J. Geophys. Res.-Atmos., 117, D05102, https://doi.org/10.1029/2011JD016553, 2012.
Wang, J.: Daily meteorological Data of Nam Co Station China during 2019–2020, Natl. Tibet. Plateau Data Cent. [data set], https://doi.org/10.11888/Meteoro.tpdc.271782, 2021.
Wang, X., Pang, G., and Yang, M.: Precipitation over the tibetan plateau during recent decades: A review based on observations and simulations, Int. J. Climatol., 38, 1116–1131, https://doi.org/10.1002/joc.5246, 2018.
Wang, X., Tolksdorf, V., Otto, M., and Scherer, D.: WRF-based dynamical downscaling of ERA5 reanalysis data for High Mountain Asia: Towards a new version of the High Asia Refined analysis, Int. J. Climatol., 41, 743–762, https://doi.org/10.1002/joc.6686, 2020.
Wang, Y., Yang, K., Zhou, X., Wang, B., Chen, D., Lu, H., Lin, C., and Zhang, F.: The Formation of a Dry-Belt in the North Side of Central Himalaya Mountains, Geophys. Res. Lett., 46, 2993–3000, https://doi.org/10.1029/2018GL081061, 2019.
Wang, Y., Wang, L., Li, X., Zhou, J., and Hu, Z.: An integration of gauge, satellite, and reanalysis precipitation datasets for the largest river basin of the Tibetan Plateau, Earth Syst. Sci. Data, 12, 1789–1803, https://doi.org/10.5194/essd-12-1789-2020, 2020a.
Wang, Y., Yang, K., Zhou, X., Chen, D., Lu, H., Ouyang, L., Chen, Y., Lazhu, and Wang, B.: Synergy of orographic drag parameterization and high resolution greatly reduces biases of WRF-simulated precipitation in central Himalaya, Clim. Dynam., 54, 1729–1740, https://doi.org/10.1007/s00382-019-05080-w, 2020b.
Wei, D. and Wang, X.: Meteorological observation data in an alpine steppe site of Shenzha Station (2015-018), Natl. Tibet. Plateau Data Cent. [data set], https://doi.org/10.11888/Meteoro.tpdc.270117, 2019.
Willmott, C. J. and Robeson, S. M.: Climatologically aided interpolation (CAI) of terrestrial air temperature, Int. J. Climatol., 15, 221–229, https://doi.org/10.1002/joc.3370150207, 1995.
Xie, P., Yatagai, A., Chen, M., Hayasaka, T., Fukushima, Y., Liu, C., and Yang, S.: A gauge-based analysis of daily precipitation over East Asia, J. Hydrometeorol., 8, 607–626, https://doi.org/10.1175/JHM583.1, 2007.
Xu, J., Ma, Z., Yan, S., and Peng, J.: Do ERA5 and ERA5-land precipitation estimates outperform satellite-based precipitation products? A comprehensive comparison between state-of-the-art model-based and satellite-based precipitation products over mainland China, J. Hydrol., 605, 127353, https://doi.org/10.1016/j.jhydrol.2021.127353, 2022.
Xu, R., Tian, F., Yang, L., Hu, H., Lu, H., and Hou, A.: Ground validation of GPM IMERG and trmm 3B42V7 rainfall products over Southern Tibetan plateau based on a high-density rain gauge network, J. Geophys. Res., 122, 910–924, https://doi.org/10.1002/2016JD025418, 2017.
Yang, K. and Jiang, Y.: A long-term (1979–2020) high-resolution (∘) precipitation dataset for the Third Polar region (TPHiPr), Natl. Tibet. Plateau Data Cent. [data set], https://doi.org/10.11888/Atmos.tpdc.272763, 2022.
Yang, S., Li, R., Wu, T., Hu, G., Xiao, Y., Du, Y., Zhu, X., Ni, J., Ma, J., Zhang, Y., Shi, J., and Qiao, Y.: Evaluation of reanalysis soil temperature and soil moisture products in permafrost regions on the Qinghai-Tibetan Plateau, Geoderma, 377, 114583, https://doi.org/10.1016/j.geoderma.2020.114583, 2020.
Yang, W., Yao, T., Zhu, M., and Wang, Y.: Comparison of the meteorology and surface energy fluxes of debris-free and debris-covered glaciers in the southeastern Tibetan Plateau, J. Glaciol., 63, 1090–1104, https://doi.org/10.1017/jog.2017.77, 2017.
Yang, W.: Conventional ice surface meteorological data for Parlung Glacier No. 4 and Debris-covered 24K Glacier in southeast Tibet from June to September (2016), Natl. Tibet. Plateau Data Cent. [data set], https://doi.org/10.11888/AtmosPhys.tpe.249475.db, 2018.
Yao, T., Bolch, T., Chen, D., Gao, J., Immerzeel, W., Piao, S., Su, F., Thompson, L., Wada, Y., Wang, L., Wang, T., Wu, G., Xu, B., Yang, W., Zhang, G., and Zhao, P.: The imbalance of the Asian water tower, Nat. Rev. Earth Environ., 3, 618–632, https://doi.org/10.1038/s43017-022-00299-4, 2022.
Yatagai, A., Kamiguchi, K., Arakawa, O., Hamada, A., Yasutomi, N., and Kitoh, A.: Aphrodite constructing a long-term daily gridded precipitation dataset for Asia based on a dense network of rain gauges, B. Am. Meteorol. Soc., 93, 1401–1415, https://doi.org/10.1175/BAMS-D-11-00122.1, 2012.
Ye, B., Yang, D., Ding, Y., Han, T., and Koike, T.: A bias-corrected precipitation climatology for China, J. Hydrometeorol., 62, 3–13, https://doi.org/10.1175/JHM-366.1, 2007.
You, Q., Fraedrich, K., Ren, G., Ye, B., Meng, X., and Kang, S.: Inconsistencies of precipitation in the eastern and central Tibetan Plateau between surface adjusted data and reanalysis, Theor. Appl. Climatol., 109, 485–496, https://doi.org/10.1007/s00704-012-0594-1, 2012.
Zhang, G.: Dataset of river basins map over the TP (2016), Natl. Tibet. Plateau Data Cent. [data set], https://doi.org/10.11888/BaseGeography.tpe.249465.file, 2019.
Zhang, L., Li, X., Zheng, D., Zhang, K., Ma, Q., Zhao, Y., and Ge, Y.: Merging multiple satellite-based precipitation products and gauge observations using a novel double machine learning approach, J. Hydrol., 594, 125969, https://doi.org/10.1016/j.jhydrol.2021.125969, 2021.
Zhang, Y.: Meteorological observation dataset of Shiquan River Source (2012–2015), Natl. Tibet. Plateau Data Cent. [data set], https://doi.org/10.11888/Meteoro.tpdc.270548, 2018.
Zhao, L.: Meteorological Datasets of Xidatan station (XDT) on the Tibetan Plateau in 2014–2018, Natl. Tibet. Plateau Data Cent. [data set], https://doi.org/10.11888/Meteoro.tpdc.270084, 2018.
Zhao, L., Wu, T., Xie, C., Li, R., Wu, X., Yao, J., Yue, G., and Xiao, Y.: Support Geoscience Research, Environmental Management, and Engineering Construction with Investigation and Monitoring on Permafrost in the Qinghai-Tibet Plateau, China, Bulletin of Chinese Academy of Sciences, 32, 1159–1168, https://doi.org/10.16418/j.issn.1000-3045.2017.10.015, 2017.
Zhou, X., Yang, K., Ouyang, L., Wang, Y., Jiang, Y., Li, X., Chen, D., and Prein, A.: Added value of kilometer-scale modeling over the third pole region: a CORDEX-CPTP pilot study, Clim. Dynam., https://doi.org/10.1007/s00382-021-05653-8, 2021.
Zhu, S., Ma, Z., Xu, J., He, K., Liu, H., Ji, Q., Tang, G., Hu, H., and Gao, H.: A Morphology-Based Adaptively Spatio-Temporal Merging Algorithm for Optimally Combining Multisource Gridded Precipitation Products with Various Resolutions, IEEE T. Geosci. Remote, 60, 4103221, https://doi.org/10.1109/TGRS.2021.3097336, 2022.