the Creative Commons Attribution 4.0 License.
the Creative Commons Attribution 4.0 License.
 | 08 Dec 2023
Lagoon hydrodynamics of pearl farming atolls: the case of Raroia, Takapoto, Apataki and Takaroa (French Polynesia)
Oriane Bruyère
Romain Le Gendre
Mathilde Chauveau
Bertrand Bourgeois
David Varillon
John Butscher
Thomas Trophime
Yann Follin
Jérôme Aucan
Vetea Liao
Between 2018 and 2022, four pearl farming Tuamotu atolls of French Polynesia were monitored with autonomous oceanographic instruments to measure the hydrodynamics of atoll lagoons and the ocean–lagoon water exchanges. These surveys were conducted within the framework of the ANR-funded MANA (Management of Atolls) project and its extensions to additional sites. The overarching goal was to improve knowledge on the processes influencing the spat collection of the pearl oyster Pinctada margaritifera, the oyster species used to produce black pearls. These data sets are also critical for the calibration and validation of 3D high spatial resolution hydrodynamic models used to study oyster larval dispersal within lagoons. The observational strategies focused on the characterization of ocean–lagoon exchanges through passes and hoa (i.e., shallow reef flats), lagoon circulation, incident waves breaking on the forereef, water elevation inside the lagoon as well as spatial temperature variability. Chronologically, the investigated atolls were first Raroia Atoll with 9 months of measurements between May 2018 and March 2019 during which the MALIS1 and MALIS2 cruises on-board the R/V ALIS took place. It was followed by a 4 month deployment in Takapoto Atoll (November 2021 to March 2022). In late April 2022, Apataki Atoll was instrumented until end of July, followed by Takaroa measurements between July and October 2022. Apataki (Leg2) and Takaroa Atoll were conjointly instrumented during the MALIS 3 oceanographic cruise. Altogether, those multi-atoll data bring a worldwide unique oceanographic atoll data set that is useful for addressing local pearl farming questions but potentially beneficial for other fundamental and applied investigations. Each data set was post-processed, quality controlled and converted into NetCDF format. Files are available in open source into dedicated repositories in the SEANOE marine data platform. Links (DOI) of individual data sets are provided in Table 2.
- Article
(9729 KB) - Full-text XML
- Companion paper
- BibTeX
- EndNote


This study focuses on hydrodynamic data collected between 2018 and 2022 on four pearl farming atolls of the Tuamotu Archipelago, in French Polynesia. French Polynesia (FP) is a French overseas collectivity located in the Central Pacific Ocean (134 to 155∘ W and 7 to 27∘ S). It consists of five archipelagos (Fig. 1b) and 118 atolls and high islands spread on a vast Exclusive Economic Zone (EEZ) with 4.8 million km2 (Andréfouët and Adjeroud, 2019). The Tuamotu and Gambier Archipelagoes include a total of 77 atolls and several high islands that are found in the lagoon of Gambier. Five of the atolls are actually with dry or uplifted lagoons. The other 72 atolls all have an intertidal or partly emerged rim surrounding the lagoon. Among the atolls with a deep (>20 m) lagoon, about 30 have been black pearl farming atolls since the beginning of this activity in the late 1980s. Currently, as of 2023, only 20 are active or operational.
Black pearl farming is the second source of income for French Polynesia after tourism. In 2021, it represented a EUR 40 million value in exports (Andréfouët et al., 2022b). This activity emerged as a major activity after nearly 60 years of trials and pioneering work. Since the 1980s and especially the 1990s, the number of exploitations has boomed, owing to the presence of abundant natural stocks of oysters Pinctada margaritifera. This stock has allowed to the spats to be efficiently collected in several lagoons, and a sustained supply of oysters for pearl production. The activity thus includes oyster production (through spat collection) and pearl production. In 2021, 8136 ha of lagoon concessions were dedicated to these activities (DRM, 2021). Four islands and atolls (Gambier, Marutea Sud, Ahe and Arutua) represent half of the concessions but many other atolls contribute to the activity (such as Apataki, Takapoto, Takaroa, Katiu, Kauehi and Raroia). However, there are ups and downs. For instance, Takaroa atoll lagoon suffered a major dystrophy event in 2014 (Rodier et al., 2019), resulting in mass mortality of oysters and spats. Since then, the activity has been moribund in this lagoon, and has not yet recovered as of 2023. Overall in French Polynesia, the numbers of farmers have decreased over the past few years and have now stabilized at around 600 farmers, with 340 of them producing pearls.
Since the first mortality events in Takapoto atoll in the 1980s, pearl farming lagoons have been the objects of numerous scientific investigations related to the biology and ecophysiology of P. margaritifera, the estimation of natural stocks, or the characterization of the planktonic trophic web and food sources for oysters, among many other topics (Le Pennec, 2010; Andréfouët et al., 2012b, 2022b; Gueguen et al., 2016). Lagoon hydrodynamics became a focus during the Programme General Recherche sur la Nacre 2 (PGRN2) in the late 1990s, using a comparative approach between atoll lagoons but with limited field measurements (Pagès and Andréfouët, 2001; Andréfouët al., 2001b), in the wake of the comparative TYPATOLL program (Dufour and Harmelin-Vivien, 1997).
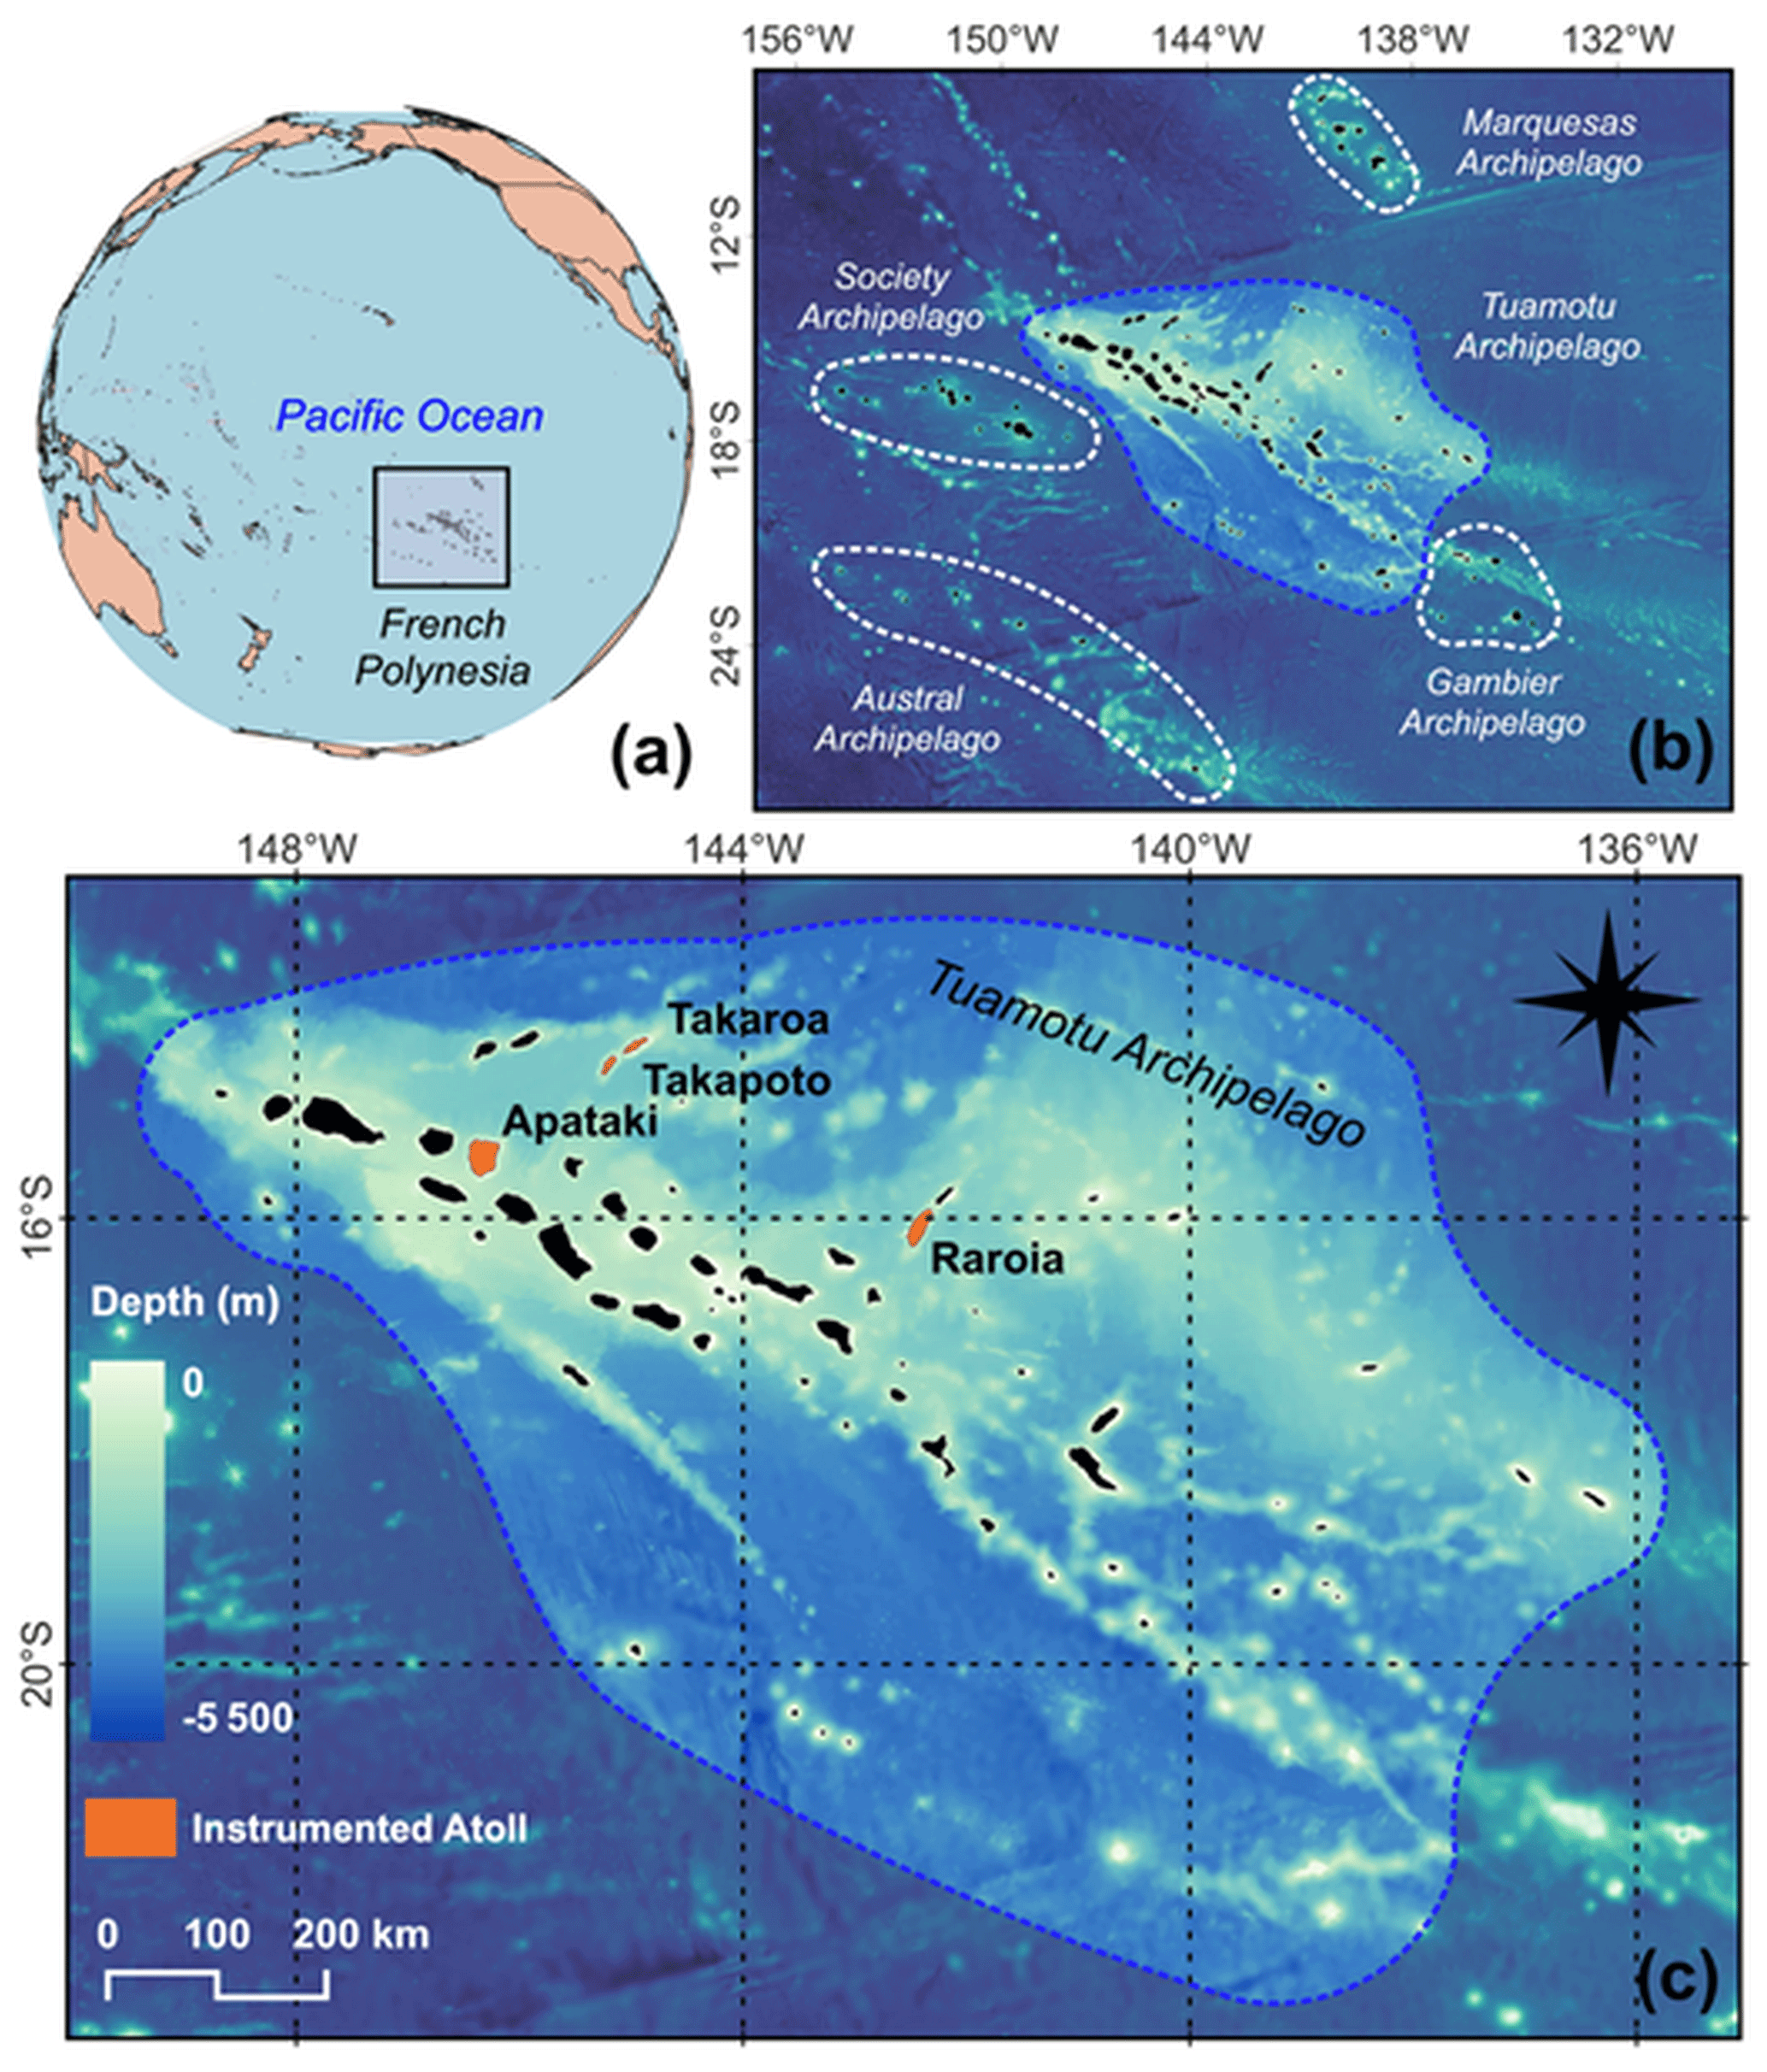
Figure 1Map of French Polynesia Archipelagos and GEBCO bathymetry (GEBCO Compilation Group, 2023). The instrumented atolls of Tuamotu Archipelago that are the focus of this study are colored in orange (Raroia, Takapoto, Apataki, Takaroa).
Following the first Tuamotu–Gambier Atoll hydrodynamic modeling work by Tartinville et al. (1997) that investigated Moruroa Atoll in the context of nuclear weapon tests consequences, a workshop in 2004 in Tahiti identified the main steps required to achieve 3D high spatial resolution numerical models to address pearl farming questions (Andréfouët et al., 2006). A high priority topic was to better understand spat collection variability, for which it was necessary to better characterize the P. margaritifera larval dispersal phase in spat collection lagoons exposed to different oceanographic and atmospheric forcings.
Ahe Atoll became the first atoll investigated for 3D hydrodynamical modeling, with for the first time a large array of in situ measurements (Dumas et al., 2012). Ahe Atoll had a 1 yr dedicated field program in 2008–2009 (see Le Gendre, 2020a, for sampling strategy), followed by a dedicated oceanographic POLYPERL cruise in 2013 (Andréfouët, 2013). Ahe was followed by Takaroa Atoll but only with a short field expedition in 2009 (see Le Gendre, 2020b, for sampling strategy). Results from Ahe Atoll model proved to be very useful in characterizing larval dispersal variability (Thomas et al., 2012, 2014, 2016).
To build on these first results, the ANR-funded MANA (Management of Atolls) project was launched in 2017 (Andréfouët et al., 2022b) and was completed in September 2022. The overarching goals of the project were to provide new spatially explicit products useful for the management of geomorphologically diverse pearl farming atolls (namely Ahe, Takaroa and Raroia in French Polynesia and Manihiki in the Cook Islands). Focus was still on understanding spat collection on different sites, but also providing guidelines for stock management and restocking (André et al., 2022; Violette et al., 2023). Funds and instruments provided by the local Direction des Ressources Marines (DRM) in charge of the management of pearl farming lagoons expanded the MANA project to two new sites (Gambier Islands and Takapoto Atoll). Finally, the Commission Nationale de la Flotte Côtiere also supported the project with ship time (R/V ALIS) for two cruises in Raroia Atoll in 2018 (Andréfouët, 2018) and one cruise targeting in particular the Apataki and Takaroa Atolls in 2022 (Andréfouët and Le Gendre, 2022).
This paper reports on the in situ data collected within the framework of the MANA project and its derivatives on Raroia Takapoto, Takaroa and Apataki atolls between 2018 and 2022 (Fig. 1c). It is organized as follows: Sect. 2 briefly presents the French Polynesia climate to draw the regional context, and the general sampling strategy applied to atolls during the MANA project considering the typical geomorphology of atolls and their lagoons and the hydrodynamic processes at stake. Then, the sampling strategy specific to the different study sites is developed in Sect. 3. Oceanographic instruments used during all surveys are detailed in Sect. 4 and data processing specificities are provided in Sect. 5. Examples of results are provided in Sect. 6. Section 7 finally informs on data availability followed by Sect. 8, which concludes this paper.
2.1 French Polynesia climate
Owing to the large latitudinal and longitudinal variations, there are local weather differences between French Polynesia archipelagoes, but overall, the French Polynesia climate has two seasons (Laurent and Maamaatuaiahutapu, 2019). The wet and warm season ranges from November to April (Austral summer) with weak trade winds (northeast to southeast) and moderate waves including distant swells originating in the Northern Hemisphere. Then, a cooler and dryer season occurs from May to October (Austral winter), with stronger trade winds and high-energy distant swells from the Southern Hemisphere. The weather is influenced by the proximity of the South Pacific Convergence Zone (SPCZ) leading to higher rainfalls during December to March, albeit with significant spatial and interannual variations between archipelagoes (Laurent and Maamaatuaiahutapu, 2019).
The interannual El Niño-Southern Oscillation (ENSO) affects the French Polynesian climate and particularly precipitations and trade wind regimes. ENSO influences the position of the SPCZ, which leads to increased precipitations, higher occurrences of tropical cyclones and changes in wind regimes during the El Niño phase (Laurent and Varney, 2014). Conversely, the La Niña phase exacerbates the main features of the neutral years, with lower precipitation and drought, especially in the north (Marquesas Archipelago), and lower east to southeast trade winds overall.
The wind and wave regimes of French Polynesia with a focus on pearl farming sites was recently revisited at different temporal scales (Dutheil et al., 2020, 2021). The wave regime is much more spatially variable and atoll-dependent than the wind regime considering the shadowing effects on the propagation of wave trains created by the position of atolls relative to each other (Andréfouët et al., 2012a, 2022b).
2.2 Atoll geomorphology and hydrodynamic process: the clues for the MANA project field data collection strategy
During the MANA project and its extensions, a total of four atolls (Raroia, Takapoto, Apataki and Takaroa, Fig. 2, Table 1) have been instrumented with physical instruments to better understand the processes influencing Pinctada margaritifera spat collection variability. Instruments were also needed for the calibration and validation of 3D high spatial resolution hydrodynamical models and to improve the realism of existing models. The deployments took place between 2018 and 2022, with an interruption due to the COVID pandemic (Fig. 3). We describe in this section the general features encountered on all atolls and the principles used for the sampling strategy to capture the main hydrodynamic processes. Section 3 provides the sampling specifics per atoll.
High-resolution bathymetry data were collected by private sub-contractors using mono-beam (Takaroa Atoll) or multibeam (Takapoto, Raroia atolls) sounders (Andréfouët et al., 2020). Soundings were resampled and interpolated to achieve a 10 m resolution bathymetric grid for Raroia and Takapoto and a 60 m resolution grid for Takaroa Atoll, prior to the development of hydrodynamic models. Conversely, the Apataki lagoon has not been entirely mapped yet as of 2023.
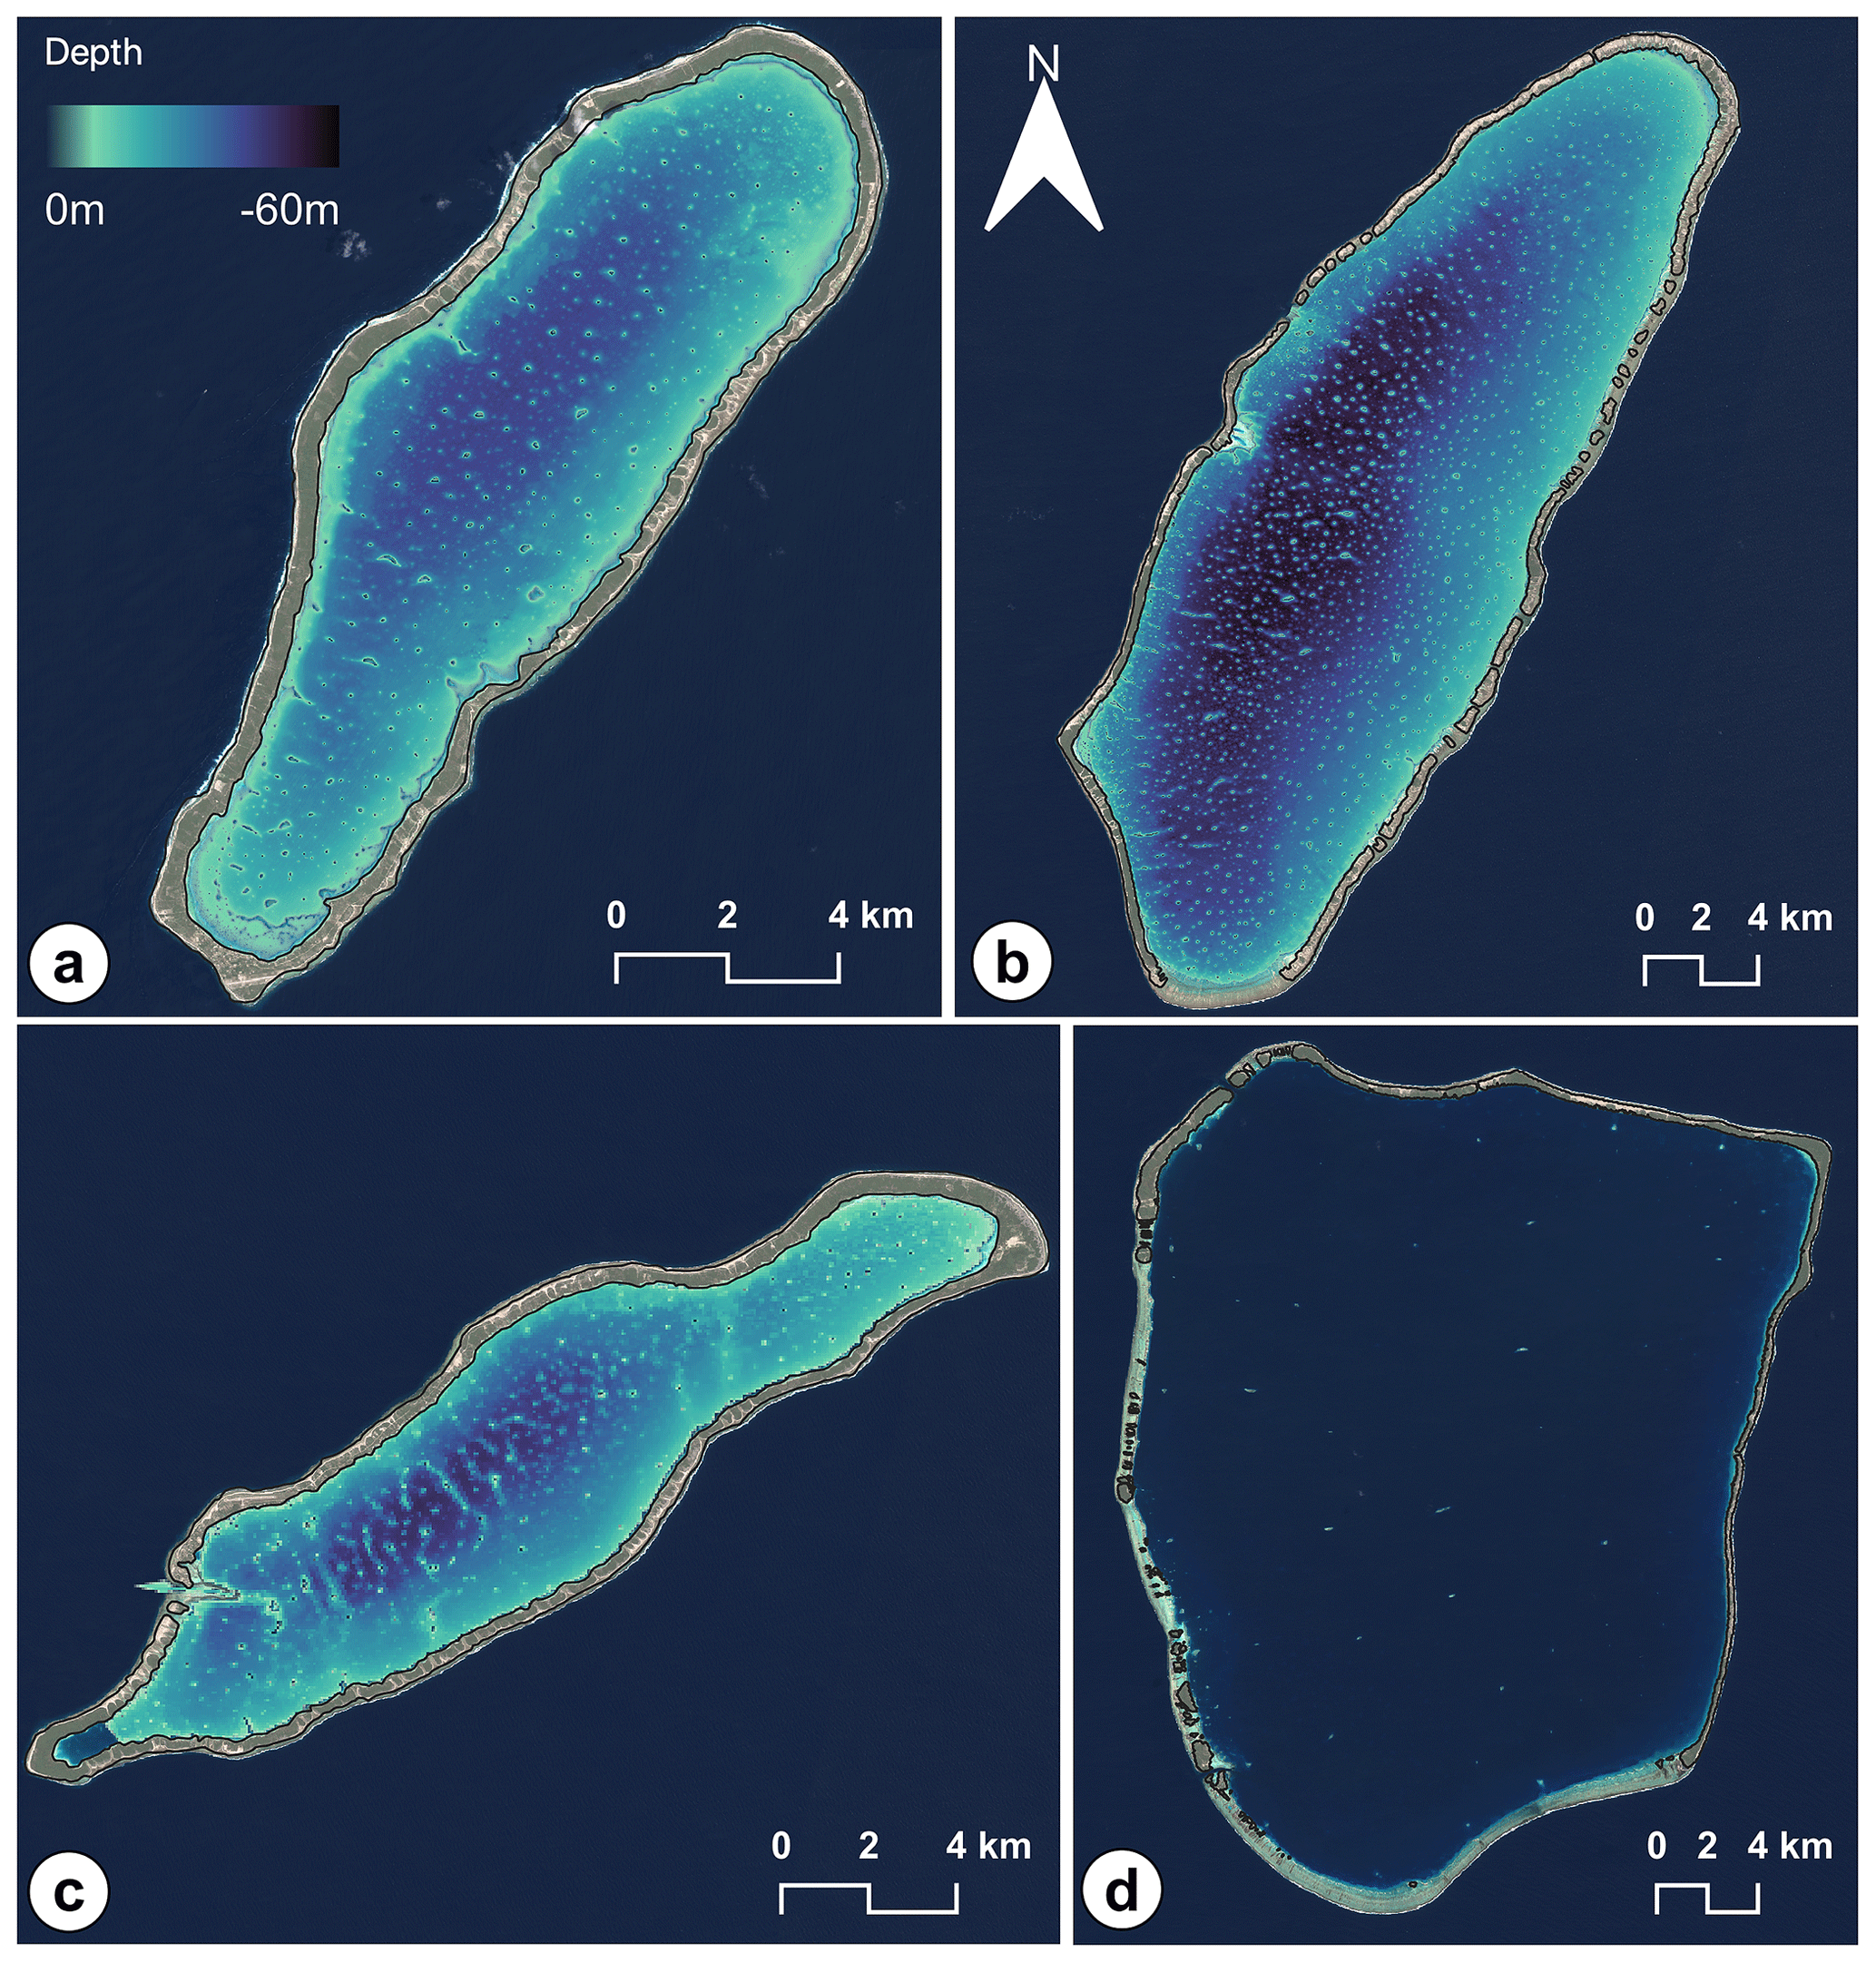
Figure 2Bathymetry (described in Andréfouët et al., 2020) and motu contours for (a) Takapoto Atoll, (b) Raroia Atoll, (c) Takaroa Atoll. Depth color-scale is identical for the three atolls. For Apataki Atoll (d), there are no complete lagoon bathymetry data available yet. Background satellite images are from Sentinel 2 (Copernicus Sentinel 2, 2021).
Table 1Additional information about instrumented atolls (from Andréfouët et al., 2020).
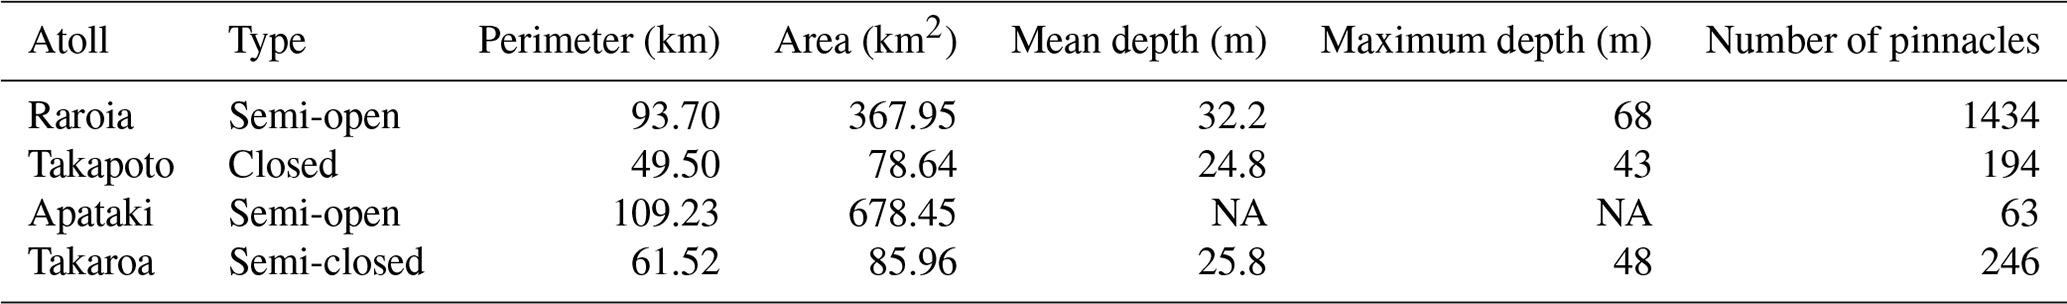
NA: not available
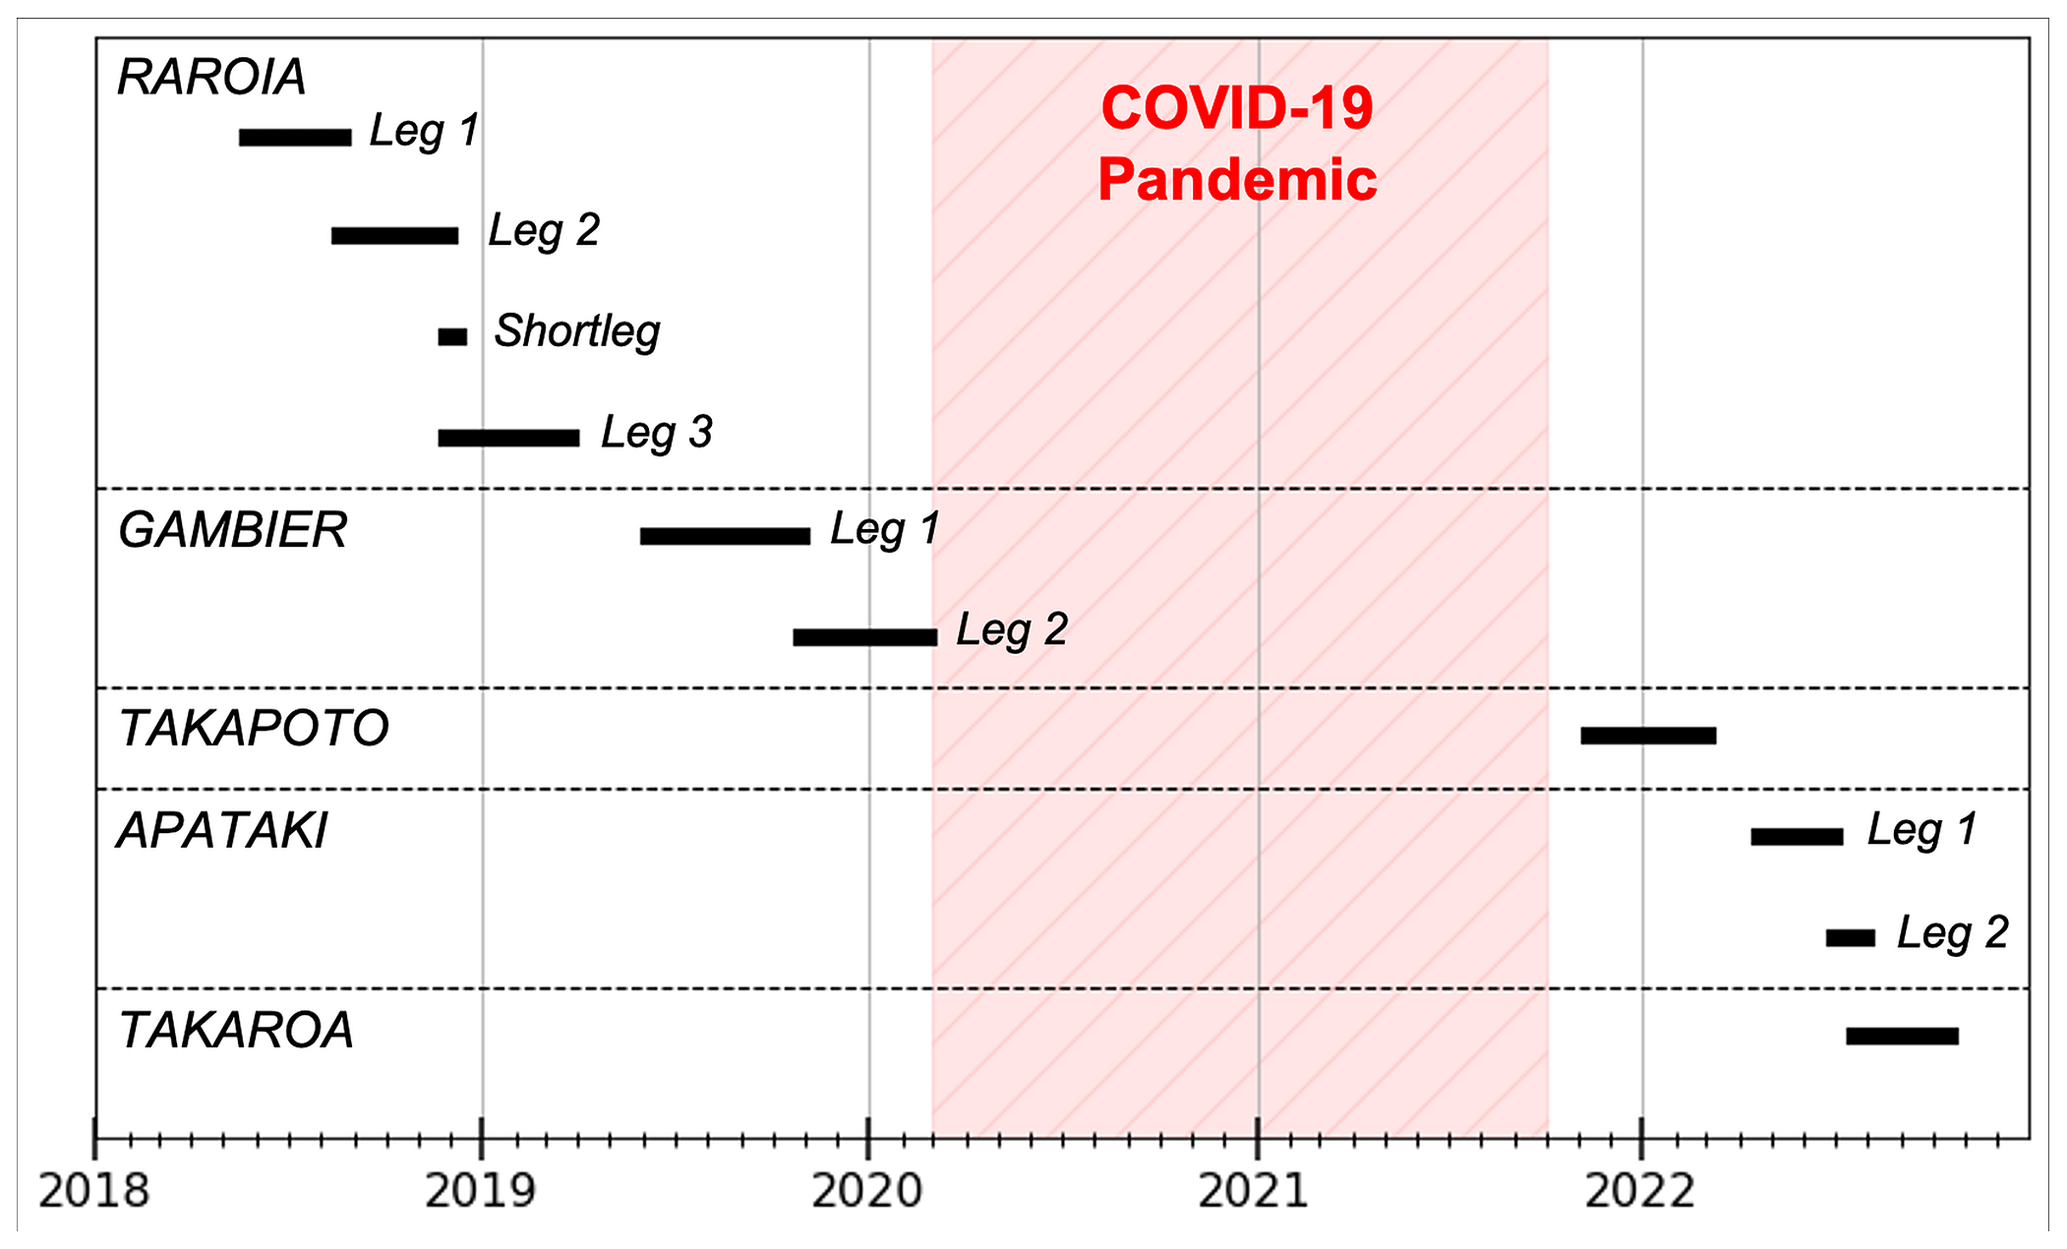
Figure 3MANA project deployments between May 2018 and November 2022. Gambier Islands are another site studied from mid-2019 to February 2020. It is a group of high islands and data are presented elsewhere (Bruyère et al., 2023d) because the sampling strategy obeys different criteria than atolls.
Extrinsic factors (such as the wind or wave regimes) and intrinsic factors (such as the degree of aperture) are both strong drivers of hydrobiogeochemical functioning in atoll lagoons (Dufour et al., 2001; Andréfouët al., 2001b). They both need to be taken into account when sampling atoll lagoons for their hydrodynamics, as explained hereafter in generic terms.
Wind and wave influence the lagoon renewal and its circulation. On an archipelago scale, the swell climate of any given atoll is highly dependent on its position relative to other atolls that can block the incoming swells (Andréfouët et al., 2012a). For instance, the large Tuamotu atolls in the south of the archipelago (Rangiroa, Fakarava, Kaukura, etc.) block all incoming southern swells. It is therefore necessary to measure incoming waves with pressure sensors on, if possible, all the sectors of exposition of the studied atoll. Regional wave models are also useful to assess the conditions during a survey, and Wave Watch III model data have been used at high spatial resolution in some cases (Andréfouët et al., 2012a; Dutheil et al., 2021; Andréfouët et al., 2022a, 2023b). Wind data are generally not monitored during shore-based field campaigns, as we relied on either the nearby Météo-France weather station if possible (e.g., Takaroa Atoll, Gambier Islands, data available through https://publitheque.meteo.fr, last access: 20 May 2023) or ERA5 reanalysis data (Hersbach et al., 2020). When on board the R/V ALIS, the ship weather station also records wind data.
Although all atolls can be different in terms of lagoon bathymetry (Andréfouët al., 2020), size, and exposure to wind and waves, all atolls share common geomorphological features that play a role in the lagoon hydrodynamics. Atoll landforms siting on the atoll rims are reef islands (locally named motu). They result from the accumulation of carbonate sediments above antecedent (Holocene) conglomerate platforms (Montaggioni et al., 2021). Rims can be vegetated or not (Andréfouët et al., 2001a). Atoll rims can have 0, 1, 2 or 3 (at maximum) deep passages (or pass) and a number (from a handful to several hundreds) of shallow spillways (locally named hoa) along the atoll rim that connect the ocean to the lagoon.
In generic terms, water movements from the ocean to the lagoon through the pass and shallow hoa are controlled by tide and waves. Note first that the tidal range in this region of the world is low (10 to 50 cm maximum in the ocean from west Tuamotu to Gambier Archipelago) owing to the presence of an amphidromic point west of Tuamotu (Dumas et al., 2012; Laurent and Maamaatuaiahutapu, 2019). All the sites treated here are thus in a micro-tidal environment. Incoming waves breaking on the atoll crest directly modulate the flows through the wave-exposed open spillways (Tartinville et al., 1997; Dumas et al., 2012; Aucan et al., 2021; Andréfouët al., 2022a). The number and width of hoa are used to define the degree of aperture of an atoll, as a coarse proxy useful to characterize the water exchanges between ocean and lagoon and some biogeochemical variables (Dufour et al., 2001).
The degree of aperture of the atoll also influences the lag between oceanic and lagoonal tides. Even atolls with wide deep passes experience a few hours' shift in tidal lagoon signal compared with the ocean. They are also subjected to a lagoon tidal amplitude lower than in the ocean (Dumas et al., 2012; Aucan et al., 2021). These differences are also a factor that complicates the establishment of a common water level baseline between the lagoon and the ocean (Callaghan et al., 2006). It is a problem specific to atolls with passes (Aucan et al., 2021). Without the availability of appropriate differential sensors (see the Sensor section hereafter), the water level baseline is therefore established around the average sea level measured in the lagoon or ocean (Aucan et al., 2021).
In the lagoon, even if current speeds are typically low (Dumas et al., 2012), internal circulation cells occur, that are highly dynamic and predominantly controlled by wind speed and direction, as shown for instance for Ahe (Dumas et al., 2012) or Mururoa Atolls (Tartinville et al., 1997). A large lagoon is potentially much more complex in term of numbers and dynamics of these hydrodynamic cells than the smaller atolls. If there is a pass, its influence can generate locally strong currents; but it is nevertheless spatially limited owing to the alternate incoming–outgoing tide-driven currents (Dumas et al., 2012).
Temperature in the lagoon influences oyster development, survival at the larval and adult stages, and the final pearl quality, plus other indirect factors such as plankton availability (Thomas et al., 2010; Le Moullac et al., 2016; Latchere et al., 2018; Sangare et al., 2020). Temperature is monitored according to an array of temperature-measuring sensors deployed in the ocean, passes, hoa and lagoon. In the lagoon, a systematic spatial coverage is sought as well as a 3D coverage by deploying sensors vertically at the sub-surface (approximately 2 m), and at a depth of 10 m and finally 40 m. This information is also useful to assess lagoon stratification during low wind periods.
The MANA observational strategy objectives integrate all the aforementioned processes. In situ instruments were thus deployed to capture:
-
Sea level variations, tidal dynamics and surge (ocean, lagoon), using pressure sensors
-
Incoming incident waves on the different atoll sectors and wave (wind-induced) in the lagoon, using pressure sensors
-
Currents in hoa on different atoll sectors, using current meters or current profilers moored in hoa facing the pressure sensors that measure the incident waves
-
Currents in passes and inside the lagoon using current profilers
-
Water temperature variations in the ocean and the lagoon in different rim and lagoon sectors, using a variety of temperature-recording sensors (temperature-only, pressure or current-meter sensors)
This paper presents data collected between 2018 and 2022 in four Tuamotu Archipelago atolls, chronologically Raroia, Takapoto, Apataki and Takaroa Atolls. The following sections (Sect. 3.1, 3.2, 3.3 and 3.4) present each atoll and the implemented observational strategy. The length of data acquisition ranged between 3 and 9 months. Raroia and Apataki deployments were organized in legs to achieve long deployment duration while allowing regular instrument maintenance (e.g., battery replacing, bio-fouling, offloaded data, checking of the mooring component). The beginning or end of a leg is thus generally synonymous with a short data collection interruption for maintenance. Long deployments were a combination of shore-based and research vessel-based work. Atolls were equipped with five different types of instruments, namely Acoustic Doppler Current Profilers (ADCPs), current profilers, drag-tilt current meters, temperature and pressure loggers, and temperature sensors. Instrument configurations and specificities are presented hereafter in a dedicated section (Sect. 4).
3.1 Raroia Atoll
Raroia is a large atoll (area 368 km2) in the central Tuamotu region (Andréfouët et al., 2020). The atoll is oriented along the NE-SW direction (Fig. 2) and exposed to the east trade winds. The eastern reef rim is open to the ocean with numerous hoa and motu. The western side has one deep and wide (500 m) pass (Garue pass) as well as a few shallow hoa. The southern portion has a wide uninterrupted 5 km-long hoa. The northwest and north sides are closed by a vegetated rim.
The lagoon is deep with an average depth of 32 m. It has a typical saucer-shaped geomorphology but with the presence of a very high number of pinnacles (>1600) rising from the floor and distributed homogenously throughout the lagoon (Table 1).
Raroia was the subject of the most complex and intensive deployment. The 9 month physical observations started in the middle of May 2018 and ended in late March 2019. The deployments were organized in three legs (between May and August 2018, August and December 2018 and between January and March 2019 respectively) as well as one extra “short leg” conducted during the MALIS2 cruise with a specific setting and deployment (Fig. 2). Surveys were in part conducted during the oceanographic campaigns MALIS 1 and MALIS 2 with the R/V ALIS (Andréfouët, 2018; Aucan et al., 2021).
The sampling strategy is summarized in Fig. 4. The instruments moored in the lagoon, hoa, pass and oceanic sides of the atoll were either moored at the same location during the entire three legs, or their deployment was leg dependent (see Table A1 in Appendix A). Three stations were positioned on the external reef slopes on the north-east (O2), south (O3), and north-west (O1) atoll side to measure offshore incident waves with pressure sensors. These oceanic sensors were systematically paired with current meter (profilers or drag-tilt current meters) moored inside hoa directly facing the oceanic sensor's location. Water levels inside the lagoon were recorded at five stations (L4, L5, L6, L7, L8) to deduce surge and tide signal using pressure sensors. Those lagoonal pressure loggers were systematically associated with two temperature sensors moored on the sub-surface and at a depth of around 20 m. These three-sensor stations were replicated spatially to characterize the within-lagoon spatial heterogeneity. Current profilers were anchored inside three hoa (western, eastern and southern) that faced the oceanic pressure sensors. Inside the Garue Pass deep current profilers were moored to evaluate water fluxes lagoonward and oceanward as well as at the edge of the pass lagoonward to study the pass gyre (Pass2). Finally, two additional loggers were positioned in the south lagoon to measure lagoon currents in the spat collection area (L7 and L8). During the short leg, these two lagoon profilers were moved to the north lagoon, close to H1 and H2. Table A1 refers to the exact period and location of mooring for each sensor.
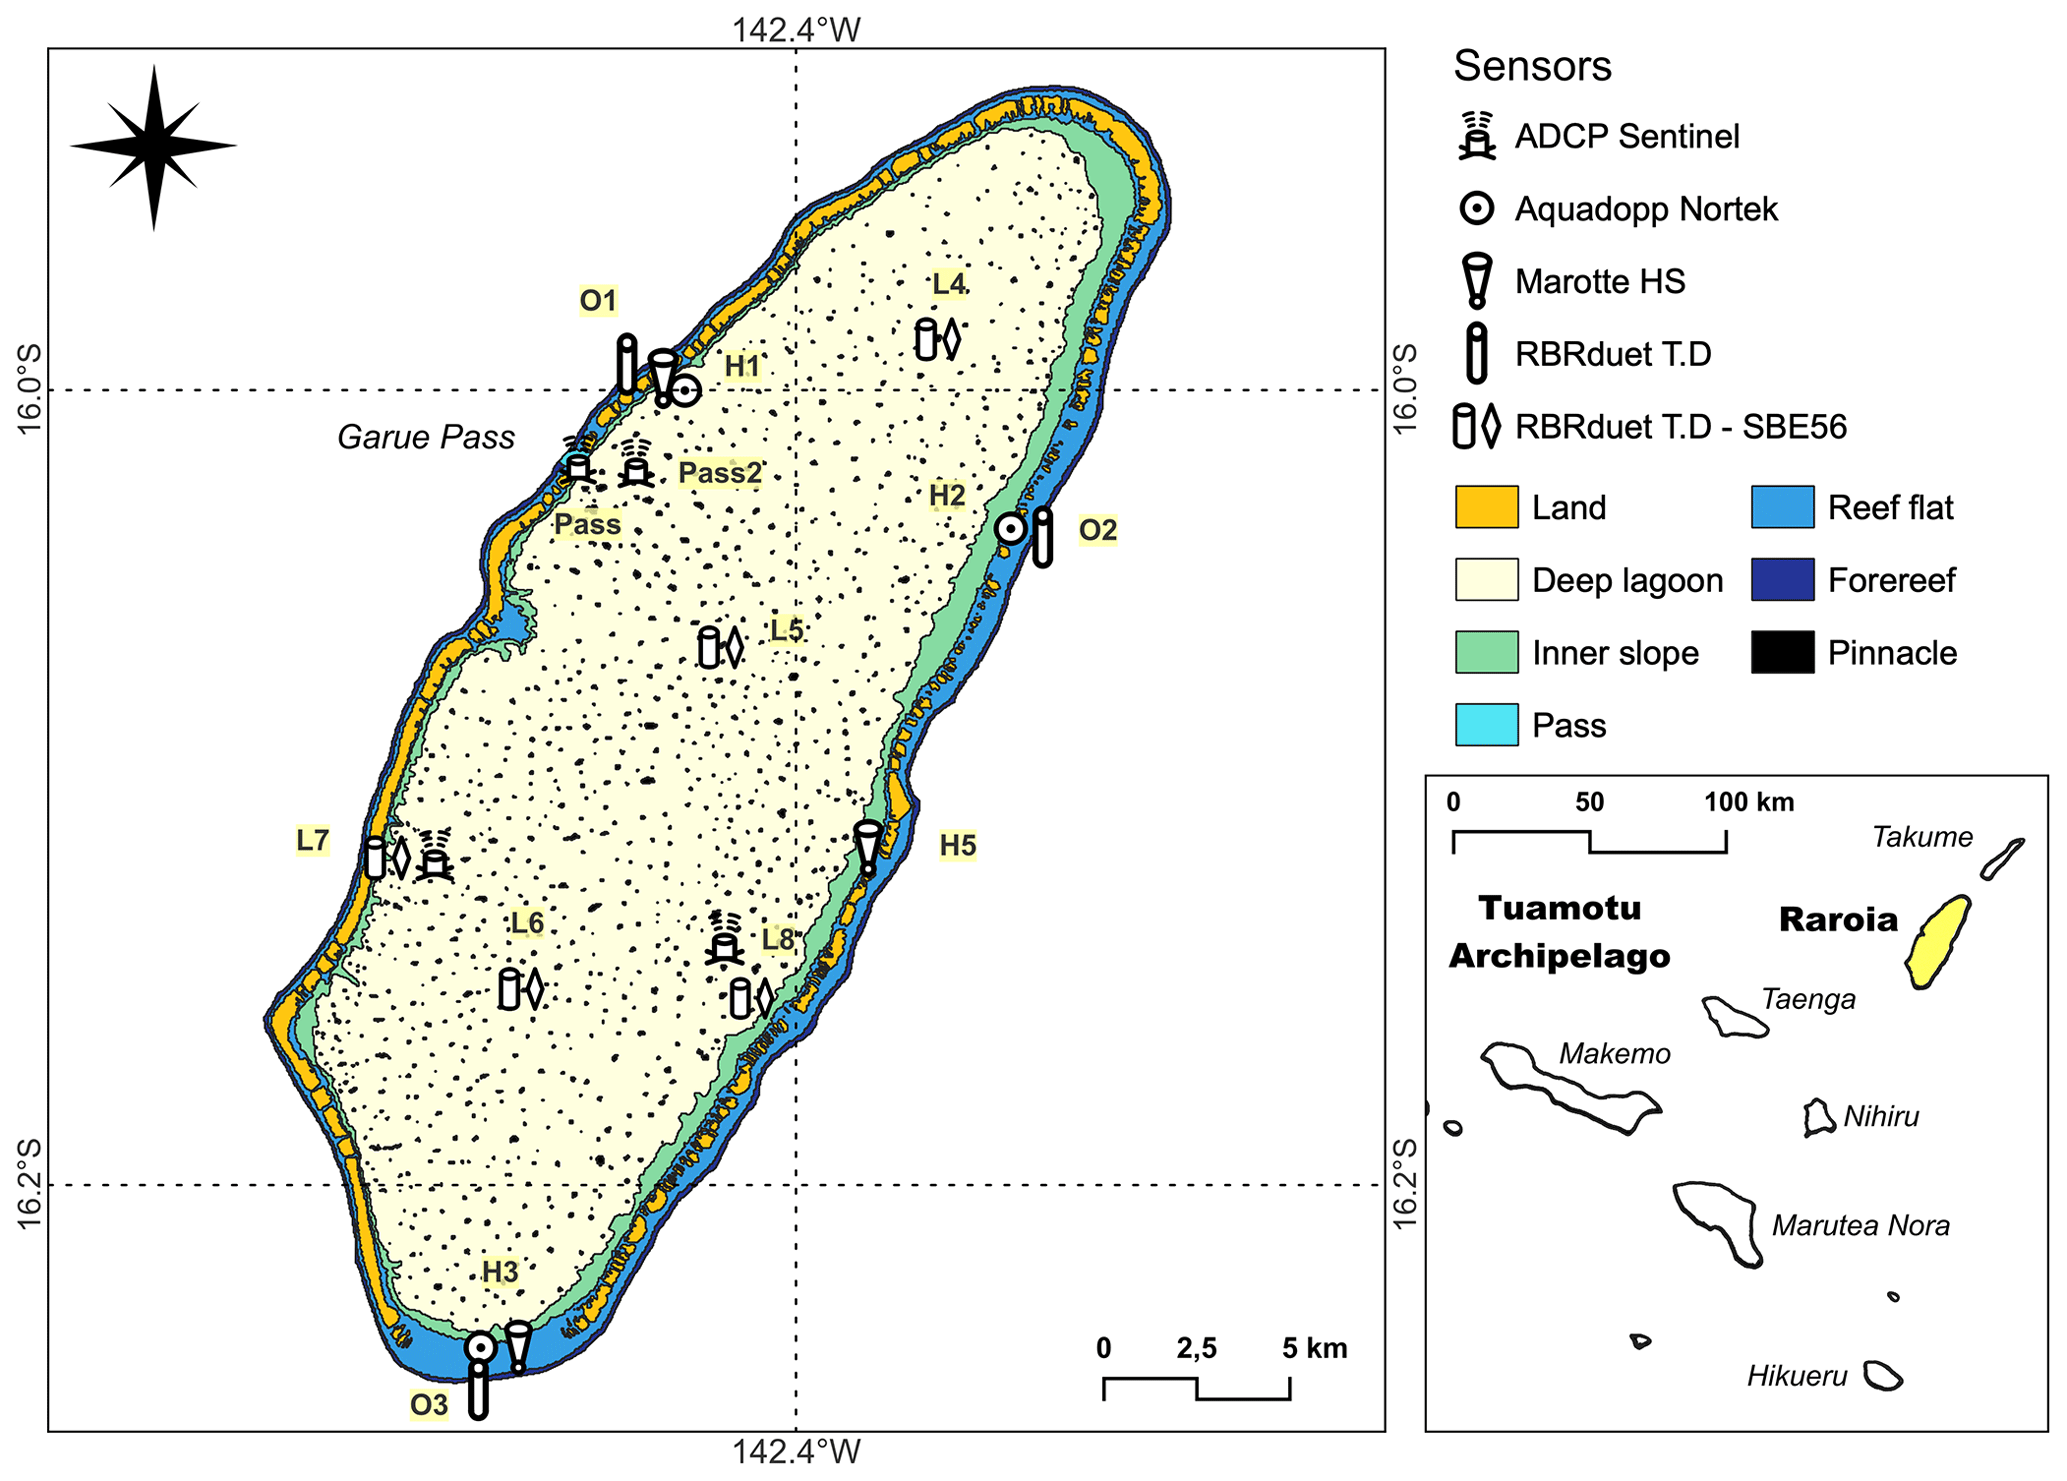
Figure 4Observational strategy applied during Raroia experiments. ADCP: Acoustic Doppler Current Profiler. Inner slope category is defined at an approximate depth between 0 and 15 m. Background map from the Millennium Coral Reef Mapping Project (Andréfouët and Bionaz, 2021). O: oceanic stations. H: hoa station. L: Lagoon stations (see Table A1 for details of each station).
3.2 Takapoto Atoll
Takapoto is a medium-sized 78 km2 northwestern Tuamotu atoll. This atoll is distinct from the other studied atolls owing to the absence of deep passes connecting the lagoon to the open ocean. It is the most closed of all the study sites with only few several narrow hoa present on both the west and east flanks of the atoll (Andréfouët et al., 2022a). The maximal and average lagoon depth are respectively 43 and 25 m (Table 1). Pinnacles can be found everywhere in the lagoon but their density is higher on the south-west region (Andréfouët et al., 2020).
This atoll was monitored over a 4 month period (November 2021 to March 2022). Measurements focused on the entry of oceanic water via the few active hoa present in two regions, namely Teavatika (southest region) and Takaï (northwest region) (Fig. 5). Two stations with paired Aquadopp (in the deeper part of hoa) and RBRduet T.D (ocean side) were set in Teavatika (station O01 and Aqua2) and Takaï (station O03 and Aqua1) areas in order to measure breaking wave parameters and current velocity related to waves and tides. Inside the lagoon, two additional stations in the middle and south lagoon were instrumented with one RBRduet T.D and two SBE56 (one in sub-surface and one below 30 m) following the strategy applied for Raroia (see Sect. 3.1).
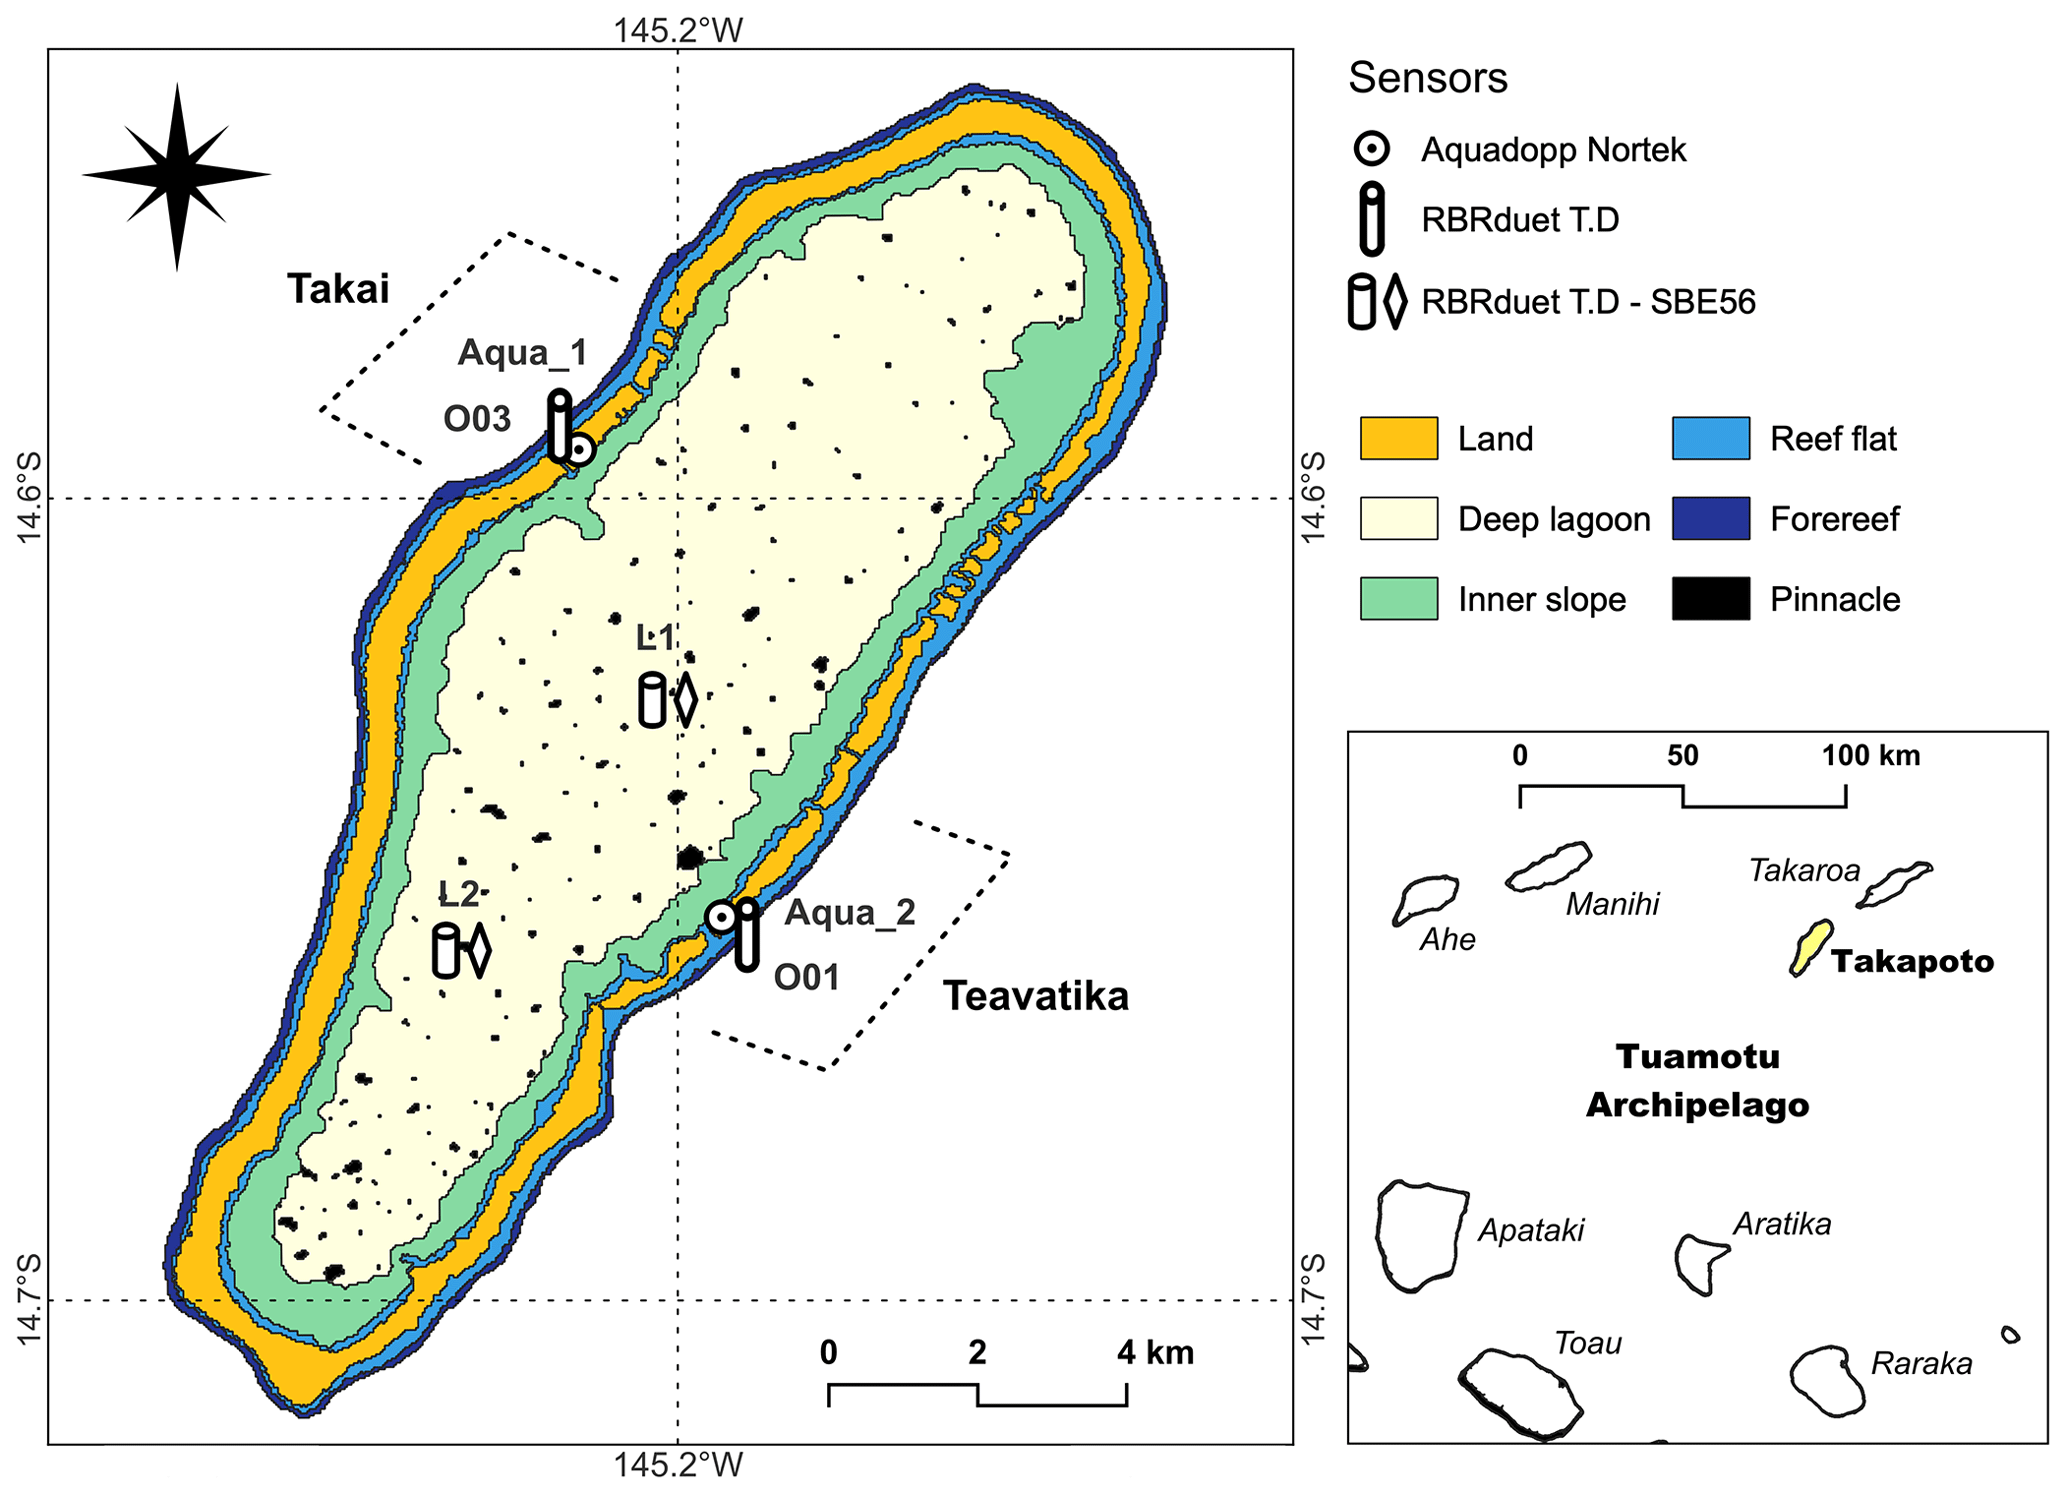
Figure 5Location of deployed instruments in Takapoto Atoll. Inner slope category is defined at an approximate depth of between 0 and 15 m. Background map from the Millennium Coral Reef Mapping Project (Andréfouët and Bionaz, 2021). O: oceanic stations. Aqua: hoa station. L: Lagoon stations (see Table A1 for details of each station).
3.3 Apataki Atoll
Apataki Atoll is a Western Tuamotu atoll and is the largest instrumented atoll (678 km2) of the MANA project, representing eight times the area of Takapoto Atoll (Table 1). The atoll rim is almost completely closed on the east and north sides. The southern region is an 18 km-long, wide open reef flat highly subjected to oceanic entries caused by distant swells (south-south-east are the dominant swell directions). Finally, the western rim is dominated by a succession of wide reef flats, narrow hoa and motu. Two deep passes both located on the west side and respectively named (Pakaka in the south and Tehere in the north) allow the oceanic and lagoonal systems to connect. As previously said, complete bathymetric coverage is not yet available for the lagoon and instrumented stations were selected and positioned using satellite imagery. Pinnacles visible on satellite images are few (63, see Table 1) and spread over the entire lagoon.
The resulting data set covers a 4 month period separated into two legs: Leg 1 (April 2022 to July 2022) and Leg 2 (July 2022). Leg 2 measurements were managed during the MALIS 3 oceanographic cruise with the R/V ALIS (Andréfouët and Le Gendre, 2022). Lagoonal stations (L1, L2, L3, L6) with one RBRduet T.D and two SBE56 sensors follow the same strategy applied to Raroia and Takapoto (Fig. 6). Pressure sensors moored on the oceanic forereef were positioned on the south (O1–O2) and east sides (O3) to face hoa. The facing southern hoa were instrumented with two current profilers (O1 paired with Aqua2 and O2 with Aqua1) in order to record oceanic fluxes crossing the reef. Deep current profilers (P01, P02 and P03) were anchored inside or under the influence of the passes to evaluate current intensity and direction (Fig. 6).
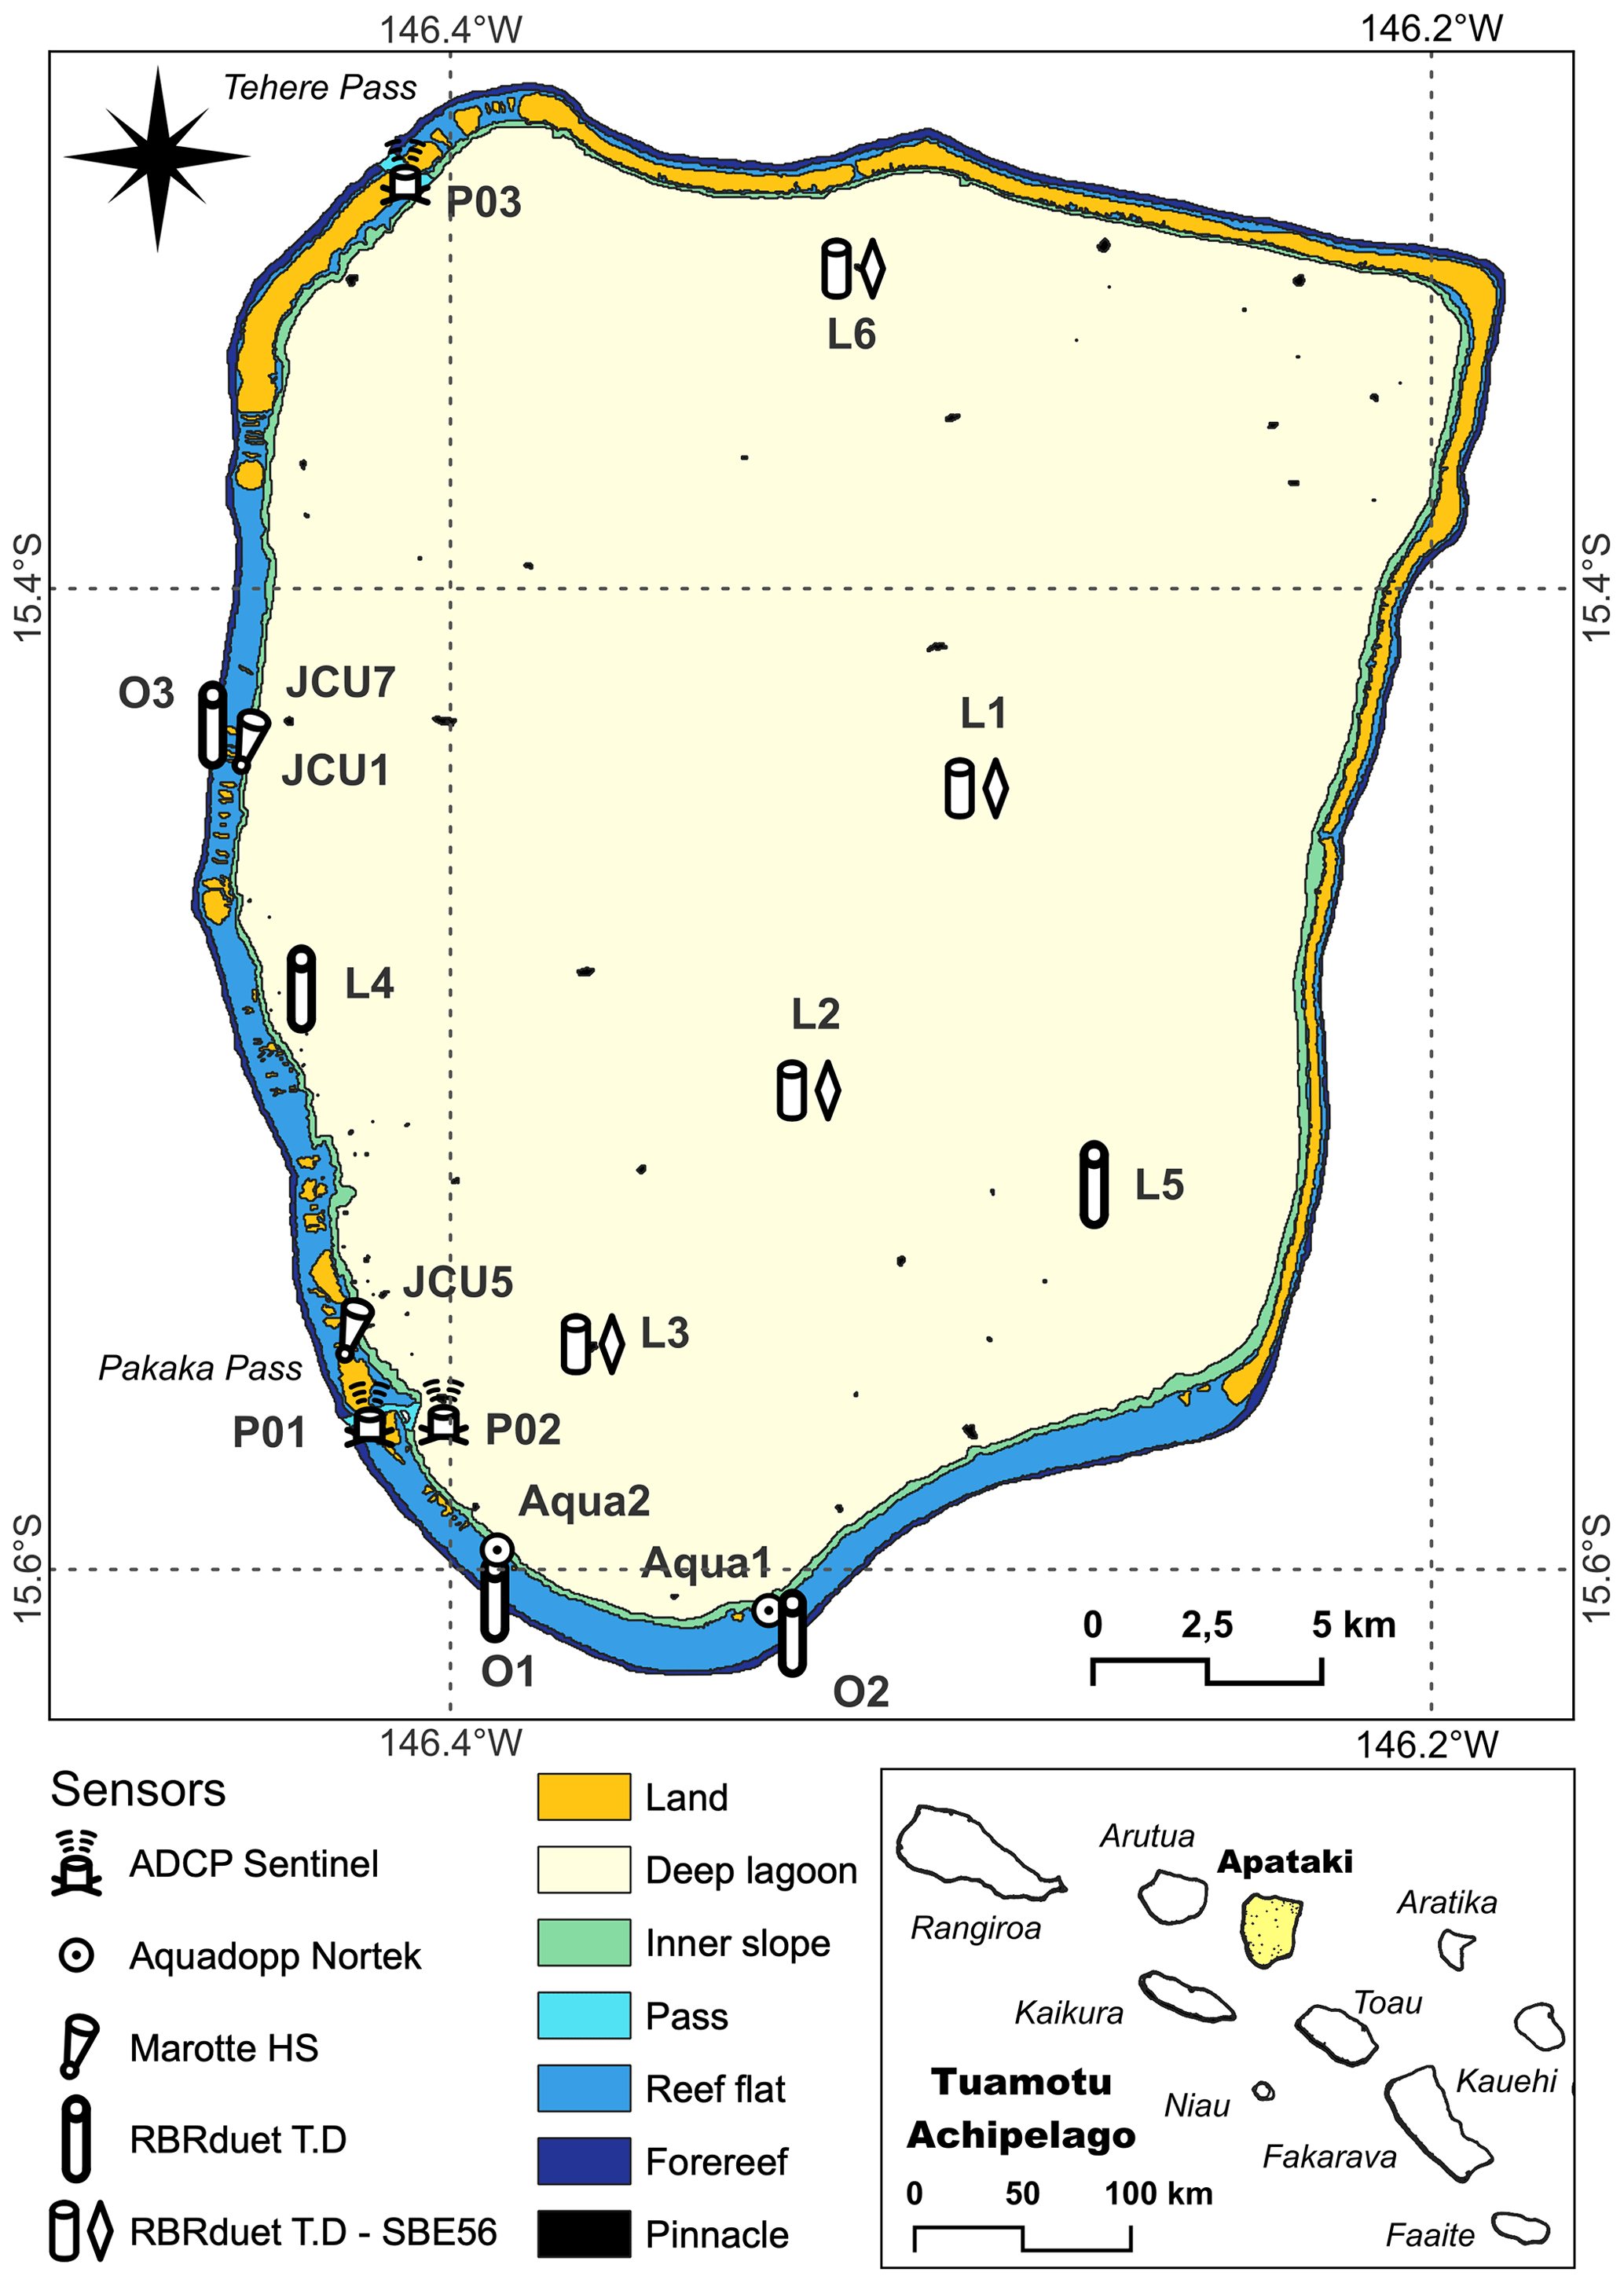
Figure 6Sampling strategy adopted during Apataki surveys in 2022. ADCP: Acoustic Doppler Current Profiler. Inner slope category is defined at an approximate depth of between 0 and 15 m. Background map from the Millennium Coral Reef Mapping Project (Andréfouët and Bionaz, 2021). O: oceanic stations. Aqua and JCU: hoa station. L: Lagoon stations. P: Pass stations (see Table A1 for details of each station).
3.4 Takaroa Atoll
Takaroa Atoll is located 10 km eastward from Takapoto Atoll (Sect. 3.3) in the Northwestern Tuamotu region (14.27∘ S–145∘ W). Its 86 km2 lagoon is characterized by a semi-closed continuous rim with small hoa on the southern region, and by a narrow deep pass (Teaunonae Pass) reaching a length of 170 m long and a depth of 20 m (Fig. 7). The lagoon has an average depth of 26 m and a maximum depth of 47 m (Table 1). Pinnacles are abundant in the central deep lagoon area (Fig. 7). This atoll was previously studied in 2009 (see Le Gendre, 2020b, for sampling strategy), but the data collected were limited. During the MALIS 3 cruise in July–August 2022 (Andréfouët and Le Gendre, 2022), the pass was instrumented to get additional measurement (3 months) of current velocity and direction using one current profiler sensor moored at a depth of 18 m.
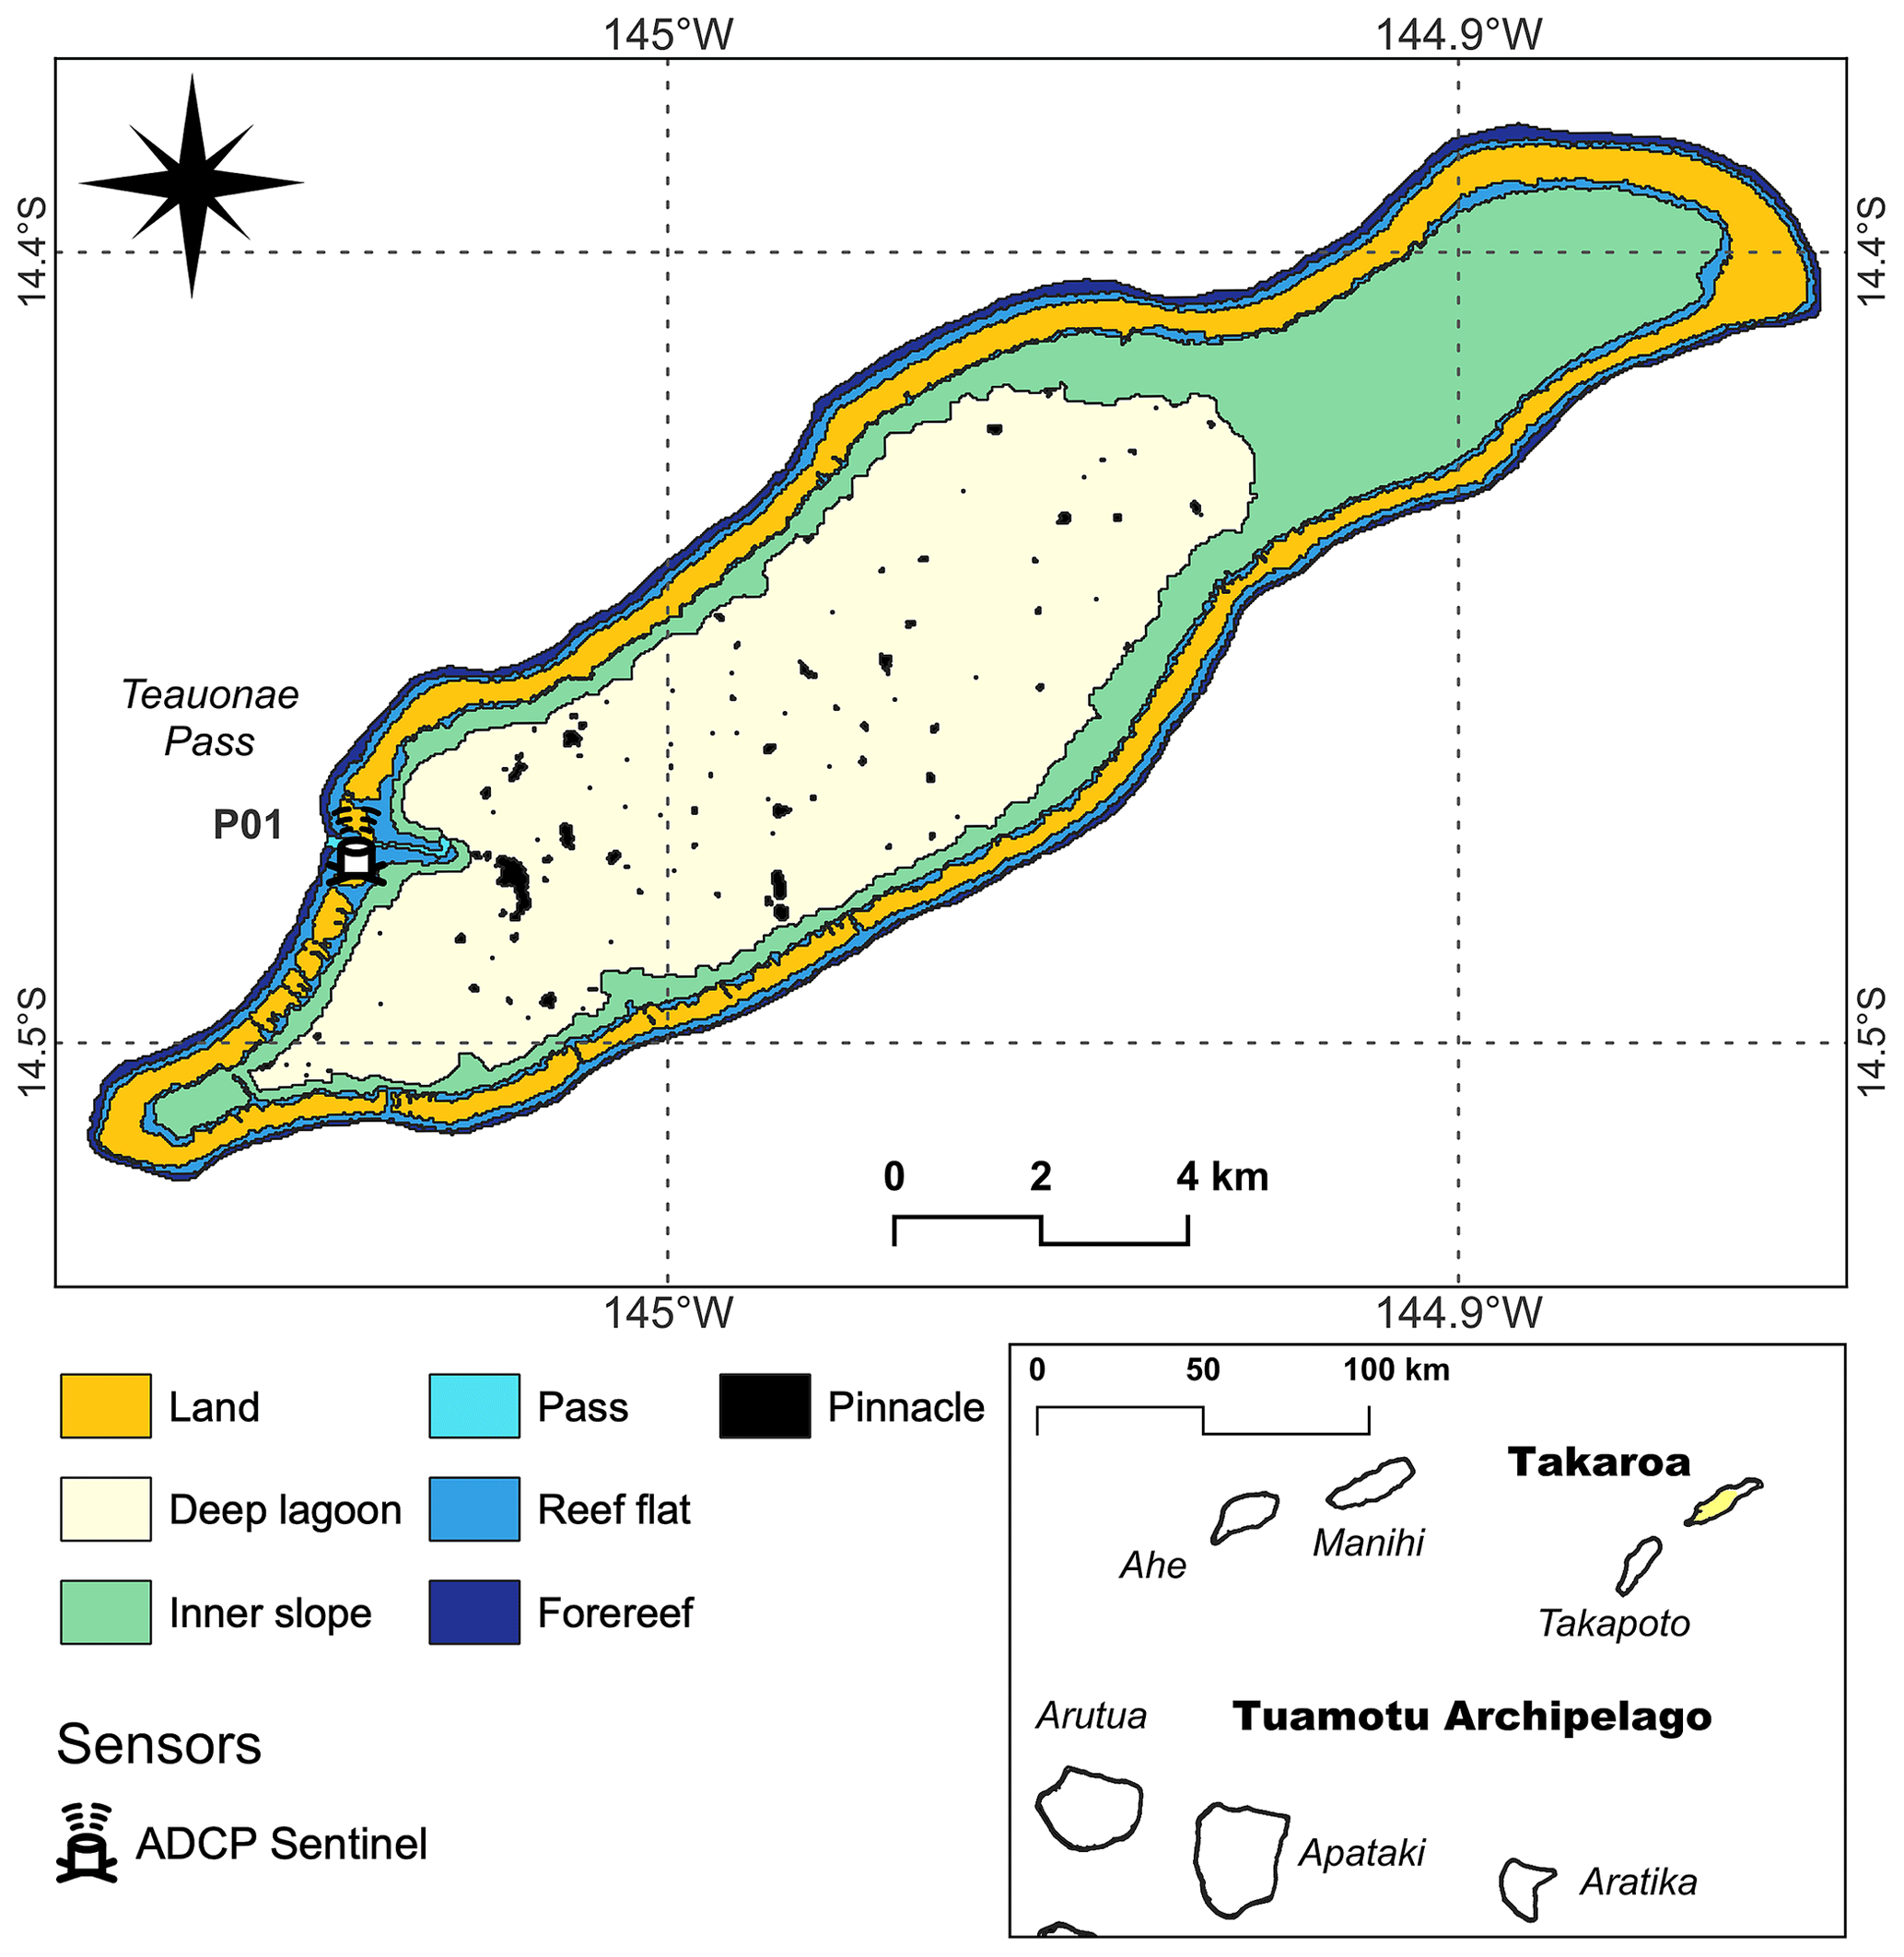
Figure 7Position of the single station P01 in Takaroa Atoll during the MALIS 3 cruise. ADCP: Acoustic Doppler Current Profiler. Inner slope category is defined at an approximate depth of between 0 and 15 m. Background map from the Millennium Coral Reef Mapping Project (Andréfouët and Bionaz, 2021). P: Pass station (see Table A1 for details).
Each sensor deployed in various atolls was autonomous and moored on the seabed by SCUBA with a suitable structure adapted to the station substrate (sand-rubble, rock-coralline, coral, pavement, etc.) to avoid displacements and ensure durability across the planned sampling period.
Figure 8 illustrates the main types of instruments and their installations. A detailed summary (location, measured parameters, frequency, station depth, etc.) of all the instruments deployed is available in the Appendix (Table A1).
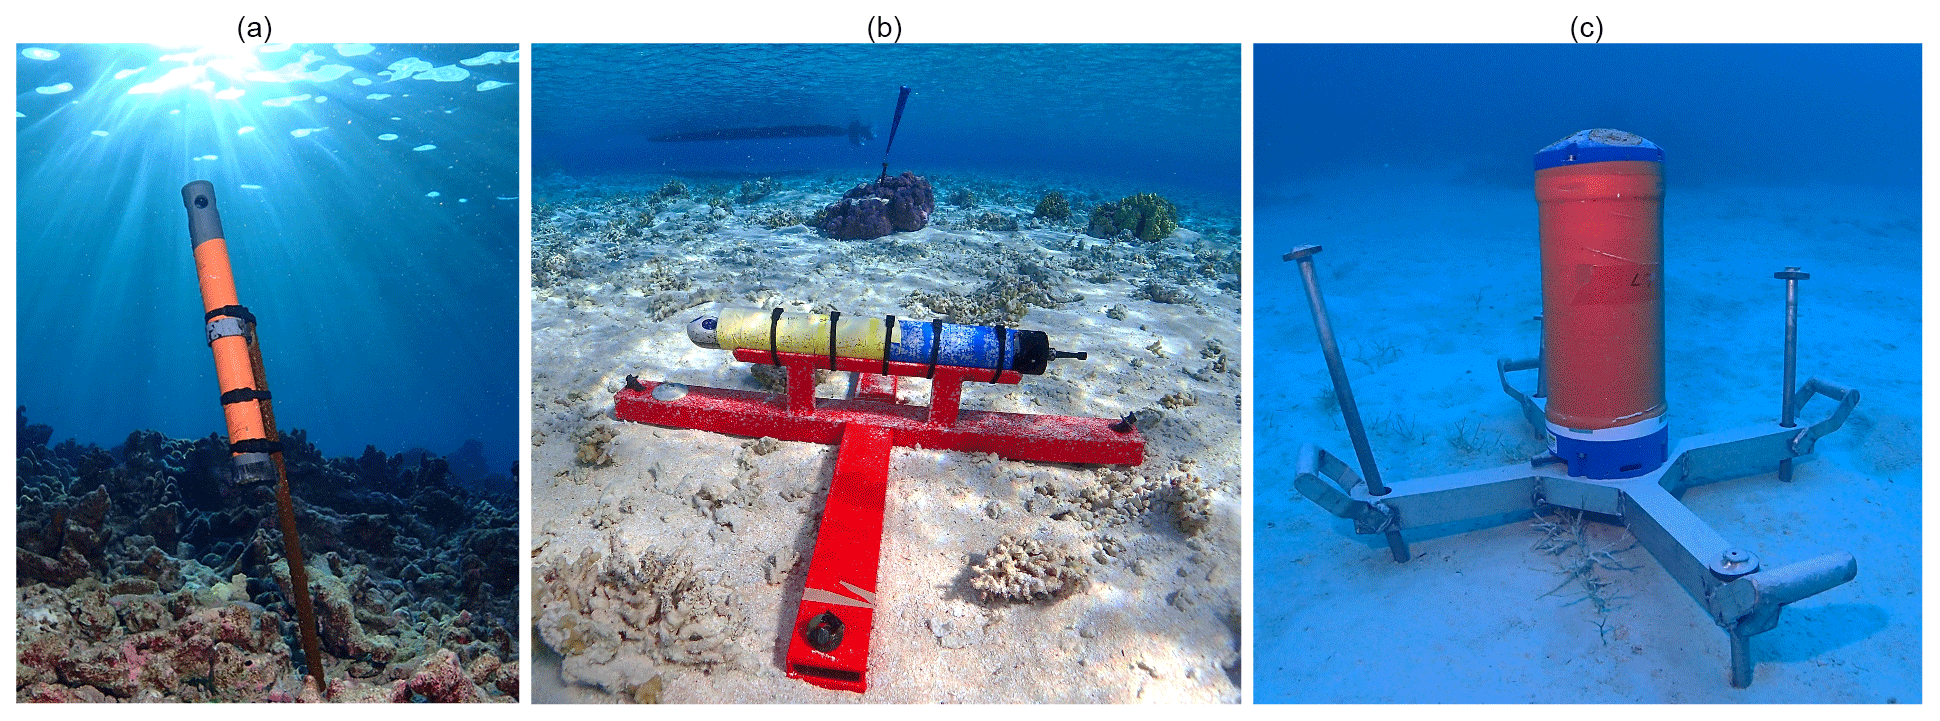
Figure 8Images of moored structures and deployed instruments in Raroia Atoll. (a) PVC tube for RBRduet T.D or SBE56 sensors fixed on a hard coralline bottom. (b) Aquadopp Nortek (on the forefront) and Marotte HS (at the back) moored on same station on the pavement or coral head. (c) ADCP Sentinel instrument moored at the bottom of a deep lagoon (photos: Serge Andréfouët).
4.1 Compact Temperature and Pressure sensors
Two types of compact loggers have been used to monitor temperature/pressure or temperature data respectively. First, the RBRduet T.D is a data logger constructed by RBR Ltd (https://rbr-global.com/products/compact-loggers/rbrduet-td/, last access: 7 April 2023) recording temperature and pressure at high sampling frequency (continuous sampling was set at 1 Hz intervals). Those precise sensors were anchored between 8 and 12 m deep on external reef slopes into differently exposed atoll sectors to provide sea-state parameters during post-processing steps (waves and sea level). RBRduet T.D loggers have also been deployed inside lagoons (6.7 to 13.5 m deep) in order to measure tide and surge variations.
High-precision temperature data were recorded with SBE56 sensors from SEABIRD Electronics Inc (https://www.seabird.com/sbe-56-temperature-sensor/product?id=54627897760, last access: 7 April 2023). Depending on atoll deployments, loggers were set up with a sampled frequency of 10 s (Raroia) or 1 min (Takapoto and Apataki).
To evaluate the temperature stratification in the water column, two SBE56 were systematically moored on the same station at two different depths (one sensor mostly around 2 m and one sensor up to 40 m), plus the setting also included one of the aforementioned RBRduet T.D moored at 6–13 m between the SBE56.
4.2 Current profilers
Two kinds of current profilers were deployed in the passes or hoa to measure current velocity and estimate the water fluxes between the ocean and the lagoon. Acoustic Doppler Current Profilers (ADCPs) were always bottom-mounted (upward-looking mode) to measure the water column up to the sub-surface. The number of cells was specific to each instrument and depth of mooring. ADCPs were set to sample in burst mode.
-
ADCPs from Teledyne RD Instruments Inc. (TRD-I) (i.e., Sentinel profilers) measured current intensity and direction across the water column according to a pre-defined number of cells, as well as pressure and temperature related to the presence of a sensor in its transducer head (Fig. 8, right image). The cell size was set to 50 cm, 1 m or 2 m depending on the instrument configuration, and the number of cells was dependent on the station depth. This instrument model was deployed inside the passes (Raroia, Apataki, Takaroa), in the lagoon close to the pass to characterize lagoon areas under the pass influence (Raroia, Apataki), or inside the lagoon away from the pass to characterize the lagoonal wind-induced circulation (Raroia). For each deployment, instruments were set up with a 10 min burst frequency except for two stations in Raroia (L7 and L8) where the sampling rate was 30 min. For Raroia, the two Sentinel V20 models and two Sentinel V50s of 1000 and 500 KHz working frequency respectively (http://www.teledynemarine.com/workhorse-sentinel-adcp?ProductLineID=12, last access: 7 April 2023) were moored during Leg 2 and the “short leg”. For Apataki, two Sentinel V50s were deployed inside passes and one V20 in the lagoon upstream of the southern pass. Finally, for Takaroa, only one V20 was installed inside the pass.
-
ADCPs from Nortek (i.e., Aquadopp profilers) are suitable instruments for shallow current measurements (Fig. 8, middle image). As such, they were predominantly moored inside various hoa (station depth <3 m). This sensor measures the pressure and 3D velocities that allow water elevation and the speed and direction of vertical currents to be deduced. In Raroia, two Aquadopp 2 MHz (https://www.nortekgroup.com/fr/products/aquadopp-profiler-2-mhz, last access: 6 April 2023) were moored inside two different hoa with a 5 min sampling rate with a cell size equal to 20 cm and three pings per ensemble. Beam coordinate systems for Raroia deployments were set in Cartesian coordinates (XYZ). Two stations in Takapoto and Apataki Atolls were also equipped with Aquadopps. Cell size was also set to 20 cm but settings were adjusted with 18 pings at each 10 min frequency burst and beam coordinates were configured to measure in Earth normal coordinates (ENUs).
4.3 Drag-tilt current meters
Marotte HS are low-cost drag-tilt current meters manufactured by the Marine Geophysics Laboratory of James Cook University, Australia (https://www.marinegeophysics.com.au/current-meter, last access: 3 April 2023). They measure temperature and velocities components (u,v) at the instrument level (Fig. 8, middle image). Speed and direction parameters are deduced from the sensor accelerometer and magnetometer without considering the device orientation. Sampling frequency was set to 10 s (Apataki) or 1 min (Raroia). Marotte HS were always moored in shallow locations (<2 m depth). During the Raroia legs, Marotte HS were paired with Aquadopp instruments (as showed in Fig. 8) in order to compare the measured velocity between sensors. In Apataki, two Marotte sensors were moored on hoa along the western side during Legs 1 and 2. A number of these instruments were lost or failed in the course of the MANA deployments shown in Fig. 3.
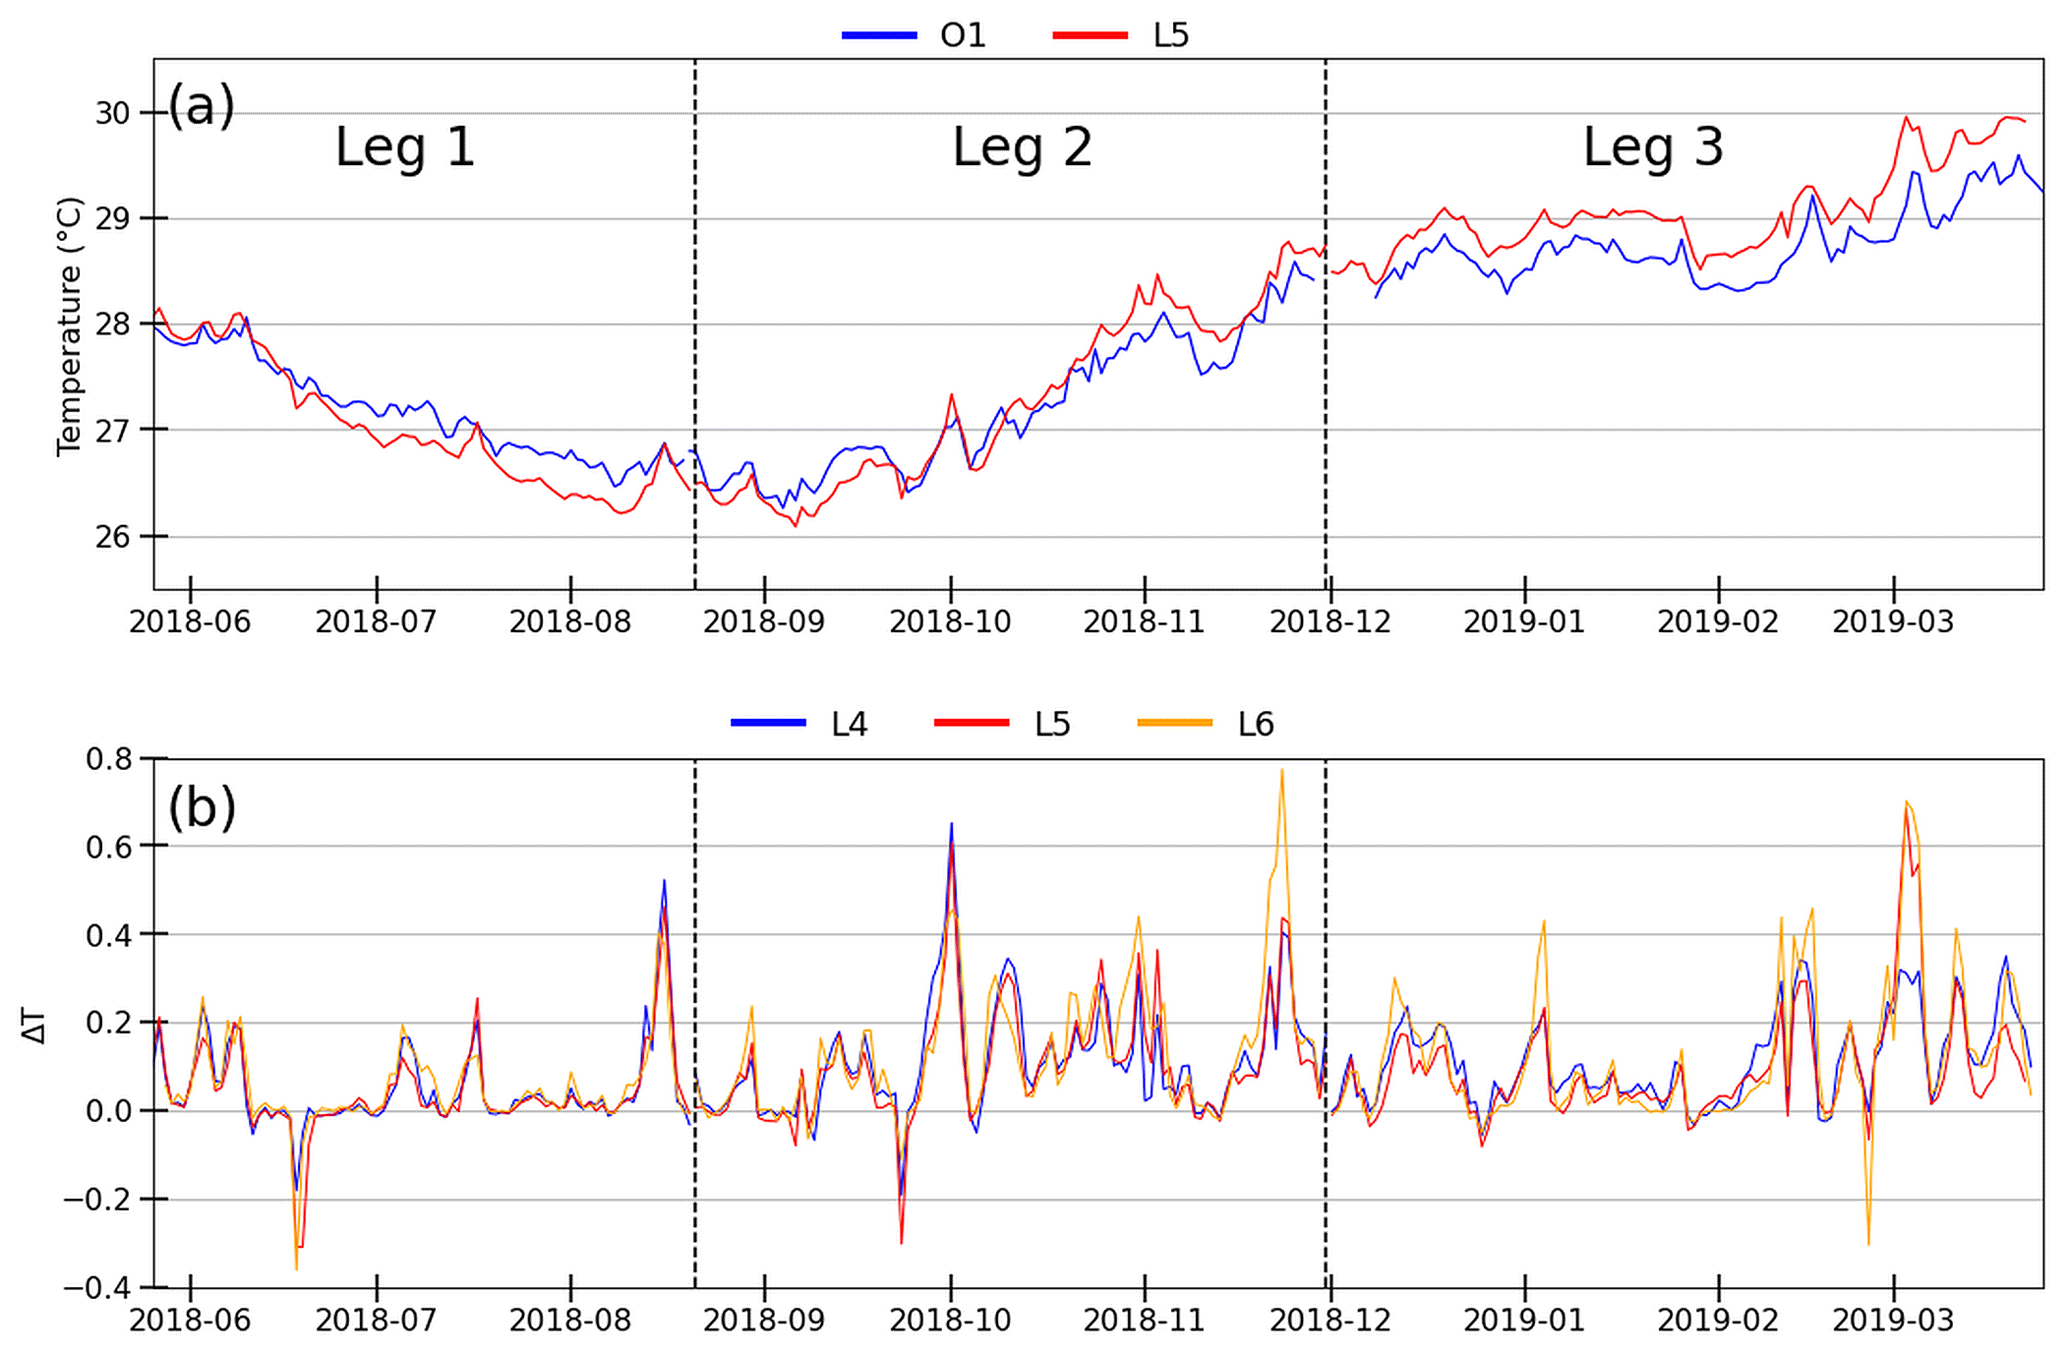
Figure 9For Raroia Atoll, (a) daily temperature time series of oceanic station O1 (9 m depth) and lagoon station L5 (2 m depth) on a daily scale over the entire deployment period. (b) Surface–bottom temperature differences on a daily scale for L4, L5 and L6 lagoon stations.
The processing and protocols applied to the data sets presented herein are similar to those of Bruyère et al. (2022) for the study of New Caledonia lagoons. For each data logger type, after retrieving the data from the instruments with the manufacturer's software, data were post-processed using Python 3.7 routines. Data were systematically converted into NetCDF format. Each NetCDF file contains variables and related metadata information including global attributes. Global attributes describe the data ensuring their reusability by giving geospatial position, temporal coverage, sampling frequency, depth, instrument serial number, investigator's name and any additional useful comments for data users. Depending on instruments, specific processing steps were performed (or not), namely:
-
For RBRduet T.D, pressure data were corrected from a constant atmospheric pressure (101 325 bar) in order to avoid the influence of weather condition changes. No vertical referencing by Differential Global Positioning Systems (DGPS) were achieved owing to the vicinity of breaking waves in the case of forereef stations. To deduce wave parameters (Significant wave height, Peak frequency and Mean wave period), data were filtered using the Fourier transform to acquire a pressure spectrum (within a range of 3–25 s). Then, the methods referenced in Aucan et al. (2017) were applied using the linear wave theory with a homogenous cut-off frequency (set to 0.33) to filter high-frequency spectra. To calculate the water level, depth measurements were subtracted from the mean sea level (long-term depth-averaged of the temporal series). As a result, two output files were created, one at 1 h resolution containing wave parameters and another file at 1 min frequency with the temperature and water level.
-
Current meter profilers (Sentinel and Aquadopps) do not provide reliable current measurements near the sea surface owing to contamination of the Doppler velocity related to acoustic sidelobe reflections from the boundary. To avoid contaminated cells, sea surface currents data were always removed from the processed files. Vertical and temporal resolutions remain dependent on deployment settings. No barometric correction was applied on depth but the mean depth of the entire time series was subtracted from data to obtain the water elevation. For Raroia, Aquadopp's coordinate system was set to Cartesian coordinates, to be consistent with other measures, directions were recalculated in ENU coordinates using the heading orientation.
-
Marotte HS data were averaged at 1 min frequency to smooth the high-frequency fluctuations. The by-default direction convention (initially ClockWise (CW) from east) was changed to be congruent with other instruments and with the oceanographic current convention (CW from north).
-
Finally, for SBE56 instruments no specific treatments were applied on temperature records, and final NetCDF files keep the raw frequency settings.
For all sensors, a visual check was performed with Ferret software (http://ferret.pmel.noaa.gov/Ferret/, last access: 20 October 2023) to exclude all out-of-water data in order to set the correct start and end of time series. The screening step also helps to detect any remaining anomalous values (out of range values) from the processed files. If any remaining anomaly is observed a specific comment in the NetCDF Global attributes is included.
Examples of collected data sets on the different atolls are provided hereafter for each category of sensor and deployment. They are by no means exhaustive (see Table A1). No lagoon processes that require taking into account multiple data sets are interpreted here as this makes the object of dedicated publications (e.g., Andréfouët et al., 2023b), but some basic descriptive interpretations are provided here.
6.1 Water temperature records
Figure 9a illustrates water temperature time series for stations O1 and L5 stations in Raroia Atoll (Fig. 4). The 9 month deployment in Raroia includes almost the entire 2018 winter season and the 2018–2019 summer season. This example shows the passage from the cold to the warm season (approximately 26 ∘C in August–September to 30 ∘C in April). The sampling period shows that the variations are not continuously linear. Different rates of changes occur between Leg 2 and Leg 3 for instance, and there are episodes of trend inversion (such as a period of cooling in mid-November 2018) (Fig. 9a).
The differences between the ocean and the lagoon are noteworthy, with the lagoon cooler than the ocean during the winter season, and the opposite in October, when the lagoon became warmer than the ocean. The ocean–lagoon differences are less than 1 ∘C (−0.83 to +0.42 ∘C).
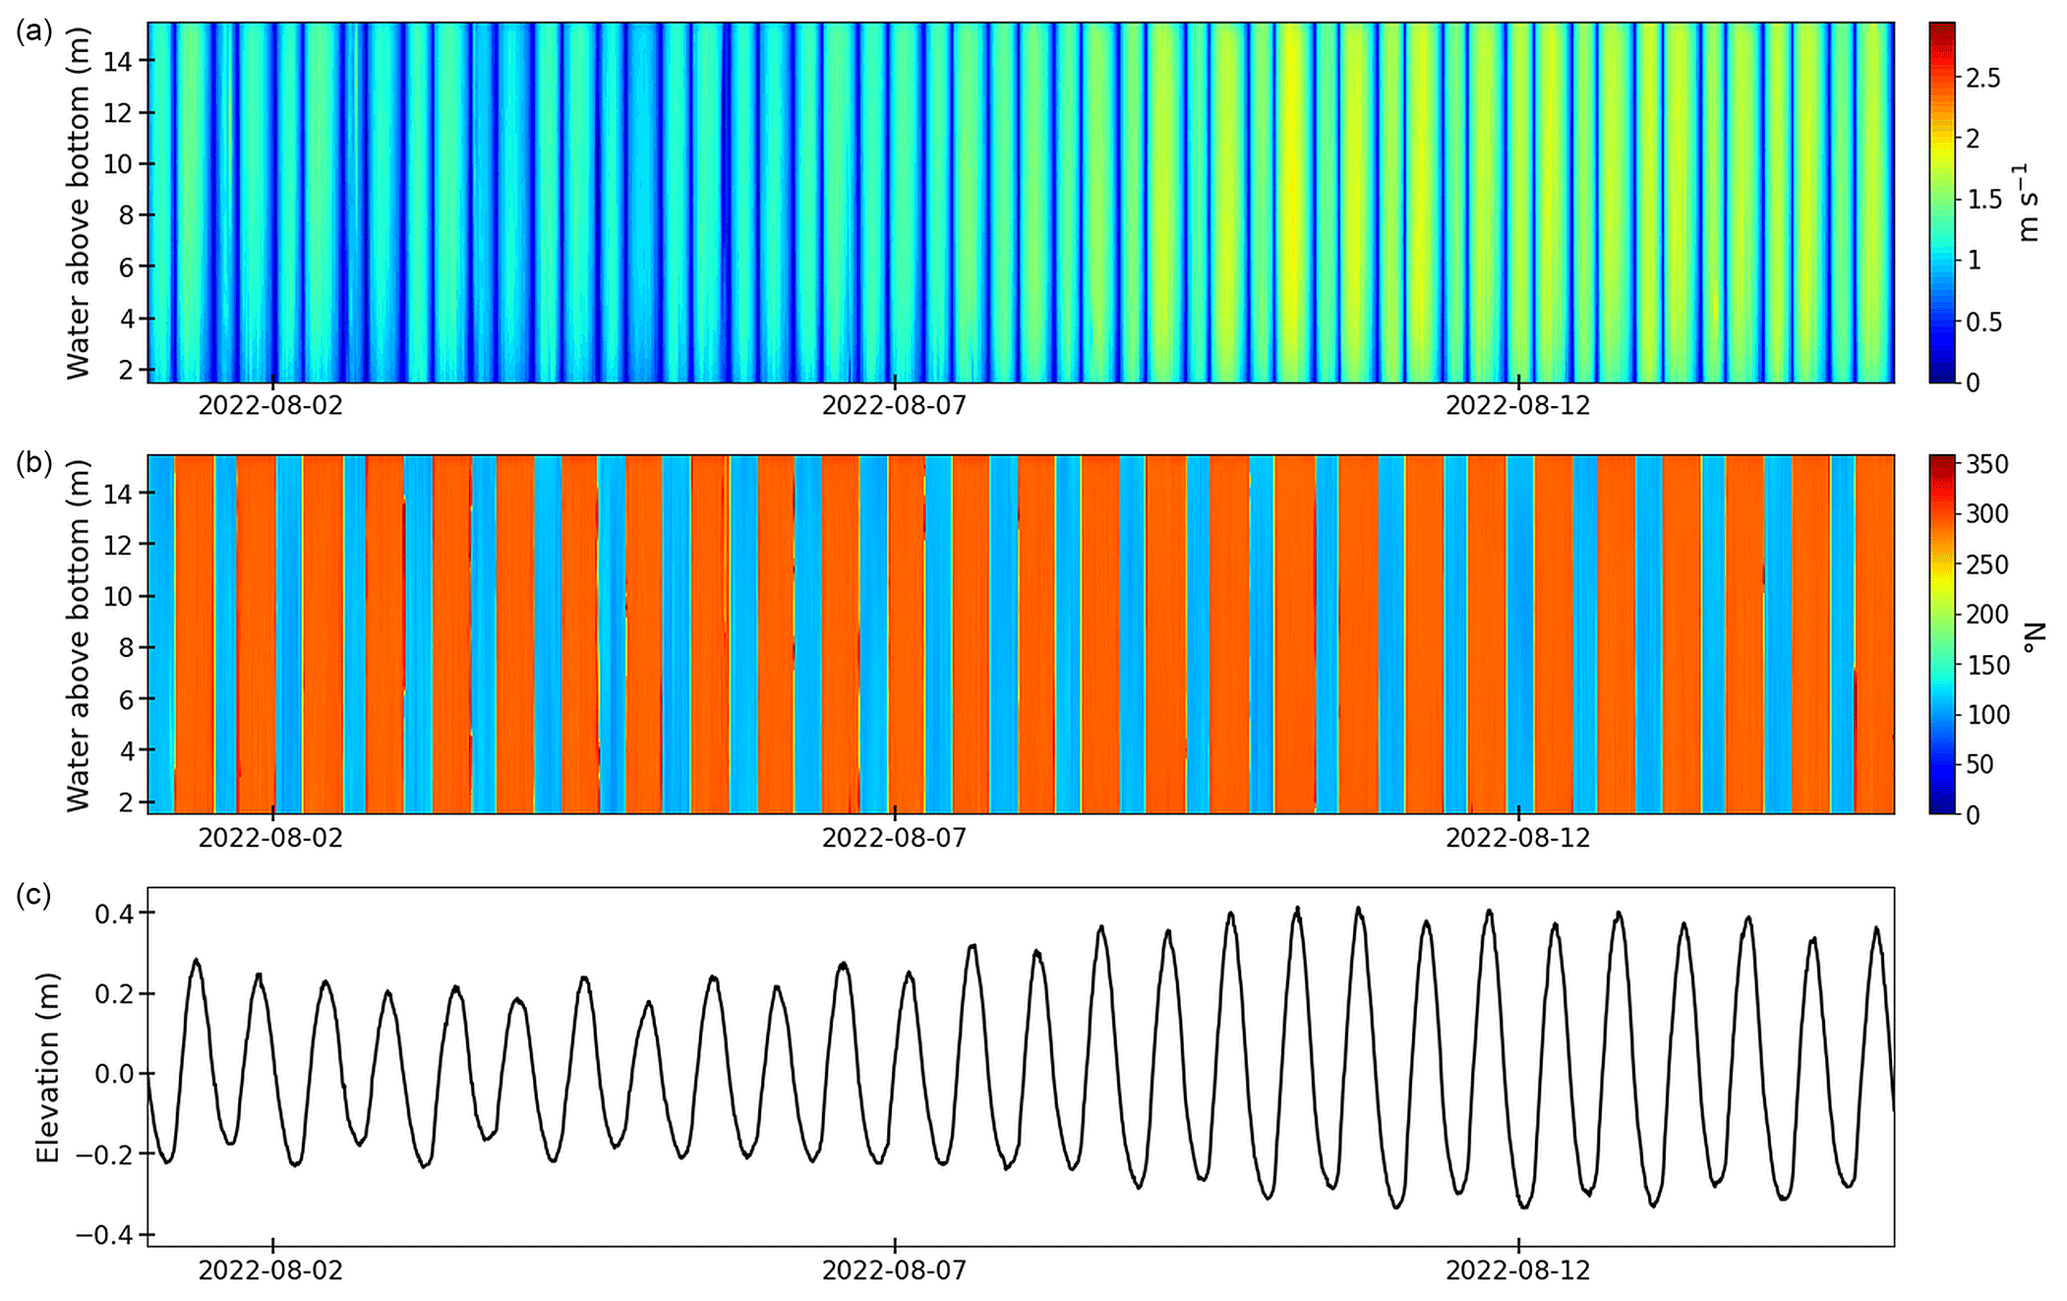
Figure 10Fifteen days zoom of current speeds (a), directions (b) over water column and water elevation time series (c) measured with an ADCP Sentinel V20 moored into Teaunonae Pass station (P01) in Takaroa Atoll. For direction interpretations, the oceanographic convention is employed (direction in which the current is propagated).
Inside the lagoon, Fig. 9b shows the surface–bottom water temperature differences for L4, L5 and L6 stations at Raroia Atoll (Fig. 4). The surface–bottom delta for three stations shows that fluctuations are spatially synchronous, but can be of different amplitudes. High amplitudes reveal water column stratification to be more intense during Leg 2 and Leg 3. Surface temperatures are generally higher than the bottom temperature. In some rare instances, the delta is negative, as in three events in June 2018, September 2018 and February 2019 during which the bottom temperature was +0.3 ∘C warmer than the surface. Interpretation of all these patterns requires the use of wind data (not shown).
6.2 Current records
Figure 10 shows current intensities (m s−1) and directions (∘ N) distributed over the water column in the Takaroa Pass (Fig. 7). The ADCP was moored at a depth of 17 m (Table A1). Current directions (Fig. 10, middle window) inside the pass are vertically homogenous and follow the semi-diurnal tide cycles (ebb and flow) with a westward (red) orientation during ebb and eastward (blue) during flow, which correspond to the channel orientation (see Fig. 7). Changes in current direction are very abrupt when the tide changes, in a matter of minutes. Current intensities (Fig. 10, first window) are also homogenous according to depth. The weakest currents occur during slack water corresponding to high or low tide maximum. Figure 10 (bottom panel) shows how current speed is related to spring tide, with a stronger outgoing current at that time. During “normal” conditions (no meteorological or wave events), water exchanges between ocean and lagoon through the pass are mostly driven by tide but meteorological events can alter the rhythm if the lagoon fills up because of incoming swells, for instance.
6.3 Sea state parameters
Wave parameters post-processed from pressure data measured by RBRduet T.D sensors deployed in Apataki Atoll are shown Fig. 11. The contrast between wave exposure on the different sides of an atoll is demonstrated by station O1, where incident wave heights ranged between 0.8 and 2 m, and up to 4 m during the mega swell episode hitting French Polynesia (mid-July 2022) (Andréfouët et al., 2023b). Conversely, the incident waves measured on the eastern station O3 never reach above 1 m high (Fig. 11a). Water elevation measured inside the lagoon (station L02) shows the entry of oceanic waters especially during the mid-July 2022 mega-swell and the corresponding positive +50 cm surge (Fig. 11c), as well as a strong distortion of the tide signal (Fig. 11b).
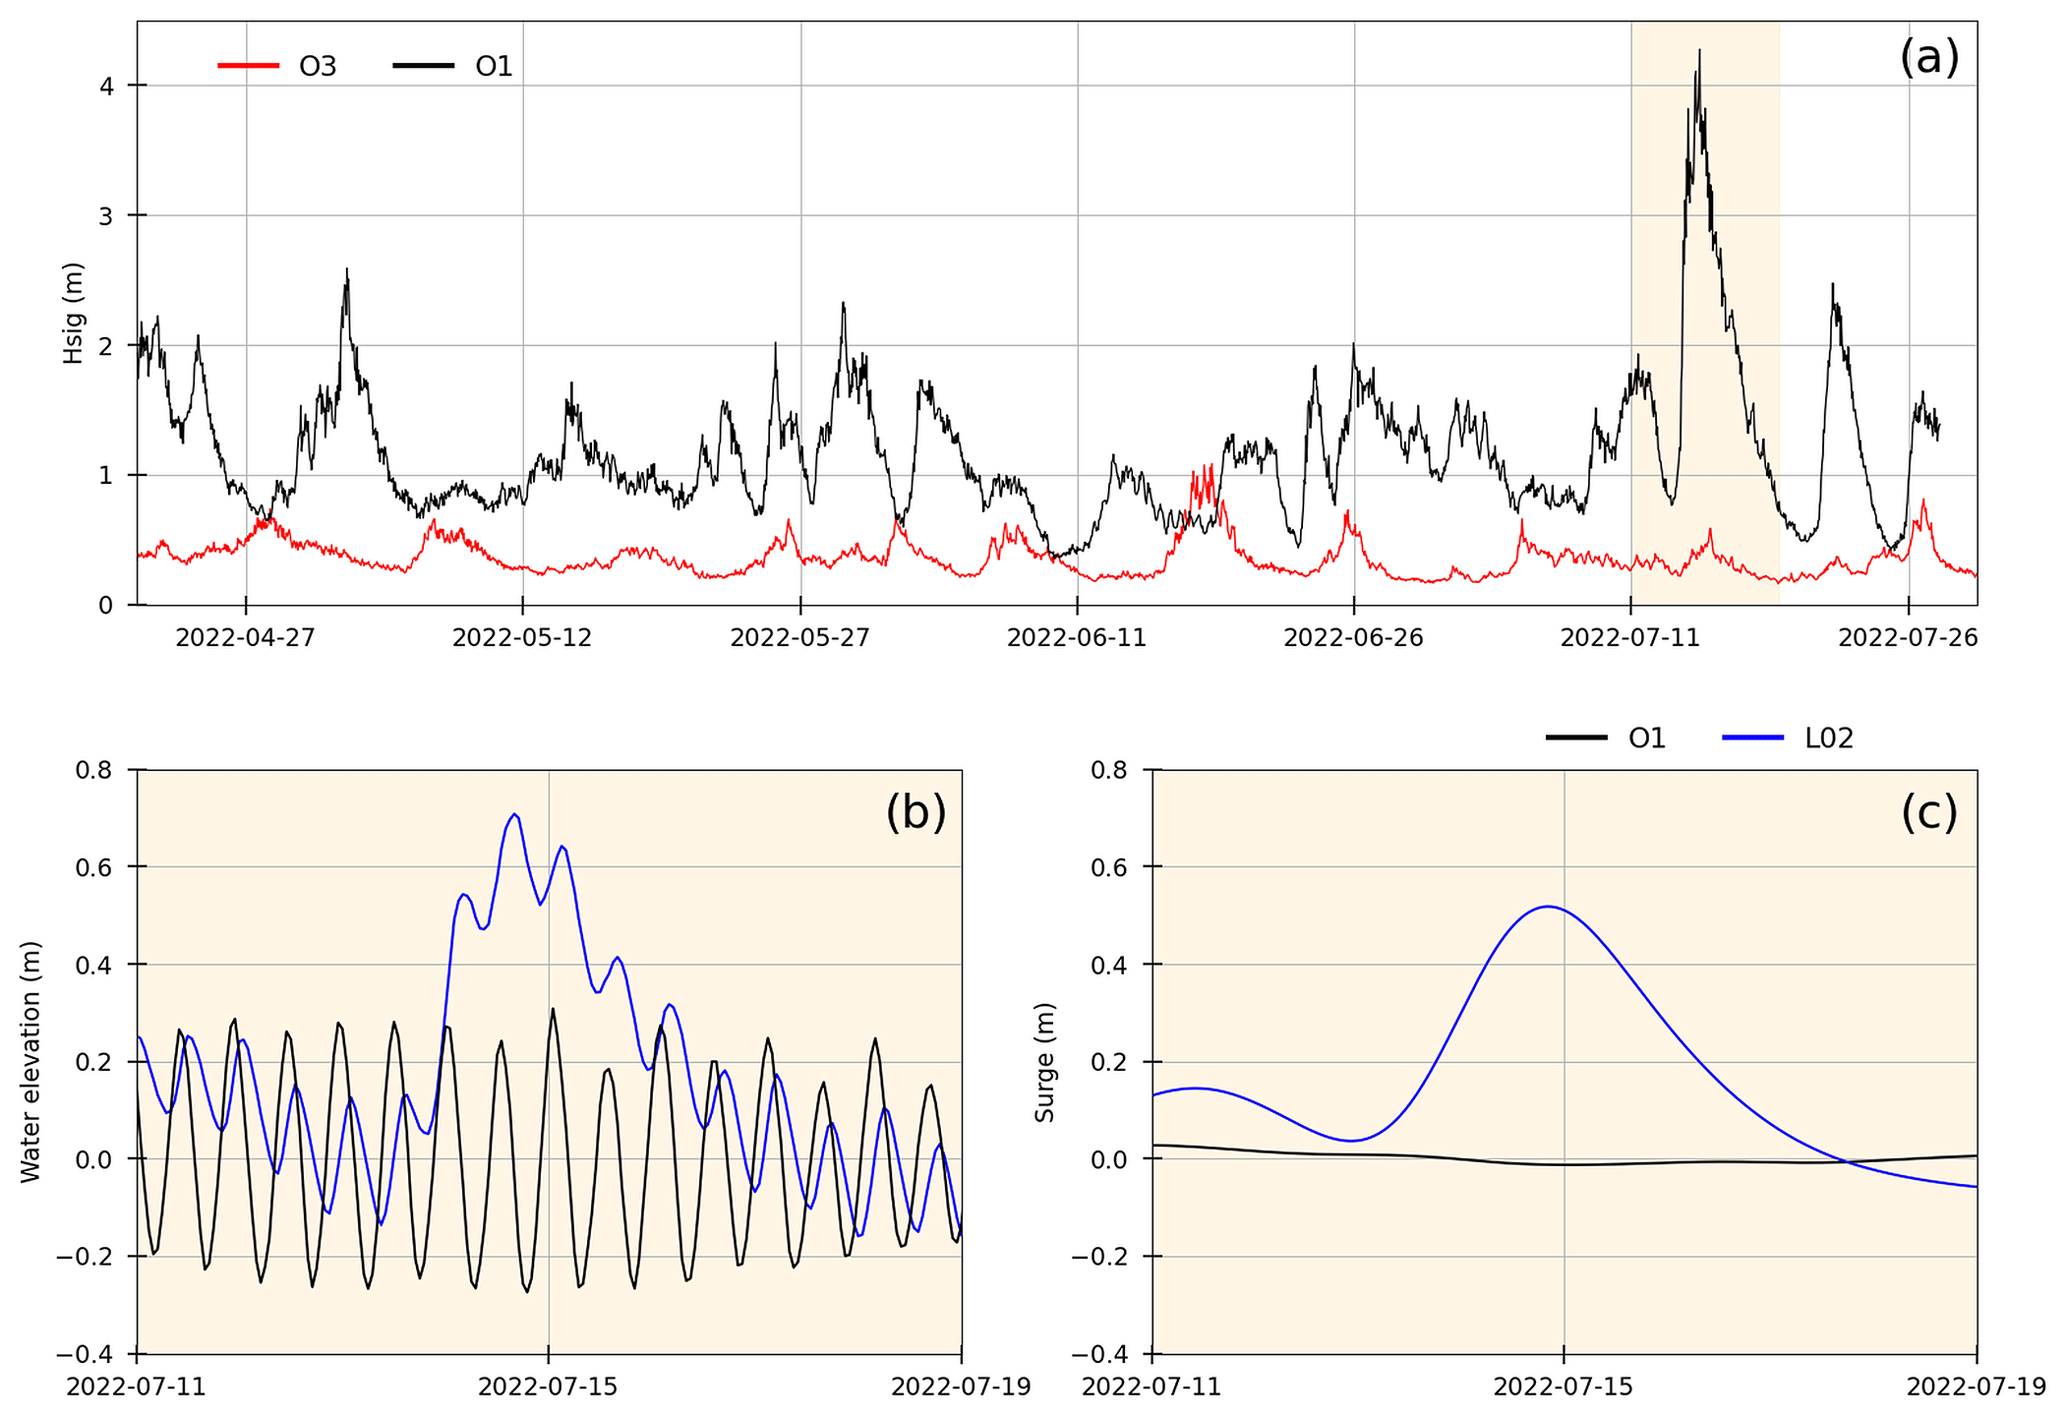
Figure 11(a) Significant wave height (Hsig) observed in station O1 (south side) and O03 (east coast) over the entire period of measurement in Apataki Atoll. (b) Surge elevation in the oceanic station (O1) and inside the lagoon (L05) during the wave event. (c) Zoom of tidal signal recorded in the oceanic station (O1) and inside the lagoon (L02) during the period of mega-swell.
The data sets presented here are publicly available on SEANOE (SEA ScieNtific Open data Edition) open data publisher (https://www.seanoe.org/, last access: 6 December 2023, Seanoe, 2023). Data are in open source and are identified per atoll and provided in NetCDF format with missing values set to −999. Permanent DOIs for each individual repository are presented in Table 2. Those data sets have already been used for field investigations (Andréfouët et al., 2023b; Aucan et al., 2021), and hydrodynamics models calibration and validation.
Table 2DOIs and references associated with the four data sets presented in this paper.
The data sets presented in this paper come from 5 years of investigations conducted in four specific pearl farming atolls in the Tuamotu Archipelago (French Polynesia). Combined, the four study sites represent one of the largest volumes of oceanographic data collected for any atoll archipelago worldwide. Those data inform about the inter-atoll and intra-lagoon differences due to the replication of field sites in most lagoons. Intra-lagoon and ocean–lagoon temperature, sea levels and hydrodynamics variables can be better understood with this existing data set. More investigations may nevertheless be required in different configurations to continue representing the diversity of Tuamotu and Gambier pearl farming sites. Besides pearl farming, the data provided here can also be useful for a variety of ecological, geomorphological, sedimentological and management applications.
Table A1List of station and instrument features (station position and depth, instrument type, raw and processed parameters, deployment date, sampling frequency and leg occurrence).
SA is the PI of the MANA project. SA, RLG, JA and VL raised funds. SA, RLG, VL and JA designed and conducted the experiments. SA, RLG, BB, DV, JB, TT, YF, JA and VL had implications in the field experiments. OB, MC, RLG, JA, SA, TT, YF and VL organized, processed, checked and archived the data sets. OB and SA prepared the paper and designed the figures, with contributions from all co-authors.
The contact author has declared that none of the authors has any competing interests.
Publisher's note: Copernicus Publications remains neutral with regard to jurisdictional claims made in the text, published maps, institutional affiliations, or any other geographical representation in this paper. While Copernicus Publications makes every effort to include appropriate place names, the final responsibility lies with the authors.
The authors acknowledge the Direction des Ressources Marines (DRM) of French Polynesia for their financial support and for providing oceanographic instruments. The CNFC and the crew of the R/V ALIS captained by Jean-François Barazer (scientific cruises MALIS 1, MALIS 2 and MALIS 3) were instrumental in the success of the field operations. The additional scientific staff that helped during one of the field operations described here include Joseph Campanozzi-Tarahu, Marcellino Raka, Tavi Tehei and Fabien Tertre (DRM), Magali Boussion (IRD), Benoit Beliaeff, Chloé Germain and Caline Basset (IFREMER). We thank the mayors, Townhouse staff, boat drivers and local population of the different atolls for their support and welcome. This work was made possible thanks to: the MALIS 1 and MALIS 2 oceanographic cruises in Raroia Atoll (https://doi.org/10.17600/18000582, Andréfouët, 2018), and the MALIS 3 cruise in Apataki and Takaroa Atoll (https://doi.org/10.17600/18001644, Andréfouët and Le Gendre, 2022), all conducted on board R/V ALIS.
This study was primarily funded by grant no. ANR-16-CE32-0004 MANA (Management of Atolls project). For Takapoto Atoll, surveys were also funded by the Direction des Ressources Marines (DRM) through grant no. 7518/VP/DRM to IRD. Instruments were provided by the Direction des Ressources Marines, OTI project, Contrat de Projet France-French Polynesia, Program 123, Action 2, 2015–2020.
This paper was edited by Giuseppe M. R. Manzella and reviewed by two anonymous referees.
André, L. V., Chinain, M., Gatti, C. M., Liao, V., Van Wynsberge, S., Tedesco, P., and Andréfouët, S.: A systematic prioritization approach for identifying suitable pearl oyster restocking zones following a mass mortality event in Takaroa Atoll, French Polynesia, Marine Pollut. B., 176, 113472, https://doi.org/10.1016/j.marpolbul.2022.113472, 2022.
Andréfouët, S.: POLYPERL cruise, RV Alis, French Oceanographic Cruises [data set], https://doi.org/10.17600/13100050, 2013.
Andréfouët, S.: MALIS 1&2 cruise, RV Alis, French Oceanographic Cruises [data set], https://doi.org/10.17600/18000582, 2018.
Andréfouët, S. and Adjeroud, M.: French Polynesia. In World Seas: An Environmental Evaluation, Elsevier., 827–854, https://doi.org/10.1016/B978-0-08-100853-9.00039-7, 2019.
Andréfouët, S. and Bionaz, O.: Lessons from a global remote sensing mapping project. A review of the impact of the Millennium Coral Reef Mapping Project for science and management, Sci. Total Environ., 776, 145987, https://doi.org/10.1016/j.scitotenv.2021.145987, 2021.
Andréfouët, S. and Le Gendre, R.: MALIS 3 cruise, RV Alis, French Oceanographic Cruises [data set], https://doi.org/10.17600/18001644, 2022.
Andréfouët, S., Claereboudt, M., Matsakis, P., Pagès, J., and Dufour, P.: Typology of atoll rims in Tuamotu Archipelago (French Polynesia) at landscape scale using SPOT HRV images, Int. J. Remote Sens., 22, 987–1004, https://doi.org/10.1080/014311601300074522, 2001a.
Andréfouët, S., Pagès, J., and Tartinville, B.: Water renewal time for classification of atoll lagoons in the Tuamotu Archipelago (French Polynesia), Coral Reefs, 20, 399–408, https://doi.org/10.1007/s00338-001-0190-9, 2001b.
Andréfouët, S., Ouillon, S., Brinkman, R., Falter, J., Douillet, P., Wolk, F., and Buestel, D.: Review of solutions for 3D hydrodynamic modeling applied to aquaculture in South Pacific atoll lagoons, Marine Pollut. B., 52, 1138–1155, 2006.
Andréfouët, S., Ardhuin, F., Queffeulou, P., and Le Gendre, R.: Island shadow effects and the wave climate of the Western Tuamotu Archipelago (French Polynesia) inferred from altimetry and numerical model data, Marine Pollut. B., 65, 415–424, https://doi.org/10.1016/j.marpolbul.2012.05.042, 2012a.
Andréfouët, S., Charpy, L., Lo-Yat, A., and Lo, C.: Recent research for pearl oyster aquaculture management in French Polynesia, Marine Pollut. B., 65, 407–414, https://doi.org/10.1016/j.marpolbul.2012.06.021, 2012b.
Andréfouët, S., Genthon, P., Pelletier, B., Le Gendre, R., Friot, C., Smith, R., and Liao, V.: The lagoon geomorphology of pearl farming atolls in the Central Pacific Ocean revisited using detailed bathymetry data, Marine Pollut. B., 160, 111580, https://doi.org/10.1016/j.marpolbul.2020.111580, 2020.
Andréfouët, S., Desclaux, T., Buttin, J., Jullien, S., Aucan, J., Le Gendre, R., and Liao, V.: Periodicity of wave-driven flows and lagoon water renewal for 74 Central Pacific Ocean atolls, Marine Pollut. B., 179, 113748, https://doi.org/10.1016/j.marpolbul.2022.113748, 2022a.
Andréfouët, S., Lo-Yat, A., Lefebvre, S., Bionaz, O., and Liao, V.: The MANA (MANagement of Atolls, 2017–2022) project for pearl oyster aquaculture management in the Central Pacific Ocean using modelling approaches: Overview of first results, Marine Pollut. B., 178, 113649, https://doi.org/10.1016/j.marpolbul.2022.113649, 2022b.
Andréfouët, S., Bruyère, O., Aucan, J., Liao, V., and Le Gendre, R.: Lagoon hydrodynamics of pearl farming atolls in French Polynesia: the case of Raroia Atoll (Tuamotu Archipelago), SEANOE [data set], https://doi.org/10.17882/94147, 2023a.
Andréfouët, S., Bruyère, O., Liao, V., and Le Gendre, R.: Hydrodynamical impact of the July 2022 “Code Red” distant mega-swell on Apataki Atoll, Tuamotu Archipelago, Global Planet. Change, 228, 104194, https://doi.org/10.1016/j.gloplacha.2023.104194, 2023b.
Aucan, J., Vendé-Leclerc, M., Dumas, P., and Bricquir, M.: Wave forcing and morphological changes of New Caledonia lagoon islets: Insights on their possible relations, C. R. Geosci., 349, 248–259, https://doi.org/10.1016/j.crte.2017.09.003, 2017.
Aucan, J., Desclaux, T., Le Gendre, R., Liao, V., and Andréfouët, S.: Tide and wave driven flow across the rim reef of the atoll of Raroia (Tuamotu, French Polynesia), Marine Pollut. B., 171, 112718, https://doi.org/10.1016/j.marpolbul.2021.112718, 2021.
Bruyère, O., Soulard, B., Lemonnier, H., Laugier, T., Hubert, M., Petton, S., Desclaux, T., Van Wynsberge, S., Le Tesson, E., Lefèvre, J., Dumas, F., Kayara, J.-F., Bourassin, E., Lalau, N., Antypas, F., and Le Gendre, R.: Hydrodynamic and hydrological processes within a variety of coral reef lagoons: field observations during six cyclonic seasons in New Caledonia, Earth Syst. Sci. Data, 14, 5439–5462, https://doi.org/10.5194/essd-14-5439-2022, 2022.
Bruyère, O., Le Gendre, R., Liao, V., and Andréfouët, S.: Lagoon hydrodynamics of pearl farming atolls in French Polynesia: the case of Apataki Atoll (Tuamotu Archipelago), SEANOE [data set], https://doi.org/10.17882/94031, 2023a.
Bruyère, O., Le Gendre, R., Liao, V., and Andréfouët, S.: Lagoon hydrodynamics of pearl farming atolls in French Polynesia: the case of Takapoto Atoll (Tuamotu Archipelago), SEANOE [data set], https://doi.org/10.17882/94032, 2023b.
Bruyère, O., Le Gendre, R., Liao, V., and Andréfouët, S.: Lagoon hydrodynamics of pearl farming atolls in French Polynesia: the case of Takaroa Atoll (Tuamotu Archipelago), SEANOE [data set], https://doi.org/10.17882/94146, 2023c.
Bruyère, O., Le Gendre, R., Liao, V., and Andréfouët, S.: Lagoon hydrodynamics of pearl farming islands: the case of Gambier (French Polynesia), Earth Syst. Sci. Data Discuss. [preprint], https://doi.org/10.5194/essd-2023-302, in review, 2023d.
Callaghan, D. P., Nielsen, P., Cartwright, N., Gourlay, M. R., and Baldock, T. E.: Atoll lagoon flushing forced by waves, Coastal Engineering., 53, 691–704, https://doi.org/10.1016/j.coastaleng.2006.02.006, 2006.
Copernicus Sentinel-2.: (processed by ESA), MSI Level-2A BOA Reflectance Product. Collection 1, European Space Agency, https://doi.org/10.5270/S2_-znk9xsj, 2021.
Dufour, P. and Harmelin-Vivien, M.: A research program for a typology of atoll lagoons: strategy and first results, Proc. 8th Int Coral Reef Symp., 1, 843–848, 1997.
Dufour, P., Andréfouët, S., Charpy, L., and Garcia, N.: Atoll morphometry controls lagoon nutrient regime, Limnol. Oceanogr., 46, 456–461, https://doi.org/10.4319/lo.2001.46.2.0456, 2001.
Dumas, F., Le Gendre, R., Thomas, Y., and Andréfouët, S.: Tidal flushing and wind driven circulation of Ahe atoll lagoon (Tuamotu Archipelago, French Polynesia) from in situ observations and numerical modelling, Marine Pollut. B., 65, 425–440, https://doi.org/10.1016/j.marpolbul.2012.05.041, 2012.
DRM (Direction des Ressources Marines): Bulletin Statistique: Synthèse des données de la pêche professionnelle, de l'aquaculture et de la perliculture, Edition 2021, http://www.ressources-marines.gov.pf/wp-content/uploads/sites/24/2022/10/Bulletin-statistique-DRM-2021-light.pdf (last access: 6 December 2023), 2021.
Dutheil, C., Andréfouët, S., Jullien, S., Le Gendre, R., Aucan, J., and Menkes, C.: Characterization of south central Pacific Ocean wind regimes in present and future climate for pearl farming application, Marine Pollut. B., 160, 111584, https://doi.org/10.1016/j.marpolbul.2020.111584, 2020.
Dutheil, C., Jullien, S., Aucan, J., Menkes, C., Le Gendre, R., and Andréfouët, S.: The wave regimes of the Central Pacific Ocean with a focus on pearl farming atolls, Marine Pollut. B., 162, 111751, https://doi.org/10.1016/j.marpolbul.2020.111751, 2021.
GEBCO Compilation Group: GEBCO 2023 Grid, GEBCO Compilation Group [data set], https://doi.org/10.5285/f98b053b-0cbc-6c23-e053-6c86abc0af7b, 2023.
Gueguen, Y., Gaertner-Mazouni, N., Lo, C., and Le Moullac, G.: Integrated management of pearl culture in French Polynesia in the context of global change: Synopsis of existing results. Estuarine, Coastal Shelf Sci., 182, 229–234, https://doi.org/10.1016/j.ecss.2016.07.010, 2016.
Hersbach, H., Bell, B., Berrisford, P., Hirahara, S., Horányi, A., Muñoz-Sabater, J., Nicolas, J., Peubey, C., Radu, R., Schepers, D., Simmons, A., Soci, C., Abdalla, S., Abellan, X., Balsamo, G., Bechtold, P., Biavati, G., Bidlot, J., Bonavita, M., Chiara, G., Dahlgren, P., Dee, D., Diamantakis, M., Dragani, R., Flemming, J., Forbes, R., Fuentes, M., Geer, A., Haimberger, L., Healy, S., Hogan, R. J., Hólm, E., Janisková, M., Keeley, S., Laloyaux, P., Lopez, P., Lupu, C., Radnoti, G., Rosnay, P., Rozum, I., Vamborg, F., Villaume, S., and Thépaut, J.: The ERA5 global reanalysis, Q. J. Roy. Meteor. Soc., 146, 1999–2049, https://doi.org/10.1002/qj.3803, 2020.
Latchere, O., Mehn, V., Gaertner-Mazouni, N., Le Moullac, G., Fievet, J., Belliard, C., Cabral, P., and Saulnier, D.: Influence of water temperature and food on the last stages of cultured pearl mineralization from the black-lip pearl oyster Pinctada margaritifera. PLoS ONE, 13, e0193863, https://doi.org/10.1371/journal.pone.0193863, 2018.
Laurent, V. and Maamaatuaiahutapu, K.: Atlas climatologique de la Polynésie française, Météo France, Faa'a-Tahiti, 242 pp., 2019.
Laurent, V. and Varney, P.: Historique des cyclones de Polynésie française de 1831 à 2010. Météo-France, Papeete, 192 pp., 2014.
Le Gendre, R.: Plan de pose des instruments: mesures de pression, houle, courant et température – Ahe, SEXTANT(IFREMER) [data set], https://doi.org/10.12770/be239ab6-bd5b-4dfd-9d3c-51e6c3793810, 2020a.
Le Gendre, R.: Plan de pose des instruments: mesures de pression, courant et température – Takaroa, SEXTANT(IFREMER) [data set], https://doi.org/10.12770/ec81af02-e049-4f99-8cc6-748ee0550d32, 2020b.
Le Moullac, G., Soyez, C., Latchere, O., Vidal-Dupiol, J., Fremery, J., Saulnier, D., Lo Yat, A., Belliard, C., Mazouni-Gaertner, N., and Gueguen, Y.: Pinctada margaritifera responses to temperature and pH: Acclimation capabilities and physiological limits, Estuar. Coast. Shelf Sci., 182, 261–269, https://doi.org/10.1016/j.ecss.2016.04.011, 2016.
Le Pennec, M.: Huître perlière et perle de Tahiti. Faa'a. Université de la Polynésie française, Punaauia-Tahiti, 203 pp., 2010.
Montaggioni, L. F., Martin-Garin, B., Salvat, B., Aubanel, A., Pons-Branchu, E., Paterne, M., and Richard, M.: Coral conglomerate platforms as foundations for low-lying, reef islands in the French Polynesia (central south Pacific): New insights into the timing and mode of formation, Marine Geol., 437, 106500, https://doi.org/10.1016/j.margeo.2021.106500, 2021.
Pagès, J. and Andréfouët, S.: A reconnaissance approach for hydrology of atoll lagoons, Coral Reefs., 20, 409–414, https://doi.org/10.1007/s00338-001-0192-7, 2001.
Rodier, M., Longo, S., Henry, K., Ung, A., Lo-Yat, A., Darius, H., Viallon, J., Beker, B., Delesalle, B., and Chinain, M.: Diversity and toxic potential of algal bloom-forming species from Takaroa lagoon (Tuamotu, French Polynesia): a field and mesocosm study, Aquat. Microb. Ecol., 83, 15–34, https://doi.org/10.3354/ame01900, 2019.
Sangare, N., Lo-Yat, A., Moullac, G.L., Pecquerie, L., Thomas, Y., Lefebvre, S., Gendre, R.L., Beliaeff, B., and Andréfouët, S.: Impact of environmental variability on Pinctada margaritifera life-history traits: A full life cycle deb modeling approach, Ecol. Modell., 423, 109006, https://doi.org/10.1016/j.ecolmodel.2020.109006, 2020.
Seanoe: Sea scientific open data publication, https://seanoe.org/, last access: 16 April 2023.
Tartinville, B., Deleersnijder, E., and Rancher, J.: The water residence time in the Mururoa atoll lagoon: Sensitivity analysis of a three-dimensional model, Coral-Reefs., 16, 193–203, https://doi.org/10.1007/s003380050074, 1997.
Thomas, Y., Garen, P., Courties, C., and Charpy, L.: Spatial and temporal variability of the pico- and nanophytoplankton and bacterioplankton in a deep Polynesian atoll lagoon, Aquat. Microb. Ecol., 59, 89–101, https://doi.org/10.3354/ame01384, 2010.
Thomas, Y., Le Gendre, R., Garen, P., Dumas, F., and Andréfouët, S.: Bivalve larvae transport and connectivity within the Ahe atoll lagoon (Tuamotu Archipelago), with application to pearl oyster aquaculture management, Marine Pollut. B., 65, 441–452, https://doi.org/10.1016/j.marpolbul.2011.12.027, 2012.
Thomas, Y., Dumas, F., and Andréfouët, S.: Larval Dispersal Modeling of Pearl Oyster Pinctada margaritifera following Realistic Environmental and Biological Forcing in Ahe Atoll Lagoon, PLoS ONE, 9, e95050, https://doi.org/10.1371/journal.pone.0095050, 2014.
Thomas, Y., Dumas, F., and Andréfouët, S.: Larval connectivity of pearl oyster through biophysical modelling; evidence of food limitation and broodstock effect. Estuarine, Coast. Shelf Sci., 182, 283–293, https://doi.org/10.1016/j.ecss.2016.03.010, 2016.
Violette, C., Le Gendre, R., Chauveau, M., and Andréfouët, S.: A multivariate approach to synthetize large amount of connectivity matrices for management decisions: Application to oyster population restocking in the pearl farming context of Tuamotu Archipelago semi-closed atolls, Marine Pollut. B., 189, 114748, https://doi.org/10.1016/j.marpolbul.2023.114748, 2023.
- Abstract
- Introduction
- The French Polynesia atolls context: climate, geomorphology and hydrodynamic processes
- Study sites and sampling strategy
- Oceanographic instruments
- Data processing and quality control
- Examples of results
- Data availability
- Conclusions
- Appendix A
- Author contributions
- Competing interests
- Disclaimer
- Acknowledgements
- Financial support
- Review statement
- References