the Creative Commons Attribution 4.0 License.
the Creative Commons Attribution 4.0 License.
 | 26 Jan 2024
Lagoon hydrodynamics of pearl farming islands: the case of Gambier (French Polynesia)
Oriane Bruyère
Romain Le Gendre
Vetea Liao
Between 2019 and 2020, the Gambier lagoon was instrumented over a period of 9 months with a large array of autonomous oceanographic instruments measuring temperature, pressure, and current. Two deployments were conducted from June to October 2019 (Leg1) and from late October 2019 to late February 2020 (Leg2). A total of 16 instrumented locations were spread across the lagoon and on the forereef. Physical parameters were measured to characterize the wave climate, tide and surges, lagoonal circulation, and spatial and vertical temperature variabilities. Those observations were part of the ANR-funded MANA project (2017–2022) and its derivatives that were aimed at improving knowledge of processes influencing the spat collection of Pinctada margaritifera oysters that are used for black pearl farming and production. This dataset was a prerequisite for the development of a high-resolution biophysical model on the Gambier lagoon that is aimed at understanding the connectivity of oyster larvae (Bruyère et al., 2023a). The sampling strategy focused on the northern region of the Gambier lagoon and especially on the sub-lagoon of Rikitea, which is a prime spat collection site. The dataset was post processed, quality controlled, and is archived in a dedicated repository with a permanent DOI via the SEANOE marine data platform (https://doi.org/10.17882/94148, Andréfouët et al., 2023b).
- Article
(12073 KB) - Full-text XML
- Companion paper
- BibTeX
- EndNote


Black pearl farming is the second major economic income for French Polynesia, representing about EUR 40 M of international sales. The sector employed 1300 workers on 28 atolls and islands as of 2021 and contributes to stabilizing the populations in remote islands, especially in the Tuamotu and Gambier archipelagoes. The Gambier Islands are a series of small volcanic islands within a single large lagoon representing 25 % of French Polynesia black pearl production in 2020 (André et al., 2022; Bruyère et al., 2023a). This site has been overlooked in terms of scientific investigations aiming to support pearl farming management. Despite its good pearl production performance, Gambier also suffers from problems such as lagoonal space limitation (André et al., 2022) and more critically a recent decrease in spat collection rates (Bruyère et al., 2023a). Better understanding of spat collection requires the characterization of the oyster stocks (Bionaz et al., 2022), oyster life cycle (Le Moullac et al., 2012), and a good knowledge of hydrodynamic functioning of lagoons and larval dispersal in relation to forcing factors such as tides, wind or waves. Several pearl farming Tuamotu atoll lagoons have been instrumented in the past to study their hydrodynamics (Dumas et al., 2012; Andréfouët et al., 2023a; Bruyère et al., 2023b) and Gambier was added to the list starting in late 2019 as the first high volcanic islands investigated with an array of physical oceanography instruments (Bruyère et al., 2023a). The sampling strategy is different than the general strategy applied to atolls, as the focus of the investigation on Gambier was on a spat-producing sub-lagoon (Bruyère et al., 2023a) and because the hoa (vernacular name for the shallow passages transversal to an atoll rim) were not instrumented here unlike for atolls. As such, this paper presents the hydrodynamic data recorded in Gambier lagoons during a 9-month deployment period (June 2019–February 2020). Similar data collected on Raroia, Apataki, Takapoto, and Takaroa atolls are presented elsewhere (Bruyère et al., 2023b).
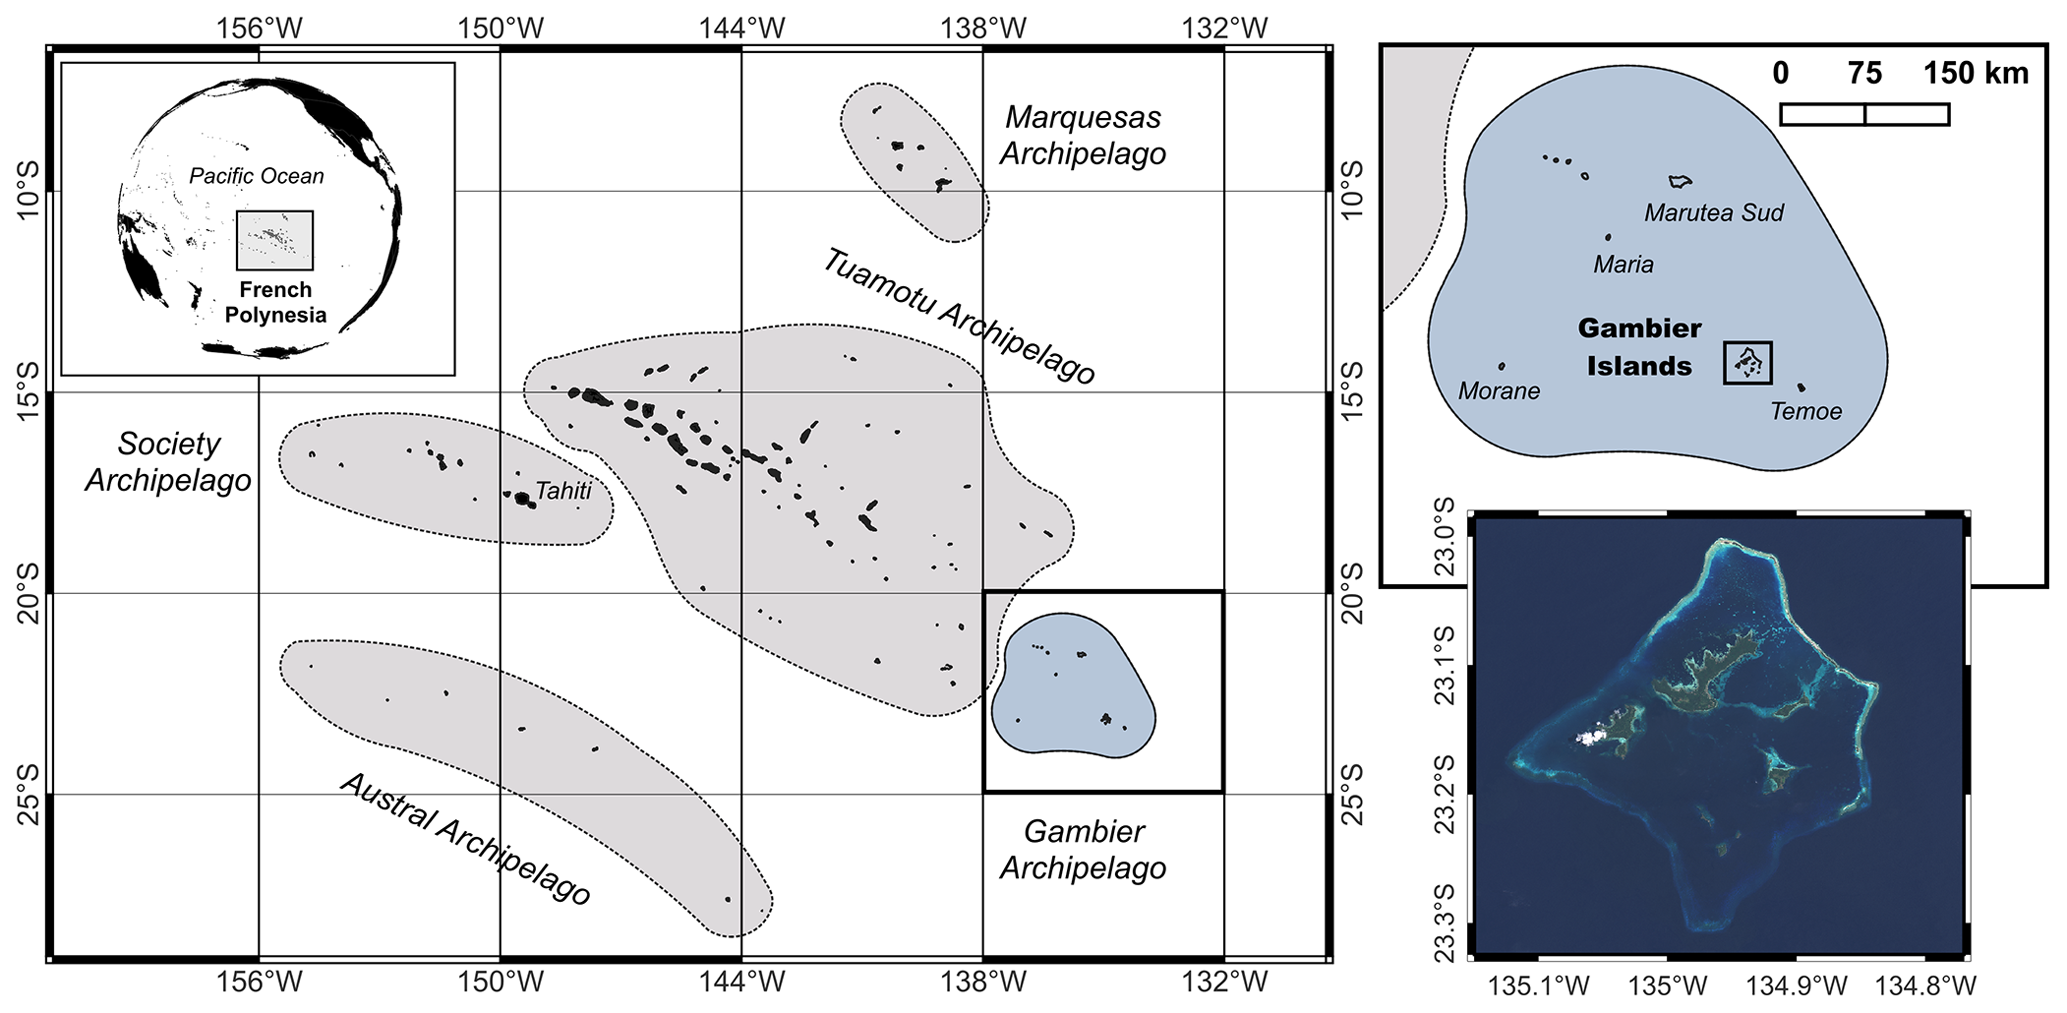
Figure 1Map of French Polynesia archipelagos and zoom of Gambier Islands location. Background satellite image from Sentinel-2 mission) (Copernicus Sentinel-2, 2021).
Gambier Islands ( S– W) constitute a group of seven high islands sharing the same large deep lagoon, situated 1645 km south-eastward from Tahiti Island. It is part of the administrative Gambier archipelago (Fig. 1) and had 1592 inhabitants in 2017. The Gambier lagoon is very open to the ocean, being surrounded by a barrier reef that is submerged on the southern and western parts, and by an intertidal and emerged barrier reef on the northern and eastern sides (Fig. 2). The northern side is cut in some sections by several hoa, allowing connections between the lagoon and the deep ocean.
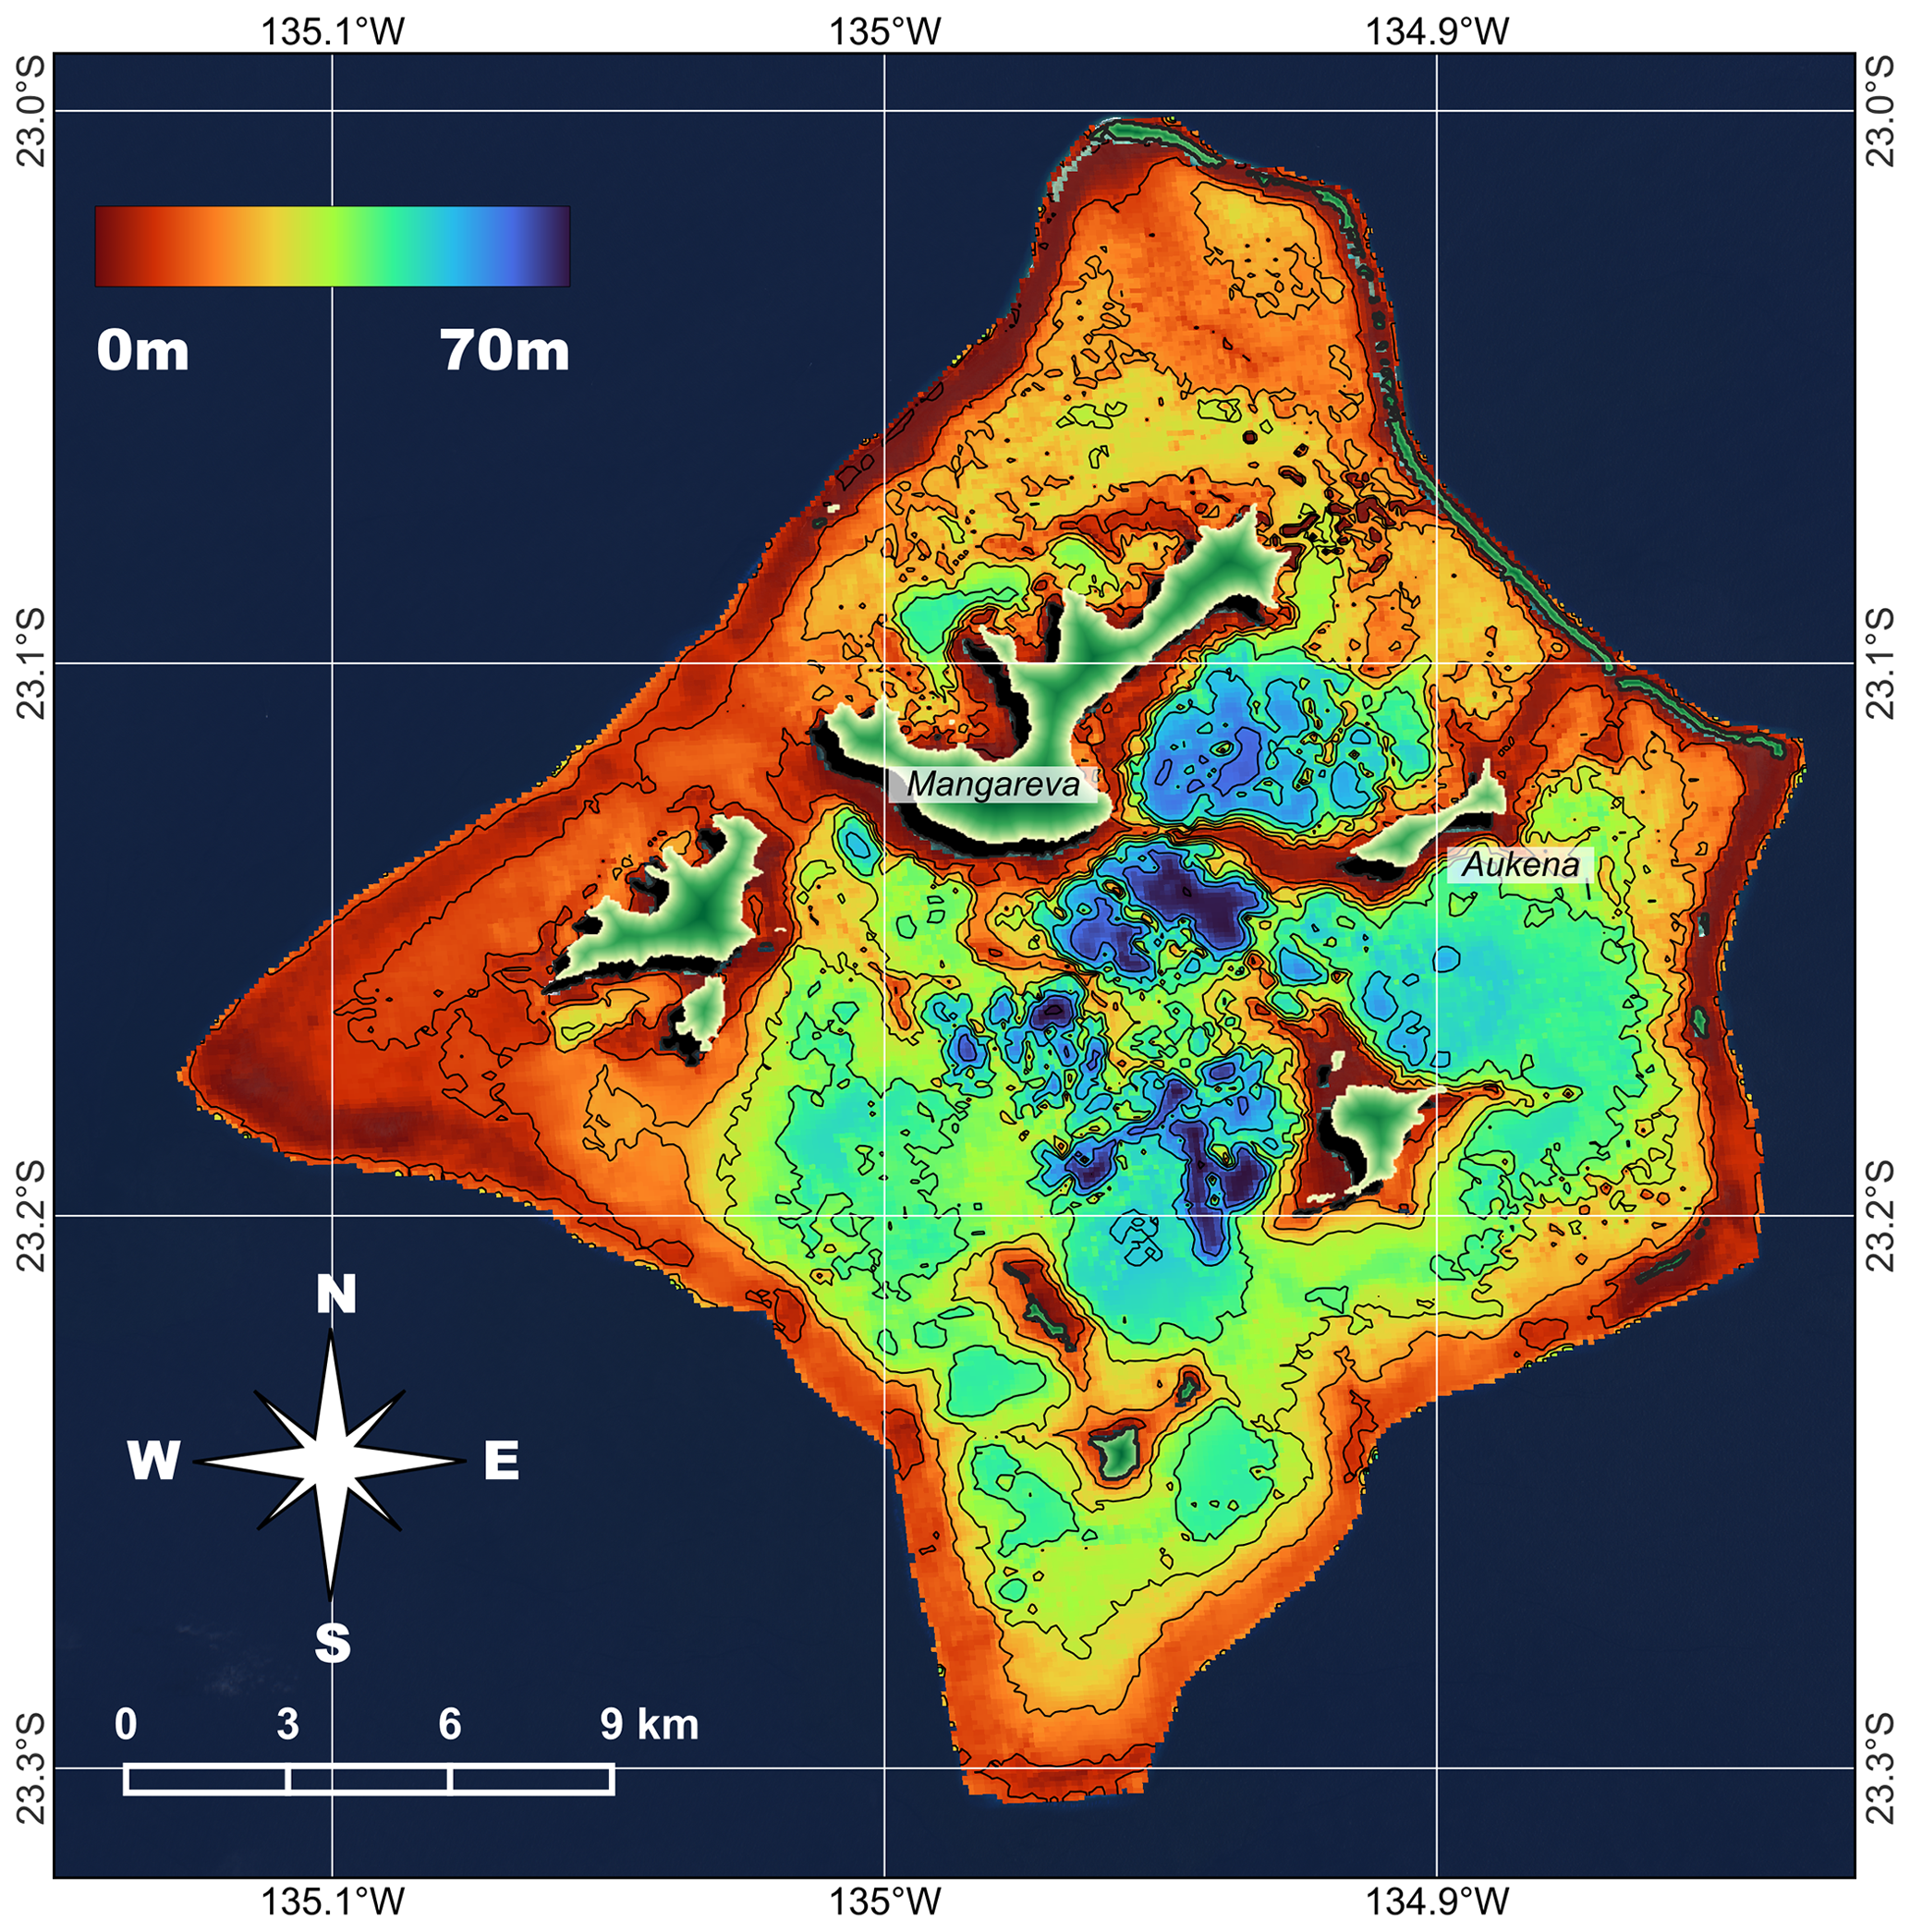
Figure 2Bathymetry map of the Gambier lagoon at 100 m resolution. The inset shows the Rikitea sub-lagoon, a key spat collection location for local pearl farmers.
Accurate bathymetric data at high spatial resolution are needed to model the Gambier lagoon hydrodynamic with realism. The French Hydrographic and Oceanographic Service (SHOM) previously collected point bathymetric soundings at high density but not everywhere in the lagoon. To fill the gaps, in 2020 the Direction des Ressources Marines (DRM) of French Polynesia funded a multi-beam bathymetric survey wherever a small vessel could navigate. To fill the last gaps remaining in the northern shallow lagoon and south-western shallow reef flats, all available in situ soundings trained a satellite-derived bathymetry computed from 10 m spatial resolution Sentinel-2 MSI MultiSpectral Instrument imagery following the method described by Amrari et al. (2021). For the hydrodynamic model, a final bathymetric grid at 100 m resolution was produced by merging the in situ and satellite-derived bathymetry data and resampling it at 100 m resolution (Fig. 2). This model resolution was deemed suitable for our purpose following our experience in atoll model development, but it was also confirmed by a recent sensitivity analyses study in other coastal environments (Ward et al., 2023). Previous bathymetric work using Landsat MSS noisy data at 80 m spatial resolution was described by Pirrazoli et al. (1984), but data are not available and the results could not be evaluated or used.
The Gambier lagoon has a surface area of approximately 500 km2. Mean and maximum depths are 24.5 and 71 m deep respectively. The lagoon is geomorphologically complex, with several deep basins, deep reticulated structures, patch reefs at various depths, and shallow sills and reef flats. Of interest is the Rikitea sub-lagoon that faces on its west side the Rikitea Village of Mangareva (main inhabited island). It is bordered on the south by Aukena Island and a shallow reef flat, and on the north side by several large pinnacles separated by deep channels (Fig. 2, insert). Finally, its eastern part is bounded by the semi-continuous emerged barrier reef. A deep basin reaching a depth of 70 m is present in the central region of Rikitea lagoon. This sub-lagoon is a priority study site because it is the main spat-collecting site for local pearl farmers.
Meteorological conditions
Meteorological conditions are recorded by Météo France weather station, which is set on the south-east of Mangareva Island (Fig. 4), at an altitude of 91 m (Laurent and Maamaatuaiahutapu, 2019). It measured wind speeds and directions in hourly time steps. However, the station can be influenced by local orographic effects (Laurent and Maamaatuaiahutapu, 2019). For this reason, we decided to use reanalysis data from the ERA5 model (Hersbach et al., 2020) (Fig. 3). Data were extracted in a single location inside the lagoon ( S– W) for the period June 2019 to February 2020 to match the instrument deployment period (Fig. 4).
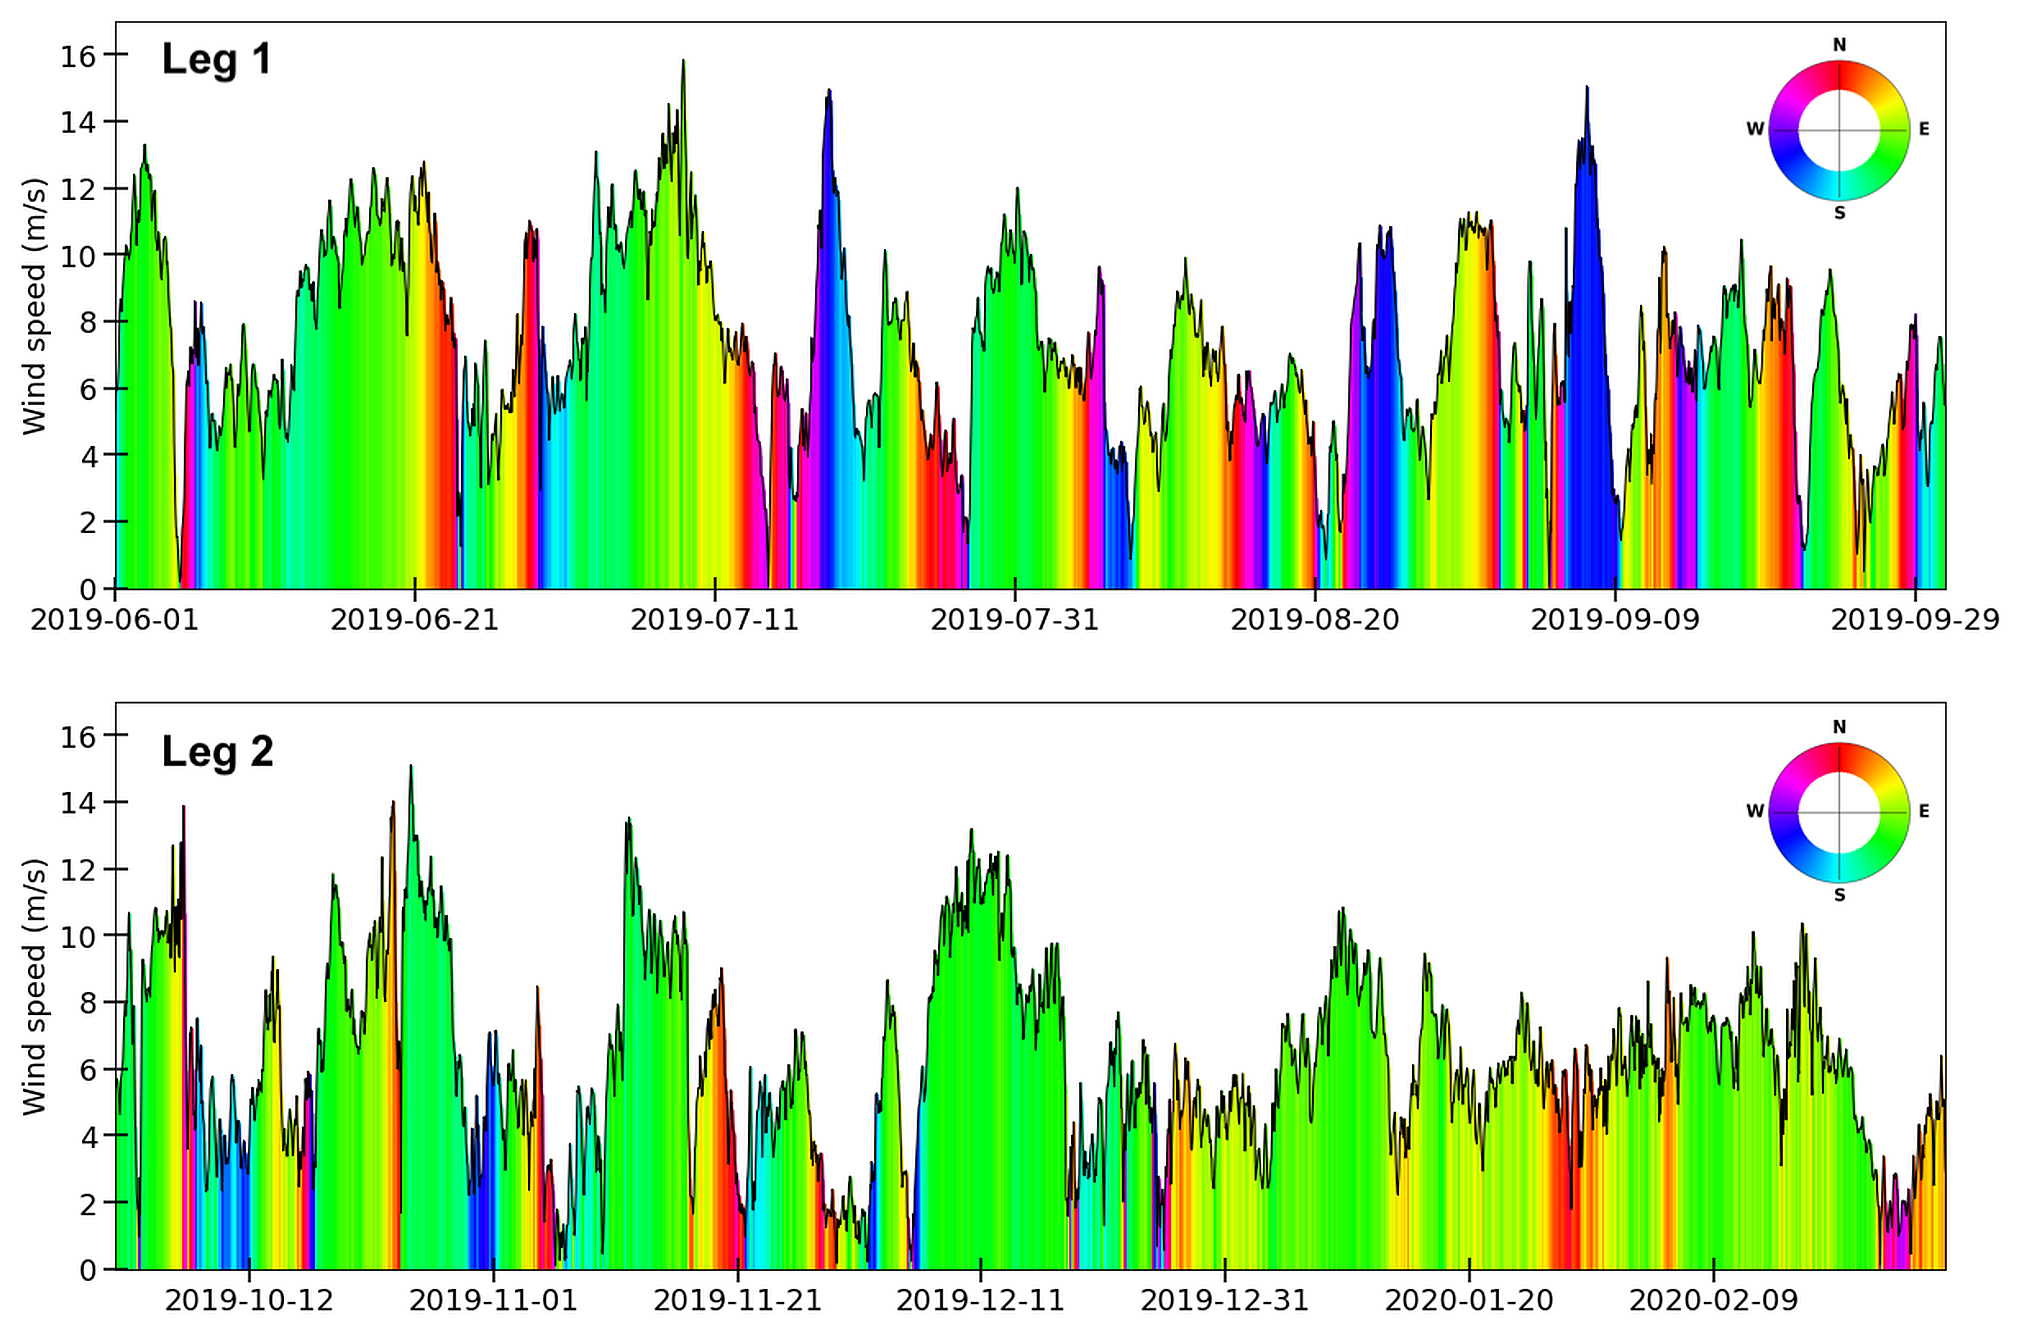
Figure 3Wind speeds (black line) and directions (polar legend) from ERA5 reanalysis were extracted inside the Gambier lagoon during Leg1 and Leg2 deployments. Wind directions follow meteorological convention (i.e., angles show where the wind is coming from).
Wind conditions observed during Leg1 are dominated by strong and short periods of SW winds probably related to local wind wave events. Conversely, Leg2 is dominated by trade wind (E to SE winds) with several SE wind events above 10 m s−1.
The sampling strategy mostly focused on the northern part of the Gambier lagoon, and especially the Rikitea lagoon (Fig. 4). The sampling was aimed at characterizing the inward–outward flows from the three boundary sectors, in the north, south-east, and south orientations (Bruyère et al., 2023a). Beyond the Rikitea lagoon, the sampling also targeted the different sections of the barrier reef, with a different exposition in order to characterize the incoming waves. Eventually, 16 locations (or stations) were equipped with at least one oceanographic instrument measuring temperature (SBE56), temperature/pressure (RBRduet T.D), current direction, and speed (ADCP, Aquadopp and Marotte HS). Instruments were moored between June 2019 and February 2020.
Observations were separated into two distinct legs (Leg1 from June 2019 to October 2019 and Leg2 from October 2019 to February 2020). At the beginning of Leg1, the sampling strategy included:
-
Measuring the vertical temperature variability and potential stratification, four lagoon stations (L01, L02, L03, L04) are coupled with three instruments (two SBE56 and one RBRduet T.D): the two SBE56 were moored at depths of approximately 20 and 2 m and the RBRduet T.D at mid-depth (7–8 m). The spatial replication in four stations allowed the lagoon heterogeneity to be measured.
-
Measuring the incident wave parameters, five RBRduet T.D were positioned (significant wave height, mean wave period and peak frequency), water elevation, surges and temperature in five locations (O01 to O05) on outer forereef sections, each with a different orientation and exposure. Instruments were moored in about 10 m of water.
-
To monitor current speeds and directions, three low-cost Marotte HS loggers were deployed in P01 to P03 on shallow reef flats. P02 and P03 monitored water entries into and from the Rikitea lagoon through the Mangareva and Aukena reef flat passage (P02), and in the north of Aukena Island (P03).
All instruments were retrieved at the end of Leg1 in late October 2019, allowing data to be downloaded, batteries to be changed, probes to be cleaned and the mooring component to be checked. At the beginning of Leg2, this initial set-up was enlarged with six current profilers (four ADCPs and two Aquadopp) to measure current speeds and directions in strategic locations, namely the three open sides of the Rikitea sub-lagoon (ADCP_1 in the north, Aqua1 in the south and Aqua 2 in the east), the western deep pass (ADCP_3), the southern channel (ADCP_4) and a location of the western lagoon close to farming sites (ADCP_2). The two Aquadopp were coupled with Marotte HS loggers previously moored in P02 and P03 shallow stations to compare the agreement between records from different sensor types and to provide more robust observations with profiles of the water column.
A detailed list of moored instruments is presented in Table 1 detailing instrument model, geographic positions, depth of deployment, sampling frequencies, dates of measurement, and physical parameters measured. Note that Bruyère et al. (2023b, Fig. 8) shows photographs of the same instruments when installed on atolls.
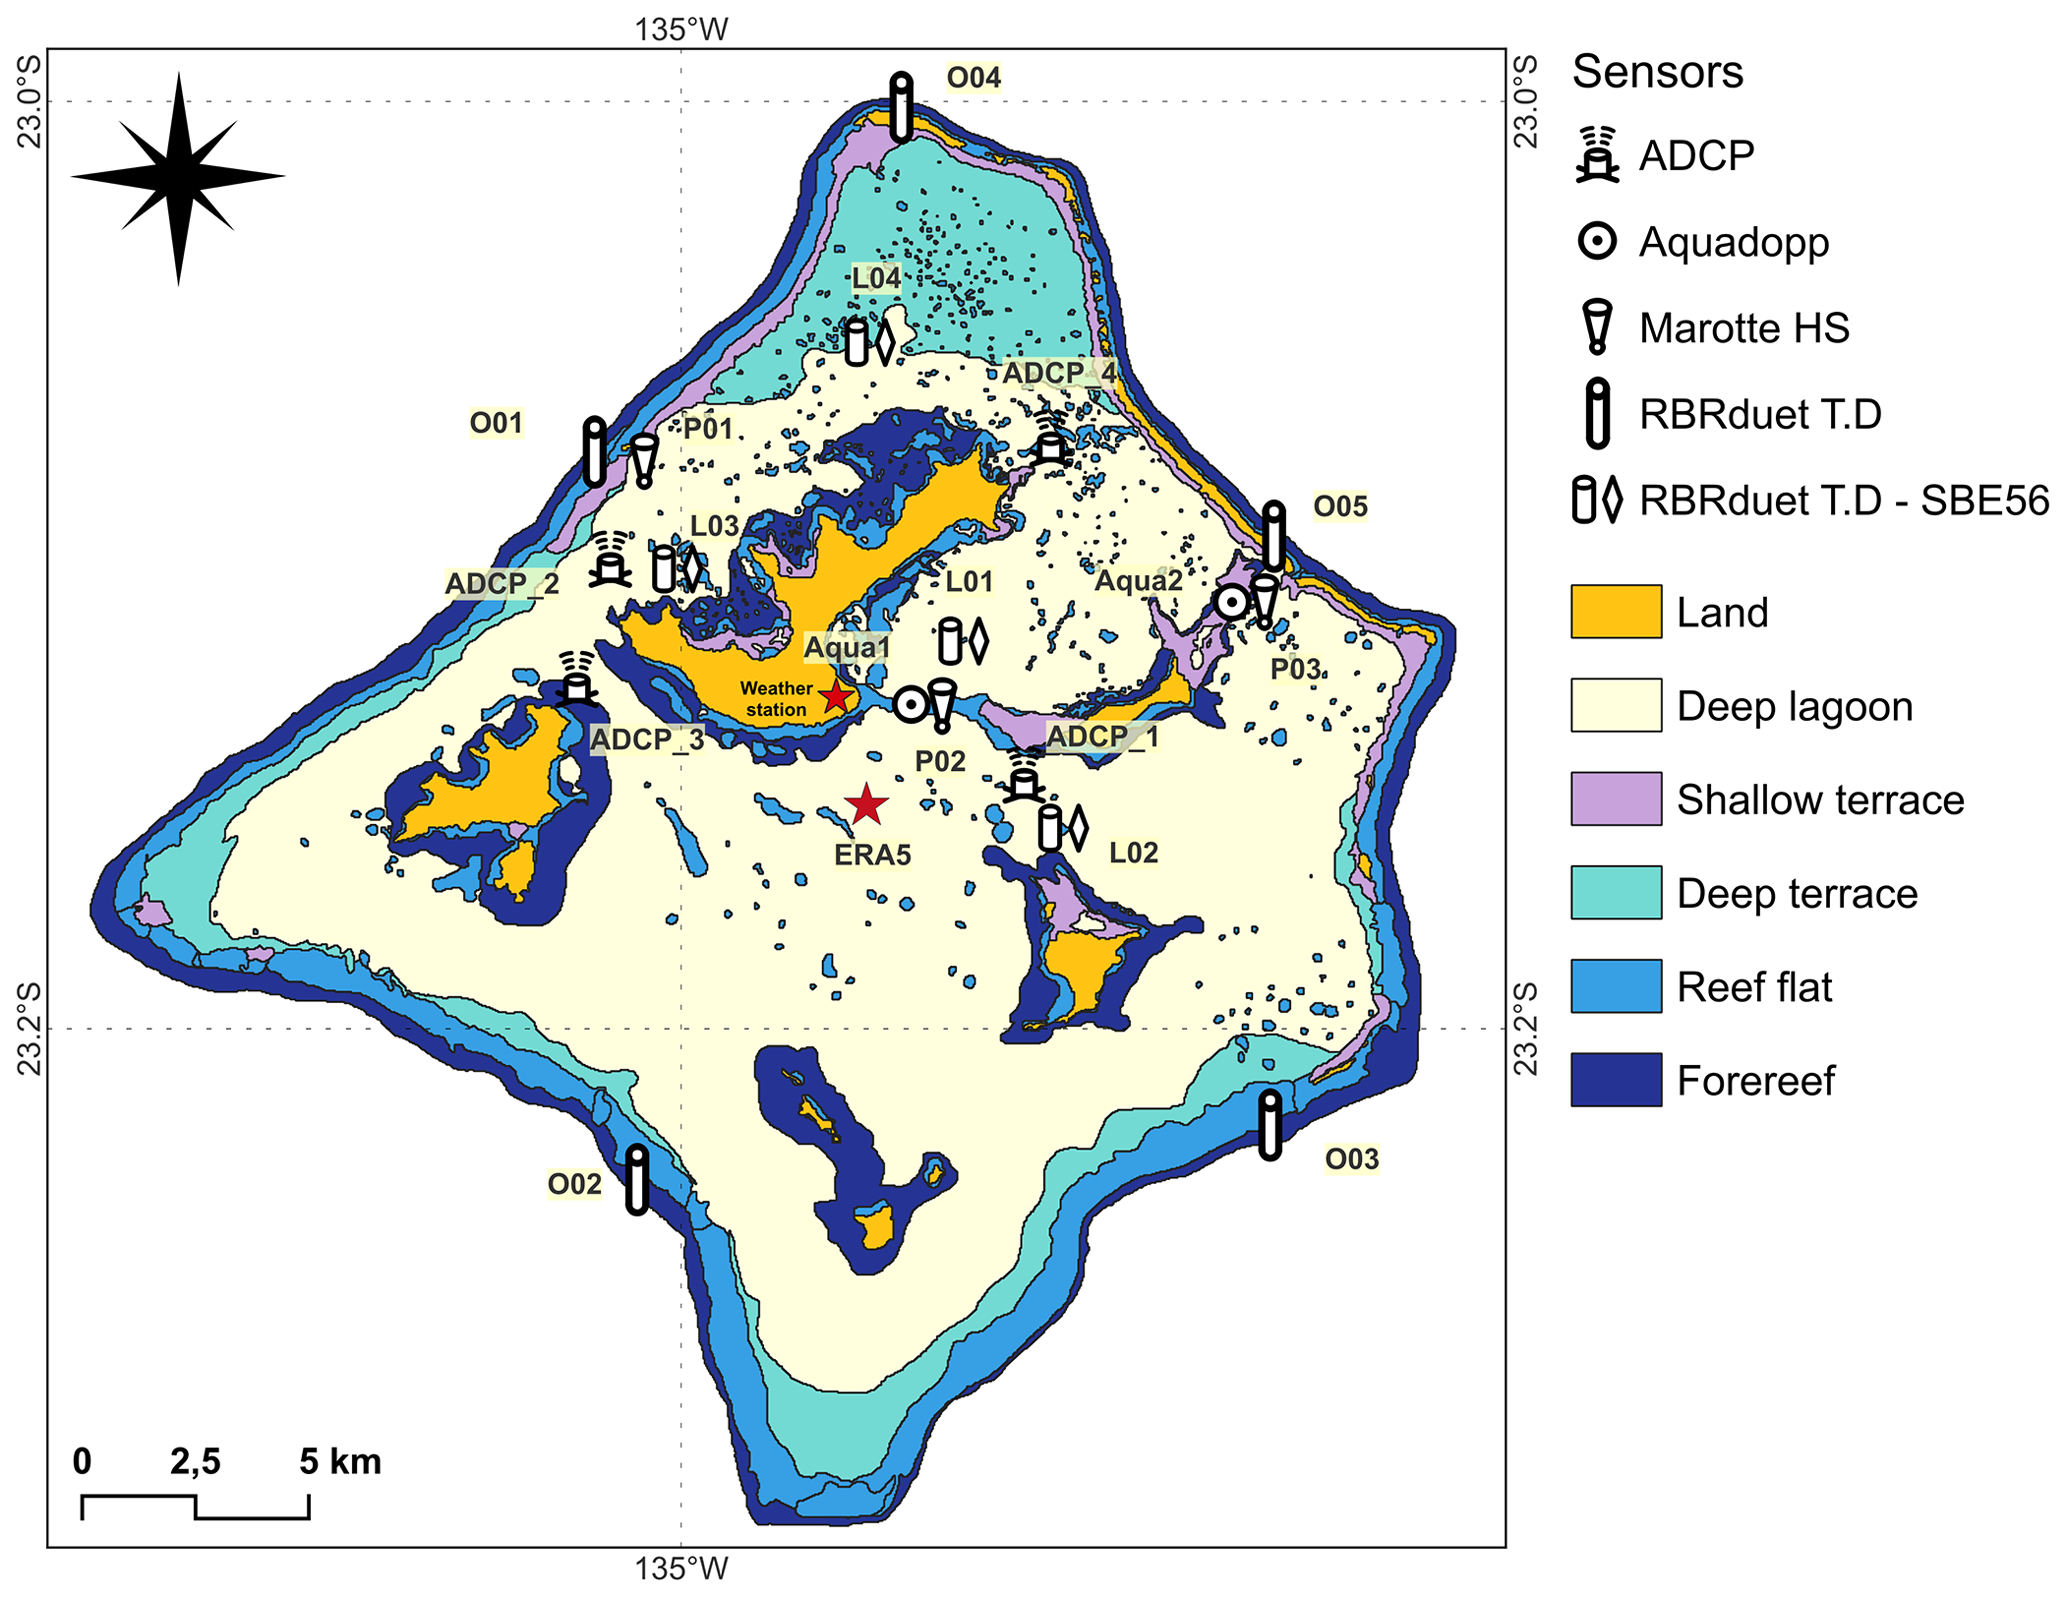
Figure 4Sampling strategy deployed during the Gambier surveys. ADCP: Acoustic Doppler Current Profiler. Background map from the Millennium Coral Reef Mapping Project (Andréfouët and Bionaz, 2021). The red stars represent the point for which ERA5 reanalysis model data are extracted and the location of the weather station
Table 1Detailed list of instruments moored at the Gambier lagoon.
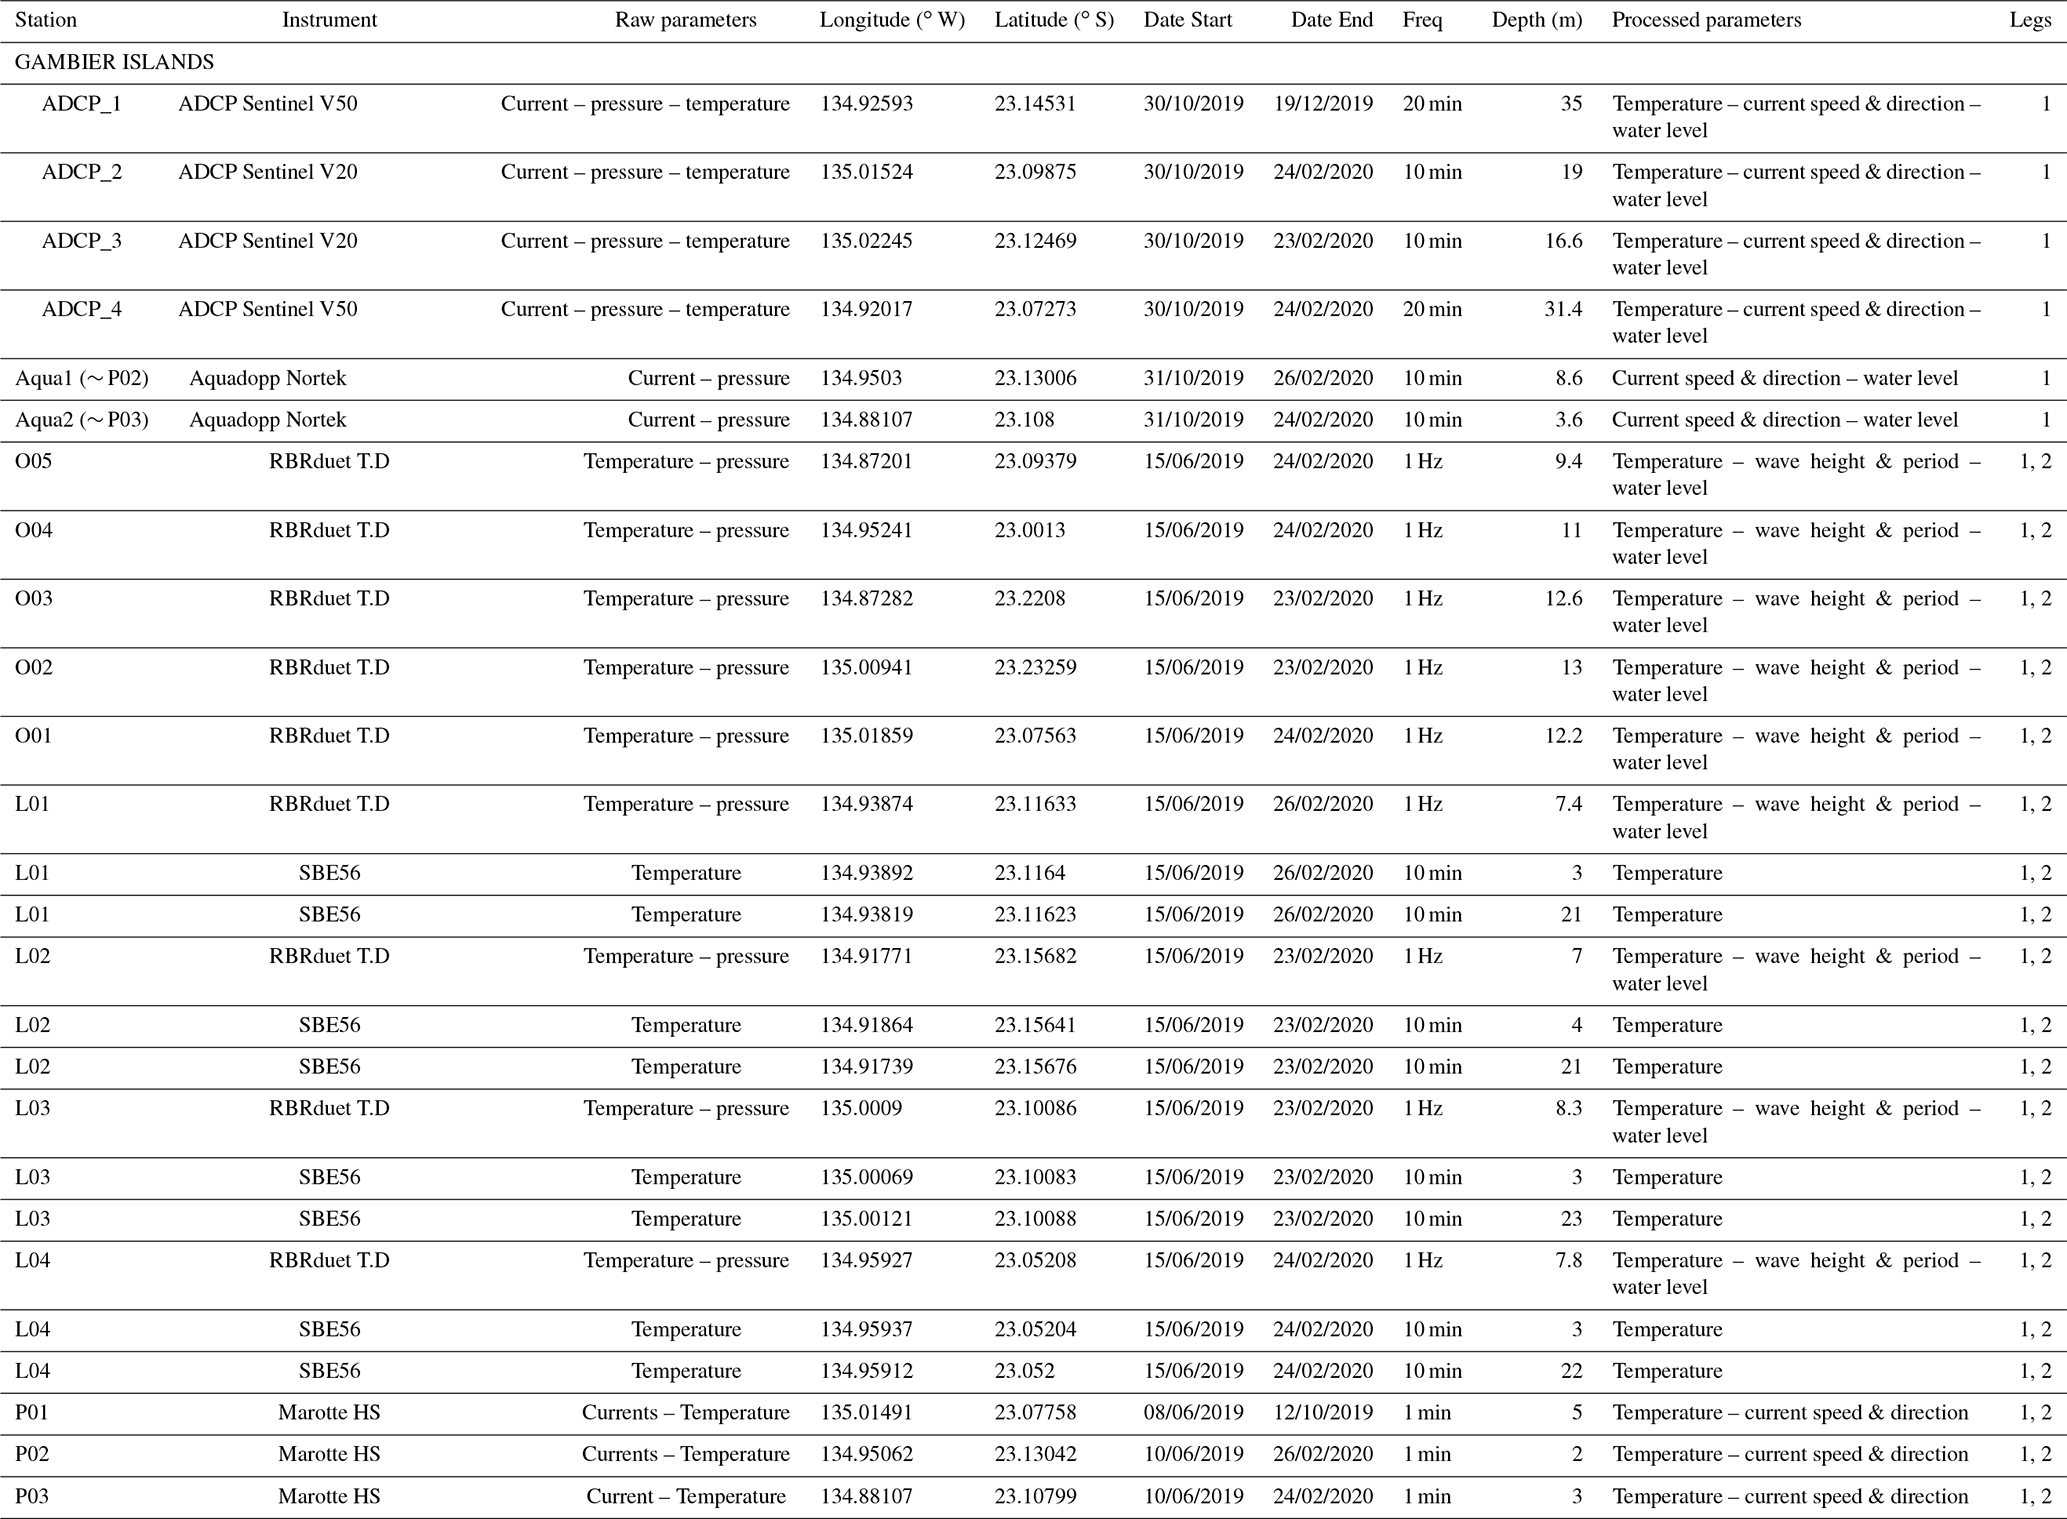
Hereafter, we present the five autonomous coastal oceanographic instruments measuring currents, temperature, and pressure used for the Gambier campaigns. Instruments were moored by SCUBA on the sea floor and secured on dedicated structure ensuring the data logger stability. Compact loggers were placed inside PVC cylinders and current profilers were protected with electrical tape to ease the removal of biological fouling. The settings were a compromise between measurements range and accuracy in the deployment environment.
Raw data were downloaded using manufacturer's software, and processed with standard Python libraries in order to generate NetCDF files. In terms of data accessibility, most of the software employed for data access supports CSV conversion, simplifying the processing. However, for the RBR instrument, a specific package called “pyrsktools” was necessary to read the dataset, and this library is provided by the manufacturer. To process the RBR instrument data, we employed the script outlined in Aucan et al. (2017). Last, for data conversion, we utilized the NetCDF4 package.
Global Attributes in NetCDF files provide details about the station (depth, geospatial coordinate), instrument settings (sampling frequency, serial number), contacts, and project references as well as any necessary additional comments useful for data users. However, specific processing steps required for some datasets are presented hereafter.
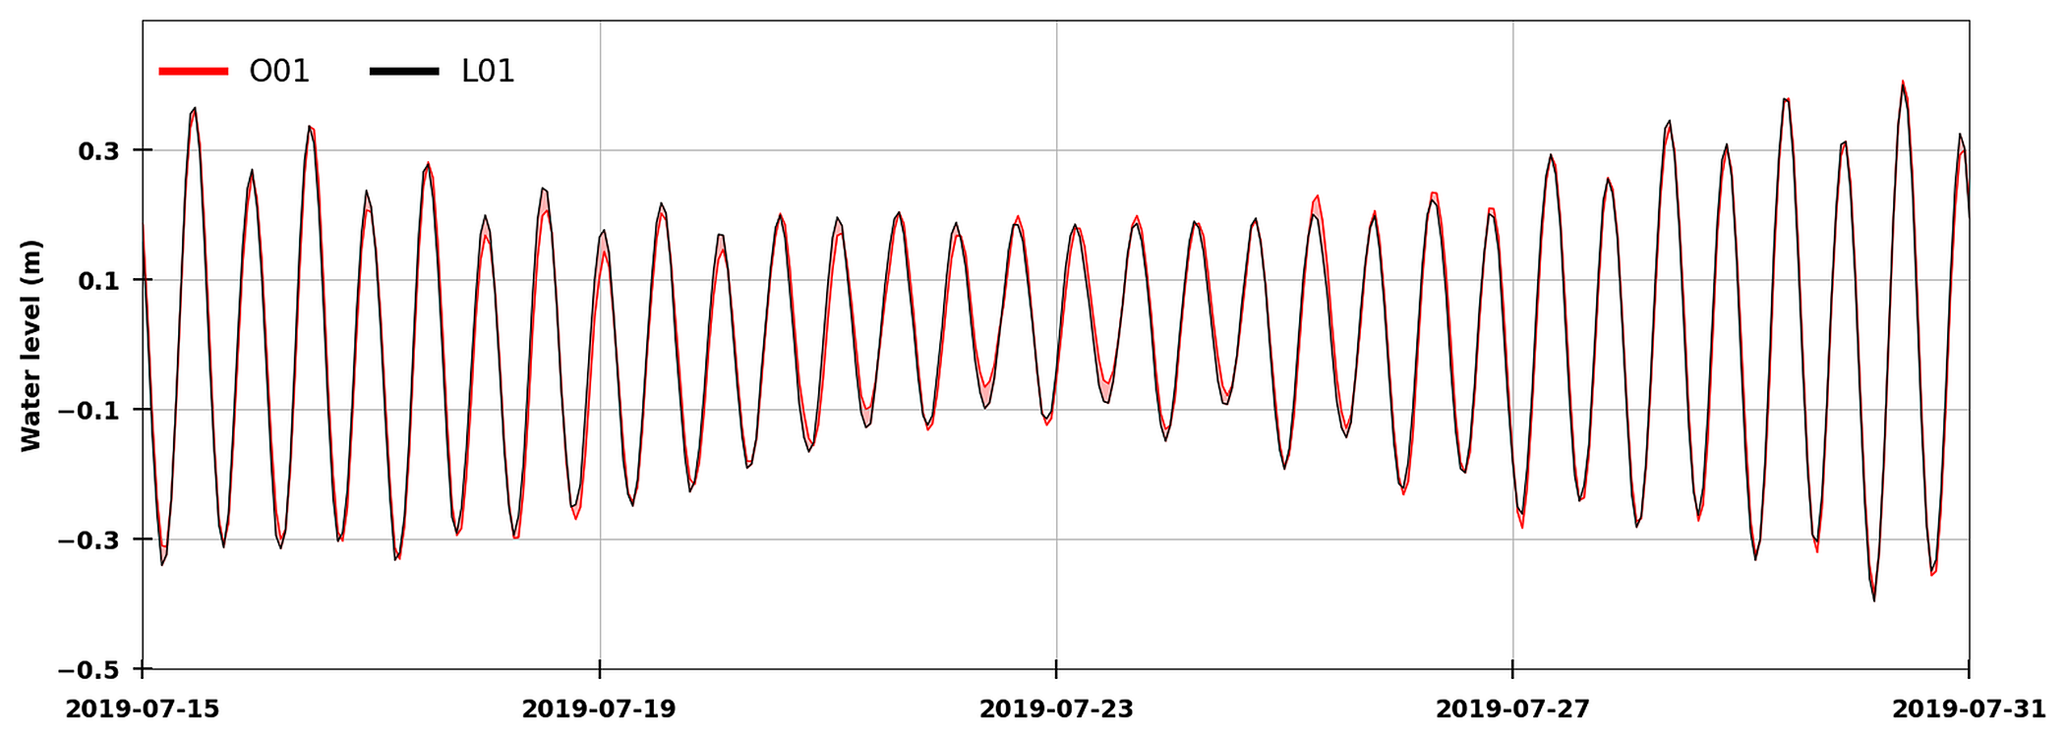
Figure 5Tide signals recorded with RBRduet T.D on forereef (station O01) and inside lagoon (station L01) during Leg1.
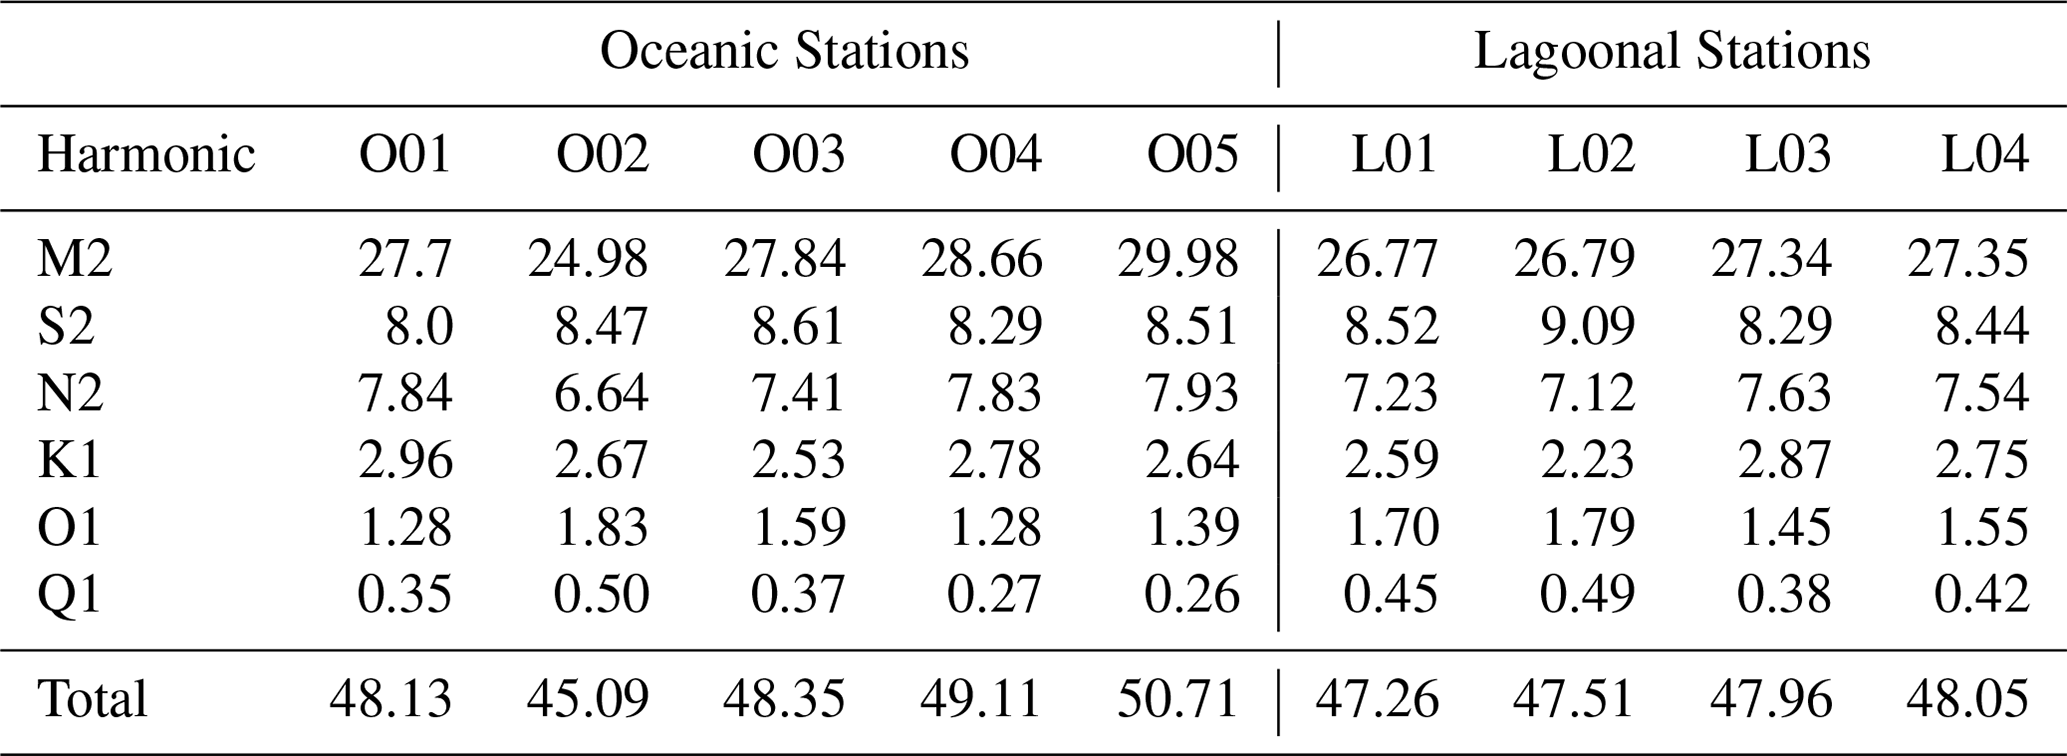
Table 2Comparison of principal harmonic amplitude (cm) measured during Leg1 between oceanic station (O01, O02, O03, O04, O05) and lagoonal stations (L01, L03, L02, L01).
4.1 RBRduet T.D
The RBRduet T.D sensor (RBR Ltd) is a compact logger ideal for long-term deployments and for providing measurements of temperature and pressure at high frequency. This instrument was moored on external reef slopes or inside the lagoon. Five loggers were anchored at a depth of between 9 and 13 m on five distinct sides of Gambier Islands (north-east, north, north-west, south-west, and south-east) to measure the incident waves reaching the reef crest. Post-processing provides significant wave height, mean wave period, and peak frequency. Inside the lagoon, four RBRduet T.D were moored at around 7–8 m to measure the water level and to deduce surge signals. For each station, a data logger was set-up to measure at 1 Hz intervals.
Pressure data were corrected from a constant atmospheric pressure value set to 1.01325 bar in order to avoid the influence of changes in weather conditions. To deduce wave parameters (significant wave height, peak frequency, and mean wave period), data were filtered using the Fourier transform to acquire a pressure spectrum (within the range 3–25 s). Then, the methods referenced in Aucan et al. (2017), also used in Aucan et al. (2021) and Andréfouët et al. (2023a), were applied using the linear wave theory with a homogenous cut-off frequency (set to 0.33) to filter the high- frequency spectrum. To calculate the water level, depth measurements were subtracted from the mean sea level (long-term depth-average of the temporal series). As a result, two output files were created, one at 1 h resolution containing wave parameters and another file at 1 min frequency with temperature and water level.
4.2 SBE56
High accuracy (±0.002 ∘C) temperature data were recorded with SBE56 sensors designed by SEABIRD Electronics Inc. Instruments. These sensors were placed in each lagoon station at depths of approximately 2 and 20 m in order to detect vertical temperature stratification. The start time and configuration of all instruments were identical. The measurement interval was set to record every 1 min. Raw data did not need a processing stage and were directly converted into NetCDF files.
4.3 Current profilers
The ADCPs used during the Leg2 are of two types: the ADCP Sentinel V from Teledyne RD Instruments Inc. (TRD-I) and the Nortek Aquadopp current profiler with pressure sensor. Both instruments were bottom mounted, fixed on the nonmagnetic aluminum frames provided by the constructors, and faced upward (see photographs in Bruyère at al., 2023a, Fig. 8).
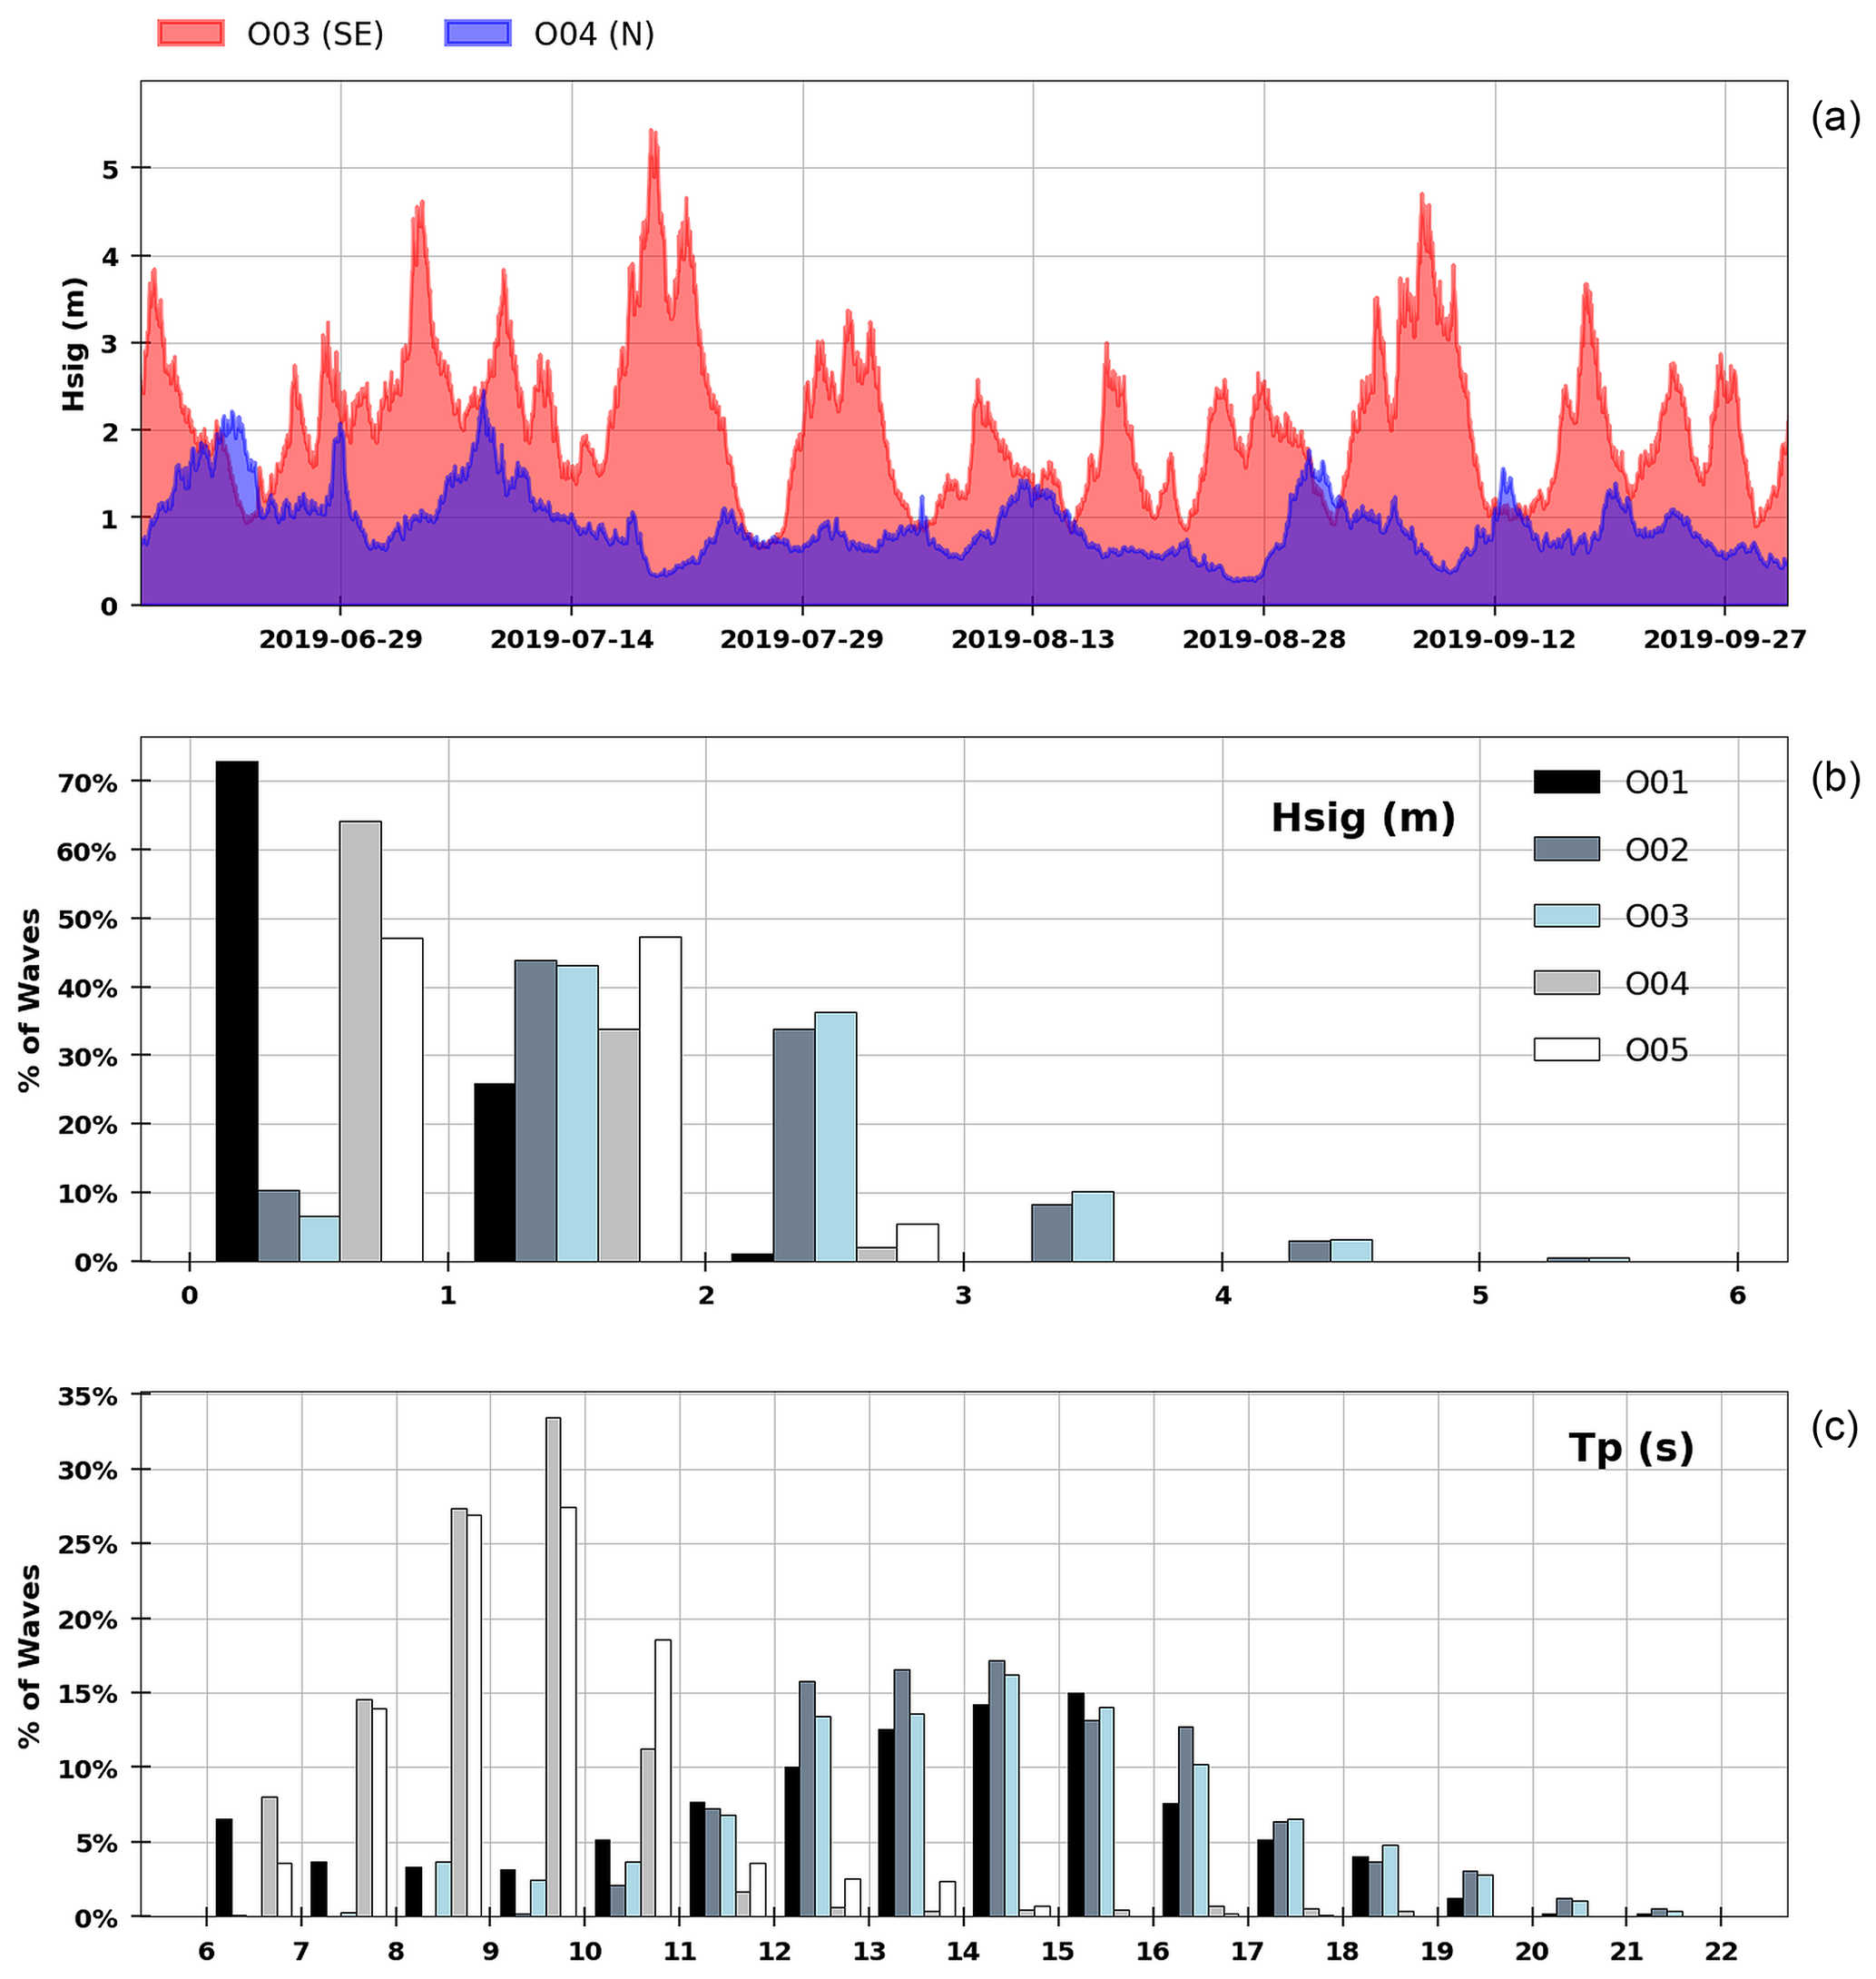
Figure 6(a) Time series of significant wave height (Hsig) recorded at 1 h time steps for O03 (south-east side) and O04 (north side) stations during Leg1. (b) Percentage of occurrence (%) of wave height class between 0 and 6 m height, measured on the five oceanic stations from 16 June to 1 October 2019. (c) Percentage of occurrence of peak period class between 6 and 22 s.
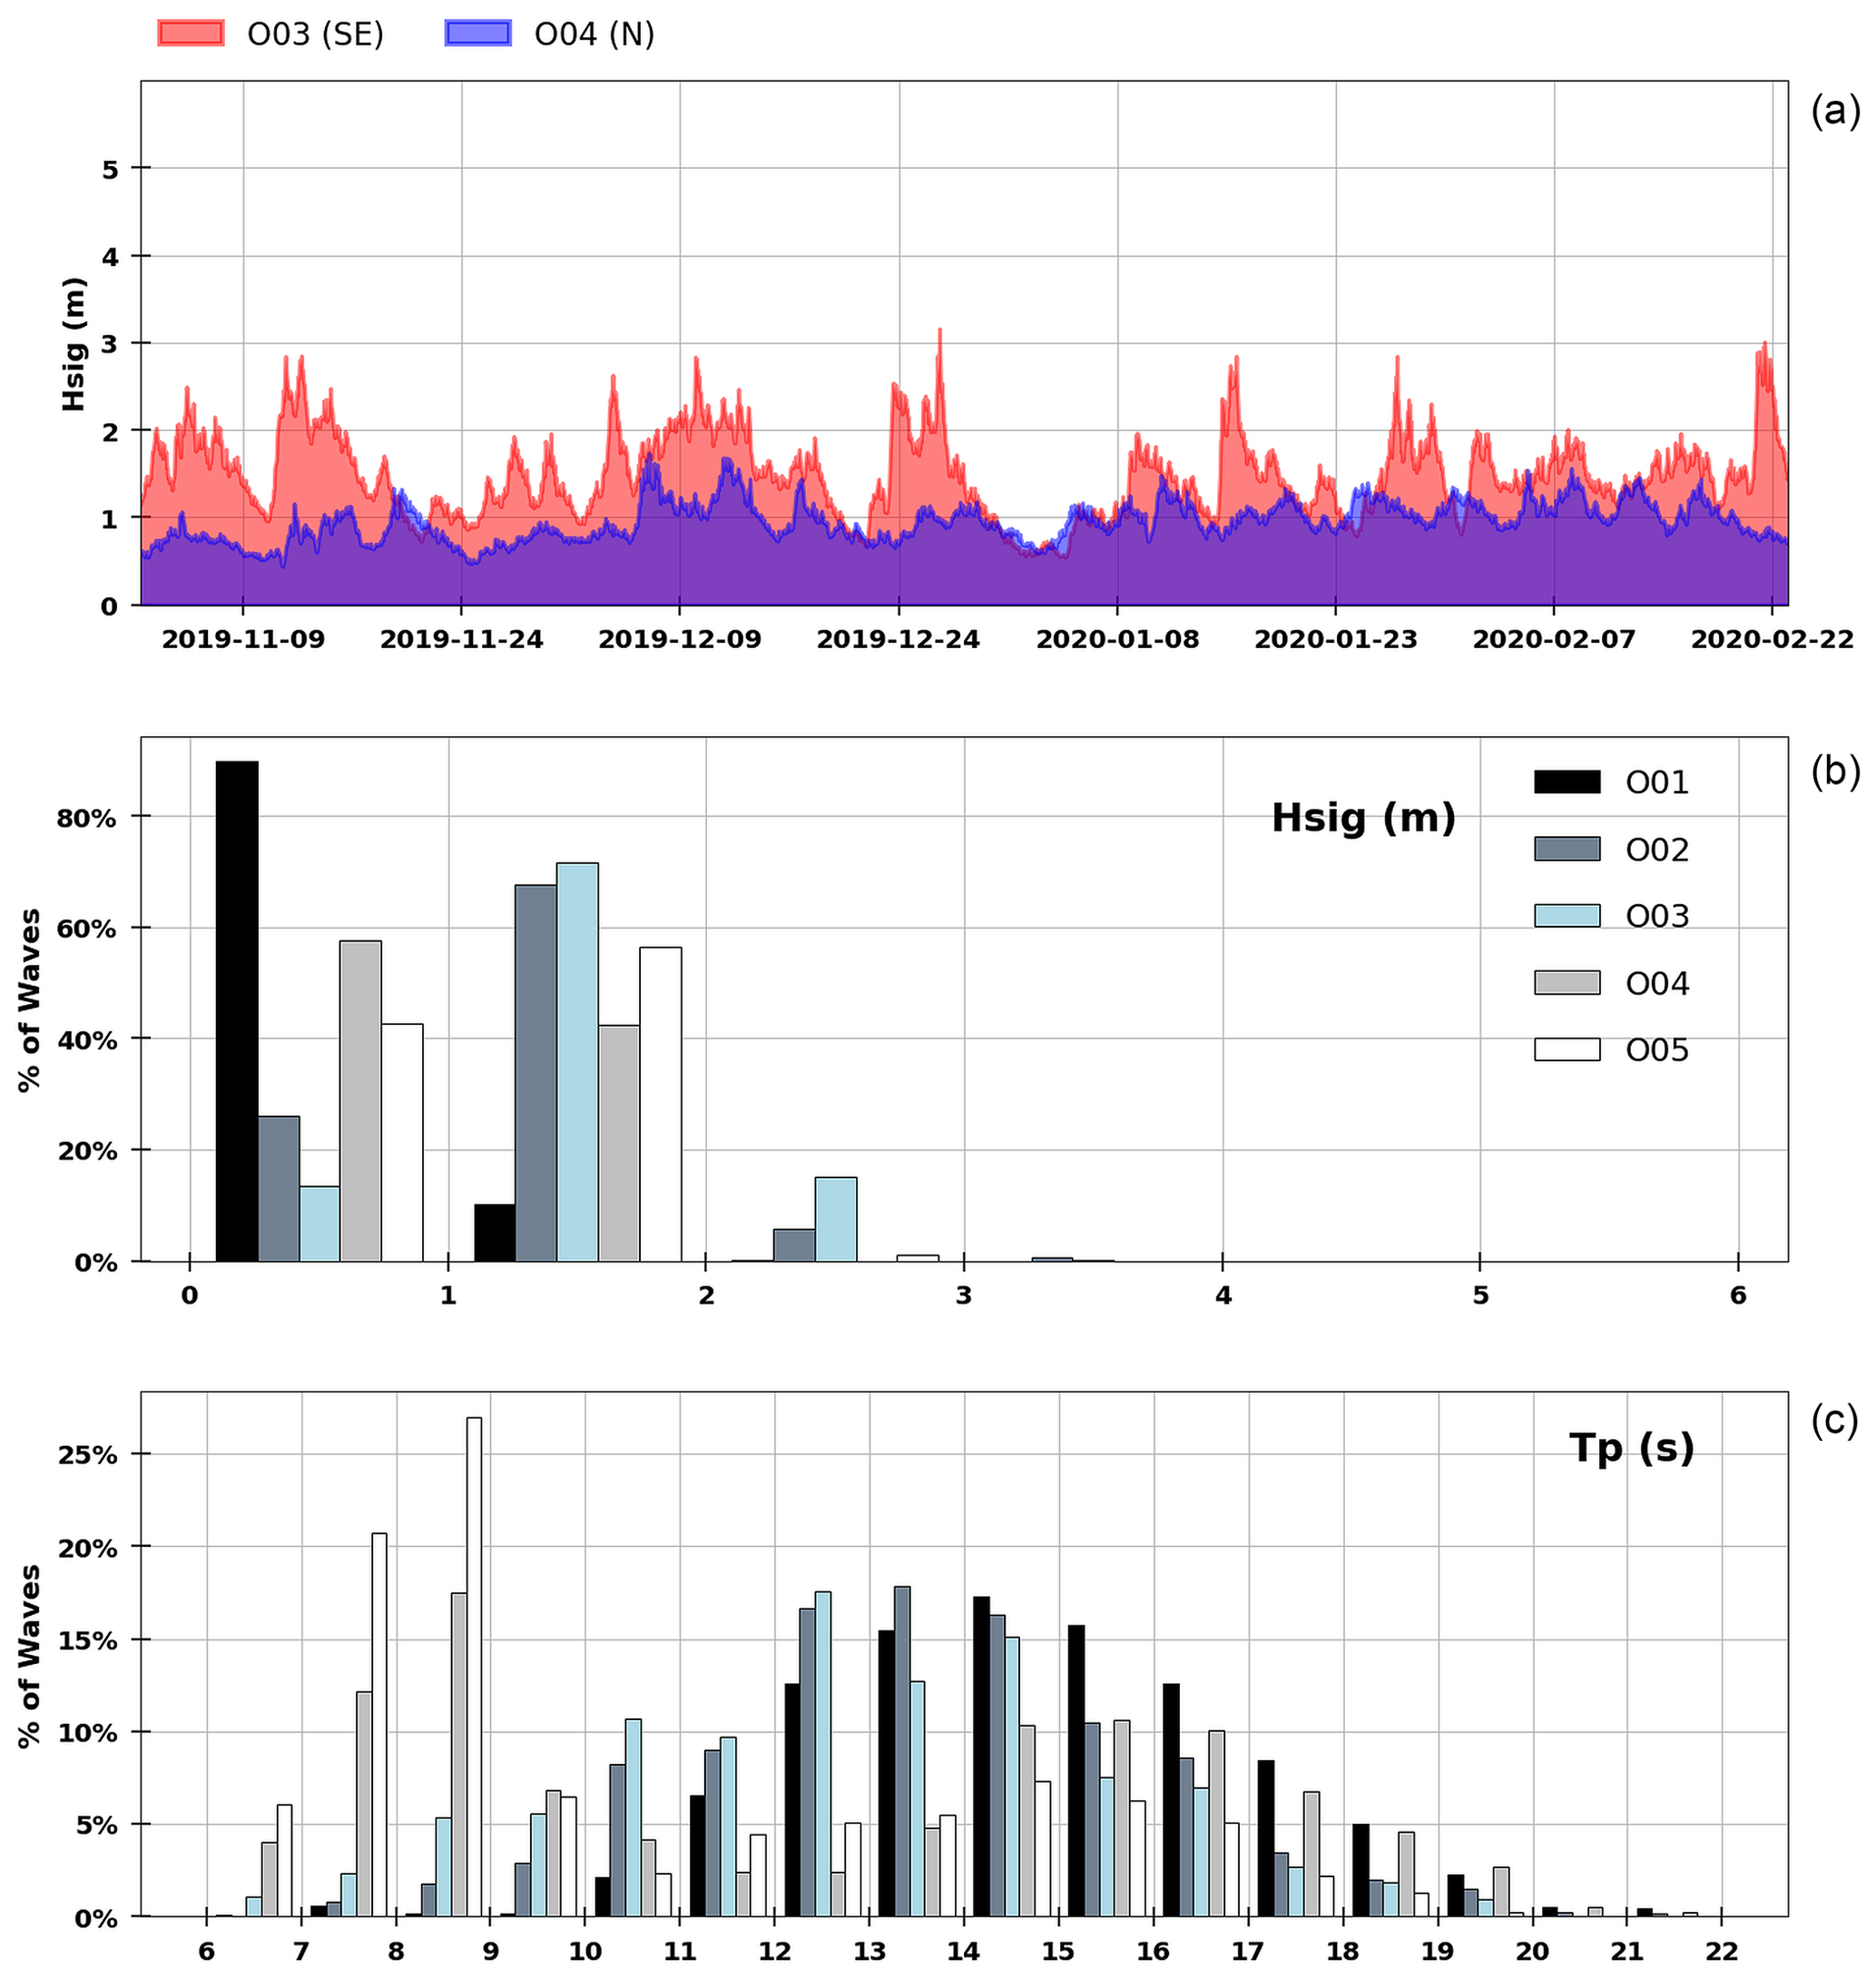
Figure 7(a) Time series of significant wave height (Hsig) recorded at 1 h time step for O03 (south-east side) and O04 (north side) stations during Leg2. (b) Number of occurrences (%) depending on wave height class (between 0 and 6 m height) measured on the five oceanic stations over the period from 2 September 2019 to 23 February 2020. (c) Number of waves (%) according to peak period class (6 to 22 s).
Regarding ADCPs, the two working frequency models Sentinel V50 (500 kHz) and Sentinel V20 (1000 kHz) were used to measure velocity along the water column, and the temperature and pressure at the sensor in its transducer head. ADCPs were set to measure in burst time: the V20 models measured burst each 10 min with 40 pings per ensemble. Conversely, the V50 models were recorded every 20 min with 180 pings per burst. For both models, cell size was fixed to a resolution of 1 m. The ADCPs V20 were moored at depths of 17 and 19 m and the V50s were fixed deeper, at 31 and 35 m.
Aquadopp current profilers (2 MHz version) measured three components (east, north, up) of current velocity data in shallow areas. The instrument settings were set to measure at 600 s burst intervals (10 min), each burst made of three pings. It resolved the entire water column, with a cell size of 50 cm. The ENU coordinate system was systematically used. Instruments were anchored at depths of 3.6 and 8.6 m.
For the current profilers, the near sea-surface cells contaminated by the acoustic sidelobe reflections were removed. Valid bins were then used to retrieve the magnitude and direction of the currents calculated using the zonal (u) and meridional (v) components. Pressure data were converted into depth by subtracting the depth-averaged value across the entire time series of pressure. No barometric correction was applied to depth. Processed profiles data were eventually converted into NetCDF files, which describe data at full resolution (i.e., each bin measurement is available).
4.4 Marotte HS
The Marotte HS drag-tilt current meters manufactured by Marine Geophysics Laboratory of James Cook University allow temperature and uv components to be measured at the level of the instrument within a range of adequate conditions. Each Marotte HS used in Gambier was moored on a bottom structure and set to sample at 1 min intervals. With Python routines, vectors data (u,v) are converted in Clockwise from North convention to be consistent with oceanographic convention, and then speed and direction are deduced. Note that the Marotte HS moored at P01 was lost during Leg1.
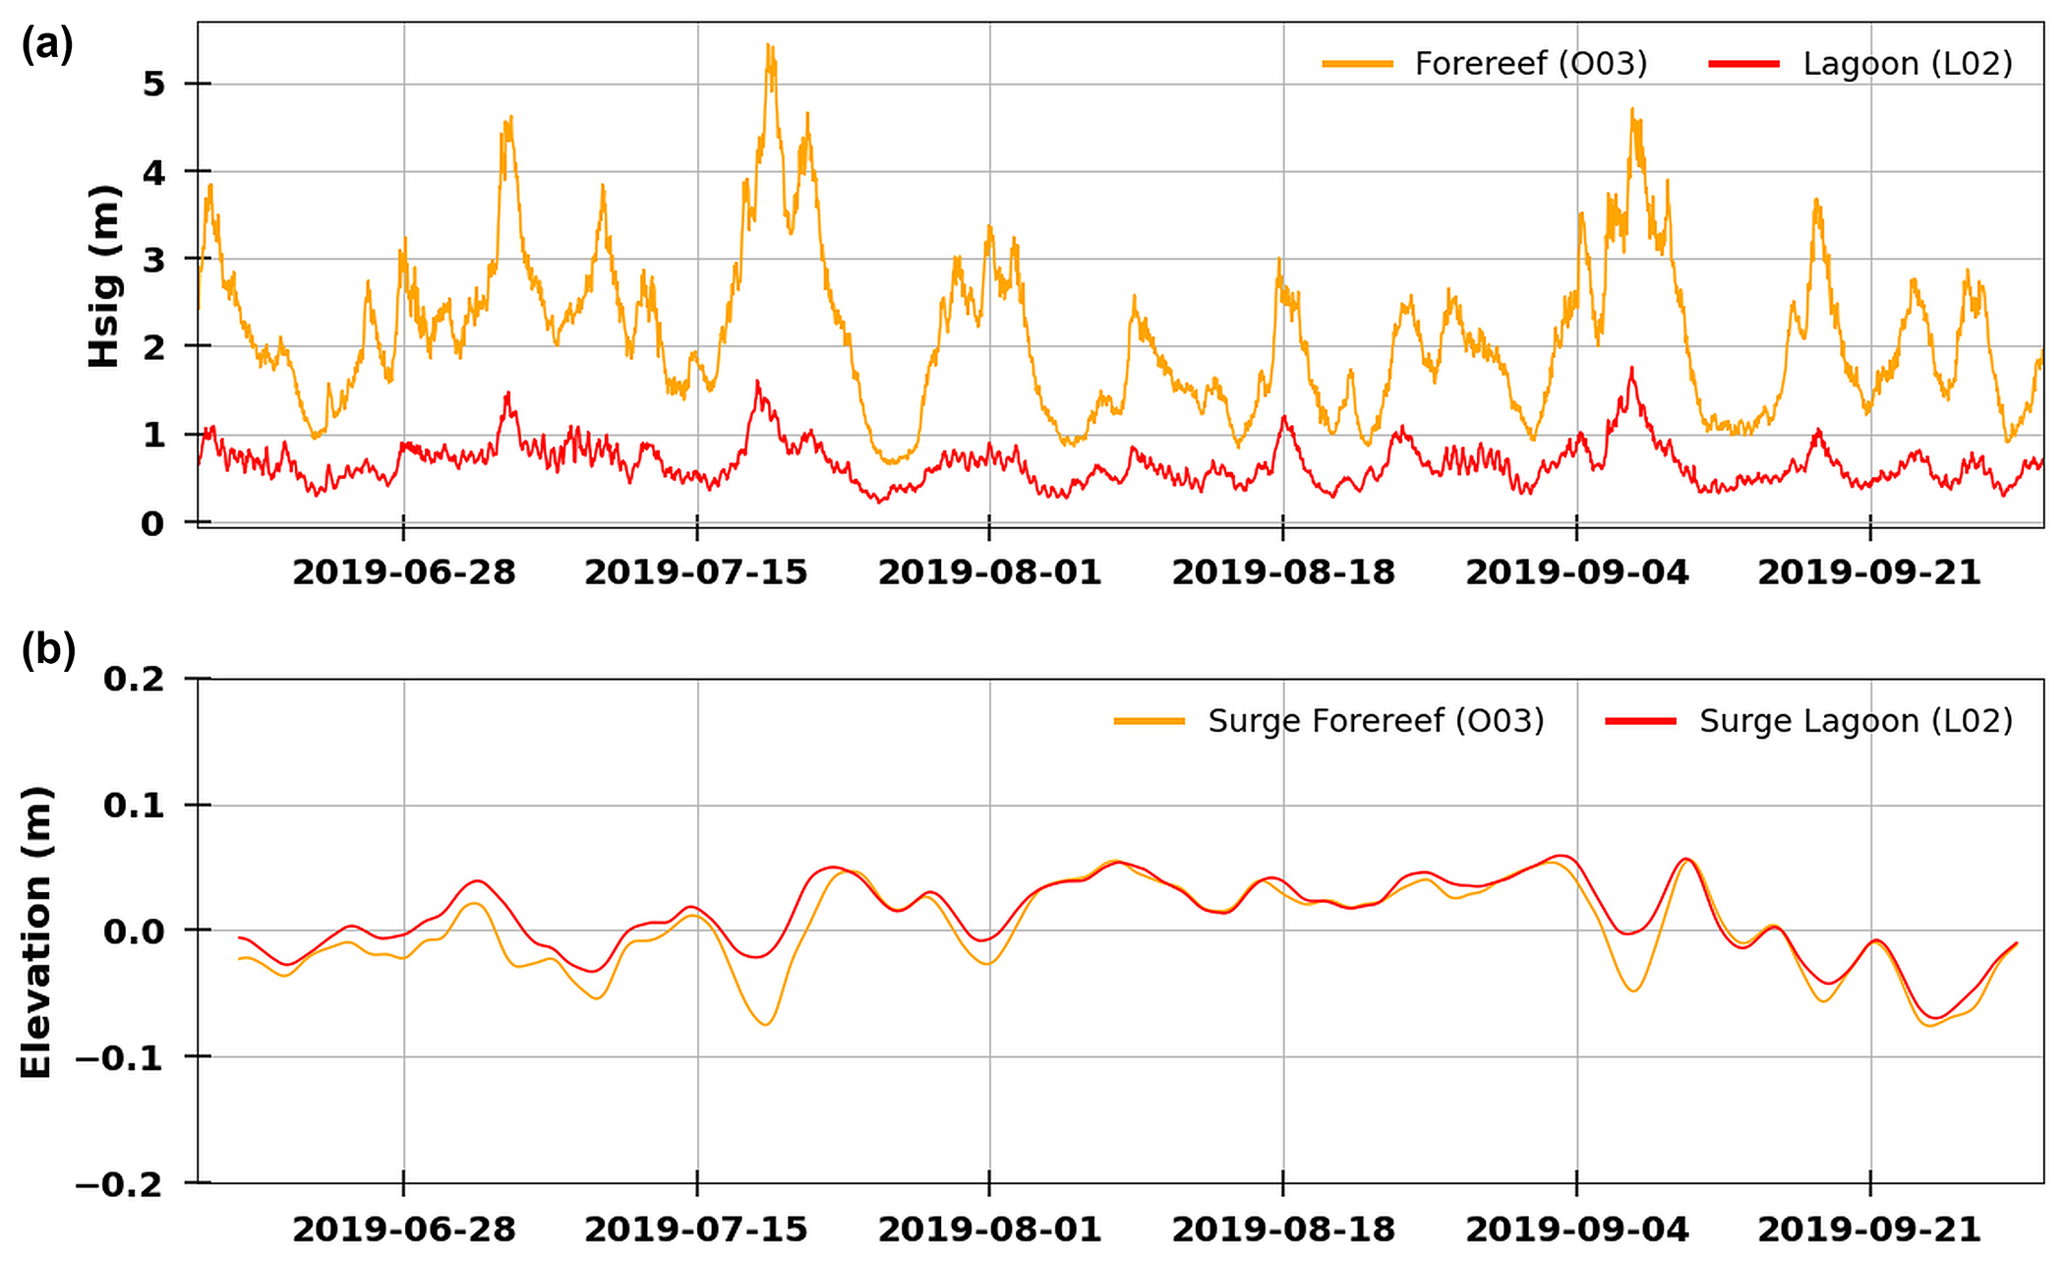
Figure 8Time series of significant wave height measured at O03 and at lagoonal station L02 during Leg1 (a). Surge (m) determined using Demerliac filter at the O03 and L02 stations (b).
4.5 Quality control
The quality control procedure consists of visually checking each time series converted in NetCDF files with Python and Ferret and removing all remaining out-of-water data, or flag anomalies (such as out-of-range data or spikes). With this step, the final correct data coverage is determined and reported in the Global attributes of each processed file.
This section briefly presents selected hydrodynamic features of Gambier lagoons. Measurements have provided water-level variations in the ocean and in the lagoon, incident waves on forereefs, spatial and vertical temperature variations, and finally the depth-averaged current, at a number of strategic locations. Data shown here are complementary to those shown in Bruyère et al. (2023a), which were more specific to the study of the Rikitea sub-lagoon.
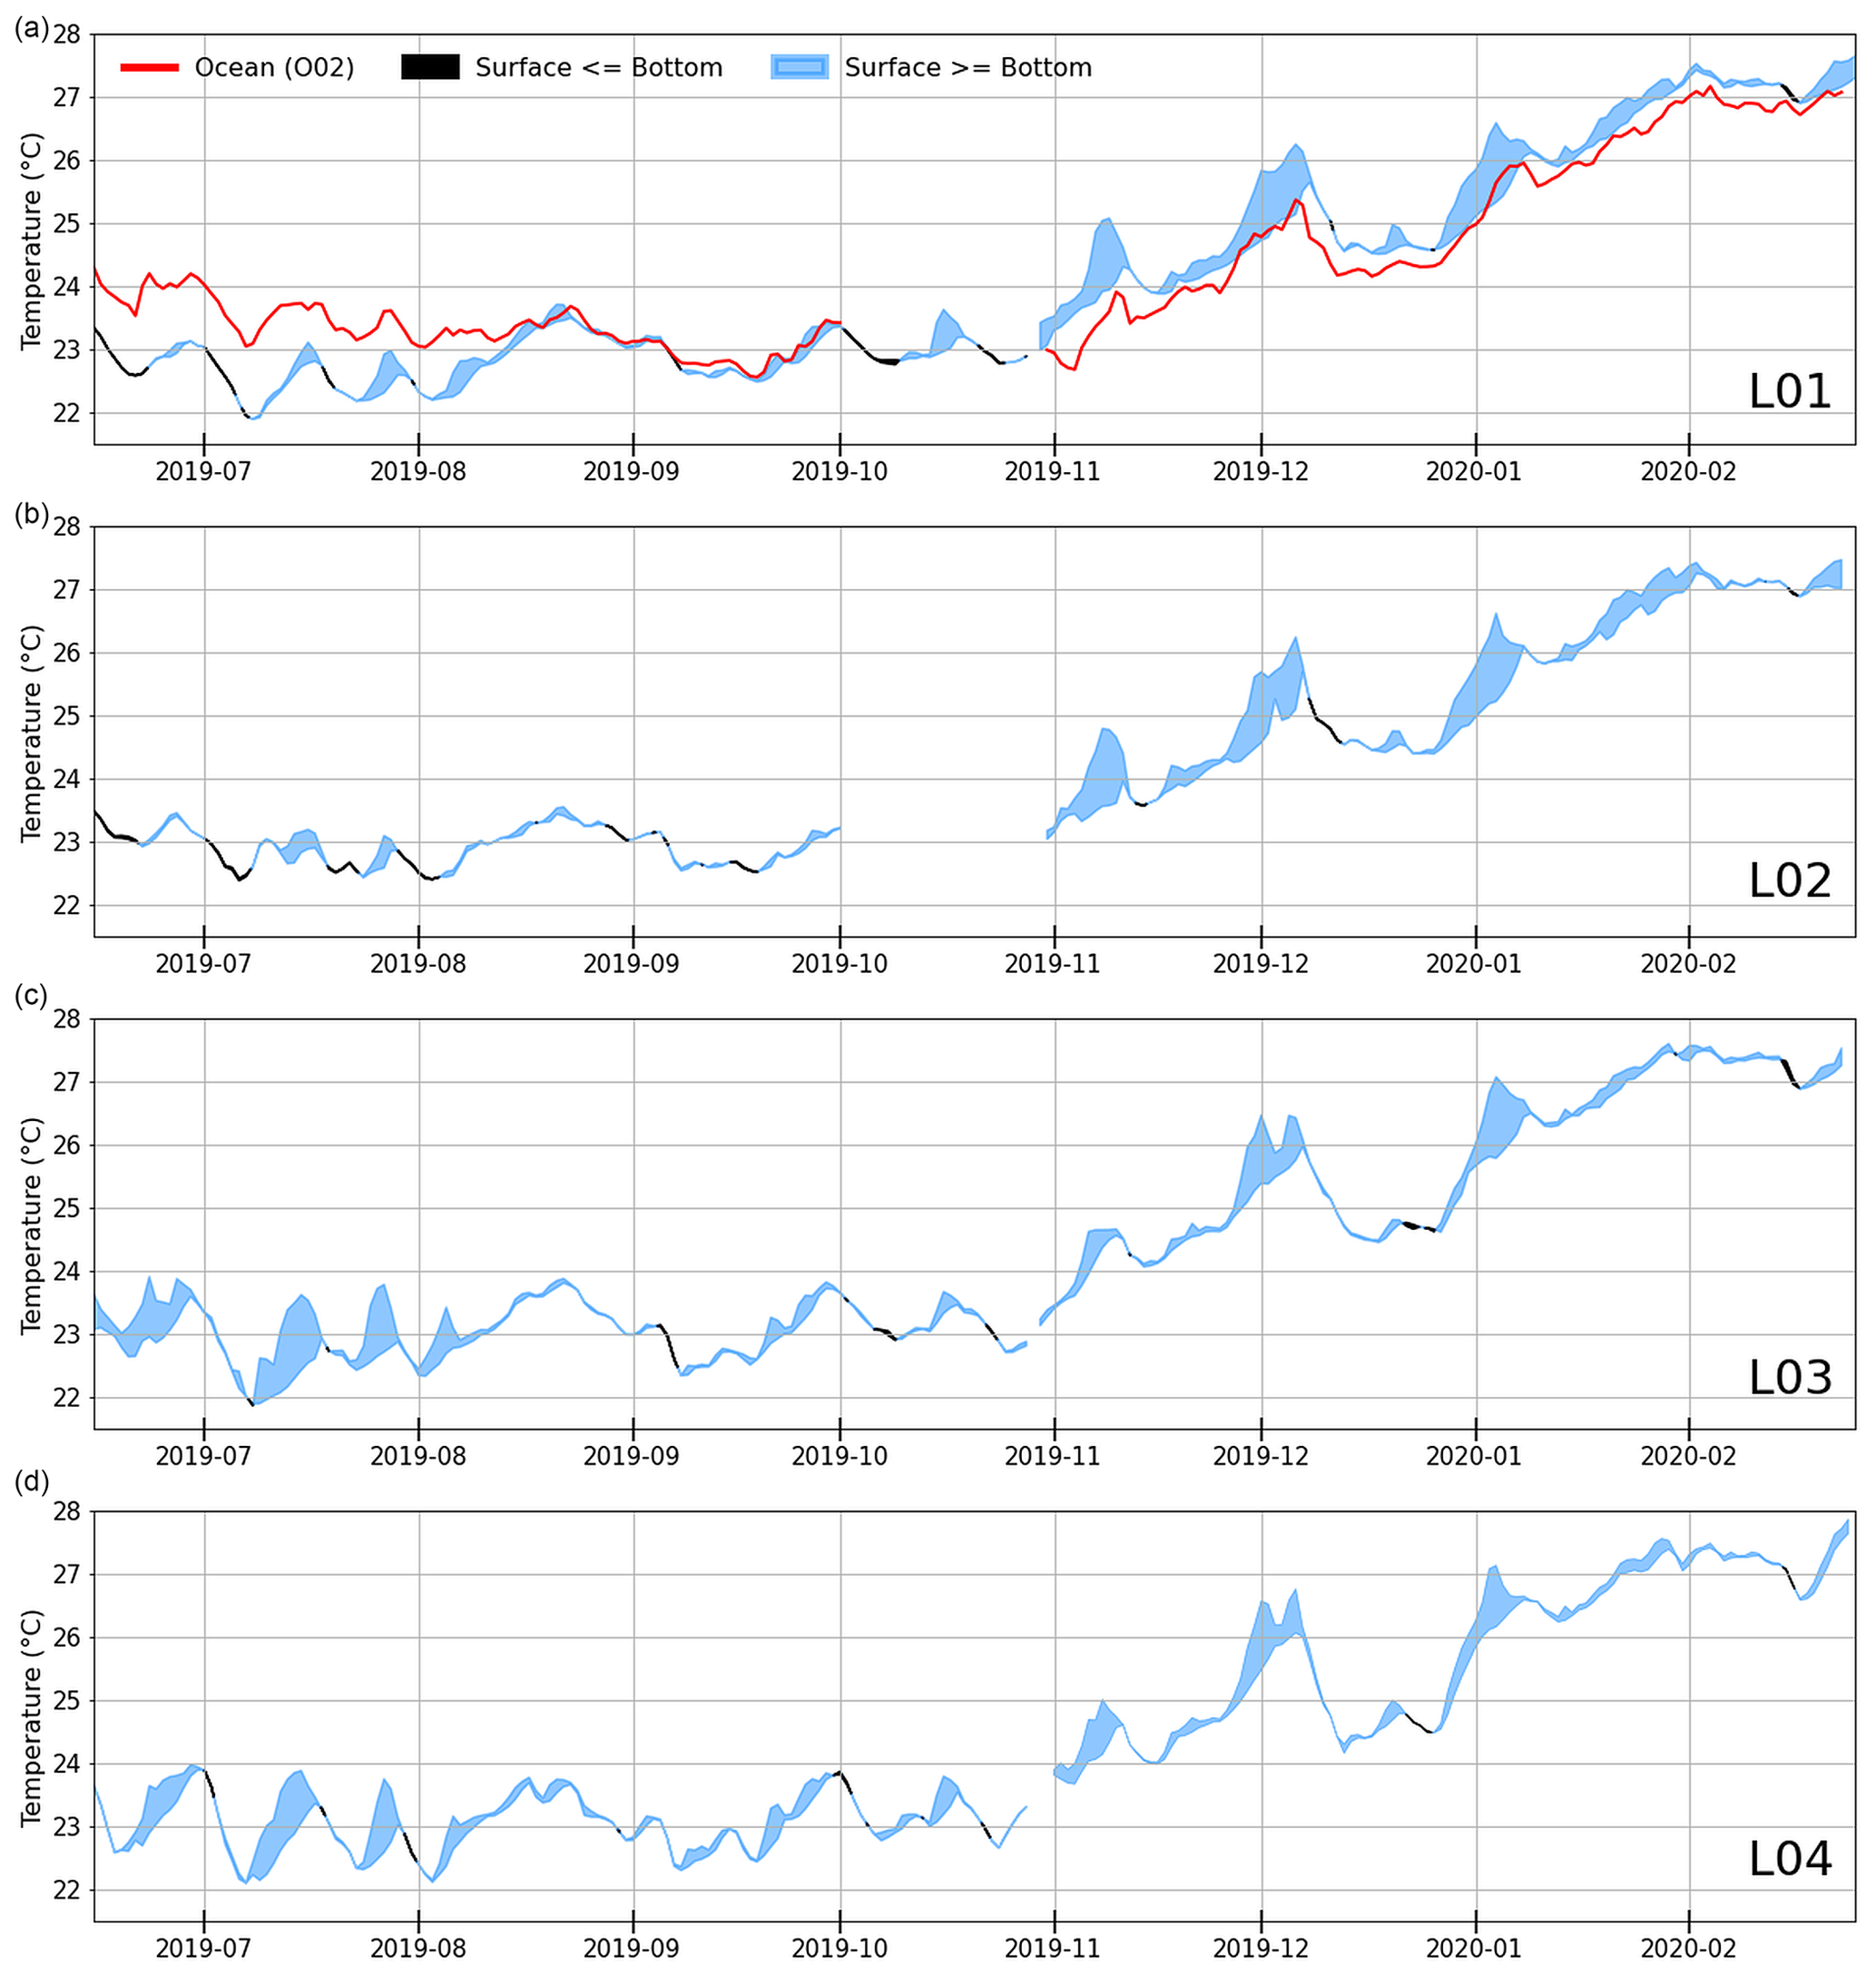
Figure 9Time series of daily lagoon temperature measured with SBE56 data loggers at surface and bottom depths (approximately 3 and 20 m respectively) along Leg1 and Leg2 deployments. Oceanic temperature measured at the O02 station is shown in the top panel in red. Positive or negative temperature differences between surface and deeper areas are highlighted in blue and black respectively.
5.1 Tidal analysis
Amplitude of tidal constituents are presented in Table 2. Tidal analysis on Leg1 was made with the “t_tide” Python package (Pawlowicz et al., 2002). The sum of the six main harmonic constituents reaches 48 cm in oceanic station (O01). For O01 station, 57 % of water elevation is related to the semi-diurnal M2 harmonic amplitude, which represents 27.7 cm. Water-level oscillations in the ocean and lagoon are similar and synchronous because of the openness of the Gambier lagoon (Fig. 5). Compared with previous works on Tuamotu atolls (Dumas et al., 2012; Andréfouët et al., 2023a), where lagoon tide signal is highly attenuated, a difference of only a few centimeters in amplitude occur in the Gambier lagoon. It was less than 1 cm between the O01 and L01 stations but more than 2.6 cm between O05 and L03) (Table 2). Those results confirm the degree of openness of the Gambier lagoon to the ocean, and explain the tide-driven circulation inside the lagoon.
5.2 Wave parameters
Waves around Gambier were recorded on the five forereefs equipped with the RBRduet T.D sensors. Leg1 deployment occurred during the austral winter season (June to October), where distant swells generated by southern weather events are dominant. The measurements confirmed the importance of these southern swells (Fig. 6a). The station O03 located on the south-eastern side of Gambier Islands recorded several events, with wave heights > 3 m. Conversely, the significant wave heights measured at the northern station O04 averaged only ∼ 1 m, except during a few events at ∼ 2 m (i.e., July 2019). Only the two southern stations (O02 and O03) captured waves above 3 m in height (Fig. 6b). The north-west side is the calmest area owing to its protection from E-SE trade winds, with wave height under 1 m 73 % of the time. For the O03 station this class of height (0–1 m) represented only 6.6 % of the records.
Stations O04 (north) and O05 (north-east) recorded in ∼ 80 % of the time peak wave periods (Tp) under 11 s. These stations are dominated by wind waves generated by E-NE trade winds. In contrast, O01, O02, O03 measured higher Tp, which means that wave regimes are rather dominated by distant swell (Fig. 6c).
Wave measurements during the Leg2 deployment in austral summer contrast substantially with Leg1 (Fig. 7a); in particular, the wave heights measured on the south sides of the island (O02 or O03) reached a height of 3 m only once (Fig. 7b). Wave heights between 1 and 2 m were dominant (> 50 % of waves) on the southern stations (O02 and O03) and on the eastern station (O05). However, the peak period broadly matched the winter season (Fig. 7c).
Based on Fig. 8, wave events recorded during Leg1 on the south-east forereef station (O03) are also observed inside the lagoon (L02 station), but with a reduction in wave amplitude likely due to wave-energy dissipation on the subtidal reef flats in the south (bottom friction), and the wave refractions on islands and very shallow or emerged reefs. The lagoon surge amplitude (L02) reacts in the same manner as surge measured in the oceanic station (O03). This weak difference shows that the water levels in the lagoon and ocean are homogenous.
5.3 Temperature
Temperature in the Gambier lagoon followed, as expected, a seasonal evolution, with lower temperatures in July (around 22 ∘C) and a maximum reaching 28 ∘C in February (Fig. 9). During the austral winter season, lagoonal temperatures are lower than in the ocean by approximately 1 ∘C. From late August to October, temperatures are similar and start to deviate from each other in November. The ocean is then cooler than the lagoon during the summer period. During Leg1, in austral winter, the temperature appeared fairly stable, and rather cool, with values restricted between 22 and 24 ∘C. Between June and August, three synchronous (all stations) temperature drops are observed on the entire water column (bottom and surface) with temperature decreasing by 1 to 2 ∘C depending on the location. The return to previous values was more or less rapid also depending on the stations, with surface waters warming up faster than deep areas. This phenomenon can be primarily related to intense wind events (Fig. 3) or wave events (Figs. 6–7).
The overall temperature dynamic during Leg2 shows an increasing trend starting in November 2019 until February 2020, and a maximum delta > 5 ∘C is observed between the maximum and minimum temperature reached per station across the period. Similar to Leg1, there are, however, several temperature drop events synchronous for all stations, in particular in December 2019. The drop is recorded by all lagoon stations, from 2 ∘C for L01, L02, and L03 to 2.5 ∘C in L04 in 6 d, and can be assigned to periods of high south-east winds.
5.4 Currents and lagoonal circulation
Depth-averaged water circulation observed in the Gambier lagoon shows that currents are dominated first by the tide, and are modulated by wind orientations and intensity. The ADCP_3, for instance, recorded a depth-averaged symmetric direction-oriented NW-SE related to the natural alignment of the channel formed between Mangareva and Taravai Islands and the regular effects of the tide (Fig. 10). The same directional symmetry occurs in ADCP_1 (Fig. 10).
Rikitea lagoon is influenced by water movements on its three sides. Although in- and outflows at ADCP_4 are balanced and seem primarily dominated by the tide, inflows are more dominant in Aqua_2, owing to the effects of both the tide and the south-east wind (Fig. 3). Conversely, outflows are more persistent at the Aqua_1 station, a feature that can be interpreted as the outflow compensating for the inflows elsewhere. The Rikitea sub-lagoon circulation has been specifically studied in Bruyère et al. (2023a).
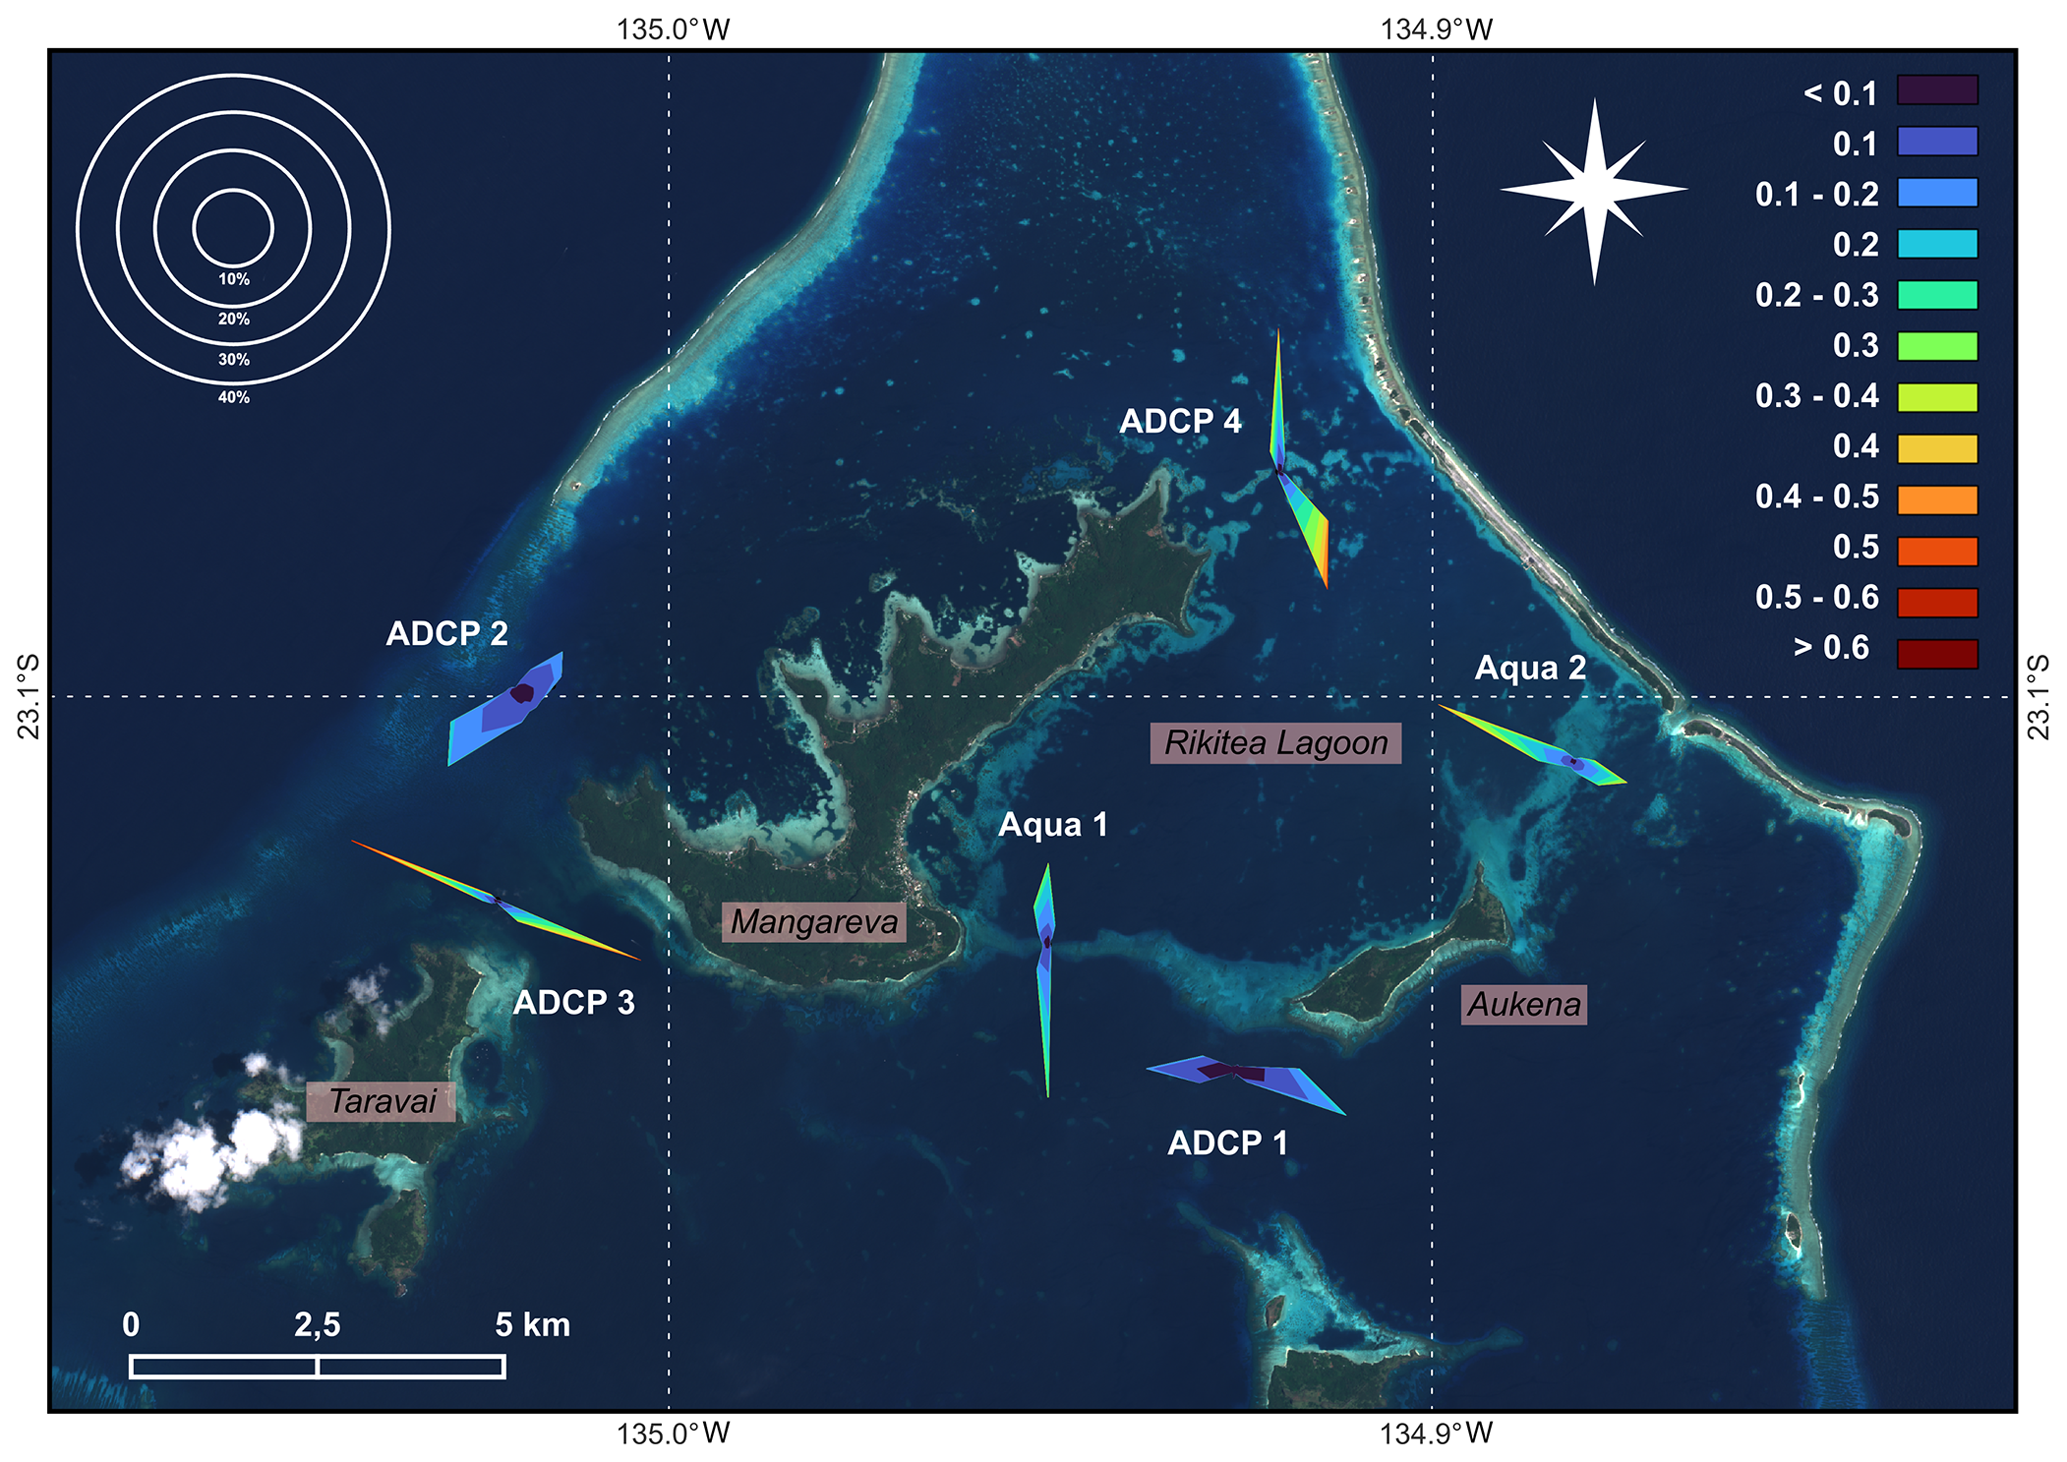
Figure 10Map of depth-averaged current speeds (color legend in m s−1) and direction recorded by current profilers (ADCP and Aquadopp) during the Leg2 deployment. Number of direction occurrences (%) are scaled according to the circles situated at the top right. Oceanographic convention is applied on current directions.
Depth-averaged current speeds and directions measured from current profilers are presented in Fig. 11. Measurements were restricted between 1 and 12 December 2019, to highlight the influence of wind intensity and direction on currents. Indeed, a strong trade wind event (SE direction and approximately 12 m s−1) was observed between 7 and 14 December (Fig. 3). This event was recorded by current profilers; Aqua2 was influenced by wind intensity and direction. In contrast, current directions observed in stations ADCP_1, ADCP_3, and ADCP_4 follow tide cycles, but a small increase in speed is remarkable.
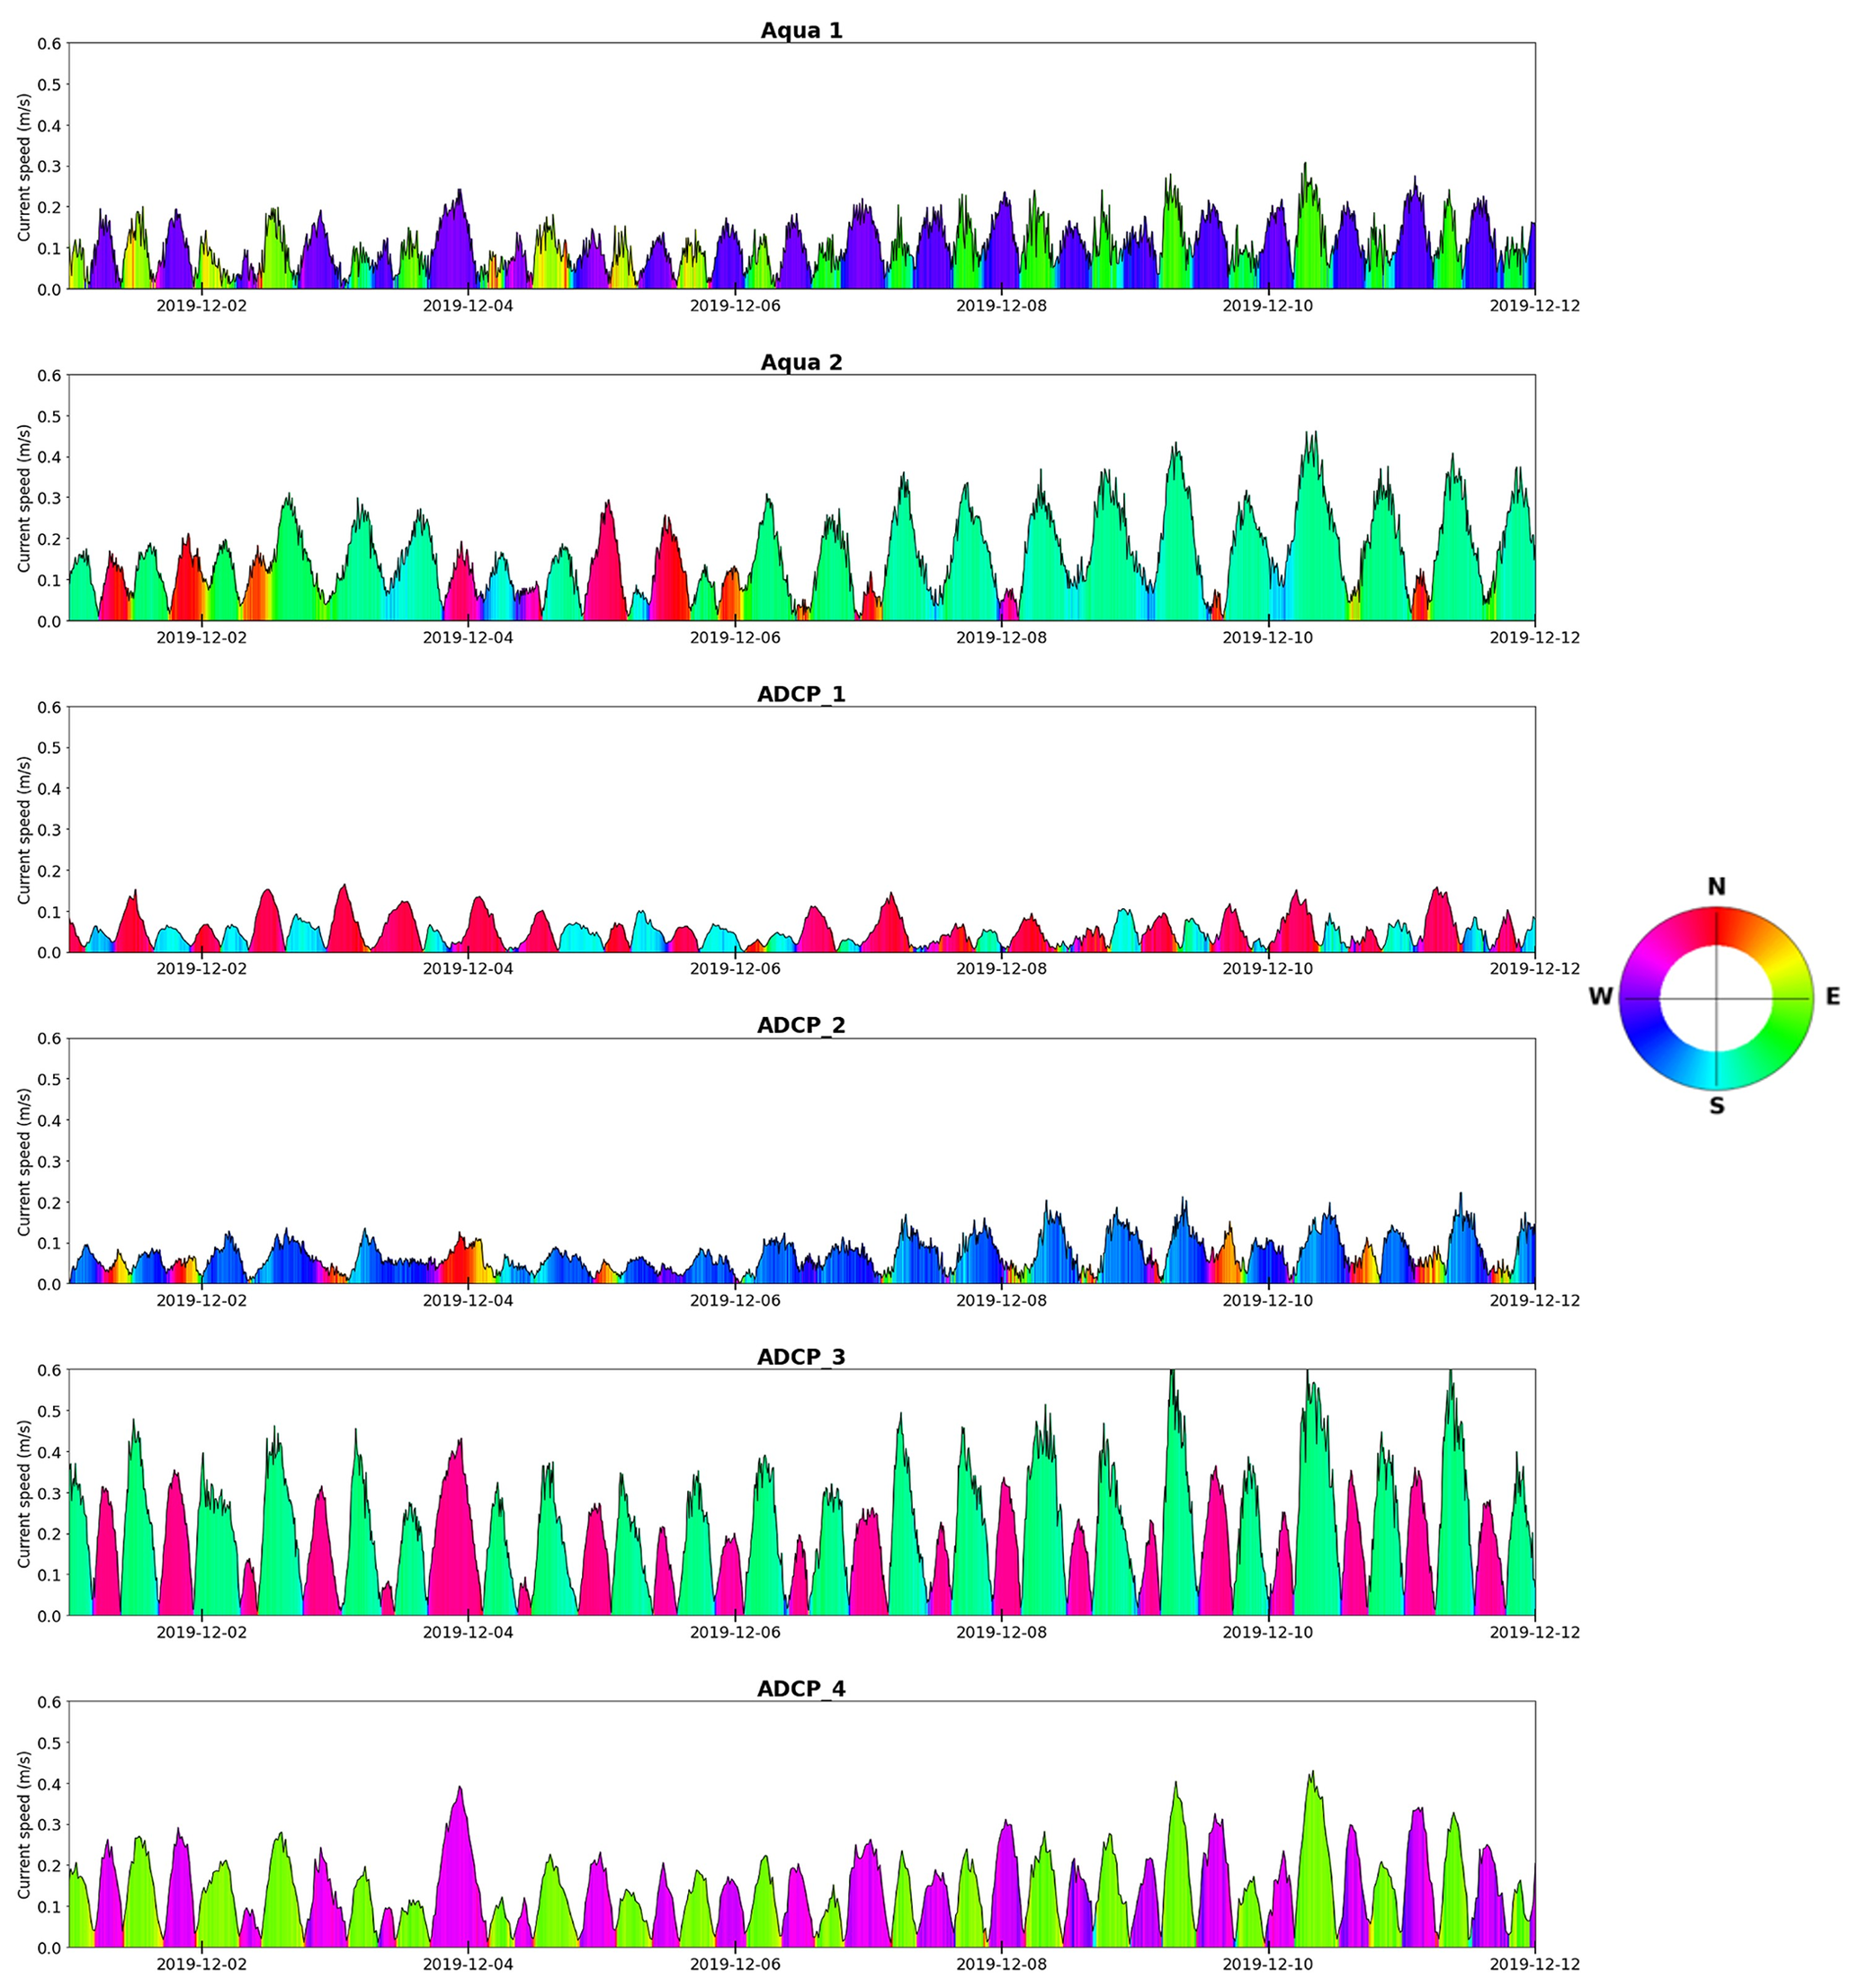
Figure 11Time series of depth-averaged current speeds (black line) and directions (polar legend) from ADCP and Aquadopp instruments moored during Leg2. Directions follow the oceanographic convention (direction where the current is going).
Dataset is made publicly available in NetCDF format through SEANOE open data publisher (https://www.seanoe.org/, Seanoe, 2023) in a dedicated repository. The registered database link to the following DOI https://doi.org/10.17882/94148 (Andréfouët et al., 2023b). Potential users can use their preferred NetCDF tools and libraries to access and process the dataset.
The data presented in this paper provide a continuous time series of oceanographic data (currents, temperature, water levels, and wave parameters) recorded from June 2019 to February 2020 in the Gambier Islands lagoon. To our knowledge, this Gambier dataset represents a first physical oceanography observatory for a geomorphologically complex Polynesian site, but could be useful for guiding deployments in the various high islands surrounded by large open lagoons and barrier reefs found in the Pacific Ocean, in Micronesia (e.g., Chuuk in the Federated States of Micronesia), Melanesia (e.g., Kadavu in Fiji) or elsewhere in Polynesia (e.g., Vava'u in Tonga). Specific deployments for atolls are described in Bruyère et al. (2023b). Data collected with such deployments were suitable for model validation as shown in Bruyère et al. (2023a). Those measurements offered the possibility of studying the hydrodynamic features in relation to pearl farming activities, including spat collection (Bruyère et al., 2023a). For future work in Gambier, in situ measurements could be extended to the southern part of the Gambier lagoon, as well as a specific investigation of the lagoon circulation during the winter season, when swell events with high (> 3 m) wave height occur. Furthermore, the dataset presented here can also be extremely useful for other investigations, beyond pearl farming. Investigators could look at a variety of oceanographic processes not considered here, such as the presence and impact of low-frequency infra-gravity wave that could be detected by the pressure sensors, or flood hazard estimation. Namely, physical oceanography data can be helpful in understanding the variability in occurrences of ciguatera fish poisoning, which has been a severe problem in the Gambier lagoon (Chinain et al., 2016), biodiversity resilience and larval recruitment for coral and invertebrate species other than oysters, and effects of land-born pollutants.
OB: conceptualization, writing – original draft, visualization, investigation data curation. RLG: investigation, data curation, writing – review and editing. VL: funding acquisition, investigation, writing – review and editing. SA: conceptualization, visualization, investigation data curation, writing – original draft, funding acquisition.
The contact author has declared that none of the authors has any competing interests.
Publisher's note: Copernicus Publications remains neutral with regard to jurisdictional claims made in the text, published maps, institutional affiliations, or any other geographical representation in this paper. While Copernicus Publications makes every effort to include appropriate place names, the final responsibility lies with the authors.
The authors acknowledge the Direction des Ressources Marines (DRM) of French Polynesia for their financial support and for providing oceanographic instruments. The additional scientific staff who helped during the field operation described here included David Varillon, Bertrand Bourgeois, John Butscher, Manui Tanetoa, and Teranui Ebb. We also thank the boat drivers and local population for their support and welcome.
This research has been supported by the Agence Nationale de la Recherche (grant no. ANR-16-CE32-0004, MANA “Management of Atolls”). Takapoto Atoll surveys were funded by the Direction des Ressources Marines (DRM) through grant 7518/VP/DRM to IRD. Instruments were provided by the Direction des Ressources Marines, OTI project, Contrat de Projet France French Polynesia, Program 123, Action 2, 2015–2020.
This paper was edited by Giuseppe M. R. Manzella and reviewed by Stuart Pearson and Robert Schlegel.
Amrari, S., Bourassin, E., Andréfouët, S., Soulard, B., Lemonnier, H., and Le Gendre, R.: Shallow water bathymetry retrieval using a band-optimization iterative approach: application to New Caledonia coral reef lagoons using Sentinel-2 data, Remote Sens., 13, 4108, https://doi.org/10.3390/rs13204108, 2021.
André, L. V., Van Wynsberge, S., Chinain, M., Gatti, C. M. I., Liao, V., and Andréfouët, S.: Spatial Solutions and Their Impacts When Reshuffling Coastal Management Priorities in Small Islands with Limited Diversification Opportunities, Sustainability, 14, 3871, https://doi.org/10.3390/su14073871, 2022.
Andréfouët, S. and Bionaz, O.: Lessons from a global remote sensing mapping project. A review of the impact of the Millennium Coral Reef Mapping Project for science and management, Sci. Total Environ., 776, 145987, https://doi.org/10.1016/j.scitotenv.2021.145987, 2021.
Andréfouët, S., Bruyère, O., Liao, V., and Le Gendre, R.: Hydrodynamical impact of the July 2022 “Code Red” distant mega-swell on Apataki Atoll, Tuamotu Archipelago, Global Planet. Change, 228, 104194, https://doi.org/10.1016/j.gloplacha.2023.104194, 2023a.
Andréfouët, S., Bruyère, O., Liao, V., and Le Gendre, R.: Lagoon hydrodynamics of pearl farming islands in French Polynesia: the case of Gambier Islands, SEANOE [data set], https://doi.org/10.17882/94148, 2023b.
Aucan, J., Vendé-Leclerc, M., Dumas, P., and Bricquir, M.: Wave forcing and morphological changes of New Caledonia lagoon islets: Insights on their possible relations, C. R. Geosci., 349, 248–259, https://doi.org/10.1016/j.crte.2017.09.003, 2017.
Aucan, J., Desclaux, T., Le Gendre, R., Liao, V., and Andréfouët, S.: Tide and wave driven flow across the rim reef of the atoll of Raroia (Tuamotu, French Polynesia), Mar. Pollut. Bull., 171, 112718, https://doi.org/10.1016/j.marpolbul.2021.112718, 2021.
Bionaz, O., Le Gendre, R., Liao, V., and Andréfouët, S.: Natural stocks of Pinctada margaritifera pearl oysters in Tuamotu and Gambier lagoons: New assessments, temporal evolutions, and consequences for the French Polynesia pearl farming industry, Mar. Pollut. Bull., 183, 114055, https://doi.org/10.1016/j.marpolbul.2022.114055, 2022.
Bruyère, O., Chauveau, M., Le Gendre, R., Liao, V., and Andréfouët, S.: Larval dispersal of pearl oysters Pinctada margaritifera in the Gambier Islands (French Polynesia) and exploring options for adult restocking using in situ data and numerical modelling, Mar. Pollut. Bull., 192, 115059, https://doi.org/10.1016/j.marpolbul.2023.115059, 2023a.
Bruyère, O., Le Gendre, R., Chauveau, M., Bourgeois, B., Varillon, D., Butscher, J., Trophime, T., Follin, Y., Aucan, J., Liao, V., and Andréfouët, S.: Lagoon hydrodynamics of pearl farming atolls: the case of Raroia, Takapoto, Apataki and Takaroa (French Polynesia), Earth Syst. Sci. Data, 15, 5553–5573, https://doi.org/10.5194/essd-15-5553-2023, 2023b.
Chinain, M., Darius, H. T., Gatti, C. M., and Roué, M.: Update on ciguatera research in French Polynesia, SPC Fisheries Newsletter, 150, 42–51, 2016.
Copernicus Sentinel-2: (processed by ESA), MSI Level-2A BOA Reflectance Product, Collection 1, European Space Agency [data set], https://doi.org/10.5270/S2_-znk9xsj, 2021.
Dumas, F., Le Gendre, R., Thomas, Y., and Andréfouët, S.: Tidal flushing and wind driven circulation of Ahe atoll lagoon (Tuamotu Archipelago, French Polynesia) from in situ observations and numerical modelling, Mar. Pollut. Bull., 65, 425–440, https://doi.org/10.1016/j.marpolbul.2012.05.041, 2012.
Hersbach, H., Bell, B., Berrisford, P., Hirahara, S., Horányi, A., Muñoz-Sabater, J., Nicolas, J., Peubey, C., Radu, R., Schepers, D., Simmons, A., Soci, C., Abdalla, S., Abellan, X., Balsamo, G., Bechtold, P., Biavati, G., Bidlot, J., Bonavita, M., Chiara, G., Dahlgren, P., Dee, D., Diamantakis, M., Dragani, R., Flemming, J., Forbes, R., Fuentes, M., Geer, A., Haimberger, L., Healy, S., Hogan, R. J., Hólm, E., Janisková, M., Keeley, S., Laloyaux, P., Lopez, P., Lupu, C., Radnoti, G., Rosnay, P., Rozum, I., Vamborg, F., Villaume, S., and Thépaut, J.: The ERA5 global reanalysis, Q. J. Roy. Meteor. Soc., 146, 1999–2049, https://doi.org/10.1002/qj.3803, 2020.
Laurent, V. and Maamaatuaiahutapu, K.: Atlas Climatologique de la Polynésie française, Météo France, Faaa-Tahiti, p. 242, ISBN 978-2-11-155191-6, 2019.
Le Moullac, G., Tiapari, J., Teissier, H., Martinez, E., and Cochard, J.-C.: Growth and gonad development of the tropical black-lip pearl oyster, Pinctada margaritifera (L.), in the Gambier archipelago (French Polynesia), Aquacult Int., 20, 305–315, https://doi.org/10.1007/s10499-011-9460-x, 2012.
Pawlowicz, R., Beardsley, B., and Lentz, S.: Classical Tidal Harmonic Analysis Including Error Estimates in MATLAB using T_TIDE, Comput. Geosci., 28, 929–937, 2002.
Pirazzoli, P. A.: Cartographie des hauts fonds par télédétection dans l'archipel des Gambier (Polynésie française), Espace Géographique, 13, 277–284, https://doi.org/10.3406/spgeo.1984.3937, 1984.
Seanoe: Sea scientific open data publication, https://seanoe.org/, last access: 30 November 2023.
Ward, S. L., Robins, P. E., Owen, A., Demmer, J., and Jenkins, S. R.: The importance of resolving nearshore currents in coastal dispersal models, Ocean Model., 183, 102181, https://doi.org/10.1016/j.ocemod.2023.102181, 2023.