the Creative Commons Attribution 4.0 License.
the Creative Commons Attribution 4.0 License.
 | 06 Dec 2023
WorldCereal: a dynamic open-source system for global-scale, seasonal, and reproducible crop and irrigation mapping
Kristof Van Tricht
Jeroen Degerickx
Sven Gilliams
Daniele Zanaga
Marjorie Battude
Alex Grosu
Joost Brombacher
Myroslava Lesiv
Juan Carlos Laso Bayas
Santosh Karanam
Steffen Fritz
Inbal Becker-Reshef
Belén Franch
Bertran Mollà-Bononad
Hendrik Boogaard
Arun Kumar Pratihast
Benjamin Koetz
Zoltan Szantoi
The challenge of global food security in the face of population growth, conflict, and climate change requires a comprehensive understanding of cropped areas, irrigation practices, and the distribution of major commodity crops like maize and wheat. However, such understanding should preferably be updated at seasonal intervals for each agricultural system rather than relying on a single annual assessment. Here we present the European Space Agency-funded WorldCereal system, a global, seasonal, and reproducible crop and irrigation mapping system that addresses existing limitations in current global-scale crop and irrigation mapping. WorldCereal generates a range of global products, including temporary crop extent, seasonal maize and cereal maps, seasonal irrigation maps, seasonal active cropland maps, and model confidence layers providing insights into expected product quality. The WorldCereal product suite for the year 2021 presented here serves as a global demonstration of the dynamic open-source WorldCereal system. Validation of the products was done based on best available reference data per product. A global statistical validation for the temporary crop extent product resulted in user's and producer's accuracies of 88.5 % and 92.1 %, respectively. For crop type, a verification was performed against a newly collected street view dataset (overall agreement 82.5 %) and a limited number of publicly available in situ datasets (reaching minimum agreement of 80 %). Finally, global irrigated-area estimates were derived from available maps and statistical datasets, revealing the conservative nature of the WorldCereal irrigation product. The WorldCereal system provides a vital tool for policymakers, international organizations, and researchers to better understand global crop and irrigation patterns and to inform decision-making related to food security and sustainable agriculture. Our findings highlight the need for continued community efforts such as additional reference data collection to support further development and to push the boundaries for global agricultural mapping from space. The global products are available at https://doi.org/10.5281/zenodo.7875104 (Van Tricht et al., 2023).
- Article
(13923 KB) - Full-text XML
-
Supplement
(410 KB) - BibTeX
- EndNote


Global food security is a major challenge in the face of population growth and climate change (Rosegrant and Cline, 2003; Brown and Funk, 2008; Prosekov and Ivanova, 2018). A vital step in achieving the “Zero Hunger” sustainable development goal is obtaining a global view on cropped areas, particularly those that produce major commodity crops like maize and wheat (Fritz et al., 2013; FAO, 2022). In addition, a global perspective on irrigation practices is equally crucial to ensure sustainable and efficient use of water resources, especially as agriculture becomes more intensive and as changing precipitation patterns affect major crop-producing regions worldwide (Fischer et al., 2007; Elliott et al., 2014).
Such global views on crop extent, crop type, and irrigation should preferably be generated at seasonal intervals for each agricultural system rather than as one-off or yearly products, due to the dynamic nature of growing seasons, meteorological conditions, agricultural practices, and rotation cycles (You and Sun, 2022; Bégué et al., 2018). Moreover, recent crises such as the COVID-19 pandemic, the most extreme weather events in decades, and the war in Ukraine have had a profound impact on global food systems and further stressed the need to capture seasonal changes in cropped areas and irrigation status for which to date large data gaps remain (FAO, 2022). This information can help policymakers and international organizations to better plan and allocate resources for food production and distribution (Becker-Reshef et al., 2019).
Crop mapping remains, however, a difficult task due to the diversity and complexity of agricultural systems (Liu et al., 2022). Satellite remote sensing has become an essential data source for land cover/use mapping thanks to an increased availability of open and free data, cloud computing infrastructure, and powerful machine learning algorithms (Szantoi et al., 2020; Karthikeyan et al., 2020; Pandey et al., 2021). However, most global satellite-based products do not focus on one specific land cover class such as cropland and have to balance many land cover classes in one mapping approach, such as the European Space Agency (ESA) WorldCover 2021 global land cover product that maps the world in 11 distinct classes at 10 m resolution (Zanaga et al., 2022). Only a few global products are dedicated to cropland. Pittman et al. (2010) presented a 250 m cropland layer based on MODIS data where they concluded that moving from static to dynamic cropland monitoring applications would be the next step in global cropland mapping. Thenkabail et al. (2021) published a global cropland extent product at 30 m (GCEP30) for the year 2015 based on Landsat imagery, and Potapov et al. (2022) presented the first time series of global maps of cropland extent and change based on 30 m Landsat data at 4-year intervals. Such long intervals were required to capture sufficient clear-sky observations for accurate cropland detection.
With regards to crop-specific maps, Han et al. (2021) produced the first global and annual maps of rapeseed planting area for 2017–2019 at 10 m resolution based on Sentinel-1 and Sentinel-2 data. Most high-resolution crop type products available to date are restricted in terms of spatial coverage, highlighting the complexity of global crop type mapping. The study by d'Andrimont et al. (2021) produced the first 10 m resolution crop type map for the European Union, covering 19 different crop types, based on Sentinel-1 data. Li et al. (2023) developed 10 m resolution maps for maize and soybean over China for 2019 based on a combination of PlanetScope and Sentinel-2 data. ESA's GeoRice project generated high-resolution rice maps for Southeast Asia for 2018–2020 based on Sentinel-1 data. Several regional crop type mapping projects in Africa are being set up under the Digital Earth Africa umbrella (Halabisky et al., 2022), while efforts such as in Tseng et al. (2021) provide crucial insights for leveraging sparsely available crop type datasets to create crop type maps in challenging regions. Becker-Reshef et al. (2023) collected and harmonized various regional crop type products to generate global Best Available Crop Specific Masks (BACS) for wheat, maize, rice, and soybeans in the context of global food security monitoring.
The first global irrigation datasets have been typically derived from a combination of statistics and inventories, with a minimal role for earth observation data (e.g. FAO's area equipped for irrigation map; Siebert et al., 2013). This map was further improved by Meier et al. (2018) through a combination of remote-sensing-based land cover maps (ESA Climate Change Initiative (CCI)), land suitability maps, and long time series of the Normalized Difference Vegetation Index (NDVI) in a multi-criteria decision framework. Salmon et al. (2015) relied on a combination of survey data, remote sensing time series, and climate data to train a supervised classification model to distinguish rainfed, irrigated, and paddy croplands. Detecting irrigation purely from satellite observations is a challenging effort that can be addressed in various ways, employing microwave-based soil moisture estimates, optical satellite observations, and/or measurements of crop water stress through thermal satellite data (Massari et al., 2021). Thenkabail et al. (2009) created a 1 km resolution irrigated-area map based on a combination of optical satellite data (SPOT VEGETATION (VGT)), thermal satellite data (AVHRR), a digital elevation model, and climate data. In contrast, Wu et al. (2023) relied exclusively on long time series of NDVI data in a locally tuned thresholding system to detect irrigation activities in dry periods at a global scale. Most recently, Teluguntla et al. (2023) combined the Global Cropland-Extent Product at 30-m Resolution (GCEP30; Thenkabail et al., 2021) with multiple spectral bands and indices of Landsat 8 from 2014–2017 in a supervised machine learning approach, resulting in a high-resolution (30 m) global irrigated-area product (LGRIP30).
Despite the clear increase in global agricultural mapping products, existing initiatives are not yet fully closing the global agricultural data gaps because of one or more of the following limitations (FAO, 2022): (i) their specific definition of cropland precludes their usage in near real time because they need access to multiple years of data; (ii) they do not cover the full thematic detail that is required for global agricultural monitoring purposes, including crop-specific maps for the big commodity crops such as maize and wheat; (iii) they provide a one-time product, while the dynamic nature of agricultural landscapes requires frequent and timely updates; (iv) they do not explicitly account for local growing seasons which hampers crop-specific mapping in different seasons; (v) they do not provide information on agricultural practices at seasonal timescales, such as the occurrence of active cropland or the application of irrigation in specific growing seasons; (vi) they exclusively provide the end product without publication of an open-source system that allows for reproducibility, continuity, and improvement of these products; or (vii) they have limited local applicability in areas with less training data.
In the framework of ESA's WorldCereal project, we aimed to address these current existing limitations, pushing the boundaries on global-scale, seasonal, and reproducible crop and irrigation mapping by building an open-source and highly scalable system with the potential to generate globally consistent maps that can be locally fine tuned if users add their own training data. In this research, we present the range of WorldCereal products that have been generated for the year 2021 at global level. This includes (i) an annual temporary crop map, (ii) seasonal maize and cereals (wheat + barley + rye) maps, (iii) seasonal active irrigation maps, (iv) seasonal active cropland maps, and (v) model confidence layers related to the individual products. The complete 2021 WorldCereal product suite demonstrates the capabilities of the dynamic open-source WorldCereal system on a global scale, emphasizing the importance of continuing its development beyond the 2021 showcase. This product suite can also act as a foundation for an operational worldwide crop monitoring system, thereby contributing to the achievement of the “Zero Hunger” sustainable development goal.
2.1 Annual temporary crop map
Land cover maps typically contain a cropland class, but this class is not always consistently defined (Tubiello et al., 2023). The base product that is generated by the WorldCereal system is an annual temporary crop map. This is a binary map identifying land used for crops with a less-than-1-year growing cycle which must be newly sown or planted for further production after the harvest (FAO, 2023). Sugar cane, asparagus, and cassava are also considered temporary crops, even though they remain in the field for more than 1 year. The WorldCereal temporary crop maps exclude perennial crops as well as (temporary) pastures. These maps are generated once a year, with the period being defined in a region by the end of the last growing season that is considered by the system (see Sect. 2.2 and Fig. 6).
2.2 Crop seasonality
Agriculture is dynamic in nature with different crops being grown in different seasons throughout the year depending on local growing conditions. A global crop-mapping system should therefore include a definition of growing seasons that reflect regional patterns. This is particularly challenging in equatorial areas that exhibit no clear winter–summer seasonality and are often characterized by multiple growing seasons in a calendar year that follow the spatial and temporal variability of precipitation patterns in addition to local agricultural practices (Jägermeyr and Frieler, 2018; Franch et al., 2022). As part of the WorldCereal system, Franch et al. (2022) developed gridded global crop calendars at 0.5∘ resolution for maize and wheat, leveraging the main existing global crop calendar products: GEOGLAM Crop Monitor, the United States Department of Agriculture Foreign Agricultural Service (USDA-FAS), the Food and Agriculture Organization (FAO), and the Joint Research Centre's Anomaly Hot-Spots of Agricultural Production (ASAP). Given the global extent of the WorldCereal products and the gaps that existing products exhibit at this scale, crop calendars were simulated in those areas not covered by any of these products (Franch et al., 2022). The resulting crop calendars were used to stratify the globe into zones with similar maize and wheat growing seasons (Sect. 3.3), which form the basis for tasking the WorldCereal system to generate the products (Sect. 4). The crop calendars consist of one major cereals' season and up to two maize seasons. Spring cereals grown at northern latitudes generally exhibit the same seasonality as maize in those regions and are therefore not characterized by a separate growing season (see also Fig. 6 for a detailed example).
2.3 Seasonal crop type maps
The WorldCereal crop type products provide binary maps for the maize and wheat growing seasons as defined by the global crop calendars, showing where maize and cereals are grown. Cereals include wheat, barley, and rye, which belong to the Triticeae tribe. These crops were grouped together because their spectral signatures and growing seasons were too similar to reliably distinguish them at a global scale. The WorldCereal crop type maps are generated within the respective annual temporary crop mask (Sect. 2.1).
2.4 Seasonal active irrigation maps
Irrigation can be applied in many ways, some of which are easier to detect from space than others. Additionally, the reason to irrigate might differ per crop and region (Burt et al., 2000). For example, in some countries, only the most valuable crops are irrigated and saved from dehydration due to a general water shortage, whilst in other countries irrigation is widely applied to maximize crop yield. The WorldCereal irrigation product was primarily trained using irrigation data from (semi-)arid climate zones. This was done partly by choice (the impact of irrigation on the environment is larger in dry regions) but also by necessity since there is limited irrigation data available for temperate regions. In the WorldCereal system, therefore, areas are defined as irrigated agriculture only if, due to extensive irrigation over a prolonged period, a significant crop yield can be reached. Other types of irrigation, such as incidental irrigation during the sowing period or during short-term droughts, are not the focus of the irrigated-area mask. This primarily excludes irrigation in more temperate climates, where irrigation is mostly applied to enhance crop yield instead of preventing crop failure. A pixel can only be classified as being irrigated in a specific season if that pixel has been identified as actively cultivated in the season of interest (Sect. 2.5). This choice is made to prevent potential commission of irrigated areas that might be introduced by features that react to wet conditions in sparsely vegetated areas.
2.5 Seasonal active cropland maps
Assessing total crop production at a regional scale requires an indication of not only where temporary crops are grown (as indicated by the WorldCereal temporary crop map) but also during which growing season(s) the identified areas are effectively in use for growing crops. External pressures such as natural disasters, a global pandemic, and armed conflicts may lead to severe damage to crops and/or induce field abandonment, causing complete cropping seasons to fail and thereby significantly impacting local-to-global food security. To gain a better understanding of local food production, the WorldCereal active cropland product indicates whether a pixel identified as temporary crops has been actively cultivated during a specific growing season. For a pixel to be labelled as “active” during a particular growing season, a full crop growth cycle (sowing, growing, senescence, and harvesting) needs to take place within the designated time period. Note that this active marker is not crop-type specific and will capture other crop types aside from cereals and maize as long as they show a similar seasonality. This also means in practice that any crop grown (slightly) outside the predefined growing seasons will not be flagged as active cropland in any of the seasons covered by the system.
In this section we outline the methodology for the creation of the WorldCereal products. While the presented products focus on the year 2021 at the global scale, the general methodology can be applied to other years and custom regions as well. Figure 1 illustrates how product generation is achieved by the WorldCereal classification system starting from a user-defined area and year of interest. The number and exact timing of the maize and cereals' seasons to be processed are derived from the global crop calendars (Sect. 2.2), which were stratified into uniform zones to enable fast processing at large spatial scales (Sect. 3.3). Based on this information, the appropriate time series of raw Earth Observation (EO) data are extracted (see also Fig. 6) and pre-processed for each individual growing season (detailed processing steps further specified in Sect. 3.2). Next, the prepared inputs are condensed into product-specific sets of classification features (Sect. 3.4), which directly feed into the respective classification models for temporary crops, maize, cereals, and irrigation detection (Sect. 3.5). Following model inference, several post-processing steps are applied to enhance individual product quality and inter-product consistency (Sect. 3.6). Note that Fig. 1 does not include the training aspect of the different classification models applied. Section 3.1 further details the reference data used for training our global models, whereas Sect. 3.5 describes the model architecture and training procedure. Finally, Sect. 3.7 specifies how the WorldCereal products were validated.
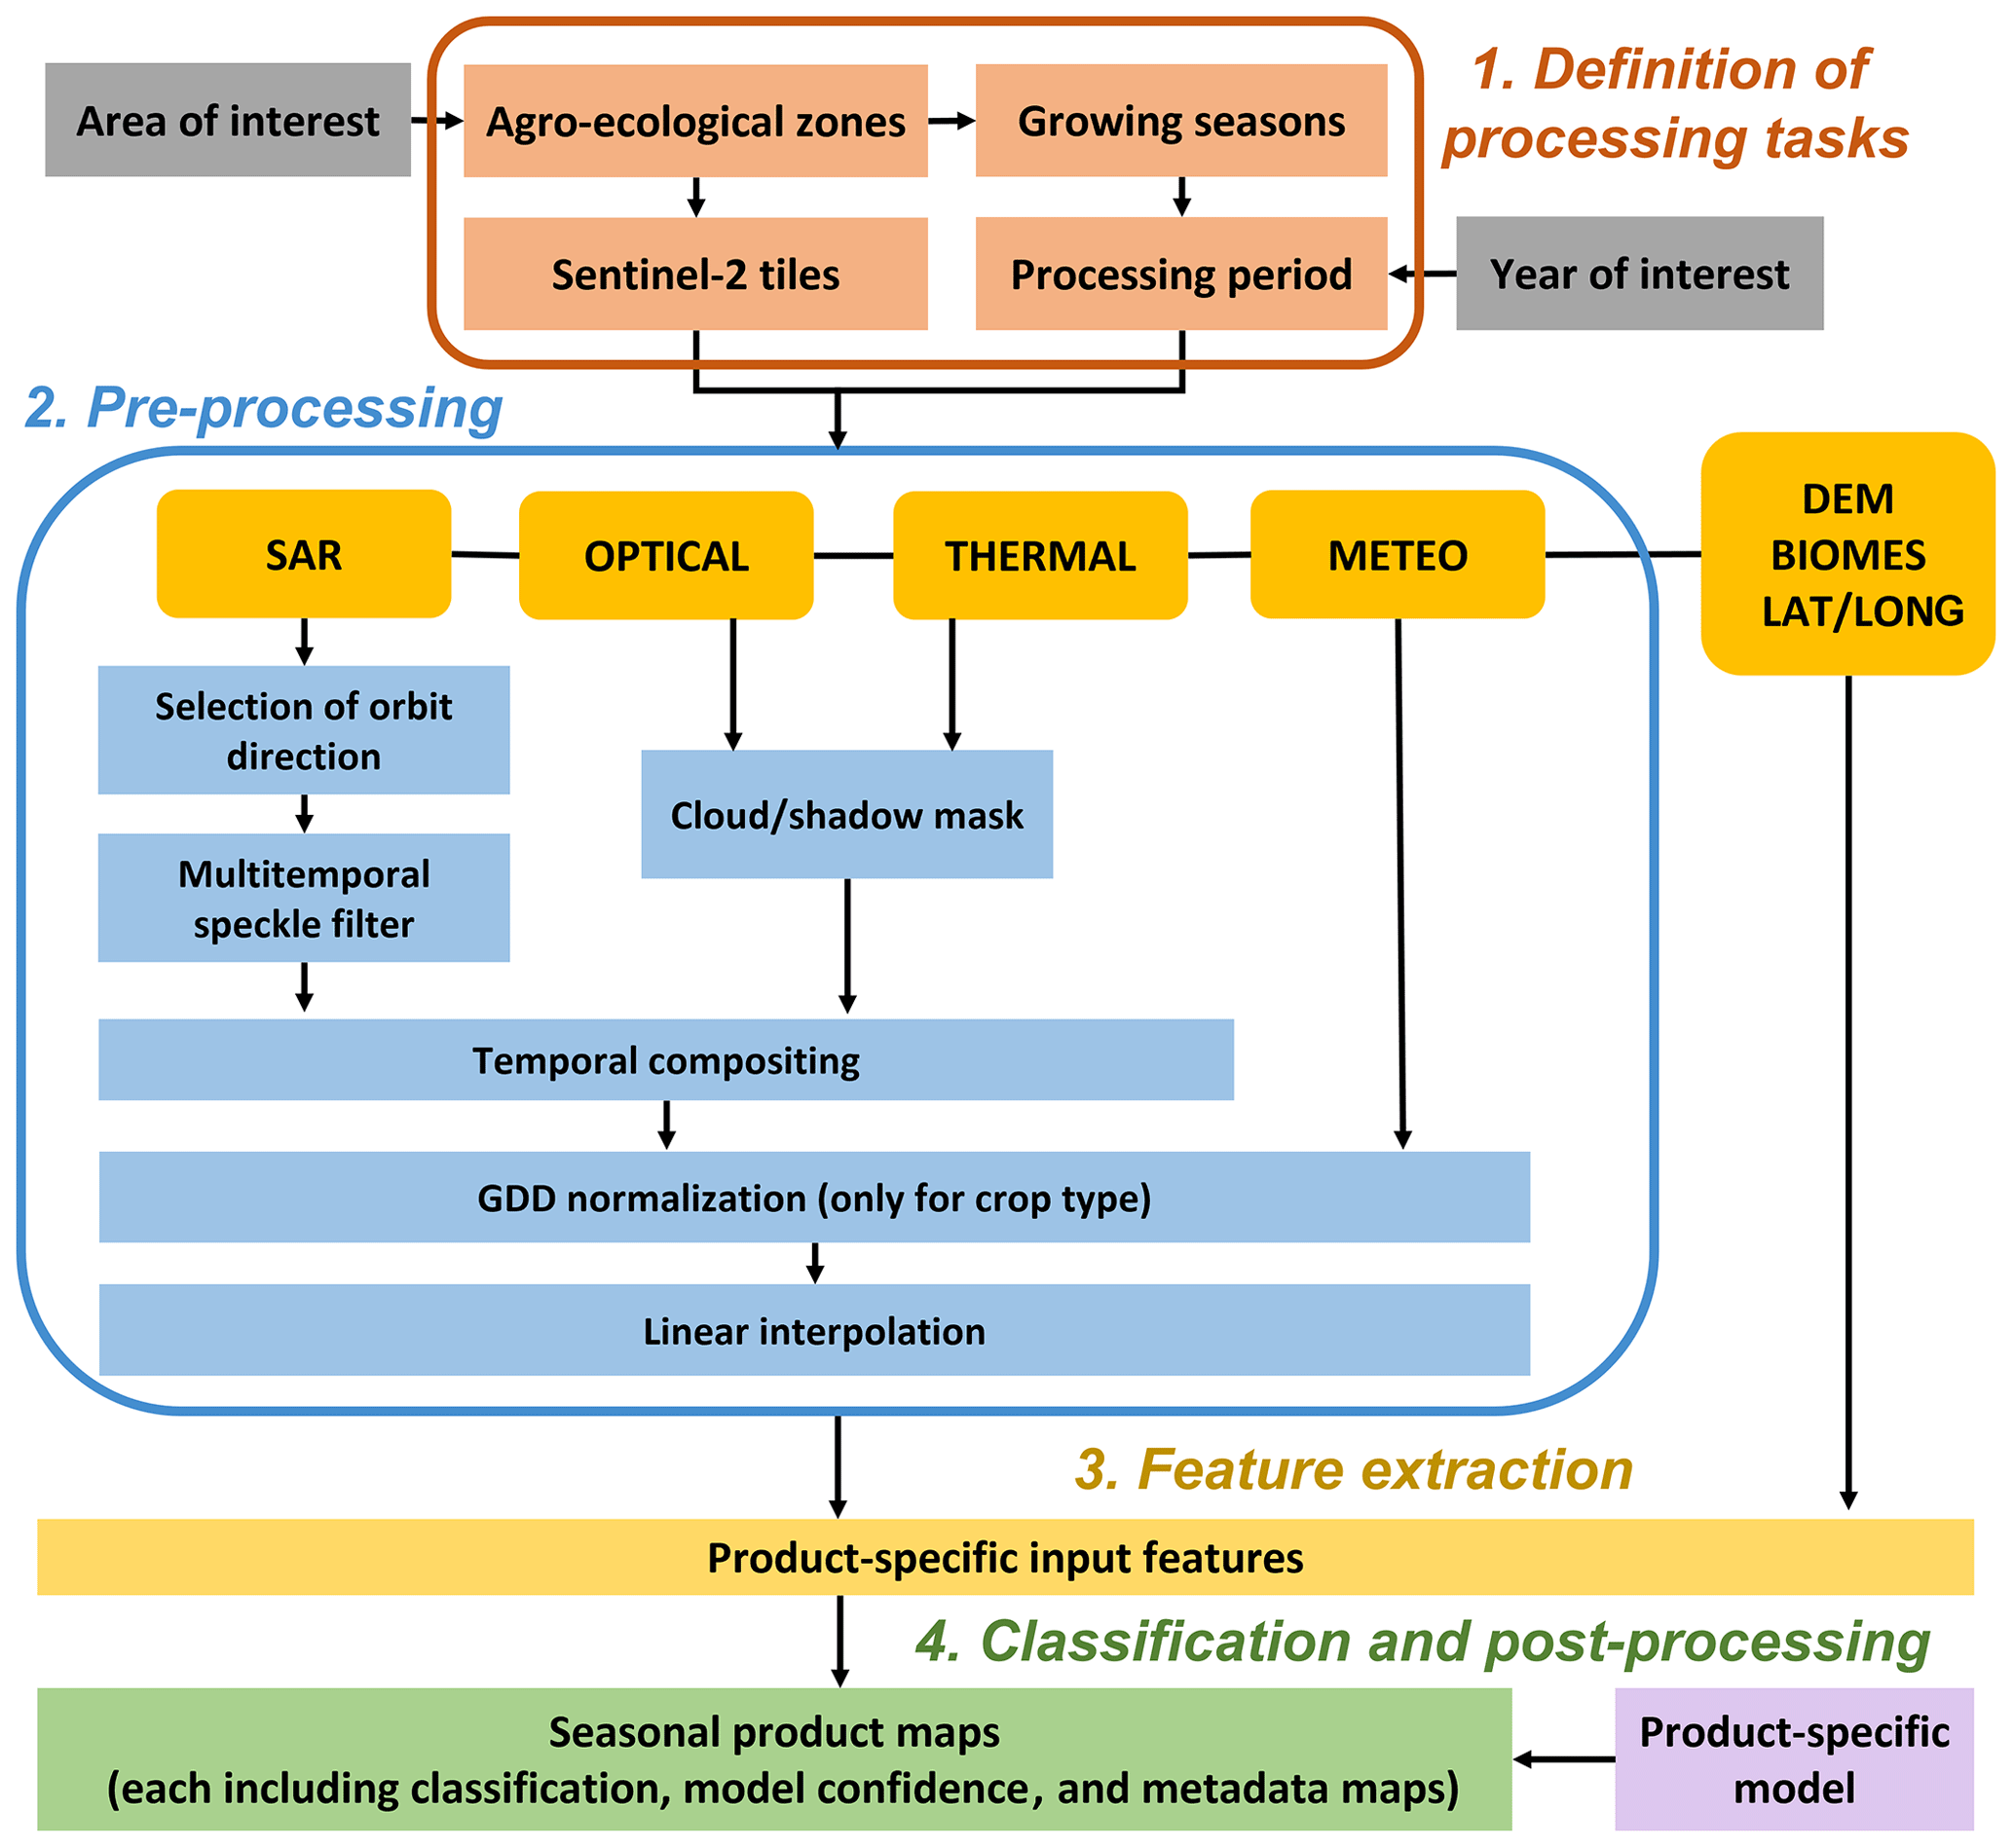
Figure 1WorldCereal production flowchart detailing the steps required to generate the WorldCereal products for a user-defined area and year of interest. This schematic does not include training of the classification models.
3.1 Training data
High-quality and representative training data are key to a well-performing and robust mapping system. Classification algorithms that need to be transferrable in space and time require training data that are spatially well spread and ideally cover as many of the agrometeorological conditions over time as possible. This reduces the risk of overfitting to specific locations, crop types, years, or growing conditions (Cracknell and Reading, 2014; Gu et al., 2016; Pelletier et al., 2017). Within the WorldCereal project, a community-based, open-access, and harmonized reference data repository at global extent was developed to address this need (Boogaard et al., 2023). This repository currently holds around 75 million harmonized samples from 2017 onward, originating from different sources such as the Group on Earth Observations Global Agricultural Monitoring Initiative (GEOGLAM) Joint Experiment for Crop Assessment and Monitoring (JECAM) sites, the Radiant MLHub, the Future Harvest (CGIAR) centres, the National Aeronautics and Space Administration Food Security and Agriculture Program (NASA Harvest), and the International Institute for Applied Systems Analysis (IIASA) citizen science platforms (LACO-Wiki and Geo-Wiki), as well as from individual project contributions. Each sample contains information on either its land cover/use, crop type, irrigation status, or a combination of these. A timestamp, derived as accurately as possible, allows us to assign a sample to a specific year and growing season(s). Finally, a confidence score indicates the expected quality of a sample and was derived at the original reference dataset source level based on the combined expert assessment of spatial, temporal, and thematic accuracy. A large number of samples is located in the EU and the USA, thanks to major contributions of European Land Parcel Identification System (LPIS) datasets and points sampled from the USDA Crop Data Layer. These datasets were therefore subsampled for training to reduce the spatial bias and keep the number of training input extractions manageable. The detailed description of this reference data module and the harmonization process followed can be found in Boogaard et al. (2023). Irrigation training data were especially sparse, consisting of only 36 000 rainfed and 26 000 irrigated samples divided over 19 countries. Since this was too limited to train a global irrigation mapping system, manually collected samples were included. The irrigated samples of this dataset consisted of centre-pivot irrigation sites which were visually selected using Google satellite and Bing aerial base layers. A minimum NDVI peak threshold of 0.4 was set to prevent including centre-pivot irrigation data that were not showing any cropping activity during the training period. Rainfed samples were primarily collected from Europe, northern Africa, India, Australia, and Argentina. The accuracy of this dataset was verified using the FAO AQUASTAT data on areas equipped for irrigation (Siebert et al., 2013). This manual training dataset added another 50 000 irrigated and 30 000 rainfed samples. The resulting label density at ∼5∘ resolution for land cover/use, crop type, and irrigation training samples is shown in Fig. 2. While the land cover samples are globally well distributed, strong regional differences in label availability (and even large data gaps) are apparent for crop type and irrigation training data.
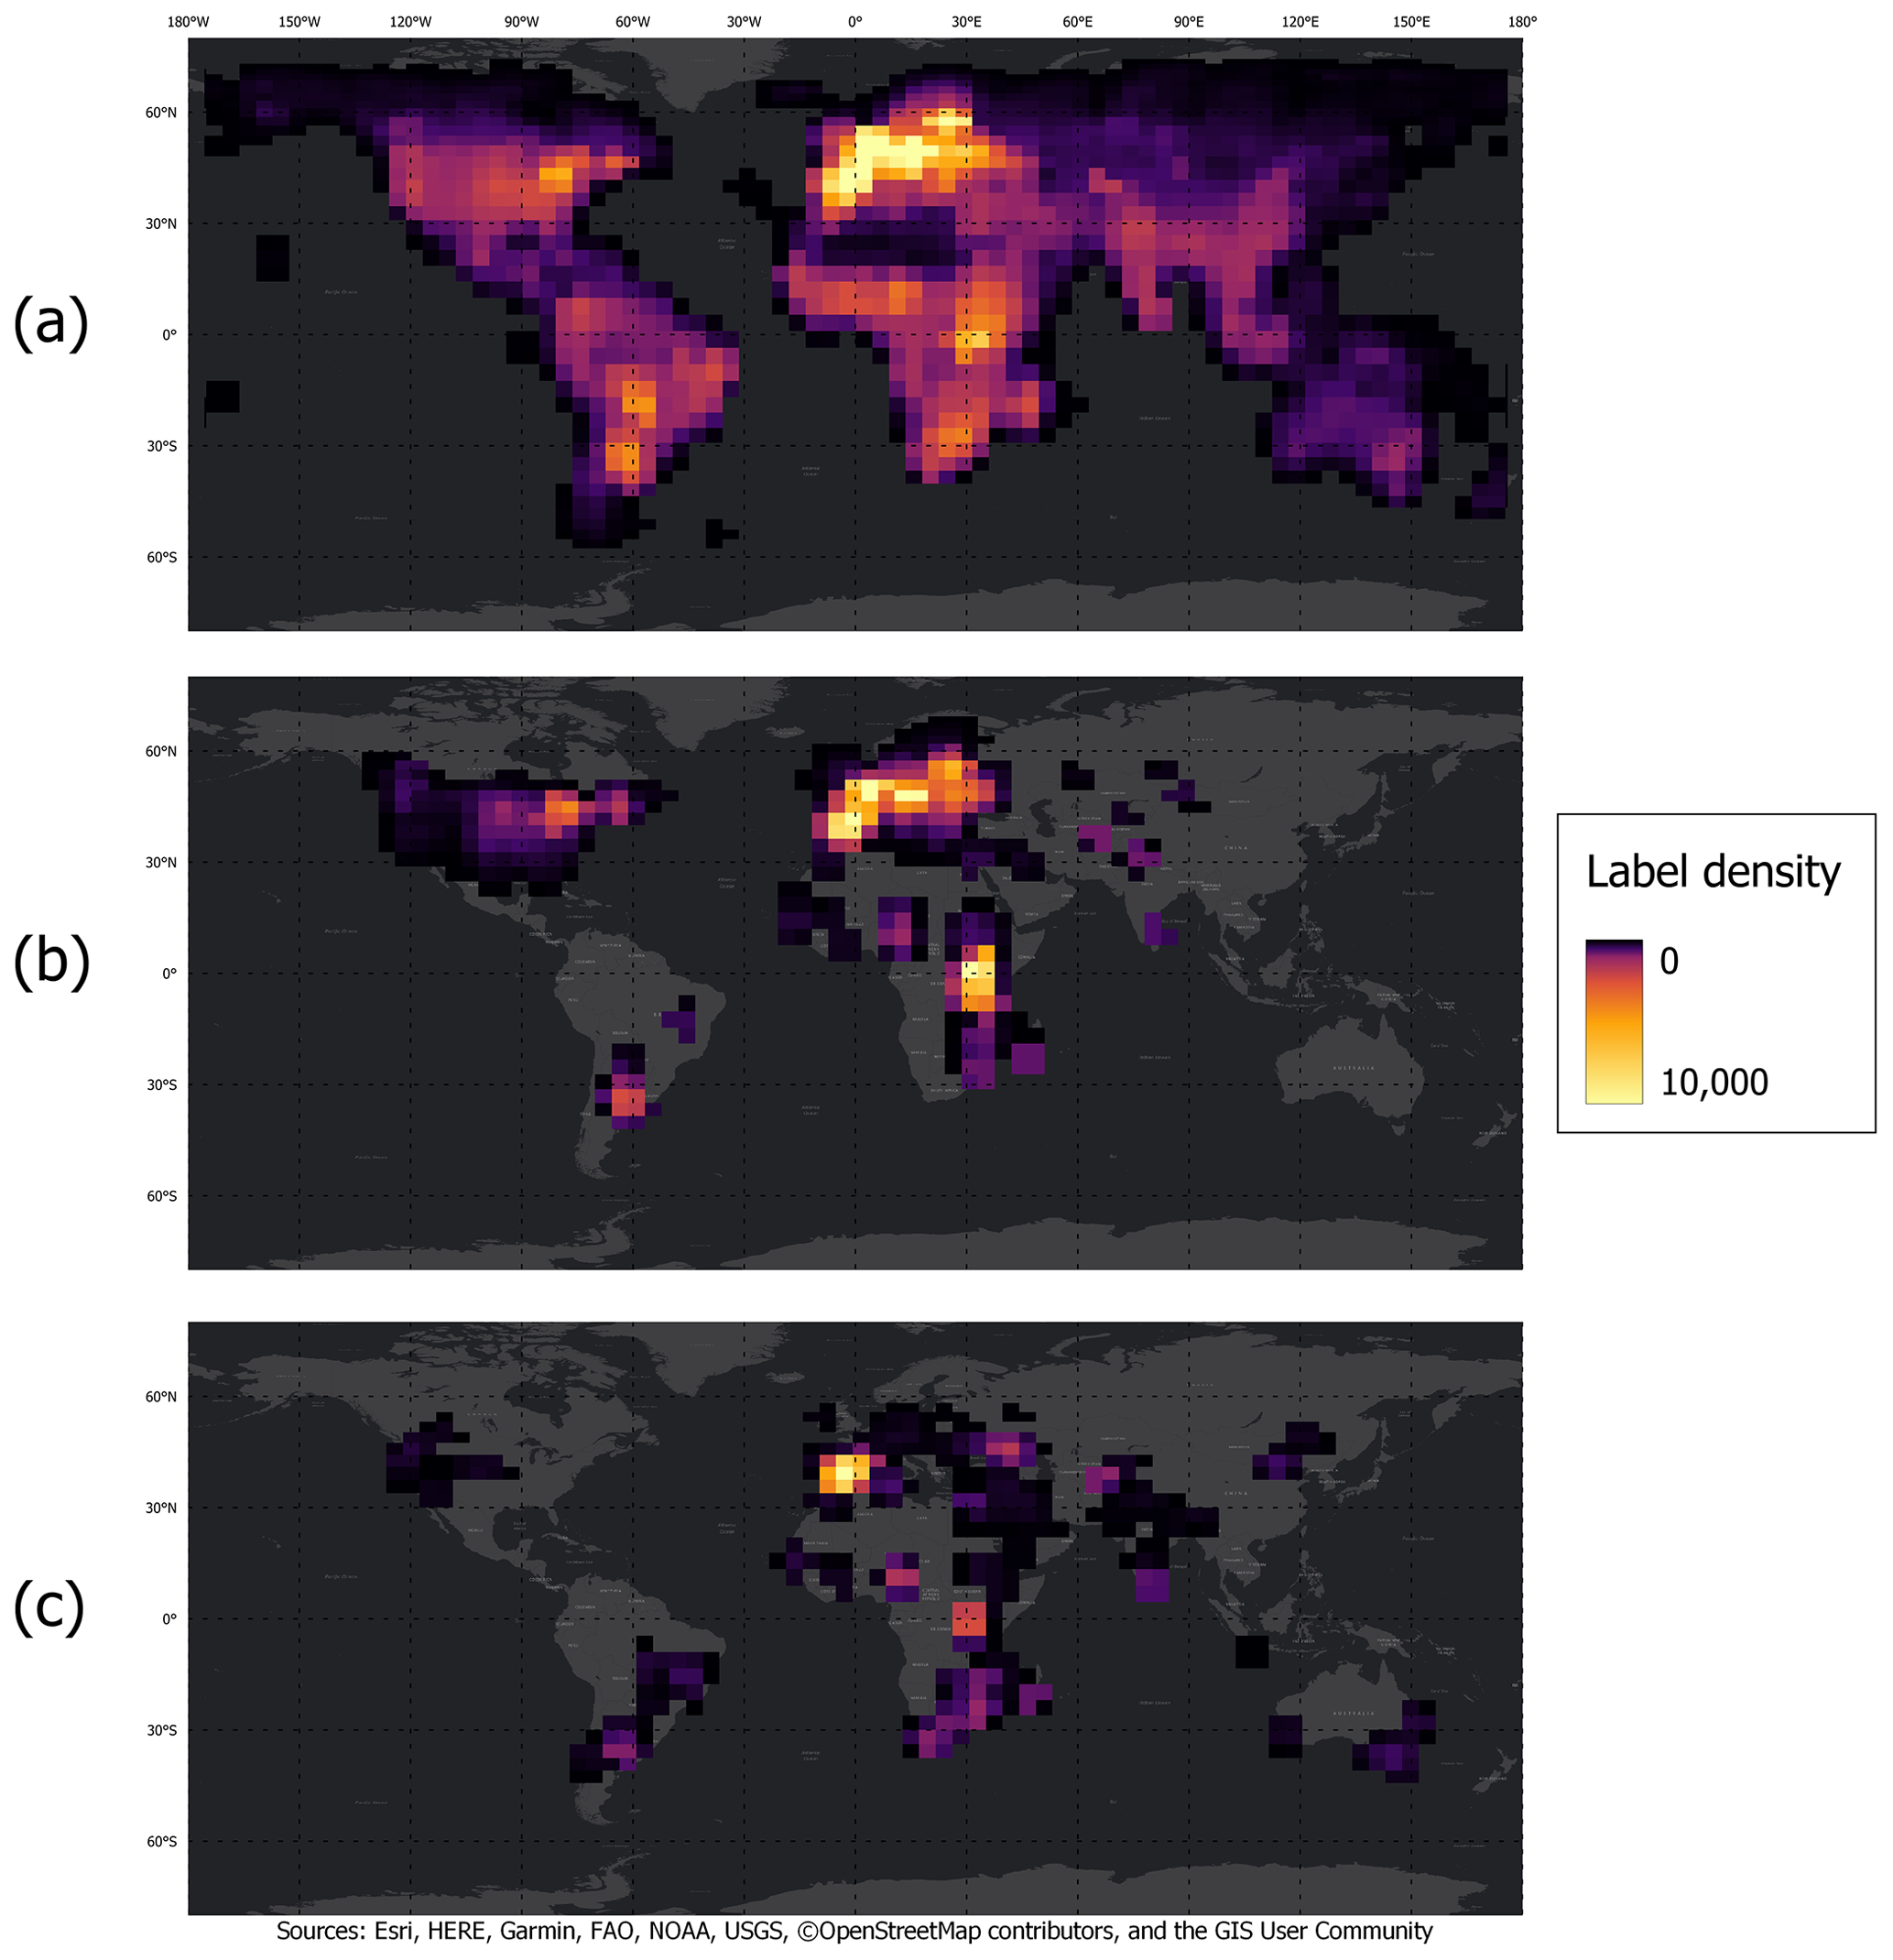
Figure 2Available label density at ∼5∘ resolution for training the different WorldCereal models. (a) Land cover labels to be used for temporary crop mapping show a good global spread. (b) Labels for training the crop type models exhibit large spatial gaps. (c) Irrigation labels are the most sparsely distributed.
3.2 Inputs and pre-processing
The satellite-based inputs used to create the WorldCereal products are optical Sentinel-2, radar Sentinel-1, and thermal Landsat 8 time series. Sentinel-2 optical bands were first subjected to cloud and shadow masking by applying a dilated version of the binarized SEN2COR scene classification mask (Main-Knorn et al., 2017). For crop type mapping, a crop-specific growing degree days (denoted GDD) normalization step was performed on the original time series using mean daily temperature data from the global AgERA5 reanalysis dataset (Boogaard et al., 2020). The aim of this step is to better align the time series of identical crops that are growing under different temperature regimes. The procedure is outlined in detail in Cintas et al. (2023). Next, depending on the product, either the original or GDD-normalized acquisitions were composited to 10 d regular timestamps using a median operator. The remaining missing values due to prolonged cloudy periods were linearly interpolated.
Sentinel-1 pre-processing consists first of an orbit direction selection in case both ascending and descending orbits are acquired over a region. This prevents mixing of backscatter signals under entirely different viewing conditions but also increases the generalizability of the system given that in most regions of the world only one orbit direction is acquired. The orbit direction selection is done by retrieving the times between subsequent acquisitions and selecting the orbit direction with the smallest maximum temporal gap. Speckle was reduced by applying a Gamma-MAP filter with a kernel size of 7 and an equivalent number of looks of 3, preserving the original spatial resolution while significantly reducing speckle noise in the signal. Next, crop-specific GDD normalization was done in the case of crop type mapping (Cintas et al., 2023). Finally, a 12 d compositing was performed using a mean operator, and any missing values (due to, for example, temporary unavailability of the satellite) were linearly interpolated.
The Landsat 8 Collection 2 Level 2 surface temperature band ST_B10 was first masked using an eroded and dilated version of the mask originally delivered with the product, in turn based on the CFMask (Foga et al., 2017) algorithm. The data were then composited into 16 d time series using a median filter. The remaining missing values in particularly cloudy periods were linearly interpolated.
Next to the main satellite inputs, the workflow also makes use of ancillary data sources. We used the Copernicus DEM - Global and European Digital Elevation Model (COP-DEM) at approximately 30 m spatial resolution (“GLO-30”). The original 30 m data were resampled to 20 m spatial resolution to align with the Sentinel-2 tile grid and to be compatible with the classification workflow. Another auxiliary layer is based on biome membership. Based on the 846 ecoregions of the Ecoregions2017 map (Dinerstein et al., 2017), the world was stratified into 13 biomes. Biome membership allows for a classification model for implicit grouping of training and inference data based on shared characteristics as described by their biome. These biomes were originally obtained as discrete vector polygons. Using these in the classification can cause the appearance of hard border artefacts in the products. To avoid these artefacts and reflect the natural and gradual transitions between biomes, we derived a set of continuous biome raster datasets. The original biome polygons were first simplified with a tolerance of 0.01∘, buffered at 0.05∘, and rasterized with a resolution of 0.01∘. The obtained raster datasets were then filtered with a Gaussian kernel of radius 0.5∘, with maximum amplitude of 1 at the centre and 0 at the borders. The resulting filtered biomes gradually transition from 0 to 1 in a range of 1∘ around the original discrete biome borders. This means that points close to the biome boundaries will have a certain degree of membership also with other nearby biomes, representing the gradual transition between different biomes.
3.3 Stratification
The WorldCereal classification system aims for product generation within 1 month after the end of a particular growing season. Due to the dynamic nature of these growing seasons across the globe, we created a stratification based on the global crop calendars discussed in Sect. 2.2. Regions sharing similar crop calendars were grouped into 203 homogenous agro-ecological zones (AEZs; Fig. 3) that are used as a mapping trigger for the system (Fig. 6 in Sect. 4). In addition, Buchhorn et al. (2020a) reported that classification algorithms for global mapping purposes are better adapted to sub-continental and continental patterns if they are trained and applied at sub-global scale. Therefore, we also stratified the global terrestrial regions into large biogeographical realms (Fig. 4) following the Ecoregions2017 dataset (Dinerstein et al., 2017). This allows for model training at realm level instead of global level, provided that sufficient training data are available (Sect. 3.5).
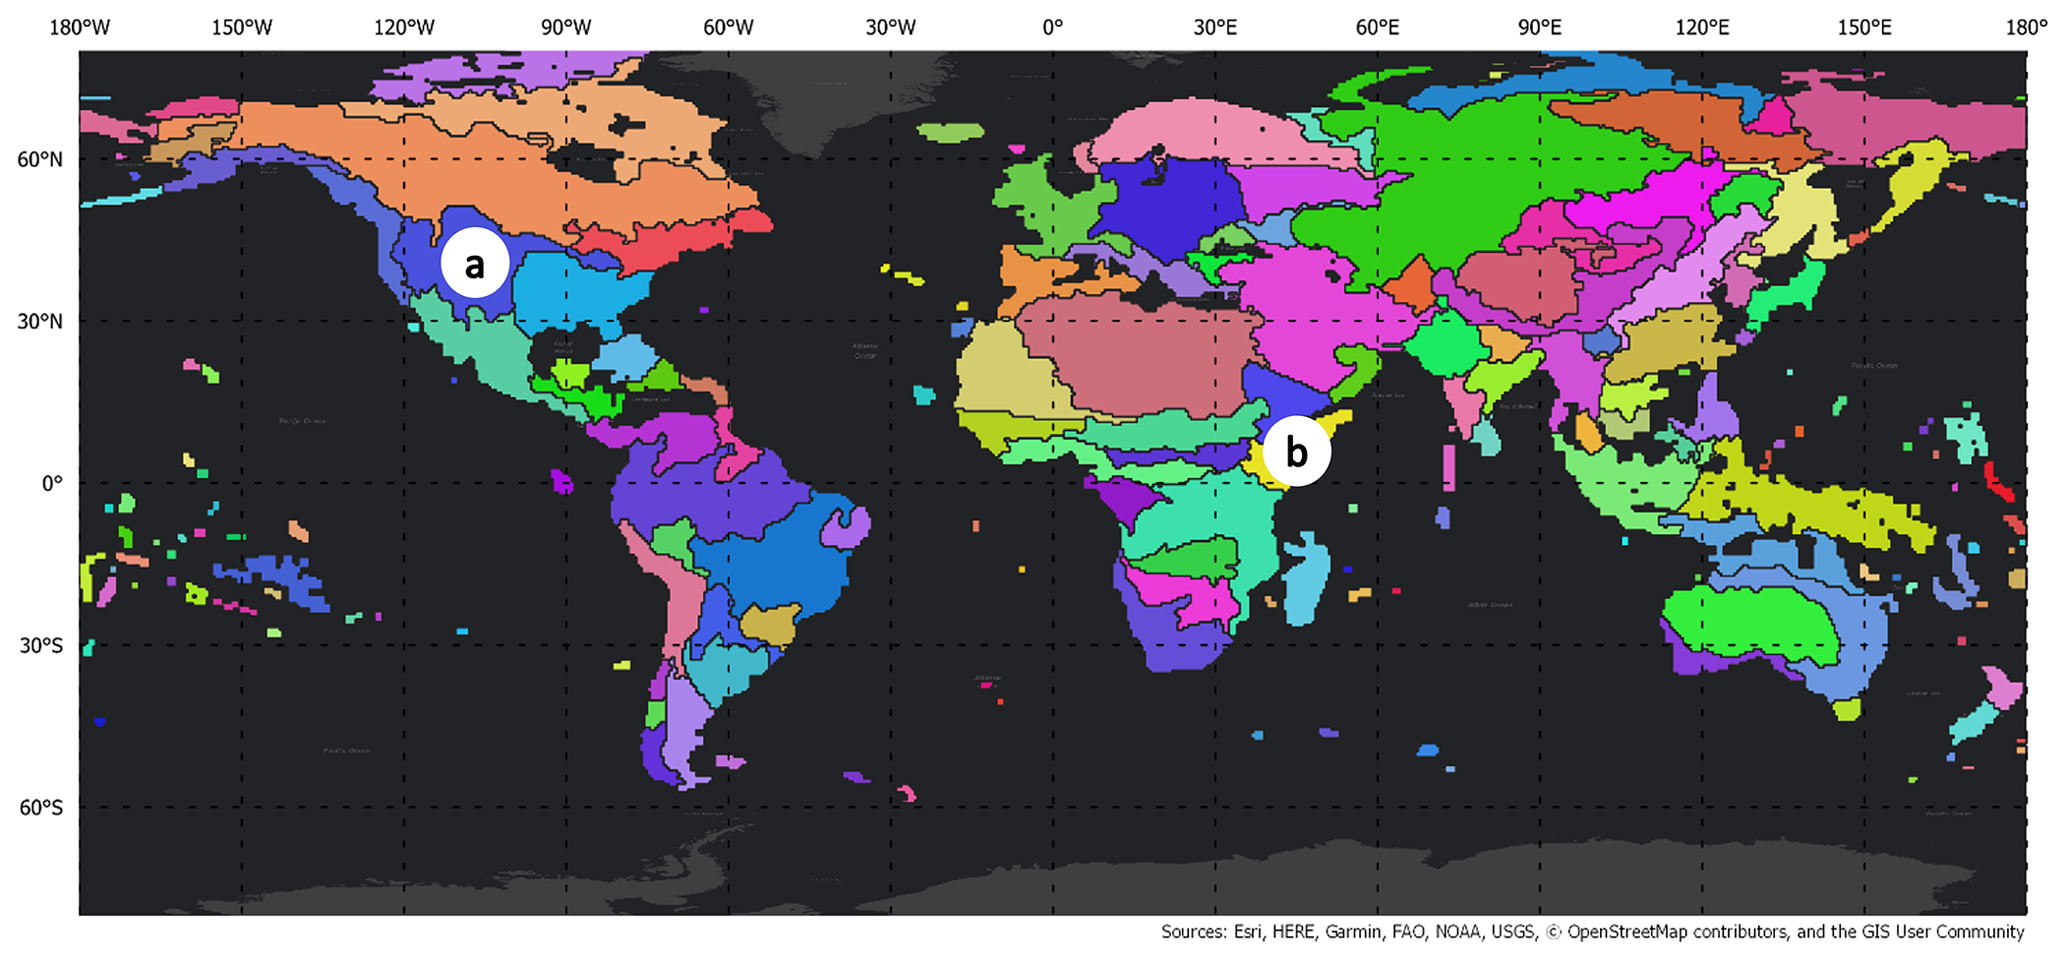
Figure 3Global stratification based on crop calendar similarity. Each resulting agro-ecological zone (AEZ) serves as a WorldCereal map trigger to generate products based on local seasonality, which is further demonstrated in Fig. 6. Letters (a) and (b) identify the specific AEZs used as input to generate Fig. 6.
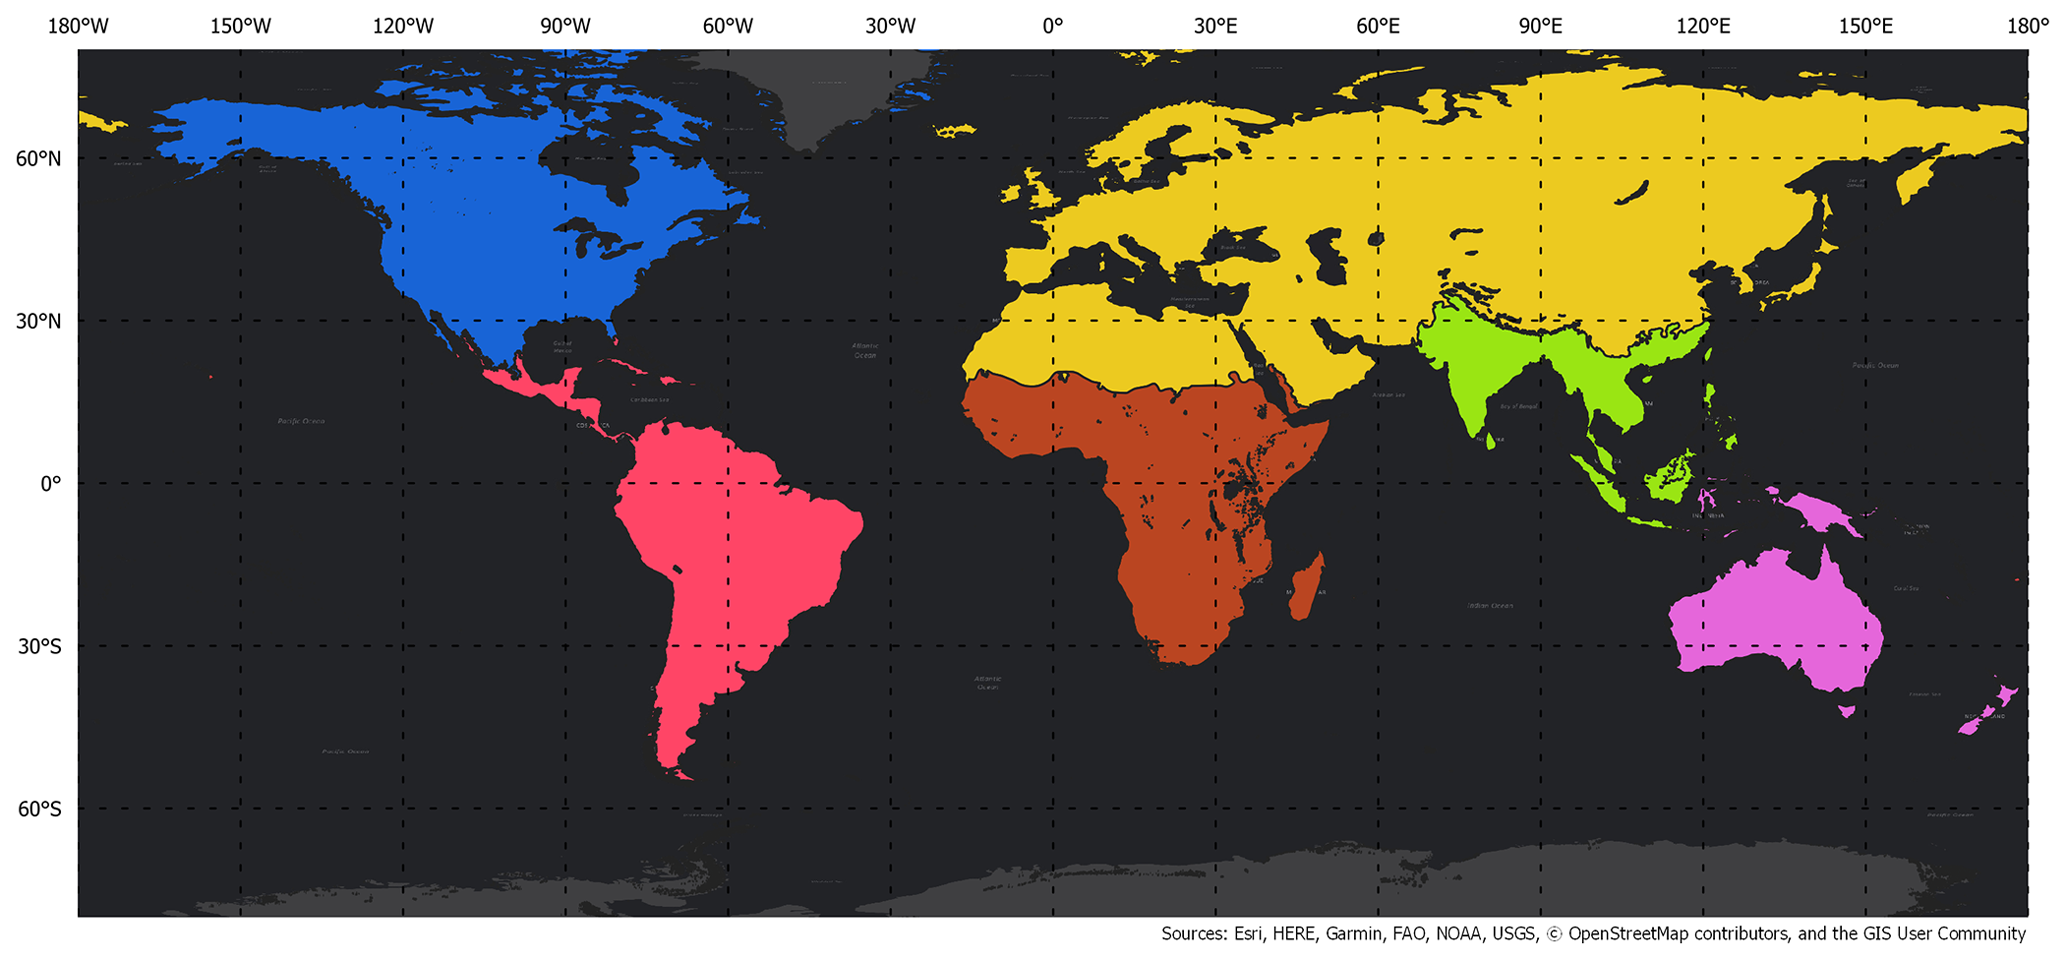
Figure 4Biogeographical realms used to train localized temporary crop extent models (Dinerstein et al., 2017).
3.4 Feature extraction
Classification features were derived from the five data sources discussed in Sect. 3.2, i.e. optical, radar, thermal infrared, DEM, and fuzzy biomes. Aside from the DEM and biomes, feature extraction always starts from pre-processed time series, either directly derived from the data source (e.g. Sentinel-2 reflectance bands) or a derived time series using a combination of multiple input variables (e.g. a spectral index). Exact timing and length of the time series was determined by the pixel-based crop calendars for the respective products (Sect. 2.2). Whereas different features were originally computed at the native spatial resolution of the input data source for computational purposes, in the end all features were resampled to 10 m resolution before being used as input in the classification models. In the remainder of this section, we describe in more detail the specific features that were computed for generating the different WorldCereal products.
3.4.1 Temporary crop mapping features
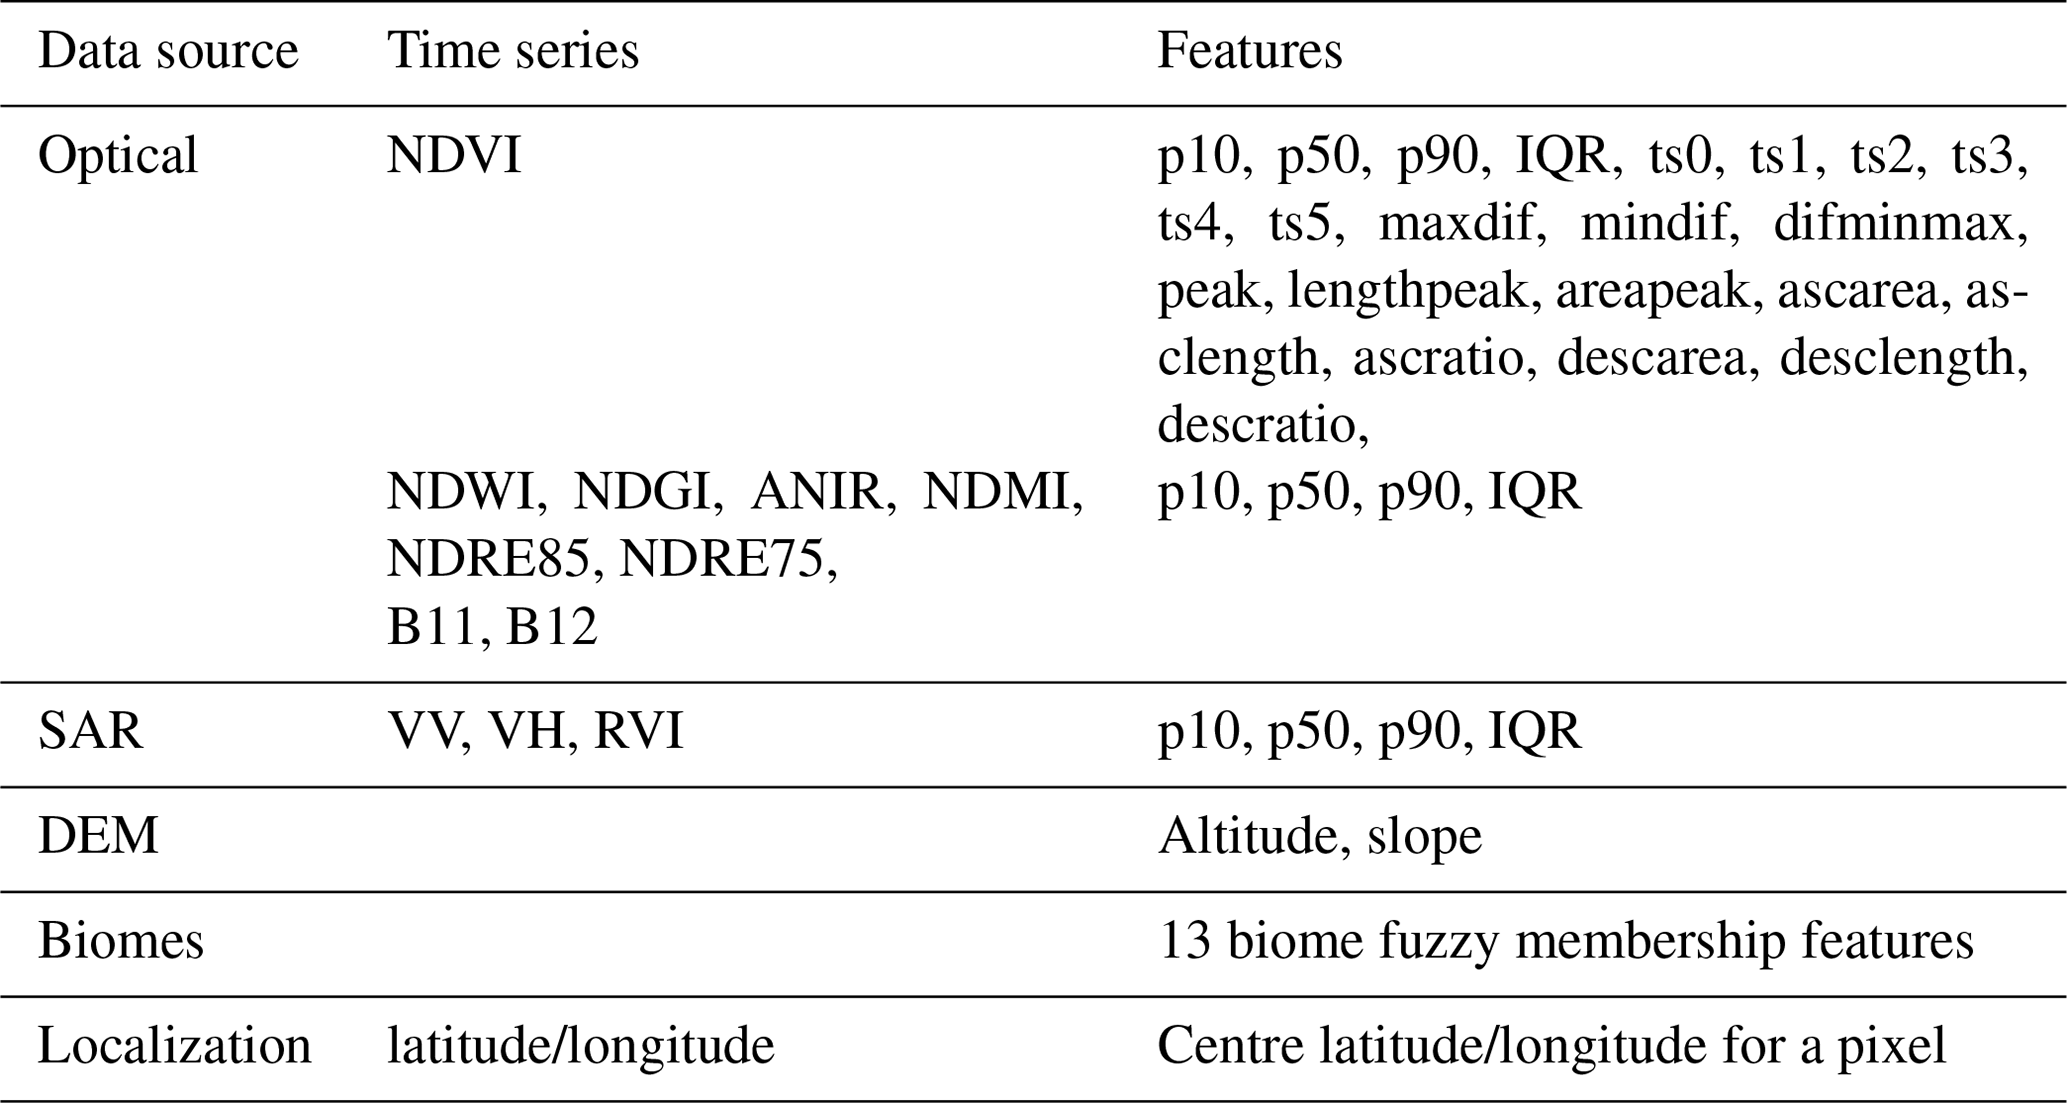
Mapping temporary crops using satellite data remains challenging in many regions, due to the variability in agricultural landscapes, spectral similarity with other land cover classes, fallow practices, and cloud obstruction during the growing season (Vancutsem et al., 2013). Defining a robust and characteristic set of features that separates temporary crops from all other land cover classes is therefore key. From the Sentinel-2 optical pre-processed inputs, we computed the following vegetation indices which have a proven record for mapping cropland (Valero et al., 2016; Nakalembe et al., 2021; Thenkabail et al., 2021; Potapov et al., 2022): normalized difference vegetation index (NDVI), normalized difference water index (NDWI), normalized difference greenness index (NDGI), angle on near-infrared (ANIR), normalized difference moisture index (NDMI), and two normalized difference red edge indices (NDRE85 and NDRE75). The reader is referred to Table S1 for more information on these indices. Together with the short-wave-infrared bands B11 and B12, we summarized these time series using the 10th (p10), 50th (p50), and 90th (p90) percentiles as well as the interquartile range (IQR). For NDVI in particular, the temporal profile was captured in more detail by sampling the time series at six positions spread evenly throughout its length (resulting in six additional features, ts0–ts5) and by computing 12 of the temporal features based on the work by Valero et al. (2016). As for Sentinel-1 SAR (synthetic aperture radar) features, three time series were used as the basis for feature computation, i.e. VV, VH backscatter, and the radar vegetation index (RVI), all of which have proven their use in crop mapping studies (Kenduiywo et al., 2018; Van Tricht et al., 2018; Mandal et al., 2020). These time series were summarized using the p10, p50, and p90 percentiles as well as the IQR. DEM altitude and slope and fuzzy biome membership features were included, as well. Finally, positional features latitude and longitude were also added, which we call localization features. Localization features allow classification algorithms to become “spatially aware” and hence gain knowledge on where training or inference data are originating from. To avoid overfitting on exact combinations of latitude and longitude and at the same time to reduce the risk of inferior product quality in data-sparse regions, random perturbations of up to 2.5 and 10∘ (ranges determined empirically) were added during training to latitude and longitude, respectively. The complete list of features used for temporary crop mapping is provided in Table 1.
3.4.2 Crop type mapping features
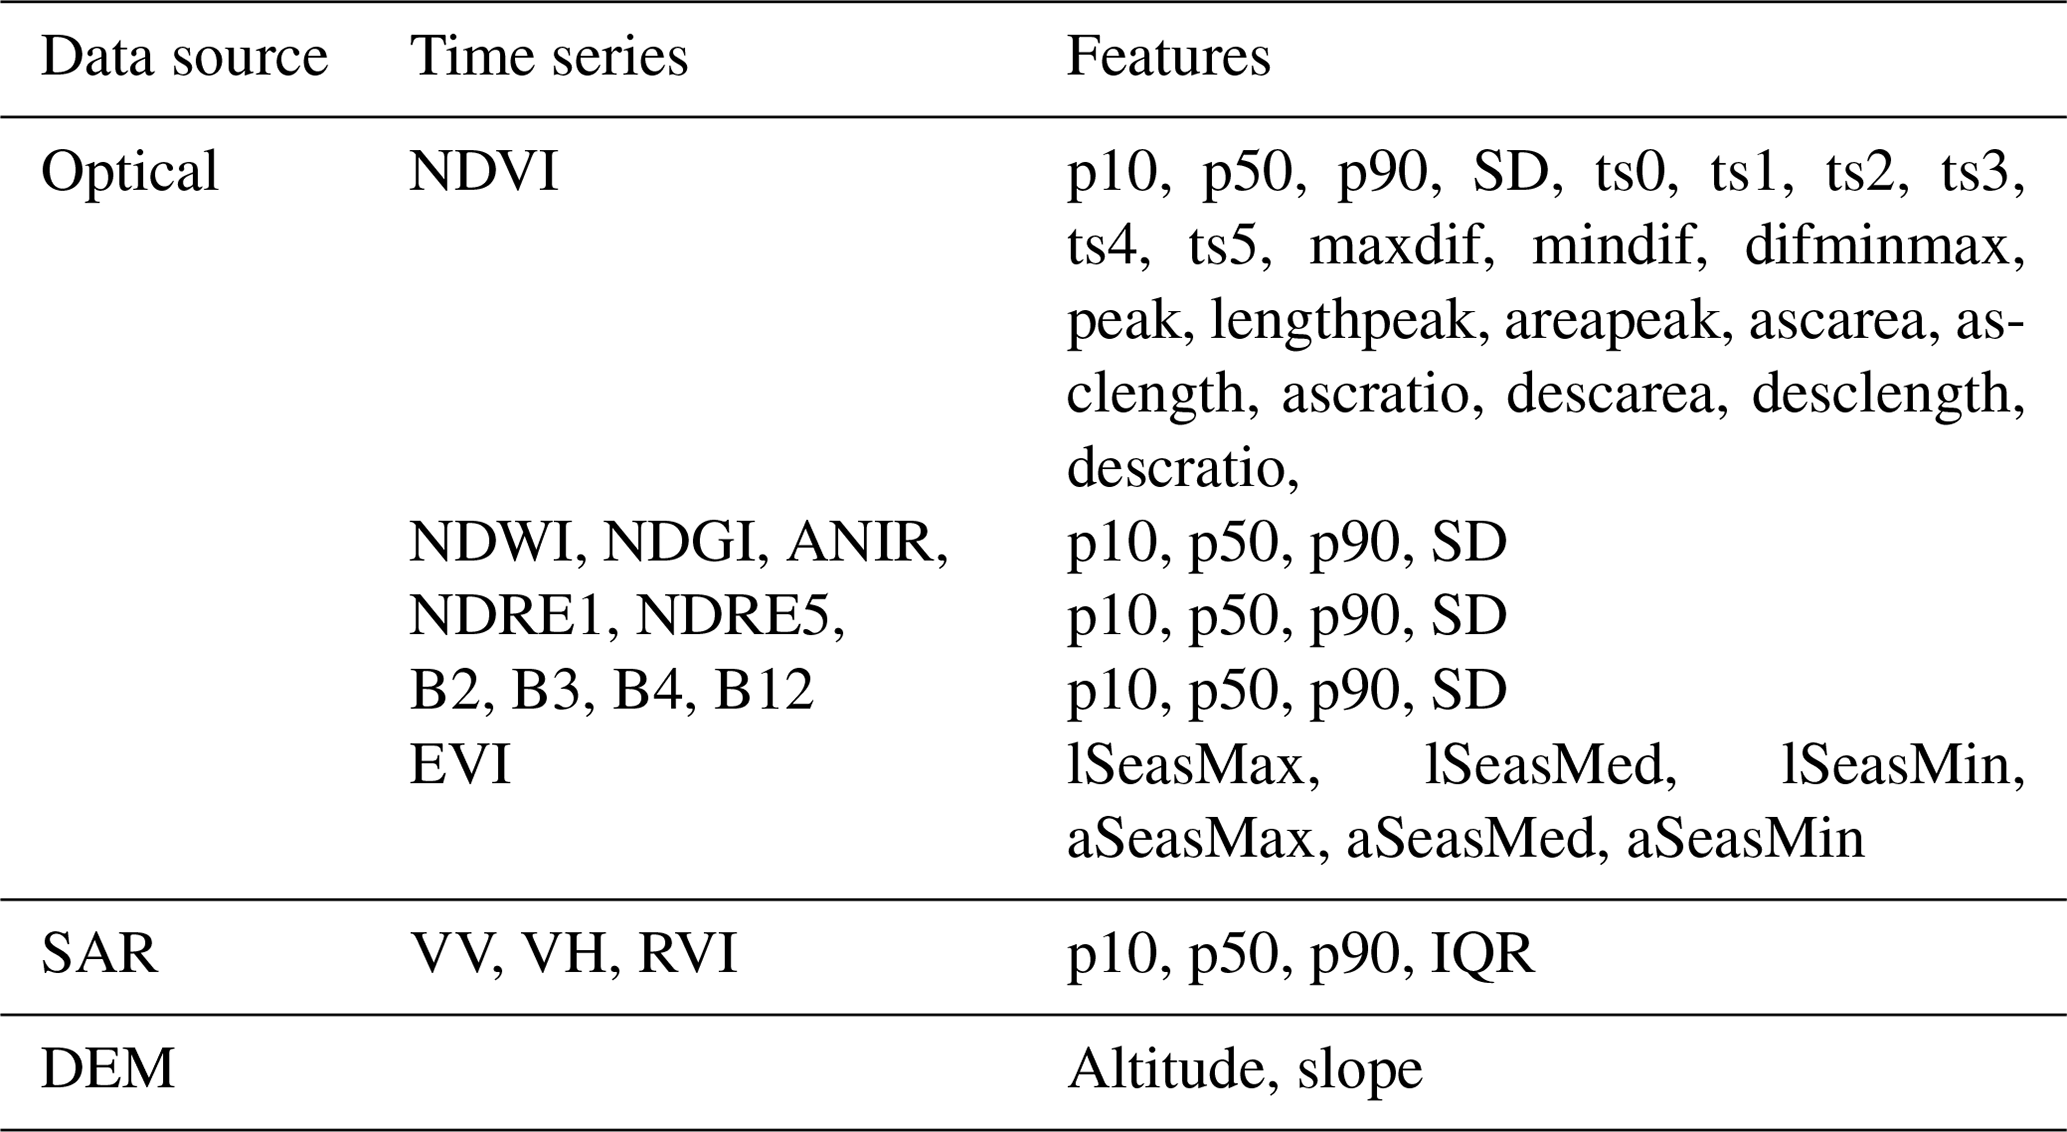
Specific crop type identification within the temporary crop mask started from a similar collection of features as for temporary crop mapping. To further enrich the feature set for distinguishing between different crop types, the standard deviation (SD) temporal statistic was added, in addition to the Sentinel-2 RGB bands (B02, B03, B04). We also computed the enhanced vegetation index (EVI), which was used to automatically detect the growing seasons in a time series, based on the method described by Bolton et al. (2020). Outputs of the season detection algorithm include the number of detected growing seasons and for each season the dates of its start, peak, and end. Based on these outputs, minimum, median, and maximum of both the length and EVI amplitude for all detected seasons were derived and added as classification features. Biome and localization features, in turn, were not included because of insufficient global coverage of training data to cover all possible biome and localization combinations. The full feature set is described in Table 2. The seasonality detection is also used in the WorldCereal system to generate a seasonal active cropland layer (see Sect. 2.5).
3.4.3 Irrigation mapping features
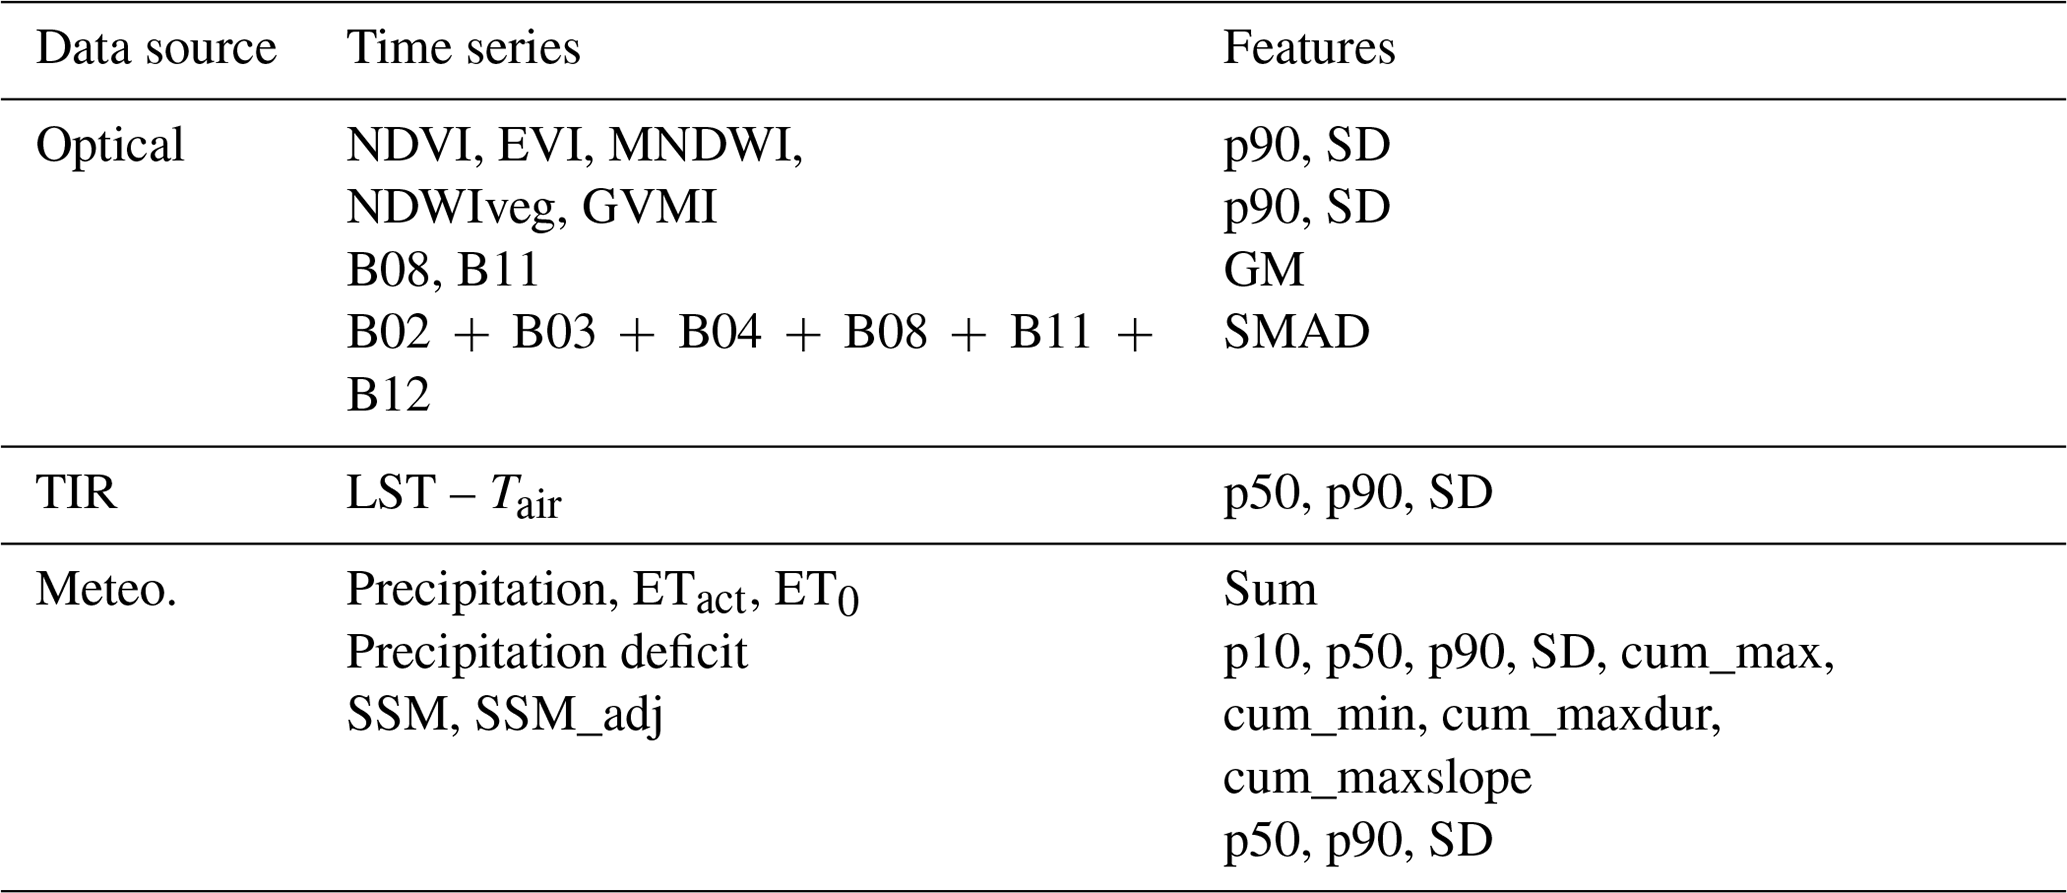
The feature collection of the WorldCereal irrigation model focuses on optical and thermal satellite observations from Sentinel-2 and Landsat 8, respectively, in combination with meteorological data from AgERA5. The basic features of the algorithm are pure Sentinel-2-based indices, such as NDVI, NDWI, modified normalized difference water index (MNDWI), EVI, and global vegetation moisture index (GVMI) (see Table S1). These features can explain the health of a crop or if a crop is experiencing any form of stress. To prevent overfitting of the model, only the p90 and SD were calculated for these indices and added as features to the model. The p90 explains if a crop was able to flourish, potentially because of irrigation, or if a crop showed clear signs of stress. The SD is used to understand how dynamic the growing season of a crop was. A more advanced feature based on multiple Sentinel-2 bands is the spectral (cosine) median absolute deviation (SMAD). This feature highlights the temporal variation of multiple optical bands and has a positive impact on the detection of irrigation (Wellington and Renzullo, 2021). Finally, also the geomedian (GM) calculated for the near-infrared and short-wave-infrared bands of Sentinel-2 were added to the model to emphasize the absorption patterns of chlorophyll and water.
Second, the relation between the air temperature (Tair) and land surface temperature (LST) is used to further understand the stress conditions of a crop. Under well-watered conditions, the difference between Tair and LST is minimal, because the crop is cooling itself through transpiration processes. An increasing difference between Tair and LST indicates that the crop is unable to transpire to its maximum potential and that stomata are being closed; additional water is necessary for the crop to continue growing.
The third feature set focuses on the impact of irrigation on evapotranspiration (ET). Similar to the proposed Sentinel-2-based indices, ET indicates if a crop can thrive or not. Modelling the actual ET (ETact) using remote sensing data is complex and requires many inputs. To increase the computational efficiency of the model, a simple relation between the reference evapotranspiration (ET0) and the NDVI is used to calculate the actual ETact. This relation is based on the work of Kamble et al. (2013). The ET0 is calculated using AgERA5 data and relies on the Penman–Monteith equations (Allen et al., 1998). Since ET only explains if a crop is thriving and cannot help making a distinction between a rainfed crop in a humid climate or an irrigated crop in a more arid climate, precipitation data were added. The resulting precipitation deficit (Pdef) explains the difference between evapotranspiration and precipitation, where a large Pdef can be the result of extensive irrigation. From the Pdef time series, multiple features were calculated. The basic features are p10, p50, and p90, followed by the SD of the ET data. Additionally, the cumulative Pdef was calculated to understand the trend, longevity, and severity of the precipitation deficit. From this cumulative Pdef, the maximum and minimum were calculated, together with the maximum duration of a positive Pdef and the maximum slope of the cumulative Pdef curve. To conclude, also the sum divided by the length of the growing season of the ET0, ETact, and P were added as features to the algorithm. The duration of a positive cumulative Pdef, the maximum cumulative Pdef, and the minimum cumulative Pdef were also divided by the length of the season. These divisions were made to ensure that there is no bias towards regions with longer growing seasons.
Finally, to also include the relation between soil moisture and irrigation, the optical trapezoid model (OPTRAM; Sadeghi et al., 2017) was used. This model focuses on the relationship between short-wave infrared reflectance and the NDVI. In this model, the short-wave infrared reflectance is converted into surface-transformed reflectance (STR). A trapezoidal model relies on a predefined wet and dry edge. These edges explain at which NDVI and STR value the soil is saturated or at its wilting point. In contrast to the original OPTRAM model, the edges are defined by grouping the STR data of one growing season by discrete NDVI steps. The dry edge of each step is represented by the minimum STR value within that specific step. The wet edge is calculated by adding the median STR with the standard deviation of the STR to prevent the model from becoming too sensitive to oversaturated conditions, which is a known issue (Sadeghi et al., 2017). The final wet and dry edges are calculated by applying a linear regression through all the individual wet and dry edge values. For this soil moisture data, p50, p90, and SD were calculated and used as features. The final feature set was based on the correlation between the precipitation and the OPTRAM-based soil moisture content. A high correlation indicates that an increase in soil moisture is primarily driven by precipitation. A low correlation, on the other hand, might indicate that other factors, like irrigation, could have caused the increase in soil moisture content. For this dataset, also p50, p90, and SD were calculated. Table 3 shows an overview of all the features used in the irrigation classification algorithm.
3.5 Classification
The classification algorithms are based on a CatBoost model, which is a high-performance model architecture for gradient boosting on decision trees (Prokhorenkova et al., 2018). Input to the respective algorithms were the features listed in Tables 1–3. The output of each model is a binary classification of the inputs into the class of interest vs. all other classes. For the temporary crop map, this means a binary classification of temporary crops vs. all other land cover types. For seasonal crop type maps, this means maize or cereals vs. all other crops. For irrigation maps, actively irrigated crops are mapped against rainfed crops. As discussed in Sect. 3.3, separate temporary crop mapping models were trained for each realm. Crop type and irrigation models were trained at the global level because of a lack of sufficient training samples in each individual realm. The models were trained on their respective seasonal training features: we trained temporary crop models based on annual features; a winter cereals model was trained based on the main wheat season features; a spring cereals model was trained using the features from the maize season in selected northern zones that are known to grow spring cereals; and a maize model was trained on the combined features of up to two maize seasons. For each model, the training data were randomly divided into 70 % calibration, 20 % validation, and 10 % test samples. During training, only calibration and validation samples were used, while test samples were retained for performance assessment. Each model was trained with a maximum of 4000 iterations, a depth of 8, a learning rate of 0.05, and early stopping activation after 40 rounds without improvement. The distribution of the binarized training samples is imbalanced, the degree by which depends on the availability of different sources of reference datasets. To cope with this imbalance, we computed the class weights that balance the distribution, which we then used for loss weighting to eliminate the imbalance problem. In addition to these class weights, sample-specific weights were also adjusted based on the confidence score of the respective reference dataset they were originating from (see Sect. 3.1). It is important to note that the models were trained on the combined training data from the available years (2017–2021) without providing year-specific information to the model. The aim was to train generalized models across multiple years that do not specifically require new training data in unseen years.
As a complementary product of the binary prediction, the models also provide binary class probabilities which we used to assess the pixel-based model's confidence in its prediction. Unconfident model predictions are characterized by binary probabilities close to 0.5, while confident model predictions are close to 0 or 1. Therefore, we defined model confidence as a value between 0 and 100, computed using Eq. (1).
where “probability” is the class probability of the winning class (≥0.5). Note that this model confidence score simply reflects how certain the model is of its prediction, based on what it has learnt from the training data, and does not reflect actual accuracy based on independent validation data.
3.6 Post-processing
Since classification was done on a per-pixel basis, no contextual information was taken into account in the workflow. This can lead to the so-called salt-and-pepper effect in the output product (Hirayama et al., 2019). We therefore applied the majority filter technique (Stuckens et al., 2000) to reduce this effect and used a kernel size of 5 pixels for the temporary crops product and 7 pixels for the crop type and irrigation products. To retain high-confidence model predictions, we switched off majority filtering for those pixels that had a model confidence of ≥0.85 for temporary crops and ≥0.75 for crop type and irrigation.
Consistency between the different products was ensured during post-processing in three ways. First, a positive crop detection by one of the crop type models in a season automatically identifies a pixel as active cropland for that particular season. Second, a pixel marked as inactive in a season automatically sets that pixel to rainfed in the irrigation product. Third, any overlap between different crop type products within the same growing season was resolved by retaining the crop type with the highest model confidence. Different seasons, even when partly overlapping, were not subject to conflict resolving as they were processed independently and at different times.
3.7 Validation
The validation approach differs from product to product, depending on quality and availability of reference datasets that were not used during model training and hence available for independent validation.
3.7.1 Annual temporary crop maps
We followed the guidelines for rigorous accuracy assessment provided in Stehman and Foody (2019) and Szantoi et al. (2021). To validate the annual temporary crop products, a new validation dataset (Lesiv et al., 2023b) was created which is completely independent from all other existing maps or reference datasets and which is in line with the cropland definition and mapping period of the WorldCereal products as outlined in Sect. 2. The sampling design of the validation dataset is probabilistic with a random distribution of sample sites. The validation sample sites were generated before the WorldCereal products were produced. Therefore, to avoid issues with inclusion probabilities, we selected a random sample design in equal area projection (Goode Homolosine). Considering that arable land covers approximately up to 10 % of all land, the sample size consisted of 50 000 unique sample sites, with possibly up to 5000 sample sites labelled as temporary crops. Response design has been implemented in the Geo-Wiki application (Fritz et al., 2012), where each validation sample site has been visually interpreted by several experts. To decide if a sample is covered by temporary crops in a given period of time, the experts looked at very high-resolution Google historical imagery and Google Street View images, Microsoft Bing images, ESRI imagery, Planet historical data, Sentinel-2 time series, and MODIS NDVI time series. The validation sample sites where the experts disagreed on temporary crop presence were revisited and revised.
By using the new validation dataset, we calculated confusion matrices with accuracy metrics such as overall, user's and producer's accuracies. To calculate 95 % confidence intervals for each metric, we applied bootstrapping with replacement (Schreuder et al., 2004; Szantoi et al., 2021). Unlike the original method proposed by Stehman and Foody (2019), this bootstrapping approach does not require the assumption of a normal distribution and takes full advantage of today's computational power for estimating confidence intervals. All the calculations were done at global level and by continents.
3.7.2 Seasonal crop type maps
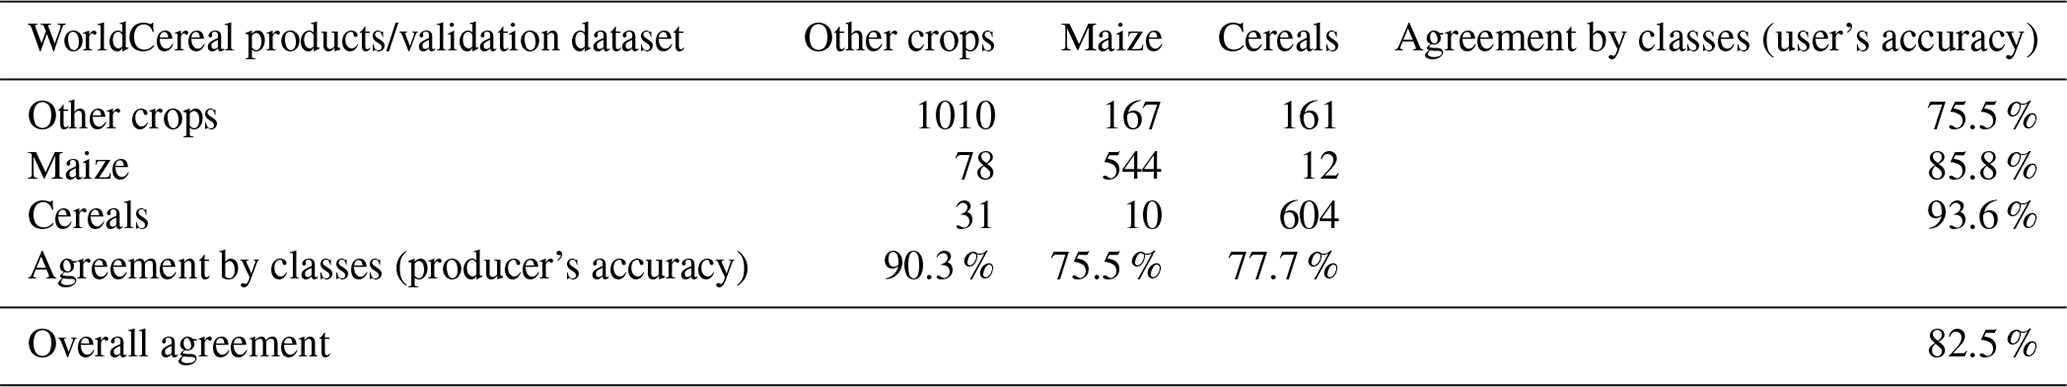
The coverage and availability of crop type information for the year 2021 is limited. Therefore, to get a global overview of the quality of the crop type products, we decided to invest in a new crop type validation dataset (Lesiv et al., 2023a). This dataset was created by using a new IIASA tool, called “Street Imagery validation” (https://svweb.cloud.geo-wiki.org/, last access: 10 May 2023), where users could check street level images (e.g. Google Street View images, Mapillary, etc.) and identify the crop type where it is possible. The advantage of this tool is that there are plenty of georeferenced images with dates, going back in time. The disadvantage is that users need to check plenty of images where only few will clearly show cropland fields that are mature enough to be identified. To make the data collection more efficient, we provided our experts with preliminary maps of points in agricultural areas where street level images are available for the year 2021. Then, the experts checked those locations in an opportunistic way. In total, we collected around 3500 unique locations, distributed around the globe (Fig. 5) and matching the WorldCereal 2021 mapped seasons (Table 4). After discarding perennial crops and locations outside the WorldCereal temporary crop mask, 2617 samples remained for crop type validation. This dataset is completely independent from all the existing maps and reference datasets. Since it is not a subset from the training dataset, there are no potential issues related to spatial autocorrelation between training and validation datasets. Though, it has a limitation – the sample design is not probabilistic. By using the new validation dataset on crop type, we calculated a confusion matrix with metrics, which we called overall agreement and agreement by classes. We did not use the term “accuracy” since the sample design is not probabilistic. In addition to this global effort, comparisons were performed with publicly available regional in situ reference datasets (Sect. 3.1) and randomly sampled locations from existing crop type maps (USDA National Agricultural Statistics Service Cropland Data Layer, 2021) to further demonstrate crop type product quality.
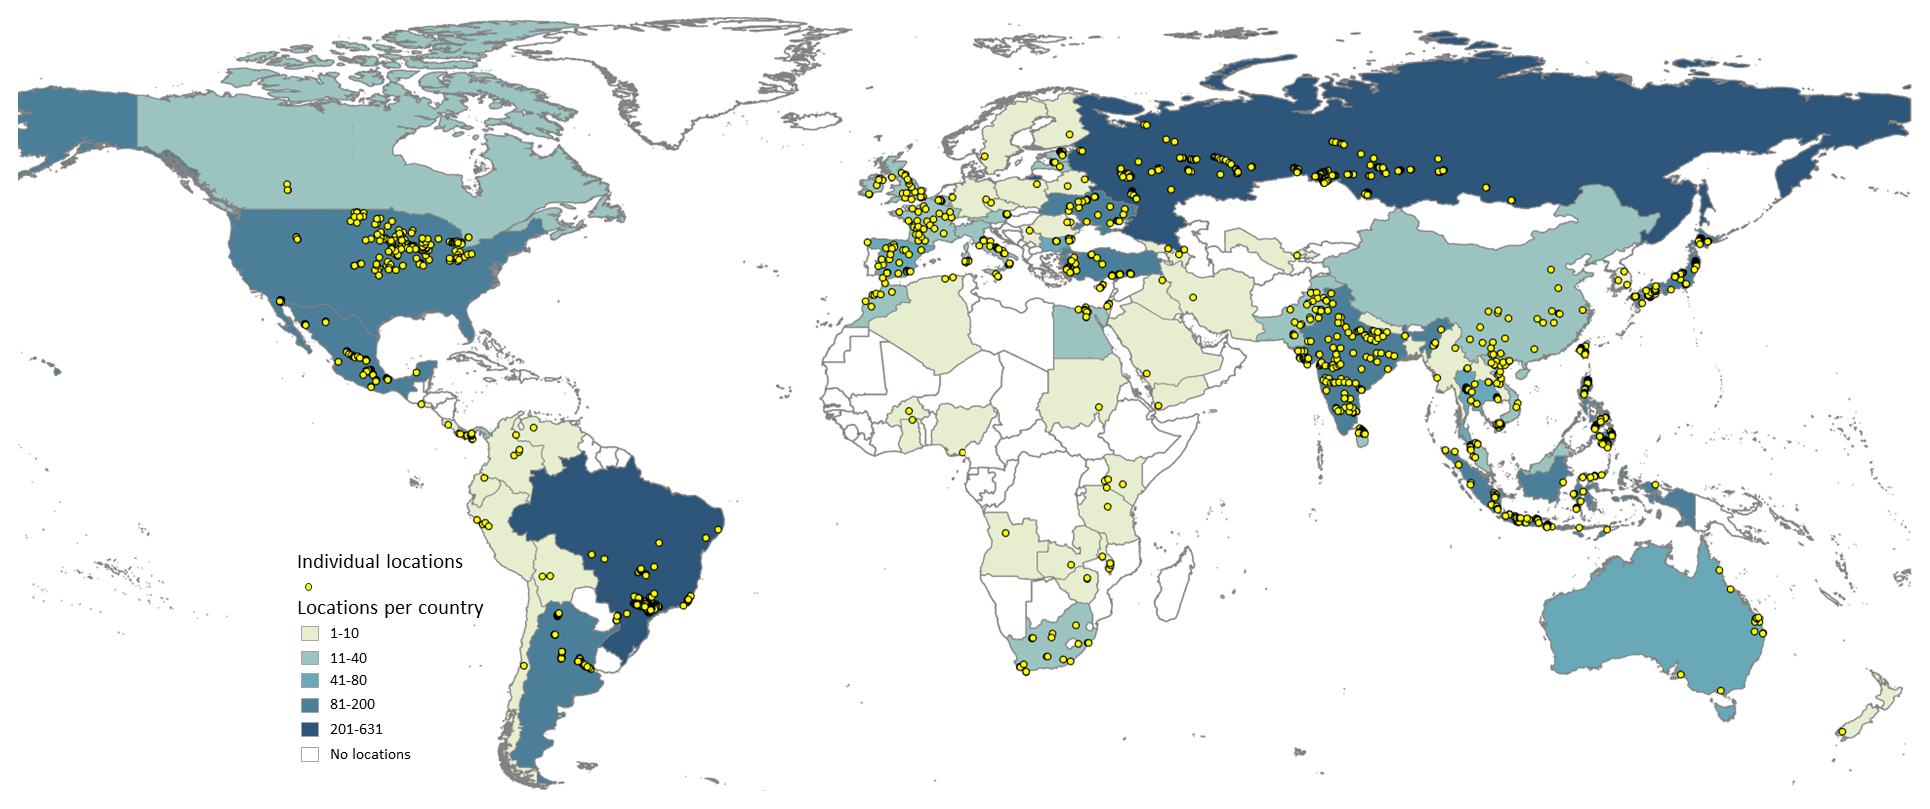
Figure 5Locations with identified crop type across the globe, using the Street Imagery validation tool. Base map source: http://GADM.org (last access: 1 May 2023).
3.7.3 Seasonal active irrigation maps
The amount of total land that is being irrigated differs from year to year, heavily depending on weather conditions. As mentioned in the description of training data, there is very limited information available about actual irrigation of cropland fields, giving us little means to run a quantitative validation of irrigation products as such, especially by season. For irrigation we hence focus on a qualitative assessment, by spatially comparing the WorldCereal irrigation products with two open-access datasets: (i) Global map of areas equipped for irrigation expressed as percentages, produced by FAO (Siebert et al., 2013); and (ii) the Landsat-Derived Global Rainfed and Irrigated-Cropland Product at 30 m (LGRIP30) (Teluguntla et al., 2023). To this end, the WorldCereal seasonal irrigation products were combined into an annual product and subsequently (together with the LGRIP30 map) aggregated to match the resolution of the FAO map (0.083∘). This combined irrigated-area map describes if in any of the three seasons within the same year a pixel is being classified as irrigated. Finally, we have compared the WorldCereal irrigation products with country statistics on irrigated land from the International Commission on Irrigation and Drainage (ICID) (ICID, 2022).
3.7.4 Seasonal active cropland maps
Provided the strict definition of the seasonal active cropland maps, no ground truth data are available for validating this specific product. This marker is therefore to be used for informative purposes and only as an indication whether or not a full growing season was detected by the WorldCereal system. Note that the quality of this product is expected to be lower in regions with few valid (non-cloudy) optical observations, as this is the only input used for delineating the growing season and determining active crop growth (see Sect. 2.5).
The WorldCereal system was demonstrated at scale by globally following the crop calendars described in Sect. 2.2 for the year 2021 and generating all WorldCereal products associated with each of these seasons. The resulting seasonal products are listed in Table 4, whereas Fig. 6 illustrates how the temporal validity of these products is defined in function of the AEZ. A temporary crop map was generated based on 1 year of input data, described by the “tc-annual” season. Within the resulting temporary crop mask, winter cereals, spring cereals, and maize maps were generated within their respective seasons. Active cropland and active irrigation maps were generated for each of these seasons next to the crop type maps. The WorldCereal system works at Sentinel-2 tile level, with each tile being subdivided into 10×10 km blocks to ensure memory-efficient processing. Prior to global processing, a global agricultural mask was developed to determine which tiles could be excluded because of their distance to the closest agricultural area. This agricultural mask was largely based on the 2019 Copernicus Global Land Cover product v3 (Buchhorn et al., 2020b): each 10×10 km processing block showing a fraction of agricultural land lower than 1 % was initially excluded from the processing list. The area to be processed was cleaned and expanded by subsequently applying an erosion and dilation operation using a 20 and 40 km radius, respectively. After additional cleaning through visual analysis, the mask was resampled to Sentinel-2 tile level using a conservative approach: only if all of the tiles were flagged as containing no cropland, the tile was excluded from further analysis. This resulted in a total of 11 867 out of 18 537 Sentinel-2 tiles to be processed by the WorldCereal system (see Fig. S1). All other Sentinel-2 tiles were considered to contain no temporary crops in the WorldCereal product layers. Of the original 203 WorldCereal AEZ across the globe (Fig. 3), 106 zones intersect with tiles that were processed, and products were therefore generated for those zones (see Sect. 6).
Table 4WorldCereal seasonal products. The name of the season is provided with the associated product layers. Abbreviations for each product are defined here for use in Fig. 6.
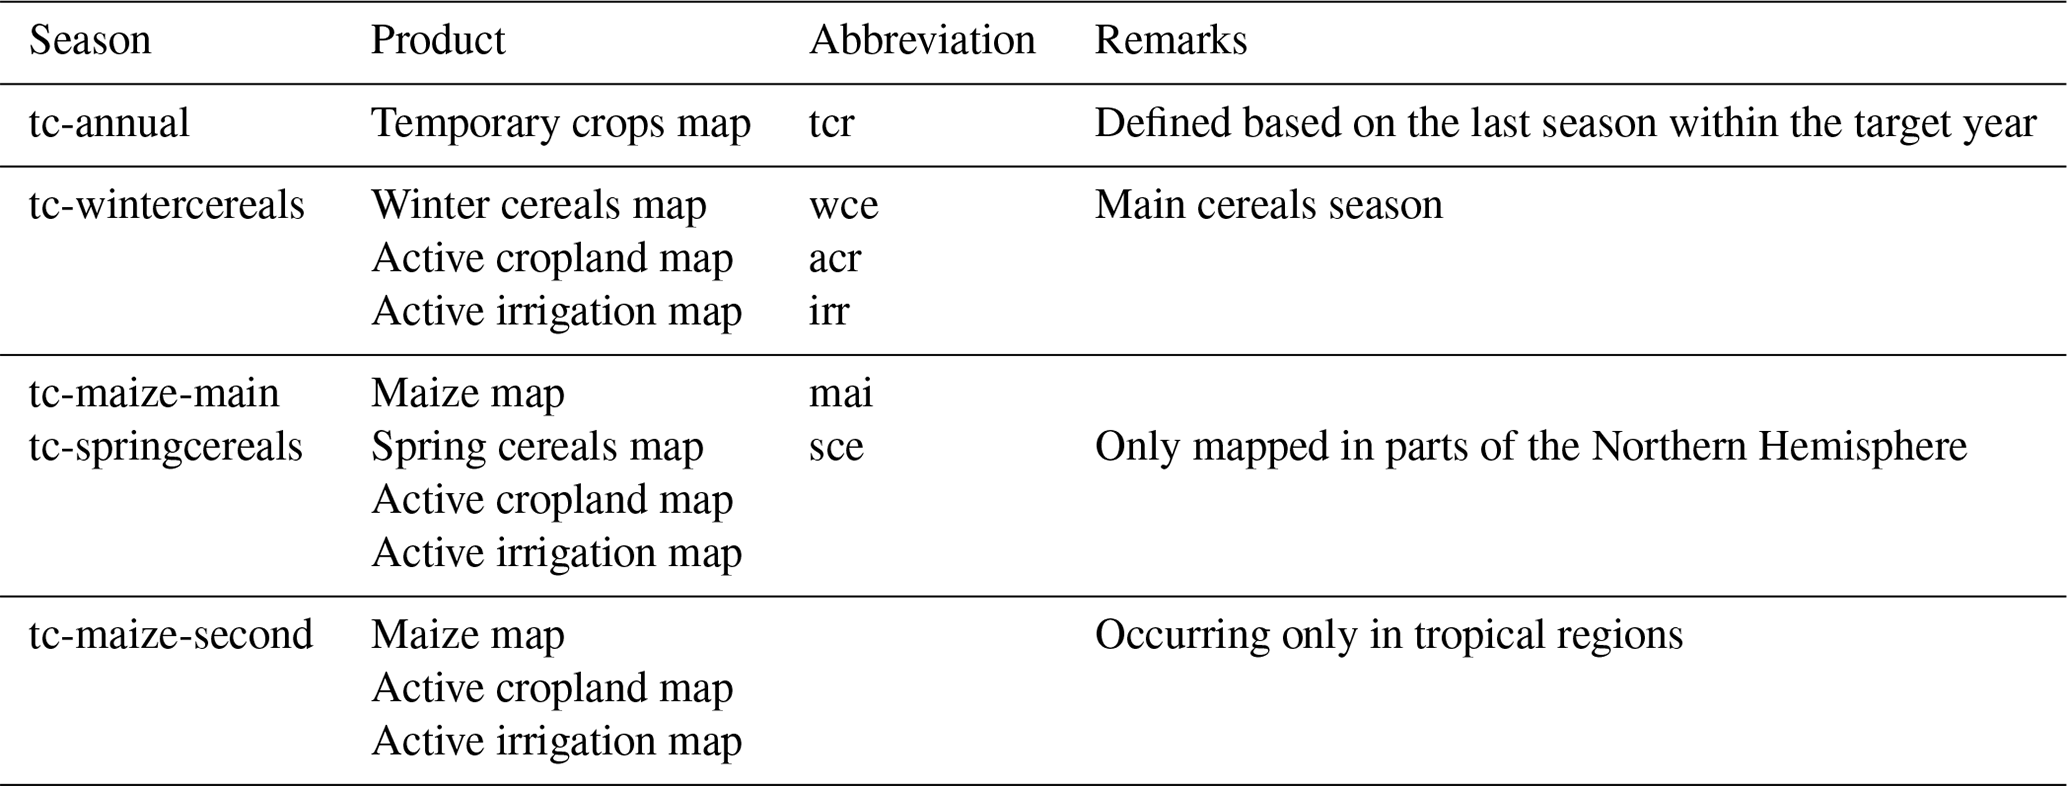
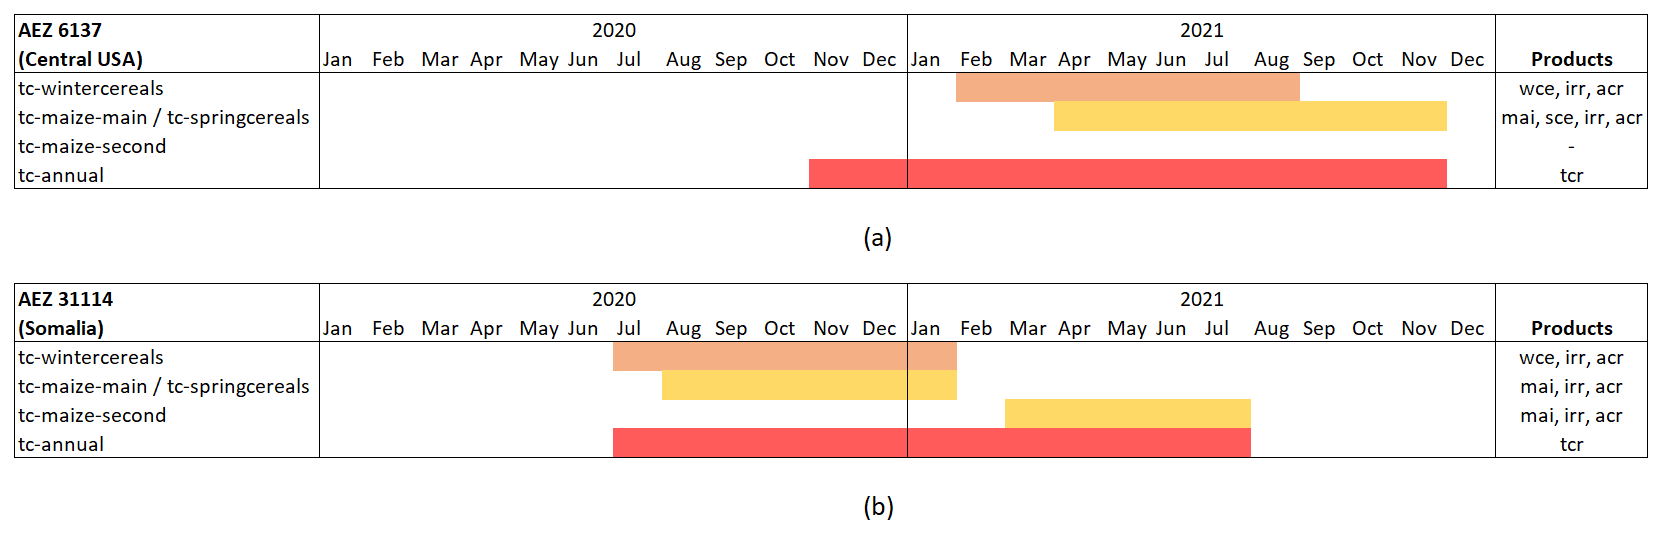
Figure 6Demonstration of WorldCereal 2021 product generation and timing for two distinctive agro-ecological zones (AEZs). (a) AEZ located in central USA, where only one maize season occurs and spring cereals are mapped jointly with maize, and (b) AEZ located in Somalia, where two maize seasons occur and no spring cereals are mapped. The coloured bars indicate the timing of the considered growing seasons and hence the extent of required satellite time series. Product abbreviations are explained in Table 4, whereas locations of AEZs are highlighted in Fig. 3.
4.1 Temporary crop extent map
The global temporary crop extent map for 2021 shows the occurrence of at least one temporary crop over the course of 1 year at 10 m resolution. The result is shown in Fig. 7, where the original product was downsampled to ∼0.004∘ resolution. Although this figure seemingly shows one global layer, it was in fact generated at different times during the calendar year for the individual zones described in Sect. 3.3, respecting their regional seasonality.
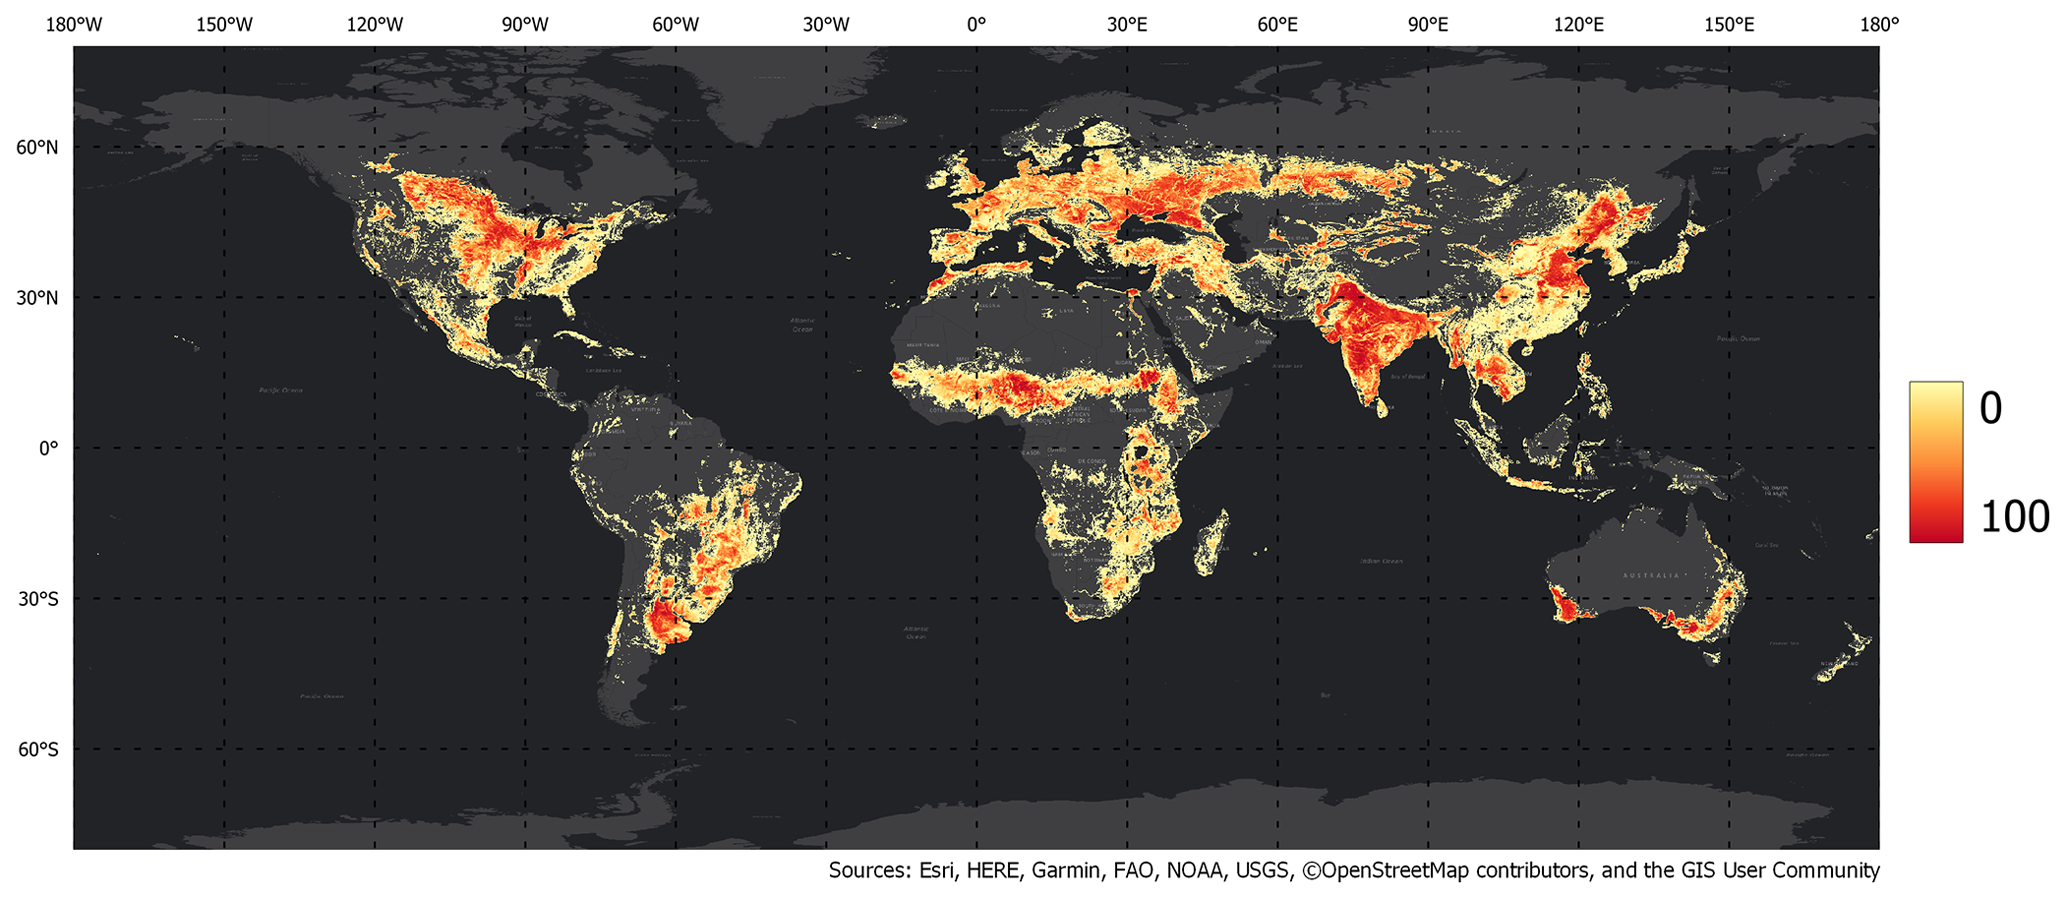
Figure 7WorldCereal 2021 temporary crop extent map. The original 10 m product was resampled to ∼0.004∘ resolution, showing the fraction of the original 10 m pixels that were labelled as temporary crops. This global overview consists of a mosaic of the individual zones for which the product was generated.
4.2 Seasonal crop type maps
The seasonal crop type maps were generated separately for each growing season defined in the individual zones (Fig. 3). By mosaicking the individual zones, global seasonal cereals and maize maps at 10 m resolution were generated, which in turn were resampled to ∼0.004∘ resolution (Fig. 8). Maize and spring cereals were generated during the same growing season (tc-maize-main). Overlap between these two products was resolved during post-processing (Sect. 3.6). No conflict resolving was done between different seasons, as these were processed independently.
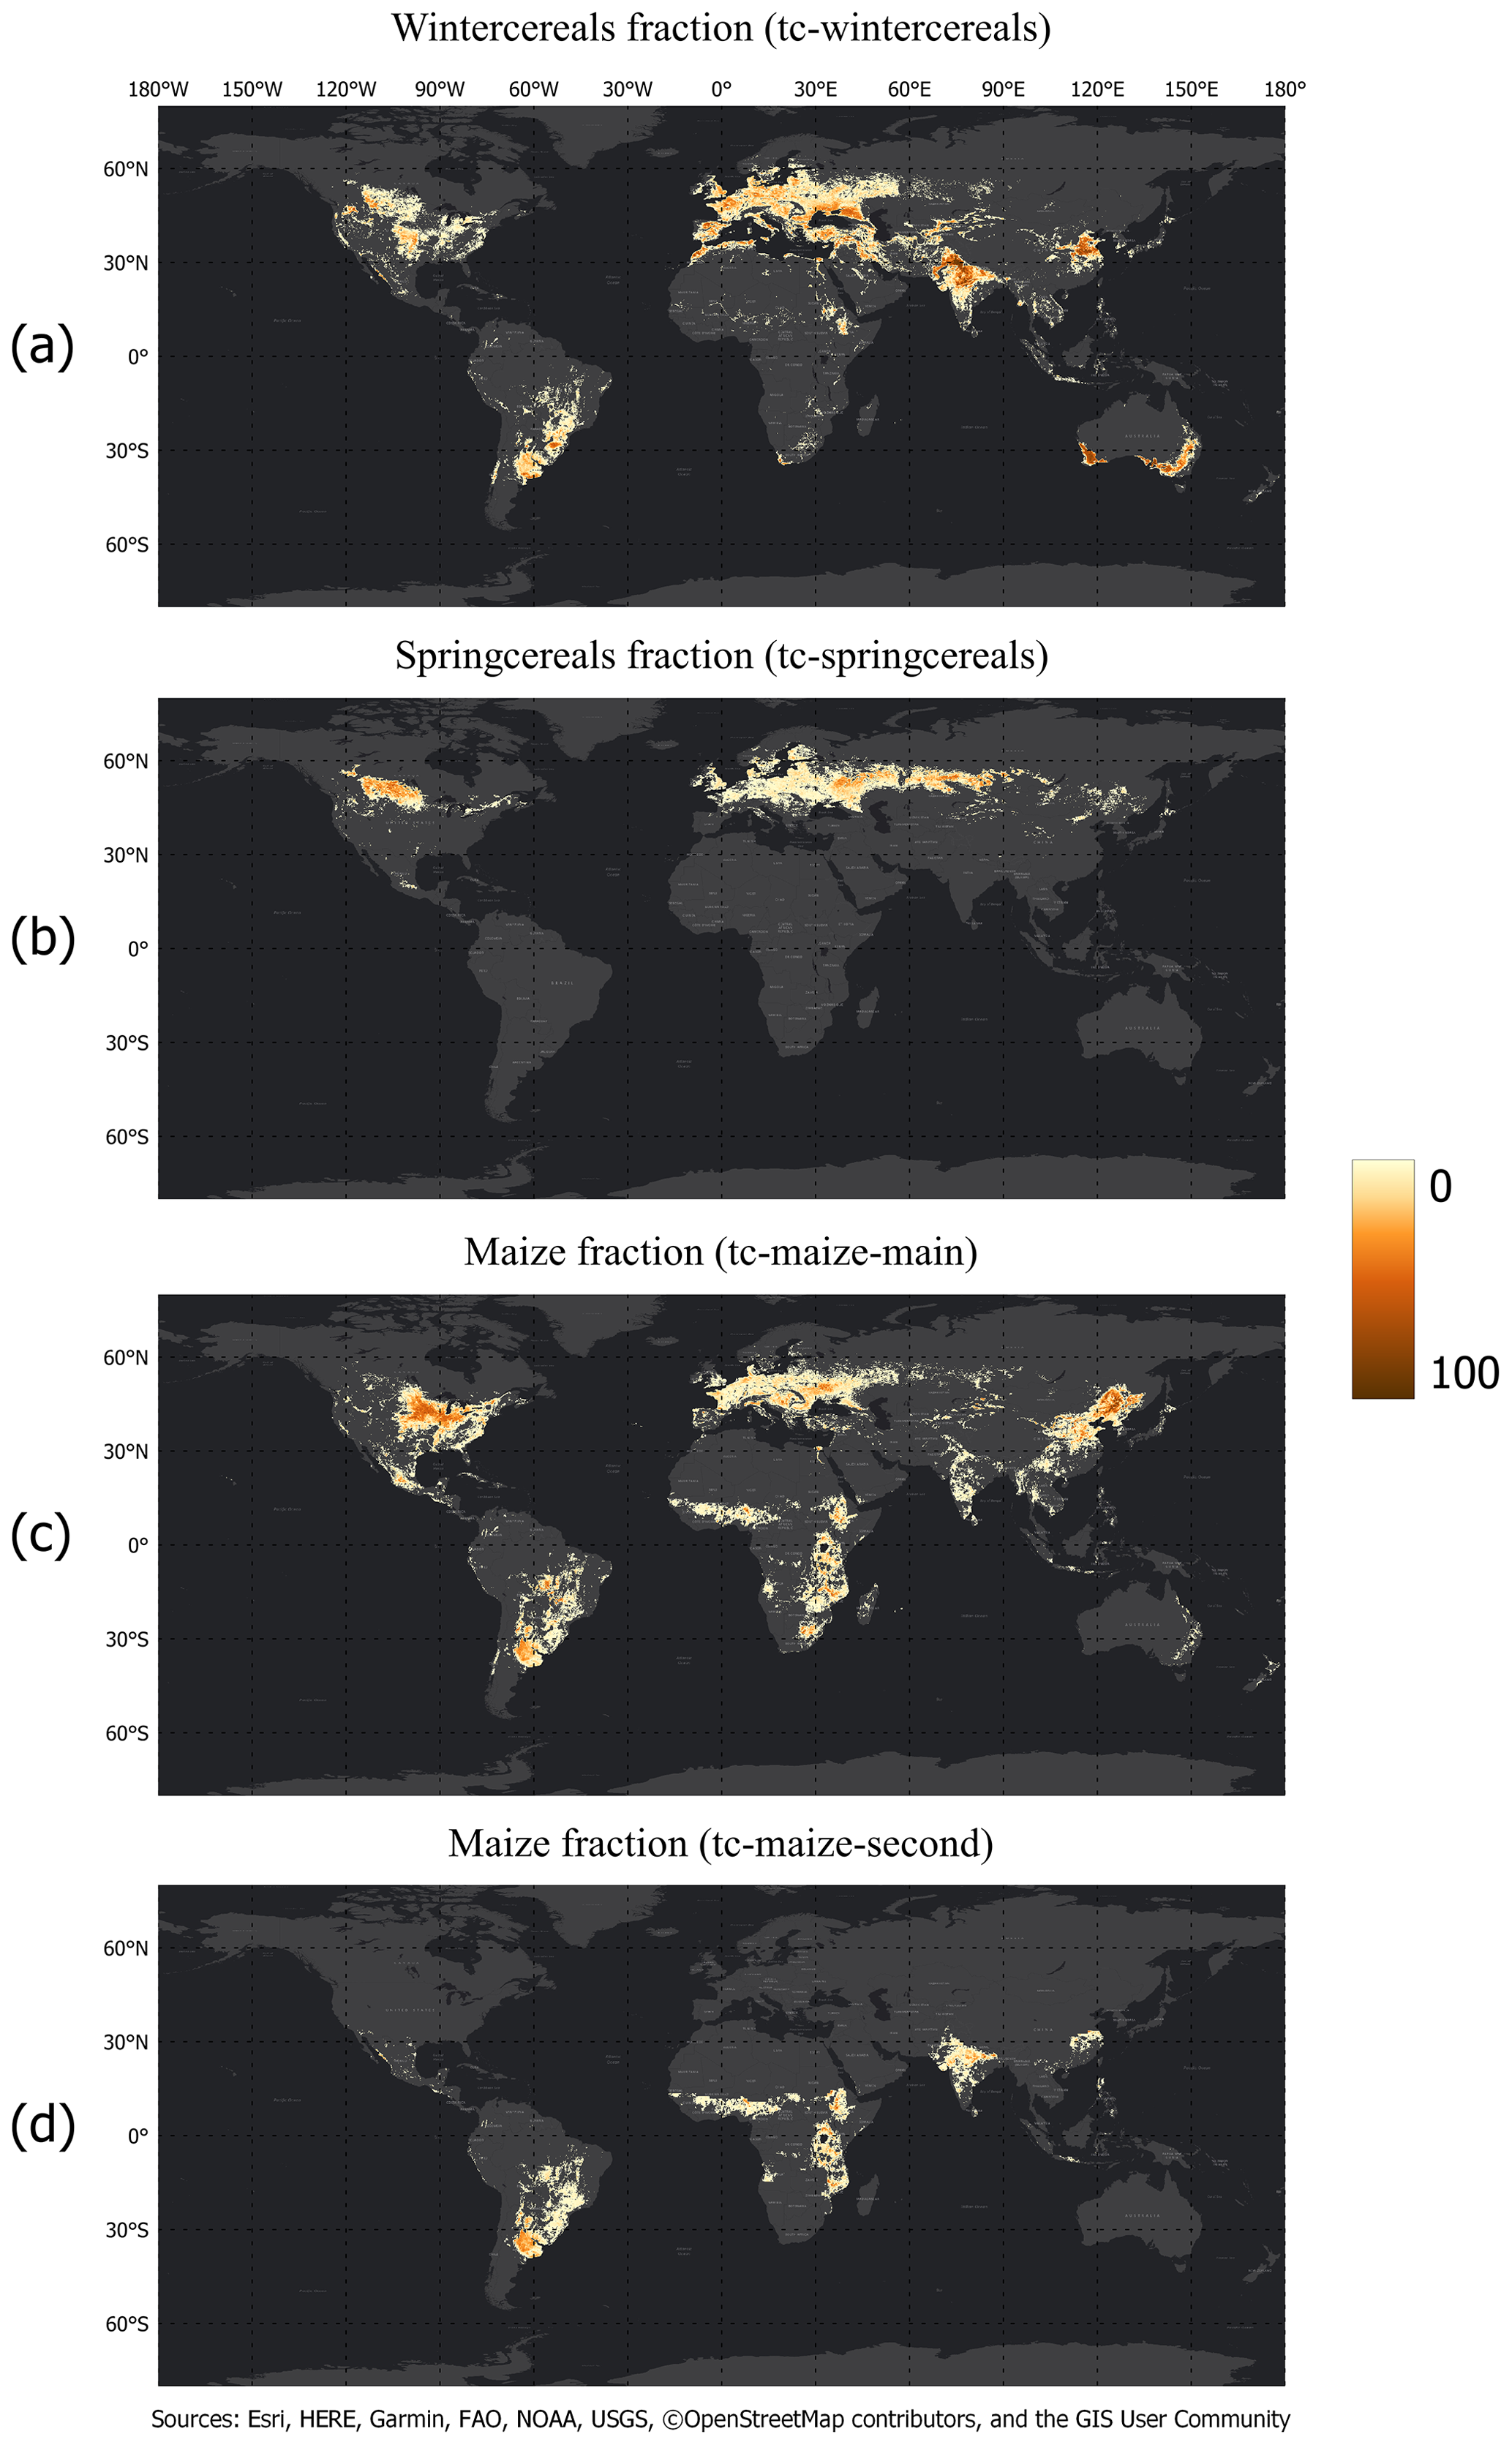
Figure 8WorldCereal 2021 seasonal crop type products. The original 10 m products were resampled to ∼0.004∘ resolution, showing the fraction of land covered by each crop type. These global overviews consist of a mosaic of the individual AEZs for which the product was generated. (a) Winter cereals fraction in the tc-wintercereals season. (b) Spring cereals fraction in the tc-springcereals season. (c) Maize fraction in the tc-maize-main season. (d) Maize fraction in the tc-maize-second season.
4.3 Seasonal active irrigation maps
Similar to the seasonal crop type maps, the irrigation maps were generated separately for each growing season and then combined to an annual 10 m product. The downsampled (∼0.004∘) results of these irrigation maps showing the fraction of irrigated land are visualized in Fig. 9. Areas without active irrigation are shown transparent. As with the annual temporary crop and seasonal crop type products, the global overview shown in Fig. 9 in reality consists of the different AEZ-based products generated at different times in the year.
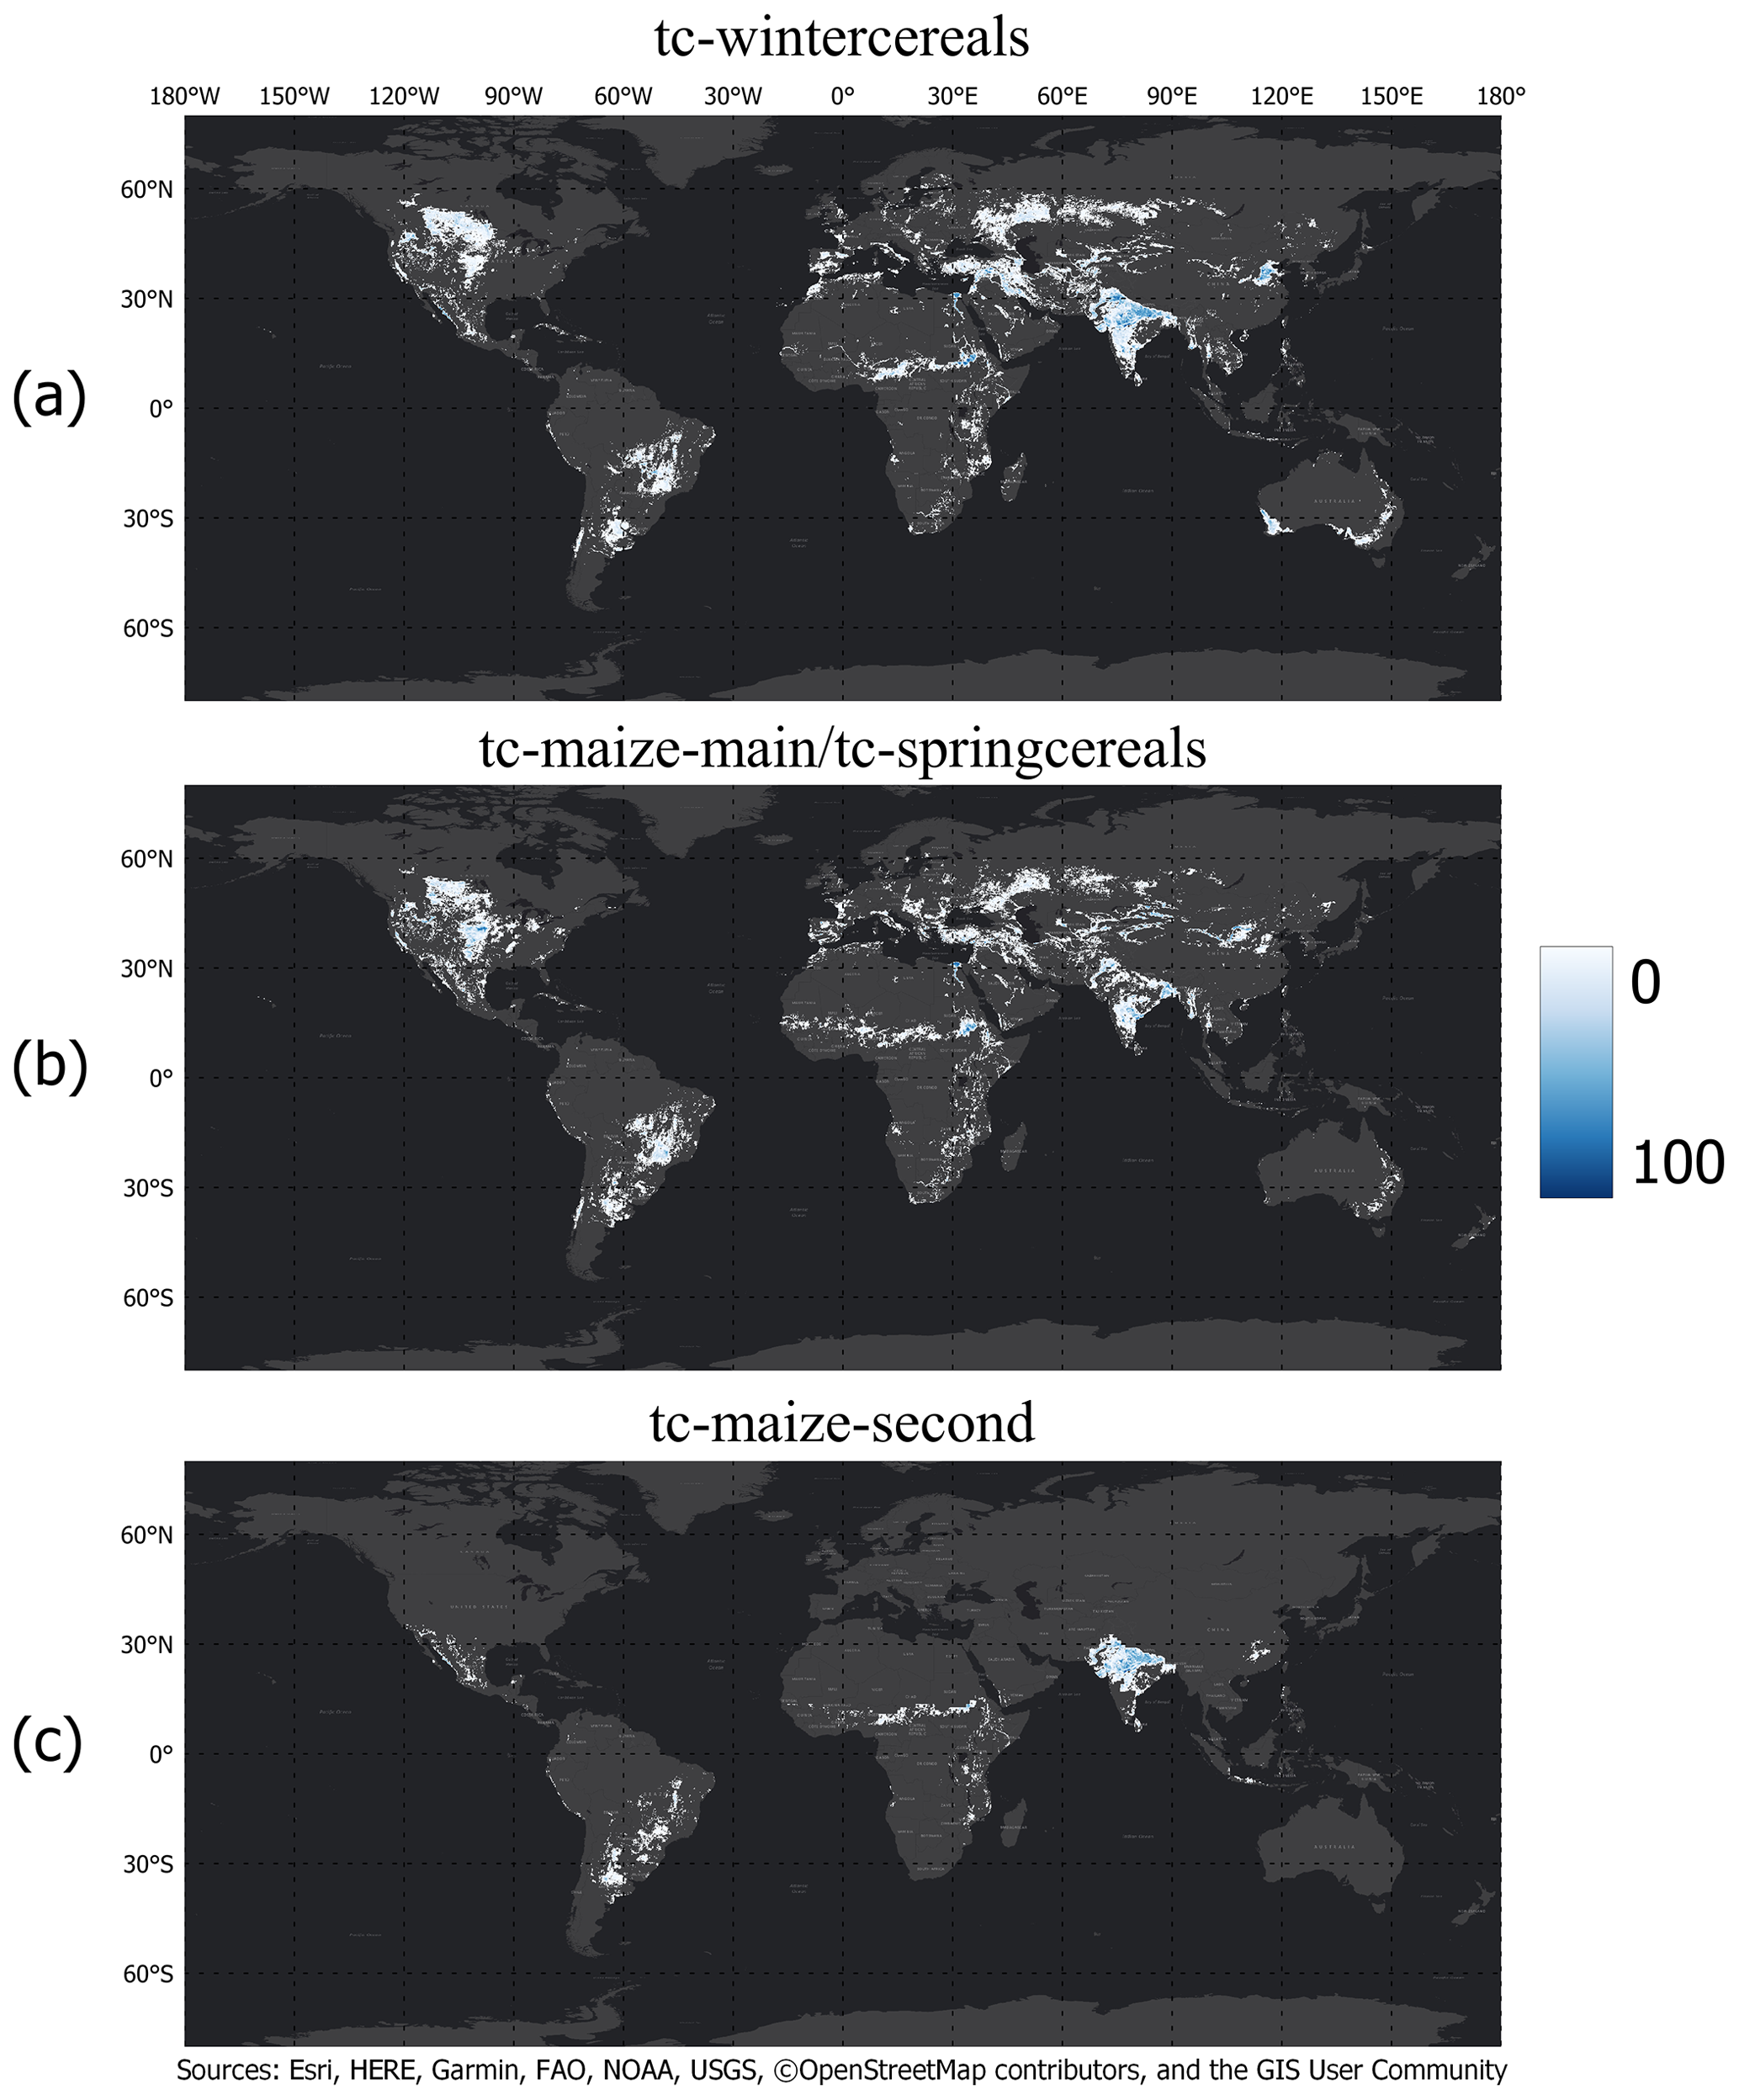
Figure 9WorldCereal 2021 seasonal active irrigation products. The original 10 m products were resampled to ∼0.004∘ resolution, showing the fraction of irrigated land. These global overviews consist of a mosaic of the individual AEZs for which the product was generated. (a) Fraction of irrigated land in the tc-wintercereals season. (b) Fraction of irrigated land in the tc-maize-main/tc-springcereals season. (c) Fraction of irrigated land in the tc-maize-second season.
4.4 Seasonal active cropland maps
Active cropland layers were generated for all seasonal layers described in Table 4. These layers show whether or not a full crop growth cycle (consisting of sowing, growing, harvesting) has been detected in the areas identified by the temporary crop mask (Sect. 4.1) within the specific season under consideration. An example is shown in Fig. 10 for a region near Grainfield, Kansas, USA, where a mixture of winter cereals and maize were detected by the WorldCereal system in their respective seasons. Fields being labelled as active cropland in Fig. 10 but not as one of the target crop types of the WorldCereal system indicate the presence of another crop type that follows the same seasonality as the crop for which the season was originally defined.
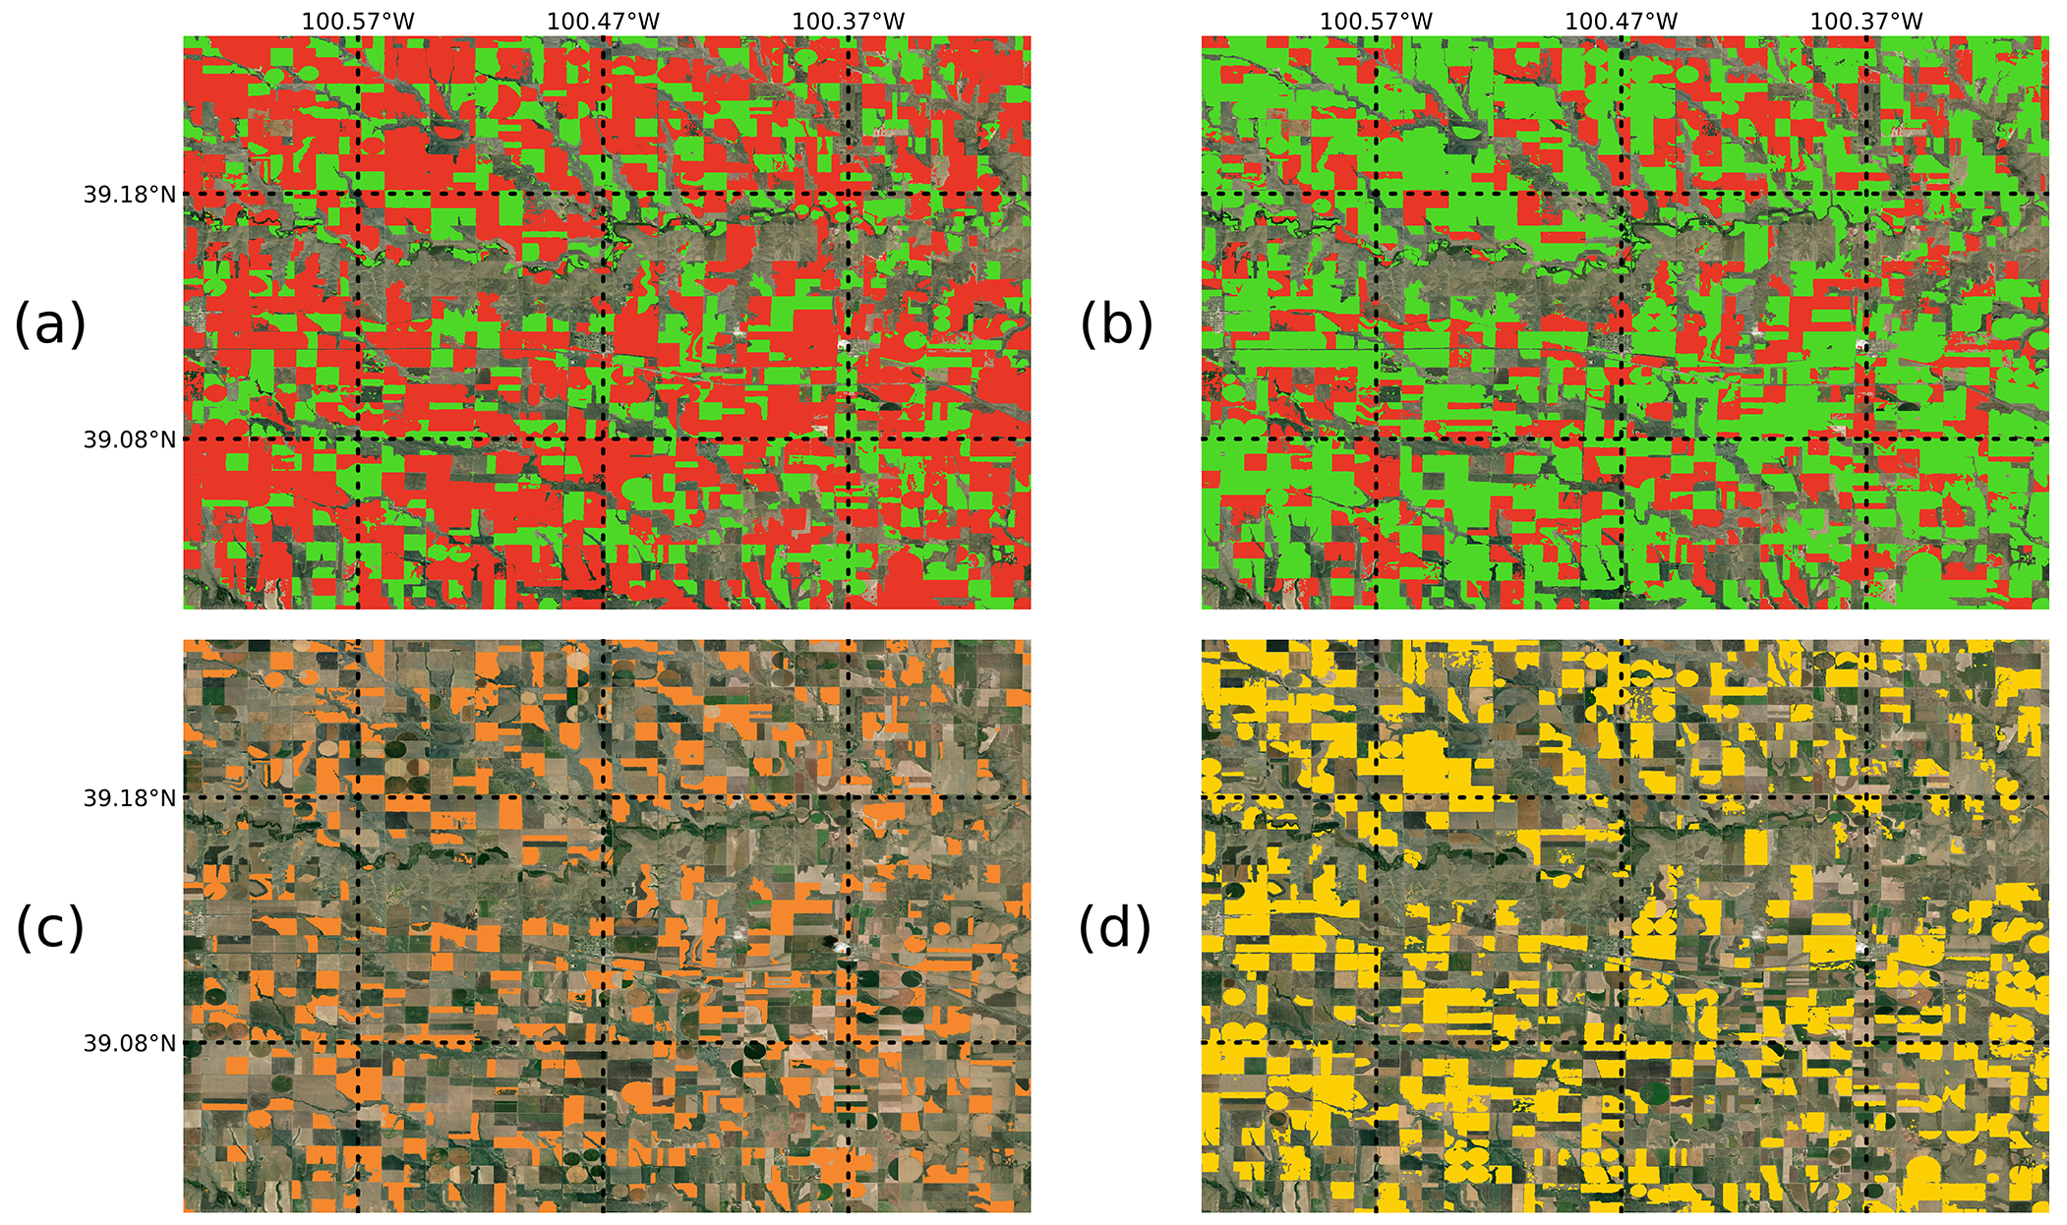
Figure 10Example of seasonal active cropland maps near Grainfield, Kansas, USA. Active cropland for (a) tc-wintercereals and (b) tc-main-maize seasons show different crop seasonality at parcel level. The (c) winter cereals and (d) maize maps overlap with active cropland for their respective season. Parcels showing up as active cropland but outside winter cereals and maize masks indicate other crops that follow the seasonality for which the respective crop type map was created.
4.5 Model confidence maps
Temporary crop extent, crop type, and irrigation maps all have related model confidence layers as described in Sect. 3.5. As an example, Fig. 11 shows the global model confidence layer associated with the temporary crop extent product (Fig. 7). Regions of low model confidence indicate that the model struggles to provide a reliable prediction, in turn meaning that in those locations the feature values used as predictors do not clearly relate to one of the two binary classes being mapped. Several reasons can be identified that may cause unreliable predictions. The most straightforward explanation is a training data gap in a specific region where the feature values do not resemble any of the combinations seen during model training in which case extrapolation by the model fails. Mixed pixels can also explain lower model confidence, e.g. on the border of agricultural fields where a pixel could include both temporary crops and another land cover class. A third explanation relates to specific agrometeorological conditions that are too different from what the model has learnt. In this case, although a region could be covered by training data from a different year, the features from the mapping year are too different, resulting in model confusion. A fourth explanation is the degree of cloud obstruction in the optical observations during the growing season. While this is partly tackled by the inclusion of radar inputs into the classification, the lack of a clear crop growth cycle in the optical inputs can significantly deteriorate crop detection performance. A last possible explanation is related to noise in the training data, because of either inconsistent class definitions or temporal, thematic, and/or geolocation inaccuracies. This confuses the model in such a way that conditions similar to the noisy training data lead to low model confidence and potentially wrong predictions. Apart from mixed pixels which are linked to the input data resolution, the most straightforward solution to improve model confidence is to gather additional training data that fills the knowledge gap. Low confidence regions could therefore point the community to targeted training data collection efforts where it is mostly needed to help boost model confidence and accuracy.
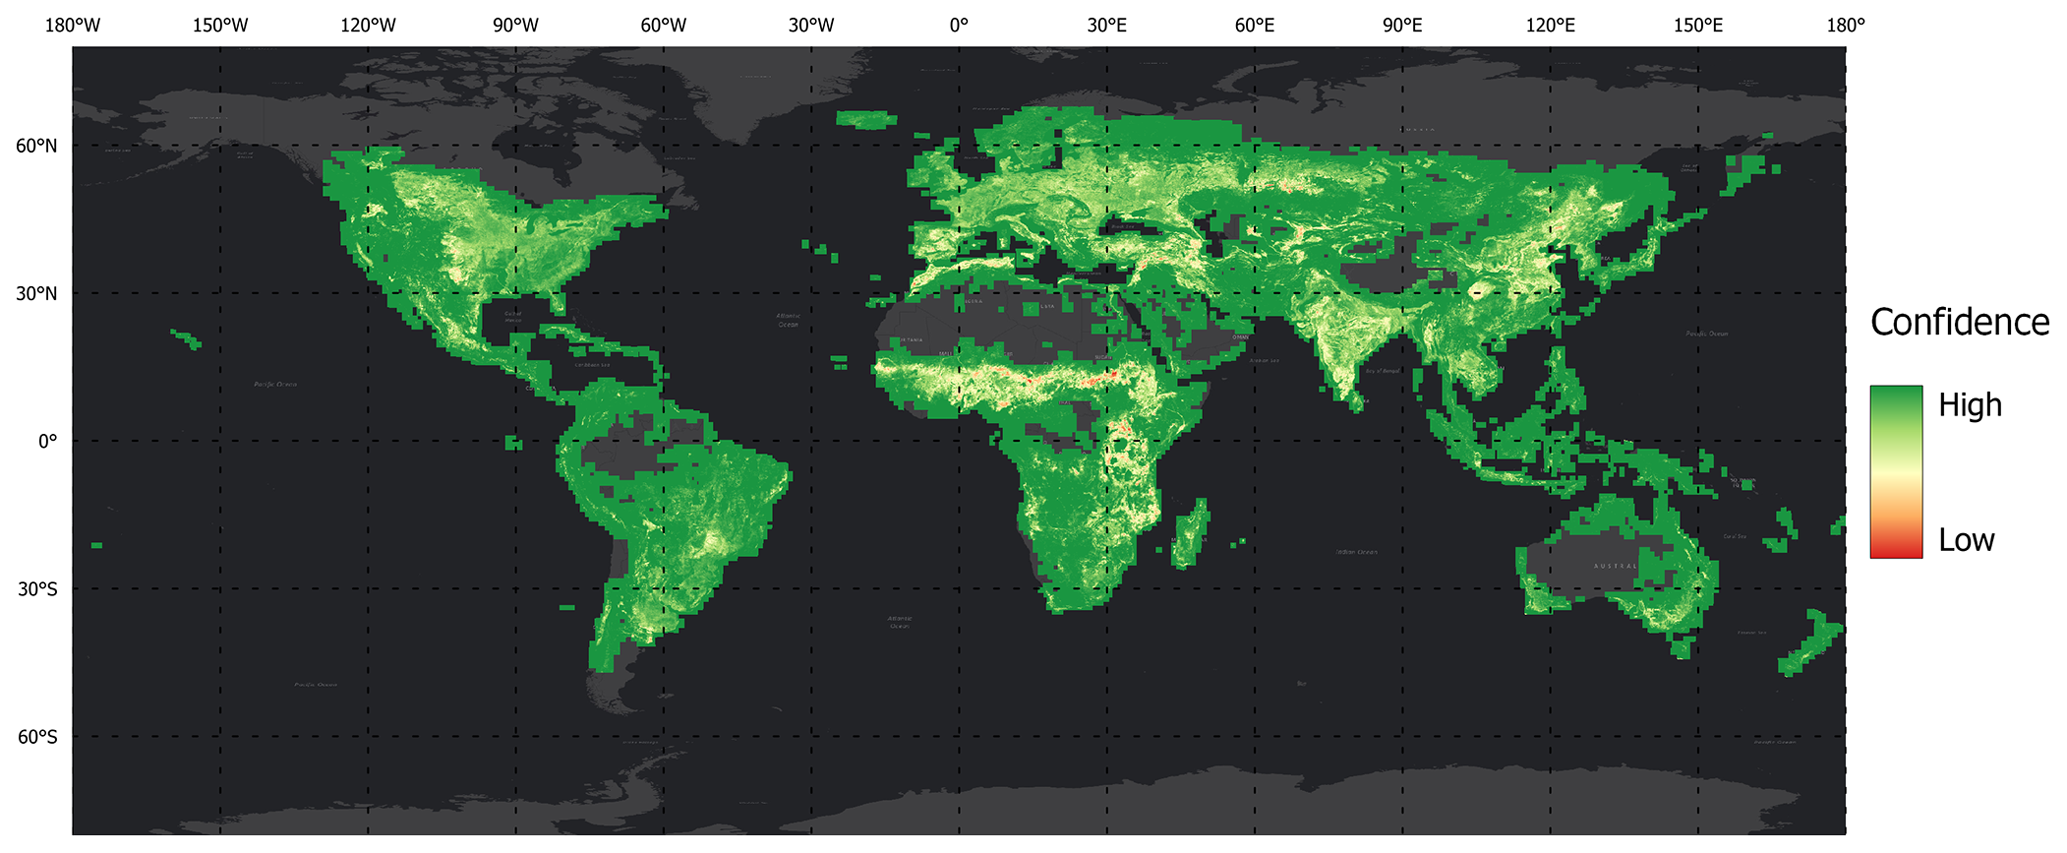
Figure 11WorldCereal 2021 temporary crop extent model confidence. The original 10 m product was resampled to ∼0.004∘ resolution, showing the mean model confidence of the original 10 m pixels.
5.1 Annual temporary crop map
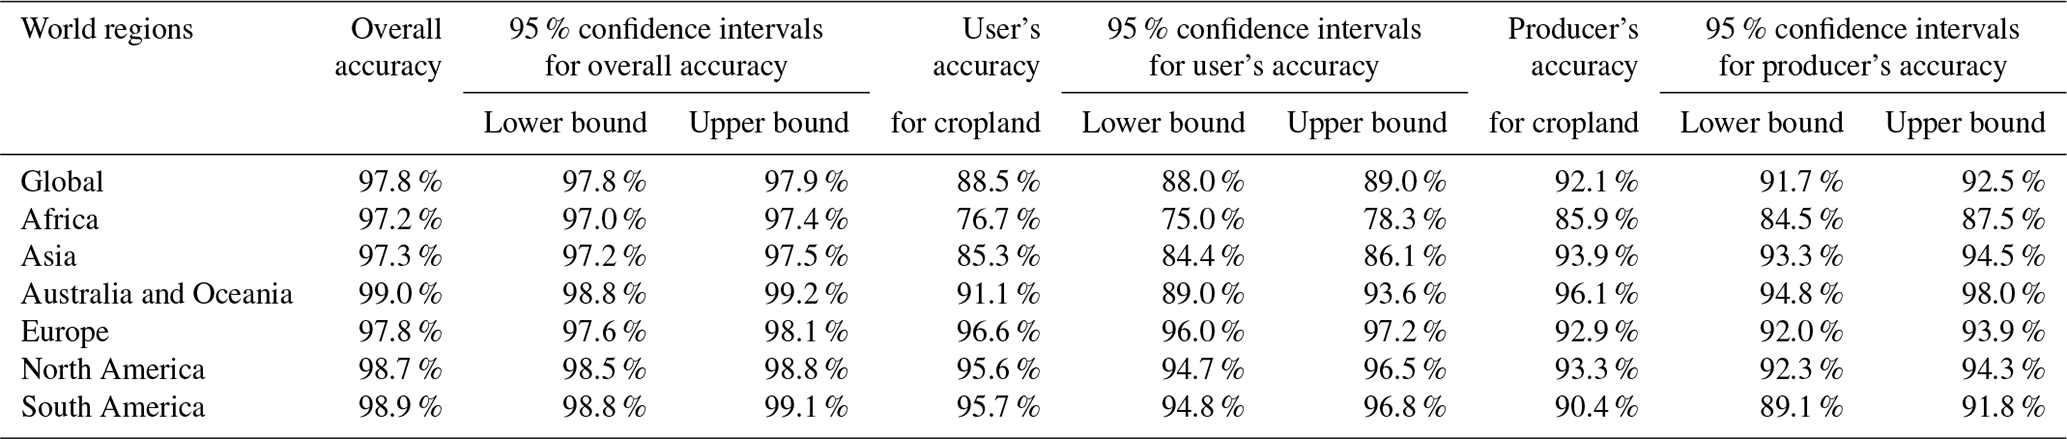
Table 5 summarizes the results of the annual temporary crop extent validation at global level and by continent. It includes overall accuracy, user's accuracy, and producer's accuracy, and 95 % confidence intervals calculated by applying bootstrapping with replacement. The most informative are user's and producer's accuracies, which are 88.5 % and 92.1 %, respectively for the globe. Overall, high-accuracy numbers are observed for most continents, while somewhat lower accuracies are observed in Asia and Africa. As expected based on agricultural landscape complexity in combination with large training data gaps, Africa has the lowest accuracy numbers.
Table 5Summary of accuracy estimates for the WorldCereal temporary crop product by regions.
It has been shown that global cropland maps reach higher accuracies when being the result of a binary classification procedure (only focusing on cropland) compared to a multi-class land cover mapping approach. For example, the cropland class of WorldCover has a user's accuracy of 80.6 (±1.5) and a producer's accuracy of 79.3 (±1.5) compared to 88.5 % (±0.5) and 92.1 % (±0.4), respectively, for WorldCereal. The single layer map from the University of Maryland (UMD croplands; Potapov et al., 2022) has comparable accuracy numbers as the WorldCereal map with an overall accuracy of 97.2 (±0.3) and a user's and producer's accuracy of 88.5 % and 86.4 % (±1.9). In contrast, the older single layer GCEP30 product has substantially lower accuracies: 91.7 % overall, 78.3 % user's accuracy, and 83.4 % producer's accuracy. We can therefore conclude that from a global perspective the most recent global cropland maps (WorldCereal and UMD croplands) are high-quality products. Selection of the most appropriate product to use for a given application will depend on both the nature of the application (different products adopt slightly different definitions of cropland; seasonal versus multi-year products) and the region (one product might have had more/better quality training data for a particular region compared to others). The use of the WorldCereal temporary crops product would be more appropriate for applications interested in active croplands for the specific growing seasons ending in 2021 that would benefit from the increased spatial resolution (10 versus 30 m), whereas UMD croplands might be better suited for applications which need to also include the fallow class and consider a longer period of time (stable cropland area).
5.2 Seasonal crop type maps
Table 6 shows the results of the independent crop type validation at global level. For calculating the confusion matrix, maize in the tc-maize-main and tc-maize-second seasons was combined into one class “maize”, while spring cereals and winter cereals were also combined into one class “cereals”. Overall, omission errors (complementary metric to producer's accuracy) are larger than commission errors (complementary metric to user's accuracy) for both crop types. This could be explained by a lack of training data. Important to note is that the presented results are biased towards the areas covered by the validation dataset (Fig. 5). In addition to this global effort, a regional comparison with USDA National Agricultural Statistics Service Cropland Data Layer (2021) resulted in an overall agreement of 82.9 %, with class-specific agreements of 80.2 % and 93.8 % for maize and 84.9 % and 66.5 % for cereals, respectively. For Canada, we found an agreement of 96 % and 80 % for maize and cereals, respectively, and noted major confusion between winter and spring cereals (Agriculture and Agri-Food Canada Annual Crop Inventory, 2021).
In order to demonstrate the temporal robustness of the WorldCereal models, an additional validation effort was done for Ukraine based on an independent dataset obtained from the National Technical University of Ukraine, Kyiv Polytechnic Institute. Country-wide crop type maps were generated for the period 2018–2021 using the WorldCereal system. Overall, user's and producer's accuracies were found to remain stable across the years (overall accuracy (OA) of 92.5 %, 92.7 %, 85 % and 93.9 %, respectively), despite only limited training data (2018–2019) being available for this particular country.
5.3 Seasonal active irrigation maps
Figure 12 shows the results of the comparison of the WorldCereal irrigation products with (a) the FAO global map of areas equipped for irrigation in 2005 (Siebert et al., 2013), (b) the Landsat-Derived Global Rainfed and Irrigated-Cropland Product at 30 m (LGRIP30) (Teluguntla et al., 2023), and (c) country statistics on irrigated land from the ICID (ICID, 2022). The figures must be interpreted with caution since we do not know what the ground truth is. It is important to consider the following aspects:
-
Wherever the WorldCereal irrigation products show less irrigation (areas highlighted in red), it could be that not all the areas equipped for irrigation were actually irrigated in 2021. This is a common practice in many countries. Also, both the FAO and LGRIP30 maps include perennial cropland in their definitions, while the WorldCereal products do not. Therefore, it is logical that those two maps show more irrigation areas in some places. Finally, as mentioned in the definition of the WorldCereal irrigation product, we do not consider incidentally irrigated cropland, e.g. cropland that is only irrigated during the sowing period, which could also be a cause of the general underestimation of irrigated land compared to other datasets.
-
Wherever the WorldCereal irrigation products show more irrigation (areas highlighted in blue), those pixels could be either areas recently equipped for irrigation, WorldCereal commission errors, or FAO and LGRIP30 omission errors. However, we assume that the blue hotspots in Sudan, the USA, Russia, and Brazil are most likely WorldCereal commission errors since they become apparent when comparing our data with either of the other three reference datasets. Other blue areas, like the hotspots in Canada, do not necessarily have to be commission errors due to the recent increase in irrigation which occurred later than the production of the three reference maps (Statistics Canada, 2021).
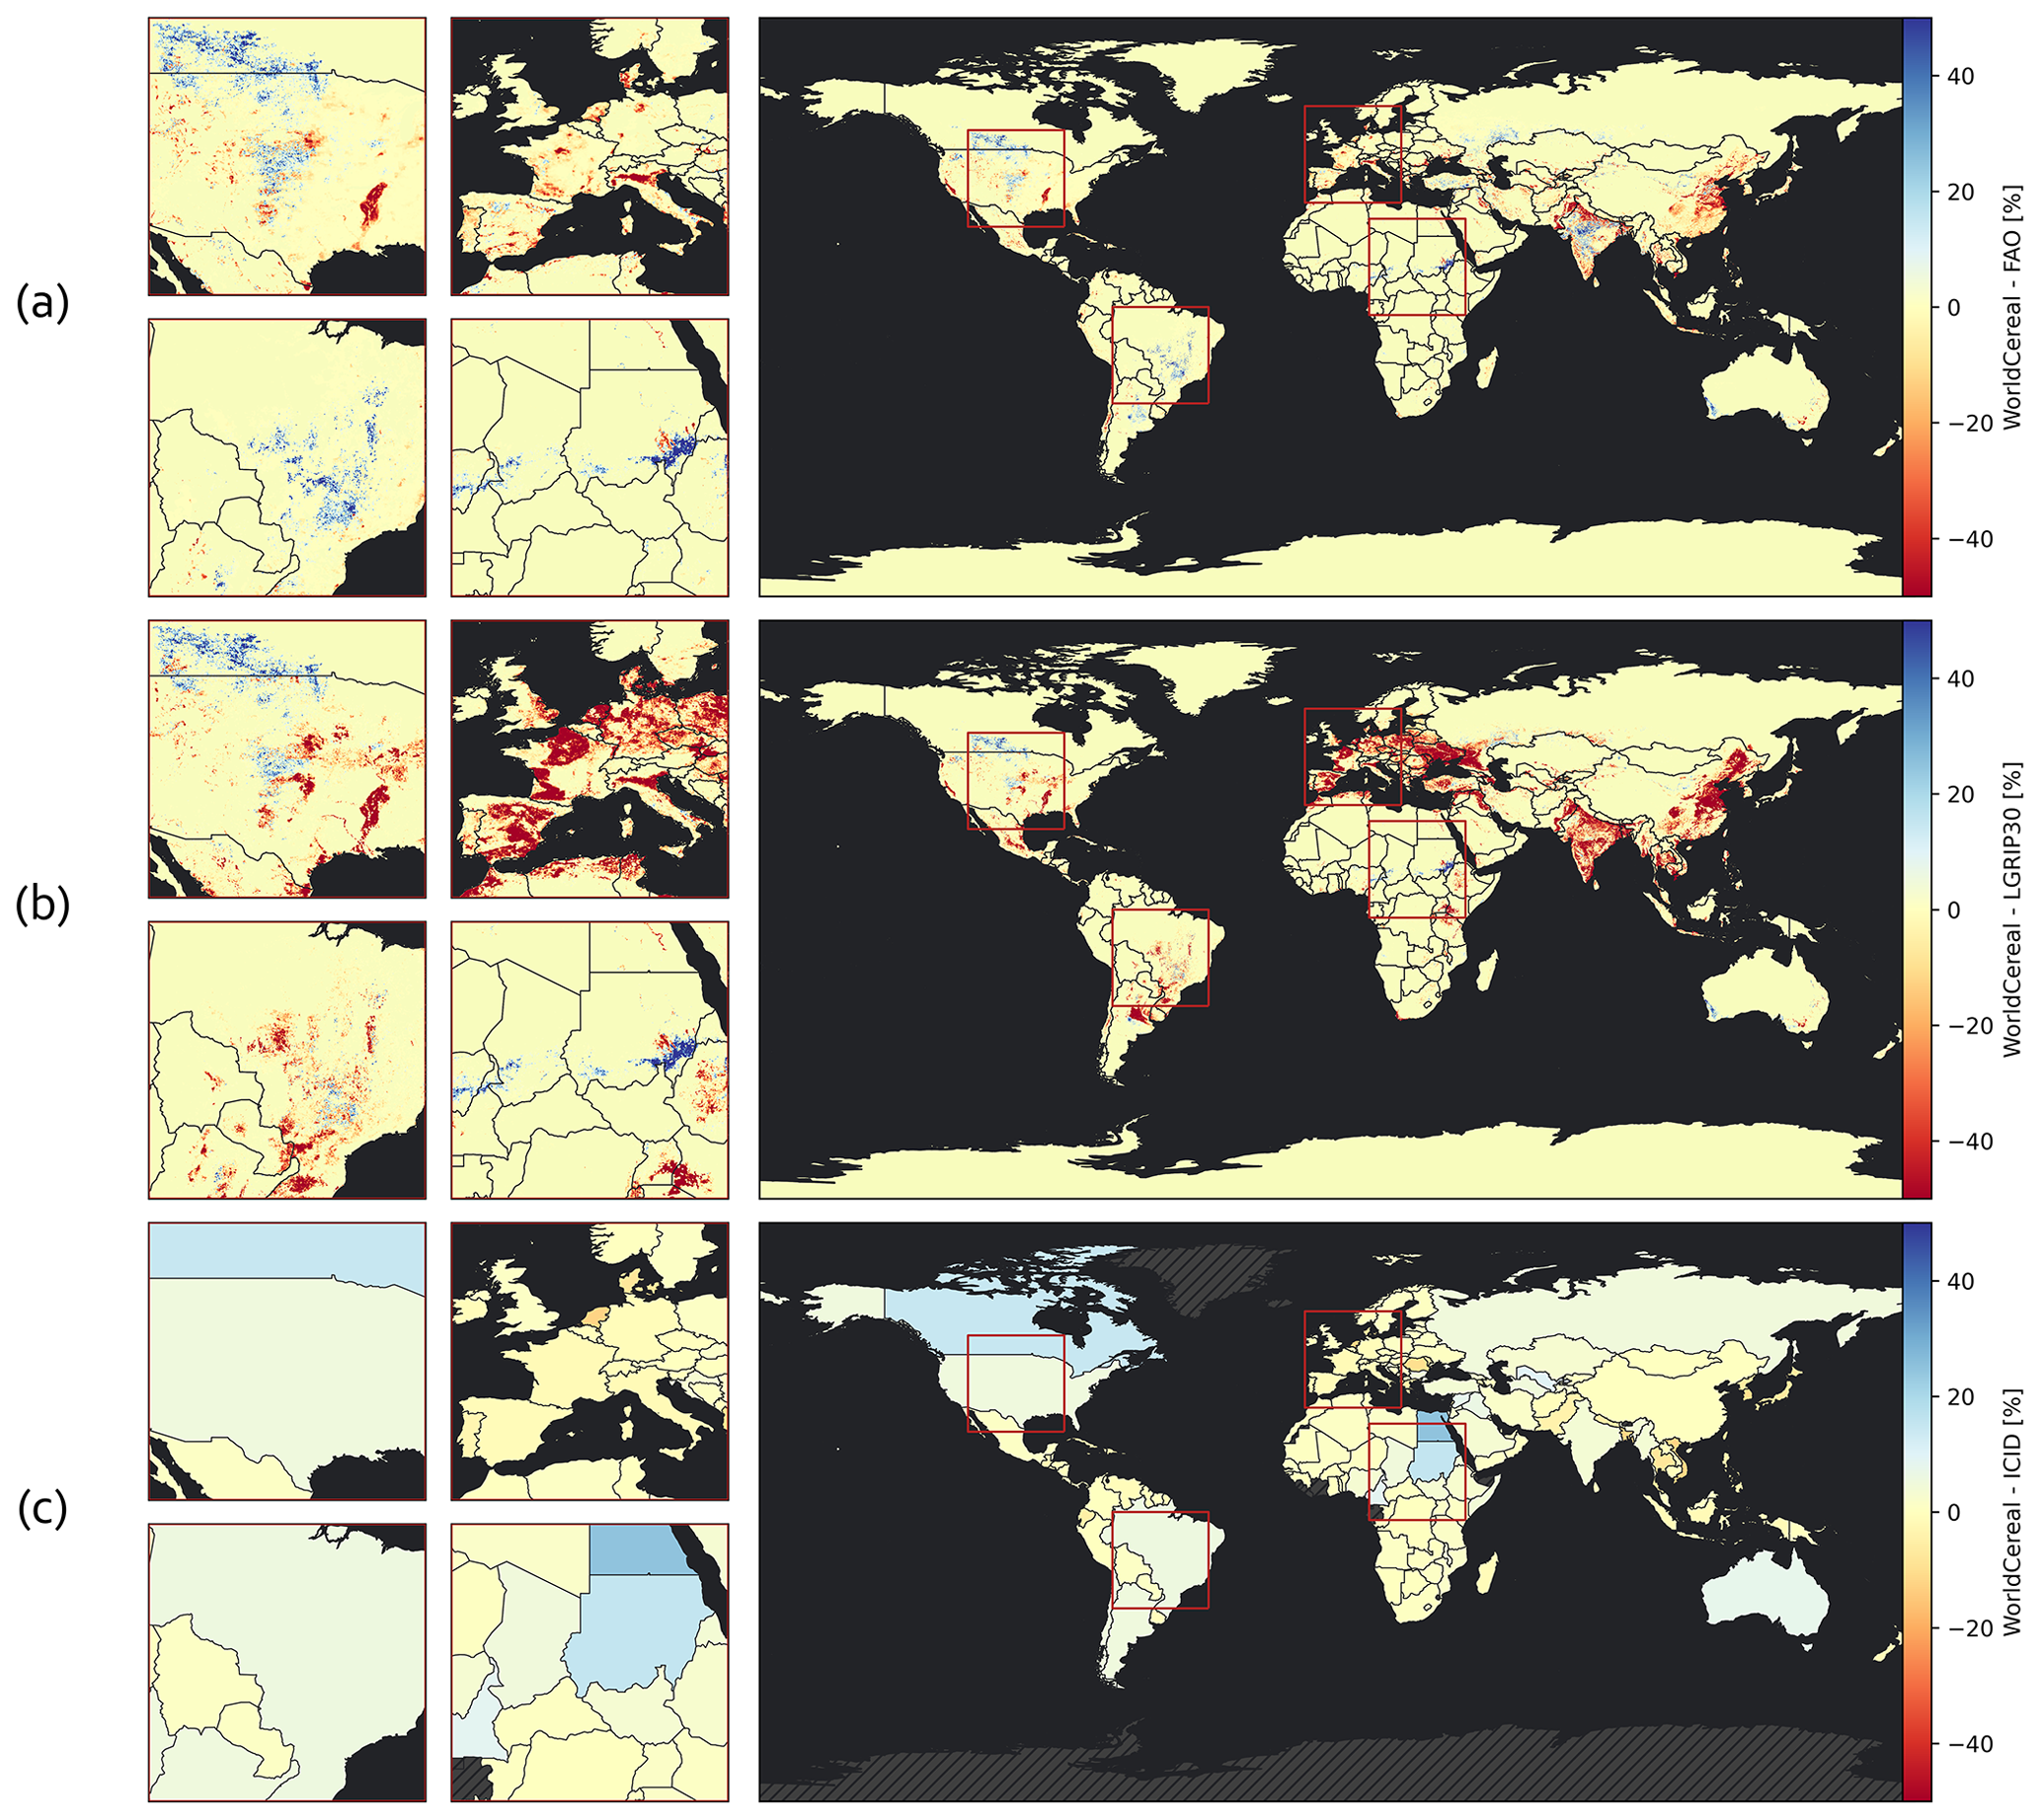
Figure 12Differences in percentages whilst comparing the WorldCereal combined irrigation product and the following: (a) the FAO global area equipped for irrigation in 2005 map, (b) the LGRIP30 irrigated-area map for 2015, and (c) the ICID world irrigated-area dataset. The WorldCereal products show more irrigation in blue areas and less in red areas, compared to the other datasets.
Figure 12b shows that there is a large difference between the WorldCereal irrigated-area product and the LGRIP30 map. Mainly in Europe and Asia the LGRIP30 classifies significantly more land as being irrigated. To understand how these maps relate to global statistics, Fig. 13 shows a comparison between multiple global irrigation maps from literature and statistical datasets from the Central Intelligence Agency (CIA, 2012) and ICID (ICID, 2022). While the latter exhibit significant variation in quality and update frequency across different countries, these datasets are still regarded as the most accurate benchmarks available at country level. We calculated the total irrigated area for the LGRIP30 and WorldCereal irrigated-area maps by downscaling both maps to the resolution (5 arcmin) of the FAO AQUASTAT area equipped for irrigation dataset (Siebert et al., 2013). To compare the three WorldCereal seasonal products with the other (annual) datasets, the seasonal datasets were merged into a single irrigated-area map for 2021 where irrigated pixels indicate that in at least one of the three seasons irrigation was detected. During the downscaling process, the number of irrigated pixels within an AQUASTAT pixel was counted and used to calculate an irrigation fraction. These fractions were then combined with each pixel's surface area to compute the total irrigated area. The total irrigated-area statistics of the other products shown in Fig. 13 were calculated by their respective authors.
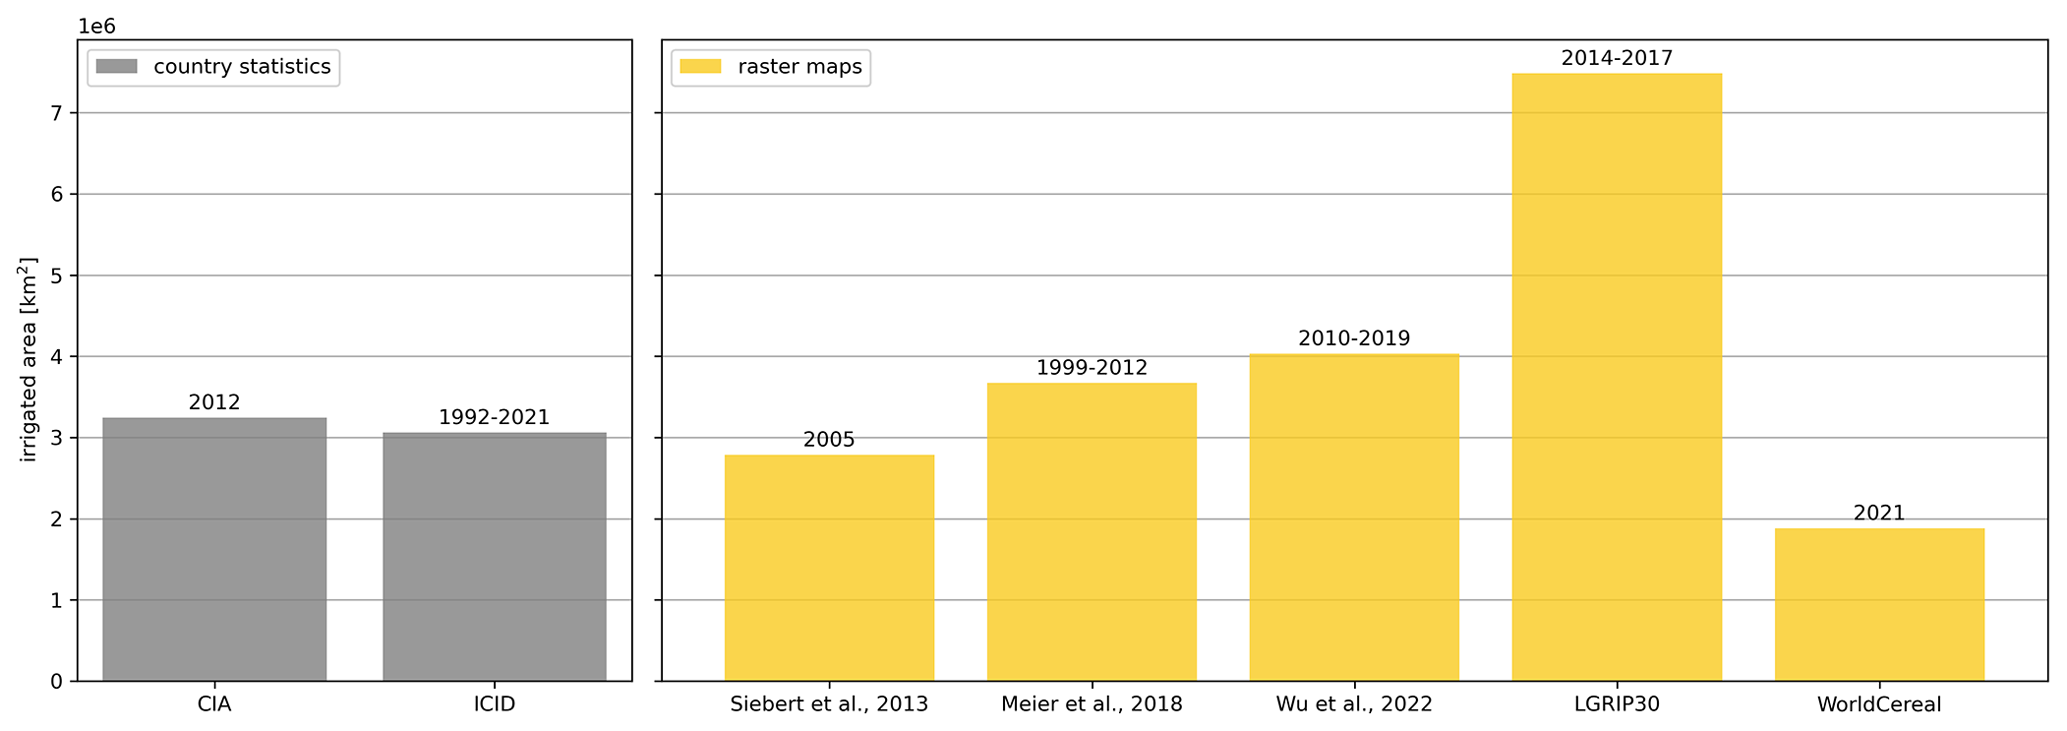
Figure 13Comparison between global statistical datasets from the CIA and ICID on irrigated area compared to five global irrigated-area maps that are based on remote sensing data.
The two statistical datasets used for this analysis show relatively similar global irrigated-area values of roughly 3 ×10⁶ km2. The map from Siebert et al. (2013) is used to produce the area equipped for irrigation map of the FAO and describes the irrigated land around the year 2005. The studies from Meier et al. (2018) and Wu et al. (2023) mainly focus on long time series of NDVI data to determine irrigated areas, whereas the LGRIP30 map is valid for the period 2014–2017 (Teluguntla et al., 2023). From the different irrigation maps, the map from Siebert et al. (2013) agrees best with the statistical datasets. Both the maps from Meier et al. (2018) and Wu et al. (2023) result in a slightly larger estimate of global irrigated areas (up to 30 % higher), while the LGRIP30 product shows an increase of more than 100 %. Finally, the WorldCereal irrigation product provides a significantly lower figure for global irrigated area (roughly 35 % less than statistical datasets), which is partly due to omission errors but also caused by the fact that the WorldCereal product only focuses on temporary crops. The year 2021 is deemed to be a relatively wet year for Europe, South America, Australia, and parts of Southern Asia (NOAA, 2022), so potentially many farms that are equipped for irrigation did not require irrigation. Producing more irrigated-area maps for different years with the WorldCereal system should give more insight into this hypothesis. Combining irrigated-area maps from different years could also add information to the irrigation frequency of each pixel.
The WorldCereal project has generated a suite of binary classification maps at 10 m resolution and global scale for the year 2021, which can act as an important starting point towards a dynamic (seasonal) global-scale crop and irrigation monitoring framework (See et al., 2023). The maps can in the first place be used at their native resolution to identify hotspots of temporary crop/cereal/maize production and irrigation practices at regional scale, in turn allowing better planning of agricultural field data collection campaigns and improving our understanding of local cultivation practices. Additionally, the data can be spatially aggregated and as such prove useful to enhance and complement subnational-to-national agricultural/water use statistics (e.g. FAOSTAT and AQUASTAT, both produced by FAO). Important to note here is that our low-resolution fraction maps (Figs. 7, 8, and 9) have been generated purely for visualization purposes and do not represent proper area statistics. We refer to Olofsson et al. (2014) for detailed guidelines on deriving regional statistics from pixel-based classification maps. The WorldCereal products are being evaluated for integration into various platforms dealing with food security and agricultural water management, including GEOGLAM's CropMonitor (Becker-Reshef et al., 2023), FAO GIEWS, and FAO WaPOR databases, where the products will contribute towards improved crop condition reporting, crop production/failure early warning and long-term forecasting, crop-specific assessment of impacts of extreme weather events and agricultural policy changes, and season-specific irrigation monitoring.
Although WorldCereal specifically focused on maize and cereals, the crop type identification system presented here represents a generic framework for crop type mapping and can be extended towards other crop types. To do so, one would require (1) high-quality reference data for the crop of interest covering all regions of interest and (2) knowledge about the timing of the growing season(s) in which the crop is cultivated (see crop calendars and agro-ecological zones as presented in Sects. 2.2 and 3.3, respectively). Our harmonized in situ reference database (Sect. 3.1; Boogaard et al., 2023) already contains data on many other crop types and can serve as a starting point here, which can be further complemented by user-provided reference data. The WorldCereal system will be integrated in the OpenEO Platform processing environment, allowing any user to easily interact with the system and launch customized model training and processing tasks for specific years, growing seasons, locations, and crop types based on public and user-provided reference data. Users will have the opportunity to use the existing trained models or train dedicated models for their application. We advise to add application-specific training data to the system in order to ensure high-quality outputs, especially when environmental conditions in the area and period of interest highly differ from the conditions currently captured by the available reference data. Fully opening up the system to the broader user community in this way will (1) allow for a continuous expansion of harmonized land cover, crop type, and irrigation reference data; (2) improvement of the products based on local user knowledge and provided training data; (3) ensure the system can meet the (changing) needs of the community; and (4) allow for new applications of the generated global products (e.g. serving as a baseline for change detection analysis at regional to global scales).
7.1 WorldCereal products
The WorldCereal 2021 products are available at https://doi.org/10.5281/zenodo.7875105 (Van Tricht et al., 2023). Each WorldCereal product has its own archive in the repository and contains cloud-optimized geotiff (COG) files per AEZ which were reprojected from the original Sentinel-2 tile grid to the lat/long WGS84 projection. Model confidence layers are available separately and were downsampled to 0.0004∘ resolution. Additionally, all 2021 products are available through Google Earth Engine, spread over three separate collections:
-
ESA WorldCereal 10 m v100 (https://developers.google.com/earth-engine/datasets/catalog/ESA_WorldCereal_2021_MODELS_v100, ESA WorldCereal Consortium, 2021a) (containing temporary crops, crop type, and irrigation products),
-
ESA WorldCereal Active Cropland 10 m v100 (https://developers.google.com/earth-engine/datasets/catalog/ESA_WorldCereal_2021_MARKERS_v100, ESA WorldCereal Consortium, 2021b) (active cropland marker), and
-
ESA WorldCereal AEZ v100 (https://developers.google.com/earth-engine/datasets/catalog/ESA_WorldCereal_AEZ_v100, ESA WorldCereal Consortium, 2021c) (agro-ecological zones).
7.2 Reference data
The harmonized reference data used in the WorldCereal system can be accessed in two ways. The first way to find the data is using the Geo-Wiki-hosted reference data module available at https://worldcereal-rdm.geo-wiki.org (last access: 20 September 2023), where users can browse through the different datasets, visible on a global map. All data and metadata can also be downloaded from the website. A second way to access the data is by entering the WorldCereal community in the Zenodo data repository, available at https://zenodo.org/communities/worldcereal-rdm/ (last access: 20 September 2023). The repository shows the harmonized data in three parts, each one having its own licence, based on the licence of the original datasets. Furthermore, the protocol to harmonize the reference data is also available there.
The new reference datasets developed for validation of the WorldCereal products are available on
-
https://doi.org/10.5281/zenodo.7825628 (Lesiv et al., 2023a) for the global crop type collected using the Street Imagery validation tool and
-
https://doi.org/10.5281/zenodo.7837480 (Lesiv et al., 2023b) for the global validation dataset on temporary crop 2021 collected using Geo-Wiki.
The entire classification module code used to generate the WorldCereal 2021 products described here is publicly available on https://doi.org/10.5281/zenodo.7863779 (Van Tricht and Degerickx, 2023).
The European Space Agency (ESA) WorldCereal system has successfully produced the first global, seasonal, and reproducible temporary crop extent, crop type, and irrigation maps at 10 m resolution. Its product suite for the year 2021 presented here provides a range of seasonal maps that are validated based on best available reference data. Global user's and producer's accuracies for the annual temporary crop product reached 88.5 % and 92.1 %, respectively. Validation numbers of the other product layers exhibit a spatial bias due to the limited availability of independent validation samples or could not be quantitatively determined due to a lack of sufficient validation samples. Despite the known challenges and complexities associated with the mapping of dynamic agricultural landscapes at large spatial scales, our efforts have demonstrated the capabilities of the dynamic open-source WorldCereal system to generate high-quality products at a global scale and with high spatial detail, thereby maximizing their applicability and relevance for local agricultural monitoring purposes. As such, we strongly believe that the WorldCereal system provides a vital tool for policymakers, international organizations, and researchers to better understand global-to-regional crop and irrigation patterns and inform decision-making related to food security and sustainable agriculture. The complete 2021 WorldCereal product suite can also act as a foundation for a worldwide crop monitoring system, providing a significant step forward in addressing the challenge of global food security. Due to these significant potential contributions, we want to strongly emphasize the importance of continuing the development of the system beyond this 2021 showcase. Moving forward, we recommend focusing on enhancing the quality of the products in areas where model confidence is lowest by forging local/regional collaborations in improved collection of ground truth data which will further enhance the local applicability of these products. Such continued community efforts are crucial to support further improvements to the system and push the boundaries for global agricultural mapping from space.
The supplement related to this article is available online at: https://doi.org/10.5194/essd-15-5491-2023-supplement.
KVT and JD: conceptualization, methodology, software, investigation, writing (original draft and review and editing), visualization, funding acquisition; SG: conceptualization, supervision, project administration, funding acquisition, writing (review and editing); DZ: methodology, software; MB, AG, and SK: software; JB: methodology, software, validation, investigation, writing (original draft and review and editing); ML: validation, data curation, writing (original draft and review and editing); JCLB: validation, data curation, writing (original draft and review and editing), funding acquisition; SF and IBR: conceptualization, funding acquisition; BF: methodology, funding acquisition; BMB: methodology; HB; data curation, writing (review and editing), funding acquisition; AKP: data curation, writing (review and editing); BK and ZS: writing (review and editing).
The contact author has declared that none of the authors has any competing interests.
Publisher's note: Copernicus Publications remains neutral with regard to jurisdictional claims made in the text, published maps, institutional affiliations, or any other geographical representation in this paper. While Copernicus Publications makes every effort to include appropriate place names, the final responsibility lies with the authors. Regarding the maps used in this paper, please note that Figs. 2, 5, 7–9, 11, and 12 contain disputed territories.
First and foremost, we would like to express our sincere gratitude to the European Space Agency (ESA) and the WorldCereal Champion users (FAO, AMIS, GEOGLAM) for their support in conceptualizing and throughout the WorldCereal project. A special thanks goes to Giuseppe Ottavianelli and Amalia Castro Gomez (ESA); Ian Jarvis (GEOGLAM); Jippe Hoogeveen and Livia Peiser (FAO Land and Water division); Mario Zappacosta (FAO GIEWS); and Lorenzo De Simone, Giulia Conchedda, and Francesco Tubiello (FAO Statistics Division) for their strong involvement.
We are also very grateful to the many other individuals and organizations who provided us with their time, resources, and expertise throughout the project, we explicitly thank the teams of EU-JRC-ASAP, NASA Harvest, UN-WFP for their invaluable contributions, and feedback on the products.
We extend our sincere thanks to all international and national organizations, who provided us with valuable in situ data for calibration and validation (see Boogaard et al., 2023).
We would like to thank the following IIASA team members who contributed to the validation data collection: Ivelina Georgieva, Andrii Bilous, Anatolii Makarevych, Svitlana Bilous, Oleksandr Lesnik, Roman Zadorozhniuk, Yaroslav Kovbasa, Maksym Burianchuk, Maksym Hrytsenko, Zoriana Romanchuk, and Orysia Yashchun.
We are also very grateful to Martina Duerauer for developing the Geo-Wiki application for the WorldCereal validation and for visualizing the final WorldCereal products on Geo-Wiki.
Finally, we are grateful to Hannah Kerner and two anonymous reviewers for providing valuable comments and suggestions which helped us to improve our work.
This research has been supported by the European Space Agency (grant no. 4000130569/20/I-NB).
This paper was edited by Hao Shi and reviewed by Hannah Kerner and two anonymous referees.
Agriculture and Agri-Food Canada Annual Crop Inventory: Science and Technology Branch, Agriculture and Agri-Food Canada, Government of Canada, Canada https://open.canada.ca/data/en/dataset/199e4ab6-832b-4434-ac39-e4887d7cc4e5 (last access: 30 April 2023), 2021.
Allen, R. G., Pereira, L. S., Raes, D., and Smith, M.: Crop evapotranspiration-Guidelines for computing crop water requirements-FAO Irrigation and drainage paper 56, Fao Rome, 300, D05109, 1998.
Becker-Reshef, I., Barker, B., Humber, M., Puricelli, E., Sanchez, A., Sahajpal, R., McGaughey, K., Justice, C., Baruth, B., Wu, B., Prakash, A., Abdolreza, A., and Jarvis, I.: The GEOGLAM crop monitor for AMIS: Assessing crop conditions in the context of global markets, Glob. Food Secur., 23, 173–181, https://doi.org/10.1016/j.gfs.2019.04.010, 2019.
Becker-Reshef, I., Barker, B., Whitcraft, A., Oliva, P., Mobley, K., Justice, C., and Sahajpal, R.: Crop Type Maps for Operational Global Agricultural Monitoring, Sci. Data, 10, 172, https://doi.org/10.1038/s41597-023-02047-9, 2023.
Bégué, A., Arvor, D., Bellon, B., Betbeder, J., De Abelleyra, D., P. D. Ferraz, R., Lebourgeois, V., Lelong, C., Simões, M., and Verón, R. S.: Remote Sensing and Cropping Practices: A Review, Remote Sens., 10, 99, https://doi.org/10.3390/rs10010099, 2018.
Bolton, D. K., Gray, J. M., Melaas, E. K., Moon, M., Eklundh, L., and Friedl, M. A.: Continental-scale land surface phenology from harmonized Landsat 8 and Sentinel-2 imagery, Remote Sens. Environ., 240, 111685, https://doi.org/10.1016/j.rse.2020.111685, 2020.
Boogaard, H., Schubert, J., De Wit, A., Lazebnik, J., Hutjes, R., and Van der Grijn, G.: Agrometeorological indicators from 1979 to present derived from reanalysis, Copernicus Climate Change Service (C3S) Climate Data Store (CDS), https://doi.org/10.24381/cds.6c68c9bb, 2020.
Boogaard, H., Pratihast, A. K., Bayas, J. C. L., Karanam, S., Fritz, S., Tricht, K. V., Degerickx, J., and Gilliams, S.: Building a community-based open harmonised reference data repository for global crop mapping, PLOS ONE, 18, e0287731, https://doi.org/10.1371/journal.pone.0287731, 2023.
Brown, M. E. and Funk, C. C.: Food Security Under Climate Change, Science, 319, 580–581, https://doi.org/10.1126/science.1154102, 2008.
Buchhorn, M., Lesiv, M., Tsendbazar, N.-E., Herold, M., Bertels, L., and Smets, B.: Copernicus Global Land Cover Layers – Collection 2, Remote Sens., 12, 1044, https://doi.org/10.3390/rs12061044, 2020a.
Buchhorn, M., Smets, B., Bertels, L., Roo, B. D., Lesiv, M., Tsendbazar, N.-E., Herold, M., and Fritz, S.: Copernicus Global Land Service: Land Cover 100m: collection 3: epoch 2019: Globe, Zenodo [data set], https://doi.org/10.5281/zenodo.3939050, 2020b.
Burt, C. M., Clemmens, A. J., Bliesner, R., Merriam, J. L., and Hardy, L.: Selection of Irrigation Methods for Agriculture, American Society of Civil Engineers, https://doi.org/10.1061/9780784404621, 2000.
CIA: “Irrigated land”, The World Factbook, Central Intelligence Agency, Washington, DC, 2012.
Cintas, J., Franch, B., Van-Tricht, K., Boogaard, H., Degerickx, J., Becker-Reshef, I., Moletto-Lobos, I., Mollà-Bononad, B., Sobrino, J. A., Gilliams, S., and Szantoi, Z.: TRANCO: Thermo radiometric normalization of crop observations, Int. J. Appl. Earth Obs., 118, 103283, https://doi.org/10.1016/j.jag.2023.103283, 2023.
Cracknell, M. J. and Reading, A. M.: Geological mapping using remote sensing data: A comparison of five machine learning algorithms, their response to variations in the spatial distribution of training data and the use of explicit spatial information, Comput. Geosci., 63, 22–33, https://doi.org/10.1016/j.cageo.2013.10.008, 2014.
d'Andrimont, R., Verhegghen, A., Lemoine, G., Kempeneers, P., Meroni, M., and van der Velde, M.: From parcel to continental scale – A first European crop type map based on Sentinel-1 and LUCAS Copernicus in-situ observations, Remote Sens. Environ., 266, 112708, https://doi.org/10.1016/j.rse.2021.112708, 2021.
Dinerstein, E., Olson, D., Joshi, A., Vynne, C., Burgess, N. D., Wikramanayake, E., Hahn, N., Palminteri, S., Hedao, P., Noss, R., Hansen, M., Locke, H., Ellis, E. C., Jones, B., Barber, C. V., Hayes, R., Kormos, C., Martin, V., Crist, E., Sechrest, W., Price, L., Baillie, J. E. M., Weeden, D., Suckling, K., Davis, C., Sizer, N., Moore, R., Thau, D., Birch, T., Potapov, P., Turubanova, S., Tyukavina, A., de Souza, N., Pintea, L., Brito, J. C., Llewellyn, O. A., Miller, A. G., Patzelt, A., Ghazanfar, S. A., Timberlake, J., Klöser, H., Shennan-Farpón, Y., Kindt, R., Lillesø, J.-P. B., van Breugel, P., Graudal, L., Voge, M., Al-Shammari, K. F., and Saleem, M.: An Ecoregion-Based Approach to Protecting Half the Terrestrial Realm, BioScience, 67, 534–545, https://doi.org/10.1093/biosci/bix014, 2017.
Elliott, J., Deryng, D., Müller, C., Frieler, K., Konzmann, M., Gerten, D., Glotter, M., Flörke, M., Wada, Y., Best, N., Eisner, S., Fekete, B. M., Folberth, C., Foster, I., Gosling, S. N., Haddeland, I., Khabarov, N., Ludwig, F., Masaki, Y., Olin, S., Rosenzweig, C., Ruane, A. C., Satoh, Y., Schmid, E., Stacke, T., Tang, Q., and Wisser, D.: Constraints and potentials of future irrigation water availability on agricultural production under climate change, P. Natl. Acad. Sci. USA, 111, 3239–3244, https://doi.org/10.1073/pnas.1222474110, 2014.
ESA WorldCereal Consortium: ESA WorldCereal 10 m v100, ESA WorldCereal Consortium [data set], https://developers.google.com/earth-engine/datasets/catalog/ESA_WorldCereal_2021_MODELS_v100 (last access: 31 October 2023), 2021a.
ESA WorldCereal Consortium: ESA WorldCereal Active Cropland 10 m v100, ESA WorldCereal Consortium [data set], https://developers.google.com/earth-engine/datasets/catalog/ESA_WorldCereal_2021_MARKERS_v100 (last access: 31 October 2023), 2021b.
ESA WorldCereal Consortium: ESA WorldCereal AEZ v100, ESA WorldCereal Consortium [data set], https://developers.google.com/earth-engine/datasets/catalog/ESA_WorldCereal_AEZ_v100 (last access: 31 October 2023), 2021c.
FAO: Tracking progress on food and agriculture-related SDG indicators, FAO, https://doi.org/10.4060/cc1403en, 2022.
FAO: Land Use, Irrigation and Agricultural Practices Questionnaire, FAO, https://www.fao.org/fileadmin/user_upload/faoweb/statistics/questionnaires/FAO_LAND_QUEST_EN.xlsx (last access: 27 November 2023), 2023.
Fischer, G., Tubiello, F. N., van Velthuizen, H., and Wiberg, D. A.: Climate change impacts on irrigation water requirements: Effects of mitigation, 1990–2080, Technol. Forecast. Soc. Change, 74, 1083–1107, https://doi.org/10.1016/j.techfore.2006.05.021, 2007.
Foga, S., Scaramuzza, P. L., Guo, S., Zhu, Z., Dilley, R. D., Beckmann, T., Schmidt, G. L., Dwyer, J. L., Joseph Hughes, M., and Laue, B.: Cloud detection algorithm comparison and validation for operational Landsat data products, Remote Sens. Environ., 194, 379–390, https://doi.org/10.1016/j.rse.2017.03.026, 2017.
Franch, B., Cintas, J., Becker-Reshef, I., Sanchez-Torres, M. J., Roger, J., Skakun, S., Sobrino, J. A., Van Tricht, K., Degerickx, J., Gilliams, S., Koetz, B., Szantoi, Z., and Whitcraft, A.: Global crop calendars of maize and wheat in the framework of the WorldCereal project, GIScience Remote Sens., 59, 885–913, https://doi.org/10.1080/15481603.2022.2079273, 2022.
Fritz, S., McCallum, I., Schill, C., Perger, C., See, L., Schepaschenko, D., van der Velde, M., Kraxner, F., and Obersteiner, M.: Geo-Wiki: An online platform for improving global land cover, Environ. Model. Softw., 31, 110–123, https://doi.org/10.1016/j.envsoft.2011.11.015, 2012.
Fritz, S., See, L., You, L., Justice, C., Becker-Reshef, I., Bydekerke, L., Cumani, R., Defourny, P., Erb, K., Foley, J., Gilliams, S., Gong, P., Hansen, M., Hertel, T., Herold, M., Herrero, M., Kayitakire, F., Latham, J., Leo, O., McCallum, I., Obersteiner, M., Ramankutty, N., Rocha, J., Tang, H., Thornton, P., Vancutsem, C., van der Velde, M., Wood, S., and Woodcock, C.: The Need for Improved Maps of Global Cropland, Eos Trans. Am. Geophys. Union, 94, 31–32, https://doi.org/10.1002/2013EO030006, 2013.
Gu, Y., Wylie, B. K., Boyte, S. P., Picotte, J., Howard, D. M., Smith, K., and Nelson, K. J.: An Optimal Sample Data Usage Strategy to Minimize Overfitting and Underfitting Effects in Regression Tree Models Based on Remotely-Sensed Data, Remote Sens., 8, 943, https://doi.org/10.3390/rs8110943, 2016.
Halabisky, M., Liu, L., Fisk, C., Adams, C., Muir, J., Delaney, P., de Simone, L., Yuan, F., Hall, L., Lewis, A., and Gennari, P.: National Land Cover and Crop Mapping using the Digital Earth Africa Platform and High-resolution Satellite Imagery, 2022, GC25C-07, AGU Fall Meeting Abstracts, https://ui.adsabs.harvard.edu/abs/2022AGUFMGC25C..07H, EID: GC25C-07, 2022.
Han, J., Zhang, Z., Luo, Y., Cao, J., Zhang, L., Zhang, J., and Li, Z.: The RapeseedMap10 database: annual maps of rapeseed at a spatial resolution of 10 m based on multi-source data, Earth Syst. Sci. Data, 13, 2857–2874, https://doi.org/10.5194/essd-13-2857-2021, 2021.
Hirayama, H., Sharma, R. C., Tomita, M., and Hara, K.: Evaluating multiple classifier system for the reduction of salt-and-pepper noise in the classification of very-high-resolution satellite images, Int. J. Remote Sens., 40, 2542–2557, https://doi.org/10.1080/01431161.2018.1528400, 2019.
ICID: Annual report 2021–2022, International Commission on Irrigation and Drainage, International Commission on Irrigation & Drainage (ICID), https://icid-ciid.org/icid_data_web/ar_2020.pdf (last access: 27 November 2023), 2022.
Jägermeyr, J. and Frieler, K.: Spatial variations in crop growing seasons pivotal to reproduce global fluctuations in maize and wheat yields, Sci. Adv., 4, eaat4517, https://doi.org/10.1126/sciadv.aat4517, 2018.
Kamble, B., Kilic, A., and Hubbard, K.: Estimating Crop Coefficients Using Remote Sensing-Based Vegetation Index, Remote Sens., 5, 1588–1602, https://doi.org/10.3390/rs5041588, 2013.
Karthikeyan, L., Chawla, I., and Mishra, A. K.: A review of remote sensing applications in agriculture for food security: Crop growth and yield, irrigation, and crop losses, J. Hydrol., 586, 124905, https://doi.org/10.1016/j.jhydrol.2020.124905, 2020.
Kenduiywo, B. K., Bargiel, D., and Soergel, U.: Crop-type mapping from a sequence of Sentinel 1 images, Int. J. Remote Sens., 39, 6383–6404, https://doi.org/10.1080/01431161.2018.1460503, 2018.
Lesiv, M., Bilous, A., Bayas, J. C. L., Karanam, S., and Fritz, S.: Global Crop Type Validation Data Set for ESA WorldCereal System, Zenodo [data set], https://doi.org/10.5281/zenodo.7825628, 2023a.
Lesiv, M., Duerauer, M., Georgieva, I., Bilous, A., Bayas, J. C. L., and Fritz, S.: Global reference data set for validating ESA WorldCereal temporary cropland extent (1), Zenodo [data set], https://doi.org/10.5281/zenodo.7837480, 2023b.
Li, H., Song, X.-P., Hansen, M. C., Becker-Reshef, I., Adusei, B., Pickering, J., Wang, L., Wang, L., Lin, Z., Zalles, V., Potapov, P., Stehman, S. V., and Justice, C.: Development of a 10-m resolution maize and soybean map over China: Matching satellite-based crop classification with sample-based area estimation, Remote Sens. Environ., 294, 113623, https://doi.org/10.1016/j.rse.2023.113623, 2023.
Liu, Y., Yu, Q., Zhou, Q., Wang, C., Bellingrath-Kimura, S. D., and Wu, W.: Mapping the Complex Crop Rotation Systems in Southern China Considering Cropping Intensity, Crop Diversity, and Their Seasonal Dynamics, IEEE J. Sel. Top. Appl. Earth Obs., 15, 9584–9598, https://doi.org/10.1109/JSTARS.2022.3218881, 2022.
Main-Knorn, M., Pflug, B., Louis, J., Debaecker, V., Müller-Wilm, U., and Gascon, F.: Sen2Cor for Sentinel-2, in: Image and Signal Processing for Remote Sensing XXIII, SPIE Digital Library, 3, https://doi.org/10.1117/12.2278218, 2017.
Mandal, D., Kumar, V., Ratha, D., Dey, S., Bhattacharya, A., Lopez-Sanchez, J. M., McNairn, H., and Rao, Y. S.: Dual polarimetric radar vegetation index for crop growth monitoring using sentinel-1 SAR data, Remote Sens. Environ., 247, 111954, https://doi.org/10.1016/J.RSE.2020.111954, 2020.
Massari, C., Modanesi, S., Dari, J., Gruber, A., De Lannoy, G. J. M., Girotto, M., Quintana-Seguí, P., Le Page, M., Jarlan, L., Zribi, M., Ouaadi, N., Vreugdenhil, M., Zappa, L., Dorigo, W., Wagner, W., Brombacher, J., Pelgrum, H., Jaquot, P., Freeman, V., Volden, E., Fernandez Prieto, D., Tarpanelli, A., Barbetta, S., and Brocca, L.: A Review of Irrigation Information Retrievals from Space and Their Utility for Users, Remote Sens., 13, 4112, https://doi.org/10.3390/rs13204112, 2021.
Meier, J., Zabel, F., and Mauser, W.: A global approach to estimate irrigated areas – a comparison between different data and statistics, Hydrol. Earth Syst. Sci., 22, 1119–1133, https://doi.org/10.5194/hess-22-1119-2018, 2018.
Nakalembe, C., Becker-Reshef, I., Bonifacio, R., Hu, G., Humber, M. L., Justice, C. J., Keniston, J., Mwangi, K., Rembold, F., Shukla, S., Urbano, F., Whitcraft, A. K., Li, Y., Zappacosta, M., Jarvis, I., and Sanchez, A.: A review of satellite-based global agricultural monitoring systems available for Africa, Glob. Food Secur., 29, 100543, https://doi.org/10.1016/j.gfs.2021.100543, 2021.
NOAA: Monthly Global Climate Report for Annual 2021, NOAA National Centers for Environmental Information, NOAA National Centers for Environmental Information, https://www.ncei.noaa.gov/access/monitoring/monthly-report/global/202113 (last access: 27 November 2023), 2022.
Olofsson, P., Foody, G. M., Herold, M., Stehman, S. V., Woodcock, C. E., and Wulder, M. A.: Good practices for estimating area and assessing accuracy of land change, Remote Sens. Environ., 148, 42–57, https://doi.org/10.1016/j.rse.2014.02.015, 2014.
Pandey, P. C., Koutsias, N., Petropoulos, G. P., Srivastava, P. K., and Ben Dor, E.: Land use/land cover in view of earth observation: data sources, input dimensions, and classifiers – a review of the state of the art, Geocarto Int., 36, 957–988, https://doi.org/10.1080/10106049.2019.1629647, 2021.
Pelletier, C., Valero, S., Inglada, J., Champion, N., Marais Sicre, C., and Dedieu, G.: Effect of Training Class Label Noise on Classification Performances for Land Cover Mapping with Satellite Image Time Series, Remote Sens., 9, 173, https://doi.org/10.3390/rs9020173, 2017.
Pittman, K., Hansen, M. C., Becker-Reshef, I., Potapov, P. V., and Justice, C. O.: Estimating Global Cropland Extent with Multi-year MODIS Data, Remote Sens., 2, 1844–1863, https://doi.org/10.3390/rs2071844, 2010.
Potapov, P., Turubanova, S., Hansen, M. C., Tyukavina, A., Zalles, V., Khan, A., Song, X.-P., Pickens, A., Shen, Q., and Cortez, J.: Global maps of cropland extent and change show accelerated cropland expansion in the twenty-first century, Nat. Food, 3, 19–28, https://doi.org/10.1038/s43016-021-00429-z, 2022.
Prokhorenkova, L., Gusev, G., Vorobev, A., Dorogush, A. V., and Gulin, A.: CatBoost: Unbiased boosting with categorical features, Advances in Neural Information Processing Systems, 31, https://proceedings.neurips.cc/paper/2018/hash/14491b756b3a51daac41c24863285549-Abstract.html (last access: ), 2018.
Prosekov, A. Y. and Ivanova, S. A.: Food security: The challenge of the present, Geoforum, 91, 73–77, https://doi.org/10.1016/j.geoforum.2018.02.030, 2018.
Rosegrant, M. W. and Cline, S. A.: Global Food Security: Challenges and Policies, Science, 302, 1917–1919, https://doi.org/10.1126/science.1092958, 2003.
Sadeghi, M., Babaeian, E., Tuller, M., and Jones, S. B.: The optical trapezoid model: A novel approach to remote sensing of soil moisture applied to Sentinel-2 and Landsat-8 observations, Remote Sens. Environ., 198, 52–68, https://doi.org/10.1016/j.rse.2017.05.041, 2017.
Salmon, J. M., Friedl, M. A., Frolking, S., Wisser, D., and Douglas, E. M.: Global rain-fed, irrigated, and paddy croplands: A new high resolution map derived from remote sensing, crop inventories and climate data, Int. J. Appl. Earth Obs., 38, 321–334, https://doi.org/10.1016/j.jag.2015.01.014, 2015.
Schreuder, H. T., Ernst, R., and Ramirez-Maldonado, H.: Statistical techniques for sampling and monitoring natural resources, U.S. Department of Agriculture, Forest Service, Rocky Mountain Research Station, Ft. Collins, CO, https://doi.org/10.2737/RMRS-GTR-126, 2004.
See, L., Gilliams, S., Conchedda, G., Degerickx, J., Van Tricht, K., Fritz, S., Lesiv, M., Laso Bayas, J. C., Rosero, J., Tubiello, F. N., and Szantoi, Z.: Dynamic global-scale crop and irrigation monitoring, Nat. Food, 4, 736–737, https://doi.org/10.1038/s43016-023-00841-7, 2023.
Siebert, S., Henrich, V., Frenken, K., and Burke, J.: Global Map of Irrigation Areas version 5 (5), FAO, https://doi.org/10.13140/2.1.2660.6728, 2013.
Statistics Canada: Agricultural irrigation patterns in Canada from 2012 to 2018, https://www150.statcan.gc.ca/n1/pub/16-508-x/16-508-x2021001-eng.htm (last access: 29 June 2023), 2021.
Stehman, S. V. and Foody, G. M.: Key issues in rigorous accuracy assessment of land cover products, Remote Sens. Environ., 231, 111199, https://doi.org/10.1016/j.rse.2019.05.018, 2019.
Stuckens, J., Coppin, P. R., and Bauer, M. E.: Integrating Contextual Information with per-Pixel Classification for Improved Land Cover Classification, Remote Sens. Environ., 71, 282–296, https://doi.org/10.1016/S0034-4257(99)00083-8, 2000.
Szantoi, Z., Geller, G. N., Tsendbazar, N.-E., See, L., Griffiths, P., Fritz, S., Gong, P., Herold, M., Mora, B., and Obregón, A.: Addressing the need for improved land cover map products for policy support, Environ. Sci. Policy, 112, 28–35, https://doi.org/10.1016/j.envsci.2020.04.005, 2020.
Szantoi, Z., Jaffrain, G., Gallaun, H., Bielski, C., Ruf, K., Lupi, A., Miletich, P., Giroux, A.-C., Carlan, I., Croi, W., Augu, H., Kowalewski, C., and Brink, A.: Quality assurance and assessment framework for land cover maps validation in the Copernicus Hot Spot Monitoring activity, Eur. J. Remote Sens., 54, 538–557, https://doi.org/10.1080/22797254.2021.1978001, 2021.
Teluguntla, P., Thenkabail, P., Oliphant, A., Gumma, M., Aneece, I., Foley, D., and McCormick, R.: Landsat-Derived Global Rainfed and Irrigated-Cropland Product 30 m V001 (V001), NASA EOSDIS Land Processes DAAC IP148728, https://doi.org/10.5067/Community/LGRIP/LGRIP30.001, 2023.
Thenkabail, P. S., Biradar, C. M., Noojipady, P., Dheeravath, V., Li, Y., Velpuri, M., Gumma, M., Gangalakunta, O. R. P., Turral, H., Cai, X., Vithanage, J., Schull, M. A., and Dutta, R.: Global irrigated area map (GIAM), derived from remote sensing, for the end of the last millennium, Int. J. Remote Sens., 30, 3679–3733, https://doi.org/10.1080/01431160802698919, 2009.
Thenkabail, P. S., Teluguntla, P. G., Xiong, J., Oliphant, A., Congalton, R. G., Ozdogan, M., Gumma, M. K., Tilton, J. C., Giri, C., Milesi, C., Phalke, A., Massey, R., Yadav, K., Sankey, T., Zhong, Y., Aneece, I., and Foley, D.: Global cropland-extent product at 30-m resolution (GCEP30) derived from Landsat satellite time-series data for the year 2015 using multiple machine-learning algorithms on Google Earth Engine cloud, Global cropland-extent product at 30-m resolution (GCEP30) derived from Landsat satellite time-series data for the year 2015 using multiple machine-learning algorithms on Google Earth Engine cloud, U.S. Geological Survey, Reston, VA, https://doi.org/10.3133/pp1868, 2021.
Tseng, G., Kerner, H., Nakalembe, C., and Becker-Reshef, I.: Learning to predict crop type from heterogeneous sparse labels using meta-learning, in: 2021 IEEE/CVF Conference on Computer Vision and Pattern Recognition Workshops (CVPRW), 2021 IEEE/CVF Conference on Computer Vision and Pattern Recognition Workshops (CVPRW), Nashville, TN, USA, 1111–1120, https://doi.org/10.1109/CVPRW53098.2021.00122, 2021.
Tubiello, F. N., Conchedda, G., Casse, L., Pengyu, H., Zhongxin, C., De Santis, G., Fritz, S., and Muchoney, D.: Measuring the world's cropland area, Nat. Food, 4, 30–32, https://doi.org/10.1038/s43016-022-00667-9, 2023.
USDA National Agricultural Statistics Service Cropland Data Layer: Published crop-specific data layer, USDA-NASS, Washington, DC, http://nassgeodata.gmu.edu/CropScape/ (last access: 30 April 2023), 2021.
Valero, S., Morin, D., Inglada, J., Sepulcre, G., Arias, M., Hagolle, O., Dedieu, G., Bontemps, S., Defourny, P., and Koetz, B.: Production of a Dynamic Cropland Mask by Processing Remote Sensing Image Series at High Temporal and Spatial Resolutions, Remote Sens., 8, 55, https://doi.org/10.3390/rs8010055, 2016.
Vancutsem, C., Marinho, E., Kayitakire, F., See, L., and Fritz, S.: Harmonizing and Combining Existing Land Cover/Land Use Datasets for Cropland Area Monitoring at the African Continental Scale, Remote Sens., 5, 19–41, https://doi.org/10.3390/rs5010019, 2013.
Van Tricht, K. and Degerickx, J.: WorldCereal/worldcereal-classification: WorldCereal classification module v1.1.1, Zenodo [code], https://doi.org/10.5281/zenodo.7863779, 2023.
Van Tricht, K., Gobin, A., Gilliams, S., and Piccard, I.: Synergistic use of radar sentinel-1 and optical sentinel-2 imagery for crop mapping: A case study for Belgium, Remote Sens., 10, 1642, https://doi.org/10.3390/rs10101642, 2018.
Van Tricht, K., Degerickx, J., Gilliams, S., Zanaga, D., Savinaud, M., Battude, M., Buguet de Chargère, R., Dubreule, G., Grosu, A., Brombacher, J., Pelgrum, H., Lesiv, M., Bayas, J. C. L., Karanam, S., Fritz, S., Becker-Reshef, I., Franch, B., Bononad, B. M., Cintas, J., Boogaard, H., Pratihast, A. K., Kucera, L., and Szantoi, Z.: ESA WorldCereal 10 m 2021 v100 (v100), Zenodo [data set], https://doi.org/10.5281/zenodo.7875104, 2023.
Wellington, M. J. and Renzullo, L. J.: High-Dimensional Satellite Image Compositing and Statistics for Enhanced Irrigated Crop Mapping, Remote Sens., 13, 1300, https://doi.org/10.3390/rs13071300, 2021.
Wu, B., Tian, F., Nabil, M., Bofana, J., Lu, Y., Elnashar, A., Beyene, A. N., Zhang, M., Zeng, H., and Zhu, W.: Mapping global maximum irrigation extent at 30m resolution using the irrigation performances under drought stress, Glob. Environ. Change, 79, 102652, https://doi.org/10.1016/j.gloenvcha.2023.102652, 2023.
You, L. and Sun, Z.: Mapping global cropping system: Challenges, opportunities, and future perspectives, Crop Environ., 1, 68–73, https://doi.org/10.1016/j.crope.2022.03.006, 2022.
Zanaga, D., Van De Kerchove, R., Daems, D., De Keersmaecker, W., Brockmann, C., Kirches, G., Wevers, J., Cartus, O., Santoro, M., Fritz, S., Lesiv, M., Herold, M., Tsendbazar, N.-E., Xu, P., Ramoino, F., and Arino, O.: ESA WorldCover 10 m 2021 v200, Zenodo [data set], https://doi.org/10.5281/zenodo.7254221, 2022.
- Abstract
- Introduction
- Definitions
- Materials and methods
- WorldCereal products
- Product validation
- Data usage and future prospects
- Data availability
- Code availability
- Conclusions
- Author contributions
- Competing interests
- Disclaimer
- Acknowledgements
- Financial support
- Review statement
- References
- Supplement