the Creative Commons Attribution 4.0 License.
the Creative Commons Attribution 4.0 License.
 | 22 Nov 2023
Investigating limnological processes and modern sedimentation at Lake Żabińskie, northeast Poland: a decade-long multi-variable dataset, 2012–2021
Wojciech Tylmann
Alicja Bonk
Dariusz Borowiak
Paulina Głowacka
Kamil Nowiński
Joanna Piłczyńska
Agnieszka Szczerba
Maurycy Żarczyński
Here, we present a dataset of a decade-long monitoring project of Lake Żabińskie, a hardwater eutrophic lake in northeast Poland. The lake contains annually laminated (varved) sediments that form a unique archive of past environmental variability. Regular measurements of the lake water physical and chemical characteristics were done using a multiparameter sonde and a set of temperature sensors deployed in the water column. Seasonal variability in sediment fluxes was documented by a sediment trap. Field sampling provided information about the hydrochemistry of incoming streams and of the lake outflow. The overall monitoring program was designed to assess relationships among meteorological conditions, limnological processes, and modern sedimentation and to answer the question of whether meteorological and limnological phenomena can be precisely tracked with varves. However, this dataset can also be used for modeling physical and biogeochemical processes in lakes. The dataset is archived at https://doi.org/10.34808/w8w7-9x34 (Tylmann et al., 2023).
- Article
(4171 KB) - Full-text XML
- BibTeX
- EndNote


Lakes that contain annually laminated (varved) sediments have been recognized as invaluable environmental archives (Zolitschka et al., 2015). Using varved sediment cores and high-resolution analytical techniques, changes in sediment composition can be observed at the (sub)seasonal scale, providing unique insights into environmental variability in the past (Butz et al., 2015; Croudace et al., 2019; Żarczyński et al., 2022). However, formation of varves in eutrophic temperate lakes is influenced by complex interactions among physical, chemical, and biological processes. To accurately track past environmental changes using varved lake sediments, it is thus necessary to recognize the impact of different processes and environmental conditions on the dynamics of sedimentation. High-resolution instrumental data that document the relationships among meteorological conditions, limnological processes in the water column, and sediment fluxes are rare and usually cover a relatively short observational period (e.g., 1 or 2 years, or even less), which does not account for the range of variability in environmental and meteorological conditions. For a better interpretation of varved sediment records, long-term instrumental datasets that cover a wide range of measured variables are needed.
Here, we present the results of a decade-long investigation of modern processes in Lake Żabińskie (also known as Lake Żabinki) located in northeast Poland. The lake was selected for long-term monitoring because it forms biogenic (calcite) varves that are typical of hardwater eutrophic lakes of the temperate climate zone (Tylmann et al., 2013). The systematic on-site measurements and sampling were initiated in 2011 under the framework of the project CLIMPOL (2011–2015) that aimed at quantitative climate reconstructions over the last 1000 years, a time period that captures climatic variability relevant to the development of modern society. In 2012, a 19.4 m long sediment profile (10 800 years) was retrieved from the deepest part of this lake and investigated with a multi-proxy approach. In 2016 the monitoring was extended by an additional 6 years within the project “Tracking climate signals preserved in lake sediments from integrated process studies and ultra-high-resolution analysis of annually laminated sediments.” As a result, we collected a wide range of information on the physical and chemical characteristics of the lake's water and modern sedimentation dynamics, as well as the hydrochemistry of incoming streams and lake outflow. The overall monitoring program was designed to assess relationships among meteorological conditions, limnological processes, and modern sedimentation and to determine whether meteorological and limnological phenomena can be precisely tracked with varves.
The goal of this paper is to present the methods of data collection, describe the data, and make this unique dataset available to the scientific community. The data have already been used to explore the record of meteorological conditions in varves of Lake Żabińskie (Żarczyński et al., 2022), but we believe that this multi-year dataset provides useful context for the interpretation of other lake sediment records and serves as a modern analogue of past sedimentation in lakes of temperate climate zones. Moreover, it could be valuable for modeling physical and biogeochemical processes in lakes. Long-term monitoring datasets are of crucial importance to validate limnological models that in turn enable assessment of limnological conditions in lakes where observations have not been made. They also enable prediction of long-term trends in water temperature changes under different scenarios of future climate change (Piccolroaz et al., 2018). Despite this potential, very few studies combine comprehensive monitoring of water-column characteristics and sedimentation processes in lakes (e.g., Heinrich et al., 2018; Maier et al., 2018; Broadman et al., 2019; Brauer et al., 2019).
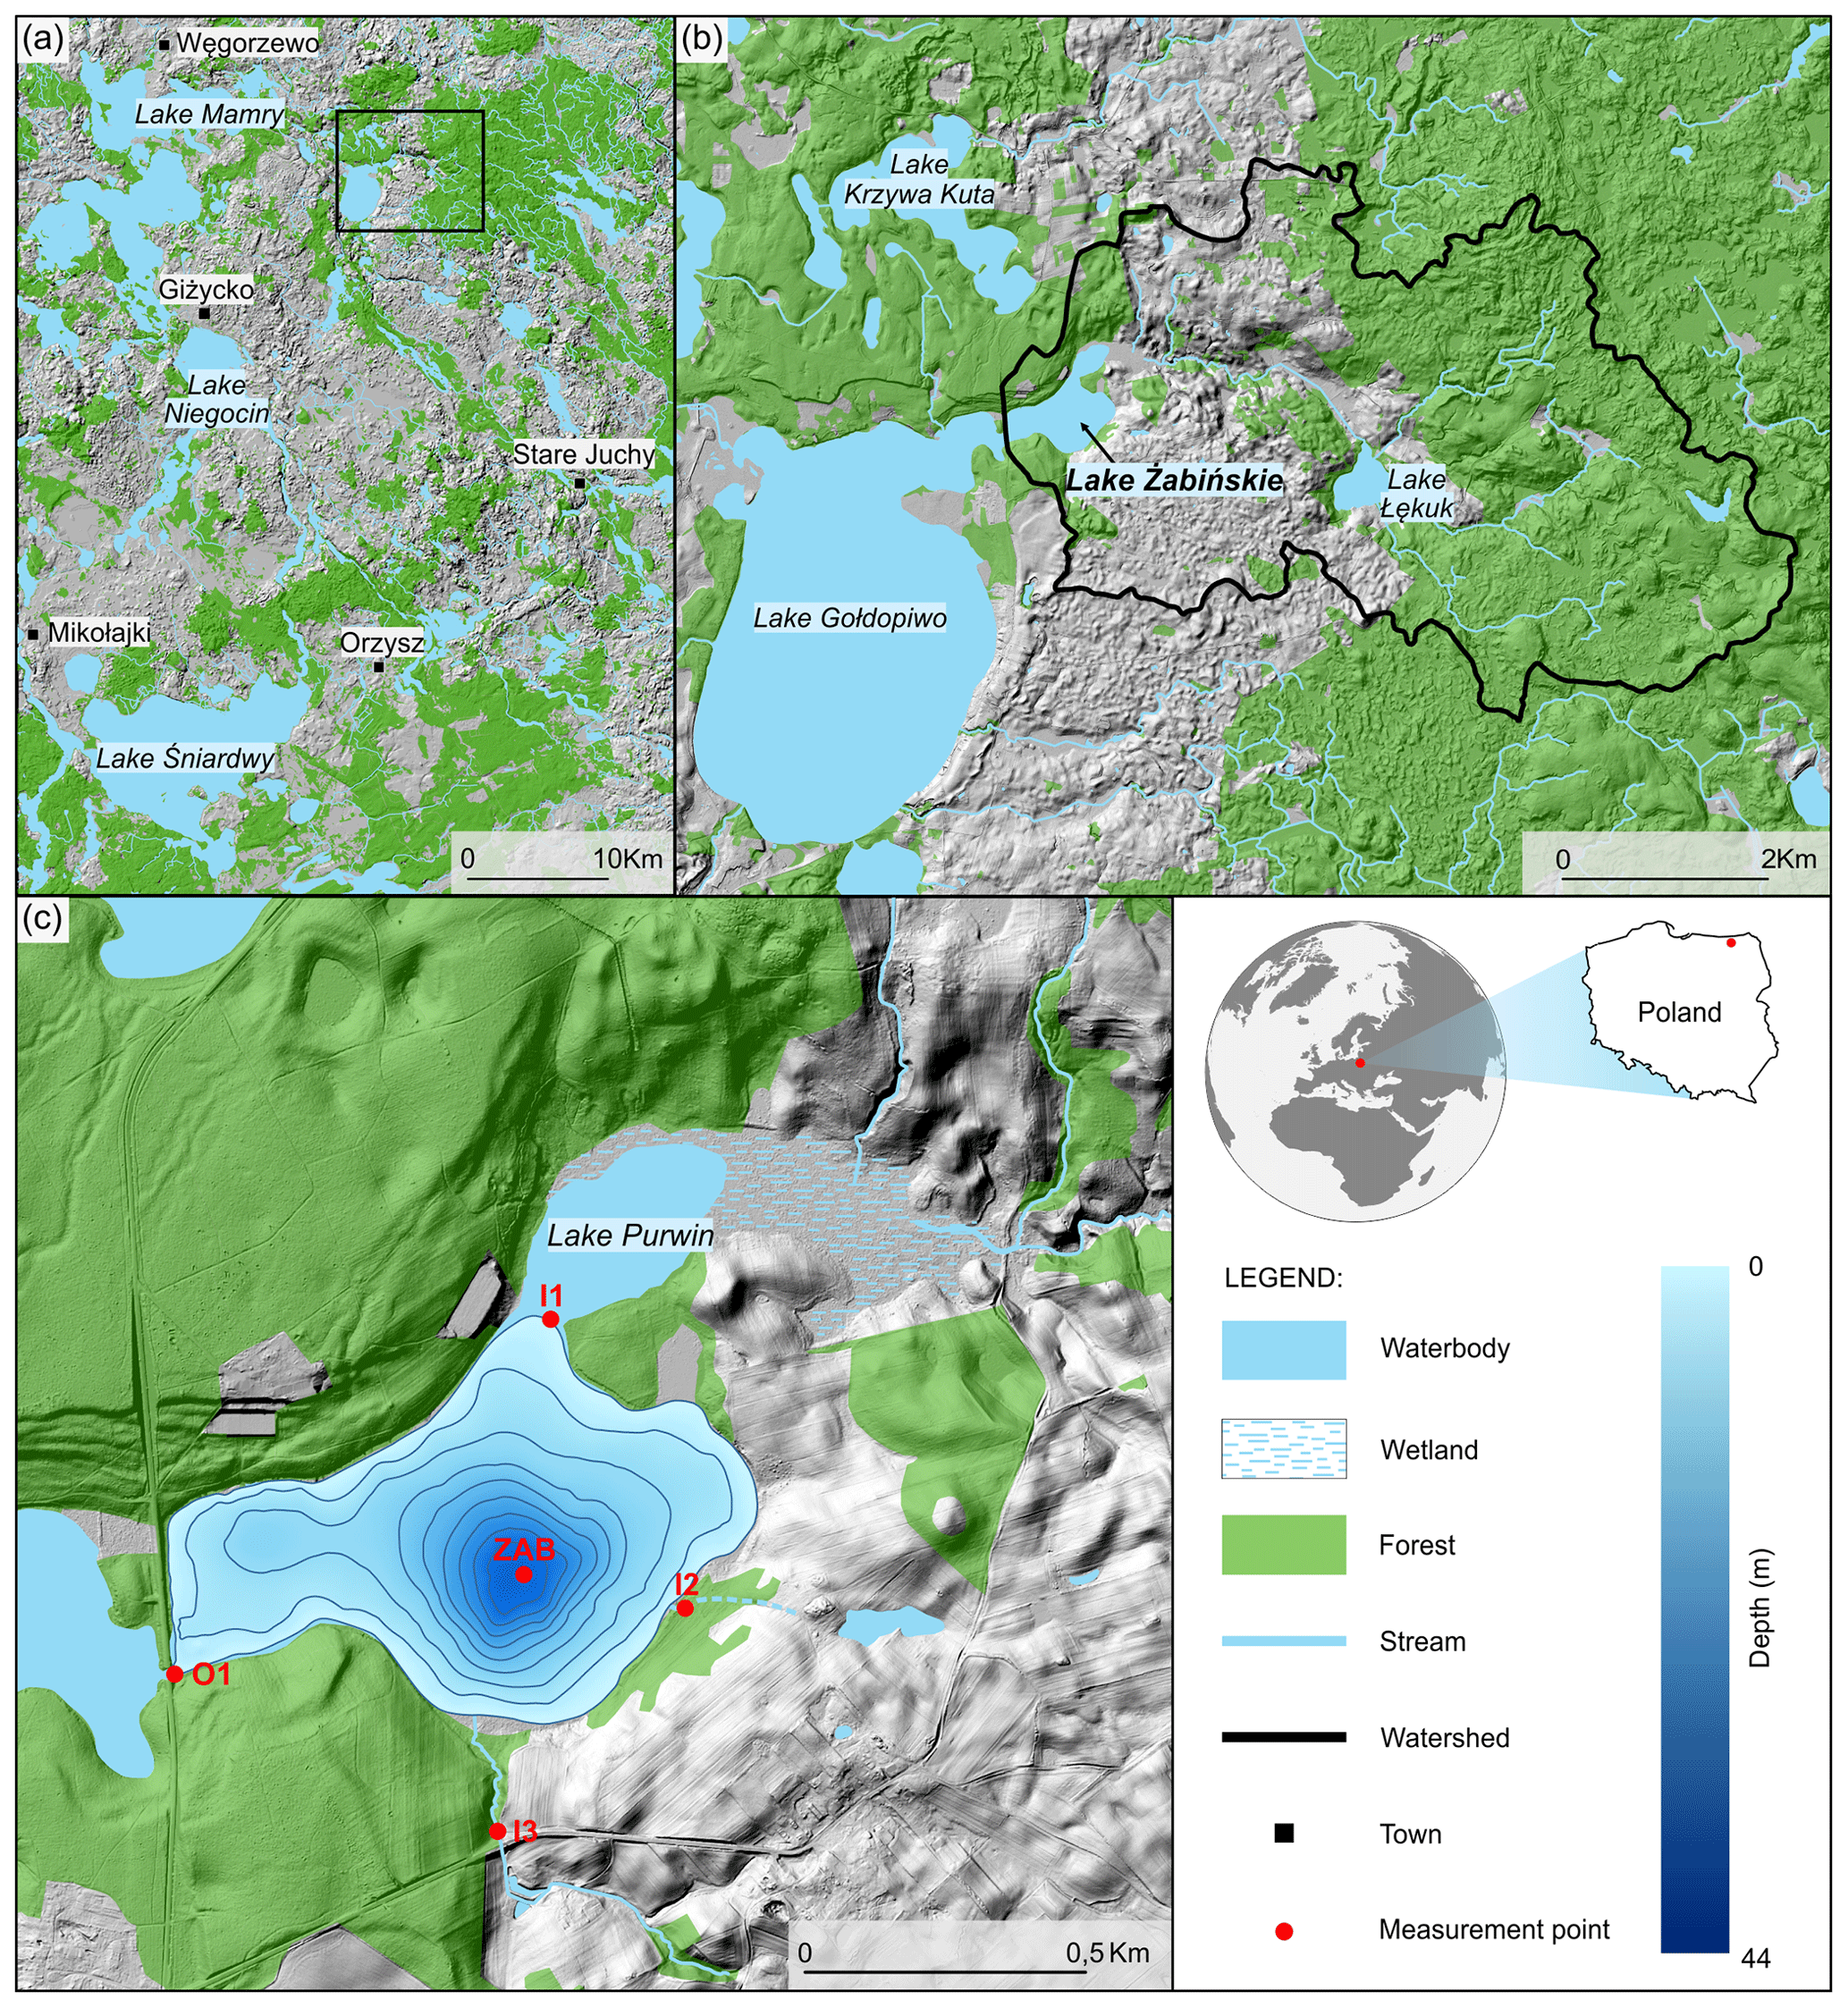
Figure 1Location and topography of the region (a) and Lake Żabińskie catchment (b), lake basin morphology with isobaths every 5 m and sampling points (c) (“O” stands for outflow and “I” for inflowing streams). Digital elevation model courtesy of © Polish Head Office of Geodesy and Cartography.
Lake Żabińskie (54.1318∘ N, 21.9836∘ E; 117 ) is located in the Land of Great Masurian Lakes, northeast Poland (Fig. 1). The region is characterized by a typical postglacial landscape, with diverse morphology, a wide diversity of glacial landforms, and a very high abundance of lakes. According to meteorological data for the period 1991–2020 (Tomczyk and Bednorz, 2022), the continental climate features strong seasonality with a mean annual air temperature of 8.0 ∘C, the lowest mean monthly temperatures occurring in January (−2.5 ∘C), and the highest in July (18 ∘C). Ice cover on lakes in the region usually occurs between December and April (Marszelewski and Skowron, 2006), but in the last 2 decades this period has been shortened. Snow cover usually lasts for about 60 d. Annual precipitation varies between 550 and 600 mm with a predominance of summer rainfall. The wettest month is June (approx. 80 mm), whereas February is the driest (approx. 25 mm). Westerly and southwesterly winds dominate in the area (Hutorowicz et al., 1996). The hydrographic network in the region has the highest areal density of lakes in Poland, reaching 20 % (Choiński, 2007).
Lake Żabińskie lies in the northern part of the region (Fig. 1). The total catchment area (24.8 km2) extends eastward from the lake and is divided into three subcatchments: Lake Łękuk (13.6 km2), Lake Purwin (7.2 km2), and the direct catchment of Lake Żabińskie (4.0 km2). The catchment topography is diverse, showing moraine landscape features with elevations between 117 and 230 . Valleys and lake basins are incised with steep slopes, locally reaching 45∘. The surface geology is dominated by glacial tills and widespread fluvioglacial sands and gravels associated with outwash formations (Szumański, 2000). Modern land cover in the catchment is dominated by forests (approx. 65 %). The woodland communities consist mainly of different types of pine and mixed pine forests that prevail on sandy soils, whereas oak–lime–hornbeam forests developed in morainic areas on the more fertile substrates (Forest Data Bank, 2014–2023). Arable land and pastures (approx. 31 %) are found in the area between Lake Żabińskie and Lake Łękuk. Human settlements are located in the Lake Żabińskie catchment: Żabinka village 0.5 km south of the lake and a recreation area on the northern shore of the lake.
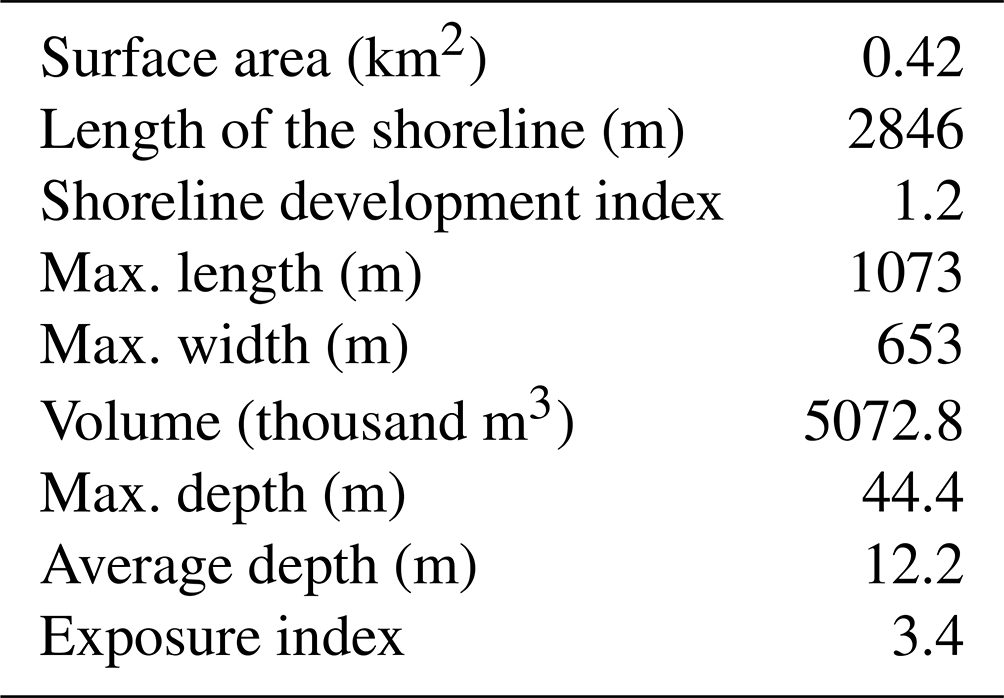
Lake Żabińskie has typical kettle hole lake characteristics, i.e., small surface area (0.4 km2) and relatively high maximum depth of approx. 44 m (Fig. 1). The lake basin is slightly elongated in the W–E direction and shows two subbasins: the central and deepest part, surrounded by steep slopes, and the shallow part on the west side, with a maximum depth of 12 m. The basic morphometric features of the lake are presented in Table 1. The lake receives water from nearby Lake Purwin and two southern creeks supply water from cultivated fields. The southernmost inlet transports substantial amounts of sediment particles and organic remains, especially after spring snowmelt and heavy rains in summer. The lake drains westward into the larger Lake Gołdopiwo. Taking into account the hydrogeological situation, the lake is likely supplied by groundwater from aquifers related to surrounding outwash plain sands or deeper inter-morainic sediments (Mapa Geośrodowiskowa Polski. Arkusz Giżycko, 2012).
Lake Żabińskie is a hardwater eutrophic waterbody with a highly productive and calcium-rich epilimnion. Anoxic conditions in deep waters have led to good preservation of varves in sediments. For this reason, the Lake Żabińskie sediment record has been investigated extensively in terms of modern sedimentation (Bonk et al., 2015; Żarczyński et al., 2022), history of lake mixing regime and productivity (Witak et al., 2017; Żarczyński et al., 2019; Zander et al., 2021), catchment erosion (Bonk et al., 2016), and vegetation change and human impact (Wacnik et al., 2016; Hernández-Almeida et al., 2017).
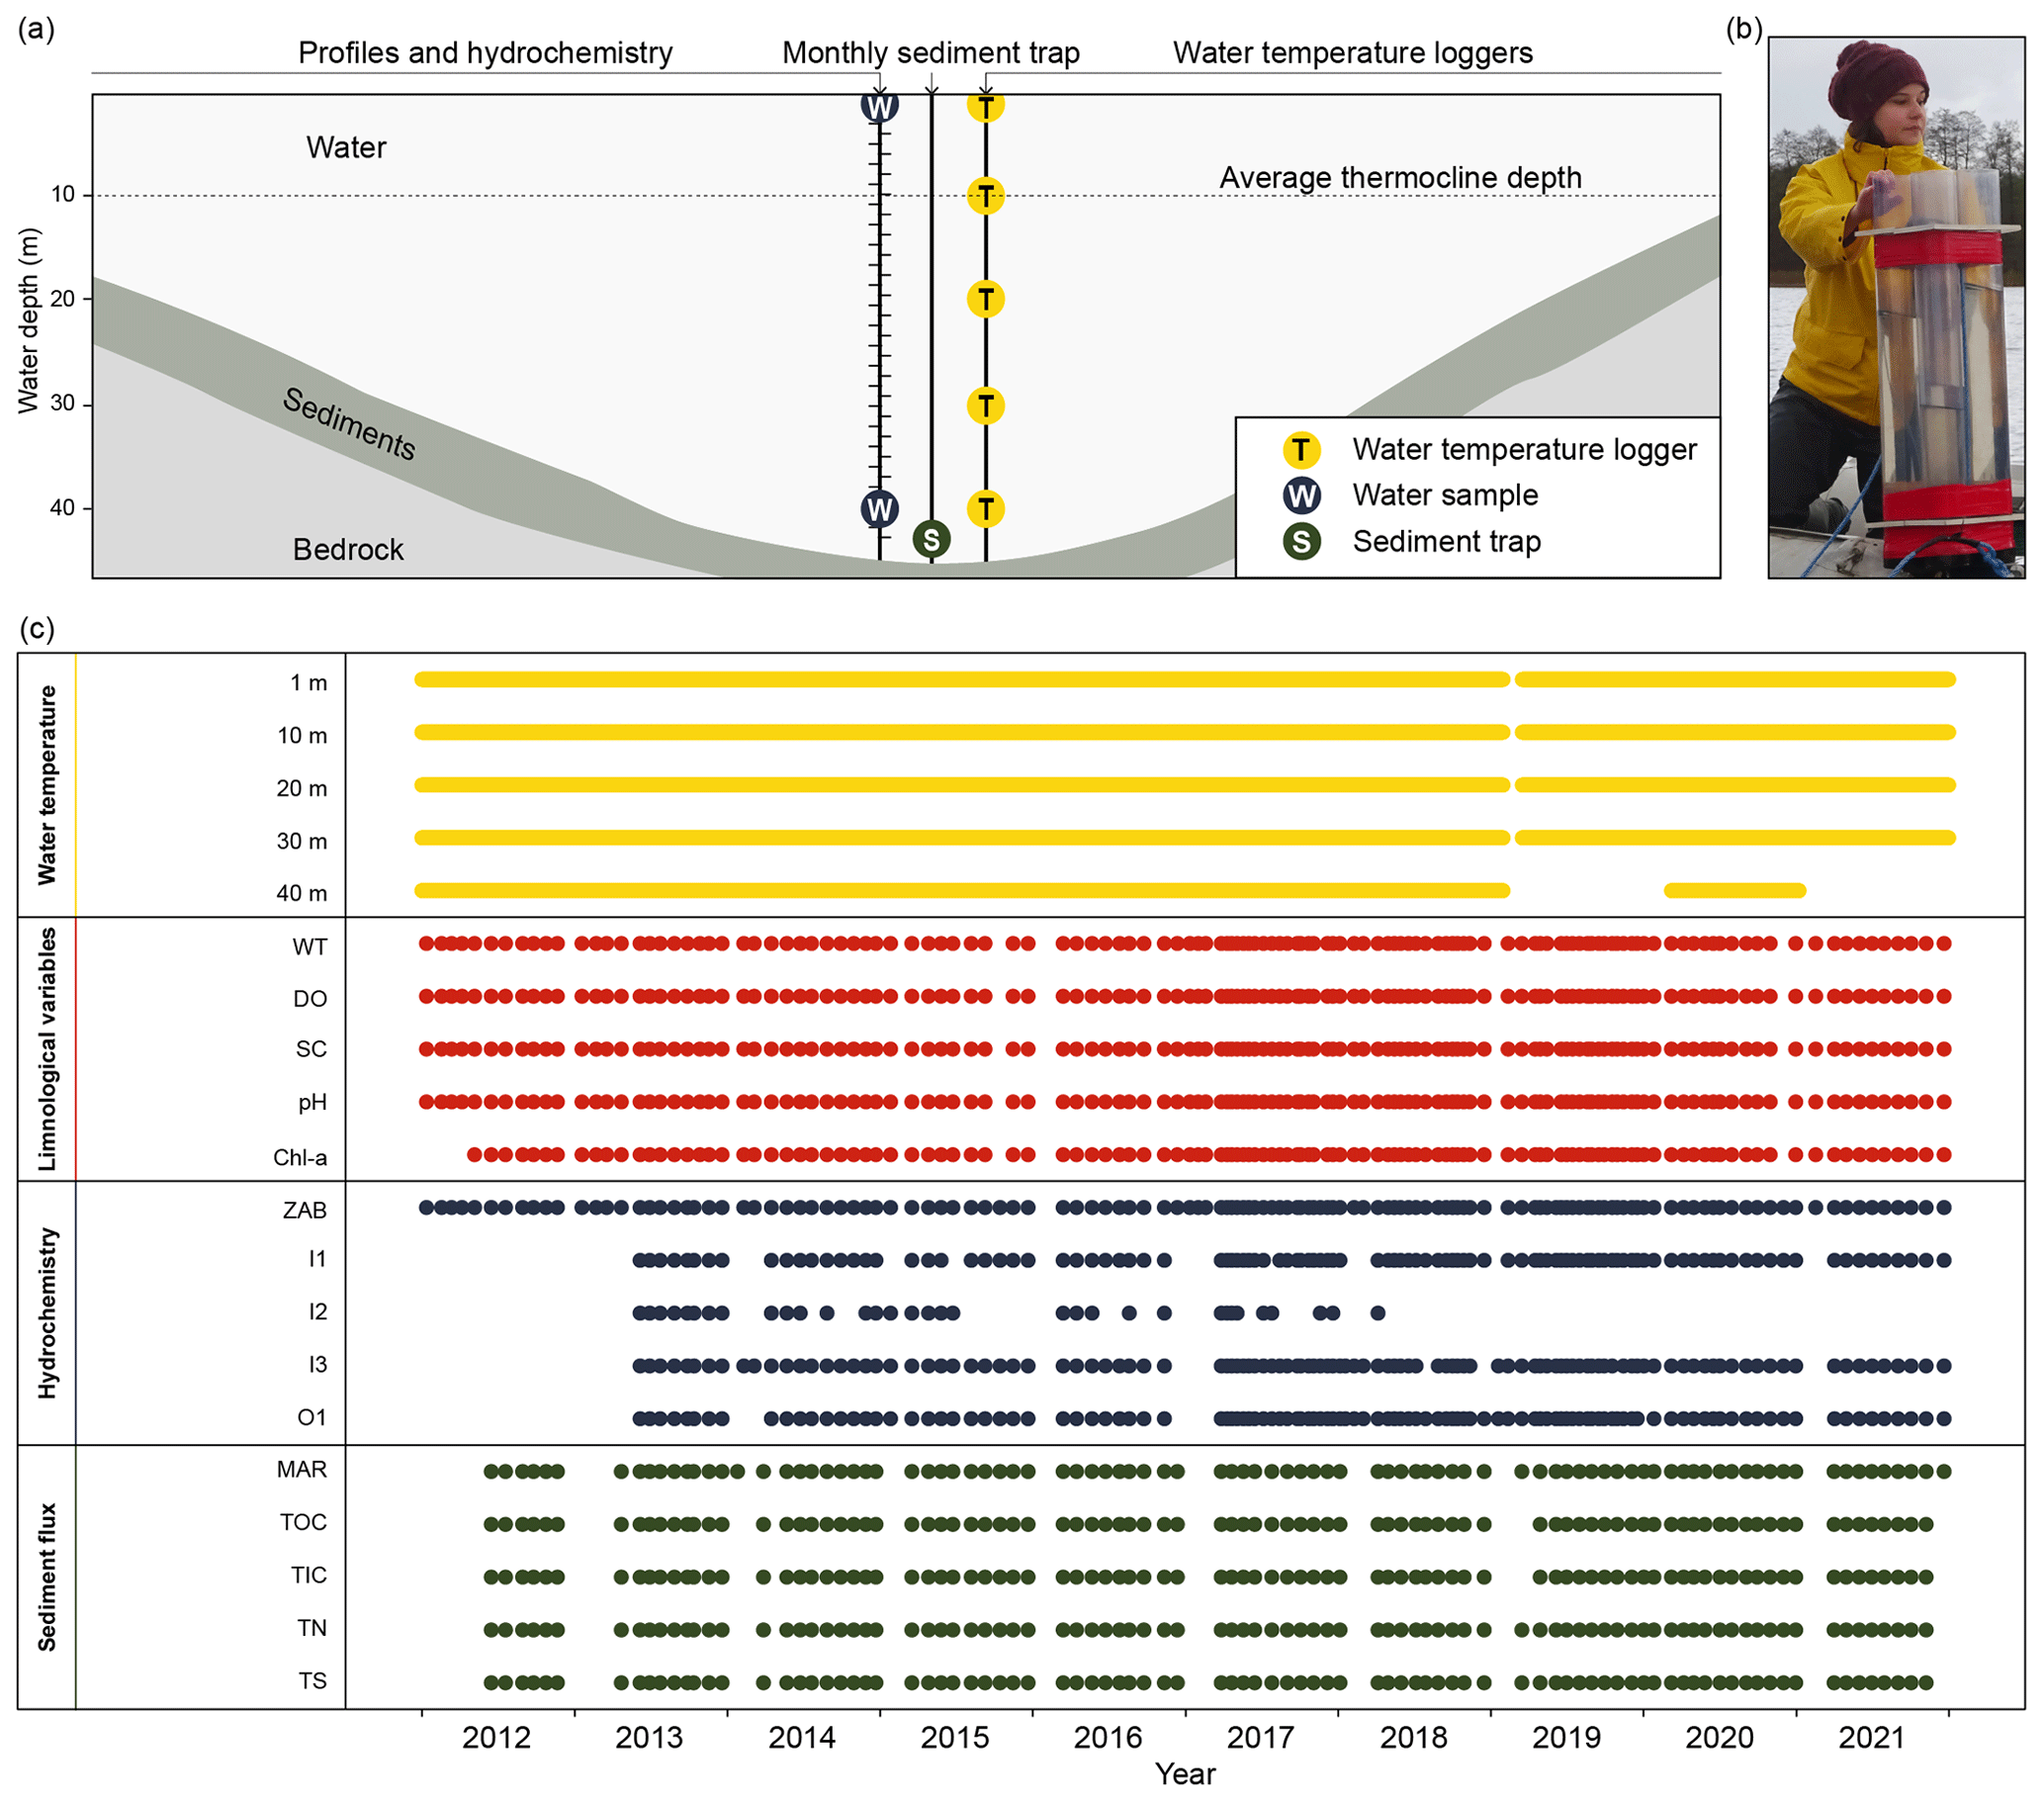
Figure 2Measurement setup (a), sediment trap (b), and data coverage (c). Abbreviations used in panel (c) are explained in Sects. 3.2–3.4.
3.1 Strategy for long-term monitoring
Limnological measurements in Lake Żabińskie were initiated in 2011, but regular observations started in 2012. The overall concept of monitoring is presented in Fig. 2. The primary measurement location was established at the deepest site in the lake (Fig. 1). Two submerged buoys are anchored at this position. Lake water temperature and monthly sediment deposition were continuously measured by thermistors and a sediment trap, respectively. Additionally, several lake water variables were manually measured in situ at regular intervals. At the same time, water samples were collected from the water column, inflows, and outflow. The population in the region and easy access to the lake for anglers and other visitors limited the possibility to install costly automatic measurement infrastructure. Thus, we decided to install only basic equipment (thermistors and sediment trap), whereas other measurements required regular field trips. Long-term daily meteorological data from stations in Kętrzyn (approx. 40 km west of the lake) and Mikołajki (approx. 50 km southwest of the lake) are publicly available from the Institute of Meteorology and Water Management – National Research Institute (https://danepubliczne.imgw.pl/, last access: 15 March 2023).
3.2 Water-column measurements and sampling
A chain of HOBO Water Temperature Pro v2 loggers (ONSET, USA) was deployed under the buoy anchored at the deepest part of the lake (Fig. 2). The loggers recorded the water temperature every 15 min at depths of 1, 10, 20, 30, and 40 m. Data were typically offloaded from the loggers once a year, in the late fall or early winter. After each offload, data were cleaned and homogenized. Cleaning included manual removal of records obtained during the offload (e.g., the logger was not submerged and showed air temperature). Additionally, the data were screened for gross errors (temperature > 35 and < 0 ∘C, negative values were corrected to 0 ∘C). Afterward, the data were cleaned by removing the most extreme 0.1 % from the series (i.e., quantiles 0.0005 and 0.9995). Finally, the time zone was standardized across the records and expressed as UTC.
Because of minor shifts that occurred every time the buoy was reset (see “series” variable in the dataset), data series from every depth were homogenized to account for the alteration in the logger depth. For this, the ratio of the mean water temperature for the last 2 h from the preceding time series to the first 2 h from the following sequence was calculated and used as a correction factor for the next series. This step minimized minor changes that occurred between the measurement series. The homogenization procedure was reset every time a gap was introduced (see “period” variable in the dataset) to account for gaps (e.g., no data recorded) in the series and to avoid artificial shifts.
Homogenized time series from each depth were used to calculate daily mean temperature values. Because of hard drive failure and corruption of raw files with data from the logger installed at a depth of 1 m, no raw data are available from 4 November 2017 to 30 January 2019. However, we update our logger database and calculate daily means every time new data are acquired, which happens roughly once a year. We were able then to restore this lower-resolution data and use it to fill the gap. Additionally, data between 31 January and 16 March 2019 are unavailable for the entire chain because of logger battery failure. Furthermore, the dataset from the depth of 40 m has more gaps, for example, because of loggers being lost during the annual retrieval and not being replaced (31 January 2019–7 March 2020 and 8 January–31 December 2021). Temperature data from 40 m depth between 8 March 2020 and 7 January 2021 were recorded by the HOBO U26 Dissolved Oxygen logger (ONSET, USA) operating at 1 h resolution.
Water-column variables were measured between January 2012 and December 2021 at monthly intervals (2012–2016, 2020–2021) or once every 2 weeks (2017–2019). All measurements were performed at the same location (Fig. 1) from a rubber boat or from the ice cover during winter. Field work was suspended when the ice cover was not sufficiently thick. During 130 field campaigns, we measured water temperature (WT), dissolved oxygen concentration (DO), pH, specific conductance (SC), and Chlorophyll a concentration (Chl a) in the water depth range of 0–40 m at 1 m intervals. During 2012–2015, a YSI 6820 multiparameter sonde (Yellow Springs Instruments, USA) was used, whereas Chlorophyll a measurements were done using MINItracka IIC fluorometer (Chelsea Instruments, UK). Afterward, an EXO2 multiparameter sonde (Yellow Springs Instruments, USA) was used for all measurements.
Water samples were collected from 1 and 40 m water depths at the same intervals as the limnological measurements presented above. Additionally, since 2013 we have collected samples from major inflows (I1, I3) and outflow (O1), while sampling inflow I2 was generally not possible because of its episodic nature. Gaps in the dataset are related to periods without water in the inflow channels. Water samples were collected using a Van Dorn water sampler, placed in 1 L polyethylene bottles, transported to the laboratory, and stored at 4 ∘C before analysis. Concentrations of major ions and nutrients (Ca2+, Mg2+, Na+, K+, , Cl−) were determined by ion chromatography (ICS 1100, Dionex, USA). Total phosphorus (TP) and total nitrogen (TN) analyses were performed after sample mineralization using the colorimetric method and Spectroquant spectrophotometers (NOVA 400, Pharo 300, Prove 600; Merck, Germany).
3.3 Sediment trap sampling and analysis
Monitoring of modern sedimentation was carried out with a sediment trap made of four 1 m long PVC liners (∅ 90 mm; 0.02344 m2 total active area) with removable cups at the bottom. The active area of the trap was exposed at 2 m above the sediment surface (Fig. 2). The trap was installed in May 2012 and recovered monthly (average interval ≈ 33 d, 93 samples) during the ice-free seasons. Longer periods between trap retrieval occurred under ice-cover conditions (62 to 153 d, eight samples). The samples were transferred from the trap into plastic containers, transported to the laboratory and stored at 4 ∘C before analysis. First, samples were freeze-dried and weighed to estimate dry sediment mass. Daily fluxes, i.e., mass accumulation rates (MAR, ), were then calculated by dividing the sample mass (g) by the trapping time (d) multiplied by the active area (m2).
Concentrations of total carbon (TC), total nitrogen (TN), and total sulfur (TS) in the sediment samples were determined with a Vario EL Cube elemental analyzer (Elementar, Germany) according to standard procedures (Żarczyński et al., 2019). Analyses of total inorganic carbon (TIC) were performed using a SoliTIC module (Elementar, Germany) coupled to the Vario EL Cube. Total organic carbon (TOC) was calculated as the difference between TC and TIC. The precision and accuracy of elemental analyses were tested on certified standard materials B2176 (CNS) and B2188 (TIC) supplied by Elemental Microanalysis. Precision ranges were TC 0.05 %–1.93 %, TIC 0.04 %–0.45 %, TN 0.01 %–0.22 %, and TS 0.01 %–0.06 %.
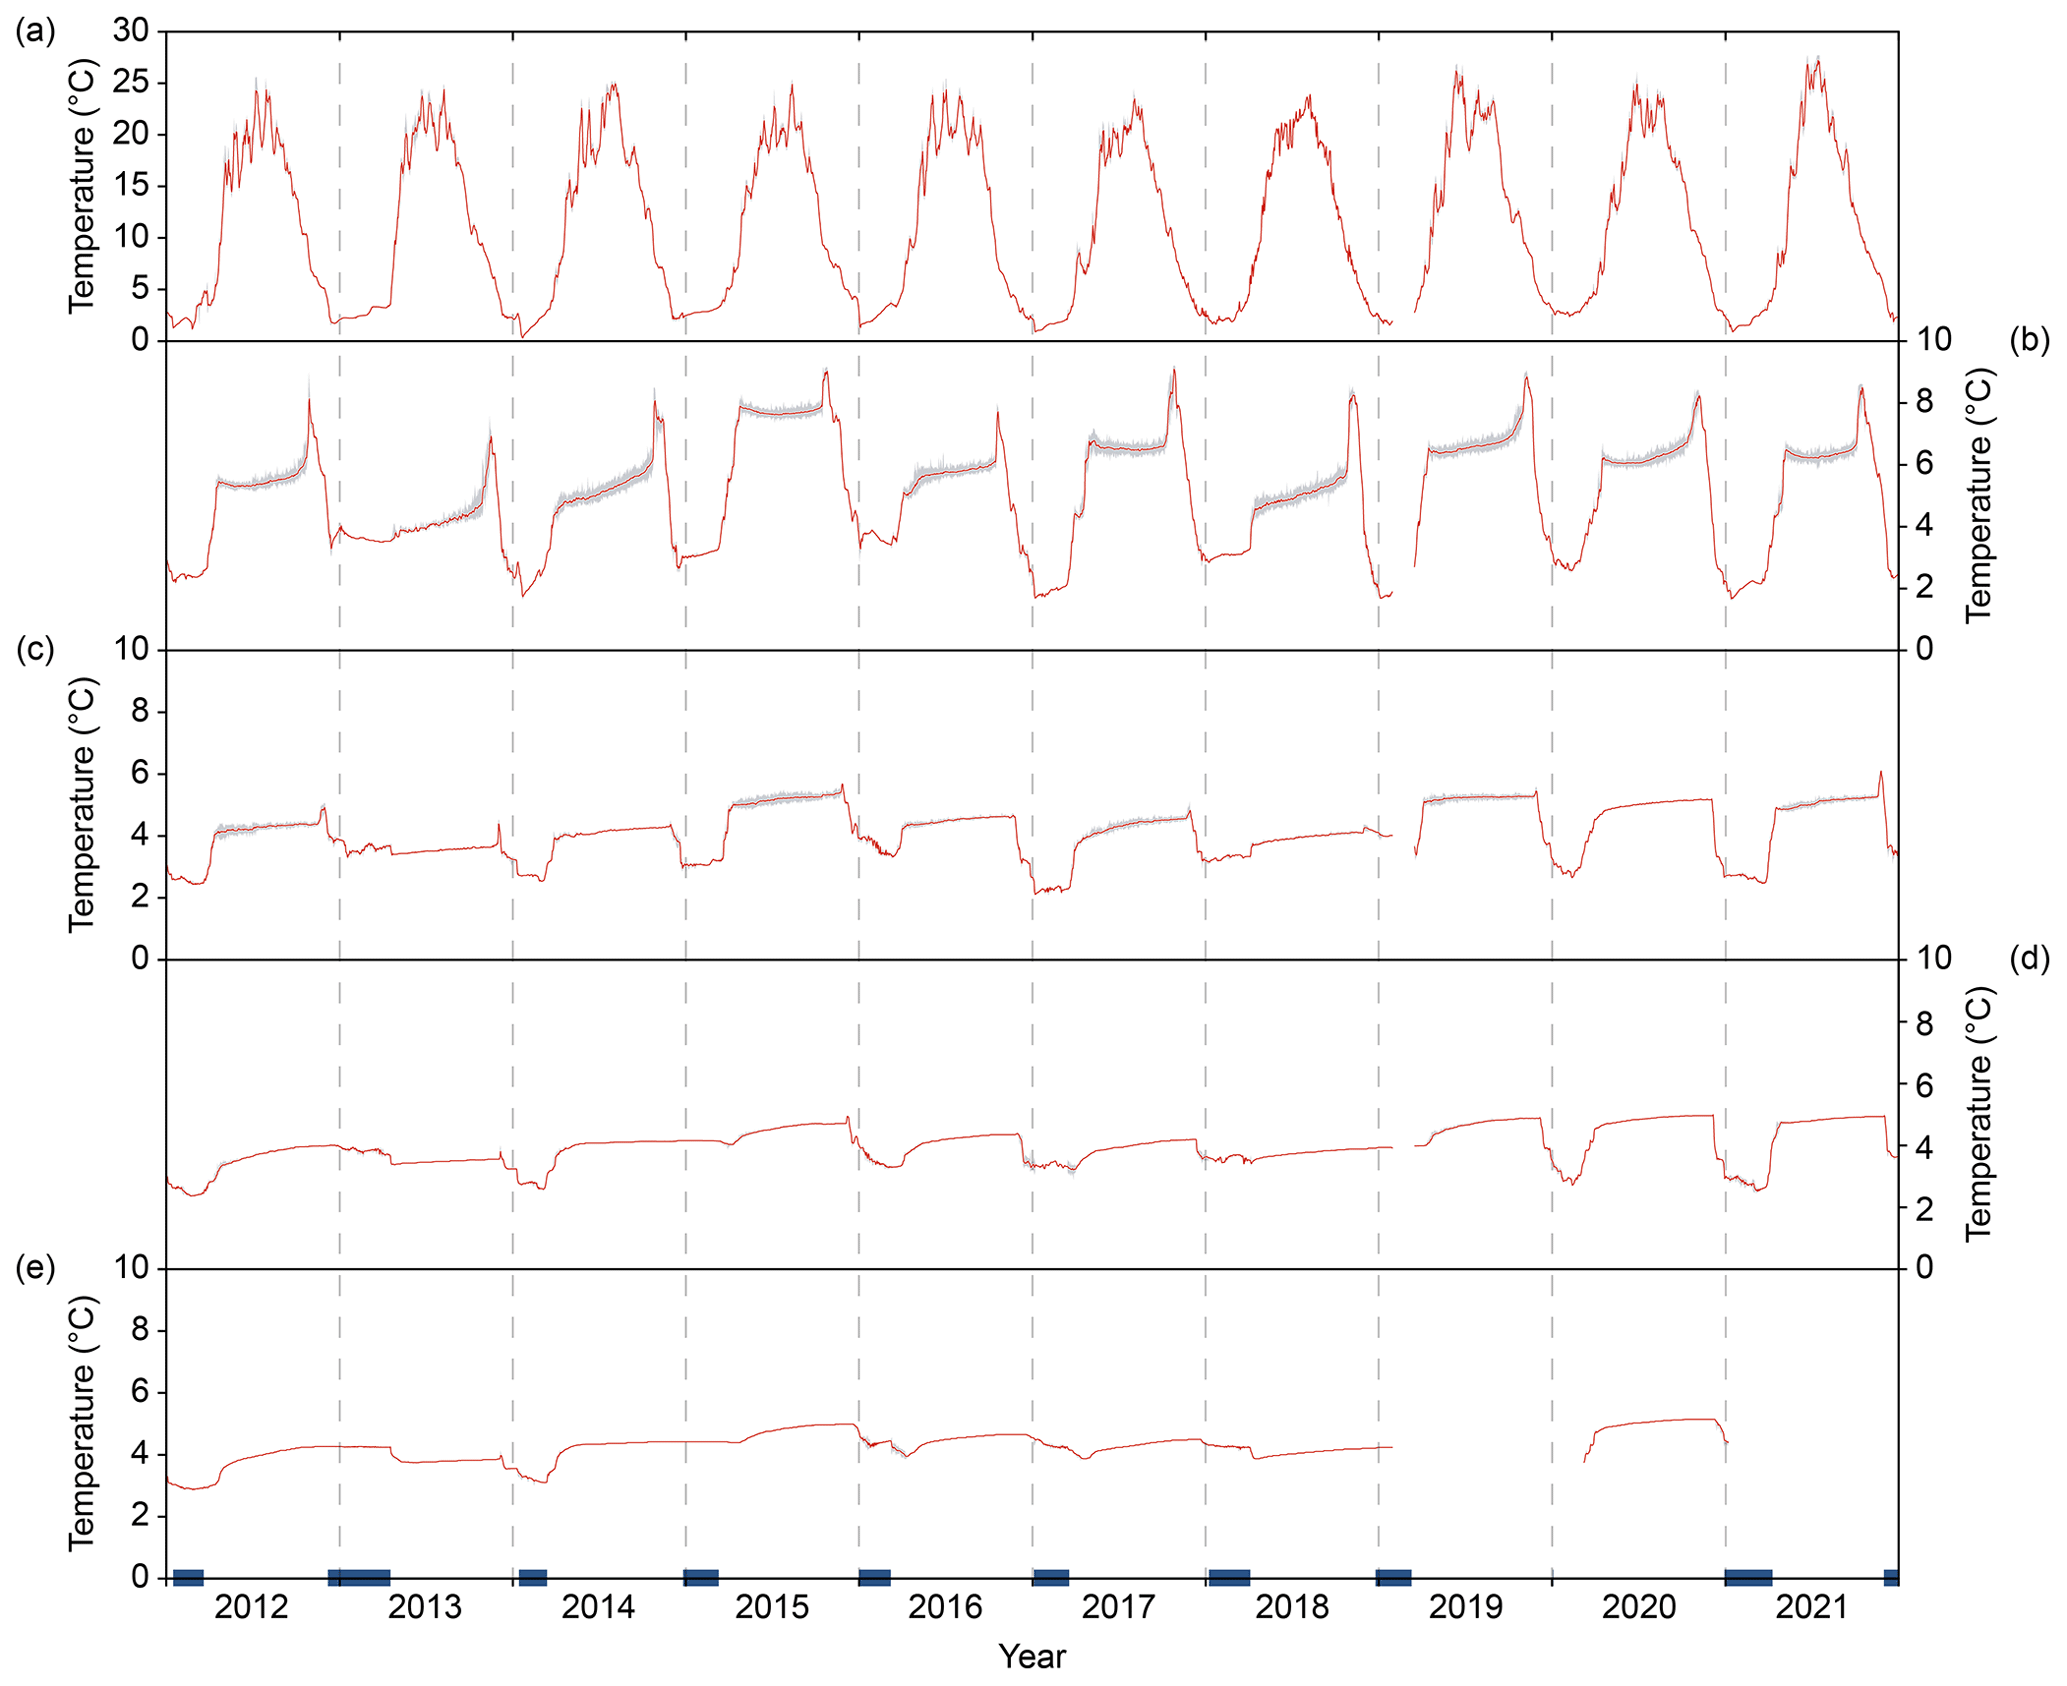
Figure 3Water temperature at different depths: (a) 1 m, (b) 10 m, (c) 20 m, (d) 30 m, and (e) 40 m. The red line represents mean daily values while the gray bands show minimum and maximum values for each day. Blue bars indicate periods with ice cover on the lake. Measurements done with HOBO loggers.
3.4 Ice-cover data
Dates of ice-cover formation and breakup were based on field observations and information obtained from local inhabitants (e.g., employees of the tourist resort located north of the lake). Additionally, available online Landsat and Sentinel satellite imagery datasets were manually screened for ice-cover traces. However, in some years, it was challenging to establish the number of days with frozen lake surface because of variable meteorological conditions with air temperature values around 0 ∘C, resulting in discontinuous ice cover.
4.1 Water-column data time series
Water temperature changes observed in the thermistor data series showed strong seasonality in the surface layer (Fig. 3). The range of mean daily values varied between 0.3 and 27.2 ∘C. The values and the variability in the water temperature in deeper waters were progressively lower, and below a depth of 20 m stabilized close to 4.0 ∘C.
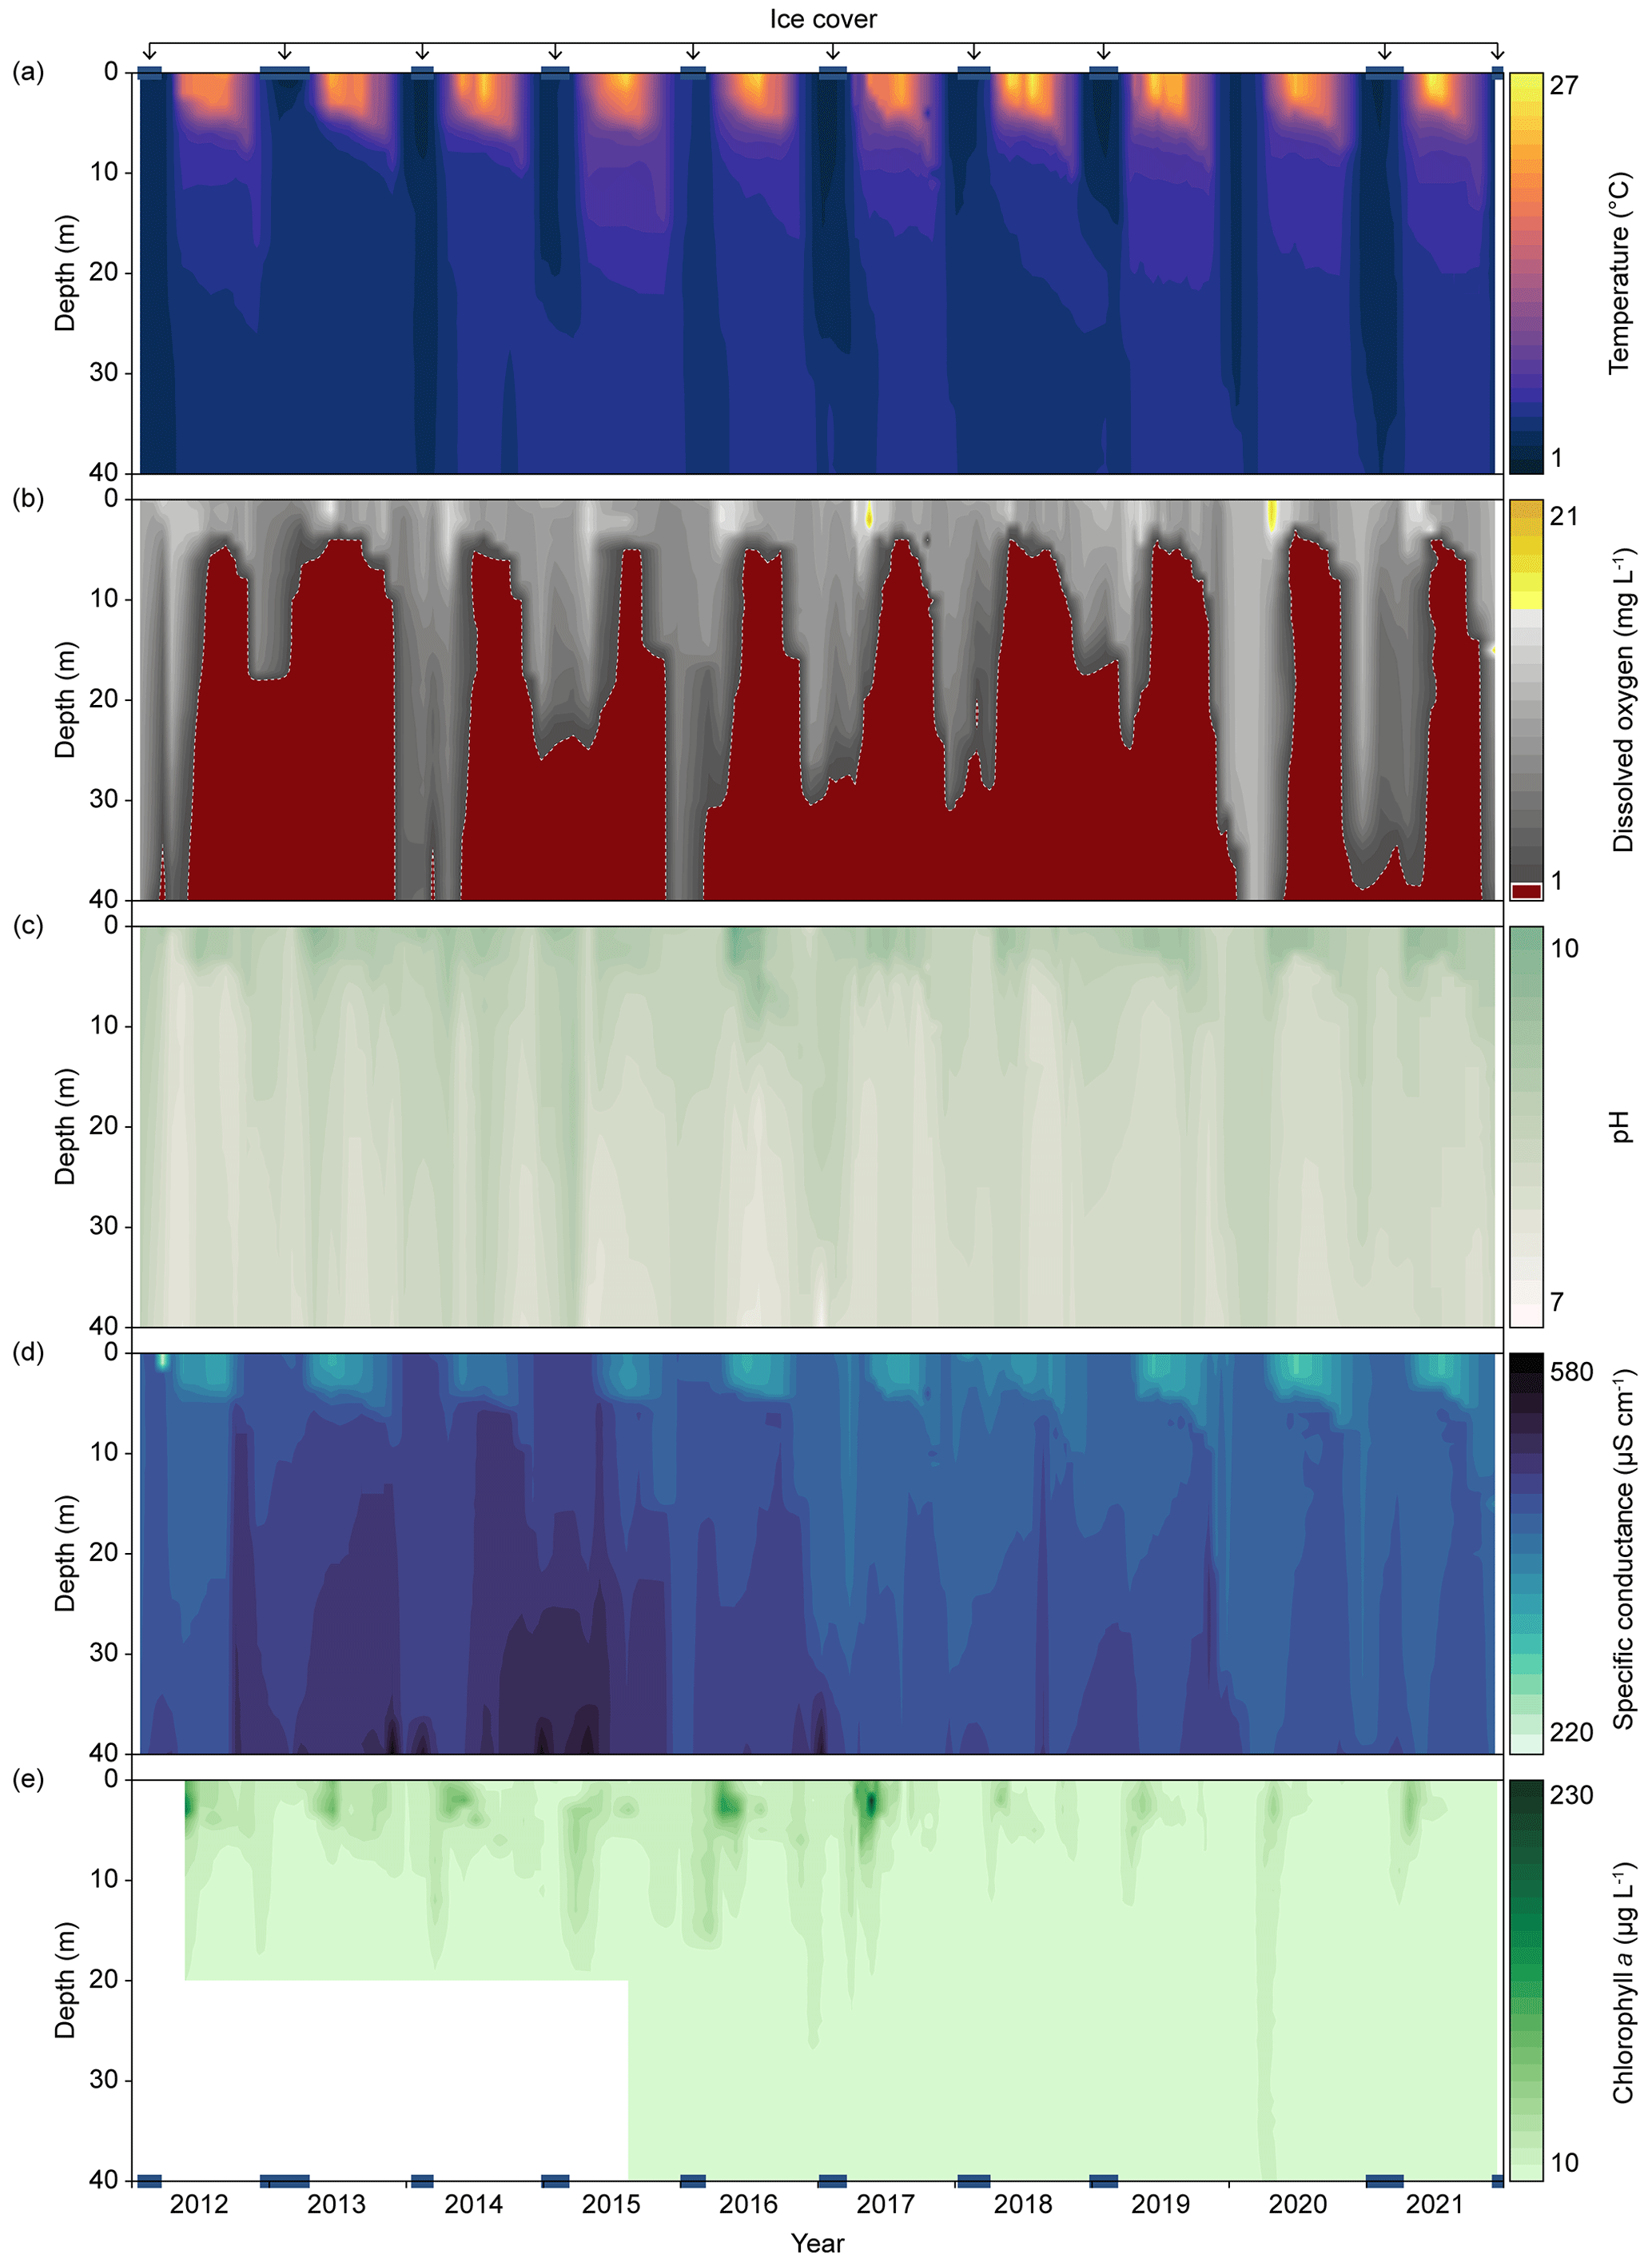
Figure 4Depth profiles of (a) water temperature, (b) oxygen concentration, (c) pH, (d) specific conductance, and (e) Chlorophyll a concentration through the water column of Lake Żabińskie. Data obtained during 130 field campaigns at monthly intervals or once every 2 weeks. Each measurement series covered the water depth range of 0–40 m at 1 m intervals.
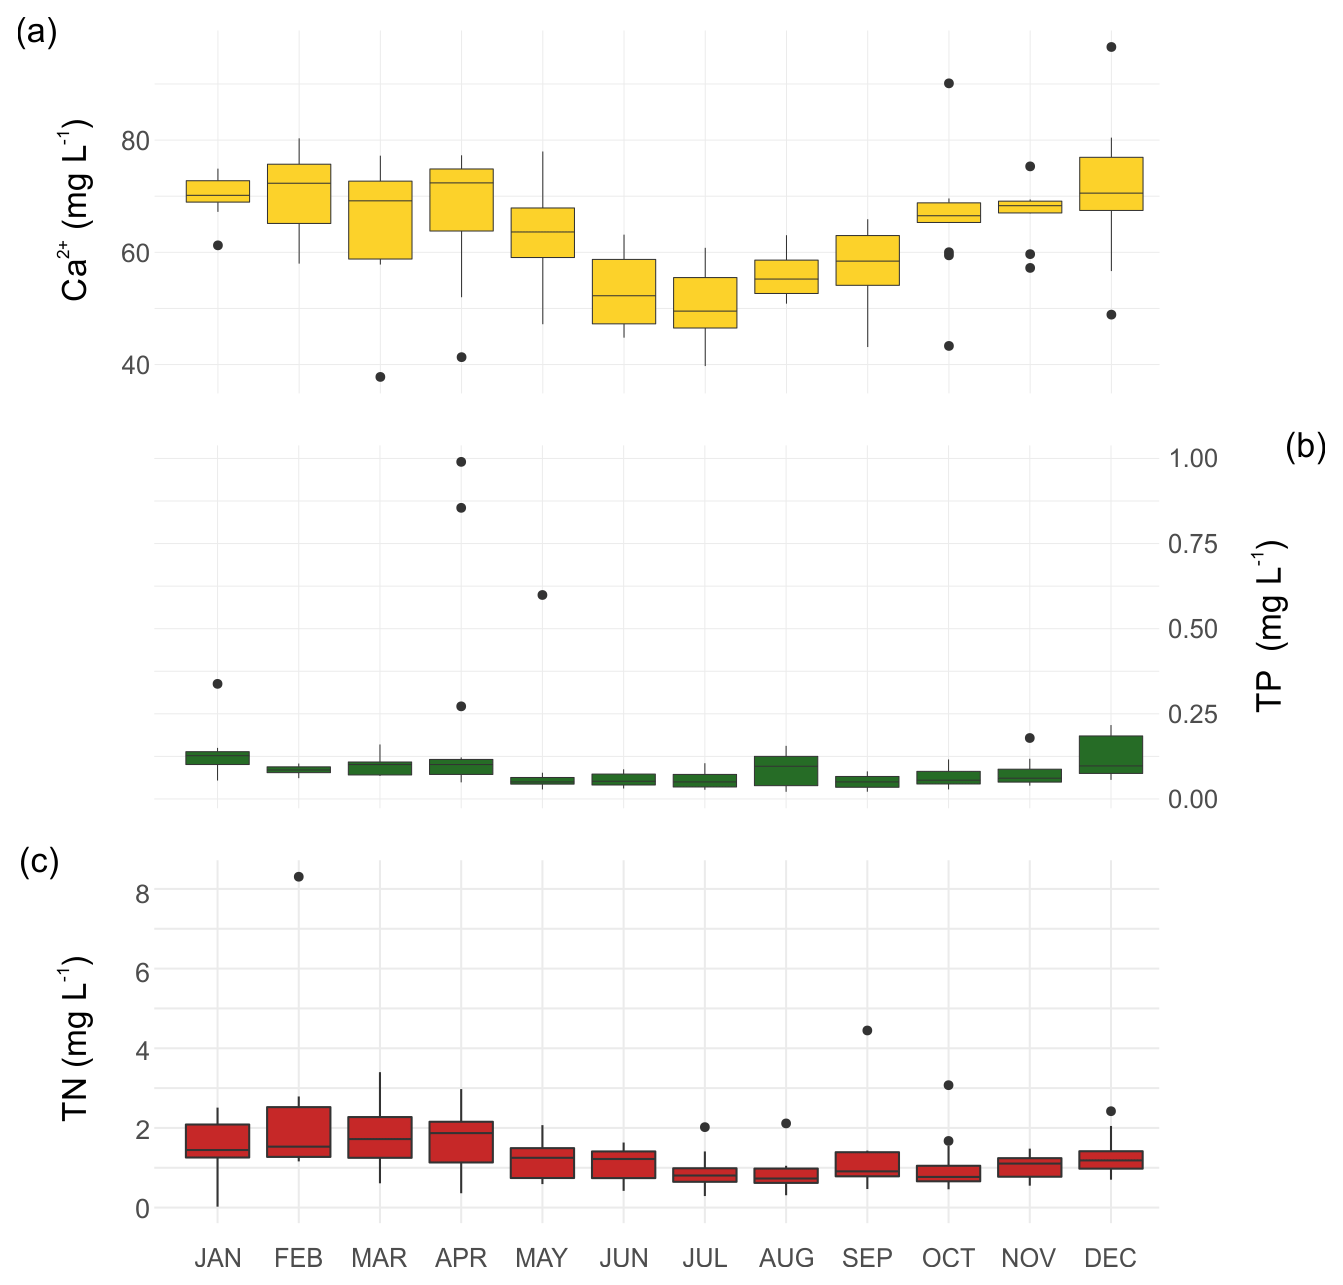
Figure 5Calcium (a), total phosphorus (b), and total nitrogen (c) concentrations in surface waters of Lake Żabińskie during the observation period (2012–2021).
The lake is generally dimictic and develops a strong summer stratification lasting from May/June to October (Fig. 4). The water column can be completely mixed in spring (April/May) and fall (November/December). Severe winter conditions lead to the development of ice cover and inverse water-column stratification, mostly from January to March. However, a detailed analysis of the major physico-chemical properties of Lake Żabińskie showed a more complex stratification regime depending on the seasonal meteorological conditions (Żarczyński et al., 2022). The intensity of spring/fall mixing is well illustrated by the vertical distribution of oxygen concentrations in the water column (Fig. 4). During sufficiently long mixing periods, oxygen was transported to the lake bottom (e.g., spring 2012, fall 2013, spring 2014, fall 2015, and winter/spring 2020), whereas rapid development of summer stratification or ice cover resulted in oxygen only reaching a certain depth (e.g., during the period 2016–2018). During the summer stratification, anaerobic conditions developed throughout the hypolimnion, and the zone of hypoxia extended to a water depth of 4 m. We also observed the influence of increasingly mild winters, e.g., in 2019/2020 when ice cover did not develop. This resulted in long and intensive mixing and high oxygen content in the whole water column. A similar situation occurred in the winter of 2020/2021, when the ice cover was thin and discontinuous.
Data on water pH, specific conductance, and Chlorophyll a show characteristic variability related to biogeochemical processes that occur in the epilimnion during spring and summer (Fig. 4). Rapid warming of the epilimnion during spring limited CO2 solubility and led to a quick increase in water pH. At the same time, an increase in water temperature triggered intensive phytoplankton blooms expressed as peaks in the content of Chlorophyll a. Finally, these processes led to rapid calcite precipitation and a subsequent decrease in specific conductance. This phenomenon was observed every year throughout the monitoring period.
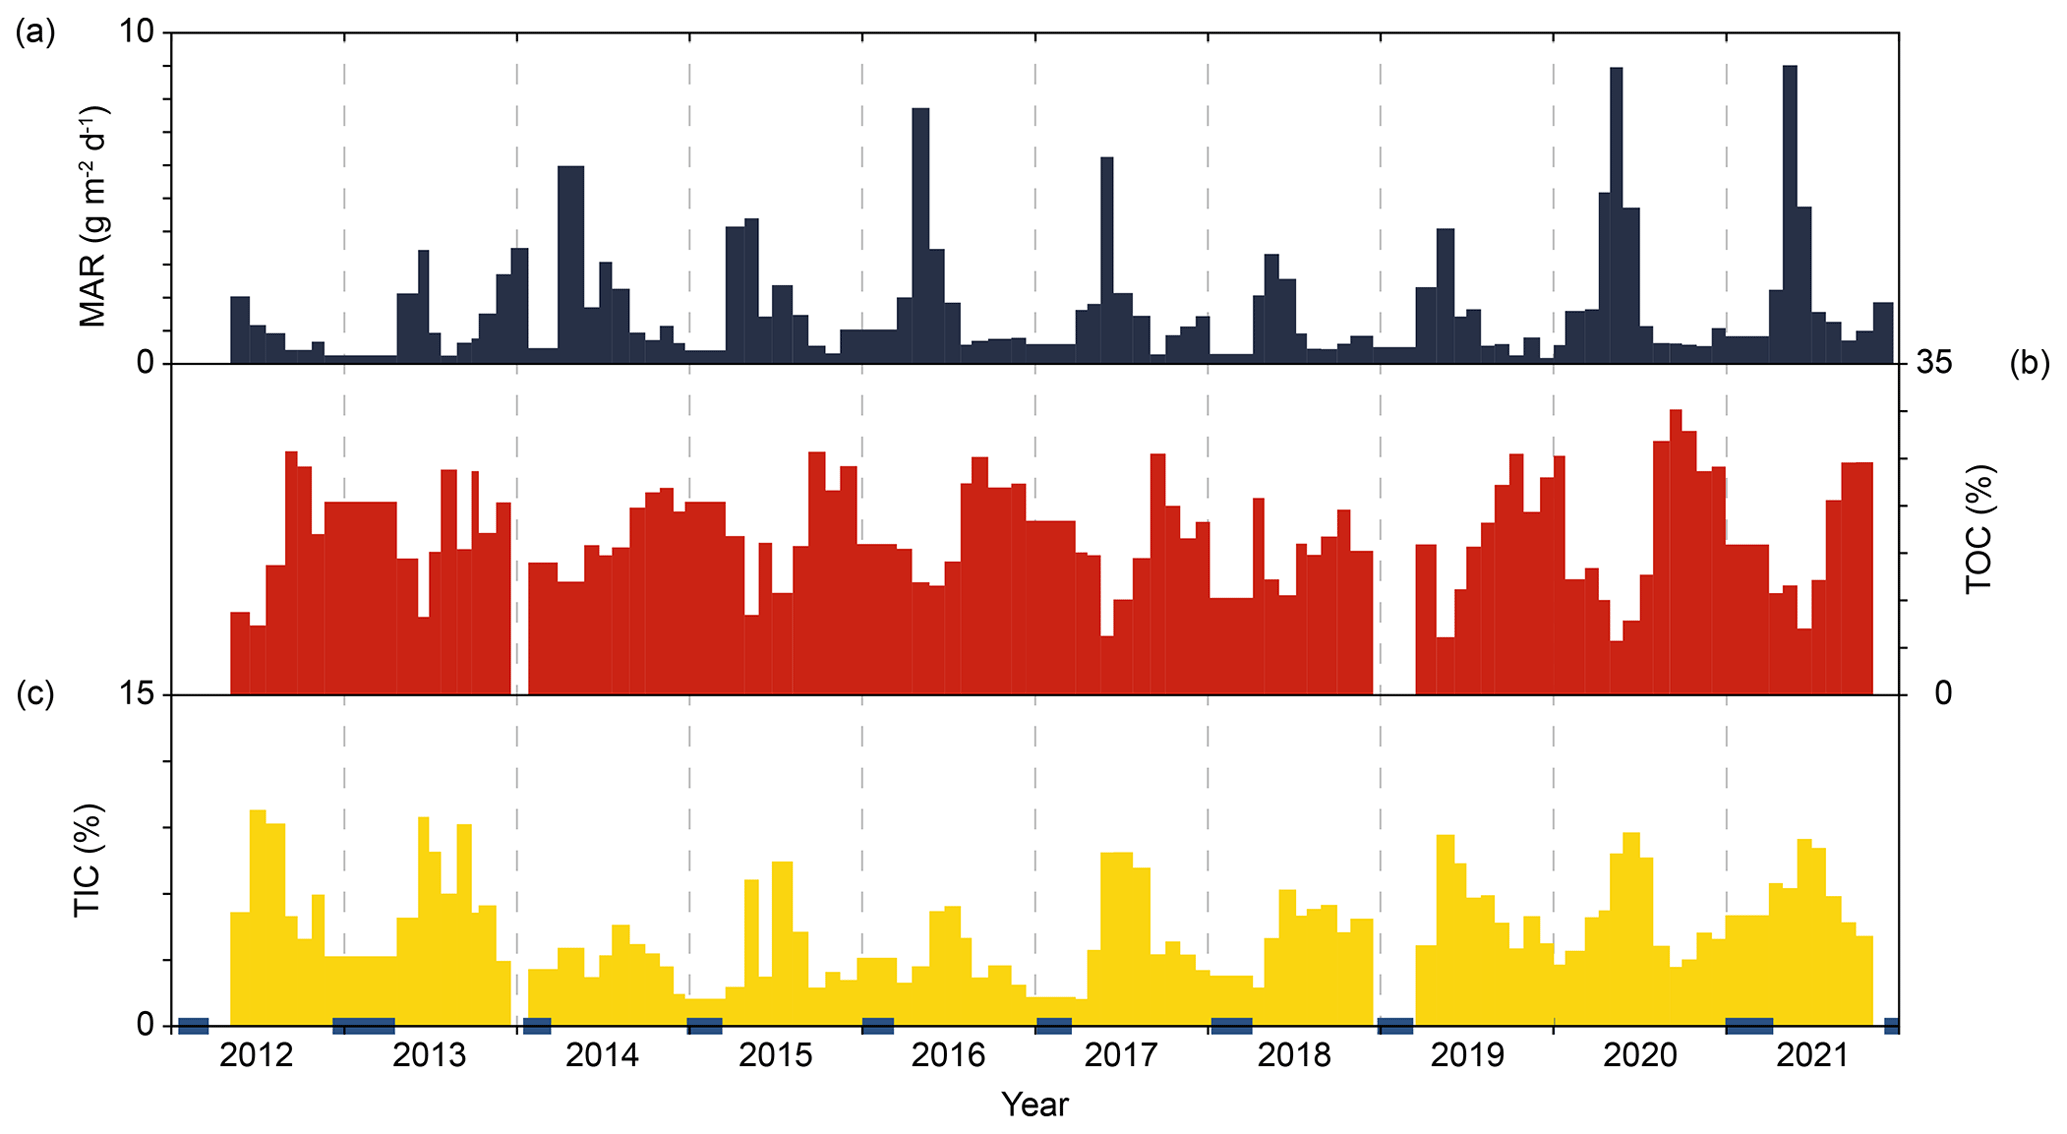
Figure 6Mass accumulation rate changes and weight (%) of major sediment components in the sediment trap samples. Data calculated for 93 samples collected from the sediment trap.
Changes in the chemical composition of the Lake Żabińskie surface waters showed strong seasonality associated with spring blooms of phytoplankton and the processes of calcite precipitation as described by Bonk et al. (2015). This is illustrated by the variability in concentrations of Ca2+ and nutrients (Fig. 5). The highest concentrations of Ca2+ were recorded during the winter season and the period of water mixing in early spring (> 70 mg L−1). After the spring turnover, concentrations tended to drop as summer stratification developed (< 50 mg L−1). Similarly, the highest mean concentrations of TP and TN in the epilimnion were measured in the winter and immediately after the ice-out (0.21 ± 0.71 mg L−1 for TP, and 2.76 ± 2.78 mg L−1 for TN). Also, maximum nutrient values are highest during late winter and spring (Fig. 5). Afterward, during the summer stratification, epilimnetic values reached annual minima as low as 0.05 and 0.89 mg L−1 for TP and TN, respectively. High nutrient concentrations in the surface waters during early spring resulted from accumulation of nutrients in the hypolimnion during winter, which were transported to the epilimnion during spring water-column turnover. Then, with the rapid air temperature rise and subsequent warming of the epilimnion, CO2 solubility decreased, causing a rapid increase in water pH. Intense algae blooms led to depletion and CaCO3 supersaturation. Finally, this led to rapid calcite precipitation, as seen by a drop of Ca2+ concentrations and peaks in the deposition of carbonates accumulated in the sediment trap (Fig. 6).
4.2 Modern sedimentation
Sediment mass accumulation rates varied dramatically throughout the monitoring period (Fig. 6). The highest peaks in MAR were recorded each year shortly after the spring turnover (May/June), after which values dropped towards midsummer. In some years, another increase was visible near fall turnover, e.g., in 2013, 2017, and 2021. The lowest values were observed during the winter with the lake under ice cover. The average MAR for all samples was 1.78 ± 1.82 (n=93). Maximum values of 9.02 and 8.96 were registered in 2020 and 2021, respectively. Overall, higher MAR values were observed in years with extended water-column mixing, e.g., in 2016, 2020 and 2021.
TOC concentrations, reflecting deposition of organic matter, averaged 17.02 ± 5.79 %. The highest concentrations commonly occurred near the end of summer stratification and during fall turnover. With the onset of ice cover, concentrations usually decreased, and lowest values occurred shortly after spring mixing. Deposition of carbonates, represented by TIC, averaged 4.63 ± 2.18 %. In most years, TIC concentrations followed the pattern of MAR changes and formed a distinct peak shortly after the ice out, reaching up to 9.80 %, whereas the lowest values, oscillating around 2.50 %, were observed in the winter.
The whole dataset from the period 2012–2021 contains monthly observations of water-column characteristics (water temperature, dissolved oxygen concentrations, pH, specific conductance, and Chlorophyll a concentrations), water chemistry (Ca2+, Mg2+, Na+, K+, , Cl−, TP, TN), and sediment fluxes and their composition (MAR, TC, TOC, TIC, TN, TS). The dataset is available from the Bridge of Knowledge – Open Research Data Catalog: https://doi.org/10.34808/w8w7-9x34 (Tylmann et al., 2023). Long-term daily meteorological data from the meteorological stations in Kętrzyn (approx. 40 km west of the lake; ID 12185) and Mikołajki (approx. 50 km southwest of the lake; ID 12280) are publicly available from the Institute of Meteorology and Water Management – National Research Institute (https://danepubliczne.imgw.pl/, last access: 15 March 2023). However, because of the complicated manual data access procedure, we suggest using the provided application programming interface (API), for example using R “climate” package (Czernecki et al., 2020) and provided station IDs.
We obtained a decade-long, high-temporal-resolution, multi-variable dataset from a typical eutrophic temperate lake system. Combined with available meteorological data, the dataset can be used to model physical and biogeochemical processes in lakes. By incorporating long-term monitoring data into models, we can improve our ability to make accurate predictions about future lake dynamics. This is particularly important because of ongoing climate change and human impacts on lake ecosystems. Lake Żabińskie is an interesting aquatic ecosystem for studying the impact of increasing air temperature and decreasing seasonality (mild winters) on the mixing regime. This, in turn, has a huge impact on the oxygen conditions in the lake, along with changes in nutrient cycling, and serious ecological consequences, e.g., massive blooms of harmful cyanobacteria species. Modeling these processes based on data from Lake Żabińskie may have applications for study of other small and deep lakes in the European lowlands. Part of this dataset has already been used to investigate the links between meteorological and limnological conditions and their influence on biochemical varve formation in Lake Żabińskie, showing great potential for reconstructing paleoenvironmental conditions. However, there are remain questions related to preservation of sub-seasonal meteorological events in the sediment records and how they can be related to climate shifts over longer timescales. This unique dataset will be valuable for comparison with data from other lake systems where investigators have collected high-temporal-resolution water-column and sedimentation data to evaluate how reliably lake deposits record characteristics and processes in the overlying waters.
WT prepared the article with contributions from AB, AS, and MŻ. All coauthors were involved in data collecting during field campaigns and laboratory work. MŻ was responsible for raw data processing for the needs of this paper.
The contact author has declared that none of the authors has any competing interests.
Publisher's note: Copernicus Publications remains neutral with regard to jurisdictional claims made in the text, published maps, institutional affiliations, or any other geographical representation in this paper. While Copernicus Publications makes every effort to include appropriate place names, the final responsibility lies with the authors.
We thank our colleagues (Benjamin Amann, Iwona Bubak, Christoph Butz, Artur Cysewski, Martin Grosjean, Iván Hernández-Almeida, Łukasz Pietruszyński, Tobias Schneider, Giulia Wienhues, and Paul Zander) for sharing ideas and for help with field and laboratory work.
This research has been supported by the Narodowe Centrum Nauki (grant no. 2015/18/E/ST10/00325) and by project CLIMPOL (grant no. PSPB-086/2010) funded by the Polish-Swiss Research Programme.
This paper was edited by Yuanzhi Yao and reviewed by Pierre Francus, Mark Brenner, and one anonymous referee.
Bonk, A., Tylmann, W., Amann, B., Enters, D., and Grosjean, M.: Modern limnology and varve-formation processes in lake Żabińskie, northeastern Poland: Comprehensive process studies as a key to understand the sediment record, J. Limnol., 74, 358–370, https://doi.org/10.4081/jlimnol.2014.1117, 2015.
Bonk, A., Kinder, M., Enters, D., Grosjean, M., Meyer-Jacob, C., and Tylmann, W.: Sedimentological and geochemical responses of Lake Żabińskie (north-eastern Poland) to erosion changes during the last millennium, J. Paleolimnol., 56, 239–252, https://doi.org/10.1007/s10933-016-9910-6, 2016.
Brauer, A., Schwab, M. J., Brademann, B., Pinkerneil, S., and Theuerkauf, M.: Tiefer See – a key site for lake sediment research in NE Germany, DEUQUA Spec. Pub., 2, 89–93, https://doi.org/10.5194/deuquasp-2-89-2019, 2019.
Broadman, E., Thurston, L. L., Schiefer, E., McKay, N. P., Fortin, D., Geck, J., Loso, M. G., Nolan, M., Arcusa, S. H., Benson, C. W., Ellerbroek, R. A., Erb, M. P., Routson, C. C., Wiman, C., Wong, A. J., and Kaufman, D. S.: An Arctic watershed observatory at Lake Peters, Alaska: weather–glacier–river–lake system data for 2015–2018, Earth Syst. Sci. Data, 11, 1957–1970, https://doi.org/10.5194/essd-11-1957-2019, 2019.
Butz, C., Grosjean, M., Fischer, D., Wunderle, S., Tylmann, W., and Rein, B.: Hyperspectral imaging spectroscopy: a promising method for the biogeochemical analysis of lake sediments, J. Appl. Remote Sens., 9, 096031, https://doi.org/10.1117/1.jrs.9.096031, 2015.
Choiński, A.: Limnologia fizyczna Polski, Wydawnictwo Naukowe UAM, Poznań, 548 pp., 2007.
Croudace, I. W., Löwemark, L., Tjallingii, R., and Zolitschka, B.: High resolution XRF core scanners: A key tool for the environmental and palaeoclimate sciences, Quatern. Int., 514, 1–4, https://doi.org/10.1016/j.quaint.2019.05.038, 2019.
Czernecki, B., Głogowski, A., and Nowosad, J.: Climate: An R Package to Access Free In-Situ Meteorological and Hydrological Datasets for Environmental Assessment, Sustainability, 12, 394, https://doi.org/10.3390/su12010394, 2020.
Forest Data Bank: http://bdl.lasy.gov.pl (last access: 15 March 2023), 2014–2023.
Heinrich, I., Balanzategui, D., Bens, O., Blasch, G., Blume, T., Böttcher, F., Borg, E., Brademann, B., Brauer, A., Conrad, C., Dietze, E., Dräger, N., Fiener, P., Gerke, H. H., Güntner, A., Heine, I., Helle, G., Herbrich, M., Harfenmeister, K., Heußner, K.-U., Hohmann, C., Itzerott, S., Jurasinski, G., Kaiser, K., Kappler, C., Koebsch, F., Liebner, S., Lischeid, G., Merz, B., Missling, K. D., Morgner, M., Pinkerneil, S., Plessen, B., Raab, T., Ruhtz, T., Sachs, T., Sommer, M., Spengler, D., Stender, V., Stüve, P., and Wilken, F.: Interdisciplinary Geo-ecological Research across Time Scales in the Northeast German Lowland Observatory (TERENO-NE), Vadose Zone J., 17, 180116, https://doi.org/10.2136/vzj2018.06.0116, 2018.
Hernández-Almeida, I., Grosjean, M., Gómez-Navarro, J. J., Larocque-Tobler, I., Bonk, A., Enters, D., Ustrzycka, A., Piotrowska, N., Przybylak, R., Wacnik, A., Witak, M., and Tylmann, W.: Resilience, rapid transitions and regime shifts: Fingerprinting the responses of Lake Żabińskie (NE Poland) to climate variability and human disturbance since AD 1000, Holocene, 27, 258–270, https://doi.org/10.1177/0959683616658529, 2017.
Hutorowicz, H., Grabowska, K., and Nowicka, A.: Charakterystyka warunków klimatycznych Pojezierza Mazurskiego, Zesz. Probl. Post. Nauk Roln., 431, 21–29, 1996.
Maier, D. B., Gälman, V., Renberg, I., and Bigler, C.: Using a decadal diatom sediment trap record to unravel seasonal processes important for the formation of the sedimentary diatom signal, J. Paleolimnol., 60, 133–152, https://doi.org/10.1007/s10933-018-0020-5, 2018.
Marszelewski, W. and Skowron, R.: Ice cover as an indicator of winter air temperature changes: Case study of the Polish Lowland lakes, Hydrol. Sci. J., 51, 336–349, https://doi.org/10.1623/hysj.51.2.336, 2006.
Państwowy Instytut Geologiczny: Mapa Geośrodowiskowa Polski 1:50 000, Arkusz Giżycko, 2012, Państwowy Instytut Geologiczny, Warszawa, 2012.
Piccolroaz, S., Healey, N. C., Lenters, J. D., Schladow, S. G., Hook, S. J., Sahoo, G. B., and Toffolon, M.: On the predictability of lake surface temperature using air temperature in a changing climate: A case study for Lake Tahoe (U. S. A.), Limnol. Oceanogr., 63, 243–261, https://doi.org/10.1002/lno.10626, 2018.
Szumański, A.: Objaśnienia do Szczegółowej Mapy Geologicznej Polski, Arkusz Giżycko (104), Państwowy Insytytu Geologiczny, Warszwa, 33 pp., 2000.
Tomczyk, A. M. and Bednorz, E.: Atlas klimatu Polski (1991–2020), Bogucki Wydawnictwo Naukowe, Poznań, 2022.
Tylmann, W., Zolitschka, B., Enters, D., and Ohlendorf, C.: Laminated lake sediments in northeast Poland: Distribution, preconditions for formation and potential for paleoenvironmental investigation, J. Paleolimnol., 50, 487–503, https://doi.org/10.1007/s10933-013-9741-7, 2013.
Tylmann, W., Bonk, A., Borowiak, D., Głowacka, P., Nowiński, K., Piłczyńska, J., Szczerba, A., and Żarczyński, M.: Multi-parameter dataset on limnological variables and modern sedimentation at Lake Żabińskie, northeast Poland, 2012–2021, Gdańsk University of Technology [data set], https://doi.org/10.34808/w8w7-9x34, 2023.
Wacnik, A., Tylmann, W., Bonk, A., Goslar, T., Enters, D., Meyer-Jacob, C., and Grosjean, M.: Determining the responses of vegetation to natural processes and human impacts in north-eastern Poland during the last millennium: combined pollen, geochemical and historical data, Veg. Hist. Archaeobot., 25, 479–498, https://doi.org/10.1007/s00334-016-0565-z, 2016.
Witak, M., Hernández-Almeida, I., Grosjean, M., and Tylmann, W.: Diatom-based reconstruction of trophic status changes recorded in varved sediments of Lake Żabińskie (northeastern Poland), AD 1888–2010, Oceanol. Hydrobiol. St., 46, 1–17, https://doi.org/10.1515/ohs-2017-0001, 2017.
Zander, P. D., Żarczyński, M., Vogel, H., Tylmann, W., Wacnik, A., Sanchini, A., and Grosjean, M.: A high-resolution record of Holocene primary productivity and water-column mixing from the varved sediments of Lake Żabińskie, Poland, Sci. Total Environ., 755, 143713, https://doi.org/10.1016/j.scitotenv.2020.143713, 2021.
Żarczyński, M., Wacnik, A., and Tylmann, W.: Tracing lake mixing and oxygenation regime using the Fe/Mn ratio in varved sediments: 2000 year-long record of human-induced changes from Lake Żabińskie (NE Poland), Sci. Total Environ., 657, 585–596, https://doi.org/10.1016/j.scitotenv.2018.12.078, 2019.
Żarczyński, M., Zander, P. D., Grosjean, M., and Tylmann, W.: Linking the formation of varves in a eutrophic temperate lake to meteorological conditions and water column dynamics, Sci. Total Environ., 842, 156787, https://doi.org/10.1016/j.scitotenv.2022.156787, 2022.
Zolitschka, B., Francus, P., Ojala, A. E. K., and Schimmelmann, A.: Varves in lake sediments – a review, Quaternary Sci. Rev., 117, 1–41, https://doi.org/10.1016/j.quascirev.2015.03.019, 2015.