the Creative Commons Attribution 4.0 License.
the Creative Commons Attribution 4.0 License.
 | 06 Oct 2023
A global streamflow indices time series dataset for large-sample hydrological analyses on streamflow regime (until 2022)
Xinyu Chen
Yuning Luo
Junguo Liu
With the booming big data techniques, large-sample hydrological analysis on streamflow regime is becoming feasible, which could derive robust conclusions on hydrological processes from a big-picture perspective. However, there is a lack of a comprehensive global large-sample dataset for components of the streamflow regime yet. This paper presents a new time series dataset on global streamflow indices calculated from daily streamflow records after data quality control. The dataset contains 79 indices over seven major components of streamflow regime (i.e., magnitude, frequency, duration, changing rate, timing, variability, and recession) of 41 263 river reaches globally on yearly and multiyear scales. Streamflow indices values until 2022 are covered in the dataset. Time span of the time series dataset is from 1806 to 2022 with an average length of 36 years. Compared to existing global datasets, this global dataset covers more stations and more indices, especially those characterizing the frequency, duration, changing rate, and recession of streamflow regime. With the dataset, research on streamflow regime will become easier without spending time handling raw streamflow records. This comprehensive dataset will be a valuable resource to the hydrology community to facilitate a wide range of studies, such as studies of hydrological behaviour of a catchment, streamflow regime prediction in data-scarce regions, as well as variations in streamflow regime from a global perspective. The dataset can be accessed at https://doi.org/10.57760/sciencedb.07227 (Chen et al., 2023a).
- Article
(4667 KB) - Full-text XML
- BibTeX
- EndNote


Streamflow regime plays a vital role not only in human life and activities but also in native biodiversity, ecosystem integrity, and biogeochemical cycles (Poff et al., 1997; Paine, 2019; Palmer and Ruhi, 2019). Because of the effects of anthropogenic activities and climate change especially in the last decades, streamflow regimes of many rivers worldwide have been changing, threatening the water security (Torabi Haghighi et al., 2021; Tonkin et al., 2018; Chen et al., 2023b, 2021). Numerous studies have been undertaken to reveal the streamflow regime shifts, their causes and consequences (Worku et al., 2014; Brouziyne et al., 2021; Sauquet et al., 2021; Lane and Kay, 2021; Yin et al., 2018). Palmer and Ruhi (2019) found that the dam construction, diversion or abstraction of water, clearing of land, and climate change increasingly degraded the river ecosystems by altering their streamflow regimes. Barichivich et al. (2018) indicated that the streamflow regime shifts over the Amazon basin in magnitude and frequency, which has caused major human suffering and disturbance to the rainforest ecosystems, are driven by strengthened Walker circulation.
In order to analyse the streamflow regime shifts, the critical components of the streamflow regime, i.e., magnitude, frequency, duration, timing, and rate of change, were proposed to characterize the entire range of streamflow regime and specific hydrologic phenomena (Poff and Ward, 1989; Poff et al., 1997; Richter et al., 1996). By using indices of these components, features of streamflow regime can be considered explicitly, and therefore indices of components have been widely used (Olden and Poff, 2003; Worku et al., 2014; Palmer and Ruhi, 2019; Shih et al., 2022; Jacobson et al., 2022; Harmon et al., 2022; Wasko et al., 2020). In the past decades, more and more indices and components have been proposed to represent different aspects of streamflow regime (Clausen and Biggs, 2000; Baker et al., 2004; Clark et al., 2009; Botter et al., 2013; Mcmillan et al., 2017; Gnann et al., 2021a). However, except for several basic indices of magnitude and frequency like the annual maximum streamflow (Do et al., 2017; Barichivich et al., 2018), there are few large-sample and global studies on other components such as timing, variability, and rate of change. Gudmundsson et al. (2018) found that there was no any study analysing time series of the variability (e.g., standard deviation, coefficient of variation, Gini coefficient, and the inter quartile range) and timing (e.g., the timing of annual minimum flow, day of minimum 7 d mean streamflow, and day of maximum 7 d mean streamflow) of daily streamflow on a global scale.
Large-sample hydrology is a way to go beyond individual case studies and to draw robust conclusions on hydrological processes from a big-picture perspective (Gupta et al., 2014; Addor et al., 2020). Currently, due to the increasing availability of large-sample hydrology datasets, as well as the booming big data techniques, more and more large-sample hydrological studies have been appearing, significantly advancing the hydrology science (Sun et al., 2021; Troin et al., 2022; Lane et al., 2022; Goeking and Tarboton, 2022; Nearing et al., 2021; Gnann et al., 2021a; Gudmundsson et al., 2021). To perform large-sample hydrological analysis, large-sample hydrological datasets based on gauged records are mostly needed. Addor et al. (2017) presented the CAMELS (Catchment Attributes and MEteorology for Large-sample Studies) dataset, which synthesized various datasets (including meteorological forcing and gauged daily streamflow time series) to describe attributes of catchments and catchment behaviours in the contiguous United States. Afterwards, diverse versions of CAMELS or CAMELS-like datasets were presented for different countries, such as the Great Britain (Coxon et al., 2020), Chile (Alvarez-Garreton et al., 2018), Brazil (Chagas et al., 2020), Australia (Fowler et al., 2021), Central Europe (Klingler et al., 2021), France (Delaigue et al., 2022), and Germany (Ebeling et al., 2022). Indices datasets of streamflow regime have also been developed on both the regional scale (like ADHI by Tramblay et al., 2021) and the global scale (like GSIM by Do et al., 2018, and Gudmundsson et al., 2018).
GSIM covers time series indices of more than 30 000 stations worldwide, which represents the water balance, the seasonal cycle, low flows, and floods, with the latest streamflow indices values until 2016. It is one of the most popular datasets which facilitate large-sample research on global streamflow. However, GSIM only includes the streamflow regime components that characterize the magnitude, timing, and variability without including components characterizing the frequency, duration, changing rate, and recession of streamflow regime. In fact, these components are very useful for fully characterizing the streamflow regime, understanding its functions, and analysing its variations. The frequency and duration of streamflow regime are crucial to studies on various flow events. Gehrke et al. (1995) discovered that in the Murray-Darling river system, the altered frequencies of high- and low-flow events have a significant impact on the species diversity of fish communities. Colls et al. (2019) examined the frequency and duration of zero flow events over 33 Mediterranean streams and found that longer duration of zero flow events significantly decreases gross primary production by promoting heterotrophy. Changing rate is an important factor affecting the lives of aquatic species. For example, rapid changes in the river stage caused by hydroelectric facilities will damage downstream aquatic species by wash-out and stranding (Cushman, 1985). In addition, the increase in the changing rate during storms will result in elevated concentrations of pollutants, which is harmful to the lives of aquatic species (Palmer and Ruhi, 2019). The recession of streamflow reflects the low-flow behaviour of a catchment and plays a vital role in both flow-biota-ecosystem processes nexus and water management. For instance, Rood et al. (1995) indicated that the accelerated flood recession had resulted in the failure of seedling establishment and the decline in riparian cottonwoods along the St. Mary River. The importance of analysing flood recession has also been emphasized to mitigate flood risks and optimize water utilization in the Huaihe River Basin (Cheng et al., 2021). In this regard, a more comprehensive indices dataset than GSIM is needed. Actually, Tramblay et al. (2021) presented the African Database of Hydrometric Indices (ADHI, 1950–2018) with a more comprehensive streamflow indices, but it is geographically limited to Africa. There is a lack of a comprehensive global large-sample dataset of components of streamflow regime, which hinders research on streamflow regime, especially on a global scale.
In this paper, we collected and merged daily streamflow records from 9 data sources into one collection, and then performed a data quality control on the collection. After that, a new global streamflow indices time series dataset was developed. The spatiotemporal coverage, quality, metadata, and sample values of the dataset are also shown in the following sections.
2.1 Data collection
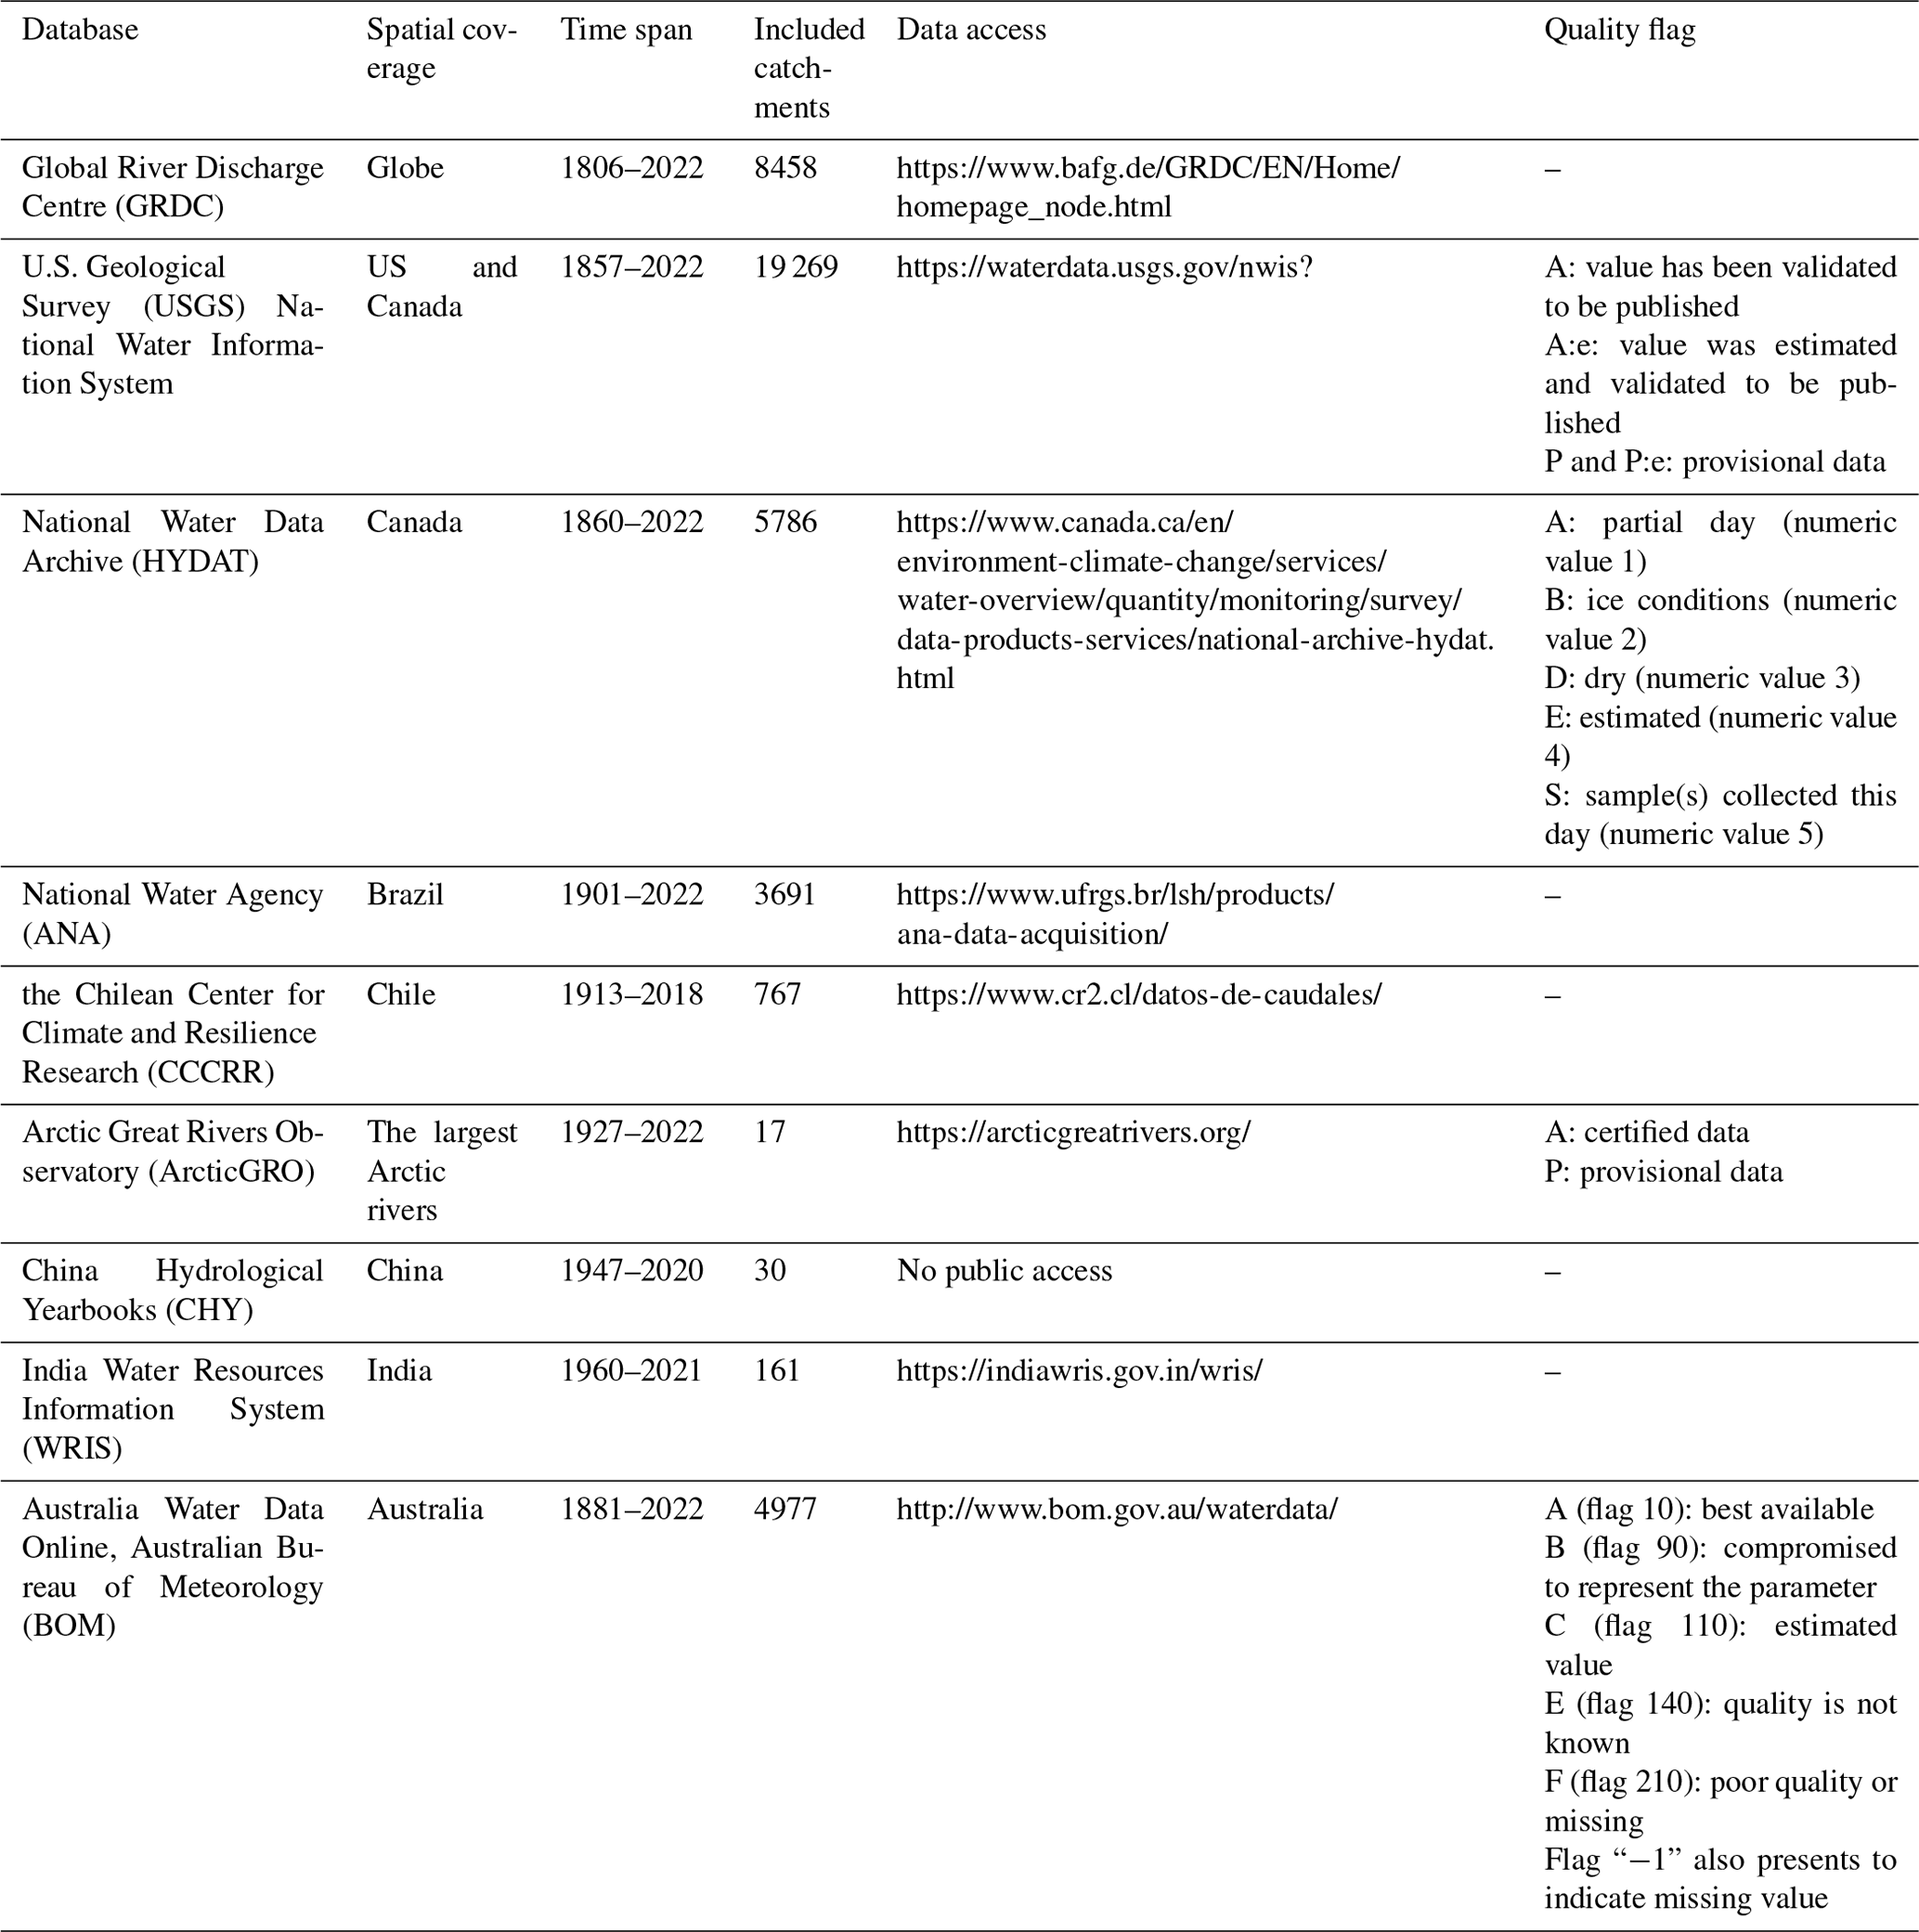
The daily streamflow records used for the establishment of a global streamflow indices time series dataset were collected from 9 data sources, i.e., Global River Discharge Centre (GRDC), U.S. Geological Survey (USGS) National Water Information System, National Water Data Archive of Canada (HYDAT), National Water Agency of Brazil (ANA), the Chilean Centre for Climate and Resilience Research (CCCRR), Arctic Great Rivers Observatory (ArcticGRO), China Hydrological Yearbooks (CHY), India Water Resources Information System (WRIS), and Australia Water Data from Australian Bureau of Meteorology (BOM) (see Table 1 for details). These data sources are all publicly available except the CHY. The original records of streamflow in CHY are restricted-access and hard to collect, and thus only streamflow data of some typical river basins were collected including 30 stations in the seven largest river basins in China. Among these data sources, USGS, HYDAT, ArcticGRO, and BOM provide quality flags of records.
GRDC and ArcticGRO are international datasets having multiple countries' records, and some records may overlap with records from other national datasets. The duplicated data can to some extent interfere with users' utilization of the data. We calculated the distances between each station in the international datasets and each station in the national datasets. When this distance was less than 60 m (approximately 0.0005∘ on the equator), these two stations were considered the potential identical station. After that, a further inspection was performed to verify whether these two stations were the same station according to the name of river and station. A total of 1895 duplicated stations were found including 8 stations in ArcticGRO, 321 stations in ANA, 324 stations in BOM, 68 stations in CCCRR, 2 stations in CHY, 439 stations in HYDAT, and 733 stations in USGS. We retained stations with longer record length and removed duplicate stations with shorter record length. A total of 41 263 stations were retained and then merged into a streamflow records collection.
Apart from the streamflow records, there are metadata of each station in every data source. However, the fields of metadata vary among different data sources. Some metadata have many fields while the others only have basic fields. For the purpose of standardization, fields of metadata of our collection include station ID, data source, river name, station number, country, latitude, longitude, contributing area, altitude, start year, end year, years, days, and missing ratio.
The Americas and Europe witness extensive streamflow records with high spatial coverage density and long record length (Fig. 1a). In contrast, there are relatively few records in Asia and Africa. Around 20 000 stations (50 %) have streamflow records with lengths more than 30 years (Fig. 1b), and more than 2000 stations' (5 %) record lengths are larger than 100 years. The stations with recording lengths of more than 100 years are mainly in North America and Europe. As for the availability of streamflow records in different years, the number of stations with available records increases from 1900 to 1978 at a peak of around 18 000, and then keeps fluctuating but relatively stable from 1979 to 2015, followed by a decrease from 2016 to 2022 at a bottom of 12 000 (Fig. 1c). Overall, the streamflow records collection has 41 263 stations with an average record length of 36 years. The time span of the collections is from 1806 to 2022.
Table 1Summary of nine measured streamflow data sources.
Last access: 30 September 2023
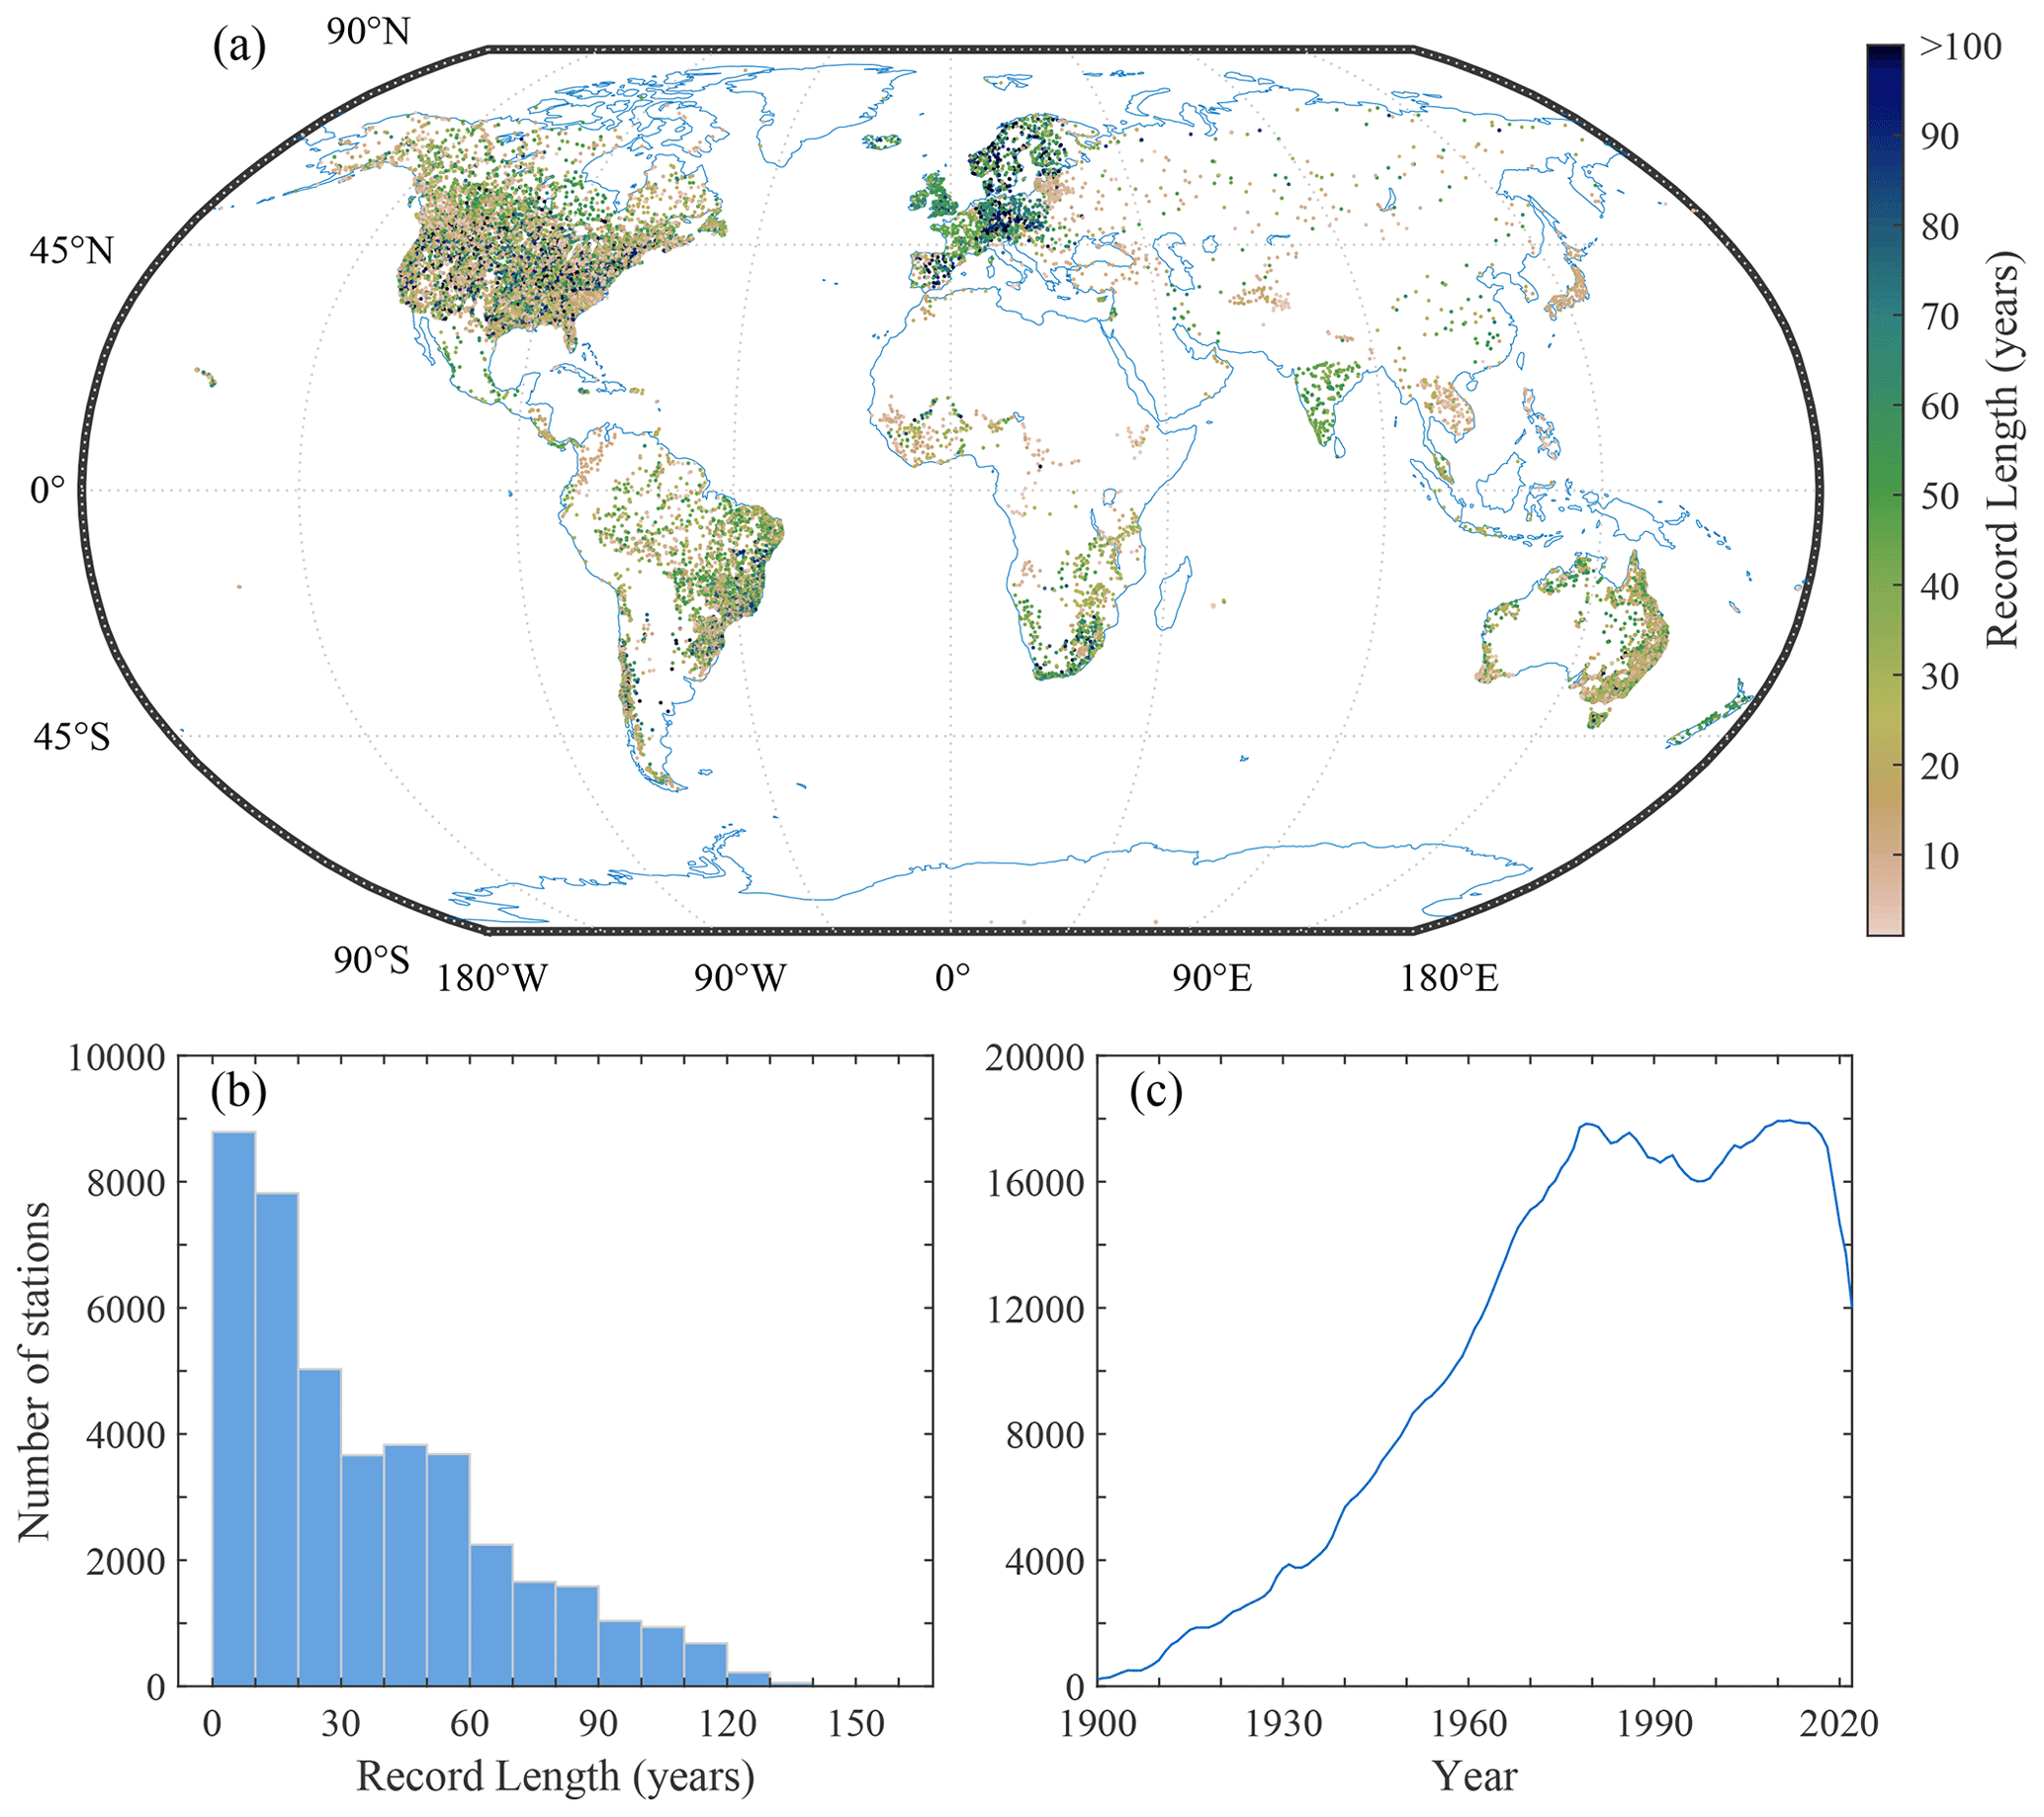
Figure 1A summary of the streamflow records collection. (a) shows the spatial distribution and record lengths of daily streamflow records. (b) illustrates number of stations with different record lengths. (c) shows number of stations with records for every year from 1900 to 2022. Refer to https://doi.org/10.57760/sciencedb.07227 (Chen et al., 2023a) for vector graphic that shows all the stations clearly without overlap since the vector graphic can be zoomed in infinitely without losing any detail.
2.2 Data quality
2.2.1 Quality flag of records
Data quality control is necessary before the use of data as poor-quality data are misleading. Some data providers have inspected the data before publication and attached data quality flags to the published data, while the others have not. Data quality flags represents data quality and thus are important to quality control. The flags vary among different data providers (Table 1). For the purpose of standardization, the original flags were translated into four flags in our streamflow records collection, i.e., reliable, suspect, no flag, and missing (see Table 2 for the rules). As for the databases without quality flags, available records were flagged as no flag while missing records were flagged as missing. For records with poor-quality flag or no flag, some studies, like Gudmundsson et al. (2018), performed automatic detection methods to identify and remove unreasonable streamflow values, including consecutive equal values and outliers. However, the criteria for judging whether data is unreasonable primarily rely on subjective assumptions. To the best of our knowledge, the applicability and possible impacts of such criteria have not been assessed yet. It is still disputable whether and how many correct values are erroneously flagged as incorrect and removed (Crochemore et al., 2020; Tramblay et al., 2021). The mistakes will diminish the utility of the data. For example, some extreme flood events may be flagged as outliers and removed, resulting in an underestimation of flood. Therefore, we did not perform disputable automatic detection methods. A reliable automatic detection method was applied as follows.
Considering possible mistakes made by instruments and humans, negative daily streamflow values may occur in the streamflow records collection, which are undoubtedly wrong values. If a daily streamflow value is a negative number, this value will be removed and flagged as missing. In addition, if quality flags are initially absent in time series where there are negative values, the whole time series will be flagged as suspect. A total of 40 842 negative streamflow values were detected and removed.
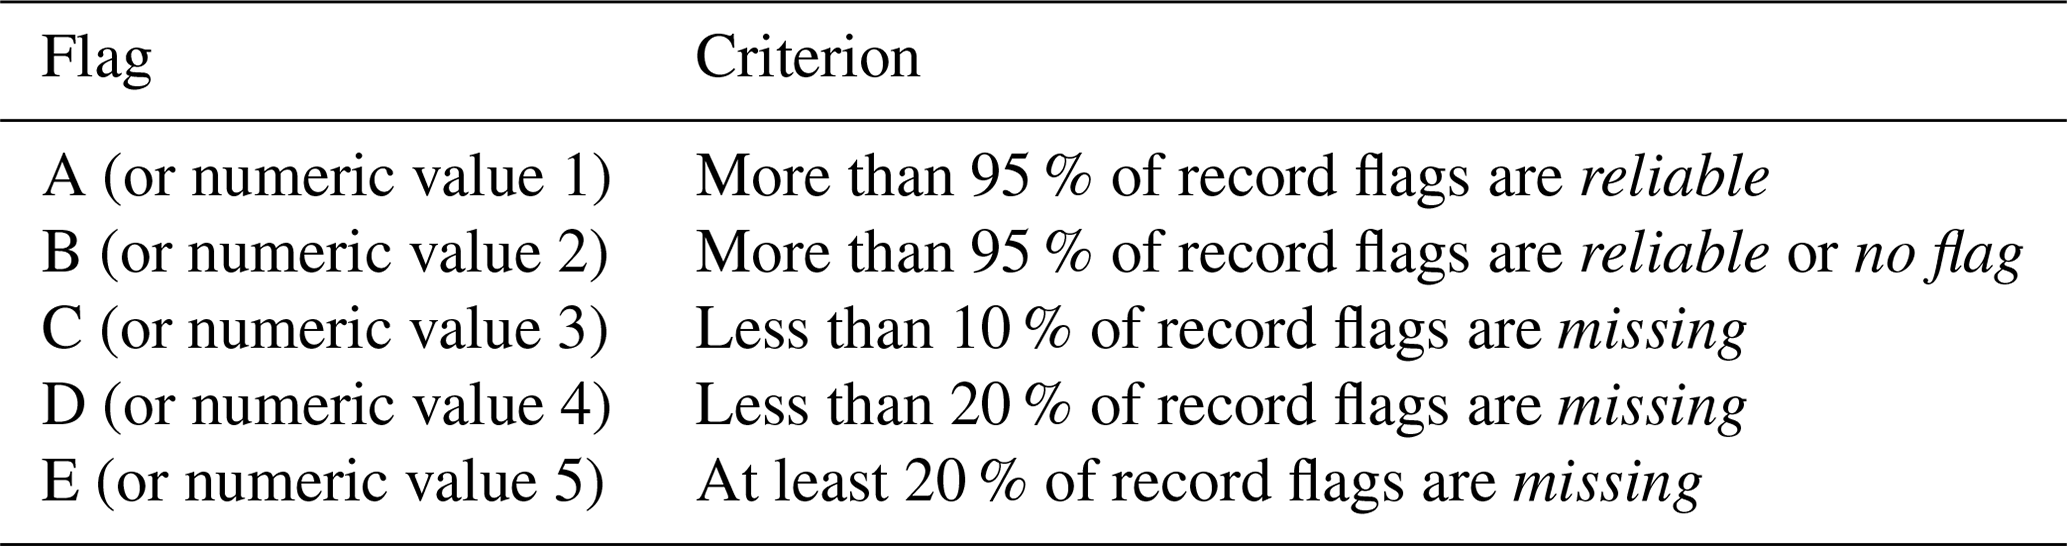
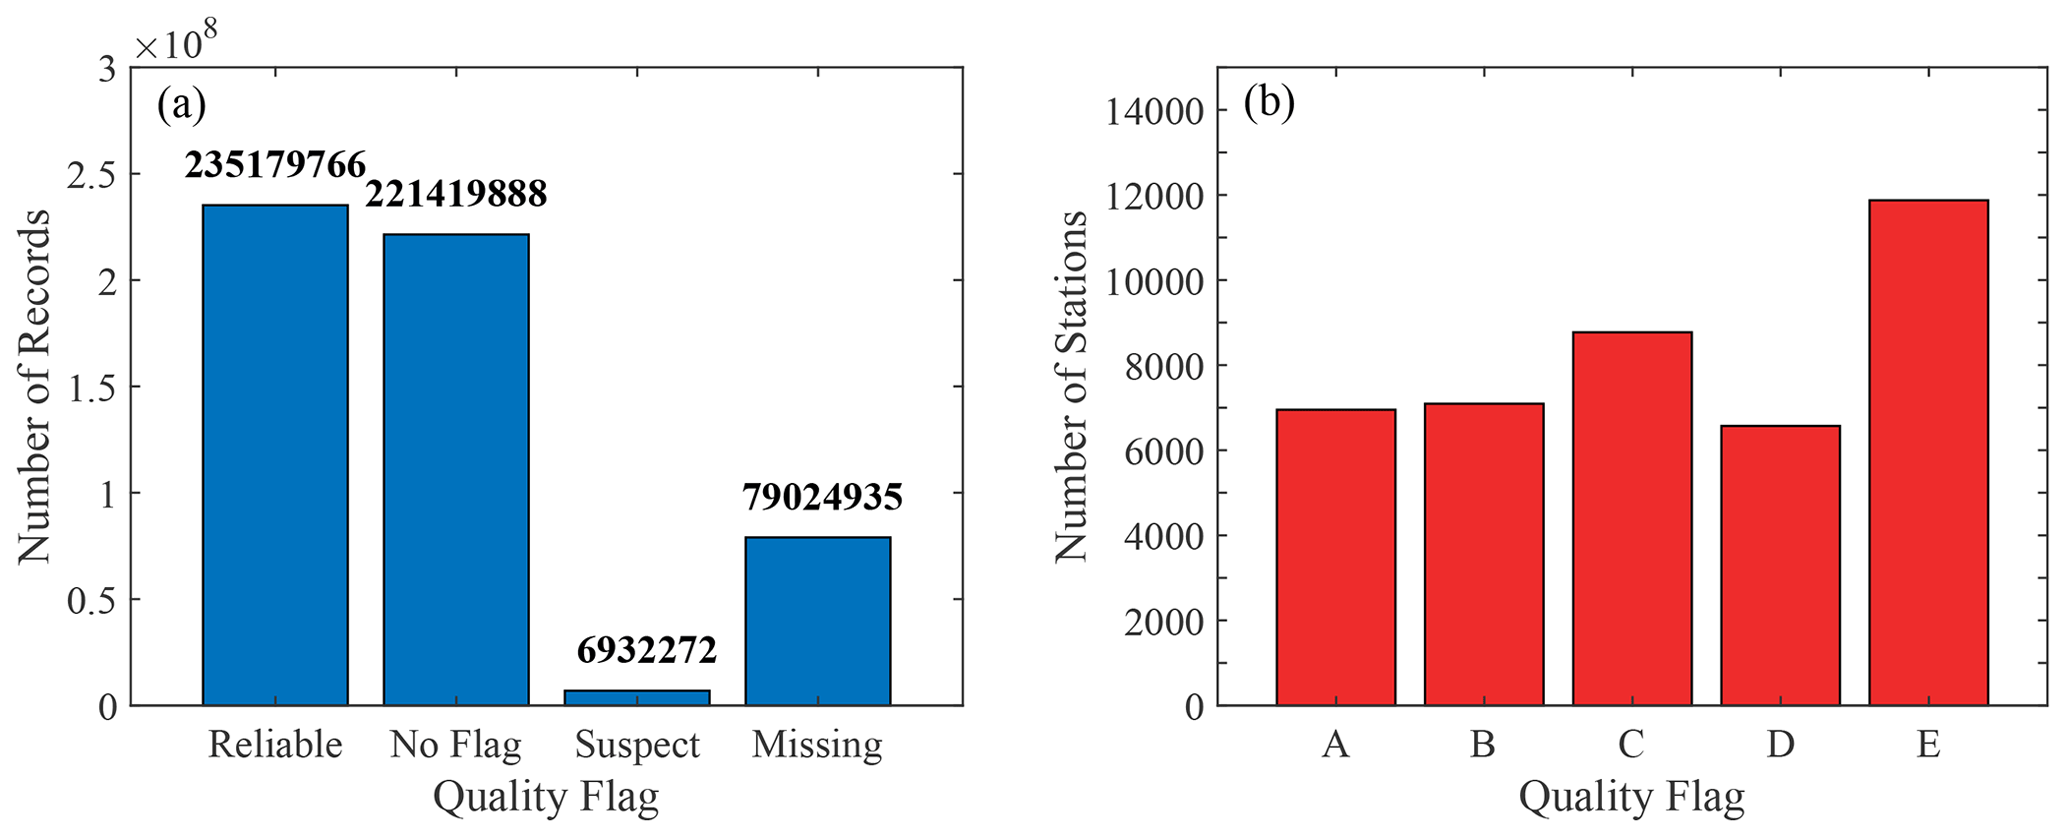
In addition to each record, quality flags were also attached to each station according to the criteria in Table 3. There are 235 million records (43 %) showing reliable, 221 million records (41 %) showing no flag, 6.9 million records (1 %) showing suspect, and 79 million records (15 %) showing missing (Fig. 2a). The numbers of stations with flags A, B, C, D, E are 6952 (17 %), 7094 (17 %), 8772 (21 %), 6571 (16 %), and 11 874 (29 %) respectively (Fig. 2b). Quality flags of records were used to assess the quality of indices that were calculated based on the records in the following text. Quality flags of stations were designed to allow users to pick appropriate stations whose records' quality meets users' quality control requirements.
Table 2Translation of quality control flags of the original databases to flags of the streamflow records collection.
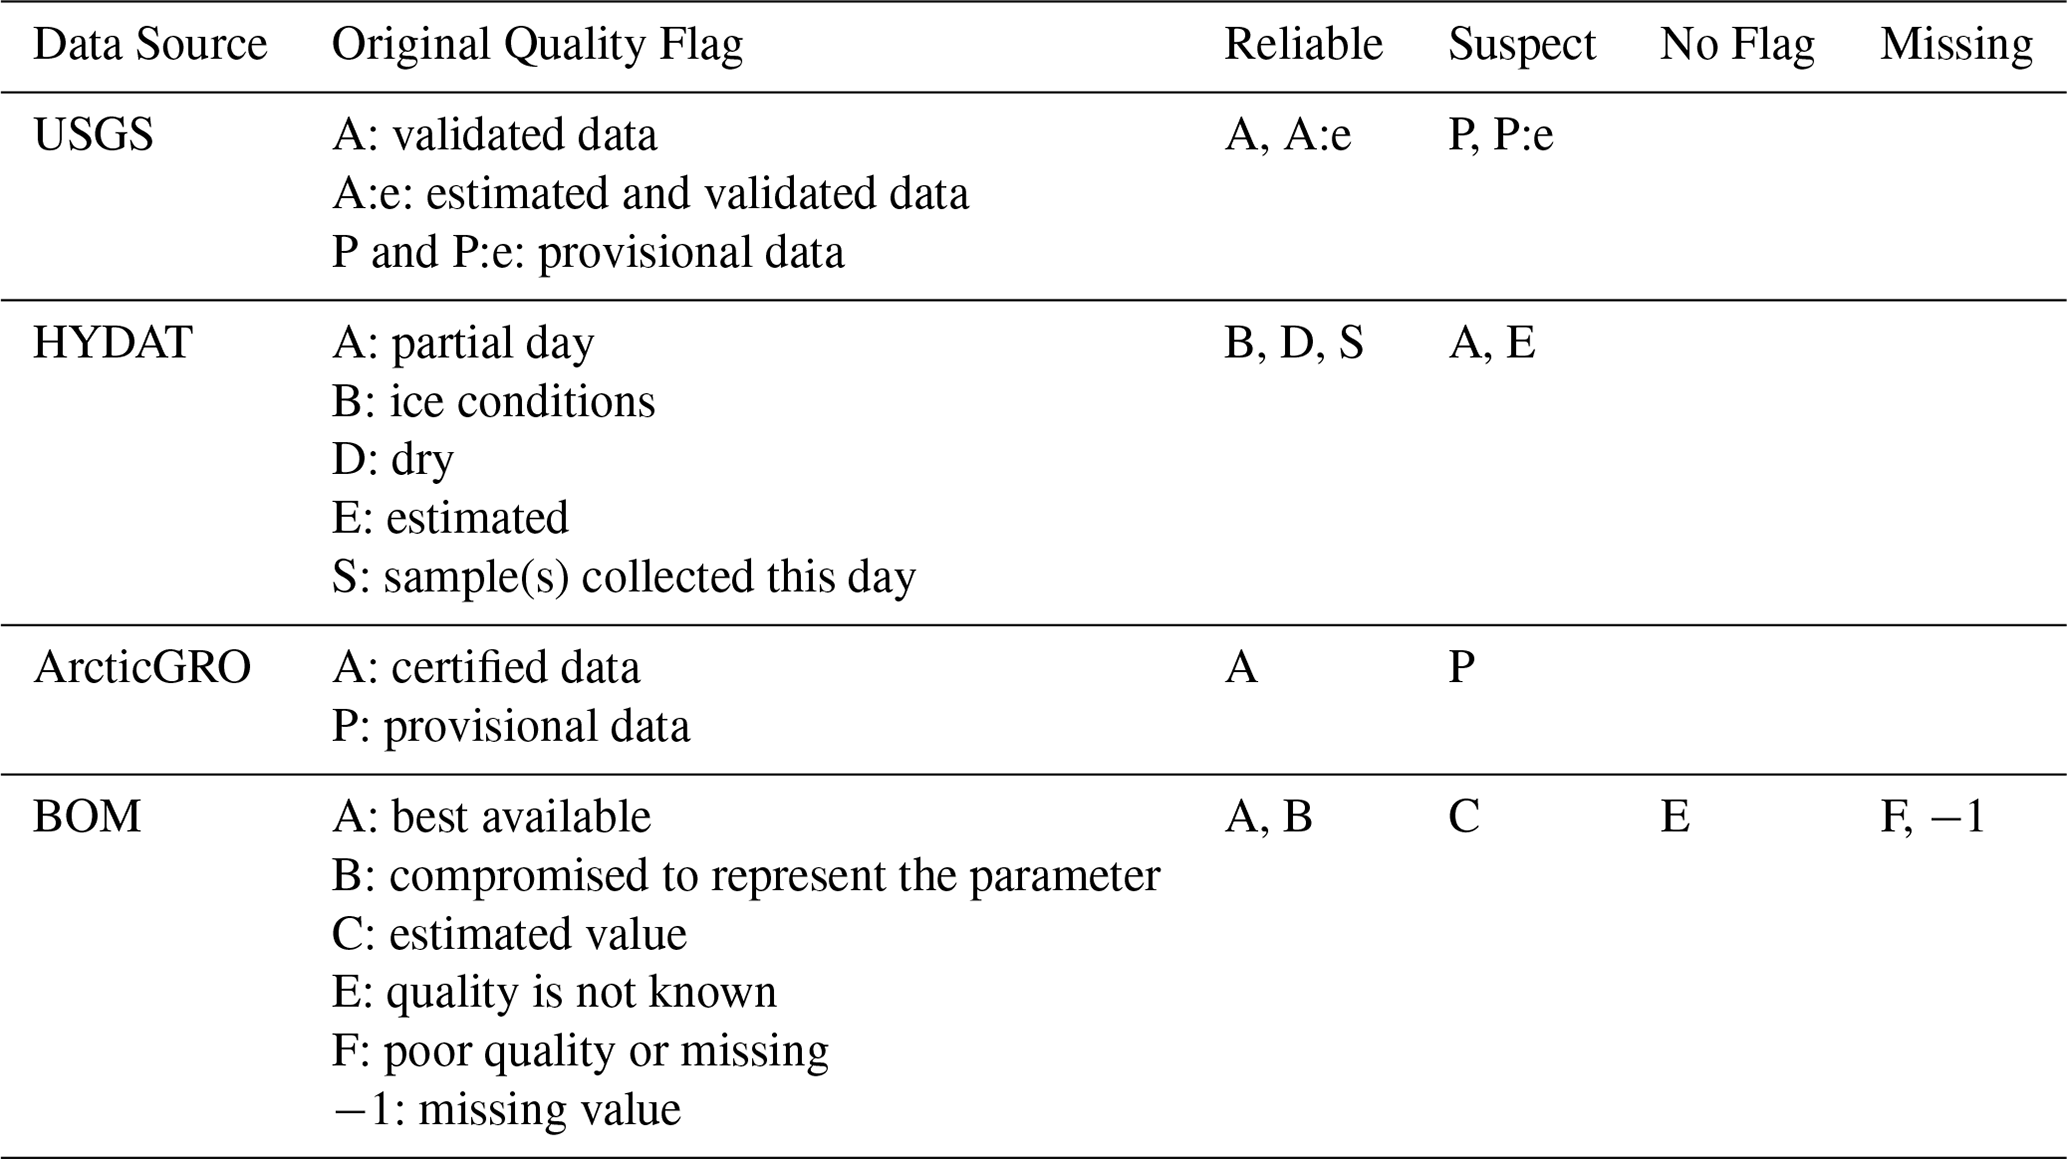
Table 3Criteria for quality control flags of stations. Note that when one station's records meet multiple criteria simultaneously, the highest-level flag is applied.
2.2.2 Temporal coverage and missing ratio
In the streamflow records collection, more than 6000 stations have a record length of 32 years from 1990 to 2022 with missing ratios less than 5 %, and around 800 stations have a record length of 102 years from 1920 to 2022 with missing ratios less than 5 % (Fig. 3a). As for the year of the latest record, the records of approximately 12 000 stations end in 2022, while the records of around 17 000 stations are absent after 2000 (Fig. 3b). Figure 3c shows the number of stations for every year from 1900 to 2022 with different missing ratios of records. All curves show similar trends. The number of stations gradually rises from 1900 to its peak in around 1978, and then keeps fluctuating but relatively stable from 1979 to 2013, followed by a decrease from 2014 to 2022. More than 80 % of stations with records have no missing records for every year from 1900 to 2022 (Fig. 3c). Furthermore, more than 50 % of stations have a record length of more than 30 years and have no missing records for every year from 1900 to 2022. There are around 15 000 stations having no missing records for every year from 1975 to 2018.
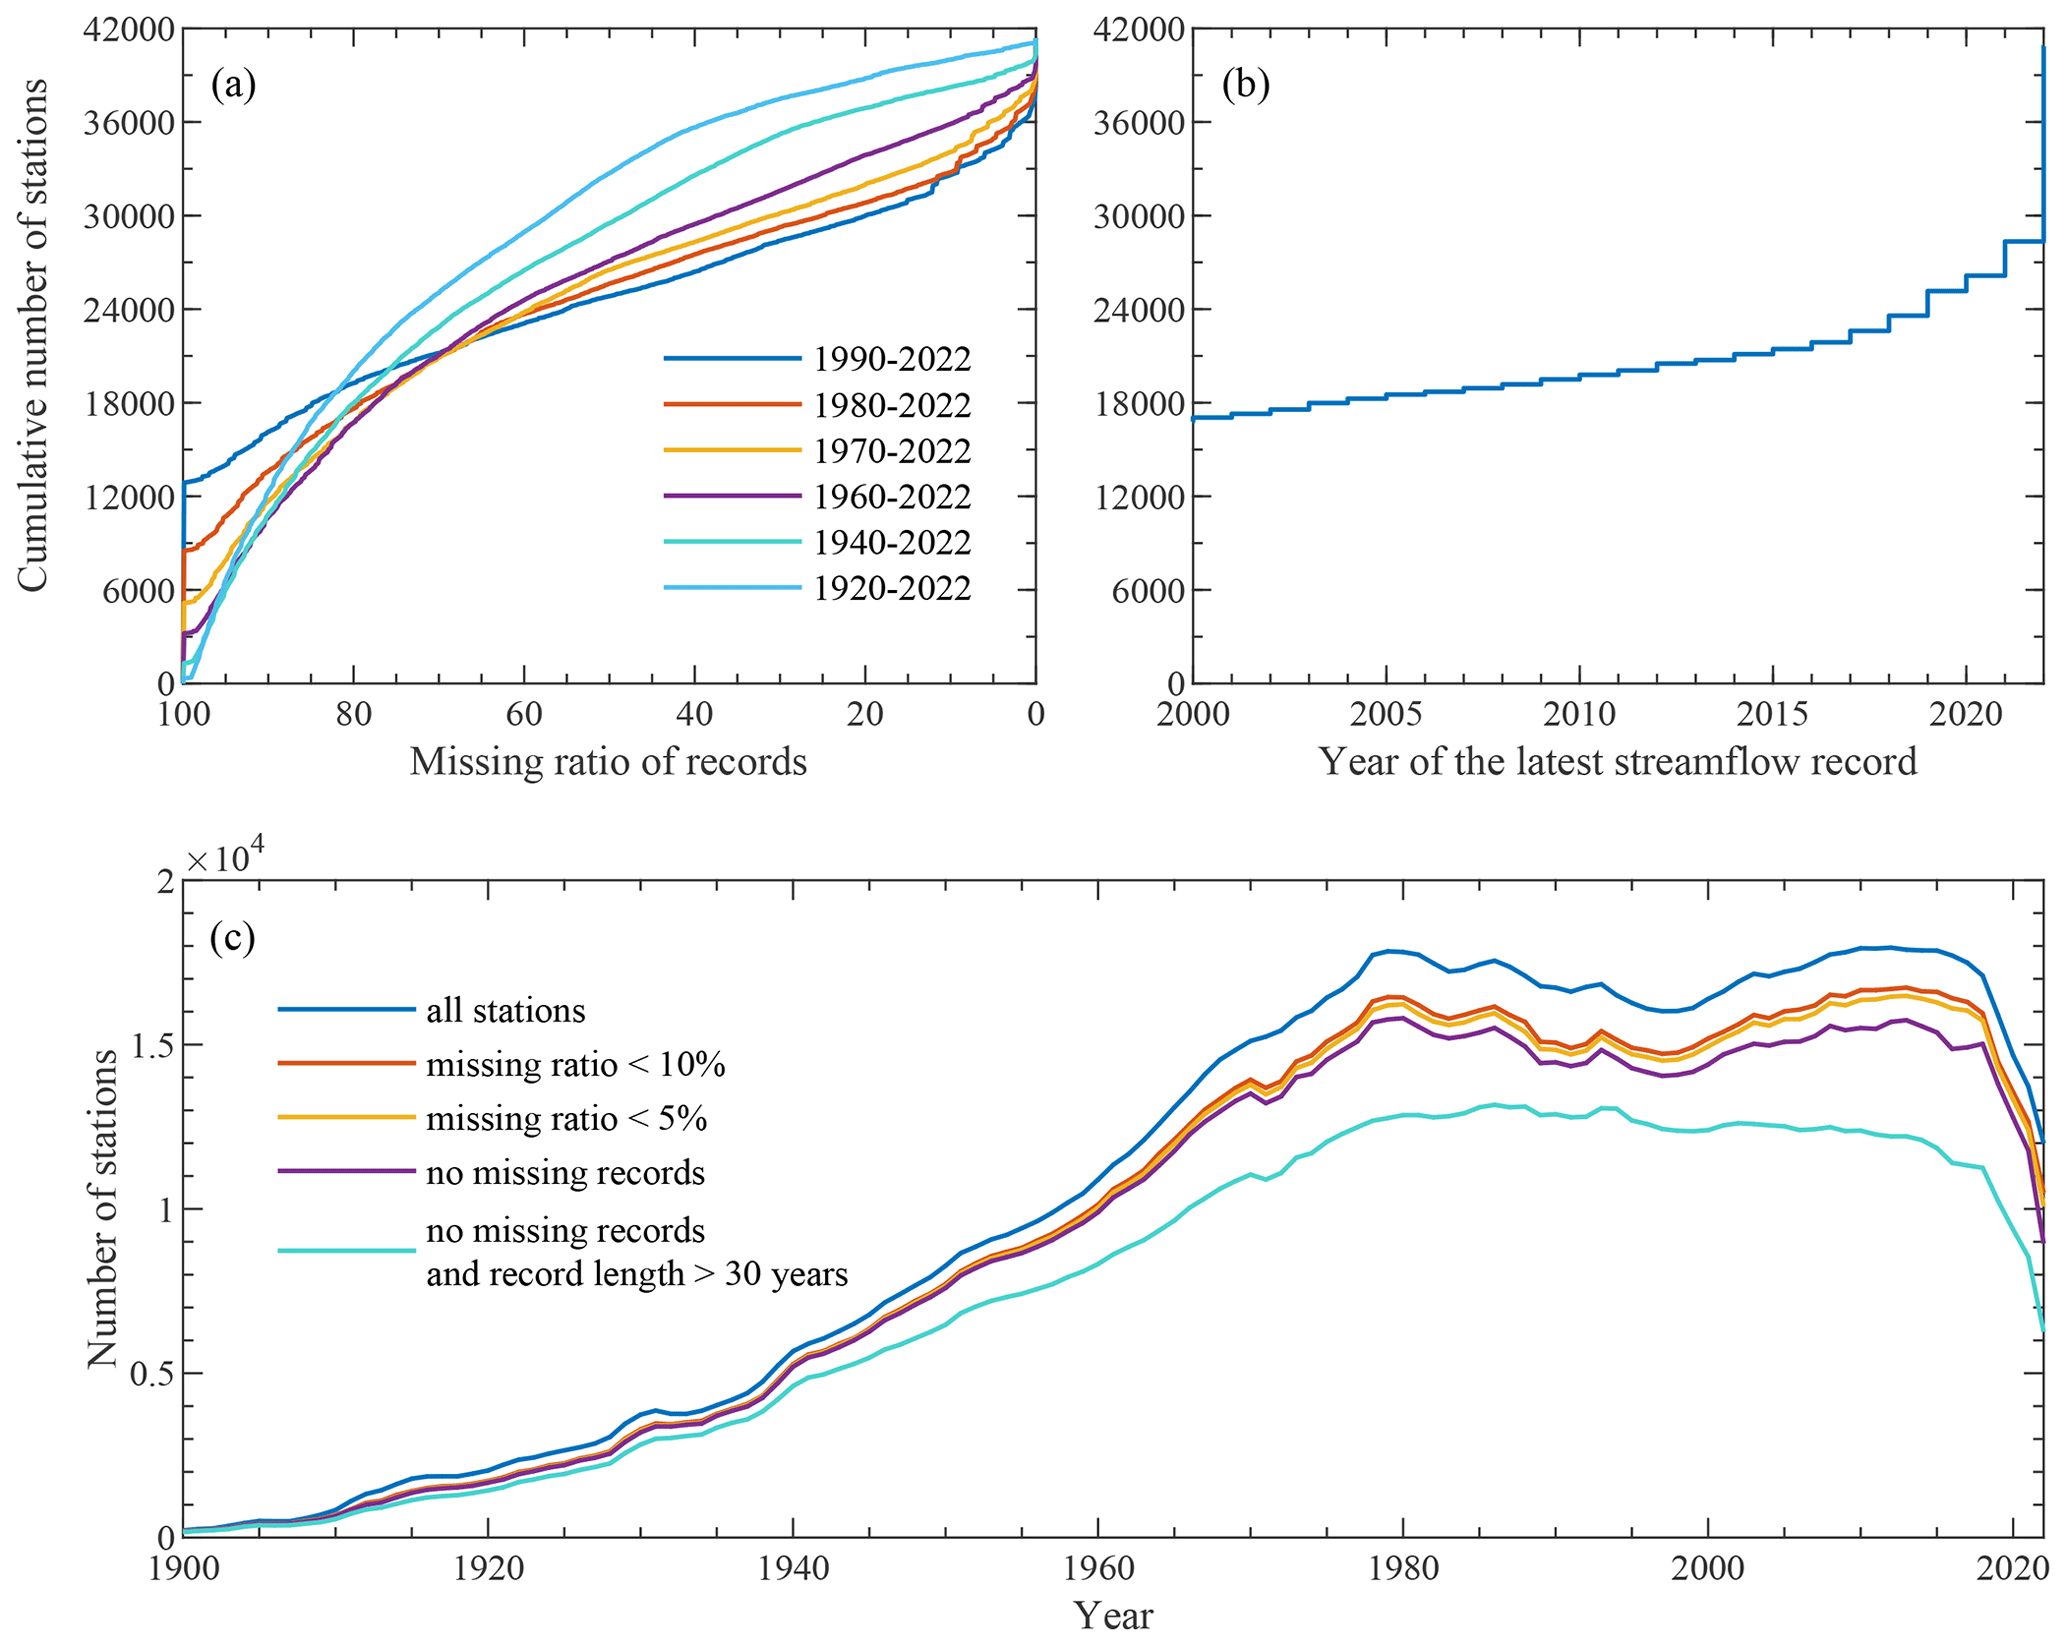
Figure 3Temporal coverage and missing ratio of streamflow records. (a) shows the cumulative number of stations corresponding to different missing ratios of records in different time spans. (b) shows the cumulative number of stations corresponding to different years of the latest streamflow record. (c) presents number of stations for every year from 1900 to 2022 with different missing ratios of records.
3.1 Indices definition and calculation
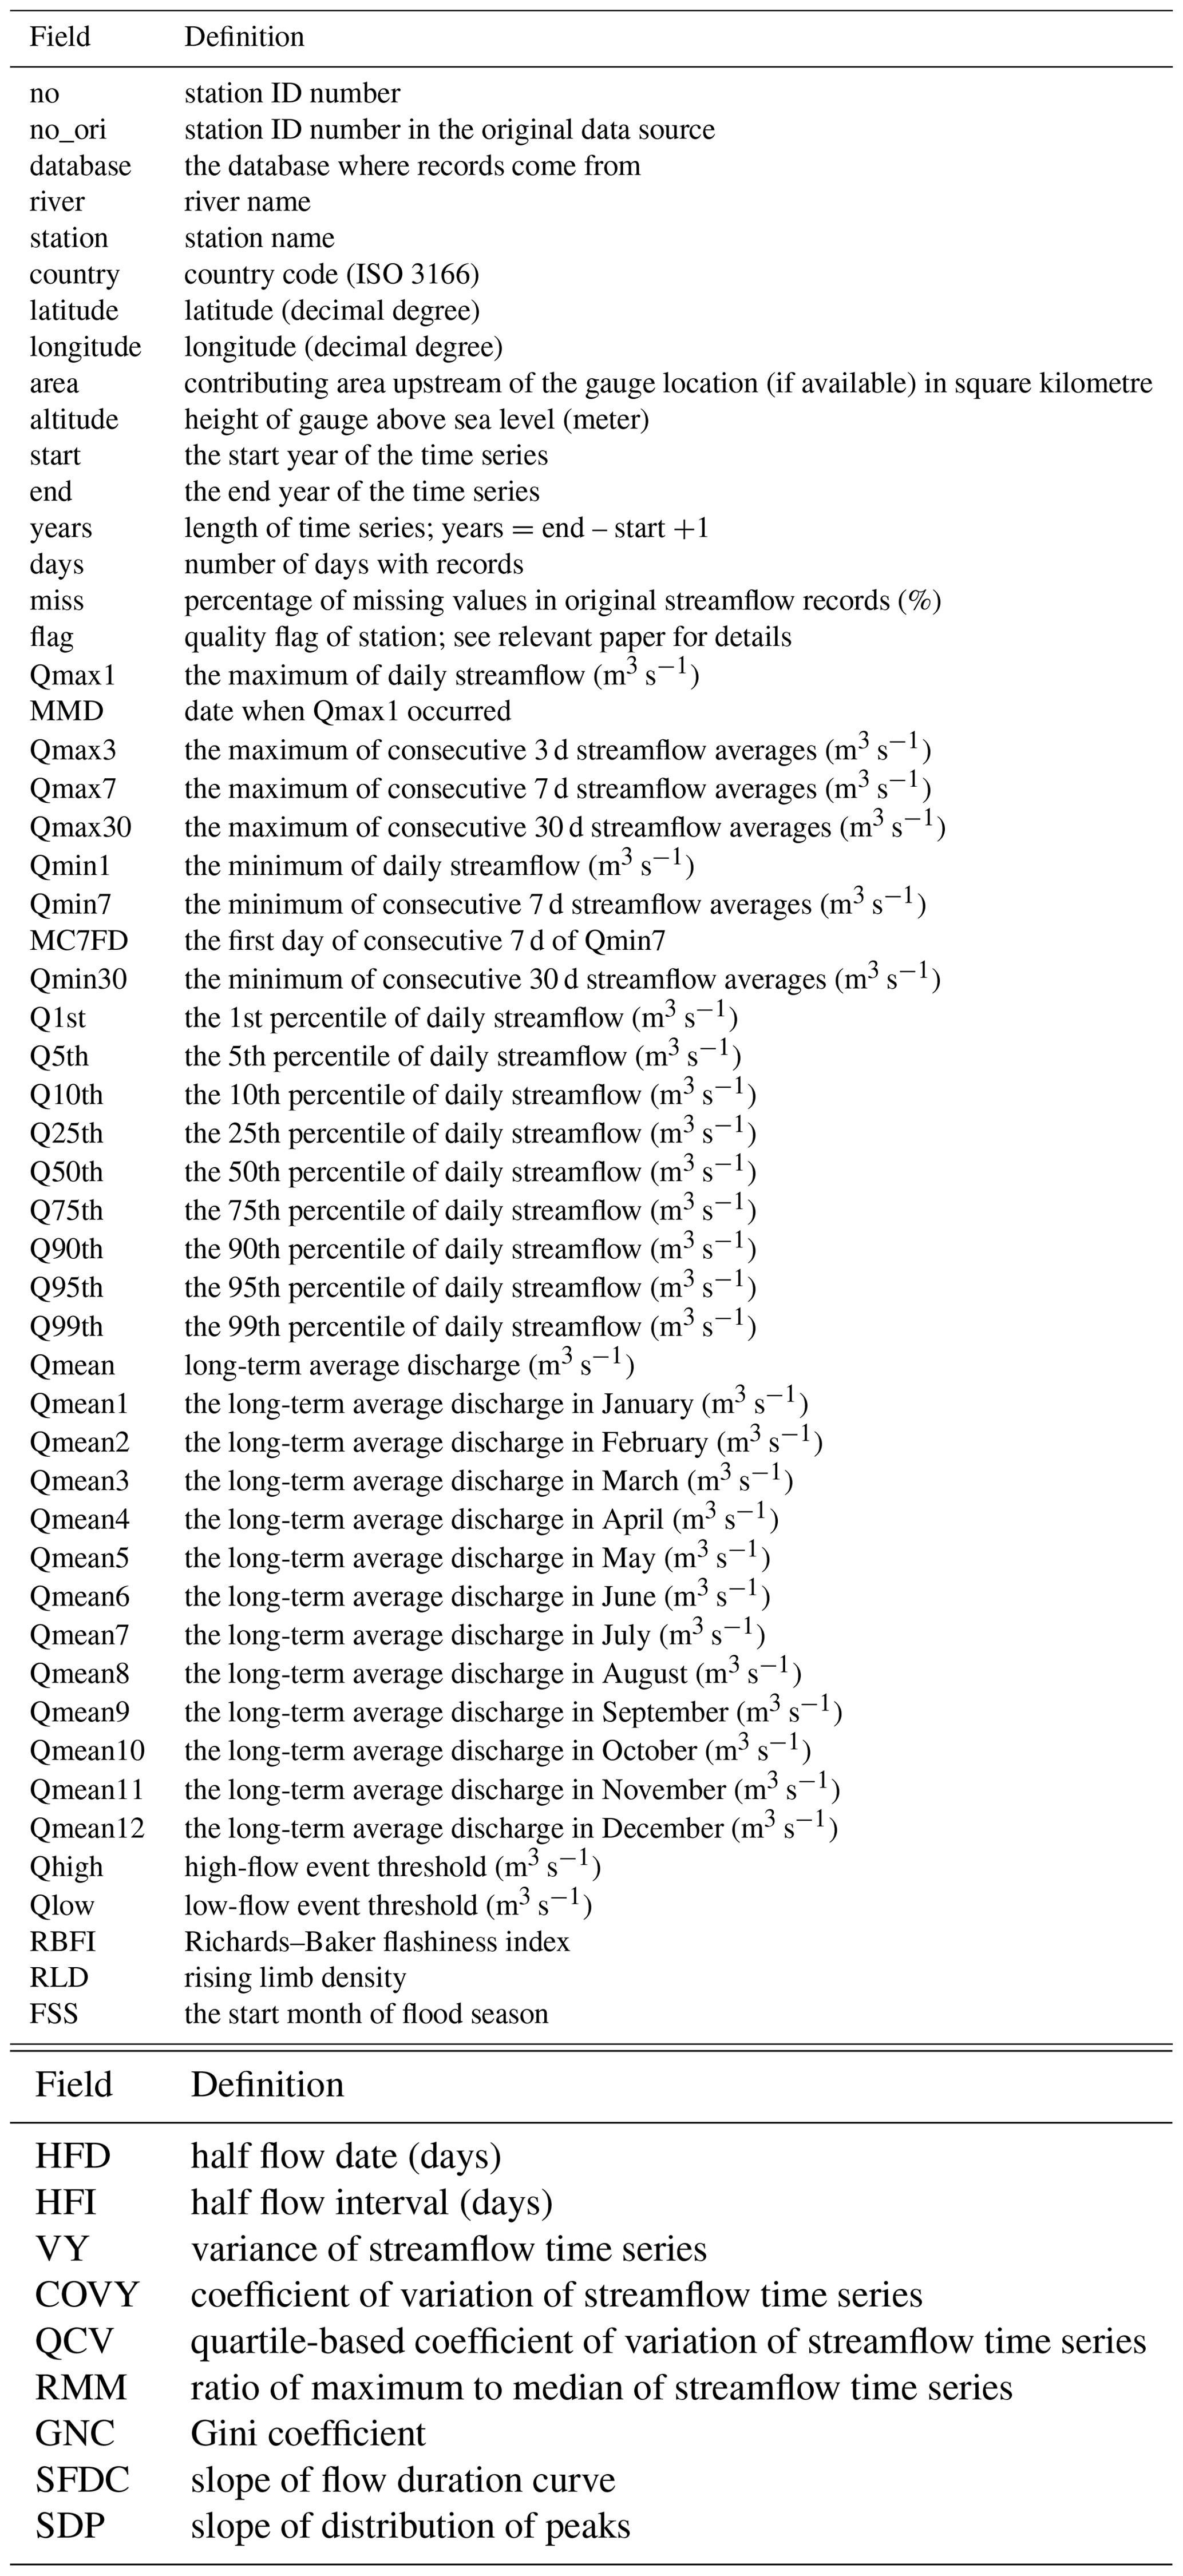
Table 4 describes 79 streamflow indices that characterize seven components of streamflow regime, i.e., magnitude, frequency, duration, changing rate, timing, variability, and recession on yearly and multi-year scales. These indices were calculated based on the streamflow records collection, and most of them were computed with the Toolbox for Streamflow Signatures in Hydrology (TOSSH, available at the address: https://github.com/TOSSHtoolbox/TOSSH, last access: 30 September 2023) (Gnann et al., 2021b).
The magnitude of streamflow regime reflects the amount of streamflow from various perspectives. Corresponding indices include: (i) maximums of consecutive 1, 3, 7, and 30 d streamflow averages and their percentages, which indicate the magnitude and concentration of high flows and floods; (ii) minimums of consecutive 1, 7, and 30 d streamflow averages, which indicate the magnitude of low flows; (iii) various percentiles of streamflow; (iv) monthly and annual mean flow, which are usually used for water resources analysis; (v) high- and low-flow event threshold (Clausen and Biggs, 2000; Olden and Poff, 2003); (vi) runoff and baseflow magnitude (Horner, 2020), which indicate the magnitude of difference between the maximum and the minimum of runoff and baseflow.
The frequency of streamflow regime is how often a flow of specific magnitude recurs over some specified time intervals (Poff et al., 1997). The corresponding indices include the ratios of days with streamflow reaching specific thresholds to the total days and the numbers of streamflow events (floods, high flows, low flows, etc.) with various thresholds. The duration is the period of time during which a streamflow event lasts. Annual mean durations of streamflow events are calculated as indices.
The changing rate, or flashiness, means how fast and frequently streamflow alters from one magnitude to another (Poff et al., 1997; Baker et al., 2004). A flashy river basin has a very quick and sensitive response to incoming water like precipitation with rapidly rising and falling hydrographs. The Richards–Baker flashiness index (Baker et al., 2004), and the mean and median of all positive/negative differences between consecutive daily streamflow values (The Nature Conservancy, 2009) are used to quantify the flashiness of streamflow. Rising limb density is an index that describes the flashiness of the catchment response; for example, a low value means a smooth hydrograph (Sawicz et al., 2011).
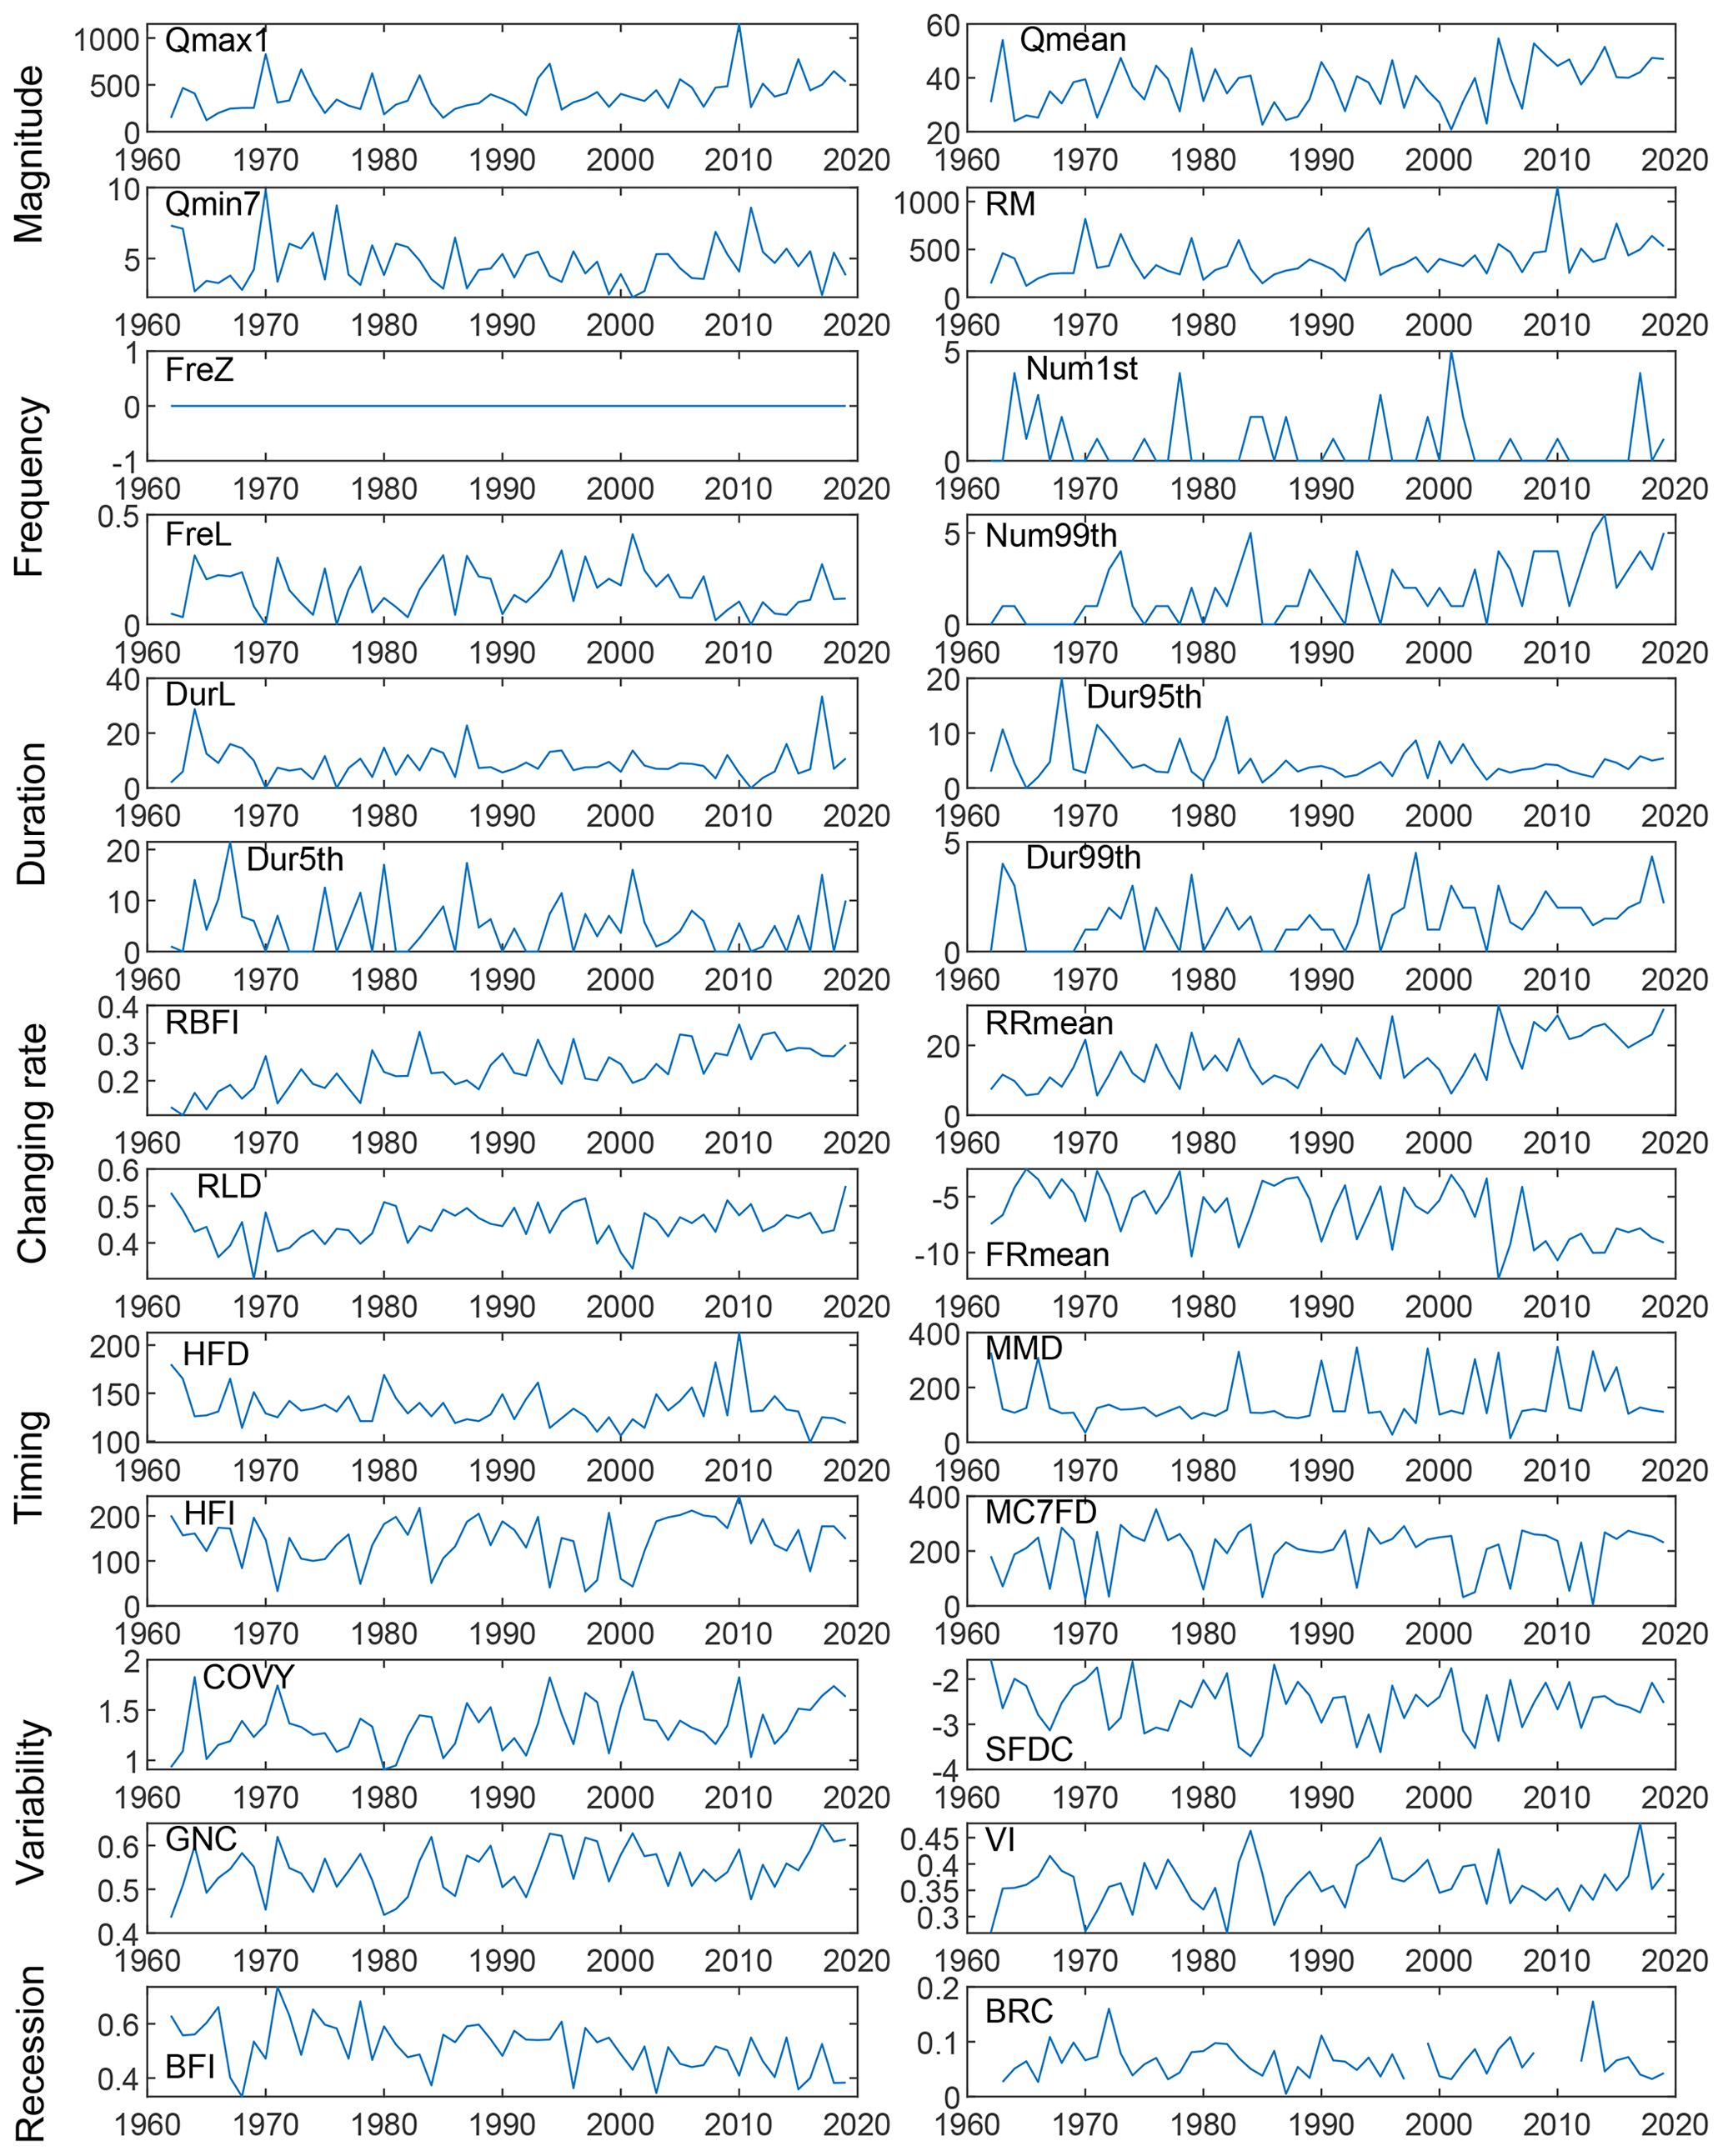
Figure 4Example streamflow indices time series for seven components of the streamflow regime of Nashwaak River at Durham Bridge, Canada, on a yearly scale. Refer to Table 4 for the definitions and units of indices.
The timing of streamflow regime is the temporal distribution of streamflow in a year (Court, 1962), which is characterized by the start date of flood season, half flow date, half flow interval, momentary maximum date, and minimum consecutive 7 d flow date in the indices dataset. To calculate the half flow date and half flow interval, the start of the water year is needed (Court, 1962). Although 1 October in the Northern Hemisphere and 1 July in the Southern Hemisphere are widely used as the start of the water year, the actual starts vary greatly even in different river basins of one hemisphere because of different geographical features, climates, etc. In the indices dataset, we use the start date of flood season as the start of the water year. The start date of the flood season for a specific station is the median of start dates of consecutive 180 d, of which the streamflow average is the biggest in one calendar year.
The indices of variability characterize the variability in streamflow regime from different perspectives (Gudmundsson et al., 2018). (i) Variance of streamflow time series provides information on the total variability in streamflow. (ii) Coefficient of variation of streamflow provides a relative measure of variability that is independent of the mean flow. (iii) Quartile-based coefficient of variation of streamflow time series provides information about the width of the distribution centre and is less sensitive to outliers. (iv) Ratio of the maximum to median of streamflow quantifies the deviation of maximum. (v) The Gini coefficient is an index to measure the inequality among values of flow duration curve. (vi) Slope of flow duration curve is an index of the variability in the seasonal water balance, which shows the difference between high and low flows (Mcmillan et al., 2017). In addition, it is also sensitive to vertical redistribution of soil water between quick flow and slow flow. (vii) Slope of distribution of peaks is an index for measuring the differences between peak discharges (Euser et al., 2013). (viii) Variability index was a measure for variability among values of flow duration curve (Lane and Lei, 1950). Rivers with a higher variability index tend to have higher percentages of surface runoff and less water storage (Estrany et al., 2010).
Recession is a component of streamflow regime which characterizes the recession of streamflow. The smoothed minima baseflow separation method of the UK Institute of Hydrology (UKIH) (1980) is used for baseflow separation required in the calculation of recession indices. Recession indices include baseflow index and baseflow recession constant. Generally, a river with a low baseflow index value has a great number of floods and low flows, and its streamflow regime is highly variable (Singh et al., 2019). Baseflow index has been commonly used in regional low-flow studies, impacts of climate change on groundwater resources, and flood responses of river basins to storm events. Baseflow recession constant is a proxy for drainage efficiency of baseflow after being recharged, which is related to the watershed hydraulic conductivity, soil porosity, and hydraulic gradient (Safeeq et al., 2013). According to Safeeq et al. (2013), a river basin with a high baseflow recession constant has a shallow subsurface flow-dominated fast draining system, whereas a river basin with low baseflow recession constant has a groundwater-dominated slow draining system.
Table 4Streamflow indices for seven components of the streamflow regime. Index name means the variable name used in the indices time series dataset. There are two temporal resolutions. Y (yearly) means one value for 1 year of the time series, and MY (multi-year) means one value for the whole time series.
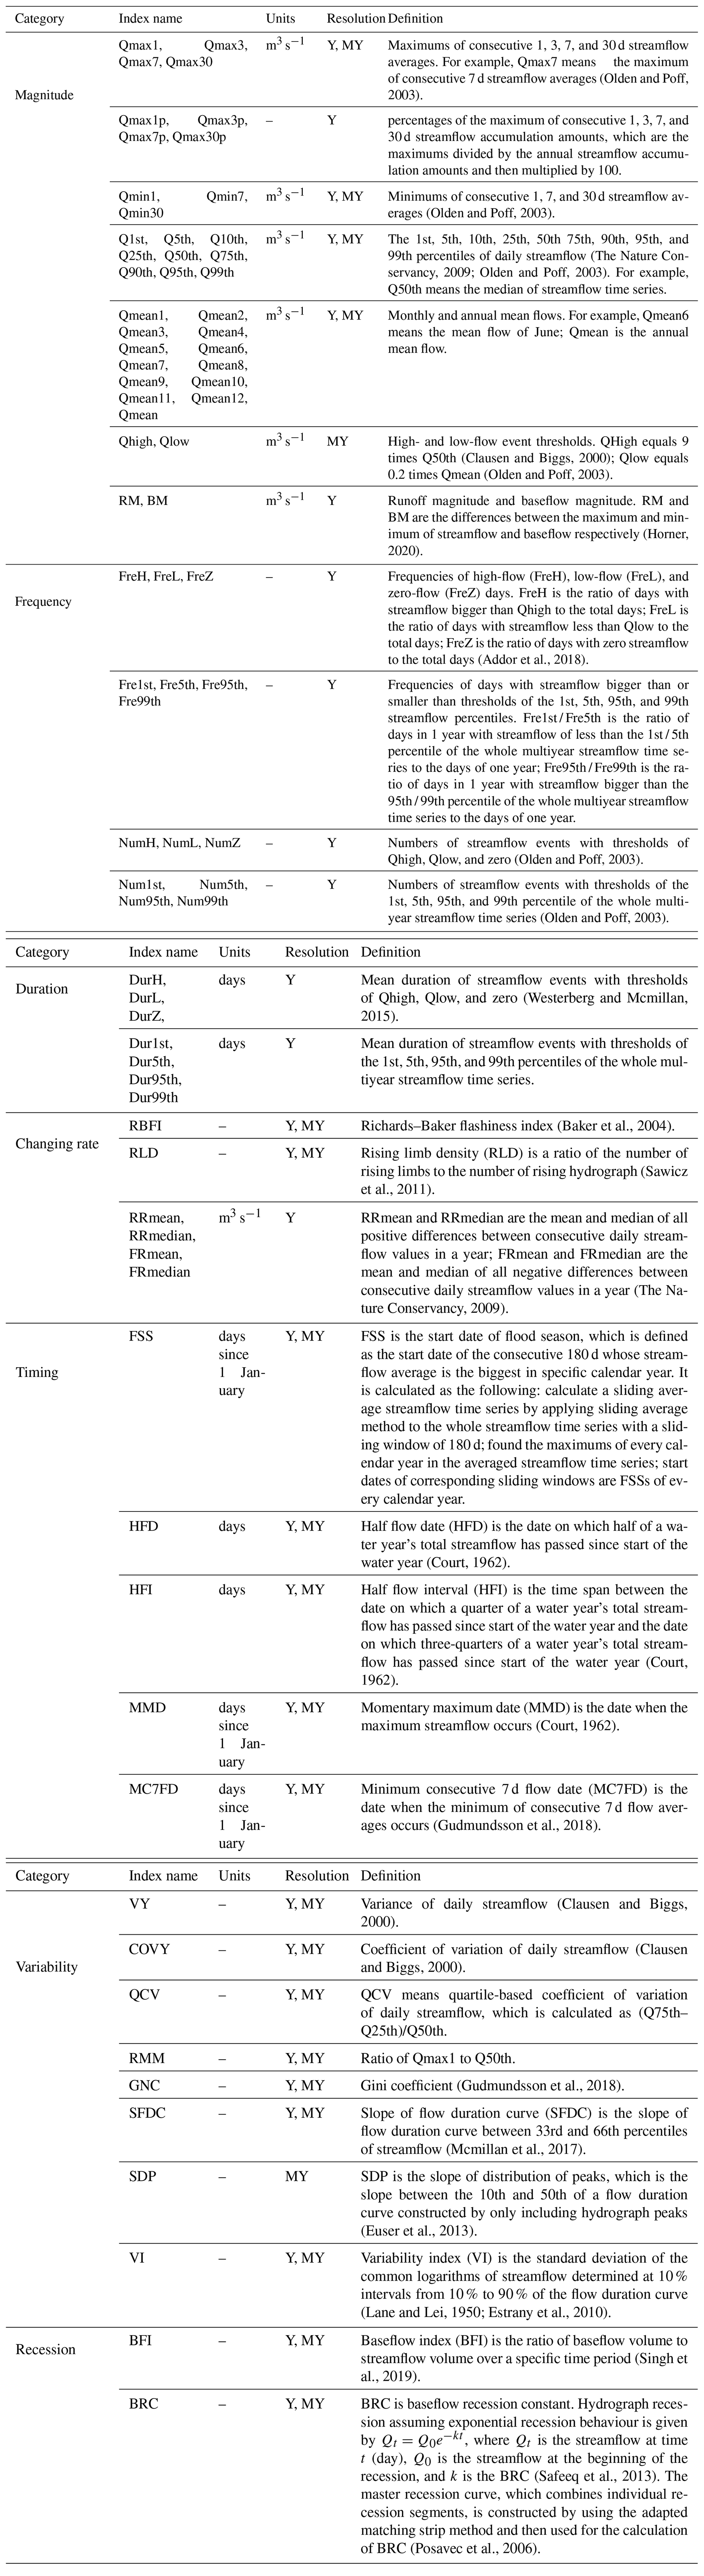
Note: for most indices, the calculation on multi-year scale is using the same algorithm as the calculation on yearly scale except that the used time series is the whole multi-year time series rather than one year's segment. For indices including FSS, HFD, HFI, MMD, and MC7FD, the multi-year values are the medians of yearly values.
3.2 Quality flags of yearly indices
According to the quality of streamflow records used for indices calculation, every yearly index value is accompanied by a quality flag for quality control. The purpose that we define the flags is to provide a space for individuals with different research objectives to have a free choice. They can use only the highest-quality indices values out of caution, or they can take some risks and add some relatively low-quality indices values in order to increase the sample size. Quality flags of yearly indices values were determined according to corresponding streamflow records and the same criteria as is shown in Table 3.
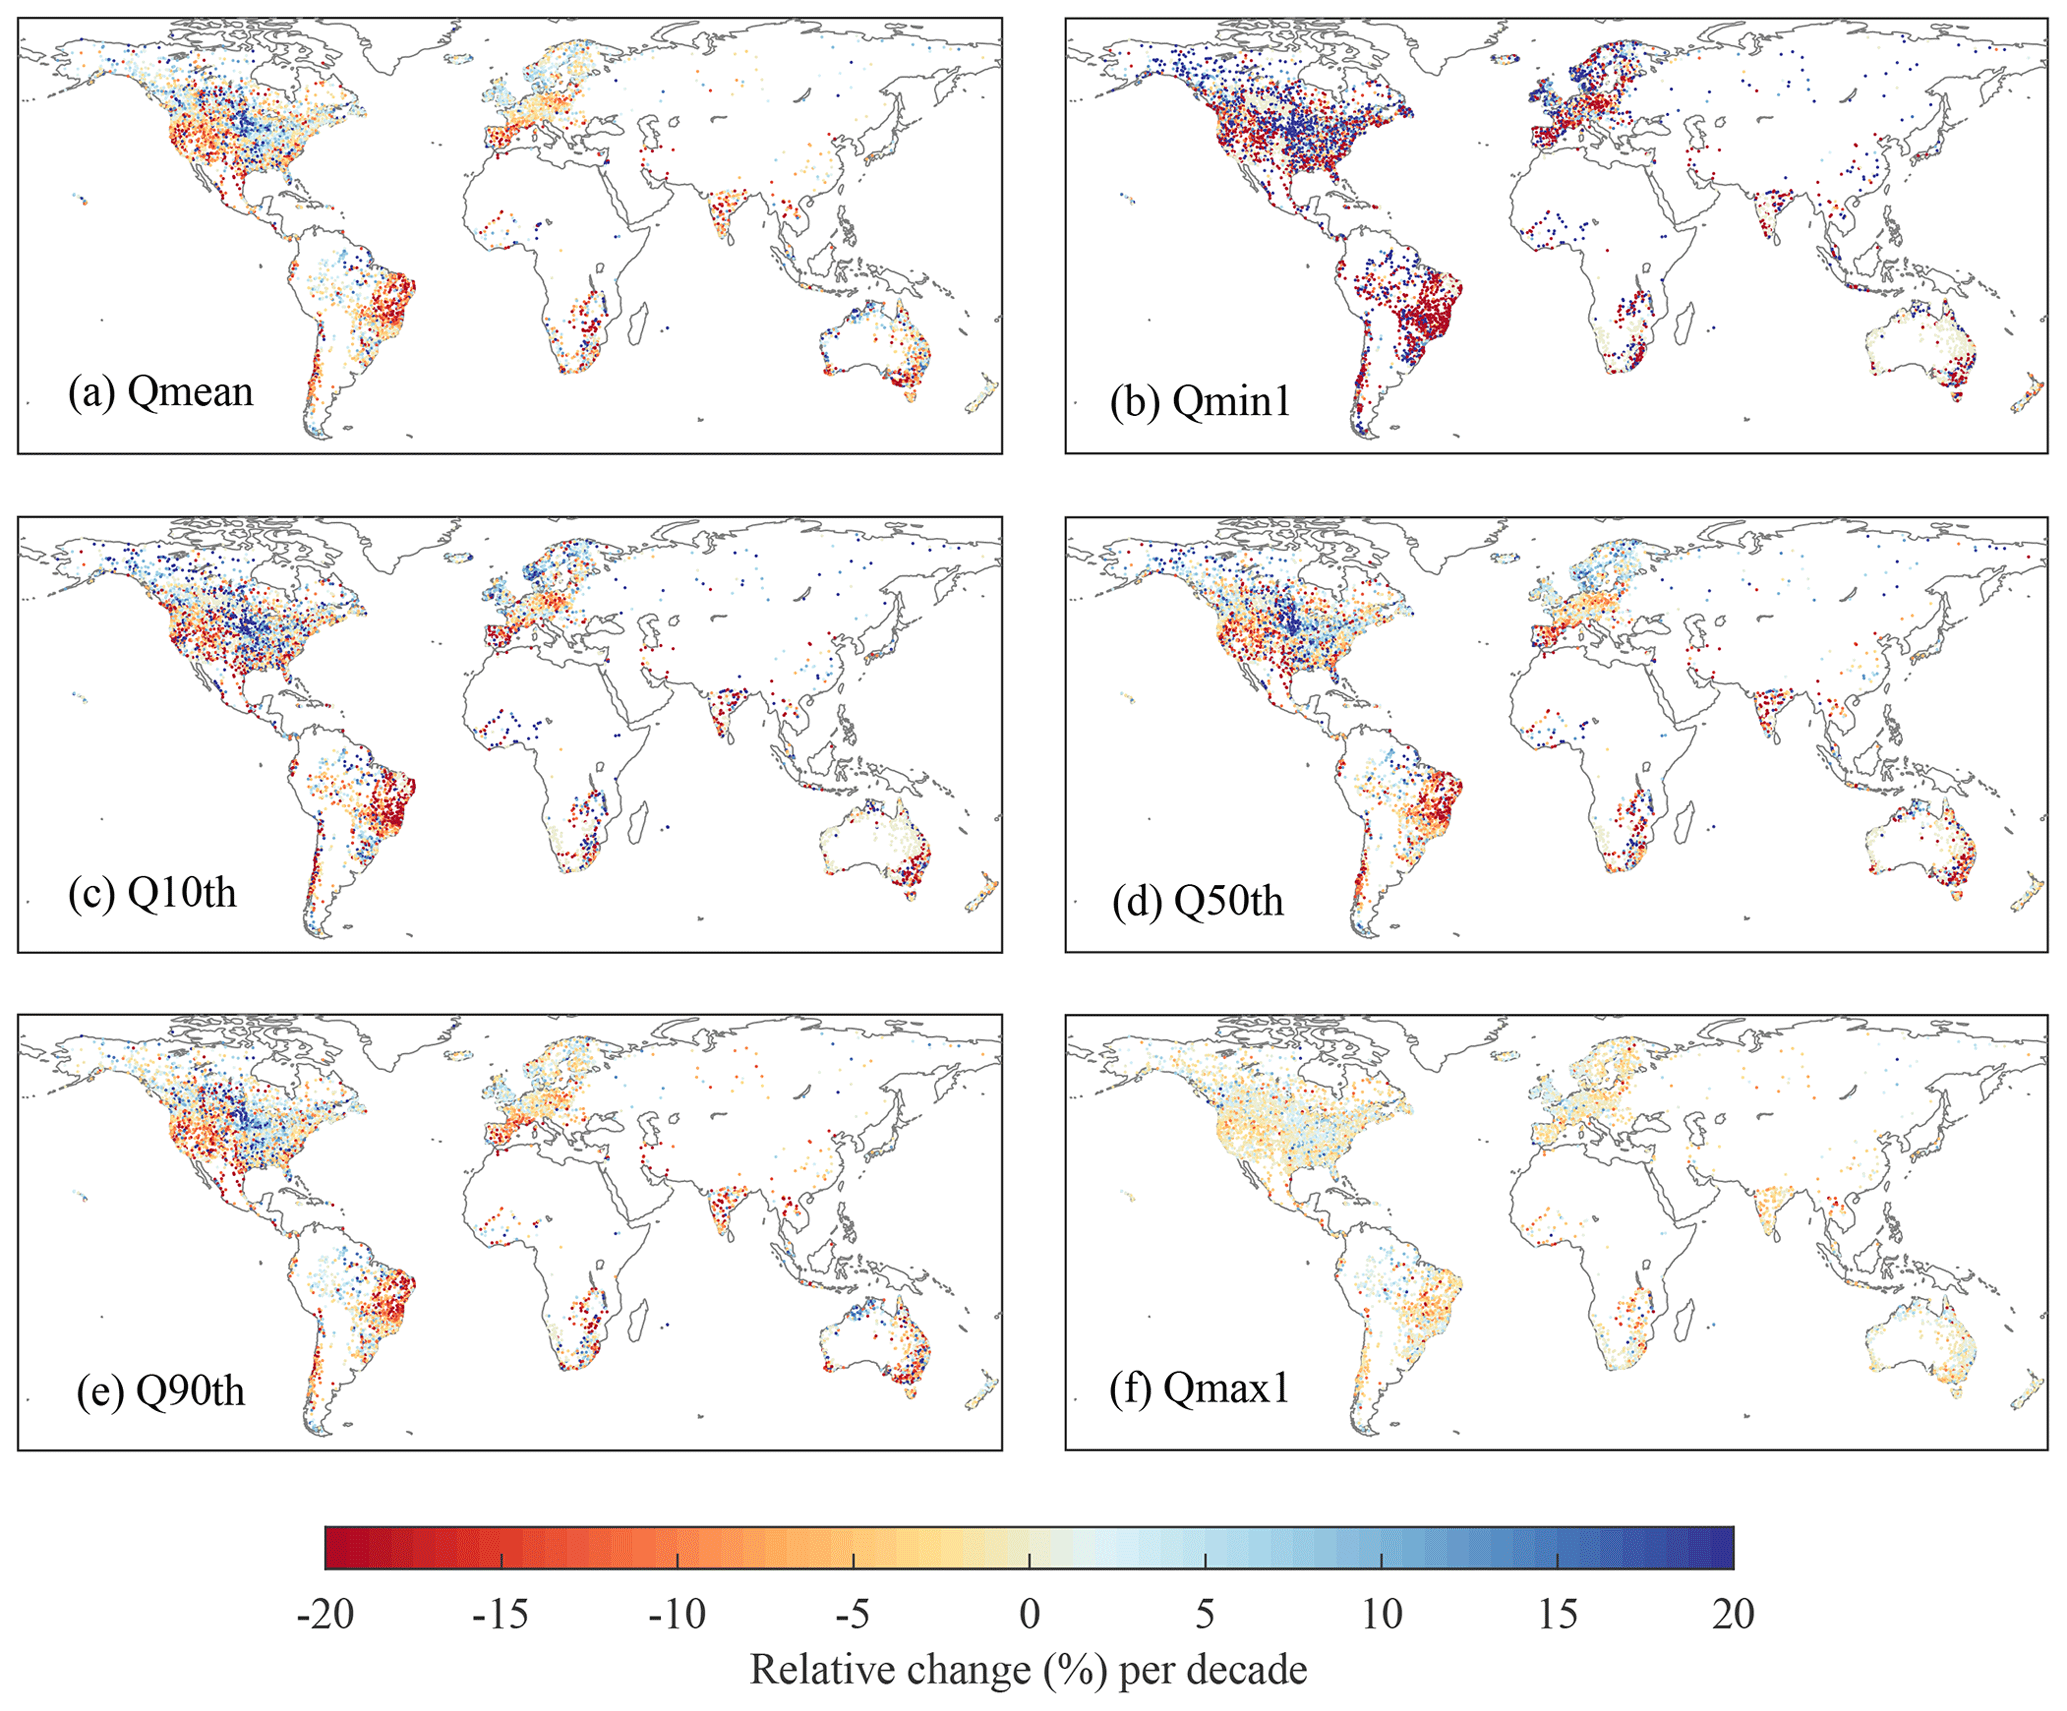
Figure 5Trends in annual mean and percentiles of streamflow during 1970 to 2022. Relative change per decade is the trend in yearly index multiplied by ten years and then divided by the multi-year index value. The trends were calculated using Sen's slope estimator. See Gocic and Trajkovic (2013) for details. Refer to Table 4 for the definitions of indices.
3.3 Example streamflow indices time series
To give a first impression of streamflow indices time series, Fig. 4 shows some streamflow indices time series of Nashwaak River at Durham Bridge, Canada on a yearly scale as an example. It is obvious that the Qmax1 and Qmean are increasing while Qmin7 has no obvious trend. The RM also shows an upward trend. These trends indicate that the magnitude of high flow is increasing. Moreover, the Num99th and Dur99th are also increasing, which means the number and lasting time of flood are rising too. To make matters worse, the RBFI and RRmean are obviously climbing as well. It means the streamflow regime of Nashwaak River is becoming more and more flashy with a higher rising–dropping speed of floods. Besides, the BFI also shows a downward trend, which indicates worse flow regulations of the river basin. In conclusion, the floods have grown in intensity and therefore flood forecasting and protection are becoming more important there.
Studies on streamflow regime on a global scale are mainly focused on the magnitude of streamflow. There are few or even no global-scale studies on other components of streamflow regime. Therefore, several studies' results about trends in annual mean and extreme streamflow were selected for comparisons with our dataset's. Figure 5 shows trends in yearly indices of mean and extreme streamflow during 1970 to 2022 derived from our dataset. Noticeable clusters of upward trends in annual mean streamflow appear in the east part of the US near the Great Lakes and the northwest part of Europe (Fig. 5a). The results are in accordance with the results of Gudmundsson et al. (2019) and Yang et al. (2021) but show more details as our collection have more stations (more than 40 000 stations) compared to around 30 000 stations of Gudmundsson et al. (2019) and around 20 000 stations of Yang et al. (2021). The spatial pattern of annual maximum streamflow is also in line with those in Do et al. (2017) and Yin et al. (2018)'s papers but have a higher resolution because more stations are included (Fig. 5f). It is noticeable that the signs of trends in different percentiles and mean of streamflow are consistent in most of regions. When one index shows an upward trend, it is highly probable that other indices will also exhibit an upward trend, and vice versa. However, there are some differences between the magnitude of changes in different indices values. The absolute values of relative change per decade of Qmin1 are obviously larger than those of other indices (Fig. 5b). In contrast, the absolute values of relative change per decade of Qmax1 are noticeably smaller than those of other indices (Fig. 5f). As the percentile increases, the absolute value of relative change per decade tends to decrease. It indicates that the low flow is more sensitive to the changing environment compared to high flow. The low flow of rivers is more vulnerable to the threat of drying up, and the regulation of streamflow during low-flow periods should be strengthened to ensure the ecological functions as well as water supply.
The global streamflow indices time series dataset is available for download at https://doi.org/10.57760/sciencedb.07227 (Chen et al., 2023a). There are two folders corresponding to two different data storage ways. One is “MAT” for files with the .mat extension, which is a binary data container format used in the MATLAB. The other is “CSV” for files with the .csv extension, in which the data are stored as a delimiter-separated text format. Apart from these, there is a file named “station_catalogue.csv”. This contains the basic information and multi-year streamflow indices of every hydrological station (Table 5).
This paper presents a global streamflow indices time series dataset for large-sample hydrology, which is designed to characterize the streamflow regime comprehensively. It includes 79 indices over 7 components of streamflow regime (i.e., magnitude, frequency, duration, changing rate, timing, variability, and recession) of 41 263 river reaches globally on yearly and multiyear scales. Before the establishment of indices dataset, streamflow records and metadata from nine databases were collected and merged into one data collection. Data quality control was performed by removing duplicate and unreasonable records, and attaching quality flags to all records and stations. Quality flags were also attached to each yearly index value in the indices dataset. A comparative analysis was performed on the trends in annual mean and percentiles of streamflow on a global scale. The results show that our dataset's results are in accordance with the results of existing studies, but our results have a higher resolution because more stations are included. Our results also indicate that the low flow is more sensitive to the changing environment compared to high flow.
Compared to existing datasets, our indices dataset has several advantages. Firstly, it includes more indices, which can characterize streamflow regime more comprehensively. Our indices dataset covers indices that characterize the frequency, duration, changing rate, and recession of streamflow regime, which are not included in GSIM or completely incorporated in other global-scale datasets. To the best of our knowledge, our dataset is the most comprehensive global-scale indices dataset in terms of streamflow indices coverage. Secondly, it includes more stations (41 263) with a longer time series (from 1806 to 2022) compared to existing streamflow indices datasets. By comparison, GSIM includes 30 959 stations with yearly indices time series from 1806 to 2016. The additional stations are mainly located in the US and China.
This dataset will greatly facilitate large-sample studies on both global and regional scales on a great number of hydrological issues related to streamflow regime, such as: (1) calibration, evaluation, and improvement of hydrological models for water resource assessment; (2) estimation of impacts of factors (like vegetation greening and snow melting caused by climate change) on streamflow regime components; (3) construction, training, and evaluation of machine learning models for hydrological forecasting and catchment classification; (4) assessment of impacts of streamflow regime shifts on biogeochemical cycles (like soil erosion) and ecological functions of streamflow; (5) analysis on the spatiotemporal pattern of streamflow regime shifts and attribution; and (6) identification of nonstationary of streamflow indices and its attribution.
LJ conceived the idea. LJ and XC conceptualized the study. XC, YL and LJ curated the data; XC compiled the data, performed the analyses and produced the figures; All authors contributed to the original draft of the paper.
The contact author has declared that none of the authors has any competing interests.
Publisher's note: Copernicus Publications remains neutral with regard to jurisdictional claims in published maps and institutional affiliations.
The authors wish to express their gratitude to all the data providers, i.e., the Global Runoff Data Centre (GRDC), U.S. Geological Survey (USGS), Water Survey of Canada (HYDAT), National Water Agency of Brazil (ANA), the Chilean Center for Climate and Resilience Research (CCCRR), Woodwell Climate Research Centre (ArcticGRO), Ministry of Water Resources of China (CHY), Central Water Commission of India (WRIS), and Australian Bureau of Meteorology (BOM), for their efforts in archiving streamflow observations and sharing the data. The authors are also grateful to the developers of TOSSH toolbox for providing such a useful tool and to Alex Buzacott for sharing a R package to download Australian water data at https://github.com/buzacott/bomWater (last access: 30 September 2023). The help from Rongrong Li from Wuhan University is highly appreciated for collecting streamflow data.
This research has been supported by the research startup grants (grant nos. Y01296129; Y01296229).
This paper was edited by Yuanzhi Yao and reviewed by Ionut Cristi Nicu and two anonymous referees.
Addor, N., Newman, A. J., Mizukami, N., and Clark, M. P.: The CAMELS data set: catchment attributes and meteorology for large-sample studies, Hydrol. Earth Syst. Sci., 21, 5293–5313, https://doi.org/10.5194/hess-21-5293-2017, 2017.
Addor, N., Nearing, G., Prieto, C., Newman, A., Le Vine, N., and Clark, M. P.: A ranking of hydrological signatures based on their predictability in space, Water Resour. Res., 54, 8792–8812, 2018.
Addor, N., Do, H. X., Alvarez-Garreton, C., Coxon, G., Fowler, K., and Mendoza, P. A.: Large-sample hydrology: recent progress, guidelines for new datasets and grand challenges, Hydrolog. Sci. J., 65, 712–725, 2020.
Alvarez-Garreton, C., Mendoza, P. A., Boisier, J. P., Addor, N., Galleguillos, M., Zambrano-Bigiarini, M., Lara, A., Puelma, C., Cortes, G., Garreaud, R., McPhee, J., and Ayala, A.: The CAMELS-CL dataset: catchment attributes and meteorology for large sample studies – Chile dataset, Hydrol. Earth Syst. Sci., 22, 5817–5846, https://doi.org/10.5194/hess-22-5817-2018, 2018.
Baker, D. B., Richards, R. P., Loftus, T. T., and Kramer, J. W.: A new flashiness index: Characteristics and applications to midwestern rivers and streams, J. Am. Water Resour. As., 40, 503–522, 2004.
Barichivich, J., Gloor, E., Peylin, P., Brienen, R. J. W., Schöngart, J., Espinoza, J. C., and Pattnayak, K. C.: Recent intensification of Amazon flooding extremes driven by strengthened Walker circulation, Sci. Adv., 4, eaat8785, 10.1126/sciadv.aat8785, 2018.
Botter, G., Basso, S., Rodriguez-Iturbe, I., and Rinaldo, A.: Resilience of river flow regimes, P. Natl. Acad. Scie. USA, 110, 12925–12930, https://doi.org/10.1073/pnas.1311920110, 2013.
Brouziyne, Y., De Girolamo, A. M., Aboubdillah, A., Benaabidate, L., Bouchaou, L., and Chehbouni, A.: Modeling alterations in flow regimes under changing climate in a Mediterranean watershed: An analysis of ecologically-relevant hydrological indicators, Ecol. Inform., 61, 101219, https://doi.org/10.1016/j.ecoinf.2021.101219, 2021.
Chagas, V. B. P., Chaffe, P. L. B., Addor, N., Fan, F. M., Fleischmann, A. S., Paiva, R. C. D., and Siqueira, V. A.: CAMELS-BR: hydrometeorological time series and landscape attributes for 897 catchments in Brazil, Earth Syst. Sci. Data, 12, 2075–2096, https://doi.org/10.5194/essd-12-2075-2020, 2020.
Chen, X., Quan, Q., Zhang, K., and Wei, J.: Spatiotemporal characteristics and attribution of dry/wet conditions in the Weihe River Basin within a typical monsoon transition zone of East Asia over the recent 547 years, Environ. Model. Softw., 143, 105116, https://doi.org/10.1016/j.envsoft.2021.105116, 2021.
Chen, X., Jiang, L., Luo, Y., and Liu, J.: A global streamflow indices time series dataset, Science Data Bank [dataset], https://doi.org/10.57760/sciencedb.07227, 2023a.
Chen, X., Zhang, K., Luo, Y., Zhang, Q., Zhou, J., Fan, Y., Huang, P., Yao, C., Chao, L., and Bao, H.: A distributed hydrological model for semi-humid watersheds with a thick unsaturated zone under strong anthropogenic impacts: a case study in Haihe River Basin, J. Hydrol., 623, 129765, https://doi.org/10.1016/j.jhydrol.2023.129765, 2023b.
Cheng, Y., Sang, Y., Wang, Z., Guo, Y., and Tang, Y.: Effects of Rainfall and Underlying Surface on Flood Recession–The Upper Huaihe River Basin Case, Int. J. Disast. Risk Sc., 12, 111–120, 10.1007/s13753-020-00310-w, 2021.
Clark, M. P., Rupp, D. E., Woods, R. A., Tromp-van Meerveld, H., Peters, N., and Freer, J.: Consistency between hydrological models and field observations: linking processes at the hillslope scale to hydrological responses at the watershed scale, Hydrol. Process., 23, 311–319, 2009.
Clausen, B. and Biggs, B.: Flow variables for ecological studies in temperate streams: groupings based on covariance, J. Hydrol., 237, 184–197, 2000.
Colls, M., Timoner, X., Font, C., Sabater, S., and Acuña, V.: Effects of Duration, Frequency, and Severity of the Non-flow Period on Stream Biofilm Metabolism, Ecosystems, 22, 1393–1405, https://doi.org/10.1007/s10021-019-00345-1, 2019.
Court, A.: Measures of streamflow timing, J. Geophys. Res., 67, 4335–4339, 1962.
Coxon, G., Addor, N., Bloomfield, J. P., Freer, J., Fry, M., Hannaford, J., Howden, N. J. K., Lane, R., Lewis, M., Robinson, E. L., Wagener, T., and Woods, R.: CAMELS-GB: hydrometeorological time series and landscape attributes for 671 catchments in Great Britain, Earth Syst. Sci. Data, 12, 2459–2483, https://doi.org/10.5194/essd-12-2459-2020, 2020.
Crochemore, L., Isberg, K., Pimentel, R., Pineda, L., Hasan, A., and Arheimer, B.: Lessons learnt from checking the quality of openly accessible river flow data worldwide, Hydrolog. Sci. J., 65, 699–711, https://doi.org/10.1080/02626667.2019.1659509, 2020.
Cushman, R. M.: Review of Ecological Effects of Rapidly Varying Flows Downstream from Hydroelectric Facilities, North Am. J. Fish. Manage., 5, 330–339, https://doi.org/10.1577/1548-8659(1985)5<330:ROEEOR>2.0.CO;2, 1985.
Delaigue, O., Brigode, P., Andréassian, V., Perrin, C., Etchevers, P., Soubeyroux, J.-M., Janet, B., and Nans, A.: CAMELS-FR: A large sample hydroclimatic dataset for France to explore hydrological diversity and support model benchmarking, IAHS-2022 Scientific Assembly, Montpellier, France, 29 May–3 June 2022, IAHS2022-521, https://doi.org/10.5194/iahs2022-521, 2022.
Do, H. X., Westra, S., and Leonard, M.: A global-scale investigation of trends in annual maximum streamflow, J. Hydrol., 552, 28–43, https://doi.org/10.1016/j.jhydrol.2017.06.015, 2017.
Do, H. X., Gudmundsson, L., Leonard, M., and Westra, S.: The Global Streamflow Indices and Metadata Archive (GSIM) – Part 1: The production of a daily streamflow archive and metadata, Earth Syst. Sci. Data, 10, 765–785, https://doi.org/10.5194/essd-10-765-2018, 2018.
Ebeling, P., Kumar, R., Lutz, S. R., Nguyen, T., Sarrazin, F., Weber, M., Büttner, O., Attinger, S., and Musolff, A.: QUADICA: water QUAlity, DIscharge and Catchment Attributes for large-sample studies in Germany, Earth Syst. Sci. Data, 14, 3715–3741, https://doi.org/10.5194/essd-14-3715-2022, 2022.
Estrany, J., Garcia, C., and Batalla, R. J.: Hydrological response of a small mediterranean agricultural catchment, J. Hydrol., 380, 180–190, 2010.
Euser, T., Winsemius, H. C., Hrachowitz, M., Fenicia, F., Uhlenbrook, S., and Savenije, H. H. G.: A framework to assess the realism of model structures using hydrological signatures, Hydrol. Earth Syst. Sci., 17, 1893–1912, https://doi.org/10.5194/hess-17-1893-2013, 2013.
Fowler, K. J. A., Acharya, S. C., Addor, N., Chou, C., and Peel, M. C.: CAMELS-AUS: hydrometeorological time series and landscape attributes for 222 catchments in Australia, Earth Syst. Sci. Data, 13, 3847–3867, https://doi.org/10.5194/essd-13-3847-2021, 2021.
Gehrke, P. C., Brown, P., Schiller, C. B., Moffatt, D. B., and Bruce, A. M.: River regulation and fish communities in the Murray-Darling river system, Australia, Regul. River., 11, 363–375, https://doi.org/10.1002/rrr.3450110310, 1995.
Gnann, S. J., McMillan, H. K., Woods, R. A., and Howden, N. J. K.: Including Regional Knowledge Improves Baseflow Signature Predictions in Large Sample Hydrology, Water Resour. Res., 57, e2020WR028354, https://doi.org/10.1029/2020WR028354, 2021a.
Gnann, S. J., Coxon, G., Woods, R. A., Howden, N. J., and McMillan, H. K.: TOSSH: A toolbox for streamflow signatures in hydrology, Environ. Model. Softw., 138, 104983, https://doi.org/10.1016/j.envsoft.2021.104983, 2021b.
Gocic, M. and Trajkovic, S.: Analysis of changes in meteorological variables using Mann-Kendall and Sen's slope estimator statistical tests in Serbia, Global Planet. Change, 100, 172–182, https://doi.org/10.1016/j.gloplacha.2012.10.014, 2013.
Goeking, S. A. and Tarboton, D. G.: Variable Streamflow Response to Forest Disturbance in the Western US: A Large-Sample Hydrology Approach, Water Resour. Res., 58, e2021WR031575, https://doi.org/10.1029/2021WR031575, 2022.
Gudmundsson, L., Do, H. X., Leonard, M., and Westra, S.: The Global Streamflow Indices and Metadata Archive (GSIM) – Part 2: Quality control, time-series indices and homogeneity assessment, Earth Syst. Sci. Data, 10, 787–804, https://doi.org/10.5194/essd-10-787-2018, 2018.
Gudmundsson, L., Leonard, M., Do, H. X., Westra, S., and Seneviratne, S. I.: Observed trends in global indicators of mean and extreme streamflow, Geophys. Res. Lett., 46, 756–766, 2019.
Gudmundsson, L., Boulange, J., Do, H. X., Gosling, S. N., Grillakis, M. G., Koutroulis, A. G., Leonard, M., Liu, J., Müller Schmied, H., Papadimitriou, L., Pokhrel, Y., Seneviratne, S. I., Satoh, Y., Thiery, W., Westra, S., Zhang, X., and Zhao, F.: Globally observed trends in mean and extreme river flow attributed to climate change, Science, 371, 1159–1162, https://doi.org/10.1126/science.aba3996, 2021.
Gupta, H. V., Perrin, C., Blöschl, G., Montanari, A., Kumar, R., Clark, M., and Andréassian, V.: Large-sample hydrology: a need to balance depth with breadth, Hydrol. Earth Syst. Sci., 18, 463–477, https://doi.org/10.5194/hess-18-463-2014, 2014.
Harmon, B., Logan, L., Spiese, C., and Rahrig, R.: Flow alterations in rivers due to unconventional oil and gas development in the Ohio River basin, Sci. Total Environ., 856, 159126, https://doi.org/10.1016/j.scitotenv.2022.159126, 2022.
Horner, I.: Design and evaluation of hydrological signatures for the diagnostic and improvement of a process-based distributed hydrological model, Université Grenoble Alpes, 2020.
Jacobson, R., Bouska, K., Bulliner, E., Lindner, G., and Paukert, C.: Geomorphic Controls on Floodplain Connectivity, Ecosystem Services, and Sensitivity to Climate Change: An Example From the Lower Missouri River, Water Resour. Res., 58, e2021WR031204, https://doi.org/10.1029/2021WR031204, 2022.
Klingler, C., Schulz, K., and Herrnegger, M.: LamaH-CE: LArge-SaMple DAta for Hydrology and Environmental Sciences for Central Europe, Earth Syst. Sci. Data, 13, 4529–4565, https://doi.org/10.5194/essd-13-4529-2021, 2021.
Lane, E. W. and Lei, K.: Stream Flow Variability, T. Am. Soc. Civ. Eng., 115, 1084–1098, https://doi.org/10.1061/TACEAT.0006394, 1950.
Lane, R. A. and Kay, A. L.: Climate Change Impact on the Magnitude and Timing of Hydrological Extremes Across Great Britain, Front. Water, 3, 684982, https://doi.org/10.3389/frwa.2021.684982, 2021.
Lane, R. A., Coxon, G., Freer, J., Seibert, J., and Wagener, T.: A large-sample investigation into uncertain climate change impacts on high flows across Great Britain, Hydrol. Earth Syst. Sci., 26, 5535–5554, https://doi.org/10.5194/hess-26-5535-2022, 2022.
McMillan, H., Westerberg, I., and Branger, F.: Five guidelines for selecting hydrological signatures, Hydrol. Process., 31, 4757–4761, 2017.
Nearing, G. S., Kratzert, F., Sampson, A. K., Pelissier, C. S., Klotz, D., Frame, J. M., Prieto, C., and Gupta, H. V.: What Role Does Hydrological Science Play in the Age of Machine Learning?, Water Resour. Res., 57, e2020WR028091, https://doi.org/10.1029/2020WR028091, 2021.
Olden, J. D. and Poff, N. L.: Redundancy and the choice of hydrologic indices for characterizing streamflow regimes, River Res. Appl., 19, 101–121, https://doi.org/10.1002/rra.700, 2003.
Paine, L.: River Cultures in World History–Rescuing a Neglected Resource, Fudan Journal of the Humanities and Social Sciences, 12, 457–472, https://doi.org/10.1007/s40647-018-0220-4, 2019.
Palmer, M. and Ruhi, A.: Linkages between flow regime, biota, and ecosystem processes: Implications for river restoration, Science, 365, eaaw2087, https://doi.org/10.1126/science.aaw2087, 2019.
Poff, N. L. and Ward, J. V.: Implications of Streamflow Variability and Predictability for Lotic Community Structure: A Regional Analysis of Streamflow Patterns, Can. J. Fish. Aquat. Sci., 46, 1805–1818, https://doi.org/10.1139/f89-228, 1989.
Poff, N. L., Allan, J. D., Bain, M. B., Karr, J. R., Prestegaard, K. L., Richter, B. D., Sparks, R. E., and Stromberg, J. C.: The natural flow regime, BioScience, 47, 769–784, 1997.
Posavec, K., Bačani, A., and Nakić, Z.: A Visual Basic Spreadsheet Macro for Recession Curve Analysis, Groundwater, 44, 764–767, https://doi.org/10.1111/j.1745-6584.2006.00226.x, 2006.
Richter, B. D., Baumgartner, J. V., Powell, J., and Braun, D. P.: A Method for Assessing Hydrologic Alteration within Ecosystems, Conserv. Biol., 10, 1163–1174, https://doi.org/10.1046/j.1523-1739.1996.10041163.x, 1996.
Rood, S., Mahoney, J., Reid, D., and Zilm, L.: Instream Flows and the Decline of Riparian Cottonwoods Along the St. Mary River, Alberta, Can. J. Bot., 73, 1250–1260, https://doi.org/10.1139/b95-136, 1995.
Safeeq, M., Grant, G. E., Lewis, S. L., and Tague, C. L.: Coupling snowpack and groundwater dynamics to interpret historical streamflow trends in the western United States, Hydrol. Process., 27, 655–668, 2013.
Sauquet, E., Shanafield, M., Hammond, J. C., Sefton, C., Leigh, C., and Datry, T.: Classification and trends in intermittent river flow regimes in Australia, northwestern Europe and USA: A global perspective, J. Hydrol., 597, 126170, https://doi.org/10.1016/j.jhydrol.2021.126170, 2021.
Sawicz, K., Wagener, T., Sivapalan, M., Troch, P. A., and Carrillo, G.: Catchment classification: empirical analysis of hydrologic similarity based on catchment function in the eastern USA, Hydrol. Earth Syst. Sci., 15, 2895–2911, https://doi.org/10.5194/hess-15-2895-2011, 2011.
Shih, S.-S., Liu, C.-H., and Ning, J.-H.: In-river weir effects on the alteration of flow regime and regarding structural stream habitat, J. Hydrol., 615, 128670, https://doi.org/10.1016/j.jhydrol.2022.128670, 2022.
Singh, S. K., Pahlow, M., Booker, D. J., Shankar, U., and Chamorro, A.: Towards baseflow index characterisation at national scale in New Zealand, J. Hydrol., 568, 646–657, 2019.
Sun, A. Y., Jiang, P., Mudunuru, M. K., and Chen, X.: Explore Spatio-Temporal Learning of Large Sample Hydrology Using Graph Neural Networks, Water Resour. Res., 57, e2021WR030394, https://doi.org/10.1029/2021WR030394, 2021.
The Nature Conservancy: Indicators of Hydrologic Alteration Version 7.1 User's Manual, 2009.
Tonkin, J. D., Merritt, D., Olden, J. D., Reynolds, L. V., and Lytle, D. A.: Flow regime alteration degrades ecological networks in riparian ecosystems, Nat. Ecol. Evol., 2, 86–93, 2018.
Torabi Haghighi, A., Yaraghi, N., Sönmez, M. E., Darabi, H., Kum, G., Çelebi, A., and Kløve, B.: An index-based approach for assessment of upstream-downstream flow regime alteration, J. Hydrol., 600, 126697, https://doi.org/10.1016/j.jhydrol.2021.126697, 2021.
Tramblay, Y., Rouché, N., Paturel, J.-E., Mahé, G., Boyer, J.-F., Amoussou, E., Bodian, A., Dacosta, H., Dakhlaoui, H., Dezetter, A., Hughes, D., Hanich, L., Peugeot, C., Tshimanga, R., and Lachassagne, P.: ADHI: the African Database of Hydrometric Indices (1950–2018), Earth Syst. Sci. Data, 13, 1547–1560, https://doi.org/10.5194/essd-13-1547-2021, 2021.
Troin, M., Martel, J.-L., Arsenault, R., and Brissette, F.: Large-sample study of uncertainty of hydrological model components over North America, J. Hydrol., 609, 127766, https://doi.org/10.1016/j.jhydrol.2022.127766, 2022.
UKIH: Institute of Hydrology: Low Flow Studies Report No 3, Institute of Hydrology, Wallingford, UK, 1980.
Wasko, C., Nathan, R., and Peel, M. C.: Trends in global flood and streamflow timing based on local water year, Water Resour. Res., 56, e2020WR027233, https://doi.org/10.1029/2020WR027233, 2020.
Westerberg, I. K. and McMillan, H. K.: Uncertainty in hydrological signatures, Hydrol. Earth Syst. Sci., 19, 3951–3968, https://doi.org/10.5194/hess-19-3951-2015, 2015.
Worku, F. F., Werner, M., Wright, N., van der Zaag, P., and Demissie, S. S.: Flow regime change in an endorheic basin in southern Ethiopia, Hydrol. Earth Syst. Sci., 18, 3837–3853, https://doi.org/10.5194/hess-18-3837-2014, 2014.
Yang, Y., Roderick, M. L., Yang, D., Wang, Z., Ruan, F., McVicar, T. R., Zhang, S., and Beck, H. E.: Streamflow stationarity in a changing world, Environ. Res. Lett., 16, 064096, https://doi.org/10.1088/1748-9326/ac08c1, 2021.
Yin, J., Gentine, P., Zhou, S., Sullivan, S. C., Wang, R., Zhang, Y., and Guo, S.: Large increase in global storm runoff extremes driven by climate and anthropogenic changes, Nat. Commun., 9, 4389, 10.1038/s41467-018-06765-2, 2018.