the Creative Commons Attribution 4.0 License.
the Creative Commons Attribution 4.0 License.
 | 27 Jan 2023
Harmonized Soil Database of Ecuador (HESD): data from 2009 to 2015
Daphne Armas
Mario Guevara
Fernando Bezares
Rodrigo Vargas
Pilar Durante
Víctor Osorio
Wilmer Jiménez
Cecilio Oyonarte
One of the largest challenges with soil information around the world is how to harmonize archived soil data from different sources and how to make it accessible to soil scientist. In Ecuador, there have been two major projects that have provided soil information, but the methodology of these projects, although comparable, did not coincide, especially with respect to how information was reported. Here, we present a new soil database for Ecuador, comprising 13 542 soil profiles with 51 713 measured soil horizons, including 92 different edaphic variables. The original data were in a non-editable format (i.e., PDF), which made it difficult to access and process the information. Our study provides an integrated framework that combines multiple analytic tools for automatically converting legacy soil information from an analog format into usable digital soil mapping inputs across Ecuador. This framework allowed us to incorporate quantitative information on a broad set of soil properties and retrieve qualitative information on soil morphological properties collected in the profile description phase, which is rarely included in soil databases. We present a new harmonized national soil database using a specific methodology to preserve relevant information. The national representativeness of soil information has been enhanced compared with other international databases, and this new database contributes to filling the gaps in publicly available soil information across the country. The database is freely available at https://doi.org/10.6073/pasta/1560e803953c839e7aedef78ff7d3f6c (Armas et al., 2022).
- Article
(6351 KB) - Full-text XML
-
Supplement
(446 KB) - BibTeX
- EndNote


There is an increasing need for updated soil datasets globally. These datasets are required to develop soil monitoring baselines, soil protection and sustainable land use strategies, and a better understanding of the soil response to global environmental change. Soil datasets are one of the most critical inputs for Earth system models (ESMs) to address different processes, such as the terrestrial carbon sinks and sources of greenhouse gases (Luo et al., 2016; Pfeiffer et al., 2020). Furthermore, access to spatially explicit, consistent, and reliable soil data is essential for digital soil mapping and for evaluating the status of soil resources with increased resolution to respond to and assess global issues (FAO, 2015; FAO and ITPS, 2015; Pfeiffer et al., 2020). Unfortunately, one of the biggest challenges for digital soil mapping is the limited available information (e.g., soil profile descriptions, soil sample analysis, hard soil data) representing soil variability across the world.
Over the last few years, there has been a growing focus on improving the quality and quantity of soil data as well as access to soil data and information (Díaz-Guadarrama et al., 2022; Smith et al., 2022; Pfeiffer et al., 2020; Orgiazzi et al., 2018; Hengl et al., 2017). Particularly, these efforts have endeavored to increase access to harmonized products containing comparable and consistent datasets. Global initiatives such as the World Soil Information Service (WoSIS; Batjes et al., 2020) or SoilGrids250m (Hengl et al., 2017), for global pedometric mapping, have provided increasing soil information to multiple users. Arrouays et al. (2017) affirm that over 800 000 soil profiles have been collected into databases during the past decades, but only a small number of these (117 000) are accessible or shared with the international community. According to Batjes et al. (2020), large numbers of soil profiles stored in many country-specific databases are not yet standardized and harmonized according to a global standard and are not shared; therefore, they are not available for use at a national level, let alone at a global level.
As acquiring new soil data is laborious and expensive, legacy soil databases and historically collected soil information are extremely valuable (Gray et al., 2015; Arrouays et al., 2017). This information is useful to test how soils change over time, but it usually comes from various projects that used different procedures, laboratory methods, standards, scales, taxonomic classification systems, and georeferencing systems. Therefore, data must be retrieved, compiled, and processed into standard, consistent, and harmonized datasets, which is a challenging process (Arrouays et al., 2018).
It is necessary to have consistent and spatially explicit information on different soil properties and attributes, such as soil organic carbon (SOC) content, and reality shows the existence of a severe deficit in coherent information at regional, national, and global levels (Arrouays et al., 2017). Rossiter (2016) highlights important barriers limiting the interoperability of soil databases with global soil modeling assessments, such as the scarce availability of soil datasets and the lack of harmonization efforts to bring multiple soil data structures into usable formats for diverse applications (e.g., digital soil mapping). Interoperability is defined as the collective effort of sharing information that can be used to produce and apply newly gained knowledge, and it is achieved by removing conceptual, technological, organizational, and cultural barriers (Vargas et al., 2017), which are common in soil-science-related communities Efforts to increase interoperability in soil science must come from various individuals and institutions, including government ministries/agencies, the scientific community, landowners, civil society groups, and business owners.
It is vital to model the status of soil resources globally at an increasingly detailed resolution in order to evaluate and have a better response to global and local issues, such us soil salinization, land degradation, and desertification (Pfeiffer et al., 2020; FAO, 2015; Hengl et al., 2014). Harmonizing soil databases will improve the estimation of current and future land potential productivity, help identify land practical limitations for land management, and identify land degradation risks, particularly soil erosion (Nur Syabeera et al., 2020). It will also contribute scientific knowledge that can aid with planning a sustainable transformation of agricultural production and with guiding policies to address emerging land competition issues around soil security, food production, bioenergy demand, and biodiversity threats (Montanella et al., 2016; FAO, 2015; McBratney et al., 2014). Thus, national- to global-scale harmonized soil databases are of critical importance for natural resource management, making progress towards eradicating hunger and poverty, and addressing food security and sustainable agricultural development, especially concerning the threats of global climate change and the need for adaptation and mitigation (FAO/IIASA/ISRIC/ISS-CAS/JRC, 2009).
In Ecuador, there have been two main efforts that have collected national soil information: one by the Instituto Espacial Ecuatoriano (IEE) and one by the Ministerio de Agricultura y Ganadería within the Sistema Nacional de Información de Tierras Rurales e Infraestructura Tecnológica (MAGAP-SIGTIERRAS) program (Tracasa-Nipsa, 2015). These projects have comparable methodologies, but there are substantial differences, especially with respect to how the soil information is structured and presented. We have identified over 13 500 soil profiles (and 51 713 measured soil horizons) in Ecuador (Loayza et al., 2020) that can be used to support a national framework on pedometric (or digital soil) mapping (Guerrero et al., 2014). We highlight that this soil information in Ecuador has not been available to the scientific community to date, and only 94 Ecuadorian soil profiles are currently included in global soil information systems, such as WoSIS (Batjes et al., 2020).
The main objective of this study is to synthesize and harmonize available soil profile information collected by the IEE and MAGAP-SIGTIERRAS across Ecuador between 2009 and 2015. In this way, we developed a new soil database with the purpose of constructing a national soil information system following international standards for archiving and sharing soil data. Thus, this dataset can easily be integrated into global soil information systems. In addition, we provide an integrated framework combining various data analysis tools to convert legacy soil information in an analog format into digital information that is useful for further analyses and data sharing.
The Harmonized Soil Database of Ecuador (HESD) was developed by integrating information collected during the following previous projects: “Generation of Geoinformation for land management and rural land valuation in the Guayas River basin, scale 1:25 000” (Generación de Geoinformación para la Gestión de territorio y valoración de tierras rurales de la Cuenca del Río Guayas, escala 1:25 000”) (2007–2015) by the IEE (CLIRSEN, 2015) and “Generation Of Geoinformation For The Management Of The Territory At National Level” (Generación De Geoinformación para La Gestión Del Territorio A Nivel Nacional) (2009–2012) by the MAGAP-SIGTIERRAS (Tracasa-Nipsa, 2015). As a result, 13 542 soil profiles are described and registered, 5368 of which are from IEE and 8174 of which are from MAGAP-SIGTIERRAS (Fig. 1).
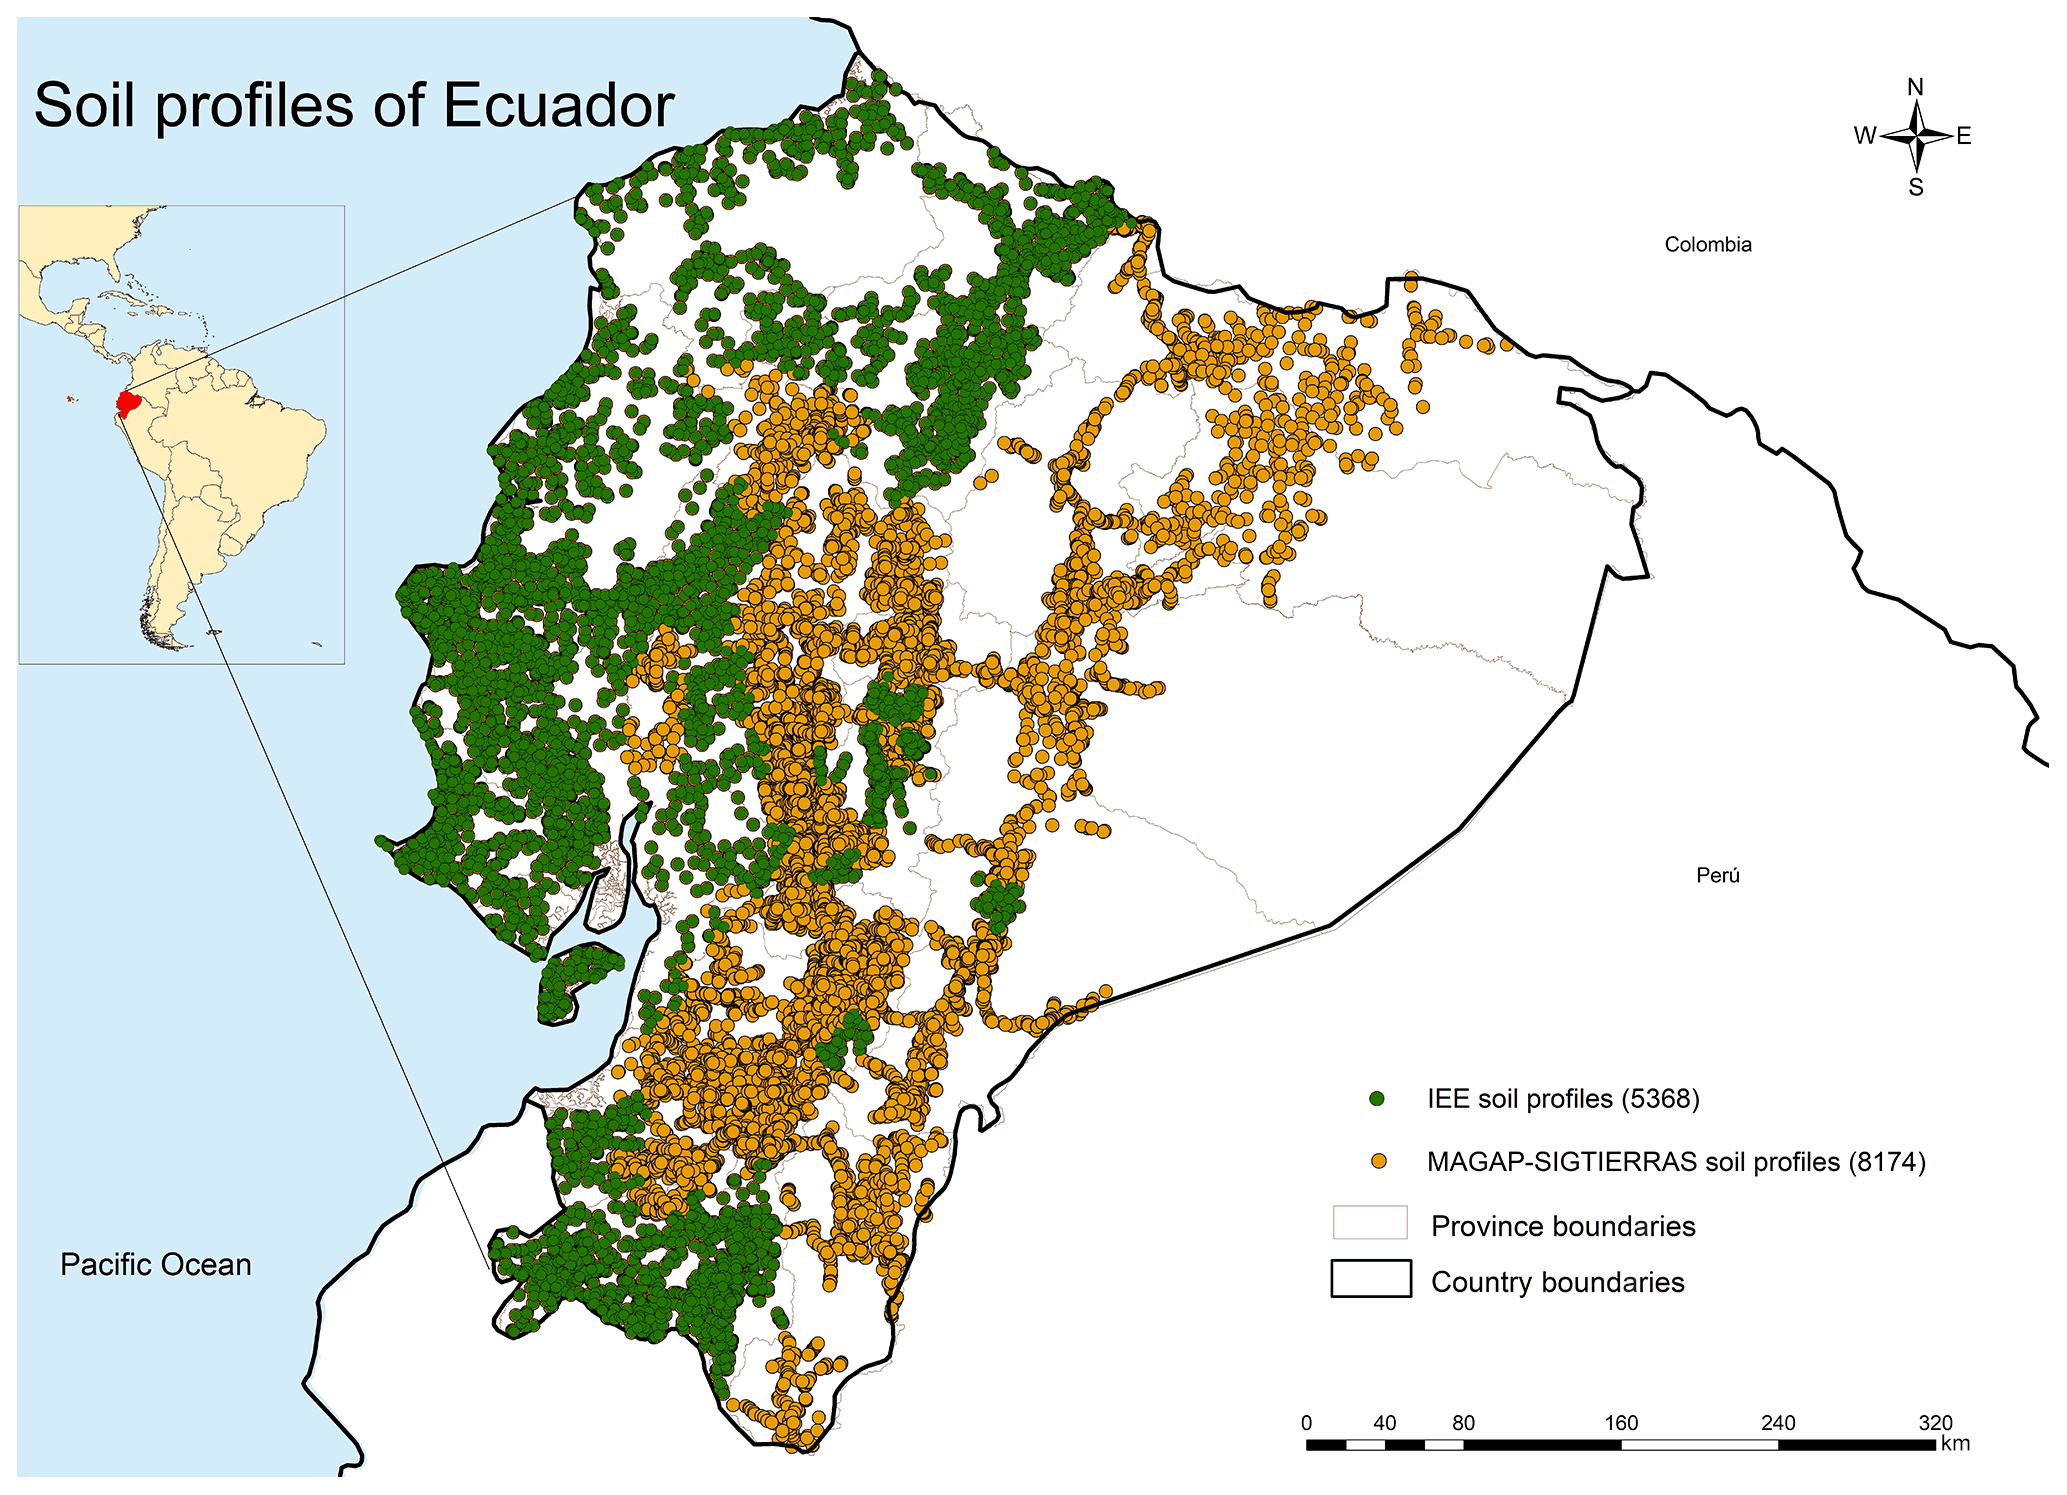
Figure 1Spatial distribution of soil profiles in Ecuador compiled in the HESD.
The original IEE data were available as a collection of portable document format (PDF) files, where each PDF represented one soil profile containing morphological and analytical information. In contrast, soil morphological and analytical information from MAGAP-SIGTIERRAS was stored in different files in PDF format. We unified the information from IEE and MAGAP-SIGTIERRAS into one harmonized database (Fig. 2) using a unique field: the profile identifier (ID_PER). Given the size of the database, manual extraction of the original information was not feasible. Therefore, we developed an automated workflow using two programming languages Python and R, to optimize data extraction of soil data and information from the original-format datasets.
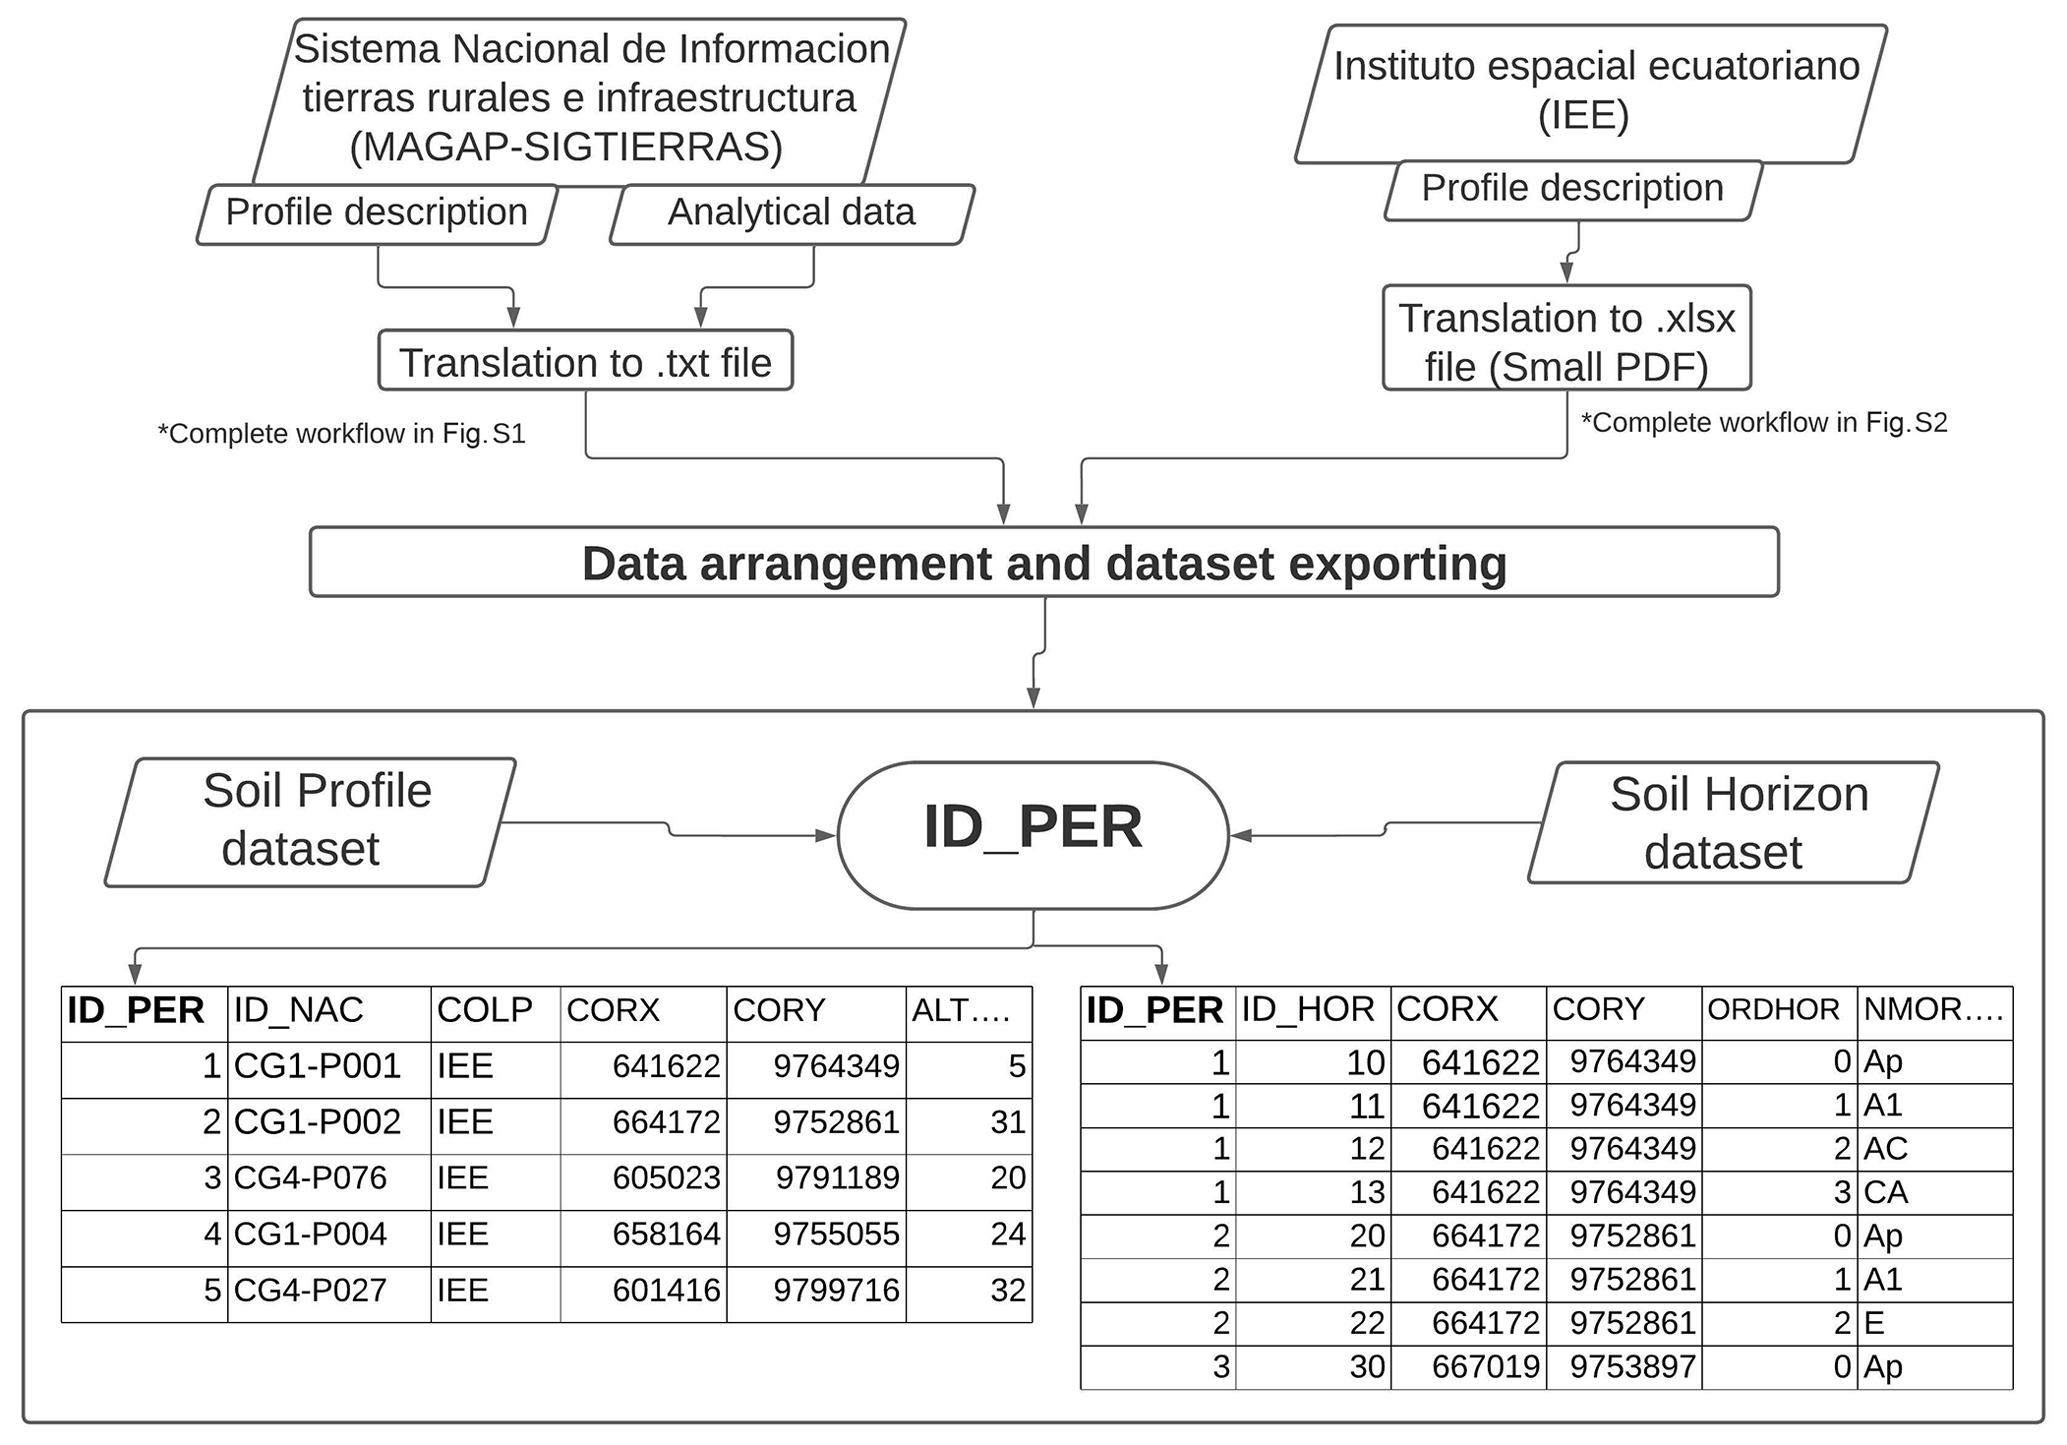
Figure 2Overview of the workflow for extracting data and structure database harmonization. The following abbreviations are used in the figure: ID_PER – profile identifier, ID_NAC – profile identifier in the provenance collection, COLP – source project, CORX – longitude coordinates, CORY – latitude coordinates, ALT – altitude, ID_HOR – horizon identifier, ORDHOR – horizon number, and HMOR – morphological horizon.
2.1 Extracting data from PDF files
Each available soil profile was divided into two groups depending on its original source (i.e., IEE or MAGAP-SIGTIERRAS). Specialized data handling libraries, such as pandas (McKinney, 2011), openpyxl (Python Software Foundation, 2010), or PDF-Tools (Tracker Software Products, 2011), were used to automate this task. The first step to extract data was to convert the information from PDF format to a data format such as .xlsx or .txt. The data extracted contained categorical information about the profile morphological description and tabular information with chemical and physical properties for each available soil horizon. The target information extracted for MAGAP-SIGTIERRAS or IEE was organized using the pandas Python library and exported to the Harmonized Soil Database of Ecuador (HESD).
Data from MAGAP-SIGTIERRAS presented a homogeneous structure which simplified data extraction. The structure from the IEE information presented many irregularities that varied across the collection. Irregularities included the following: the number of fields and variables in the tables, table headers, and differences in categorical or descriptive fields. The heterogeneity of the structure in MAGAP-SIGTIERRAS and IEE hindered the design of a homogeneous extraction methodology; therefore, we applied two approaches, as explained below.
2.1.1 The MAGAP-SIGTIERRAS approach
The homogeneous structure of the MAGAP-SIGTIERRAS dataset allowed for the development of a methodological approach based on regular expression queries. Each query sought a target variable or information contained in the text.
First, all files from MAGAP-SIGTIERRAS were stored in a specific directory. Then, iteratively, each file was converted into a .txt file, preserving the format of the tables, using the pdftools R package (Ooms, 2022). Once the files were converted, regular expressions were applied over the text to extract the key variables; to perform this process, in-house scripts were used that required adaptation depending on the structure of the original database (Supplement A). The regular-expression-based queries were imported in a data frame that held the information for a single file. Next, the resulting data frame was appended to a target data frame (i.e., final data frame) that contained all of the processed information from all available files. Once all of the files were processed, the final data frame was converted to a .csv file.
2.1.2 The IEE approach
Here, we aimed to convert the information stored in the PDF (text and tables) to .xlsx format, where each sheet contained the text blocks or tables of the original PDF document. Our only option to extract the information with this format was the open-access program Smallpdf v 0.19.1. In this way, each sheet corresponded to the description of a group of morphological, chemical, or physical soil properties.
The conversion was not always successful due to inconsistencies among datasets. Example of inconsistencies are merged rows, joint characters inside the variable descriptions, inconsistent labeling of the tables, or a different number of tables per file. Therefore, a Python 3.10.2 script was generated to overcome these difficulties and successfully extract the data. The goal was to read the .xlsx files and transfer the information into another file whose tables were designed with the target structure of the HESD (see Supplement D).
The rationale of the script was to generate a data frame for every sheet in an .xlsx file, where each sheet corresponds to a table with a chemical or physical description for a soil profile. After creating a data frame for each table, all of the data frames were merged in a standard data frame for the .xlsx file; finally, the file data frame was appended to a general data frame that contained the information for all of the .xlsx files. The files were then converted to a .csv format for the next phase of correction and harmonization. Scripts and diagrams explaining the methodology used for each case can be found in the Supplement (see Supplement B, D).
2.2 Soil data correction and harmonization
All of the data obtained from the original sources went through a manual review process by an expert pedologist to minimize the data extraction errors and provide a curated harmonized dataset. Once the original databases were merged, the two subsets of the final database (profile information subset and horizon information subset) were manually revised a second time by the expert to detect any potential errors and inconsistencies. All fields in the database were checked using basic descriptive statistics, such as minimum, maximum, average, and standard deviation values, to verify the consistency of the data and the soil properties (e.g., pH range and ratio). In some fields, it was necessary to make changes in the units of measurements in the harmonization tasks, either by standardizing the original datasets (i.e., IEE and MAGAP-SIGTIERRAS) or by converting all units to the International System of Units. The organic carbon (CO), organic matter (MO), and total nitrogen (NTOT) variables were transformed to grams per kilogram (g kg−1). The level of precision in the expression of each variable was standardized (maximum of two significant figures). Finally, some errors were found and corrected, such as duplicated information, missing data, errors in the information's agreement with the horizon, and formatting typos.
Special attention was paid to the quantitative information of the analytical variables, for which the frequency histograms were plotted to identify outliers or physical inconsistencies, such as excessively low pH values (i.e., <3), extremely high C / N ratios (i.e., >35), or zero-value assignment in unrealized determinations. All inconsistencies that could not be resolved were reclassified as “without data”.
The HESD contains information from 13 542 soil profiles with over 51 713 measured soil horizons, including 92 different edaphic variables. With over 4.7 million records that include numeric (e.g., clay content, organic material, and soil pH) and class soil properties (e.g., horizon designation and geology), the HESD represents the most complete data compilation for mainland Ecuador.
The structure of the database is based on the Soil Organic Carbon Mapping Cookbook (FAO, 2018) and represents a complete soil data compilation for Ecuador, considering the effective soil depth (ESD). The ESD considers the solum, which includes the surface and subsurface horizons with presence of roots and biological activity (Soil Survey Staff, 1975), of the soil profile. Given the impossibility of designing a single structure for coupling the profile and the soil horizons' information, the data were divided into two datasets linked by a unique identifier. Thus, the use of a relational database can easily be queried and augmented for future synthesis studies.
Table 1The HESD profile variable names, codes, descriptions, and units.

a USDA soil taxonomy (ST) developed by the United States Department of Agriculture and the National Cooperative Soil Survey (Soil Survey Staff, 1999). b Guidelines for soil description 4th edition, Food and Agriculture Organization (FAO) of the United Nations, Rome, 2006 (Food and Agriculture Organization of the United Nations, 2006).
Table 2The HESD horizon coding conventions and soils property names, units of measurement, and descriptions.

a Guidelines for soil description 4th edition, Food and Agriculture Organization (FAO) of the United Nations, Rome, 2006 (Food and Agriculture Organization of the United Nations, 2006). b The USDA system classifies soils into 12 soil texture classes.
The common identifier linking these dataset tables is the ID_PER field, which records the unique name assigned to the database. Both files (.csv) can easily be imported into statistical software such as R, after which they can be joined using the unique ID_PER. The first dataset contains information associated with the soil profile and its environmental characteristics (Table 1). It shows the variables in the profile dataset, with the soil profile information (e.g., classification, humidity and temperature regime, rockiness, and adequate depth) and the site-level data containing the environmental information (forming factors): landscape attributes, land cover type, slope.
The second dataset contains information associated with the soil profiles, divided into horizons and including qualitative and quantitative information. The dataset contains morphological information such as the designation or depth of the soil horizon, the presence or absence of roots, and the abundance of rock fragments. In addition, there are more than 30 variables related to soil physical properties (e.g., texture bulk density) and chemical properties (Table 2). We highlight that there is information regarding the soil organic fraction, the cation exchange capacity, the electrical conductivity and sodium exchange capacity, and the soil properties (e.g., soil drainage and soil tilth), which is relevant for the evaluation of soil health (USDA, 2022).
We performed an exploratory analysis of some variables included in the HESD as an example of its usability. Soil variables behave differently when the soil depth increases, and Fig. 3 shows examples of soil property–depth relationships (for organic carbon, pH, soil electrical conductivity, electrical conductivity in water total clay, soil cation exchange capacity – CIC, and soil profile of effective depth – PRES). For example, organic carbon has higher values at the surface and gradually decreases as soil depth increases. In contrast, pH ranges between 6 and 7 with an average of ∼6.5, and this value is maintained as soil depth increases. That said, we provide examples on how different soil properties vary as soil depth increases (Fig. 3).

Figure 3Variation in the concentration of soil variables with respect to depth (cm): (a) profile average of organic carbon (CO); (b) profile average of pH H2O; (c) profile average of electric conductivity in water (CEAQ); (d) profile average of electric conductivity in water total clay (ARCILLA); (e) profile average of the cation exchange capacity (CIC); and (f) profile average of the effective depth (PRES). The blue area represents the range of variation in the properties.
Table 3Statistical analysis of key variables in the HESD. The two most nationally representative types of ecosystems were selected: cropland (9675 data points) and forest (3694 data points).
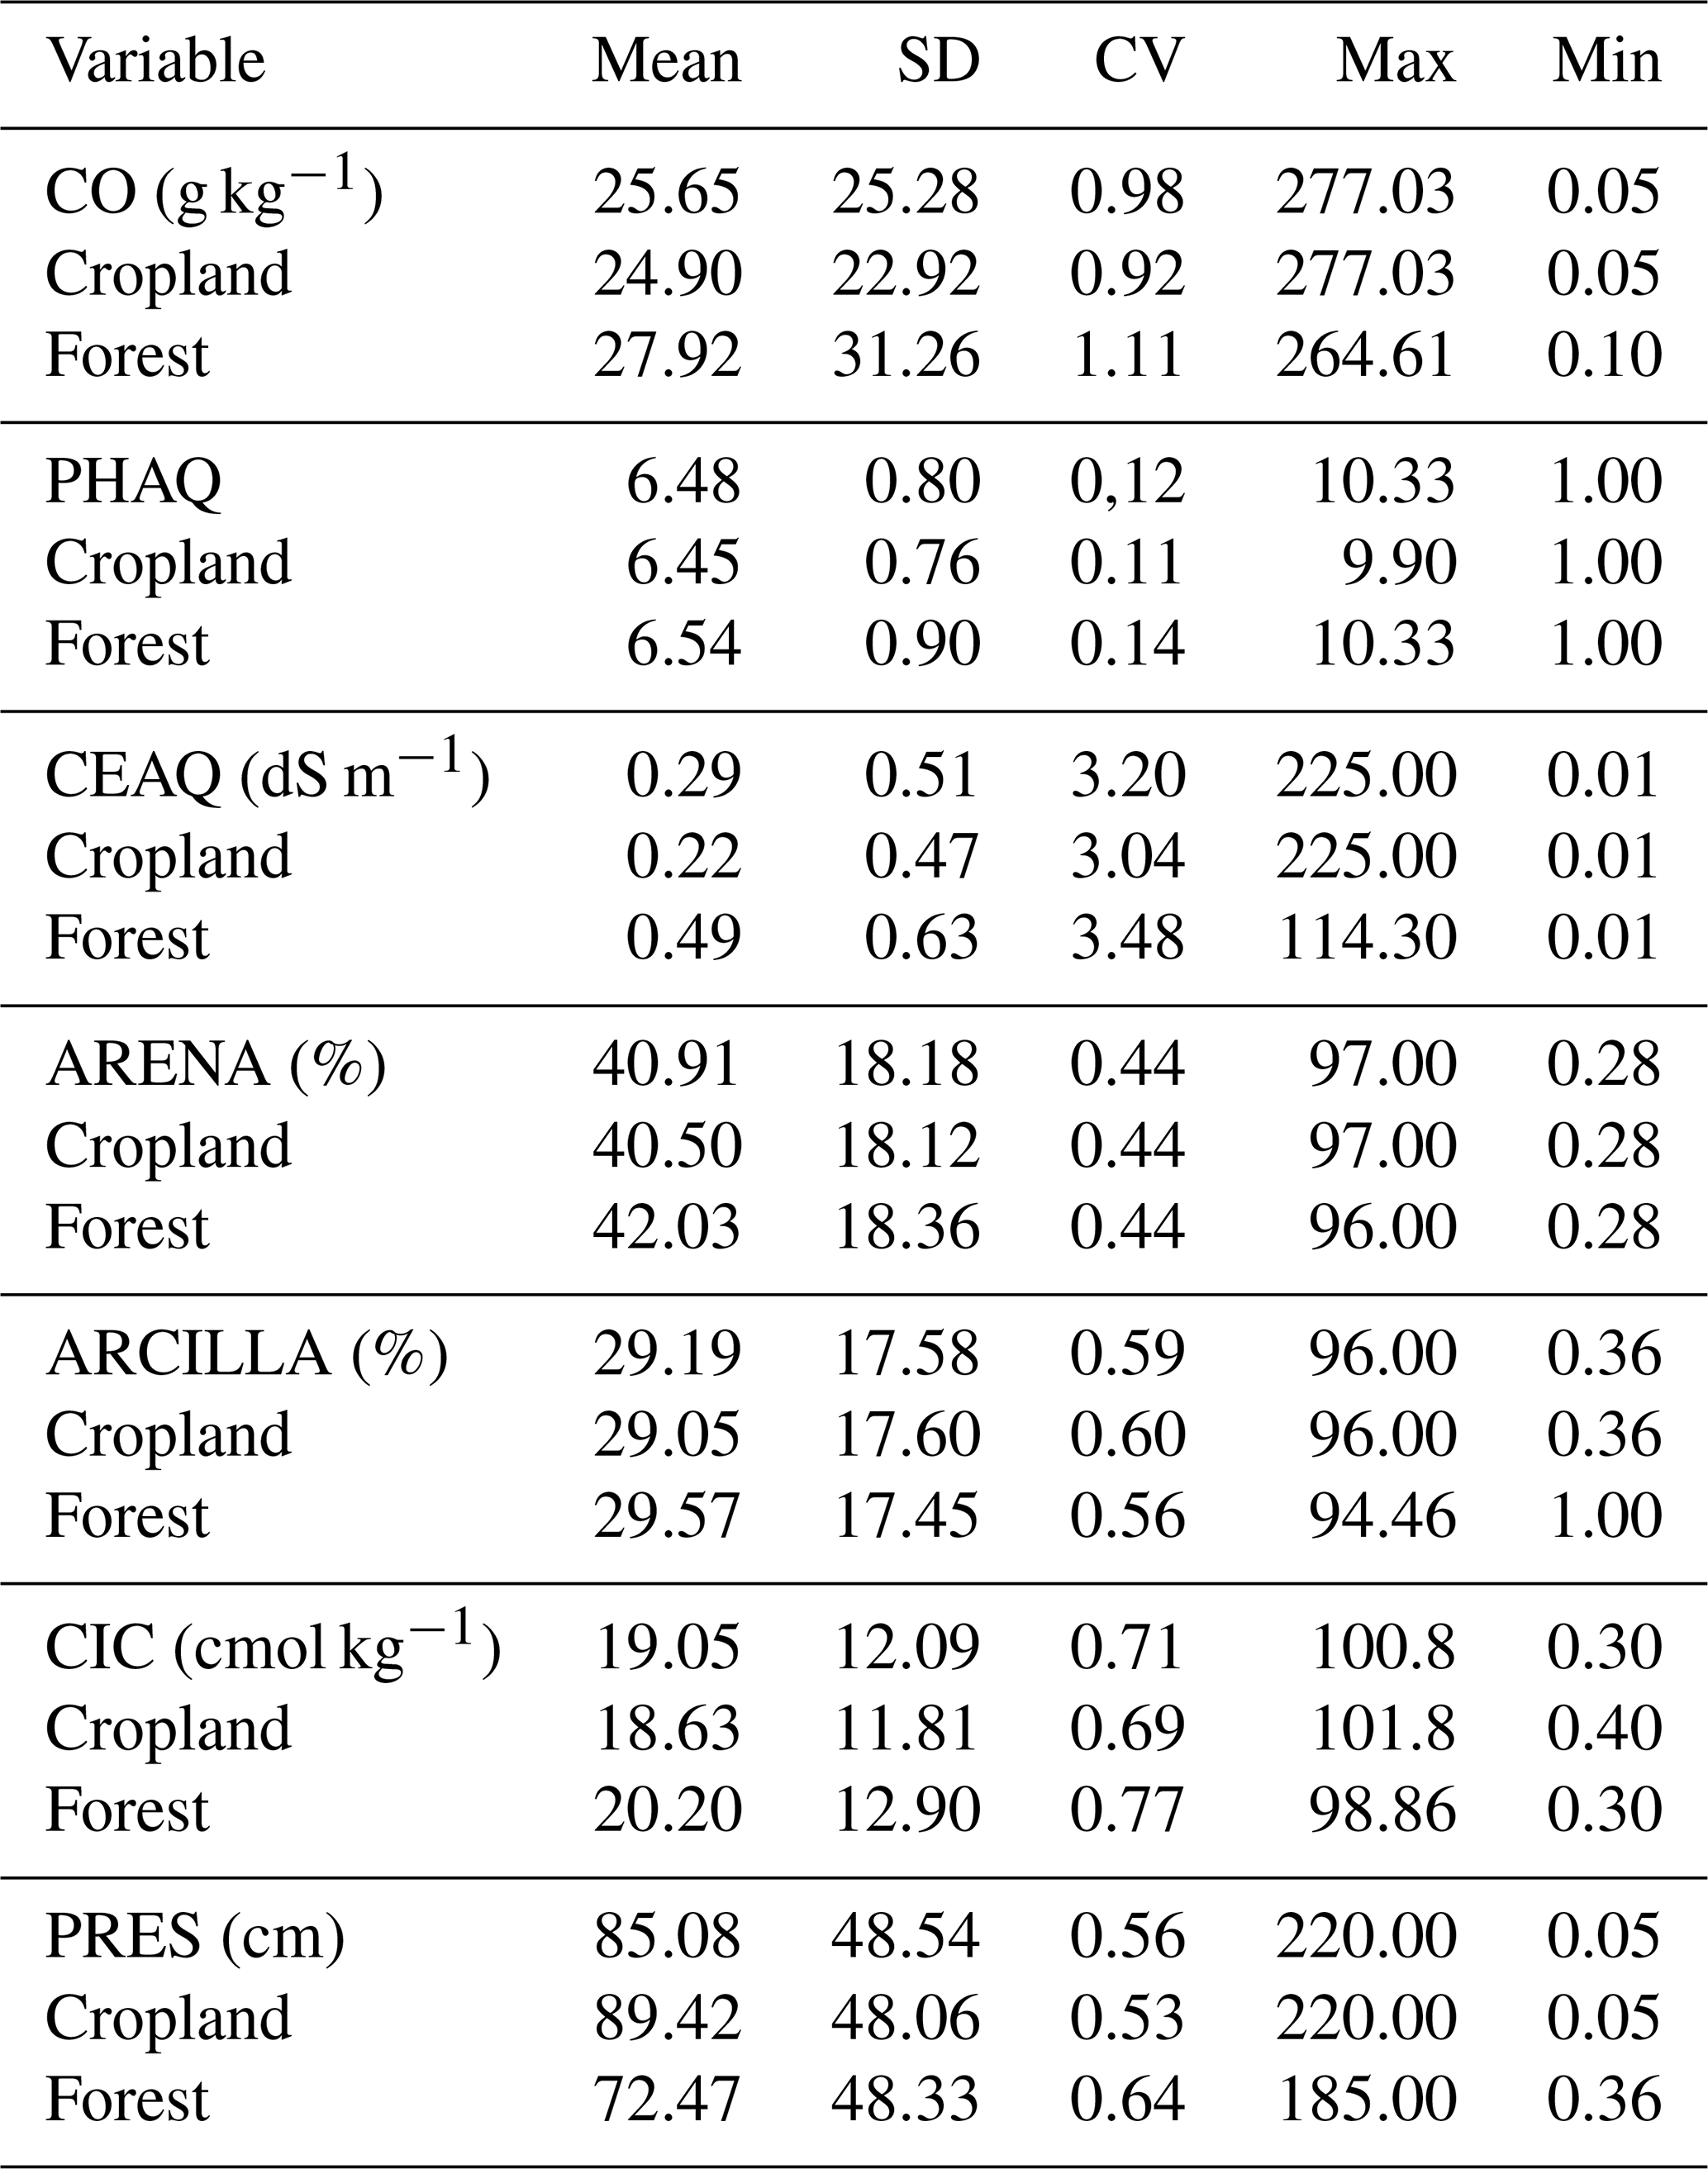
The abbreviations used in the table are as follows: CO – organic carbon, PHAQ – pH H2O, CEAQ – electric conductivity in water, ARENA – sand total, ARCILLA – clay total, CIC – cation exchange capacity, and PRES – effective depth. SD denotes standard deviation, and CV is the coefficient of variation.
Information in the HESD can be used to evaluate how land use and management could affect soil properties (Beillouin et al., 2022). Table 3 shows the results of the statistical analysis of different variables within two different ecosystems: cropland and forest. Although the HESD presents the most complete information at the national level, we recognize that there are still information gaps. The two original projects from which the soil information was extracted were focused on agricultural areas; therefore, the HESD does not represent all ecosystems across Ecuador equally. For example, the HESD has 9675 soil profile descriptions for cropland and only 3694 for forest. These two are the most representative ecosystems at the national level. We highlight that forest ecosystems show evidence of higher SOC (27.9 g kg−1) than cropland ecosystems (24 g kg−1). Thus, forest ecosystems have a higher concentration of carbon but are not always well represented in the national database.
Two different analyses carried out with the HESD: one focused on the representativeness of the data within the different biogeographical sectors and one focused on the probability of the spatial representativeness at the national level. To undertake these analyses, we used the maximum entropy approach (Maxent program; Phillips et al., 2020), which has been applied to assess the spatial representativeness of environmental observatory networks (Villarreal et al., 2019, 2018).
5.1 Representativeness index of Ecuadorian biogeographic sectors
The first analysis to test the representativeness was done considering the 15 biogeographic sectors of Ecuador (Fig. 4). We clarify that each biogeographic sector represents a group of plant communities that share flora affinity at at least the genus level and mainly at the species level; thus, these sectors define homogeneous environmental units (Ministerio de Ambiente del Ecuador, 2013).

Figure 4Map of the biogeographic sectors of Ecuador, extracted from the “Sistema de clasificación de Ecosistemas del Ecuador Continental” (Ministerio de Ambiente del Ecuador, 2013).
We calculated the representativeness index for each sector based on the number of data points divided by the total coverage percentage of each biogeographic sector. Based on this calculation, the higher the representativeness index, the better represented it is in the database (Pfeiffer et al., 2020). Table 4 shows the data points compiled in this work, by region, province, biogeographic sector, and the representativeness index for each biogeographic sector.
Table 4Distribution of SOC data points per ecosystem sector (vegetation formation) according to the Ministerio del Ambiente del Ecuador (2013).
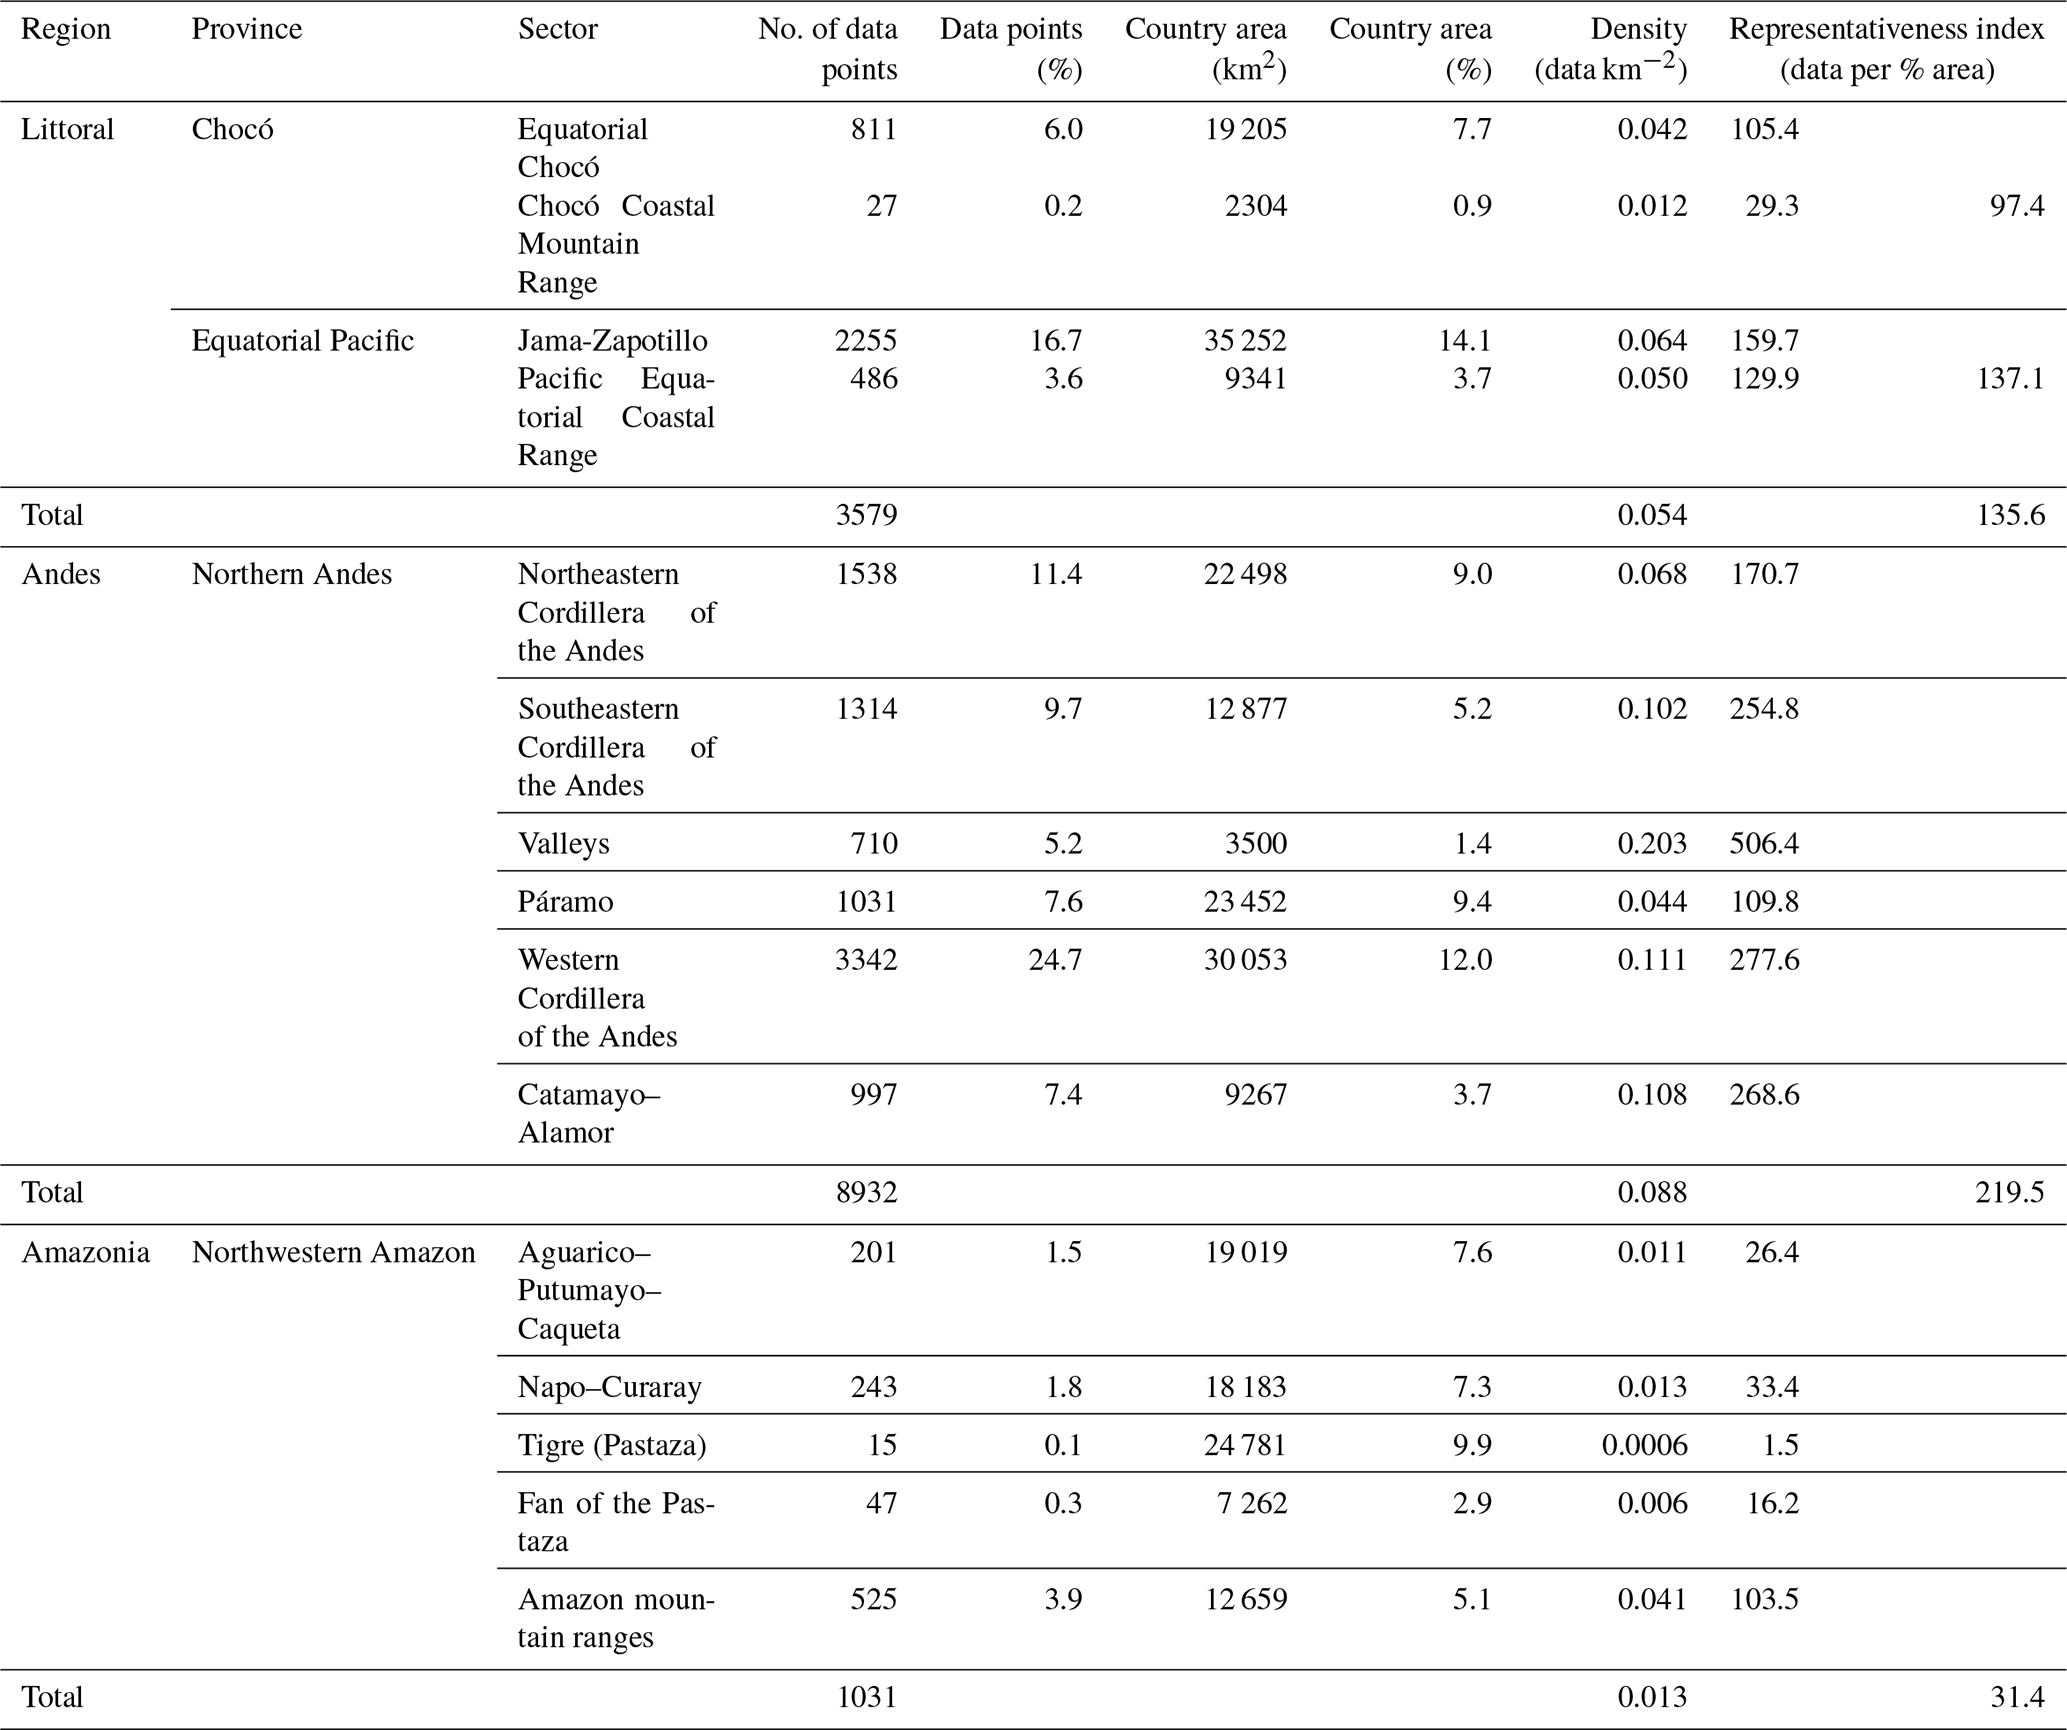
The biogeographic sector with the highest representativeness index is Western Cordillera of the Andes with 24.7 %, followed by Jama-Zapotillo (16.7 %), Northeastern Cordillera of the Andes (11.4 %), Southeastern Cordillera of the Andes (9.7 %), and Páramo (7.6 %) (Table 4). These areas are found mainly in the western part of Ecuador. The last four biogeographic sectors are grouped in what we call the “Northern Andes” province in the Andes region. In Ecuador, this zone encompasses the Andes mountain range that extends from north to south (Clapperton, 1993). In terms of SOC, these regions present the highest mean values (27.8 g kg−1).
The Andes, in the biogeographic sector of Páramo, has a mean SOC of 45 g kg−1. This sector is distributed in a valley and is almost uninterrupted over the forest line of the eastern and western mountain ranges of the Andes (Hofstede, 1999) around 3700–3400 m.a.s.l. This biogeographic sector occupies 23 452 km2 (9.4 % of the national territory) (Table 4) and is probably the largest soil carbon reservoir in Ecuador. Despite the importance of Páramo as a large pool of SOC, its representativeness index is not as high as we expected (109.8). This is probably because a large part of the region is within some of the national protected areas, which are zones that were not considered by the original projects.
Most of the data are concentrated in the southwestern part of the country. In contrast, no soil data are available for the eastern section of the country, mainly in the Amazonian region (representativeness index of 31.4), but the mean carbon concentration (17.7 g kg−1) in this region is higher than the littoral region (3579 observations, 15.5 g kg−1 SOC). This may be because the organic soil layer of the tropical forest is no deeper than 10 cm, limiting carbon accumulation in soil, and the decomposition of the litter is so rapid that the plant material reaching the soil surface is, in most cases, oxidized before it can be incorporated into the soil matrix (Hofstede, 1999).
5.2 Spatial representativeness using the Maxent approach
The second analysis carried out was performed using the Maxent approach (Yackulic et al., 2012). This analysis provides an estimate (with most values between zero and one) that can be interpreted as the probability of presence or the probability of an area being represented by the spatial information included in the HESD. This analysis allowed us to compare the spatial representativeness of the HESD with the soil information currently available in WoSIS (Batjes et al., 2020), and we demonstrate that the HESD contributes to filling the spatial soil information gaps across Ecuador, particularly across the coast and in the highlands (as shown in Fig. 5). As evidenced in Table 4, there are areas not yet fully represented with available data in the HESD, such as in the eastern part of the country (Amazonia) and in a part of the Esmeralda Province (northwest), but a greater representativeness is evident with the HESD compared with that of the current WoSIS database.
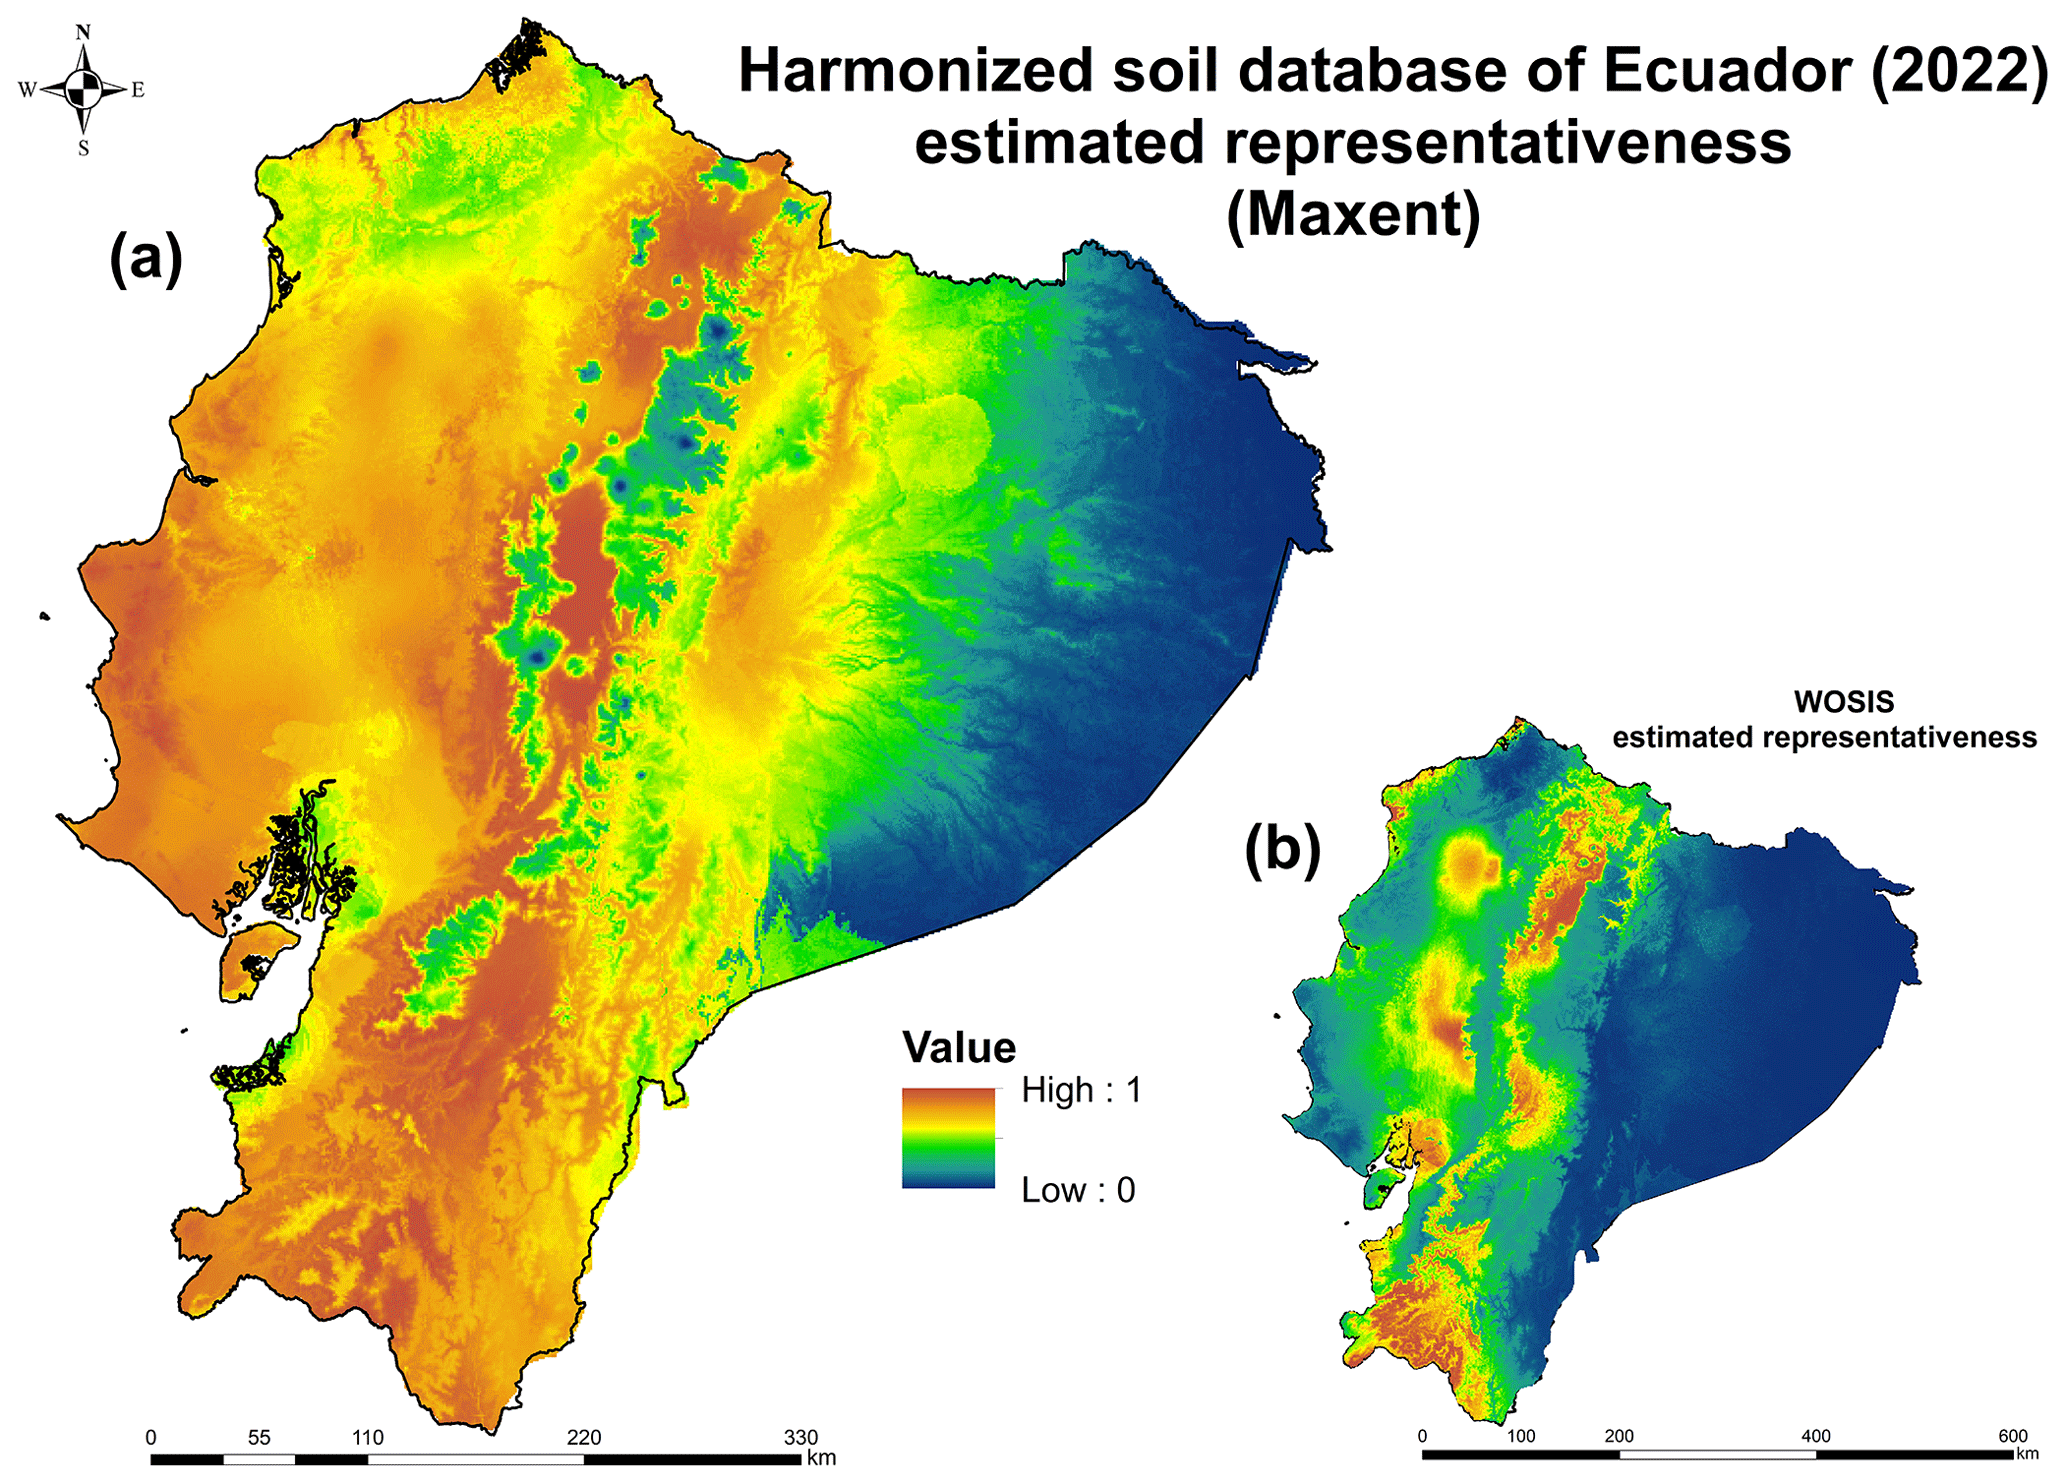
Figure 5(a) National representativeness (an estimate between zero and one of the probability of the presence) of soil information using the HESD. (b) Information available on the national representativeness of soil information from the World Soil Information Service (WoSIS).
The HESD shows a clustered distribution, with some areas better represented than others, due to the methodology used in the original projects that was biased to cropland areas (Table 4). We highlight that the original soil collection efforts (i.e., IEE and MAGAP-SIGTIERRAS) were not focused on biogeographical sectors, rather on populated areas or areas designated for agriculture, and did not consider protected areas. Other regions that are not fully represented in the HESD are the Chocó Coastal Mountain Range sector (29.3 %, coastal region) and all sectors in the Amazon region (Fig. 5, Table 4). We propose that the HESD can be updated as updated soil data become available (at the local to national level to gradually fill soil spatial information gaps and better represent the entire geographical range of Ecuador's territory.
The HESD is available at https://doi.org/10.6073/pasta/1560e803953c839e7aedef78ff7 d3f6c (Armas et al., 2022). The user will find two datasets (.csv files) that have a unique identifier (ID-PER) to link the profile information to the information of each horizon. Geographical coordinates are UTM WGS84 zone 17S (+proj=UTM +zone=17 +south +datum=WGS84 +units=m +no_defs+type=crs).
The HESD aims to increase the quantity, quality, and accessability of soil information across Ecuador and the Latin American region. The HESD facilitates the exchange and use of soil data collected within the context of collaborative efforts at different scales (global, national, and local). Globally, the HESD has the structure to be considered for use in different international projects, including the Global Soil Organic Carbon Map (GSOCmap), a project of FAO the Global Soil Partnership (GSP), and the GlobalSoilMap.Net project.
The proposed methodology demonstrates the possibility of transforming soil information that has previously been stored in formats that are not easily accessible for data analysis (e.g., in PDFs or scanned paper sheets) into usable formats for soil spatial variability studies at the regional to the national scale. We propose a systematic method for the organization of national soil information to reduce errors when generating new data in the future (Yigini et al., 2018; Baritz et al., 2008). We have substantially improved the publicly available spatial representation of soil information in Ecuador to support current soil information initiatives such as the WoSIS (Batjes et al., 2020), the GlobalSoilMap.Net project, and the FAO Global Soil Partnership, thereby increasing access to soil information across the world. The HESD includes information on more than 70 edaphic properties for Ecuadorian soils. It is evident that data gaps exist in certain areas, and there is a need to incentivize future soil survey programs to increase the sampling in underrepresented areas. The HESD could support the generation of new soil-related knowledge which could help to assess food production challenges, threats to soil security and soil health, climate change mitigation, and land degradation.
The supplement related to this article is available online at: https://doi.org/10.5194/essd-15-431-2023-supplement.
DA, MG, and CO conceptualized the study and developed the methodology. FB and PD developed the code and scripts to extract the soil information. RV and VO were responsible for writing, reviewing, and editing the manuscript. WJ helped with the original resources. CO was responsible for funding acquisition, DA prepared the manuscript with contributions from all co-authors.
The contact author has declared that none of the authors has any competing interests.
Publisher's note: Copernicus Publications remains neutral with regard to jurisdictional claims in published maps and institutional affiliations.
This work has been carried out within the framework of the “Desarrollo metodológico para la elaboración de un Sistema de Información de Suelos Global, y modelización de propiedades edáficas de interés ambiental y agronómico” project, financed by the AACID (grant no. 2017DEC003)/Junta de Andalucía. Mario Guevara acknowledges financial support from UNESCO-IGCP-IUGS (grant no. 765), UNAM-PAPIIT (grant no. IA204522), and USDA-NIFA-AFRI (grant no. 2019-67022-29696). Rodrigo Vargas acknowledges support from the NASA Carbon Monitoring System (grant no. 80NSSC21K0964).
This work has been carried out within the framework of the “Desarrollo metodológico para la elaboración de un Sistema de Información de Suelos Global, y modelización de propiedades edáficas de interés ambiental y agronómico” project, financed by the AACID (grant no. 2017DEC003)/Junta de Andalucía. Mario Guevara received support via the following grants: UNESCO-IGCP-IUGS, 2022 (grant no. 765); UNAM-PAPIIT, 2021 (grant no. IA204522); and USDA-NIFA-AFRI, USA, 2019 (grant no. 2019-67022-29696). Rodrigo Vargas received support from the NASA Carbon Monitoring System (grant no. 80NSSC21K0964).
This paper was edited by Giulio G. R. Iovine and reviewed by three anonymous referees.
Armas, D. I., Guevara, M., Bezares, F., Vargas, R., Durante, P., Osorio, V. H., Jimenez, W. A., and Oyonarte, C.: Harmonized Soil Database of Ecuador 2021 ver. 3, Environmental Data Initiative, https://doi.org/10.6073/pasta/1560e803953c839e7aedef78ff7d3 f6c, 2022.
Arrouays, D., Leenars, J., Richer-De-Forges, A., Adhikari, K., Ballabio, C., Greve, M., Grundy, M., Guerrero, E., Hempel, J., Hengl, T., Heuvelink, G., Batjes, N., Carvalho, E., Hartemink, A., Hewitt, A., Hong, S., Krasilnikov, P., Lagacherie, P., Lelyk, G., Libohova, Z., Lilly, A., Mckenzie, N., Mcbratney, A., Vasquez, G., Mulder, V., Minasny, B., Montanarella, L., Odeh, I., Padarian, J., Poggio, L., Roudier, P., Saby, N., Savin, I., Searle, R., Stolbovoy, V., Thompson, J., Smith, S., Sulaeman, Y., Vintila, R., Viscarra Rossel, R., Wilson, P., Zhang, G., Swerts, M., Oorts, K., Karklins, A., Feng, L., Ibelles Navarro, A., Levin, A., Laktionova, T., Dell`acqua, M., Suvannang, N., Ruam, W., Prasad, J., Patil, N., Husnjak, S., Pásztor, L., Okx, J., Hallett, S., Keay, C., Farewell, T., Lilja, H., Juilleret, J., Marx, S., Takata, Y., Kazuyuki, Y., Mansuy, N., Panagos, P., Van Liedekerke, M., Skalsky, R., Sobocka, J., Kobza, J., Eftekhari, K., Alavipanah, S., Moussadek, R., Badraoui, M., Da Silva, M., Paterson, G., Gonçalves, M., Theocharopoulos, S., Yemefack, M., Tedou, S., Vrscaj, B., Grob, U., Kozak, J., Boruvka, L., Dobos, E., Taboada, M., Moretti, L., and Rodriguez, D.: Soil legacy data rescue via GlobalSoilMap and other international and national initiatives, GEORESJ, 14, 1–19, https://doi.org/10.1016/j.grj.2017.06.001, 2017.
Arrouays, D., Richer de Forges, A., Mcbratney, A., Minasny, B., Savin, I., Grundy, M., Leenaars, J. G. B., Poggio, L., Roudier, P., Libohova, Z., McKenzie, N., van den Bosch, H., Kempen, B., Mulder, V. L., Lacoste, M., Chen, S., Saby, N., Martin, M., and Lagacherie, P.: The globalsoilmap project: past, present, future, and national examples from France, Dokuchaev Soil Bulletin, 3–23, https://doi.org/10.19047/0136-1694-2018-95-3-23, 2018.
Baritz, R., Eberhardt, E., Van Liedekerke, M. H., and Panagos, P. (Eds.): Environmental Assessment of Soil for Monitoring: Volume III Database Design and Selection, EUR 23490 EN/3, Office for the Official Publications of the European Communities, Luxembourg, 125 pp., https://doi.org/10.2788/93697, 2008.
Batjes, N. H., Ribeiro, E., and van Oostrum, A.: Standardised soil profile data to support global mapping and modelling (WoSIS snapshot 2019), Earth Syst. Sci. Data, 12, 299–320, https://doi.org/10.5194/essd-12-299-2020, 2020.
Beillouin, D., Demenois, J., Cardinael, R., Berre, D., Corbeels, M., Fallot, A., Boyer A., and Feder, F.: A global database of land management, land-use change and climate change effects on soil organic carbon, Sci Data, 9, 228, https://doi.org/10.1038/s41597-022-01318-1, 2022.
Clapperton, C. M.: Quaternary Geology and Geomorphology of South America, Geomorphology, 11, 347–349, https://doi.org/10.1016/0169-555X(95)90014-K, 795.
CLIRSEN: Gestión de datos edáficos en la cuenca baja del rio Guayas con la implementación de un sistema de administración de geoinformación, SAG, http://www.cepeige.org/wp-content/uploads/2018/05/6Sistema-de-Geoinformacion.pdf (last access: 9 January 2022), 2015.
Díaz-Guadarrama, S., Lizarazo, I., Guevara, M., Angelini, M., Araujo-Carrillo, G. A., Argeñal, J., Armas, D., Balta, R. A., Bolivar, A., Bustamante, N., Dart, R. O., Dell Aqua, M., Encina, A., Figueredo, H., Fontes, F., Gutiérrez-Diaz, J. S., Jiménez, W., Lavado, R. S., Mansilla-Baca, J. F., Mendonça-Santos, M. D. L., Moretti, L. M., Muñoz, I. D., Olivera, C., Olmedo, G., Omuto, C., Ortiz, S., Pascale, C., Pfeiffer, M., Ramos, I. A., Ríos, D., Rivera, R., Rodríguez, L. M., Rodríguez, D. M., Rosales, A., Rosales, K., Schulz, G., Sevilla, V., Tenti, L. M., Vargas, R., Varón-Ramírez, V. M., Vasques, G. M., Yigini, Y., and Rubiano, Y.: Improving Latin American Soil Information Database for Digital Soil Mapping enhances its usability and scalability, Earth Syst. Sci. Data Discuss. [preprint], https://doi.org/10.5194/essd-2022-291, in review, 2022.
FAO, Food and Agriculture Organization: Status of the World's Soil Resources (SWSR) – Main Report, Food and Agriculture Organization of the United Nations and Intergovernmental Technical Panel on Soils, Rome, Italy, 648 pp., 2015.
FAO, Food and Agriculture Organization: Soil Organic Carbon Mapping Cookbook 2nd edn., Rome, Italy, edited by: Yigini, Y., Olmedo, G. F., Reiter, S., Baritz, R., Viatkin, K., and Vargas, R. R., https://www.fao.org/3/bs901e/bs901e.pdf (last access: 9 January 2022), 2018.
FAO, Food and Agriculture Organization of the United Nations: Guidelines for soil description, 4th edn., Rome, 67–71, 2006.
FAO and ITPS: Status of the World's Soil Resources (SWSR) – Main Report, Food and Agriculture Organization of the United Nations and Intergovernmental Technical Panel on Soils, Rome, Italy, edited by: Montanarella, L., Chude, V., Yagi, K., Krasilnikov, P., Kazem Alavi Panah, S., Mendonça-Santos, M. L., Pennock, D., and McKenzie N., https://www.fao.org/documents/card/en/c/c6814873-efc3-41db-b7d3-2081a10ede50/ (last access: 9 January 2022), 2015.
FAO/IIASA/ISRIC/ISS-CAS/JRC: Harmonized World Soil Database (version 1.1), FAO, Rome, Italy and IIASA, Laxenburg, Austria, 2009.
Gray, J. M., Bishop, T. F. A., and Yang, X.: Pragmatic models for prediction and digital mapping of soil properties in eastern Australia, Soil Res., 53, 24–42, https://doi.org/10.1071/SR13306, 2015.
Guerrero, E., Pérez, A., Arroyo, C., Equihua, J., and Guevara, M.: Building a national framework for pedometric mapping: soil depth as an example for Mexico, edited by: Arrouays, D., McKenzie, N. J., Hempel, J. W., Richer de Forges, A. C., and McBratney, A. B., GlobalSoilMap: basis of the global soil information system, Taylor & Francis, CRC press, Oxon, 103–108, https://doi.org/10.1016/j.grj.2017.06.001, 2014.
Hengl, T., de Jesus, J. M., MacMillan, R. A., Batjes, N. H., Heuvelink, G. B., Ribeiro, E., Samuel-Rosa, A., Kempen, B., Leenaars, J. G., Walsh, M. G., and Ruiperez Gonzalez, M.: SoilGrids1km – global soil information based on automated mapping, PloS one, 9, e105992, https://doi.org/10.1371/journal.pone.0105992, 2014.
Hengl, T., Mendes de Jesus, J., Heuvelink, G. B. M., Ruiperez Gonzalez, M., Kilibarda, M., and Blagotić, A.: SoilGrids250m: Global gridded soil information based on machine learning, PLoS ONE, 12, e0169748, https://doi.org/10.1371/journal.pone.0169748, 2017.
Hofstede, R.: El Páramo como espacio para la fijación de carbono atmosférico, in: El Páramo como espacio de mitigación de carbono atmosférico, Serie Páramo 1: Quito, edited by: Medina, G., Mena, P., and Josse, C., GTP/Abya Yala, 7–10, https://www.colombiareservadevida.org/articulos/PMITIGACION.pdf (last access: 9 January 2022), 1999.
Jeroen, O.: Package “pdftools”. Text Extraction, Rendering and Converting of PDF Documents, https://cran.r-project.org/web/packages/pdftools/pdftools.pdf (last access: 9 January 2022), 2022.
Loayza, V., Sevilla, V., Olivera, C., Guevara, M., Olmedo, G., Vargas, R., Oyonarte, C., and Jiménez, W.: Digital mapping of organic carbon in Ecuador soils, Ecosistemas, 29, 1852, https://doi.org/10.7818/ECOS.1852, 2020.
Luo, Y., Ahlström, A., Allison, S. D., Batjes, N. H., Brovkin, V., Carvalhais, N., Chappell, A., Ciais, P., Davidson, E. A., Finzi, A., Georgiou, K., Guenet, B., Hararuk, O., Harden, J. W., He, Y., Hopkins, F., Jiang, L., Koven, C., Jackson, R. B., Jones, C. D., Lara, M. J., Liang, J., McGuire, A. D., Parton, W., Peng, C., Randerson, J. T., Salazar, A., Sierra, C. A., Smith, M. J., Tian, H., Todd-Brown, K. E. O., Torn, M., van Groenigen, K. J., Wang, Y. P., West, T. O., Wei, Y., Wieder, W. R., Xia, J., Xu, X., Xu, X., and Zhou, T.: Toward more realistic projections of soil carbon dynamics by Earth system models, Global Biogeochem. Cy., 30, 40–56, 2016.
McBratney, A., Field, D. J., and Koch, A.: The dimensions of soil security, Geoderma, 213, 203–213, 2014.
McKinney, W.: Pandas: a Foundational Python Library for Data Analysis and Statistics, https://www.researchgate.net/publication/265194455 (last access: 16 January 2023), 2011.
Ministerio de Ambiente del Ecuador: Sistema de Clasificación de los Ecosistemas del Ecuador Continental. Subsecretaría de Patrimonio Natural, Quito, http://ide.ambiente.gob.ec/mapainteractivo/ (last access: 9 January 2022), 2011.
Montanarella, L., Pennock, D. J., McKenzie, N., Badraoui, M., Chude, V., Baptista, I., Mamo, T., Yemefack, M., Singh Aulakh, M., Yagi, K., Young Hong, S., Vijarnsorn, P., Zhang, G.-L., Arrouays, D., Black, H., Krasilnikov, P., Sobocká, J., Alegre, J., Henriquez, C. R., de Lourdes Mendonça-Santos, M., Taboada, M., Espinosa-Victoria, D., AlShankiti, A., AlaviPanah, S. K., Elsheikh, E. A. E. M., Hempel, J., Camps Arbestain, M., Nachtergaele, F., and Vargas, R.: World's soils are under threat, SOIL, 2, 79–82, https://doi.org/10.5194/soil-2-79-2016, 2016.
Nur Syabeera, B. N. A., Firuza, B. M., Safiah, Y. M. Y., Didams, G.: A systematic review of soil erosion control practices on the agricultural land in Asia, Int. Soil Water Conserv. Res., 8, 103–115, https://doi.org/10.1016/j.iswcr.2020.04.001, 2020.
Orgiazzi, A., Ballabio, C., Panagos, P., Jones, A., and Fernández-Ugalde, O.: LUCAS Soil, the largest expandable soil dataset for Europe: a review, Eur. J. Soil Sci., 69, 140–153, https://doi.org/10.1111/ejss.12499, 2018.
Pfeiffer, M., Padarian, J., Osorio, R., Bustamante, N., Olmedo, G. F., Guevara, M., Aburto, F., Albornoz, F., Antilén, M., Araya, E., Arellano, E., Barret, M., Barrera, J., Boeckx, P., Briceño, M., Bunning, S., Cabrol, L., Casanova, M., Cornejo, P., Corradini, F., Curaqueo, G., Doetterl, S., Duran, P., Escudey, M., Espinoza, A., Francke, S., Fuentes, J. P., Fuentes, M., Gajardo, G., García, R., Gallaud, A., Galleguillos, M., Gomez, A., Hidalgo, M., Ivelic-Sáez, J., Mashalaba, L., Matus, F., Meza, F., Mora, M. D. L. L., Mora, J., Muñoz, C., Norambuena, P., Olivera, C., Ovalle, C., Panichini, M., Pauchard, A., Pérez-Quezada, J. F., Radic, S., Ramirez, J., Riveras, N., Ruiz, G., Salazar, O., Salgado, I., Seguel, O., Sepúlveda, M., Sierra, C., Tapia, Y., Tapia, F., Toledo, B., Torrico, J. M., Valle, S., Vargas, R., Wolff, M., and Zagal, E.: CHLSOC: the Chilean Soil Organic Carbon database, a multi-institutional collaborative effort, Earth Syst. Sci. Data, 12, 457–468, https://doi.org/10.5194/essd-12-457-2020, 2020.
Phillips, S., Dudik, M., and Schapire, R.: Maxent software for modeling species niches and distributions (Version 3.4.1), https://biodiversityinformatics.amnh.org/open_source/maxent/ (last access: 9 January 2022), 2020.
Python Software Foundation: Python library openpyxl 3.0.9, https://pypi.org/project/openpyxl (last access: 9 January 2022), 2010.
Rossiter, D. G.: Soil Resources Inventories: Status and Prospects in 2015, in: Digital Soil Mapping across Paradigms, Scales and Boundaries, edited by: Zhang, G. L., Brus, D., Liu, F., Song, X.-D., and Lagacherie, P., Springer, 275–281, https://doi.org/10.1007/978-981-10-0415-5, 2016.
Smith, E., Vargas, R., Guevara, M., Tarin, T., and Pouyat, R.: Spatial variability and uncertainty of soil nitrogen acroos conterminous United States at different depths, Ecosphere, 13, https://doi.org/10.1002/ecs2.4170, 2022.
Soil Survey Staff: Soil Taxonomy. A Basic System of Soil Classification for Making and Interpreting Soil Surveys, U.S.D.A. Agricultural Handbook, 436, 1975.
Soil Survey Staff: Soil taxonomy: A basic system of soil classification for making and interpreting soil surveys, 2nd edn., Natural Resources Conservation Service, U.S. Department of Agriculture Handbook, 436, 1999.
Tracasa-Nipsa: Metodología del estudio Geopedológico, Proyecto de levantamiento de cartografía temática a escala 1:25 000, lotes 1 y 2, http://metadatos.sigtierras.gob.ec/pdf/Metodologia_Geopedologia_16122015.pdf (last access: 9 January 2022), 2015.
Tracker Software Products: PDF-Tools para-Windows, V 9.2.359, https://pdf-tools.softonic.com/ (last access: 9 January 2022), 2011.
USDA (United States Department of Agriculture), Soil Health, https://www.nrcs.usda.gov/wps/portal/nrcs/main/soils/health/ (last access: 9 January 2022), 2022.
Vargas, R., Alcaraz-Segura, D., Birdsey, R., Brunsell, N., Cruz-Gaistardo de Jong Carlos, B., Etchevers, J., Guevara, M., Hayes, D., Johnson, K., Loescher, H., Paz, F., Ryu, Y., Sanchez-Mejia, Z., and Toledo-Gutierrez, K.: Enhancing interoperability to facilitate implementation of REDD+: case study of Mexico, Carbon Management, 8, 57–65, https://doi.org/10.1080/17583004.2017.1285177, 2017.
Villarreal, S., Guevara, M., Alcaraz-Segura, D., Brunsell, N. A., Hayes, D., Loescher, H. W., and Vargas, R.: Ecosystem functional diversity and the representativeness of environmental networks across the conterminous United States, Agric. Forest Meteorol., 262, 423–433, 2018.
Villarreal, S., Guevara, M., Alcaraz-Segura, D., and Vargas, R.: Optimizing an Environmental Observatory Network Design Using Publicly Available Data, J. Geophys. Res.-Biogeo., 124, 1812–1826, 2019.
Yackulic, C., Chandler, R., Zipkin, E., Royle, J., Nichols, J., Campbel, E., and Veran, S.: Presence-only modelling using MAXENT: when can we trust the inferences?, British Ecological Society, 4, 236–243, https://doi.org/10.1111/2041-210x.12004, 2012.
Yigini, Y., Olmedo, G. F., Reiter, S., Baritz, R., Viatkin, K., and Vargas, R. R. (Eds.): Soil Organic Carbon Mapping Cookbook, FAO, Rome, Italy, 2nd edn., http://www.fao.org/documents/card/en/c/I8895EN (last access: 9 January 2022), 2018.
- Abstract
- Introduction
- Materials and methods
- Soil dataset overview
- Exploratory analyses of the HESD
- Spatial distribution and environmental representativeness of the database
- Data availability
- Further considerations
- Author contributions
- Competing interests
- Disclaimer
- Acknowledgements
- Financial support
- Review statement
- References
- Supplement