the Creative Commons Attribution 4.0 License.
the Creative Commons Attribution 4.0 License.
 | 13 Sep 2023
ChinaWheatYield30m: a 30 m annual winter wheat yield dataset from 2016 to 2021 in China
Yu Zhao
Shaoyu Han
Jie Zheng
Hanyu Xue
Zhenhai Li
Yang Meng
Xuguang Li
Xiaodong Yang
Zhenhong Li
Shuhong Cai
Guijun Yang
Generating spatial crop yield information is of great significance for academic research and guiding agricultural policy. Existing public yield datasets have a coarse spatial resolution, spanning from 1 to 43 km. Although these datasets are useful for analyzing large-scale temporal and spatial change in yield, they cannot deal with small-scale spatial heterogeneity, which happens to be the most significant characteristic of the Chinese farmers' economy. Hence, we generated a 30 m Chinese winter wheat yield dataset (ChinaWheatYield30m) for major winter-wheat-producing provinces in China for the period 2016–2021 with a semi-mechanistic model (hierarchical linear model, HLM). The yield prediction model was built by considering the wheat growth status and climatic factors. It can estimate wheat yield with excellent accuracy and low cost using a combination of satellite observations and regional meteorological information (i.e., Landsat 8, Sentinel 2 and ERA5 data from the Google Earth Engine (GEE) platform). The results were validated using in situ measurements and census statistics and indicated a stable performance of the HLM based on calibration datasets across China, with a correlation coefficient (r) of 0.81 and a relative root mean square error (rRMSE) of 12.59 %. With regards to validation, the ChinaWheatYield30m dataset was highly consistent with in situ measurement data and statistical data (p<0.01), indicated by an r (rRMSE) of 0.72** (15.34 %) and 0.69** (19.16 %). The ChinaWheatYield30m is a sophisticated dataset with both high spatial resolution and excellent accuracy; such a dataset will provide basic knowledge of detailed wheat yield distribution, which can be applied for many purposes including crop production modeling and regional climate evaluation. The ChinaWheatYield30m dataset generated from this study can be downloaded from https://doi.org/10.5281/zenodo.7360753 (Zhao et al., 2022b).
- Article
(7538 KB) - Full-text XML
- BibTeX
- EndNote


Wheat is the most widely planted crop, supplying a fifth of global food calories and protein (Erenstein et al., 2022). However, wheat production is facing unprecedented challenges in the global context of climate change, such as frequent extreme weather events. Apart from natural factors, socioeconomic events such as the COVID-19 pandemic, regional conflicts and other global crises can also significantly perturb wheat production (IFPRI, 2021). In China, where the need to feed one-fifth of the world's population on its limited land (FAO et al., 2020) and food security is crucial, wheat production is an essential agricultural activity. Ensuring stable grain supplies and increasing production are important to the national economy and people's livelihoods (Feng et al., 2020). Therefore, the monitoring of crop yields in a timely manner is of great significance for regulating import and export decision-making, grain market prices, crop insurance evaluations, smart agriculture applications, and rational allocations of agricultural resources.
In the past decades, remote sensing data from ground-based, aerial-based and satellite-based platforms have received extensive attention for crop yield prediction (Battude et al., 2016; Jiang et al., 2019; Li et al., 2020; Wang et al., 2021). Ground- and aerial-based platforms have high spatial resolution and control, which are advantageous for farm-scale applications. However, their application to large-area yield estimations is too expensive. Satellite-based approaches have been widely used to monitor crop production over large areas in the past few decades, benefitting from the capability to acquire temporally and spatially continuous information (Battude et al., 2016; Huang et al., 2019). With the rapid launch of new satellites carrying various types of sensors, regional yield mapping is becoming more accurate and is being obtained at a higher spatial resolution. The mapping relies on vegetation indices (VIs) that can be derived from visible and near-infrared (NIR) reflectance bands in multispectral optical data, such as the normalized difference vegetation index (NDVI) (Rouse et al., 1974), the enhanced vegetation index (EVI) (Sims et al., 2008) or the optimized soil adjust vegetation index (OSAVI) (Rondeaux et al., 1996). These VIs have often been used to predict crop yield (Magney et al., 2016; Cao et al., 2021; Zhao et al., 2022c). There are many methods to incorporate VIs in yield estimation, such as parametric regressions, deep learning and data assimilation (Battude et al., 2016; Huang et al., 2019; Li et al., 2020).
Parametric regression models directly establish the relationship between VIs and crop yield, which may be linear or nonlinear (Magney et al., 2016; Li et al., 2020). These parametric regressions are limited to the specific research area and growing season for which they are developed, making it hard to extrapolate them either in the spatial or temporal domains. Non-parametric statistical approaches have been used in recent yield projections research. Notable studies have been done using machine learning (ML) (Cai et al., 2019; Li et al., 2021). An emerging new technique for crop yield estimations is deep learning (Tian et al., 2021) applied to various types of data acquired by satellites and drones (Jiang et al., 2020; Wang et al., 2020). Overall, ML methods heavily rely on large training datasets (Cao et al., 2021). Nonetheless, the application of machine learning in the realm of synthetic data generation has also exhibited encouraging outcomes (Arslan et al., 2019; Sivakumar et al., 2022; Ebrahimy et al., 2023).
Unlike the above-mentioned statistical models, process-based mechanic models simulate crop yield from various inputs, including soil properties, meteorological data and crop characteristics. Examples of such models are the Decision Support System of Agrotechnology Transfer modeling system (DSSAT), the Agricultural Production Systems sIMulator (APSIM) and the Simple Algorithm For Yield (SAFY) and many other crop models (Jones et al., 2003; Keating et al., 2003; Duchemin et al., 2008). These mechanistic models can generate reliable yield estimates (Paudel et al., 2021). Data assimilation (DA) provides a way of integrating the monitoring properties of observed data into the predictive and explanatory abilities of crop growth models. Leaf area index (LAI) or biomass is often used as a state variable of the DA system to correct a crop growth model behavior and ensure accurate yield predictions (Battude et al., 2016; Kang and Ozdogan, 2019). Yield is a complex trait that is related to numerous factors, including natural drivers (Li et al., 2021); crop variety (Wei et al., 2022; Bailey-Serres et al., 2019); and human factors, mainly consisting of fertilization and irrigation (Jones et al., 2003; Keating et al., 2003; Duchemin et al., 2008). Existing studies demonstrated that only updating one or two state variables is not sufficient to correct a crop growth model and thus cannot improve output predictions (Ines et al., 2013; Huang et al., 2015; Hu et al., 2017; Huang et al., 2019). In addition, uncertainties in the remote sensing monitoring of state variables such as LAI and biomass are also inherited by the DA system (Kang et al., 2019). Although data assimilation techniques allow a formal and well-understood way to combine model predictions with observations, their computational intensity is a problem that tends to be ignored when estimating large-area crop production. Transfer learning techniques can be used to transfer the knowledge learned from a crop growth model to predict wheat yield to effectively improve calculation efficiency (Zhao et al., 2022a). A reliable labeled dataset is a prerequisite for the transfer learning method (Zhang et al., 2021). However, building an effective dataset for transfer learning over a large region is still challenging.
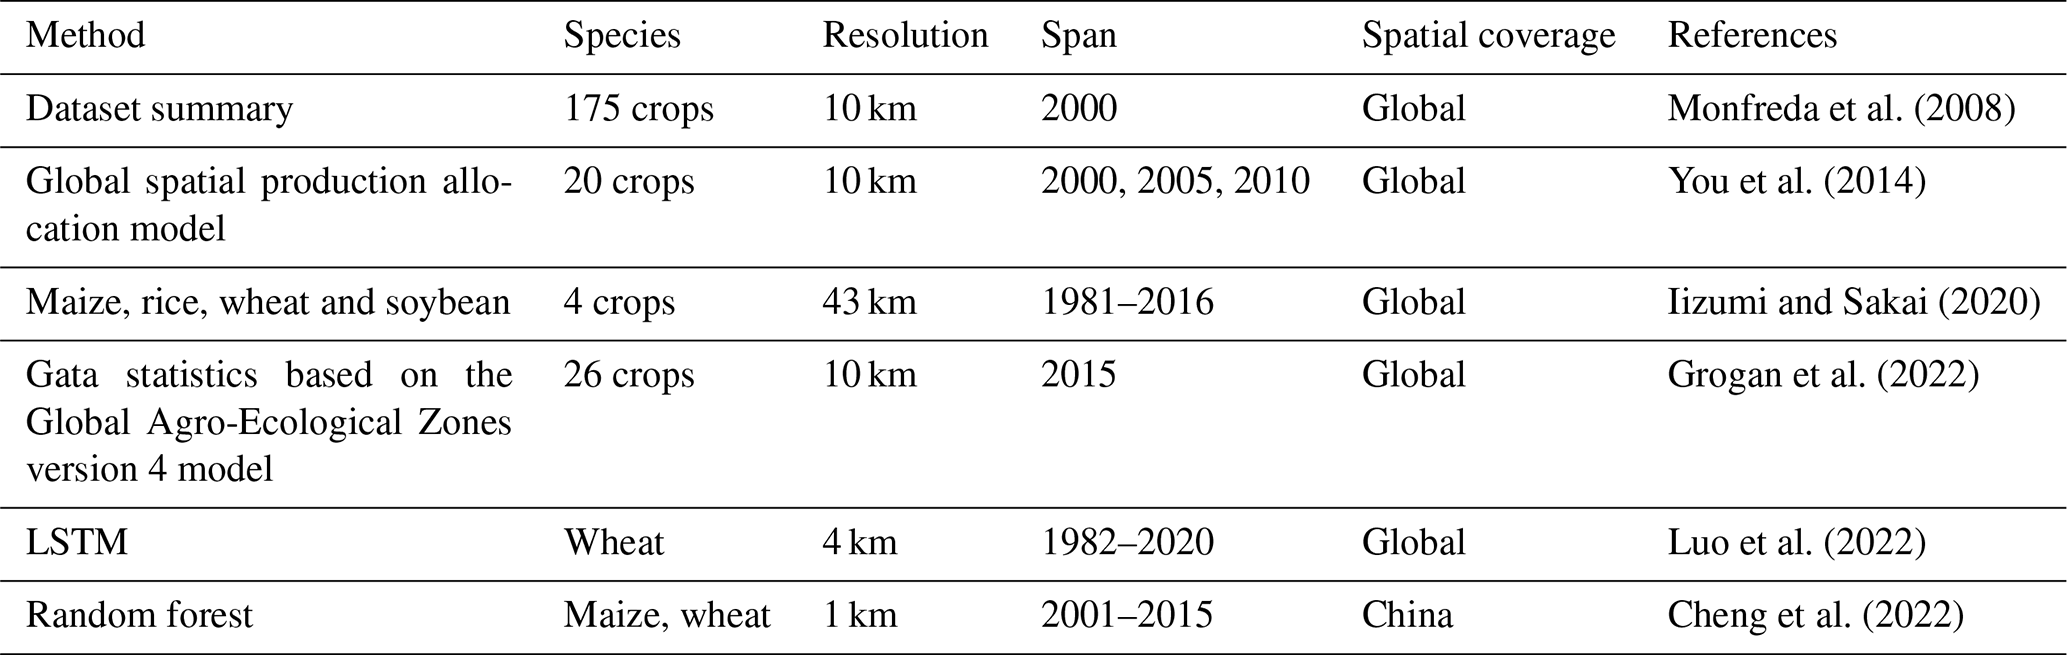
In addition to traditional crop models and assimilation strategies, there are hybrid models that incorporate the simplicity of a statistical model and the rationality of a mechanistic model and are thus called semi-mechanistic models (Ji et al., 2022). For example, Dong et al. (2020b) developed the EC-LUE-GPP (eddy covariance–light use efficiency–gross primary production) model and successfully estimated the wheat yield in Kansas, USA. Li et al. (2020) used the hierarchical linear model (HLM) to estimate interannual yield, and it showed good performance. Generally, a semi-mechanistic model has great potential in yield estimation, but its application is often limited to a relatively small area, e.g., farm, county or city scale, rather than a larger scale. National crop yield datasets, which are of great significance for large-scale agricultural resource allocation, agricultural system model construction and climate change impact assessment, are produced at coarse spatial resolutions (Table 1), e.g., 0.5∘, 10 km, 4 km or 1 km resolution (Monfreda et al., 2008; You et al., 2014; Iizumi and Sakai, 2020; Grogan et al., 2022; Luo et al., 2022; Cheng et al., 2022), and are mostly downscaled based on the statistical yield datasets and other datasets (Monfreda et al., 2008; You et al., 2014; Iizumi and Sakai, 2020; Grogan et al., 2022). This method of yield downscaling may lead to inaccurate yield estimates and incorrect assessments of the impact of climate change. In addition, yield predictions cannot rely on statistical data alone. Luo et al. (2022) and Cheng et al. (2022) developed yield datasets combining coarse-resolution real-time remote sensing data with agricultural statistics, but because 1 km × 1 km plots or 4 km × 4 km farmlands are rare in China, their field application is limited. Although these datasets are useful for analyzing larger-scale temporal and spatial changes in yield, they cannot deal with small-scale spatial heterogeneity, which happens to be the most significant characteristic of the Chinese farmers' economy. Therefore, there is an urgent need to construct a high-resolution yield dataset for investigating spatiotemporal patterns of crop production, assessing climate change impacts and modeling crop growth processes over large spatial extents.
Table 1Summary of studies on crop yield datasets. LSTM: long short-term memory.
In this study, by integrating remote sensing and climate data, we aim to (1) propose a semi-mechanistic model with excellent accuracy and low cost by combining remote sensing observations and regional meteorological information, which can simultaneously overcome inter-annual and cross-regional problems; (2) evaluate model performance using both validation dataset and the census yield data; and (3) generate a high-resolution (30 m) Chinese winter wheat yield dataset (ChinaWheatYield30m) for the period 2016–2021. This dataset will be useful to further yield-related research and guide related food policies.
2.1 Study areas
Our study area consists of the main winter-wheat-growing region of China, which includes 12 provinces and municipalities (Fig. 1). The main winter wheat production areas are mainly distributed in the Huang–Huai–Hai region (HHH), southwest China (SW), the Gansu–Xinjiang region (GX), the middle and lower reaches of the Yangtze River (MLYR), and the Loess Plateau (LP). Most of the region is in the middle of China and includes temperate, continental monsoon, temperate monsoon and subtropical monsoon climates. The sown area and production of winter wheat in China accounted for 20.02 % and 21.77 % of staple food crops in 2021 (National Bureau of Statistics of China, 2021), respectively. Three sample areas were selected for detailed analysis based on their different geographical and climatic conditions. The three selected regions in this study were chosen for comparison with other yield datasets based on different wheatland coverages. Region 1, 2 and 3 represent areas with winter wheat coverages below 25 %, around 50 % and above 75 %, respectively, serving as representative regions for these respective coverage levels.
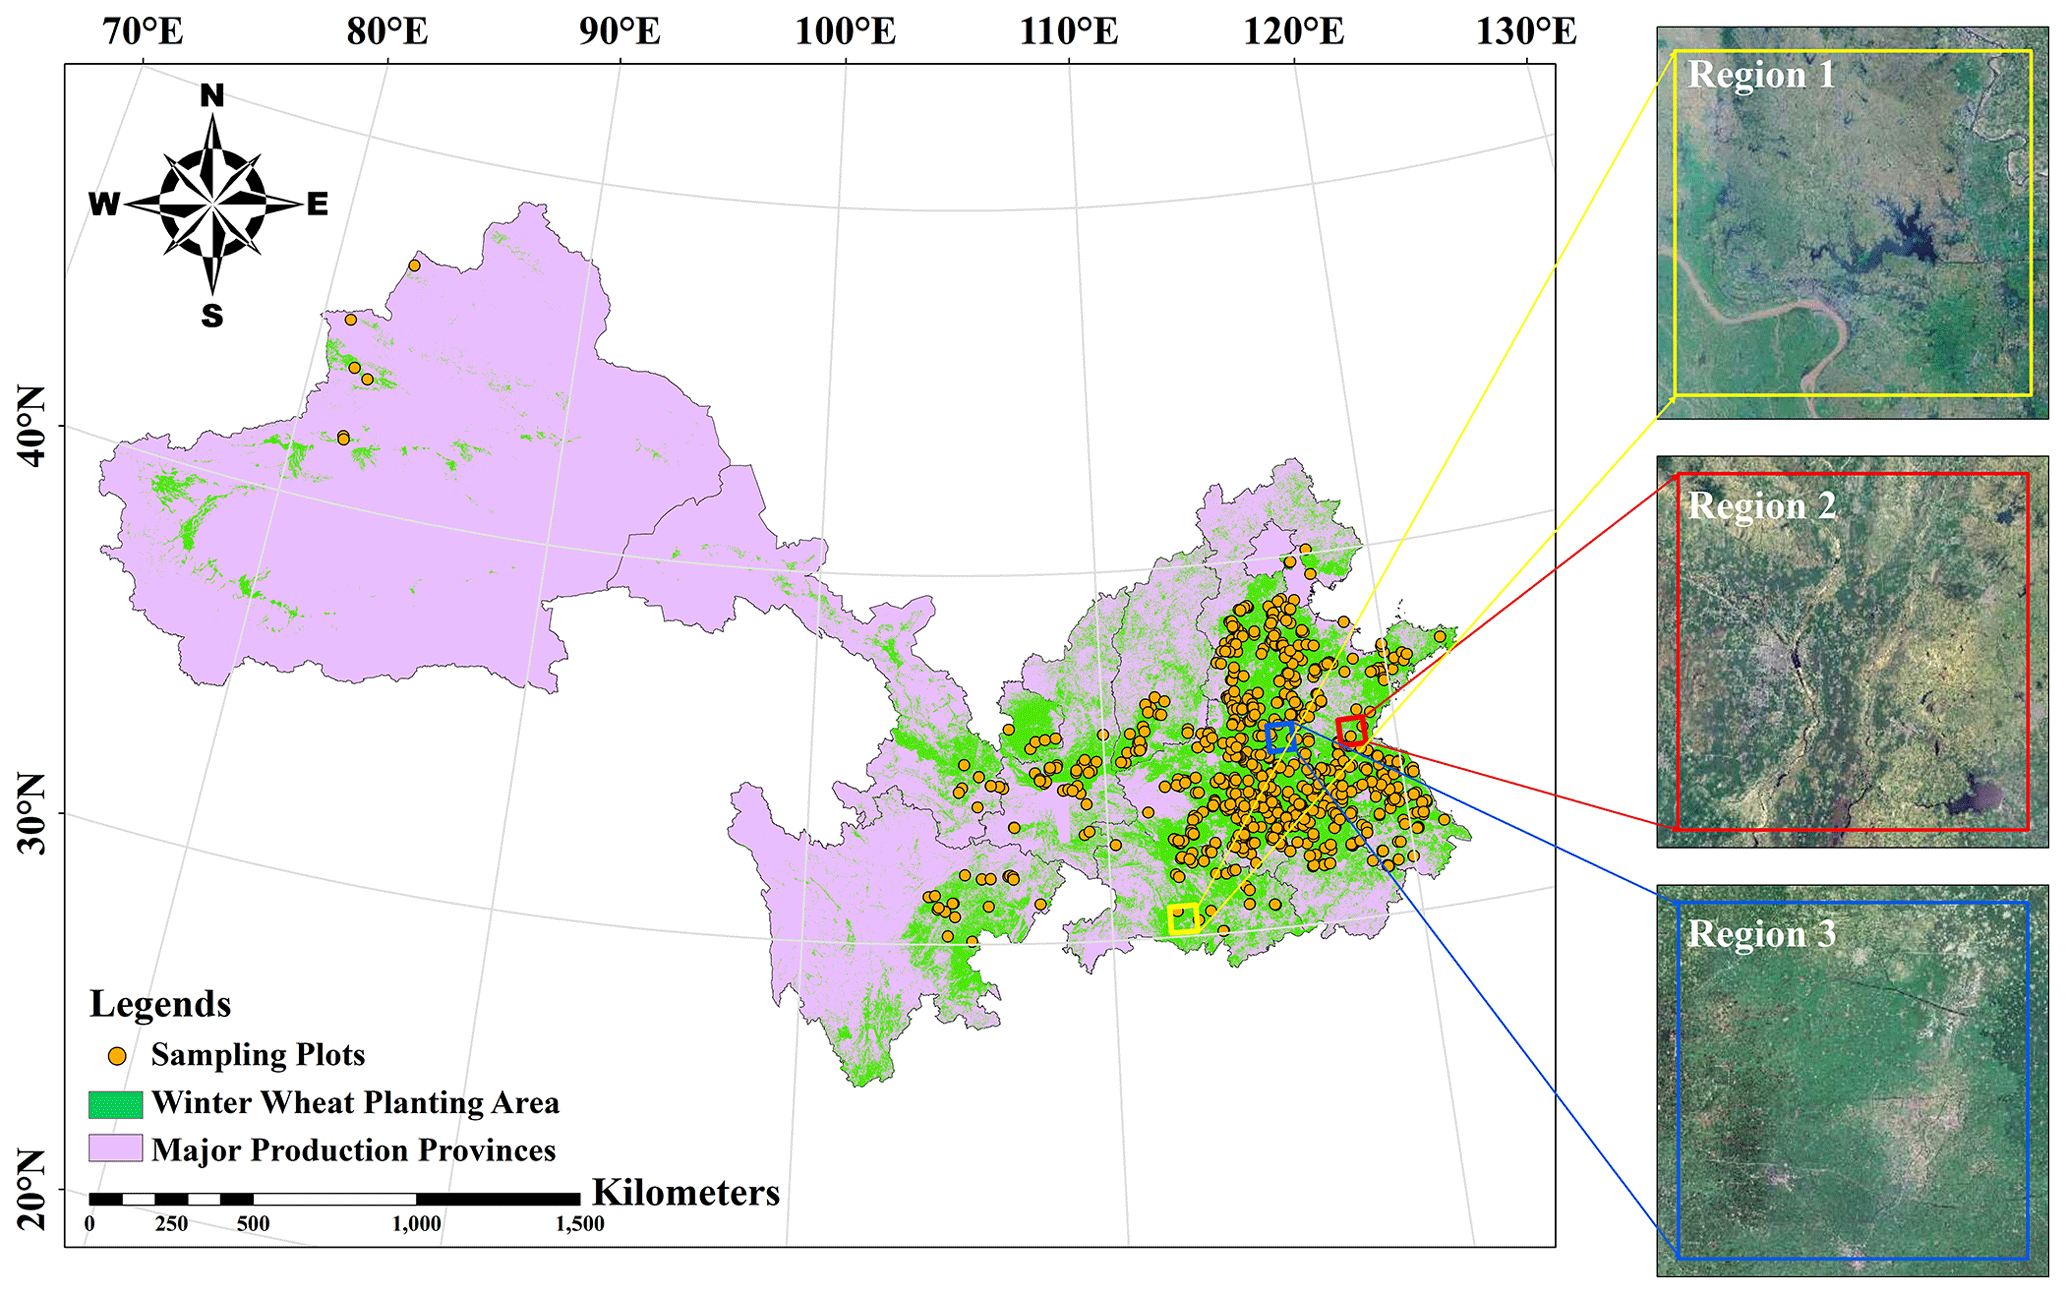
Figure 1Distribution of winter wheat within the study area and three selected example areas. Region 1, 2 and 3 are available at http://lbs.tianditu.gov.cn/server/MapService.html (last access: August 2023) and represent areas with winter wheat coverages below 25 %, around 50 % and above 75 %, respectively, serving as representative regions for these respective coverage levels.
2.2 Data collection
2.2.1 The winter wheat land cover data
We used a winter wheat map with a 30 m resolution across the main growing areas of China (Dong et al., 2020a). These data produce winter wheat maps from 2016 to 2020, which is the base map of ChinaWheatYield30m production. The yield distribution map of 2021 uses the winter wheat classification map of 2020, and the rest of the yield distribution maps are winter wheat classification maps of that year.
2.2.2 Satellite imagery data acquisition
In this work, we extracted the atmospherically corrected reflectance from Landsat 8 and Sentinel 2 images on the Google Earth Engine (GEE) platform during the period of 2016–2021. Subsequently, we calculated the Enhanced Vegetation Index 2 (EVI2) (Jiang et al., 2008) using the extracted reflectance values. These datasets were chosen to increase observation frequency and were used for yield estimation. Xu et al. (2020) have shown that Landsat 8 data and Sentinel 2 data have high consistency. The EVI2 is calculated from the reflectance in red and NIR bands (Eq. 1):
where NIR and red represent the near-infrared and red reflectance, respectively, in Landsat 8 or Sentinel 2. The maximum EVI2 (EVI2max) of the winter-wheat-growing season was used in this paper. It is generally believed that the time of EVI2max corresponds to the heading period, which has been shown to be the best period for remote sensing yield estimation (Luo et al., 2020).
2.2.3 Meteorological data
Meteorological data were important input variables for yield prediction, mainly from March to May, because this period includes most key growth stages of winter wheat (i.e., stem elongation, booting, heading, flowering and filling stages). The meteorological data, including monthly average temperatures (Tem), monthly solar radiation (Rad) and monthly precipitation (Pre), were obtained from the ERA5 dataset provided by the GEE platform (https://developers.google.com/earth-engine/datasets/catalog/ECMWF_ERA5_LAND_MONTHLY, last access: August 2023) with a resolution of 0.1∘ for the sampling site (Muñoz-Sabater, 2019). All three types of meteorological datasets were resampled to a 30 m resolution to ensure data uniformity.
2.2.4 In situ measurement yield data
Georeferenced field-scale yields were obtained by field investigation from 2016 to 2021. During the harvest period, a five-point (1 m2 per point) sampling method was used to destructively sample each winter wheat plot to measure yield. To avoid edge effects, each sample point was at least 2 m away from the edge of the farmland. The harvested grain was threshed and air-dried for yield determination. Then, the final yield was standardized as grain with 14 % moisture content. The detailed collection numbers of samples from different regions are shown in Table 2. In this paper, the data were randomly split into two datasets; two-thirds of the data were used for modeling, and the remaining data were used for validation.
Table 2Detailed statistics on the sample numbers in this study.
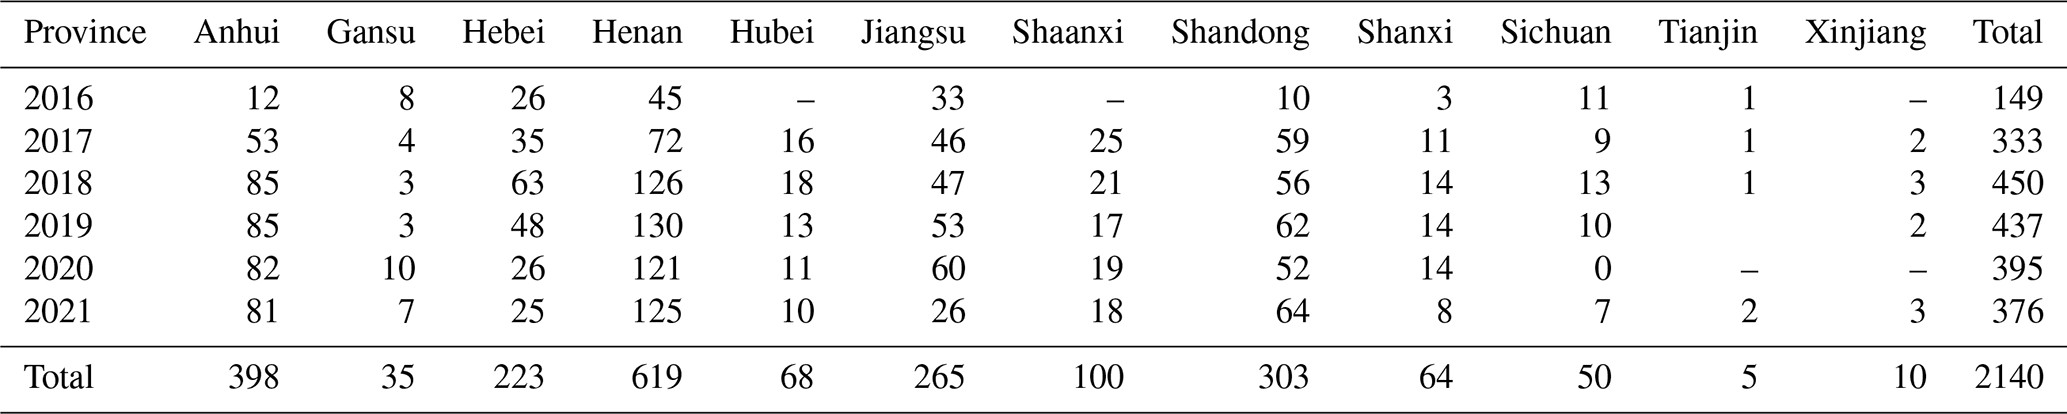
Note that “–” represents no collected data.
2.2.5 The province-level and municipal-level statistical data
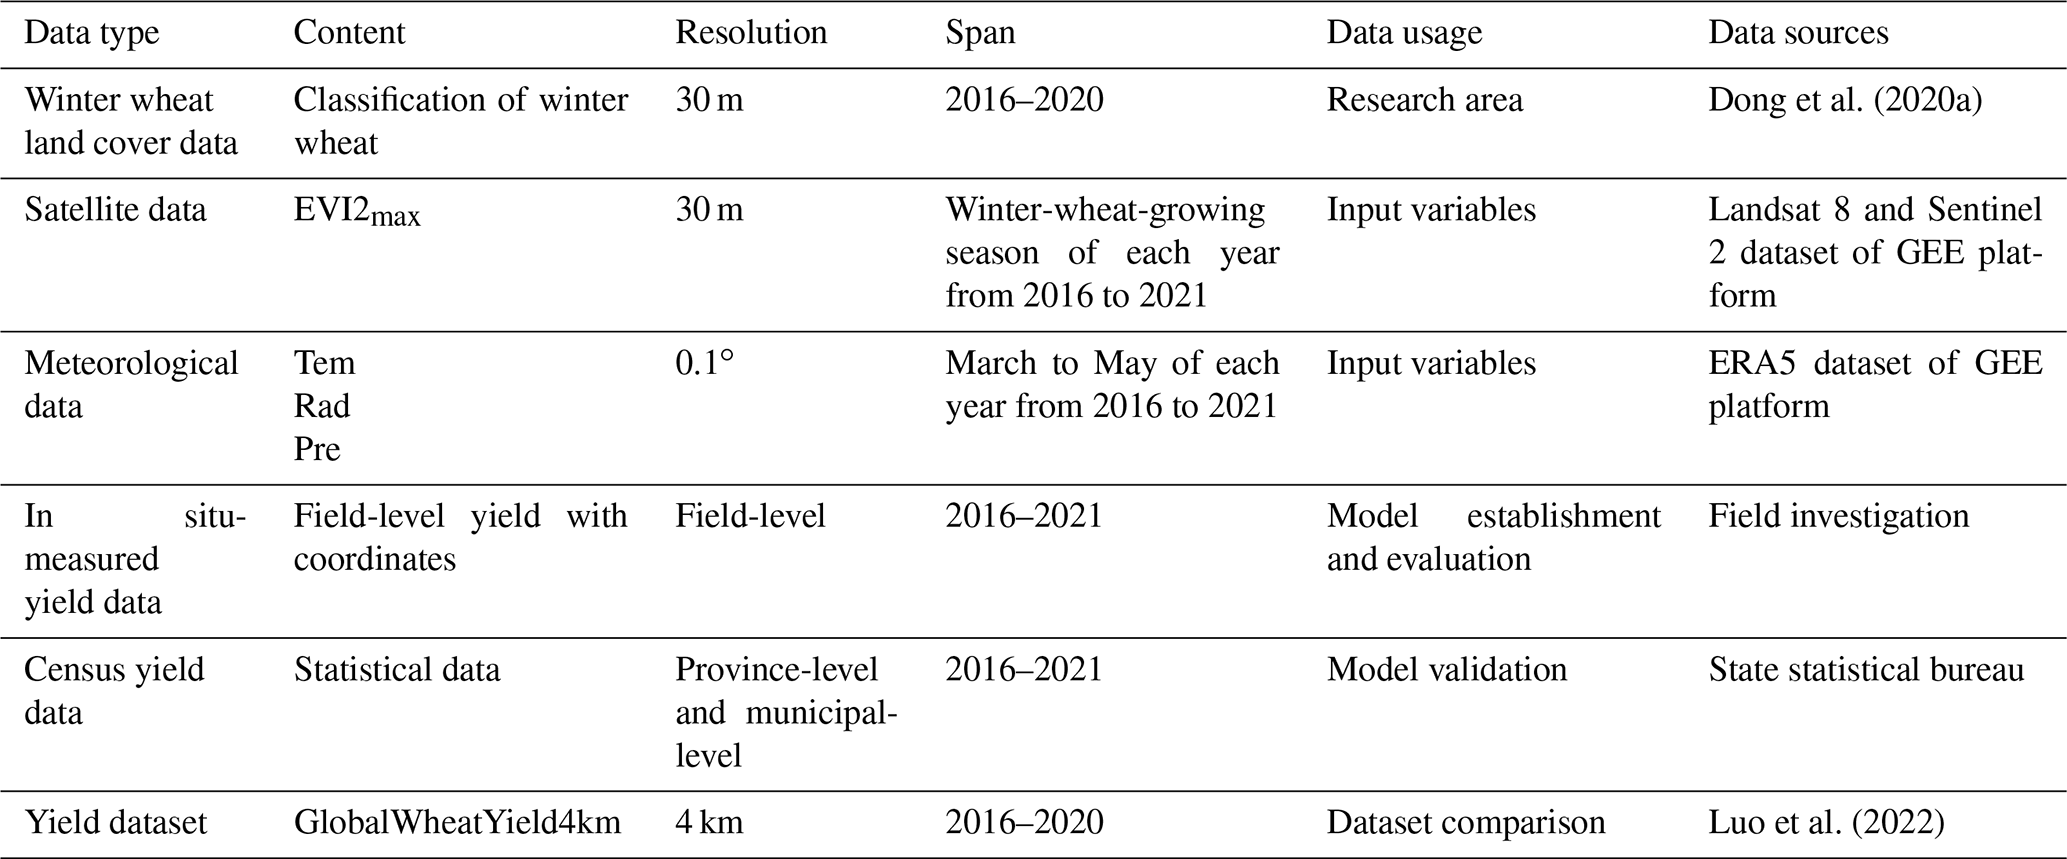
The province-level and municipal-level yield data for the study area were collected from National Bureau of Statistics between 2016 and 2021 (http://www.stats.gov.cn/tjsj/ndsj/, last access: December 2022). However, the data collected did not have direct records of the unit yield data. Therefore, to obtain the statistical yield data (kg ha−1), the total production was calculated by dividing the planted area. These data were used to validate the model in the selected research provinces and municipalities. Table 3 shows the main information and sources of all data used in this study.
2.3 Method
2.3.1 Methodology
The hierarchical linear model (HLM) is a simple and efficient method for dealing with nested structures. At present, the HLM has been extensively applied to predicting yield, grain protein content and agronomic traits for inter-annual and transregional studies (Li et al., 2020; Xu et al., 2020; Li et al., 2022; Zhao et al., 2022c). These papers have demonstrated that the HLM is a stable, reliable and scalable way of solving yield estimation problems. They also demonstrated that, although a linear relationship between EVI2max and crop yield can be established in a particular field of a single year, differences in meteorological factors between regions and years will differentiate this relationship, which is the exact problem that the HLM was employed to settle. In this study, normalization was performed on the data to reduce the impact of differences in variable scales. For each province, a set of parameters was generated using the data collected from the sample fields. The specific yield-predicting models in different provinces using the HLM method in this study involved a two-level hierarchy. Level 1 of the HLM was constructed based on the yield and EVI2max:
where β0 and r represent the intercept and random error, respectively, and β1 represents the slope of the linear model corresponding to EVI2max.
In the HLM, the parameters of β0 and β1 at Level 1 become dependent variables at Level 2. The independent variables of Level 2 are the accumulated meteorological data (Tem, Rad and Pre) of different growth stages, such that
where βj represents the β0 and β1 from Level 1 of HLM, j represents 0 or 1, γm0 is the intercept, γm1–γm3 are the slopes of each accumulated meteorological data of different months (m=3, 4, and 5), and μmj is the random error of Level 2 of HLM. The parameters of the HLM in this article are estimated using maximum likelihood estimation. Figure 2 shows a schematic of the workflow.
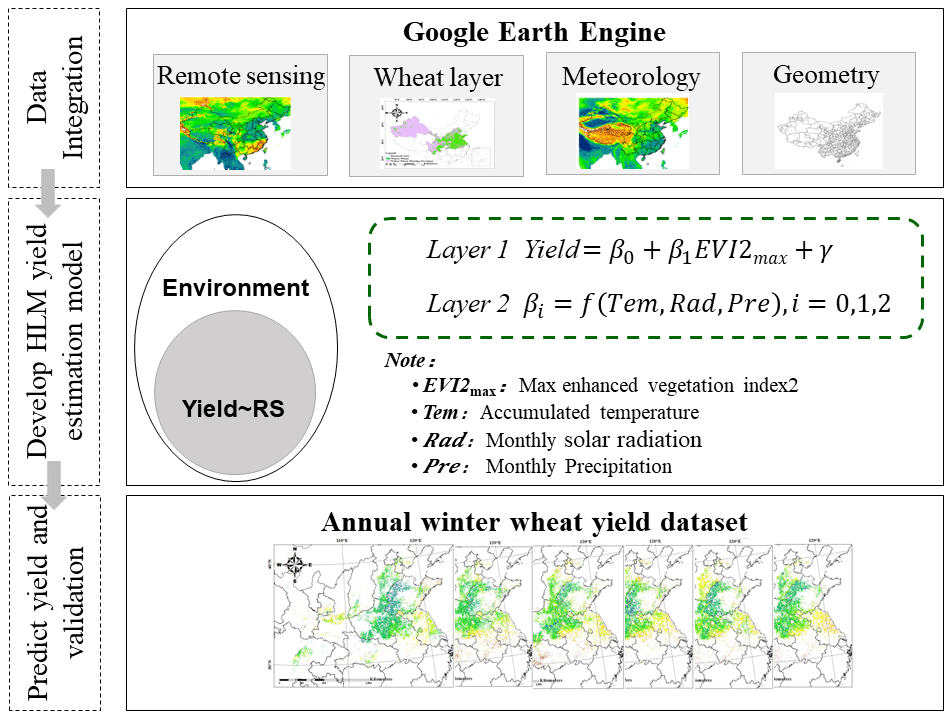
Figure 2Schematic diagram outlining the inputs, major processing steps used and generated outputs.
2.3.2 Comparison with the random forest method and the other yield datasets
Random forest (RF) is a model with predictive performance commonly used in the current yield estimation literature (Li et al., 2020; Cheng et al., 2022; Luo et al., 2022). RF regression is a classic ensemble machine learning model that establishes multiple unrelated decision trees by randomly extracting samples and features and obtains the prediction results in parallel. Each decision tree can obtain a prediction result through the samples and features extracted, and the regression prediction result of the whole forest can be obtained by averaging the results of all trees (Breiman, 2001). This study generated multiple RF models for each province just like the way we build HLMs, using same calibration and validation datasets, so this makes two models for each province and definitely comparable. Given the wide range of RF applications in generating crop yield data, we built a RF prediction model in MATLAB and compared its performance with the HLM. The number of decision trees was set to 200, and the maximum depth of the tree and the number of features optimized the models' hyperparameters through a pretuned procedure (Li et al., 2021; Cheng et al., 2022).
We compared our yield production (ChinaWheatYield30m) with an existing 4 km dataset of global wheat yield (GlobalWheatYield4km) (Luo et al., 2022) using in situ data to validate the reliability of our dataset. More specifically, we calculated the correlation coefficient (r) and relative root mean square error (rRMSE) between the in situ measurement yields and the estimates of GlobalWheatYield4km or ChinaWheatYield30m from 2016 to 2021. This study compared and analyzed national statistical data at different scales, focusing mainly on the provincial and municipal levels, to validate the accuracy of the ChinaWheatYield30m dataset. This study compared the difference between the statistical yield per unit area from 2016 and the average yield using ChinaWheatYield30m extracted from both province and municipal vector data. The provincial and municipal average yields based on the ChinaWheatYield30m dataset were calculated by dividing the total yield of all winter wheat pixels by the number of winter wheat pixels in that area.
2.3.3 Model evaluation
The commonly used correlation coefficient (r) and relative root mean square error (rRMSE) were used to compare the performance of generated models. To estimate the contribution of each input variable of the HLM, we applied an extended Fourier amplitude sensitivity test (Saltelli et al., 1999). The EFAST (extended Fourier amplitude sensitivity test) was used to determine a sensitivity index (SI) which combined the advantages from both Fourier amplitude sensitivity tests and the Sobol algorithm. The derived SI quantified how output results were impacted by input variables. The SI of each independent input variable to the yield in different provinces was computed with Simlab (version 2.2.1) software. To verify the stability of the yield model in this study, in addition to using independent samples for validation, we also selected cross-validation of the model deviation in different agricultural regions and years (Fushiki, 2011). In this study, regional and temporal cross-validation was performed by training the models on specific years or regions and then independently validating them on the remaining years or study regions as separate samples.
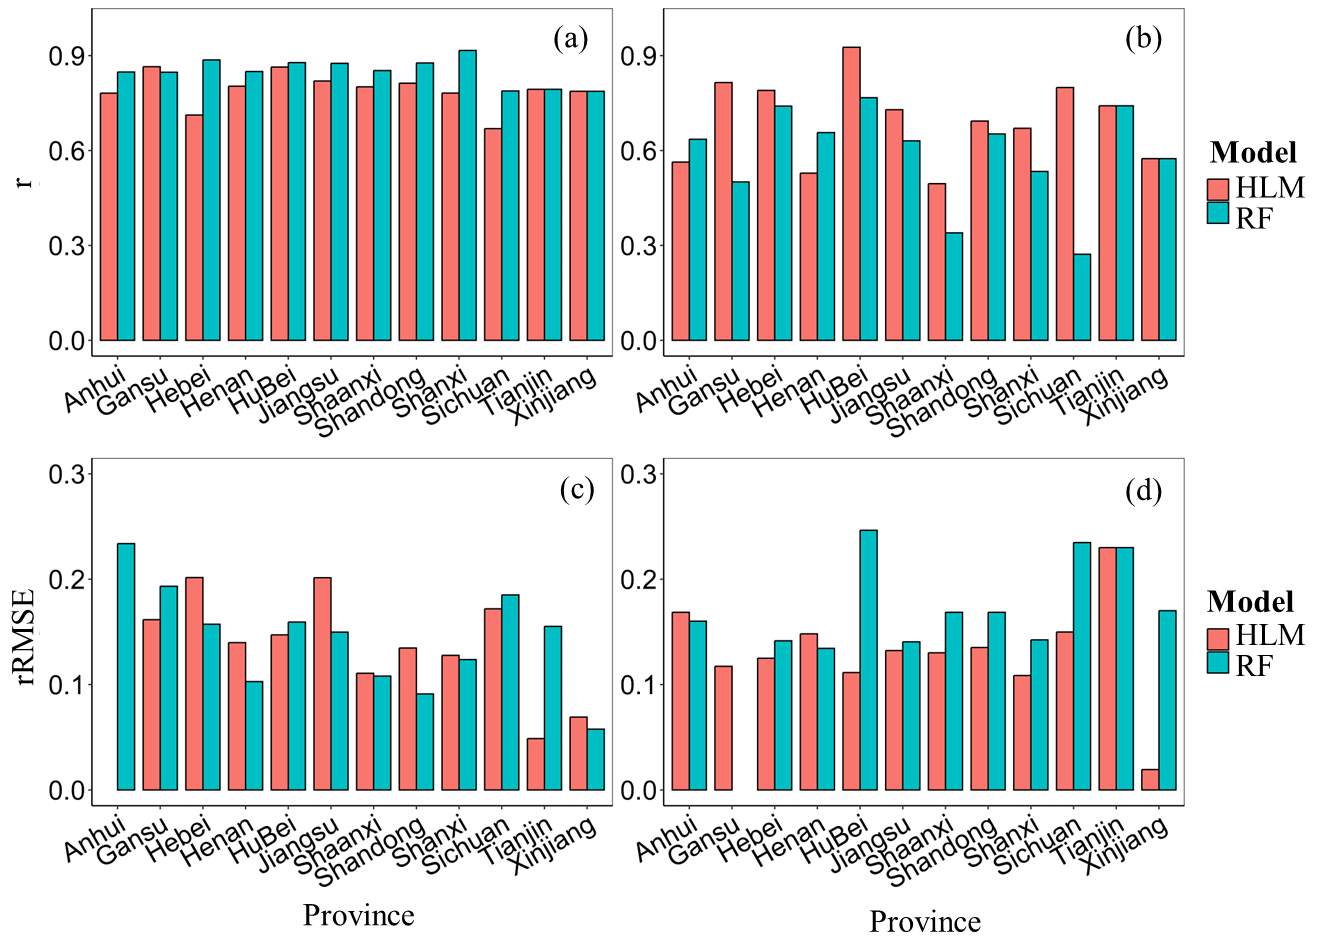
Figure 3Comparison between the predicted and measured yield in the calibrated datasets (a, c) and the validation datasets (b, d).
3.1 Exploring the appropriate method and accuracy assessment
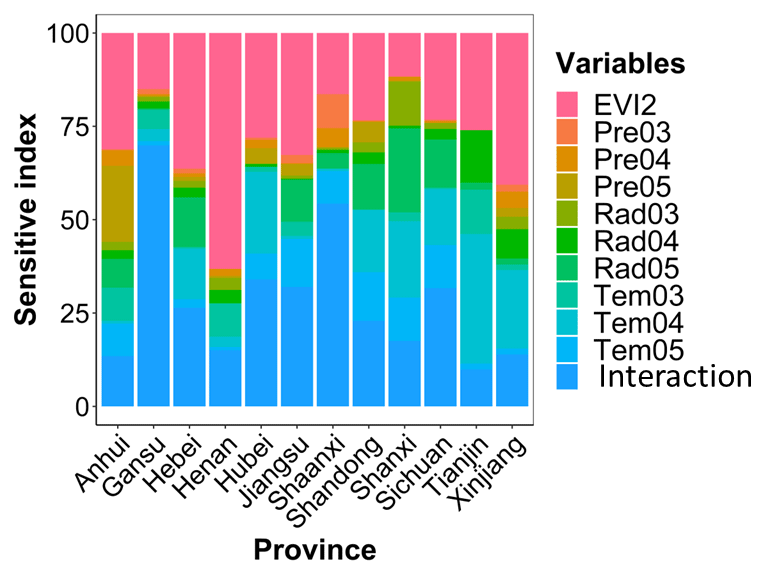
The performance of the RF and HLM in situ yield predictions during 2016–2021 for each province is shown in Fig. 3. The calibration sets for the RF and HLM have similar performance, with r (rRMSE) ranging 0.79–0.92 (5.78 %–23.37 %) and 0.67–0.87 (4.87 %–22.06 %), respectively. However, in the validation set, the HLM outperformed RF, with r (rRMSE) ranging 0.50–0.93 (1.93 %–23.00 %) and 0.27–0.76 (13.44 %–30.86 %), respectively. The superior performance of HLM was attributed to its ability to capture the interaction effects among various factors. This interaction explained most of the variation among the provinces, with a sensitive index range of 9.85 %–69.92 % (Fig. 4). The sensitive index of input variables to the HLM is shown in Fig. 4, indicating the contributions of each variable to the HLM. Overall, in most of the analyzed provinces, EVI2 was the most important variable in the HLM, with a contribution range of 11.70 %–63.18 % for different provinces. As for the meteorological factors, in general, temperature was the most important factor, whereas radiation and precipitation were less significant. The variables related to accumulated temperature, Tem04 and Tem05, had a high contribution (8.50 %–21.90 %) to the HLM. The results show the importance of weather in April and May, which in our research areas are the key months for the flowering and filling of winter wheat, the critical periods in grain formation when most organic matter is accumulated (Cabas et al., 2010).
The HLM and RF model were implemented to predict in situ wheat yield using the calibration dataset. By comparing the predicted results from 2016 to 2021 with the in situ records, it was found that there is a high consistency between the measured and predicted yield of winter wheat. The r (p<0.01) and rRMSE for the HLM were 0.81** and 12.59 %, respectively, while for the RF model, the r (p<0.01) and rRMSE were 0.83** and 12.66 %, respectively. When validating with independent samples, the HLM performed better than the RF model, with an r (p<0.01) of 0.72** and an RMSE of 15.34 % for the HLM, while the RF model had an r of 0.69** and an RMSE of 15.71 %. Due to the fact that the majority of the pixels to be predicted are located in areas not covered by the calibrated dataset, the HLM with stable performance in independent sample validation was chosen for subsequent analysis and dataset construction.
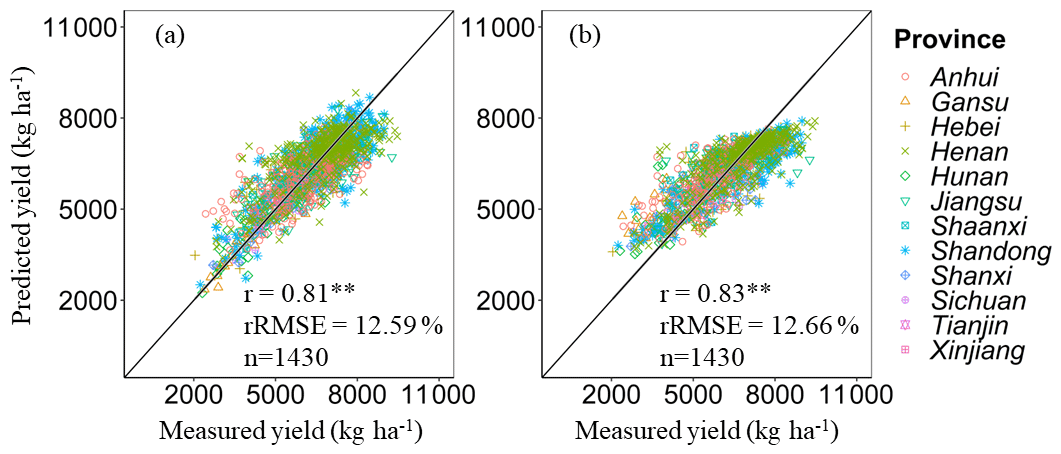
Figure 5Comparison of measured yield with predicted yield based on the HLM (a) and the RF model (b) in the calibrated datasets. ** represents that the model is significant at the 0.01 level of probability.
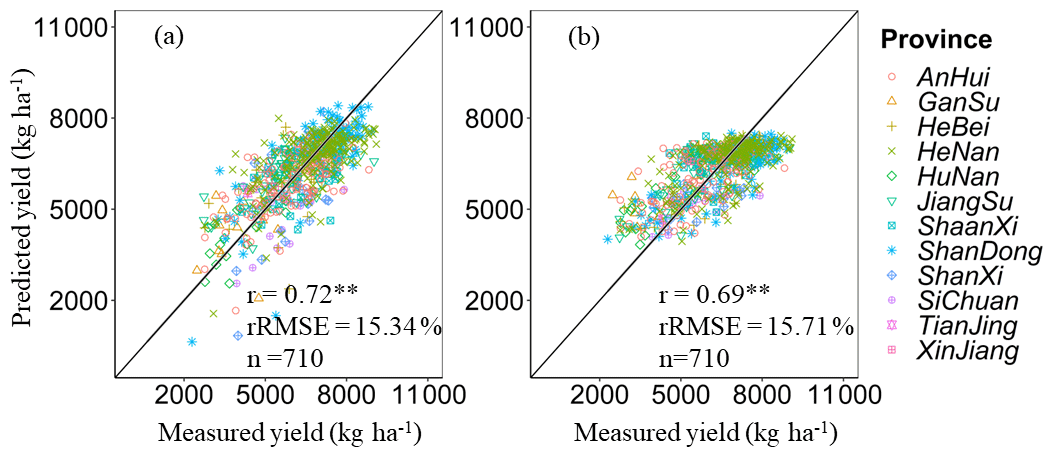
Figure 6Comparison of measured yield with predicted yield based on HLM (a) and RF model (b) in the validated datasets. ** represents that the model is significant at the 0.01 level of probability.
3.2 Cross-validation of the HLM across years and regions
Apart from validating the model using independent samples, this study also conducted cross-validation based on different years and different agricultural regions to further assess the stability of the HLM (Figs. 7 and 8). Interannual cross-validation results show that the predicted yield using the HLM has high consistency with the measured yield, with the r (p<0.01) and rRMSE values ranging from 0.55**–0.69** and 15.44 %–28.61 %, respectively. In the regional cross-validation, the cross-validation results in GX regions performed poorly, and the measured data and verification data in other regions have high consistency, with r (p<0.01) and rRMSE values ranging from 0.30**–0.51** and 17.31 %–23.16 %, respectively. The yield estimation results for the GX region and the southwest region are poor. These two regions have a large area, and there are significant differences in climate and planting management conditions. The existing data are not sufficient to reflect these differences. However, the main recommended winter wheat varieties at the provincial level have similar characteristics, and the planting patterns are similar for policy reasons. By utilizing meteorological conditions, it is possible to reflect the differences in winter wheat production within provinces as much as possible. Therefore, this article constructed a 30 m winter wheat yield dataset for China at the provincial scale.
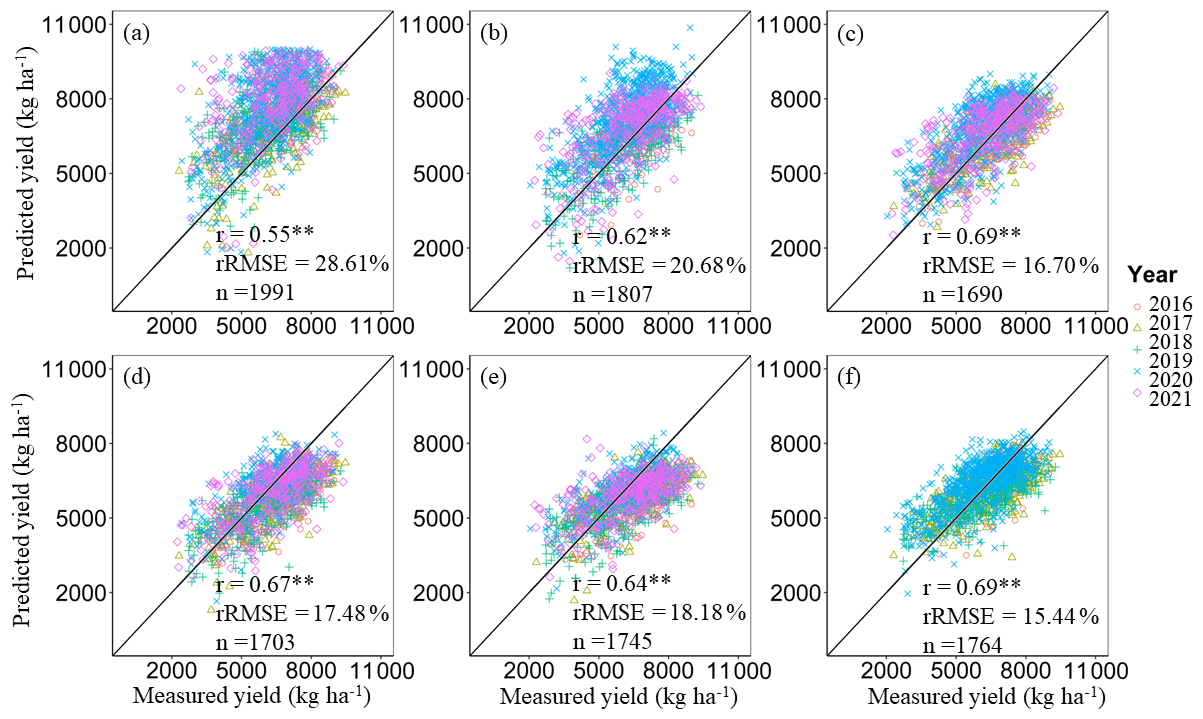
Figure 7Interannual cross-validation of the correlation between measured data and predicted data, where panels (a)–(f) indicate that the HLMs of 2016, 2017, 2018, 2019, 2020 or 2021 are directly used in other years. ** represents that the model is significant at the 0.01 level of probability.
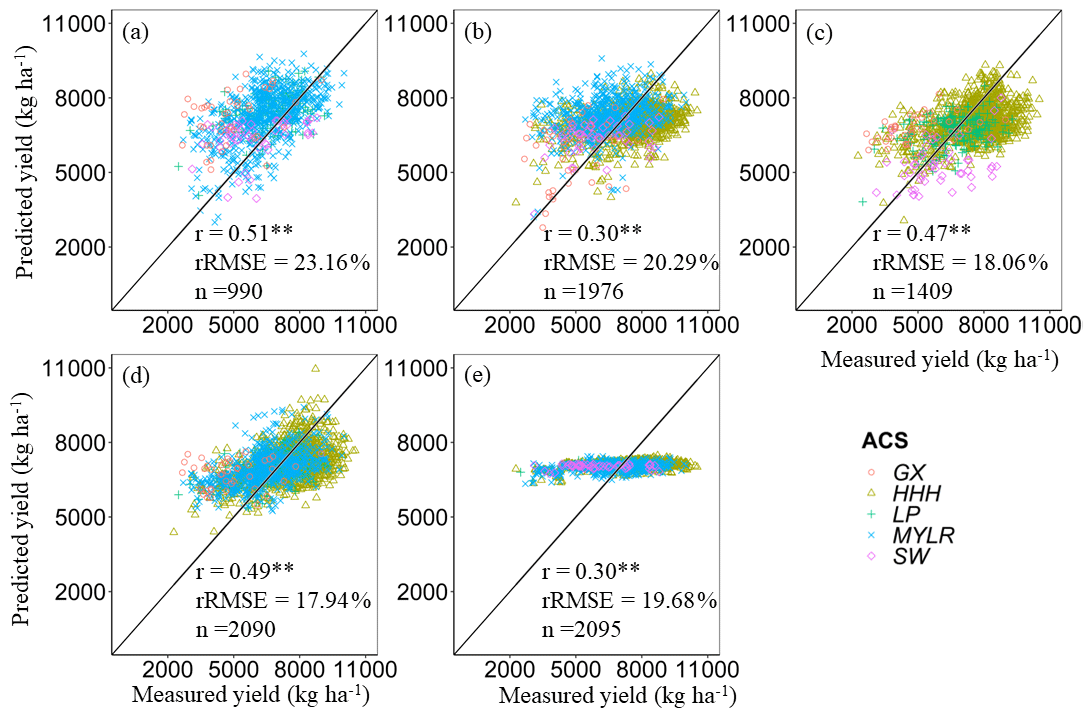
Figure 8Reginal cross-validation of the correlation between measured data and predicted data, where panels (a)–(e) indicate that the HLMs of HHH, LP, MYLR, SW or GX are directly used in other years. ** represents that the model is significant at the 0.01 level of probability.
3.3 Comparing ChinaWheatYield30m with GlobalWheatYield4km
Figure 9 shows the spatial patterns of ChinaWheatYield30m from 2016 to 2021. Generally, the spatial patterns of predicted yields were consistent with in situ-measured yields, with large variability from 2273.82–10 518.82 kg ha−1. We further summarized the province-level statistic yield. The yield averages were highest in Shandong Province (6567.48 kg ha−1), followed by Henan Province (6498.42 kg ha−1) and Hebei Province (6039.39 kg ha−1). By contrast, Jiangsu Province achieved the lowest average yield (4337.05 kg ha−1) (Fig. 10). Overall, these data are consistent with the census data. In contrast, model performance showed overestimates of wheat crop yield compared with statistical yield (r=0.69** (p<0.01), rRMSE = 19.16 %) (Fig. 10). Therefore, the field-scale yield prediction dataset not only has high precision at a fine scale, but it also performs well on a large scale.
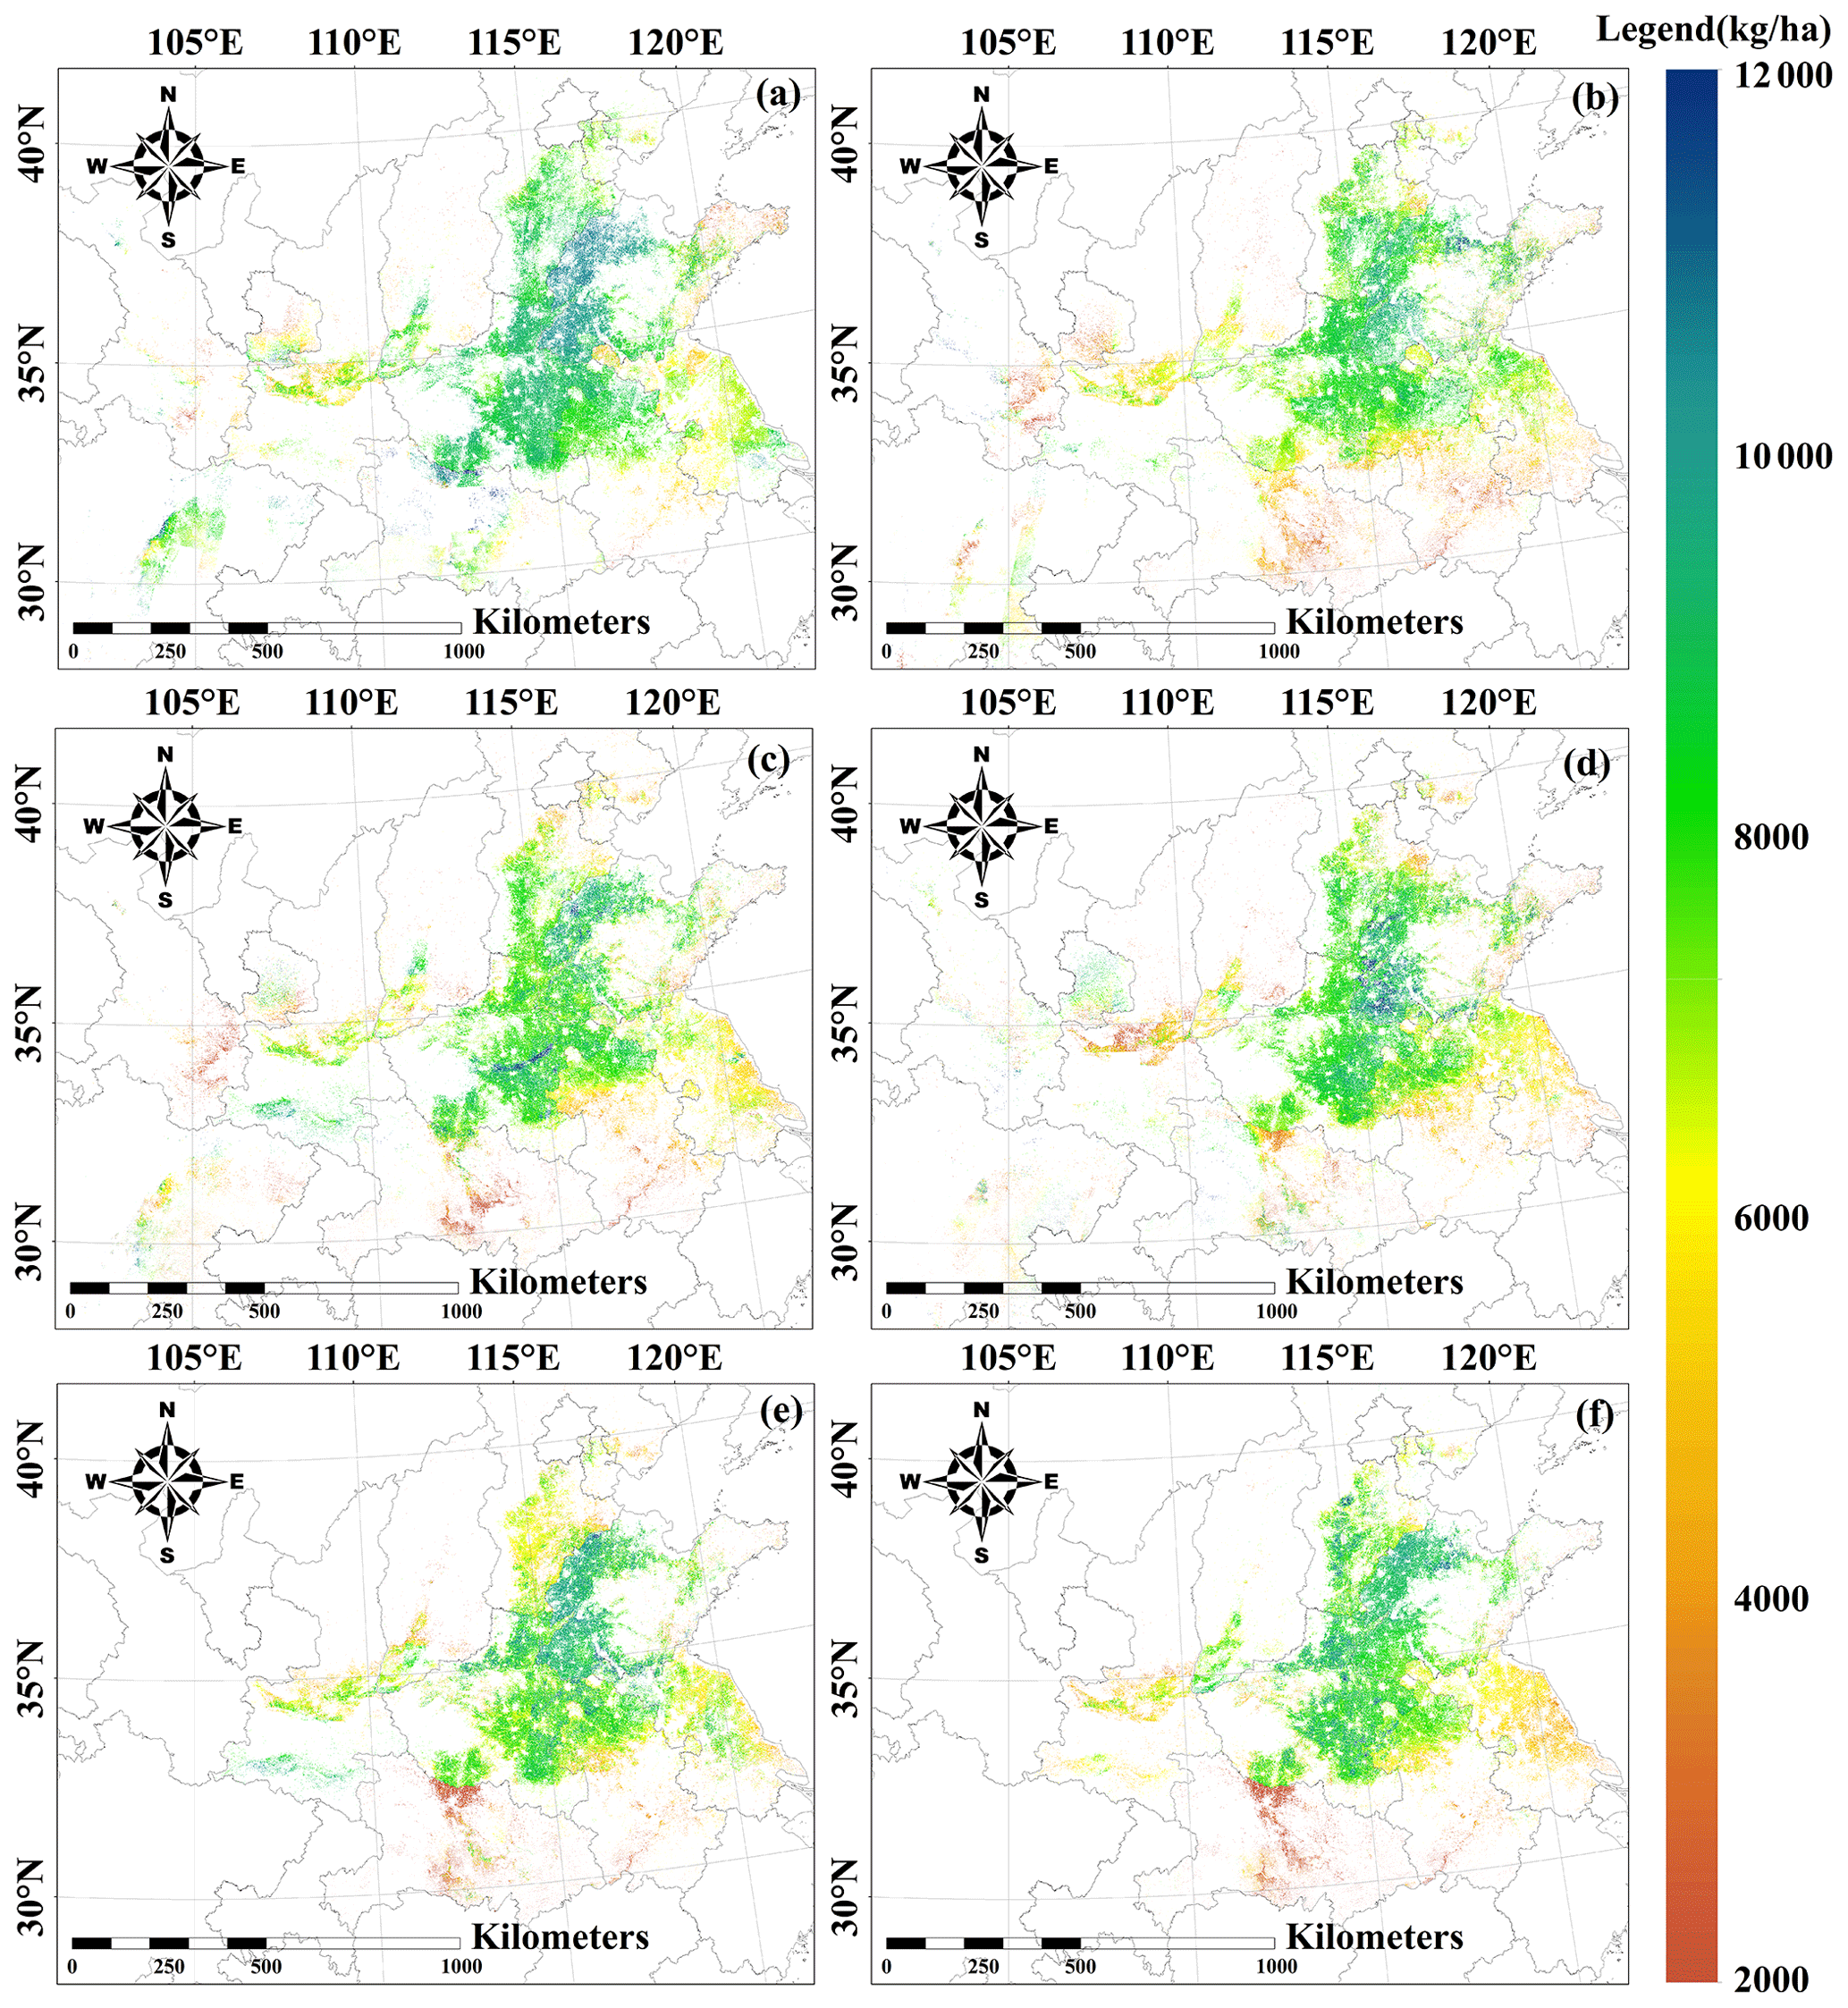
Figure 9Spatial patterns of annual winter wheat yield during 2016–2021.
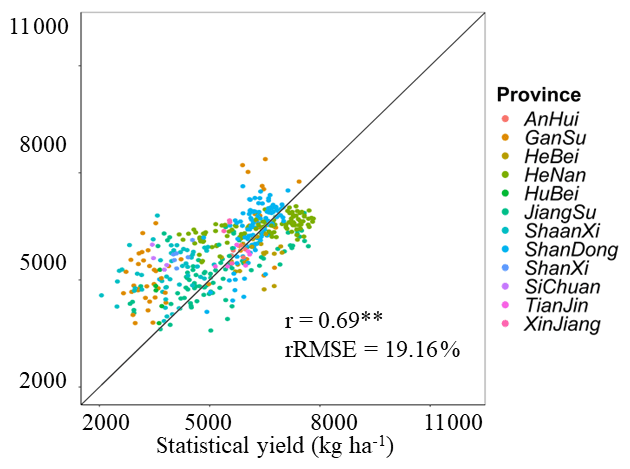
Figure 10Comparison of predicted yield and municipal statistical yield. ** represents the model being significant at the 0.01 level of probability.
We compared the datasets at the field level using single pixels and through a zonal analysis of three selected research areas. Field-level yield estimates were aggregated to match the ChinaWheatYield30m and GlobalWheatYield4km from 2016 to 2020 and then compared with in situ measurement yields (Fig. 11). The yield estimates of ChinaWheatYield30m showed higher consistencies with in situ measurement yields as the scatter points were closer to the 1:1 line than in the case of GlobalWheatYield4km. The results showed that, in different years, ChinaWheatYield30m has a lower rRMSE range (12.40 %–13.84 %) compared to GlobalWheatYield4km (20.43 %–33.06 %) (Fig. 9).
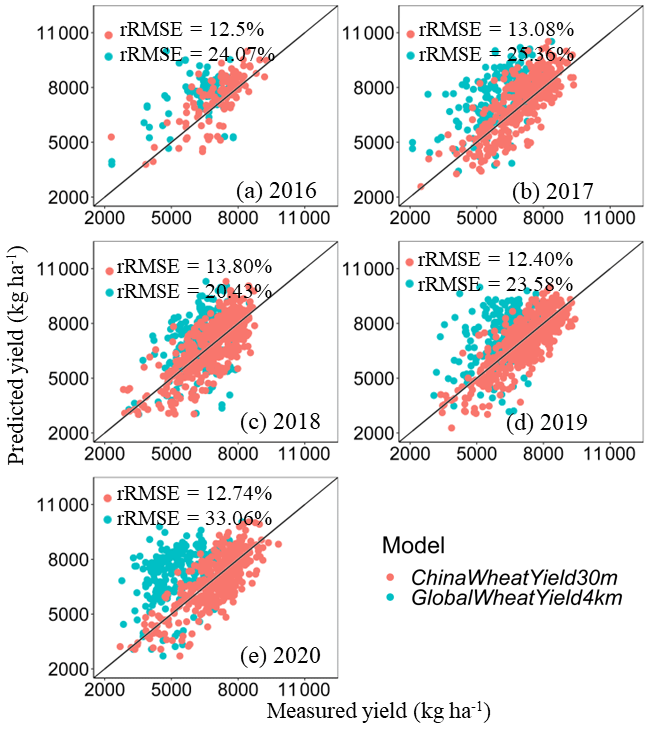
Figure 11Comparisons between in situ measurement yields and predicted yields of GlobalWheatYield4km or ChinaWheatYield30m for 2016 (a), 2017 (b), 2018 (c), 2019 (d), and 2020 (e).
As for the zonal analysis, winter wheat yield derived from ChinaWheatYield30m also has a close spatial pattern to GlobalWheatYield4km production (Fig. 12 and Table 4). In addition, ChinaWheatYield30m, with a standard deviation of 290.27–880.91 kg ha−1, depicts the difference in yield with greater spatial detail compared to the GlobalWheatYield4km standard deviation of 195.46–1516.09 kg ha−1. In the selected sample areas, the yield ranges of ChinaWheatYield30m and GlobalWheatYield4km are 2115.95–7668.69 kg ha−1 and 2653.62–10 504.50 kg ha−1, respectively. This wide range and minor deviation reveal the advantages of fine-resolution data. Compared with the actual yield records, GlobalWheatYield4km significantly underestimates them, whereas ChinaWheatYield30m is closer to the 1:1 line. In the selected sample areas, the mean yield of ChinaWheatYield30m is generally higher than that of GlobalWheatYield4km because the wheat classification at 30 m resolution is dominated by pure wheat pixels. In contrast, the wheat classification with 4 km resolution has more mixed pixels. For example, buildings and roads cannot be identified in the 4 km classification but result in an underestimation of yield prediction (Fig. 12).
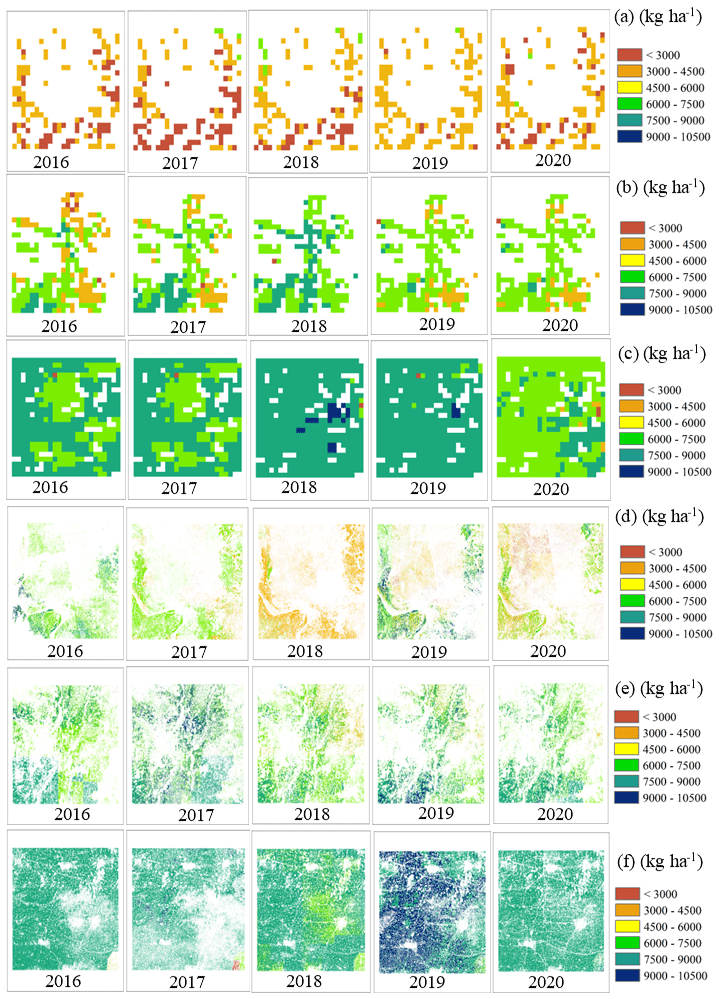
Figure 12Comparison of spatial patterns between GlobalWheatYield4km (a, b, c) and ChinaWheatYield30m (d, e, f) from 2016 to 2020. The detailed location of the selected example areas (Region 1 and d; Region 2 and e; Region 3) is shown in Fig. 1.
Table 4Statistical analysis of GlobalWheatYield4km and ChinaWheatYield30m.
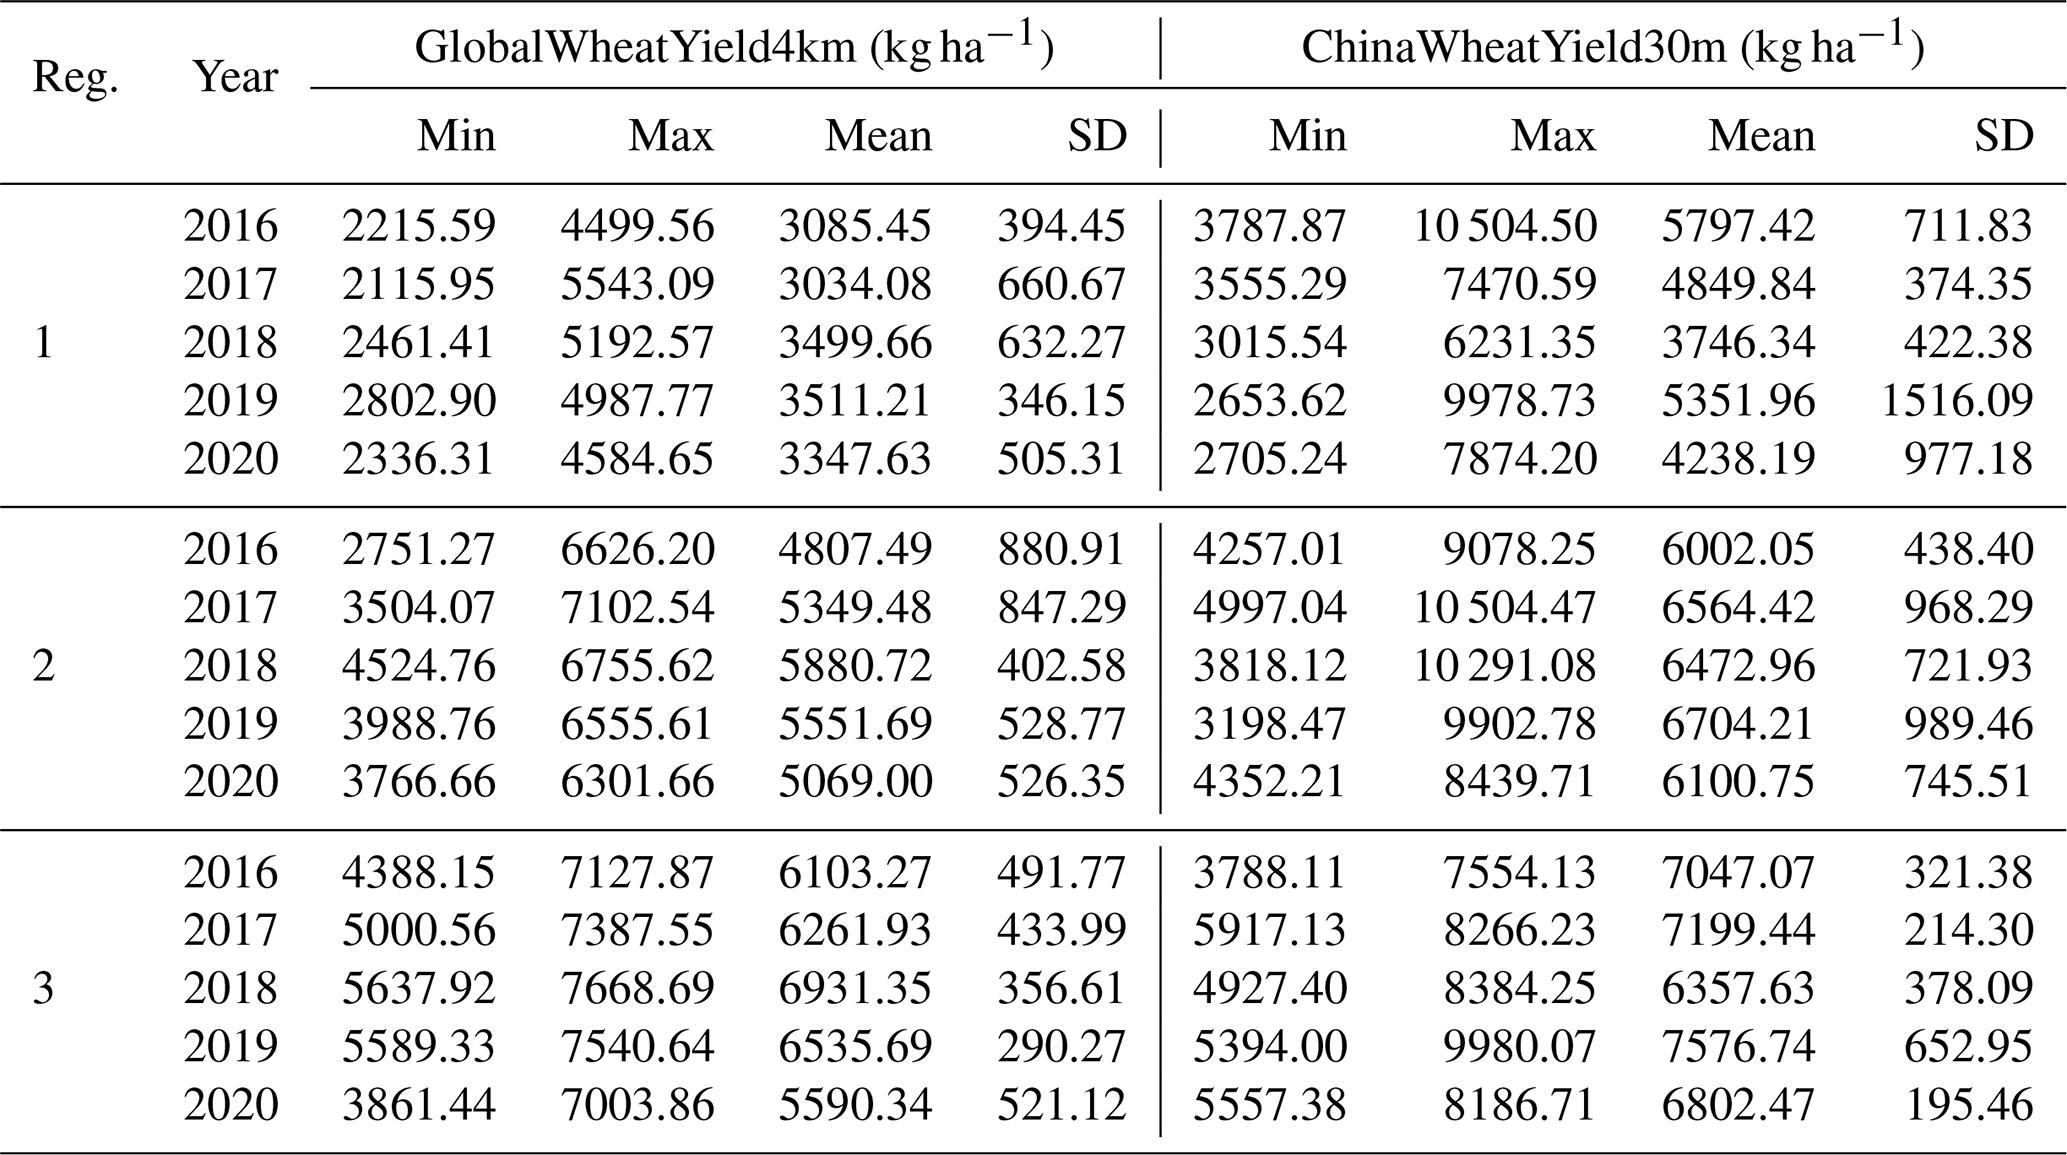
Note that “Reg” represents “region”.
4.1 Advancements of the 30 m resolution yield dataset
Information on the spatial extent of winter wheat yield is essential for drafting economic and food subsidy policies and rationally allocating resources (FAOSTAT, 2018). To our knowledge, to date there is no fine resolution (30 m) winter wheat yield distribution map. Previous research has generated the winter wheat yield distribution map of some major production areas in China at moderate resolution, e.g., 10 km, 5 arcmin grid, 5 min grid, 4 km and 1 km (Monfreda et al., 2008; Grogan et al., 2022; Luo et al., 2022; Cheng et al., 2022). Moderate-resolution yield maps have a mixed-pixel problem, which may lead to great uncertainties, as mentioned in comparison with the 4 km yield dataset. Existing wheat yield maps are usually available at the end of the season or based on yield statistics, which limits their application in early field management and government macro-control (Battude et al., 2016; Kang and Ozdogan, 2019). For example, crop growth models strongly depend on daily meteorological data as input; this increases the difficulty in early yield prediction because meteorological data during the season are lacking and long-term meteorological forecasts are unreliable. ChinaWheatYield30m had the following advantages:
-
This study generated ChinaWheatYield30m dataset with 30 m resolution (Fig. 10); the primary reason is we adopted the winter wheat classification map from Dong et al. (2020a), providing the highest resolution of 30 m wheat pixels. Such a resolution will not only provide higher result credibility, but also balance the computational efficiency problems. High-resolution yield datasets can provide more accurate spatial information about crop production, improving agricultural productivity and enabling rapid monitoring and analysis of large agricultural areas. This allows for timely detection and resolution of issues that arise during crop growth, ultimately enhancing both the efficiency and effectiveness of agricultural production.
-
A stable accuracy at field scale and large regional scale will highly contribute to field management, the modeling of agricultural systems and the drafting of agricultural policies. This study combined remote sensing and meteorological data to construct a spatiotemporally expandable HLM method for predicting winter wheat yield in the main producing areas. The relationship between vegetation index and crop yield varies across different years and regions (Li et al., 2020). Meteorological data have an important impact on crop yield (Moschini and Hennessy, 2001; Lee et al., 2013). Li et al. (2021) showed that environmental data for wheat in China explained more than 60 % of the variation in wheat yield. In this study, we generated ChinaWheatYield30m with stable results, which fully exploited the advantages of HLM to solve the nested problem of yield prediction impacted by remote sensing and meteorological data.
-
The product has a high real-time performance and can be used to forecast the output in the early period of the year. EVI2max and meteorological data used in this paper can be obtained before May, while wheat in China's main winter wheat production areas is generally harvested in June. Therefore, the proposed method can accurately predict winter wheat yield in real time. The strengths of the HLM are overcoming inter-annual and regional variations (Li et al., 2020; Xu et al., 2020; Zhao et al., 2022c). The results based on field investigation and statistical data show that the method can accurately predict winter wheat yield in the main production areas. The ChinaWheatYield30m is presumed to be most commonly concerned in metropolis level or county level; in this sense, the resolution will be feasible to these scales.
4.2 Uncertainties and limitations
Despite the advantages of ChinaWheatYield30m, the dataset also presents some data and model uncertainties.
-
Remote sensing and meteorological data used in this study still have uncertainties. This study generated the ChinaWheatYield30m dataset with 30 m resolution; the primary reason is we adopted winter wheat classification map from Dong et al. (2020a), providing the highest resolution of 30 m wheat pixels. The ChinaWheatYield30m input data consist of meteorological variables and remote sensing data; all datasets were resampled to a 30 m resolution to ensure data uniformity. In terms of remote sensing data, resampling Sentinel 2 data to 30 m may result in loss of some surface information, and the differences between pixels in the image may not be accurately captured. The increase in the number of mixed pixels can lead to uncertainties in yield estimation results. Besides, maximum EVI2 is obtained at the heading or flowering period (Luo et al., 2020), but due to the irregular availability of usable Sentinel 2 and Landsat 8 observations, the maximum EVI2 nationwide may correspond to different phenological periods.In addition, meteorological data are another important component of the yield dataset. To obtain spatially and temporally continuous meteorological driving data, this study utilizes a dataset generated by ECMWF; its meteorological data were updated in a timely manner to meet our spatio-temporal demand. However, meteorological data such as precipitation, temperature and radiation exhibit highly nonlinear and chaotic characteristics (Lorenz and Haman 1996), leading to ongoing debates about the reliability of interpolation methods. The coarse resolution of meteorological data, combined with its high spatial homogeneity over larger areas, weakens its ability to effectively capture the relationship between remote sensing data and yield variations as the second-level correction in the HLM.
-
Uncertainties in winter wheat classifications are transferred to the yield predictions. The wheat classification is based on optical remote sensing data and may be affected by meteorological factors such as clouds and rain (Dong et al., 2020a). In addition, the winter wheat classification data are mainly based on time series, and a similar time series may lead to a wrong classification, which results in uncertainties in regional yield statistics.
-
The accessibility of in situ measurement data is also one of the uncertainties in ChinaWheatYield30m. The performance of HLM depends on the quantity and quality of samples. It is more precise when sampling in the quadrat and is often higher than the statistical yield data. It was particularly difficult to collect finer-scale census data with longer time coverage in some areas, such as Xinjiang Province, leading to data gaps in ChinaWheatYield30m. We combined in situ measurements and statistical data to calibrate and validate the ChinaWheatYield30m. However, where sparse observation were available, we could only calibrate the parameters of the mathematical optimization.
-
The uncertainties of HLM application scenarios need further analysis. There is a nested issue between vegetation indices and yield relationships, as well as between meteorological data and yield relationships (Li et al., 2020; Xu et al., 2020). HLM has advantages in addressing this problem. Under similar meteorological conditions, the yield estimation of the model mainly depends on the differences in vegetation indices. In the major wheat production area, variations in crop types, soil types, climate factors and other factors have an impact on the model's estimation results (Li et al., 2021). The current model only considers the effect of meteorological data on remote sensing yield estimation, and future analyses will incorporate additional factors such as soil to generate more accurate yield datasets. The current model is primarily constructed based on normal production conditions, and estimating winter wheat yield under abnormal climatic conditions introduces significant uncertainties. Therefore, it is necessary to consider stress factors and further improve the framework of remote sensing estimation models for winter wheat in the future.
The derived yield dataset for ChinaWheatYield30m during 2016–2021 is available at https://doi.org/10.5281/zenodo.7360753 (Zhao et al., 2022b). Please be so kind to contact the authors for more detailed information.
In the present study, we generated a 30 m Chinese winter wheat yield dataset from 2016 to 2021 based on the HLM, called ChinaWheatYield30m. First, we construct a semi-mechanical model with excellent accuracy and low cost in a combination of remote sensing observations and regional meteorological information for major winter-wheat-producing areas in China. The HLM has a stable performance in calibration sets across China, with an r of 0.81** (p<0.01) and rRMSE of 12.59 %, respectively. Next, we validated the predictive performance of in situ measurement data and statistical data. The ChinaWheatYield30m dataset was highly consistent with in situ measurement data and statistical data (p<0.01), indicated by r (rRMSE) of 0.72** (15.34 %) and 0.69** (19.16 %), respectively. Finally, we established a high-resolution yield product for winter wheat in China during 2016–2021. Our ChinaWheatYield30m can be applied for many purposes, including further academic research, the establishing of economic food subsidy policies and the rational allocation of imperative resources.
YZ, GY and SH designed the research, performed the analysis, and wrote the paper. JZ, HX, YM and XL collected data. YZ and SH contributed equally to this work.
The contact author has declared that none of the authors has any competing interests.
Publisher's note: Copernicus Publications remains neutral with regard to jurisdictional claims in published maps and institutional affiliations.
We would like to thank the editor and the two reviewers for their valuable comments. We would also like to thank all the scientists and students who participated in the field observations.
This research has been supported by the National Key Research and Development Program of China (grant no. 2022YFD2001103), Key scientific and technological projects of Heilongjiang Province (grant no. 2021ZXJ05A05), the Platform Construction Funded Program of Beijing Academy of Agriculture and Forestry Sciences (grant no. PT2022-24), and Chongqing Technology Innovation and Application Development Special Project (grant nos. cstc2019jscx-gksbX0092 and cstc2021jscx-gksbX0064).
This paper was edited by Xuecao Li and reviewed by three anonymous referees.
Arslan, M., Guzel, M., Demirci, M., and Ozdemir, S.: SMOTE and Gaussian Noise Based Sensor Data Augmentation, in: 2019 4th International Conference on Computer Science and Engineering (UBMK), 11 September 2019, Samsun, Turkey, 458–462, https://doi.org/10.1109/UBMK.2019.8907003, 2019.
Bailey-Serres, J., Parker, J. E., Ainsworth, E. A., Oldroyd, G. E. D., and Schroeder, J. I.: Genetic strategies for improving crop yields, Nature, 575, 109–118, https://doi.org/10.1038/s41586-019-1679-0, 2019.
Battude, M., Al Bitar, A., Morin, D., Cros, J., Huc, M., Marais Sicre, C., Dantec, V., and Demarez, V.: Estimating maize biomass and yield over large areas using high spatial and temporal resolution sentinel-2 like remote sensing data, Remote Sens. Environ., 184, 668–681, https://doi.org/10.1016/j.rse.2016.07.030, 2016.
Breiman, L.: Random forests, Mach. Learn., 45, 5–32, https://doi.org/10.1023/A:1010933404324, 2001.
Cabas, J., Weersink, A., and Olale, E.: Crop yield response to economic, site and climatic variables, Clim. Change, 101, 599–616, https://doi.org/10.1007/s10584-009-9754-4, 2010.
Cai, Y., Guan, K., Lobell, D., Potgieter, A. B., Wang, S., Peng, J., Xu, T., Asseng, S., Zhang, Y., and You, L.: Integrating satellite and climate data to predict wheat yield in Australia using machine learning approaches, Agric. For. Meteorol., 274, 144–159, https://doi.org/10.1016/j.agrformet.2019.03.010, 2019.
Cao, J., Zhang, Z., Tao, F., Zhang, L., Luo, Y., Zhang, J., Han, J., and Xie, J.: Integrating multi-Source data for rice yield prediction across China using machine learning and deep learning approaches, Agric. For. Meteorol., 297, 108275, https://doi.org/10.1016/j.agrformet.2020.108275, 2021.
Cheng, M., Jiao, X., Shi, L., Penueals, J., Kumar, L., Nie, C., Wu, T., Liu, K., Wu, W., and Jin, X.: High-resolution crop yield and water productivity dataset generated using random forest and remote sensing, Sci Data, 9, 641, https://doi.org/10.1038/s41597-022-01761-0, 2022.
Dong, J., Fu, Y., Wang, J., Tian, H., Fu, S., Niu, Z., Han, W., Zheng, Y., Huang, J., and Yuan, W.: Early-season mapping of winter wheat in China based on Landsat and Sentinel images, Earth Syst. Sci. Data, 12, 3081–3095, https://doi.org/10.5194/essd-12-3081-2020, 2020a.
Dong, J., Lu, H., Wang, Y., Ye, T., and Yuan, W.: Estimating winter wheat yield based on a light use efficiency model and wheat variety data, ISPRS J. Photogramm. Remote, 160, 18–32, https://doi.org/10.1016/j.isprsjprs.2019.12.005, 2020b.
Duchemin, B., Maisongrande, P., Boulet, G., and Benhadj, I.: A simple algorithm for yield estimates: Evaluation for semi-arid irrigated winter wheat monitored with green leaf area index, Environ. Model. Softw., 23, 876–892, https://doi.org/10.1016/j.envsoft.2007.10.003, 2008.
Ebrahimy, H., Wang, Y., and Zhang, Z.: Utilization of synthetic minority oversampling technique for improving potato yield prediction using remote sensing data and machine learning algorithms with small sample size of yield data, ISPRS J. Photogramm. Remote, 201, 12–25, https://doi.org/10.1016/j.isprsjprs.2023.05.015, 2023.
Erenstein, O., Jaleta, M., Mottaleb, K. A., Sonder, K., Donovan, J., and Braun, H.-J.: Global trends in wheat production, consumption and trade, in: Wheat improvement: food security in a changing climate, Springer International Publishing, Cham, 47–66, 2022.
FAO, IFAD, UNICEF, WFP, and WHO.: The State of Food Security and Nutrition in the World. ransforming food systems for affordable healthy diets, FAO, Rome, Italy, https://doi.org/10.4060/ca9692en, 2020.
FAOSTAT: Food and Agriculture Organization of the United Nations, FAO Statistical Databases, http://www.fao.org/faostat/en/ (last access: 17 February 2020), 2018.
Feng, P., Wang, B., Liu, D.L., Waters, C., Xiao, D., Shi, L., and Yu, Q.: Dynamic wheat yield forecasts are improved by a hybrid approach using a biophysical model and machine learning technique, Agric. For. Meteorol., 285–286, 107922, https://doi.org/10.1016/j.agrformet.2020.107922, 2020.
Fushiki, T.: Estimation of prediction error by using K-fold cross-validation, Sta. Comput., 21, 137–146, https://doi.org/10.1007/s11222-009-9153-8, 2011.
Grogan, D., Frolking, S., Wisser, D., Prusevich, A., and Glidden, S.: Global gridded crop harvested area, production, yield, and monthly physical area data circa 2015, Sci. Data, 9, 15, https://doi.org/10.1038/s41597-021-01115-2, 2022.
Hu, S., Shi, L., Zha, Y., Williams, M., and Lin, L.: Simultaneous state-parameter estimation supports the evaluation of data assimilation performance and measurement design for soil-water atmosphere-plant system, J. Hydrol., 555, 812–831, https://doi.org/10.1016/j.jhydrol.2017.10.061, 2017.
Huang, J., Tian, L., Liang, S., Ma, H., Becker-Reshef, I., Huang, Y., Su, W., Zhang, X., Zhu, D., and Wu, W.: Improving winter wheat yield estimation by assimilation of the leaf area index from Landsat TM and MODIS data into the WOFOST model, Agric. For. Meteorol., 204, 106–121, https://doi.org/10.1016/j.agrformet.2015.02.001, 2015.
Huang, J., Ma, H., Sedano, F., Lewis, P., Liang, S., Wu, Q., Su, W., Zhang, X., and Zhu, D.: Evaluation of regional estimates of winter wheat yield by assimilating three remotely sensed reflectance datasets into the coupled WOFOST–PROSAIL model, Eur. J. Agron., 102, 1–13, https://doi.org/10.1016/j.eja.2018.10.008, 2019.
IFPRI: June 2021, International Food Policy Research Institute (IFPRI), Washington, DC, https://doi.org/10.2499/9780896294165, 2021.
Iizumi, T. and Sakai, T.: The global dataset of historical yields for major crops 1981–2016, Sci Data, 7, 97, https://doi.org/10.1038/s41597-020-0433-7, 2020.
Ines, A. V. M., Das, N. N., Hansen, J. W., and Njoku, E. G.: Assimilation of remotely sensed soil moisture and vegetation with a crop simulation model for maize yield prediction, Remote Sens. Environ., 138, 149–164, https://doi.org/10.1016/j.rse.2013.07.018, 2013.
Ji, Z., Pan, Y., Zhu, X., Zhang, D., and Wang, J.: A generalized model to predict large-scale crop yields integrating satellite-based vegetation index time series and phenology metrics, Ecol. Indic., 137, 108759, https://doi.org/10.1016/j.ecolind.2022.108759, 2022.
Jiang, H., Hu, H., Zhong, R., Xu, J., Xu, J., Huang, J., Wang, S., Ying, Y., and Lin, T.: A deep learning approach to conflating heterogeneous geospatial data for corn yield estimation: A case study of the US Corn Belt at the county level, Glob. Change Biol., 26, 1754–1766, https://doi.org/10.1111/gcb.14885, 2019.
Jiang, Z., Huete, A. R., Didan, K., and Miura, T.: Development of a two-band enhanced vegetation index without a blue band, Remote Sens. Environ., 112, 3833–3845, https://doi.org/10.1016/j.rse.2008.06.006, 2008.
Jiang, H., Hu, H., Zhong, R., Xu, J., Xu, J., Huang, J., Wang, S., Ying, Y., and Lin, T.: A deep learning approach to conflating heterogeneous geospatial data for corn yield estimation: A case study of the US Corn Belt at the county level, Global Change Biol., 26, 1754–1766, https://doi.org/10.1111/gcb.14885, 2020.
Jones, J. W., Hoogenboom, G., Porter, C. H., Boote, K. J., Batchelor, W. D., Hunt, L. A., Wilkens, P. W., Singh, U., Gijsman, A. J., and Ritchie, J. T.: The DSSAT cropping system model, Eur. J. Agron., 18, 235–265, https://doi.org/10.1016/S1161-0301(02)00107-7, 2003.
Kang, Y. and Ozdogan, M.: Field-level crop yield mapping with Landsat using a hierarchical data assimilation approach, Remote Sens. Environ., 228, 144–163, https://doi.org/10.1016/j.rse.2019.04.005, 2019.
Keating, B. A., Carberry, P. S., Hammer, G. L., Probert, M. E., Robertson, M. J., Holzworth, D., Huth, N. I., Hargreaves, J. N. G., Meinke, H., and Hochman, Z.: An overview of APSIM, a model designed for farming systems simulation, Eur. J. Agron., 18, 267–288, https://doi.org/10.1016/S1161-0301(02)00108-9, 2003.
Lee, B. H., Kenkel, P., and Brorsen, B. W.: Pre-harvest forecasting of county wheat yield and wheat quality using weather information, Agric. For. Meteorol., 168, 26–35, https://doi.org/10.1016/j.agrformet.2012.08.010, 2013.
Li, L., Wang, B., Feng, P., Wang, H., He, Q., Wang, Y., Liu, D. L., Li, Y., He, J., and Feng, H.: Crop yield forecasting and associated optimum lead time analysis based on multi-source environmental data across China, Agric. For. Meteorol., 308–309, 108558, https://doi.org/10.1016/j.agrformet.2021.108558, 2021.
Li, Z., Taylor, J., Yang, H., Casa, R., Jin, X., Li, Z., Song, X., and Yang, G.: A hierarchical interannual wheat yield and grain protein prediction model using spectral vegetative indices and meteorological data, Field Crop Res., 248, 107711, https://doi.org/10.1016/j.fcr.2019.107711, 2020.
Li, Z., Zhao, Y., Taylor, J., Gaulton, R., Jin, X., Song, X., Li, Z., Meng, Y., Chen, P., Feng, H., and Wang, C.: Comparison and transferability of thermal, temporal and phenological-based in-season predictions of above-ground biomass in wheat crops from proximal crop reflectance data, Remote Sens. Environ., 273, 112967, https://doi.org/10.1016/j.rse.2022.112967, 2022.
Lorenz, E. and Haman, K.: The essence of chaos, Pure Appl. Geophys., 147, 598–599, https://doi.org/10.2307/1347942, 1996.
Luo, Y., Zhang, Z., Chen, Y., Li, Z., and Tao, F.: ChinaCropPhen1km: a high-resolution crop phenological dataset for three staple crops in China during 2000–2015 based on leaf area index (LAI) products, Earth Syst. Sci. Data, 12, 197–214, https://doi.org/10.5194/essd-12-197-2020, 2020.
Luo, Y., Zhang, Z., Cao, J., Zhang, L., Zhang, J., Han, J., Zhuang, H., Cheng, F., Xu, J., and Tao, F.: GlobalWheatYield4km: a global wheat yield dataset at 4-km resolution during 1982–2020 based on deep learning approaches, Earth Syst. Sci. Data Discuss. [preprint], https://doi.org/10.5194/essd-2022-297, 2022.
Magney, T. S., Eitel, J. U. H., Huggins, D. R., and Vierling, L. A.: Proximal NDVI derived phenology improves in-season predictions of wheat quantity and quality, Agric. For. Meteorol., 217, 46–60, https://doi.org/10.1016/j.agrformet.2015.11.009, 2016.
Monfreda, C., Ramankutty, N., and Foley, J. A.: Farming the planet: 2. Geographic distribution of crop areas, yields, physiological types, and net primary production in the year 2000, Glob. Biogeochem. Cy., 22, GB1022, https://doi.org/10.1029/2007GB002947, 2008.
Moschini, G. and Hennessy, D. A.: Uncertainty, risk aversion, and risk management for agricultural producers, Handb. Agric. Econ., 1, 87–153, https://doi.org/10.1016/S1574-0072(01)10005-8, 2001.
Muñoz-Sabater, J.: ERA5-Land monthly averaged data from 1981 to present, Copernicus Climate Change Service (C3S) Climate Data Store (CDS) [data set], https://doi.org/10.24381/cds.68d2bb30, 2019.
National Bureau of Statistics of China: National statistical yearbook, China Statistics Press, http://www.stats.gov.cn/tjsj/ndsj/2021/indexch.htm (last access: 8 August 2022), 2021.
Paudel, D., Boogaard, H., Wit, A., Janssen, S., Osinga, S., Pylianidis, C., and Athanasiadis, I.: Machine learning for large-scale crop yield forecasting, Agric. Syst., 187, 103016, https://doi.org/10.1016/j.agsy.2020.103016, 2021.
Rondeaux, G., Steven, M., and Baret, F.: Optimization of soil-adjusted vegetation indices, Remote Sens. Environ., 55, 95–107, https://doi.org/10.1016/0034-4257(95)00186-7, 1996.
Rouse, J., Haas, R., Schell, J., and Deering, D.: Monitoring Vegetation Systems in the Great Plains with ERTS, NASA Special Publication, Washington, D.C., USA, 1, 48–62, 1974.
Saltelli, A., Tarantola, S., and Chan, P. S.: A quantitative model-independent method for global sensitivity analysis of model output, Technometrics, 41, 39–56, https://doi.org/10.2307/1270993, 1999
Sims, D. A., Rahman, A. F., Cordova, V. D., El-Masri, B. Z., Baldocchi, D. D., Bolstad, P. V., Flanagan, L. B., Goldstein, A. H., Hollinger, D. Y., and Misson, L.: A new model of gross primary productivity for North American ecosystems based solely on the enhanced vegetation index and land surface temperature from MODIS, Remote Sens. Environ., 112, 1633–1646, https://doi.org/10.1016/j.rse.2007.08.004, 2008.
Sivakumar, J., Ramamurthy, K., Radhakrishnan, M., and Won, D.: Synthetic sampling from small datasets: a modified mega-trend diffusion approach using k-nearest neighbors, Knowl.-Based Syst., 236, 107687, https://doi.org/10.1016/j.knosys.2021.107687, 2022.
Tian, H., Wang, P., Tansey, K., Zhang, J., Zhang, S., and Li, H.: An LSTM neural network for improving wheat yield estimates by integrating remote sensing data and meteorological data in the Guanzhong Plain, PR China, Agric. For. Meteorol., 310, 108629, https://doi.org/10.1016/j.agrformet.2021.108629, 2021.
Wang, F., Yi, Q., Hu, J., Xie, L., Yao, X., Xu, T., and Zheng, J.: Combining spectral and textural information in UAV hyperspectral images to estimate rice grain yield, J. Appl. Earth Obs., 102, 102397, https://doi.org/10.1016/j.jag.2021.102397, 2021.
Wang, X., Huang, J., Feng, Q., and Yin, D.: Winter Wheat Yield Prediction at County Level and Uncertainty Analysis in Main Wheat-Producing Regions of China with Deep Learning Approaches, Remote Sens., 12, 1744, https://doi.org/10.3390/rs12111744, 2020.
Wei, S., Li, X., Lu, Z., Zhang, H., Ye, X., Zhou, Y., Li, J., Yan, Y., Pei, H., Duan, F., Wang, D., Chen, S., Wang, P., Zhang, C., Shang, L., Zhou, Y., Pan, P., Zhao, M, Huang, J., Bock, R., Qian, Q., and Zhou, W.: A transcriptional regulator that boosts grain yields and shortens the growth duration of rice, Science, 377, eabi8455, https://doi.org/10.1126/science.abi8455, 2022.
Xu, X., Teng, C., Zhao, Y., Du, Y., Zhao, C., Yang, G., Jin, X., Song, X., Gu, X., Casa, R., Chen, L., and Li, Z.: Prediction of wheat grain protein by coupling multisource remote sensing imagery and ECMWF data, Remote Sens., 12, 1349, https://doi.org/10.3390/rs12081349, 2020.
You, L. Z., Wood, S., Wood-Sichra, U., and Wu, W. B.: Generating global crop distribution maps: From census to grid, AgrSyst, 127, 53–60, https://doi.org/10.1016/j.agsy.2014.01.002, 2014.
Zhao, Y., Han, S., Meng, Y., Feng, H., Li, Z., Chen, J., Song, X., Zhu, Y., and Yang, G.: Transfer-Learning-Based Approach for Yield Prediction of Winter Wheat from Planet Data and SAFY Model, Remote Sens., 14, 5474, https://doi.org/10.3390/rs14215474, 2022a.
Zhao, Y., Han, S., Zheng, J., Xue, H., Li Z., Meng, Y., Li, X., Yang, X., Li, Z., Cai, S., and Yang, G.: ChinaWheatYield30m: A 30-m annual winter wheat yield dataset from 2016 to 2021 in China, Zenodo [data set], https://doi.org/10.5281/zenodo.7360753, 2022b.
Zhao, Y., Meng, Y., Feng, H., Han, S., Yang, G., and Li, Z.: Should phenological information be applied to predict agronomic traits across growth stages of winter wheat?, Crop J., 10, 1346–1352, https://doi.org/10.1016/j.cj.2022.08.003, 2022c.
Zhang, Y., Hui, J., Qin, Q., Sun, Y., Zhang, T., Sun, H., and Li, M.: Transfer-learning-based approach for leaf chlorophyll content estimation of winter wheat from hyperspectral data, Remote Sens. Environ., 267, 112724, https://doi.org/10.1016/j.rse.2021.112724, 2021.