the Creative Commons Attribution 4.0 License.
the Creative Commons Attribution 4.0 License.
 | 06 Sep 2023
CLIM4OMICS: a geospatially comprehensive climate and multi-OMICS database for maize phenotype predictability in the United States and Canada
Parisa Sarzaeim
Diego Jarquin
Hasnat Aslam
Natalia De Leon Gatti
The performance of numerical, statistical, and data-driven diagnostic and predictive crop production modeling relies heavily on data quality for input and calibration or validation processes. This study presents a comprehensive database and the analytics used to consolidate it as a homogeneous, consistent, multidimensional genotype, phenotypic, and environmental database for maize phenotype modeling, diagnostics, and prediction. The data used are obtained from the Genomes to Fields (G2F) initiative, which provides multiyear genomic (G), environmental (E), and phenotypic (P) datasets that can be used to train and test crop growth models to understand the genotype by environment (GxE) interaction phenomenon. A particular advantage of the G2F database is its diverse set of maize genotype DNA sequences (G2F-G), phenotypic measurements (G2F-P), station-based environmental time series (mainly climatic data) observations collected during the maize-growing season (G2F-E), and metadata for each field trial (G2F-M) across the United States (US), the province of Ontario in Canada, and the state of Lower Saxony in Germany. The construction of this comprehensive climate and genomic database incorporates the analytics for data quality control (QC) and consistency control (CC) to consolidate the digital representation of geospatially distributed environmental and genomic data required for phenotype predictive analytics and modeling of the GxE interaction. The two-phase QC–CC preprocessing algorithm also includes a module to estimate environmental uncertainties. Generally, this data pipeline collects raw files, checks their formats, corrects data structures, and identifies and cures or imputes missing data. This pipeline uses machine-learning techniques to fill the environmental time series gaps, quantifies the uncertainty introduced by using other data sources for gap imputation in G2F-E, discards the missing values in G2F-P, and removes rare variants in G2F-G. Finally, an integrated and enhanced multidimensional database was generated. The analytics for improving the G2F database and the improved database called Climate for OMICS (CLIM4OMICS) follow findability, accessibility, interoperability, and reusability (FAIR) principles, and all data and codes are available at https://doi.org/10.5281/zenodo.8002909 (Aslam et al., 2023a) and https://doi.org/10.5281/zenodo.8161662 (Aslam et al., 2023b), respectively.
- Article
(9497 KB) - Full-text XML
- BibTeX
- EndNote


The evolving nature of Earth system models, proximal and remote sensing, instrumentation, artificial intelligence, and data availability requires a more comprehensive suite of analytics for quality and consistency controls (Livneh et al., 2015; Reyer et al., 2020; Quiñones et al., 2021; Rico et al., 2021; Westhues et al., 2022; Winn et al., 2023) that foster democratization of data collection, management, transformation, and adoption of findability, accessibility, interoperability, and reusability (FAIR) principles. In this changing digital environment, data quality and uncertainty assessment of the training and testing datasets become critical for improving model performance and the ability to predict systems of natural and human origins (Furche et al., 2016; Jiang et al., 2017; Sarzaeim et al., 2022a). We introduce the analytics for quality and consistency controls useful for the development and consolidation of an enhanced, high-quality, large-scale, and multidimensional database for maize phenotype predictability using genomic and phenomic (OMICS) data and meteorological and climatological observations distributed across maize production areas in the US, the province of Ontario in Canada, and the state of Lower Saxony in Germany.
The creation of multidimensional databases consistently grapples with integrating the multiple sources and spatiotemporal attributions of data, including variety, velocity, volume, and seven other characteristics known as the “Vs” of big data (Firican, 2017; Janev, 2020). Exploration, discovery, planning, and management of biological systems under volatile and unevenly distributed climate conditions favor the collection, transfer, transformation, and construction of multidimensional databases with disparate structures and uncertainties (Gonzalez-Rouco et al., 2001; Hubbard et al., 2005; Brönnimann et al., 2006; Sertel et al., 2010; Chiu et al., 2009; Sarzaeim et al., 2022a). The use of accessible analytics for quality and consistency controls for a growing availability of OMICS data including climate data becomes critical for creating and making valuable databases, favoring data construction, access, improvement, and use for discovery and innovation (Overpeck et al., 2011; Shekhar et al., 2017; Baru et al., 2022).
Generally, quality control (QC) frameworks are characterized by the identification of technical errors in data collection (Livneh et al., 2015) and the diagnostics and removal of data outliers (Gonzalez-Rouco et al., 2001; Alkhalifah et al., 2018). Habib et al. (2010) described QC as a process designed to check the correctness and completeness of models' input data. QC is traditionally oriented to detect and discard erroneous samples, decreasing uncertainties in model outputs. For example, Chiu et al. (2009) employed QC based on geospatial interpolation to identify missing data and eliminate erroneous values in a dataset of geospatially and heterogeneously distributed meteorological stations. While the heterogeneity of the spatially distributed data is critical, temporal gaps are an integral part of a robust database for predictive phenotype analytics and models. Lin and Habib (2021) proposed a framework for QC of multitemporal data for phenotyping from lidar, developing external and internal controls to increase accuracy in automated phenotyping. In another study, van Wart et al. (2013) applied a QC algorithm to detect the incorrect temperature, precipitation, relative humidity, and solar radiation values in time series released by NOAA in parts of the US Midwest and replaced the missing values using interpolation techniques. Similar approaches have been developed and operationalized for hydroclimate data (Maurer et al., 2002; Livneh et al., 2013, 2015). The application of QC analytics for high-dimensional databases has been tested in crop models such as HybridMaize (van Wart et al., 2013) and statistical models such as the genotype by environment (GxE) approach (Sarzaeim et al., 2022a) to predict maize yields. The latter found that improvements in yield predictability are directly related to data improvements. However, it remains to be seen whether additional improvements in the inputs and the model or the database enhancement based on certain variables can improve the predictability of phenotypes and, eventually, identify the underlying processes that drive it.
On the other hand, the uncertainty in monitoring and sampling and the inconsistency among the collected data structures and formats are other limitations of predictive analytics and models. Zeng et al. (2015) defined consistency control (CC) as an intercomparison among independent datasets of the same product, leading to possible synergies to enhance the product. The CC contributes to consolidating multidimensional climate and OMICS databases with different formats for phenotype simulations. The designed CC cross-checks the quality-controlled OMICS and climatic datasets, discarding discontinued data segments containing corresponding missing values and synthesizing the remaining consistent datasets ready for crop growth simulation and prediction applications. Several studies underscore QC and CC's critical and complementary roles in improving model prediction accuracy (Feng et al., 2004; Matthews et al., 2013). For example, Hartkamp et al. (1999) showed how the accuracy of agronomic models' output is affected by the input data quality, emphasizing that data QC is a prerequisite for model applications and that the data CC is complementary for successful model operations. The solutions for the incompatibility of input data and their effects on data availability improvement have been presented in their study to show the critical role of CC and QC practices. Other efforts by Amaranto et al. (2019, 2020) illustrate the need for QC and CC data to improve the predictability of variables connected by human or natural origin processes, such as crop evaporative demands and natural and engineered water supplies.
Uncertainty analysis is critical for developing and implementing models and analyzing observations and simulations. Surendran Nair et al. (2012) and Merchant et al. (2017) shed some light on the sources of uncertainty in models' inputs, structures and parameters, and calibration or validation. Muñoz-Arriola et al. (2009), Pogson (2011), Asseng et al. (2013), and Jaimes-Correa et al. (2022) explain that simplifying the models or using variables that represent key complex processes can contribute to explaining the sensitivities in model performance to uncertainties in input data and multiple environmental processes. The integration of multiple variables also represents a challenge for estimating and explaining uncertainties that emerged from, for example, compounded temperature and precipitation and is affected by sampling density and interpretation of spatially distributed data (Rehana et al., 2022; Liu et al., 2022). Furthermore, uncertainties associated with climate and crop model performance require data that allow analyses of error propagation from the inputs to the outputs (Asseng et al., 2013; Amaranto et al., 2020). The diagnostic analyses of observed data and the sensitivity of model performance to the uncertainties in the inputs are related to the quality and consistency controls in high-dimensional datasets. These relationships also show the necessity of expanding input data and quantifying uncertainties to improve models and model performance for geospatially suitable and reliable applications (Robertson et al., 2014).
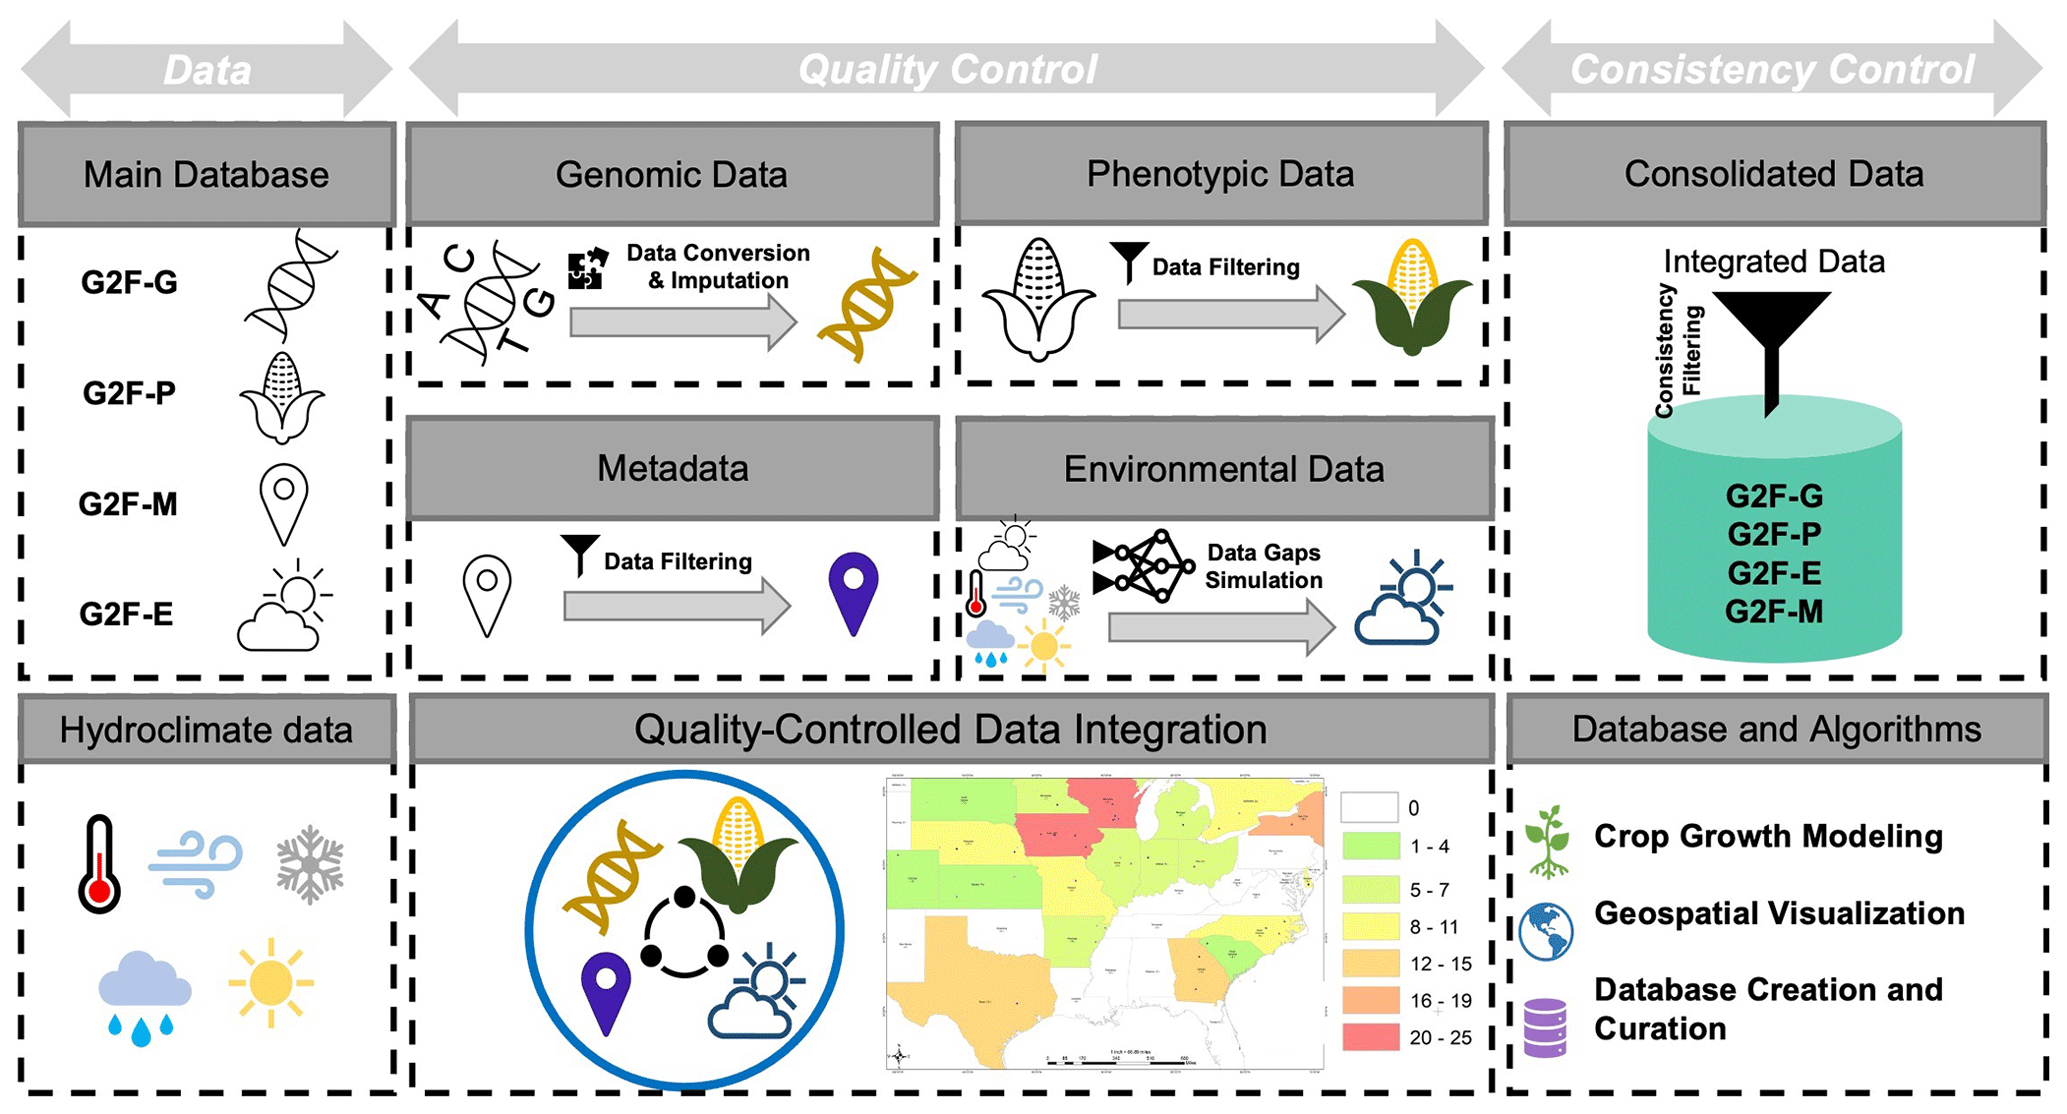
Figure 1A conceptual framework of quality and consistency control algorithms for the multidimensional Genomes to Fields (G2F) OMICS and hydroclimatic database. “G2F-G” denotes G2F genomic data, “G2F-P” denotes G2F phenotypic data, “G2F-M” denotes G2F metadata, and “G2F-E” denotes G2F environmental data. The map indicates the locations and number of sites per state used by the G2F initiative and represented in CLIM4OMICS (the map is expanded as Fig. A1).
In crop phenotype predictability, large-scale and geospatially distributed experiments integrate crop genetics and climate data to map regions suitable for growing and managing resources adaptively to climate and land use changes (Muñoz-Arriola et al., 2009; Tang et al., 2012; Rosenzweig et al., 2013; Jarquín et al., 2014; Ruane et al., 2015; Jarquin et al., 2021; Sarzaeim et al., 2022a). The Genomes to Fields (G2F) initiative is a large-scale effort designed and operated to improve the predictability of maize phenotypes across the US (http://www.genomes2fields.org, last access: 21 August 2023; Genomes to Fields, 2013). The G2F initiative has released a well-documented, large-scale, and sharable database for maize breeding, capturing the phenotypes in response to genetic improvement and environmental changes (Alkhalifah et al., 2018). Engineers, researchers, and economists interested in understanding maize genetic functionality across environments can benefit from the G2F database for phenotypic simulation using statistical models including the genotype by environment (GxE) interaction (Lawrence-Dill et al., 2019). The initial implementation of QC in the G2F database aims to remove the outliers (Alkhalifah et al., 2018). However, large-scale enterprises are more likely to expand errors and inconsistencies like missing samples, uneven records, and emerging locations. Additionally, inconsistencies between the collected data structures and formats have been maintained rather than the editing for consistency (Alkhalifah et al., 2018). These limitations reduce the advantages of using the G2F database for implementing the GxE models. Consequently, improving the datasets through gap-filling and providing a consistent data structure and format is necessary for implementing predictive analytics and models adequately. Hence, we use the G2F data to test a quality and consistency control (QC–CC) framework for the database improvement and uncertainty quantification of input data in the predictability of maize yields in the US, the province of Ontario in Canada, and the state of Lower Saxony in Germany. The G2F database offers a geospatial and multidimensional suite of variables useful for predicting maize traits using models including the GxE interaction. It can improve parameterizations of the Earth system and crop models (Rosenzweig et al., 2013; Ruane et al., 2015; Winn et al., 2023). The required four-dimensional database for training and testing the GxE models and the output visualization consists of (1) sequences of maize genomic molecular markers for multiple inbred genotypes (G2F-G), (2) observed phenotypic variables (G2F-P), (3) time series of spatially distributed environmental variables for each experimental trial (G2F-E), and (4) metadata for further analytics and geospatial visualization purposes (G2F-M). Figure 1 illustrates a conceptual framework of the quality and consistency control algorithms of the G2F data to build homogeneous, consistent, and multidimensional OMICS and environmental time series for maize phenotype modeling and prediction.
Open and valid data sources are the foundation for open-source science (Wilkinson et al., 2016; Peng et al., 2022), which is built upon FAIR principles. When these databases follow the FAIR principles, researchers and communities trigger discovery, innovation, and the democratization of digital resources (Livneh et al., 2015; Wilkinson et al., 2016; Amaranto et al., 2018; Quiñones et al., 2021; Peng et al., 2022). However, access constraints are still a limiting factor in user innovation and more expedited improvement in data and algorithms for collection-to-curation pipelines. This study consolidates a homogeneous, enhanced, and high-dimensional database following the FAIR data principles for applications in maize breeding; phenotypic modeling; and prediction within statistical, data-driven, or biophysical modeling frameworks.
The objectives of this study are to (1) design and develop a QC–CC framework to construct an enhanced multidimensional database for GxE modeling and geospatial analyses of maize phenotype predictability, (2) quantify the environmental input data uncertainties used for maize yield predictions, and (3) provide access to the database and the QC–CC framework pipeline.
The study contains six additional sections. Section 2 provides a comprehensive description of the original G2F database containing a review of each dataset and the associated limitations of the G2F data and metadata. Section 3 contains the foundation and algorithm explanation for the QC module for each dataset (Sect. 3.1), the CC algorithm and the compatible multidimensional datasets from the quality-controlled data (Sect. 3.2), and the quantification of uncertainty based on the environmental time series errors (Sect. 3.3). The results and discussion of the study are presented in Sect. 4. Finally, the data availability statement and concluding remarks are summarized at the end of Sect. 4 and Sect. 5, respectively.
The goal of the G2F initiative is to collect the key datasets for understanding the roles played by the genotype, environmental conditions, and agricultural management practices in crop traits (Lawrence-Dill et al., 2019). Since 2014, the G2F initiative has designed several maize field experiments across the US, the province of Ontario in Canada, and the state of Lower Saxony in Germany to integrate a large-scale and multidimensional database required for maize trait prediction. This database provides opportunities for further research and development in data analytics and different types of modeling approaches for maize phenotype prediction by incorporating genotypes by environment interactions. The G2F platform is updated annually to publish the genomic data, phenotypic data, environmental data, and metadata collected from the maize field trials. The genomic data are published in one file containing the molecular markers of all maize inbred lines tested and/or used as parents of the hybrids observed in the G2F sites in the experimental years. While the phenotypes, environments, and metadata are published in separate annual years, there are two released versions for all phenotypic and environmental data for a given year: (1) raw and (2) clean data files. The raw file is the first integrative version of the data collected by the G2F collaborators at each experimental site. After implementing initial checks on the format, data structure, and wrong-entry calibration, the clean file is the controlled version of the raw file. This study uses the clean version files, yet there are still several missing values, typos, and data structure inconsistencies among the clean version files from different years, which constrains the use of data for any analytics, simulation, and visualization practices (Genomes to Fields initiative, 2014, 2015, 2016, 2017, 2018, 2019, 2020, 2021).
The following subsections review each G2F dimension.
2.1 Dimension 1: G2F genomic data (G2F-G)
G2F has generated, stored, and released molecular genetic sequences at the level of single nucleotide polymorphisms (SNPs) for 1576 lines tested across the environments. The SNPs are the most common type of genetic variation among individuals. These data have been generated by the genotyping-by-sequence method, known as GBS (McFarland et al., 2020). The hierarchical data format (HDF) stores the sequenced raw SNP data of all tested cultivars for data reliability and storage efficiency. The raw genomic data stored in one single HDF file are available through the G2F platform for public access. Figure 2 shows a screenshot of a slice of the G2F-G hierarchical database stored in a single HDF file.
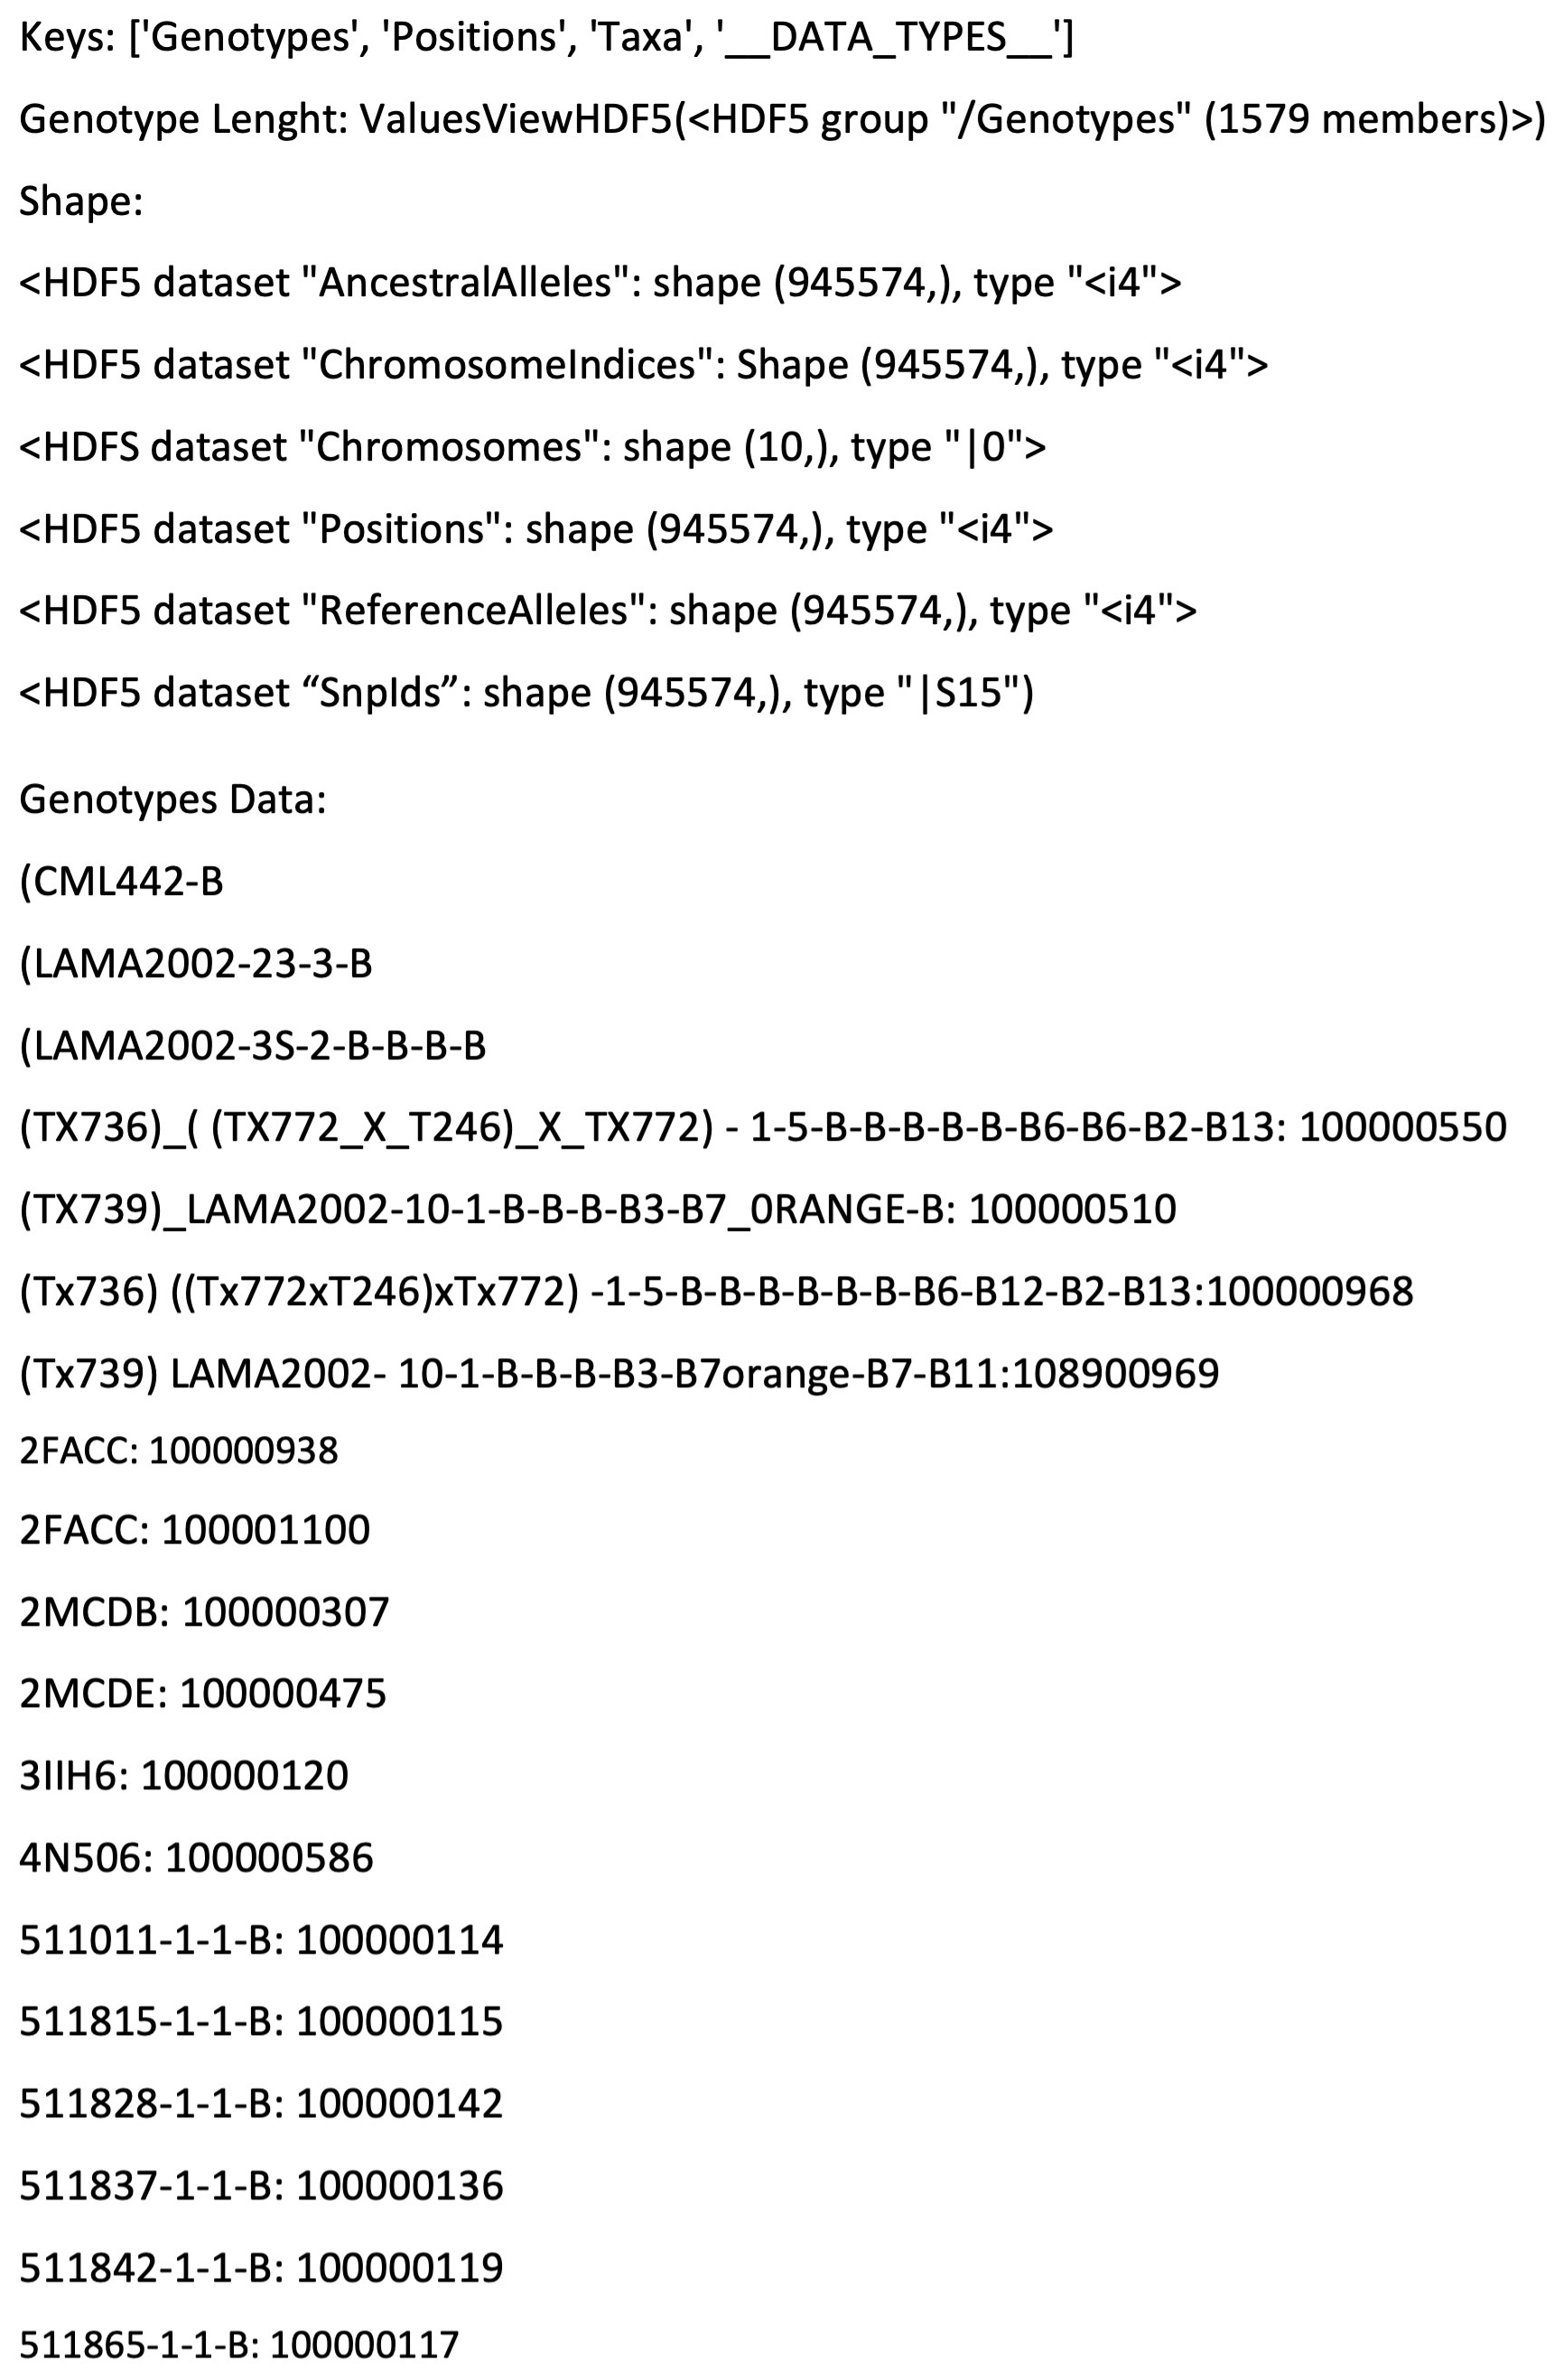
Figure 2A screenshot of the raw G2F-G data file stored in a single HDF file showing a portion of the complex hierarchical data structure of SNP sequences.
Table 1Overview of raw G2F-G data illustrating the genotyping by sequencing the molecular marker sequences of different hybrids stored in a single HDF-format file. The first column shows the maize hybrid codes, and the first row shows the locus information. The letters A, T, G, C, and R are a sample of the major and minor alleles in different marker positions. The letter N denotes the missing markers in a genetic sequence at each molecular site. The source file directory for the genetic data is in “File Upload/Genotype/Markers.txt” in the database package.
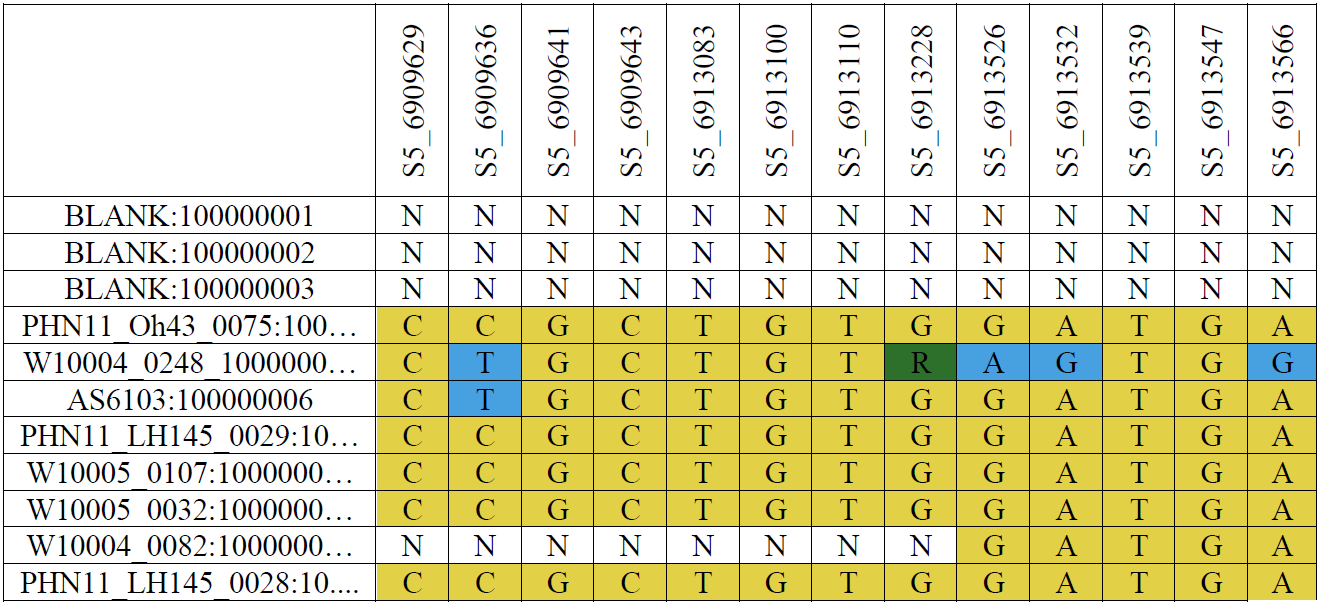
The published G2F-G HDF file is designed to be processed by the software Trait Analysis by aSSociation, Evolution and Linkage (TASSEL; Bradbury et al., 2007). TASSEL contains statistical approaches for trait association mapping, evolutionary patterns, and disequilibrium linkage (TASSEL, 2022). Table 1 is a screenshot of a portion of the G2F molecular marker dataset open in TASSEL, illustrating a comprehensive structure of genetic sequences.
2.2 Dimension 2: G2F maize phenotypic data (G2F-P)
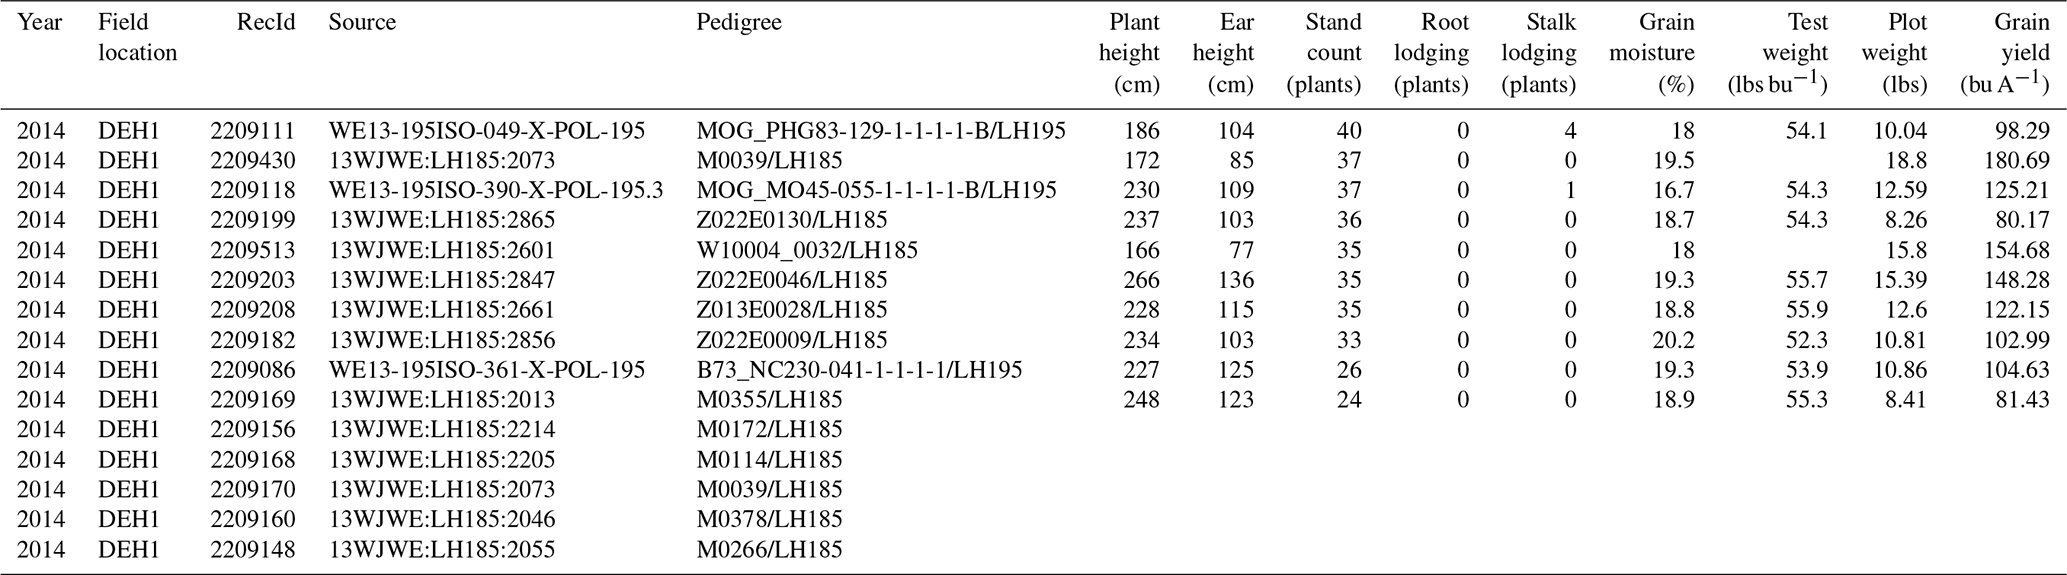
Different types of phenotypic variables have been collected as part of the G2F experiment: time-related traits recorded during the growing season such as the number of days to silking or pollen or flowering traits; yield components such as plant height (cm), ear height (cm), ear width (cm), and ear length (cm); and harvest or end traits such as grain yield. Other traits like root or stalk lodging occurrence are monitored before the harvest, and the number of stands, grain moisture (%), and grain yield (bu A−1) are collected at harvest. More additional information, phenotypic variable definitions, and measurement techniques and devices can be found in the Genomes to Fields Phenotyping Handbook (http://www.genomes2fields.org; Genomes to Fields, 2013). All the mentioned variables for all cultivars are recorded and released annually in comma-separated-values (.csv) format through the G2F platform. Table 2 represents data types of different variables and shows a slice of the G2F-P dataset.
Table 2Overview of the raw G2F-P data stored in “.csv” file format showing detailed information of the phenotypic observations in 2014 as one example of the multiyear data. The “Year” column shows the year of a specific G2F experiment, the “Field location” column shows the four-character name of the G2F experiment consisting of the state abbreviation in the first two characters and the name of the hybrid experiment in the last two characters tested in that state, the “RecId” column shows the ID of the phenotypic record, the “Source” column shows the source of the collected phenotypic sample portal, the “Plant height (cm)” column shows the height of the plant in centimeters, the “Ear height (cm)” column shows the height of the ear in centimeters, the “Stand count (plants)” column shows the number of plants per plot at harvest, the “Root lodging (plants)” column shows the number of plants that show the root lodging per plot, the “Stalk lodging (plants)” column shows the number of broken plants per plot at harvest, and the “Grain moisture (%)” column shows the percentage of the water content in plants at harvest. The other phenotypic variables have been measured and stored in similar columns. The blank cells represent the missing values of phenotypic observations. The source file directory for the phenotypic data example is in “File Upload/Phenotype/g2f_2014_hybrid_data_clean.csv” in the database package.
2.3 Dimension 3: G2F environmental data (G2F-E)
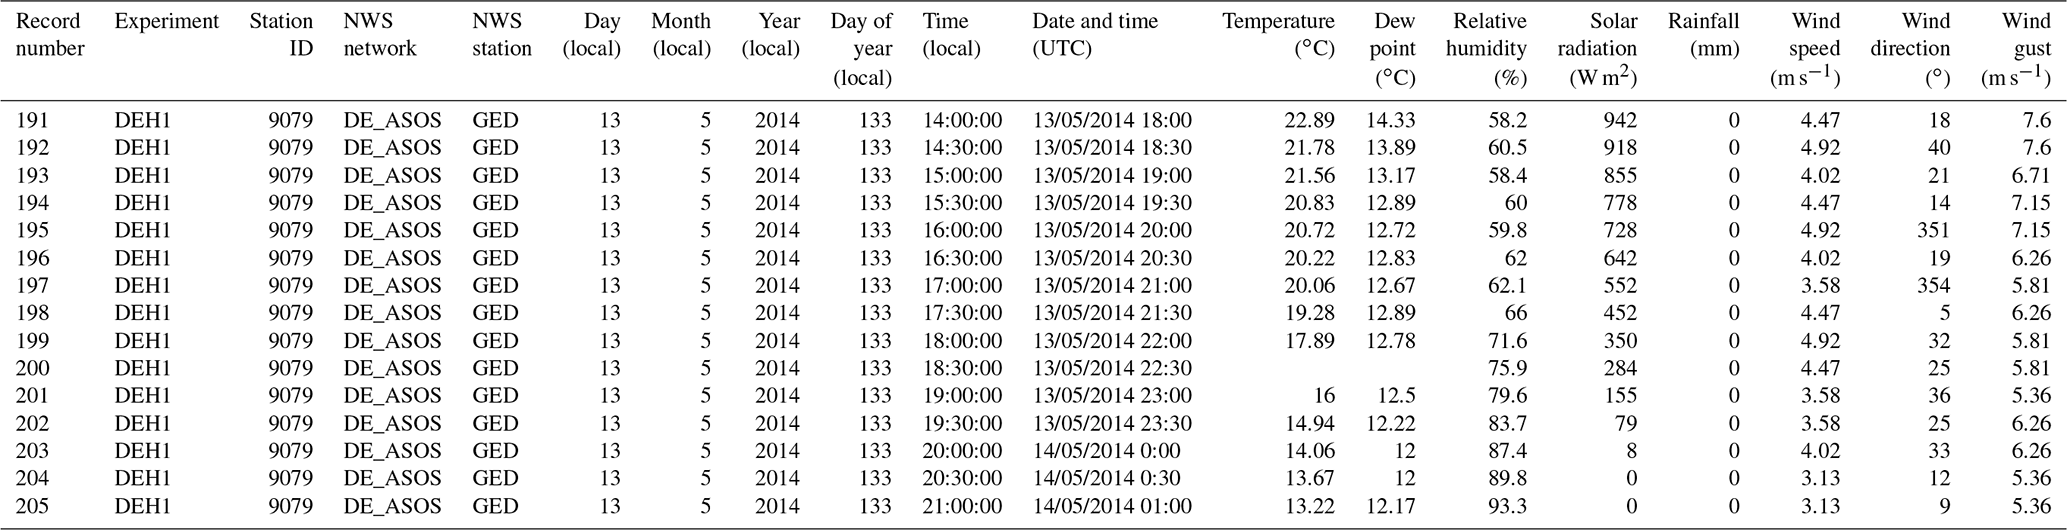
Each G2F trial field is equipped with a WatchDog 2700 weather station (http://www.genomes2fields.org). These weather stations record the environmental data, mainly the climatic drivers in maize growth during the growing season, including temperature (T, ∘C), dew point (DP, ∘C), relative humidity (RH, %), solar radiation (SR, W m−2), rainfall (R, mm), wind speed (WS, m s−1), wind direction (WD, ∘), and wind gust (WG, m s−1). The annual environmental data are collected using weather stations at each experimental field with a temporal resolution of 30 min and stored in .csv format. Data collected from every weather station are stored in one file for each year and are accessible through the G2F website. The National Weather Service (NWS) station in the Automated Surface Observing Systems (ASOS) network nearest to each of the G2F weather stations installed in the trial field has been used for false-data calibration by G2F collaborators across the G2F layout (Alkhalifah et al., 2018; Jarquin et al., 2021). The hydroclimatic time series extracted from the NWS stations have been released along with the G2F hydroclimatic time series observed in the experiments. Table 3 represents a screenshot of a slice of G2F-E data in 2014 data stored in .csv format.
Table 3Overview of raw G2F-E data stored in .csv file format showing the environmental time series in tabular format for 2014 as one example of the multiyear data. The “Record number” column shows the number of weather station records in each experiment. The “Experiment” column shows the four-character name of the G2F experiment consisting of the state abbreviation in the first two characters and the name of the hybrid experiment in the last two characters tested in that state. The “Station ID” column shows the ID of the weather station. The “NWS network” and “NWS station” columns show the nearest NWS network and station used for initial QC by the G2F collaborators. The “Day (local)”, “Month (local)”, “Year (local)”, and “Day of year (local)” columns show the local day, month, year, and day of year of the weather record. The “Date and time (UTC)” column shows the coordinated universal time. The “Temperature (∘C)”, “Dew point (∘C)”, “Relative humidity (%)”, “Solar radiation (W m−2)”, “Rainfall (mm)”, “ Wind speed (m s−1)”, “Wind direction (∘)”, and “Wind gust (m s−1)” columns show the hydroclimatic time series. The blank cells represent the missing values of phenotypic observations. The source file directory for the environmental data example is in “File Upload/Environment/g2f_2014_weather.csv” in the database package.
External environmental databases
To gap-fill the climatic datasets, we need to use externally accessible databases. Here three publicly available databases are proposed for use for this purpose: (1) the National Solar Radiation Database (NSRDB), modeling and integrating a half-hourly 4 × 4 km2 meteorological dataset in the nation developed by the U.S. Department of Energy (Sengupta et al., 2018); (2) DayMet, the 1 × 1 km2 Daily Surface Weather and Climatological Summaries developed by Thornton et al. (2022); and (3) ASOS, developed by the NWS, which is a station-based program containing daily and subdaily historical and forecasting hydroclimates. These public databases release temperature (∘C), dew point (∘C), relative humidity (%), solar radiation (W m−2), rainfall (mm), pressure (mb; Pa), wind speed (m s−1), wind direction (∘), and precipitable water (mm).
2.4 Dimension 4: G2F metadata (G2F-M)
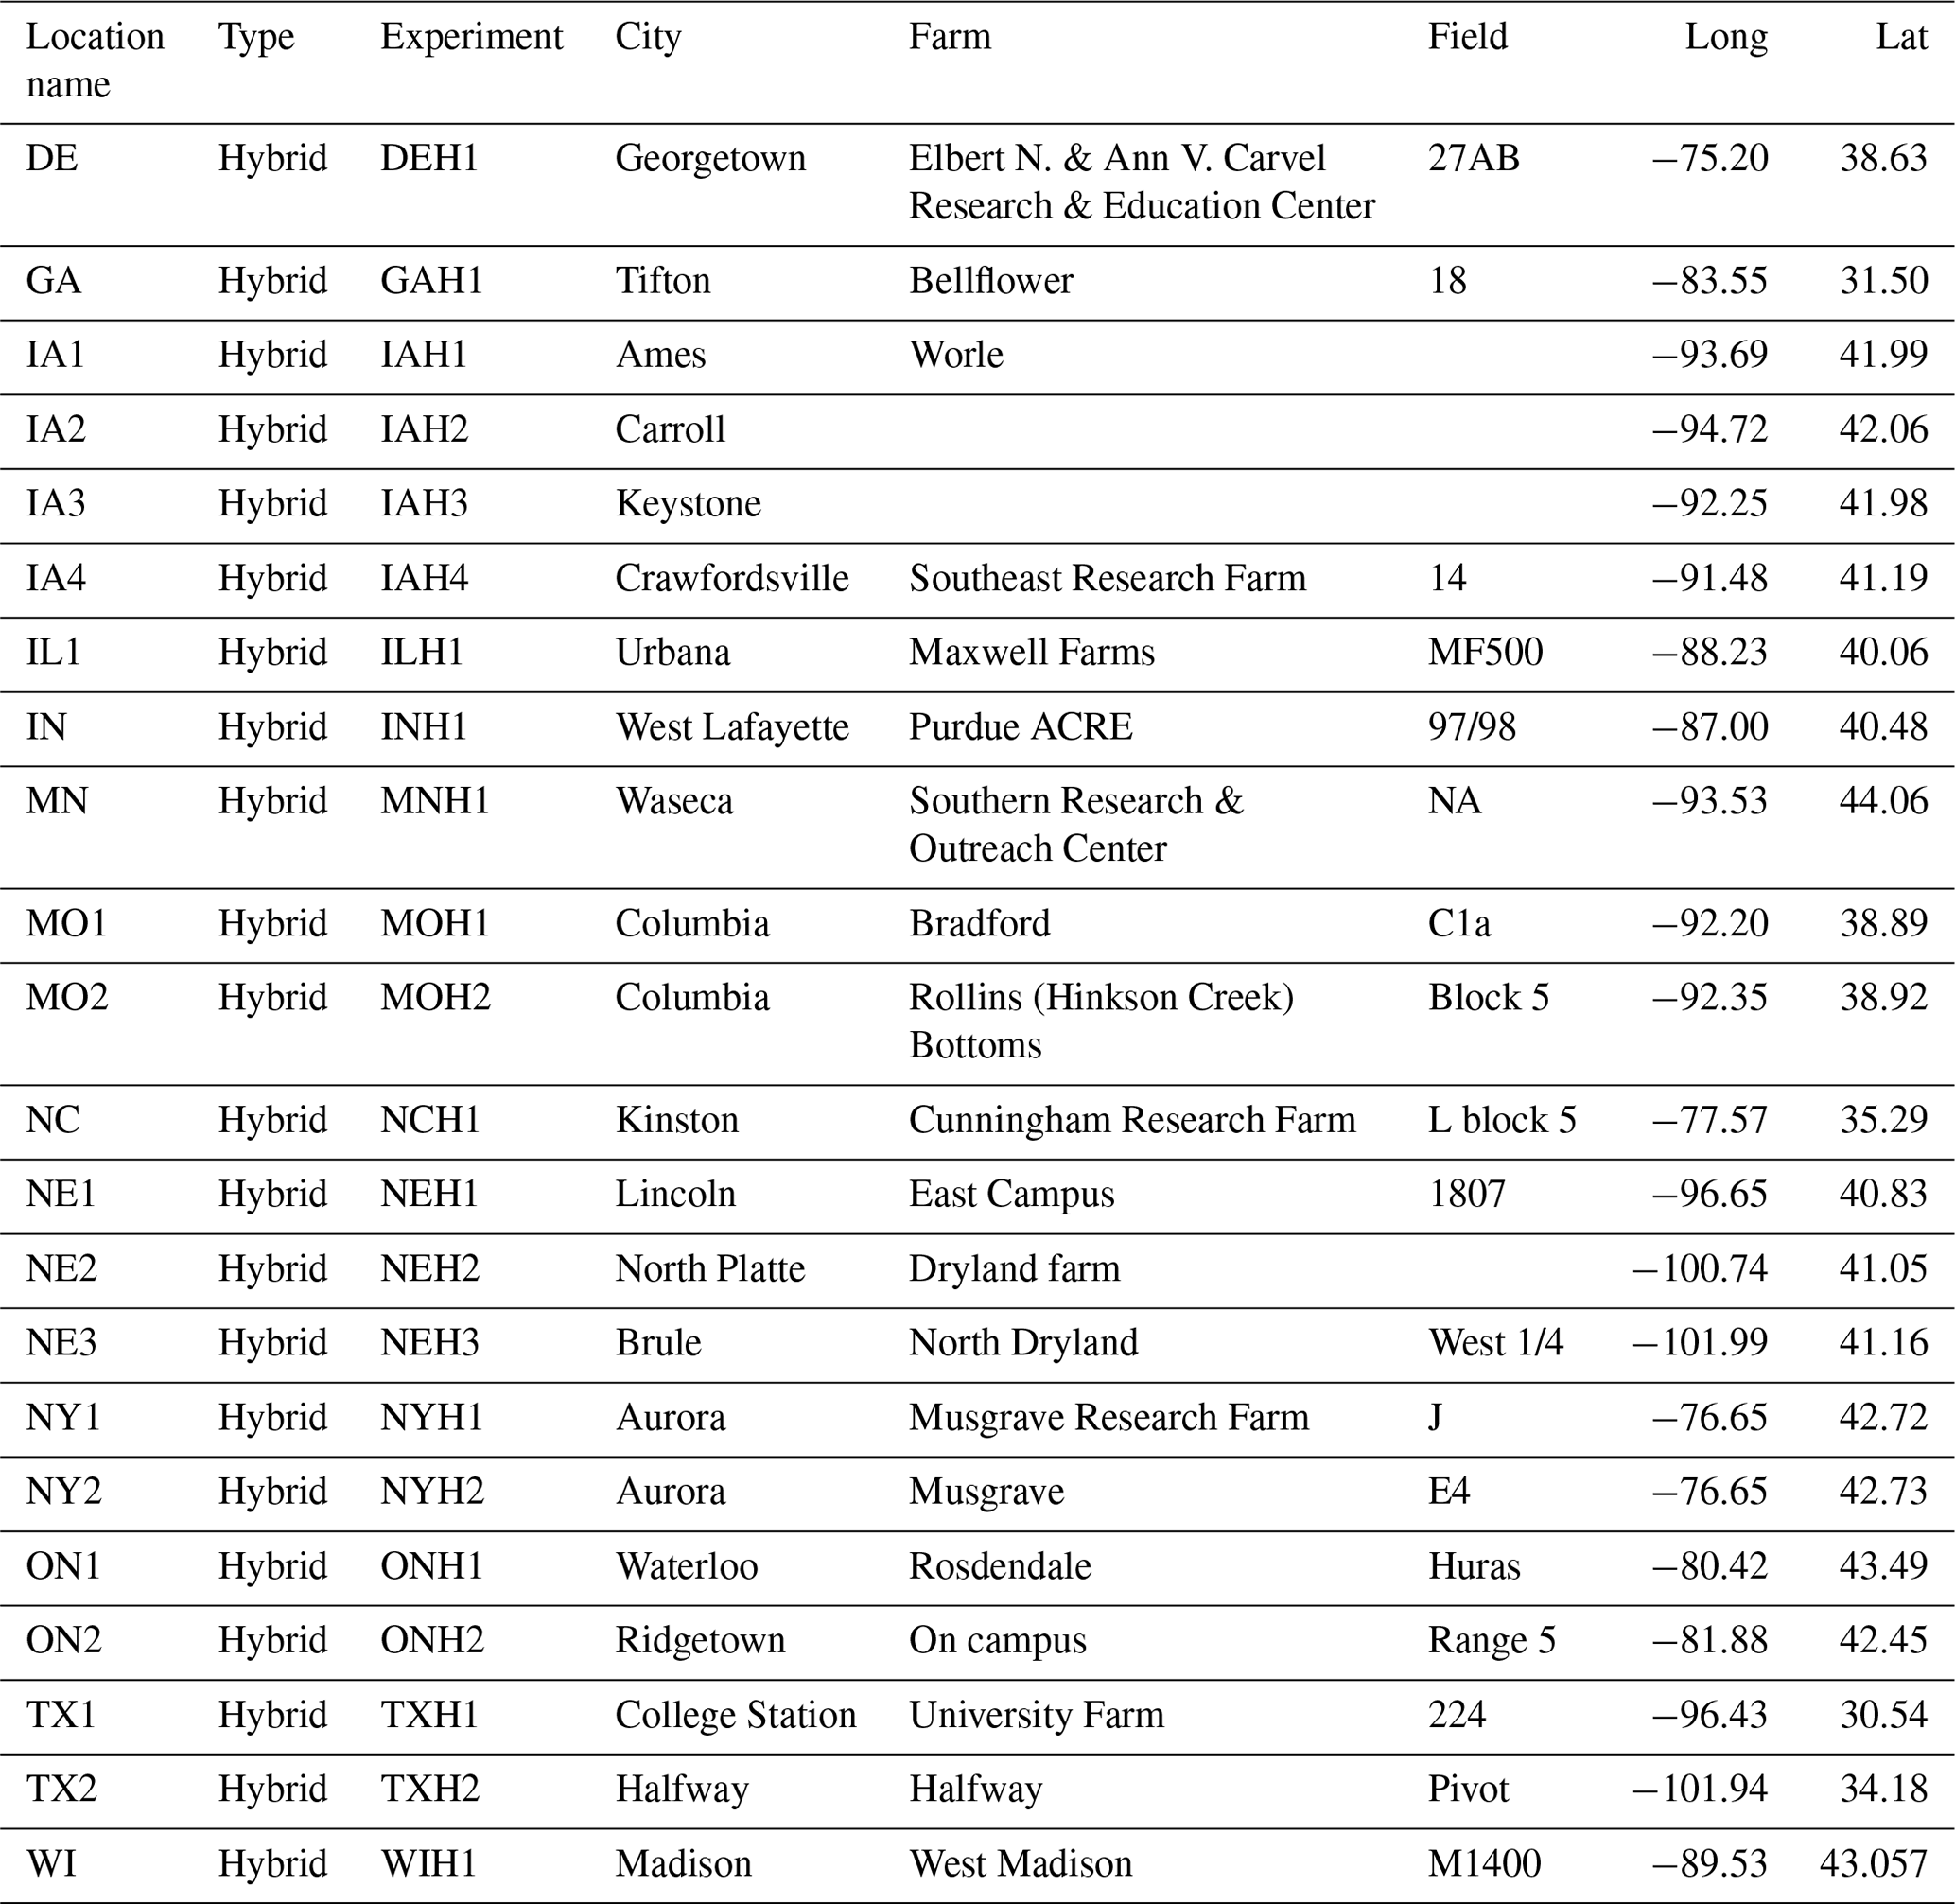
The metadata information is supplementary data about each experiment, including the name, ID, year, state, city, farm name, planting and harvesting dates, weather station serial number, weather station geolocation, and farm boundaries. These metafiles are released annually in .csv format through the G2F website. Table 4 represents a screenshot of a slice of G2F-M data in 2014 stored in .csv format.
Table 4Overview of raw G2F-M data stored in .csv file format showing the metadata collected for the 2014 experiments as one example of the multiyear data. The “Location name” column shows the state and the number of the experiment in that state. The “Type” column shows the type of experiment, which can be hybrid or inbred. The “Experiment” column shows the four-character name of the G2F experiment consisting of the state abbreviation in the first two characters and the name of the hybrid experiment in the last two characters tested in that state. The “City” column shows the city in which the experiment was carried out. The “Farm” column shows the name of the farm on which the experiment was carried out. The “Field” column shows the name of the field of the experiment. The “Long” and “Lat” columns show the longitude and latitude of the weather station installed in the field. The source file directory for the metadata example is in “File Upload/Meta/g2f_2014_field_characteristics.csv” in the database package.
3.1 Database quality control
The QC–CC is a two-module data preprocessing pipeline developed in Python for each of the G2F data dimensions (G2F-G, G2F-P, G2F-E, and G2F-M) released between 2014 and 2017 (Fig. 2). The QC module focused on four general phases, and they have specific extensions for each data dimension. The general QC phases are
-
reading raw files,
-
checking the data format and structure,
-
detecting missing values and data gaps in the datasets, and
-
implementing predictive data analytics to fill gaps.
In the first step, the raw files for G2F-P, G2F-E, and G2F-M are read to identify whether the necessary information is recorded in the right column with the appropriate header name (some headers are presented in Tables 2–4). The complete lists of appropriate headers for each data dimension are represented in Sect. 3.1.2–3.1.4. When the released files lack structure and a consistent format, the next step is to correct the respective columns and header names. Then, the missing values in each dataset are searched and identified, and the appropriate QC methods (i.e., assign an average value for G2F-G and a predicted value based on a deep neural network for G2F-E; Sarzaeim et al., 2022a) are adopted to impute the missing values. After performing all of the above steps for each dataset, the quality-controlled datasets are restored in the updated files and transferred to the CC module. The subsections below explain the methodological QC steps for each G2F data dimension (Fig. 2 illustrates the associated algorithm).
3.1.1 Submodule 1: G2F-G
G2F stores and releases genomic sequence data in an HDF file. It is noteworthy that, unlike the phenotypic data, environmental data, and metadata released annually through the G2F website, the genomic data file has been made available once in a consolidated HDF file containing the molecular marker sequences of all maize inbred lines used as parents of the hybrids tested in all the G2F experiments.
First, we downloaded the raw genotypic data file from the G2F platform, converted it to text (.txt) format, named it “Markers.txt”, and saved it in the “File Upload/Genotype” directory in the database package (Aslam et al., 2023a). The text file is then preprocessed to (1) convert the SNPs to numerical genotypic data, (2) exclude the genotypes with a large percentage of missing values in their genetic sequence, (3) exclude the genotypes that lack allelic variation, and (4) impute the missing SNPs for the remaining cultivars (see Fig. 2). These steps were integrated and implemented as follows in a single script in Python named “01_Transformations.py” located in the “G2F data preprocessing/Genotype” directory.
-
The raw HDF file released by G2F has been created in the structure that works only in TASSEL as “blackbox” software. The developed script extracts the molecular genetic markers from the text file and converts them to numerical genotypes in .csv format. This step facilitates the processing of the SNPs within the Python environment. The numerical genotype values are the probability of a major allele being selected randomly in a site marker. Thus, the minor and major homozygous alleles are converted to 0 and 1, respectively, and the heterozygous alleles are converted to 0.5.
-
A script was developed to discard the cultivars with more than 20 % missing values in their genetic sequence, providing enough DNA information for further analyses. The 20 % threshold percentage is called the percent of missing values (PMV), which varies according to the criteria of the data user. Here, we used the PMV proposed by Jarquín et al. (2017).
-
The SNPs with a minor allele frequency (MAF) smaller than 3 % were removed. This filter aims to discard the genotypes that lack allelic variation. As in the previous step, the MAF threshold used is from Jarquín et al. (2017).
-
The remaining missing SNPs for each individual are filled using the average of the numerical genotypes at each locus (p). If the average is equal to or smaller than 0.5 (the probability of heterozygous selection), the missing values are filled by the p. Otherwise, the missing values are imputed by 1−p. The screened lines and their filled SNP sequences are generated and stored in a clean version of genotypic data in “.csv” format.
3.1.2 Submodule 2: G2F-P
Multiple participants affiliated with the G2F initiative monitored maize's growth stages and harvest (http://www.genomes2fields.org). Examples of phenotypes include plant morphology (e.g., plant height, cm), ear morphology (e.g., ear height, cm; width, cm; length, cm), and plant productivity (e.g., grain moisture, %; yield, bu A−1). While in this study we focused on yield for simulation and prediction purposes (bu A−1), other phenotypes are made available and can be used.
The phenotypic datasets are released on an annual basis through the G2F website in .csv format. First, for preprocessing, we download the raw data files from all available years and save them in the “File Upload/Phenotype” directory, and then the QC is implemented to (1) check whether the first-level data known as primary columns are available, (2) check whether the second-level data known as secondary columns are available, and (3) remove the missing samples (Fig. 2). These steps are described below.
-
The primary columns are the first-level data necessary for further processing. These columns are “Year”, “Field Location”, “Pedigree”, “Plant Height [cm]”, “Ear Height [cm]”, “Grain Moisture [%]”, and “Grain Yield [bu A−1]”. The Python script “01_Phenotype_Files_Primary_Columns.py” verifies whether the mentioned headers are available in the phenotypic files. Note that the input is case-sensitive, and in many cases there are typos in the headers in the raw files. Thus, the script returns the associated error(s) with typos and suggests how to fix them. The user fixes those typos manually in the raw files. Otherwise, the file is ready for the secondary-column control step.
-
The secondary columns represent the second-level data necessary for further analysis, but if they are not available in the raw files, they can be constructed based on primary columns. These columns are “ID”, “Experiment”, “Experiment ID”, “Pedigree”, “P1”, and “P2”. “Location” denotes the state and the name of the hybrid experiment. “Experiment” refers to the environment, year, state, and name of the hybrid experiment. “Experiment ID” refers to the unique ID, which is the combination of the hybrid experiment's year, state, and name. P1 and P2 denote the maize hybrid parental pedigrees' names. The Python script “02_Phenotype_Files_Secondary_Column.py” controls the availability of these columns. If they are not available in the raw files, they will be created automatically from the data available in the primary columns.
-
We need the phenotypic observations to train and test the crop growth model (e.g., the GxE model). In many cases, the phenotype's observed measurements have been missed from recording, and thus the missing phenotypic samples are filtered out from the database by applying the “01_Phenotypes.py” script.
The developed Python scripts for steps (1) and (2) are located in the “File Control/Phenotype” directory, and the script for step (3) is located at “G2F data pre-processing/Phenotype” in the database package.
3.1.3 Submodule 3: G2F-E
The G2F environmental time series consists of T (∘C), DP (∘C), RH (%), SR (W m−2), R (mm), WS (m s−1), WD (∘), and WG (m s−1) collected during the growing season from planting to harvest. The following QC steps and the developed Python scripts are designed to preprocess the above hydroclimatic variables. The users can adapt the scripts to integrate other environmental time series.
The G2F-P and G2F-E QC steps are similar except for some extensions of the latter. The G2F-P datasets are single measurements sampled at a specific maize-growing stage for each individual plant, while the G2F-E datasets are time series of continuous hydroclimate records along the maize-growing season for each experimental site. The hydroclimate time series data required additional preprocessing actions to form the G2F-E QC. The additional actions include the initial elimination of erroneous hydroclimatic records, corrections of experiment names, and dataset categorizations accounting for the missing values.
For G2F-E preprocessing, we first download the raw data files from all available years. Then, we save the data files in the “File Upload/Environment” directory in the database package and implement the QC. The QC procedure (1) checks whether the first-level data, known as primary columns, are available; (2) checks whether the second-level data known as secondary columns are available; (3) checks whether the missing samples in each experiment in each year exist; and (4) imputes the data gaps (see Fig. 2). These steps are described below in detail.
-
The primary columns are the first-level data necessary for further processing. These columns are “Station ID”, “Experiment”, “Day [Local]”, “Month [Local]”, “Year [Local]”, “Time [Local]”, Temperature [C]”, “Dew Point [C]”, “Relative Humidity [%]”, “Solar Radiation [W m−2]”, “Rainfall [mm]”, “Wind Speed [m s−1]”, “Wind Direction [degrees]”, and “Wind Gust [m s−1]”. The Python script “01_Weather_Files_Primaty_Column.py” located in subdirectory “File Control/Environment” checks whether these columns with exactly the mentioned headers are available in the environmental files. Note that, like G2F-P, the input is case-sensitive. Thus, the script exactly returns the associated error where there is a mismatch and provides suggestions for fixing typos. Also, the user needs to fix the typos manually in the raw files. Otherwise, the file is ready for the next control step.
-
The secondary columns are the second-level data necessary for further analysis, but if they are not available in the raw files, they can be constructed based on primary columns. The columns for weather data are “Record Number” and “Day of Year [Local]”. The Python script “02_Weather_Files_Secondary_Column.py” located in “File Control/Environment” controls the availability of these columns. If the columns are not available in the raw files, they will be created automatically from the data available in the primary columns.
-
Before checking for the missing values, we can perform an initial check on the time series and remove the remaining erroneous samples after the G2F collaborators have implemented the QC. The “03_Control.py” script is saved in the “File Control/Environment” directory. This initial check occurs in the Python script and depends on the weather variables and their possible value range.
-
For “Relative Humidity [%]”, the script removes the x values if x<0 or x>100.
-
For “Solar Radiation [W m−2]”, the script removes the x values if x<0.
-
For “Rainfall [mm]”, the script removes the x values if x<0.
-
For “Wind Direction [degrees]”, the script removes the x values if x<0 or x>360 and assigns an x value to empty if the “Wind Speed [m s−1]” is zero.
For further analysis, we need to have a consistent and informative protocol to uniquely name the experiments because of the many experiments implemented in each state and field. Additionally, the name format should be consistent in the entire QC module. We created a name format that illustrates the split of the raw files into as many .csv files as experiments that are recorded in each raw environmental file. The newly generated filenames are self-described as “YearStateExperiment”. For example, “2014ILH1.csv” refers to the environmental file containing the weather time series recorded for experiment “H1” implemented in the state of “IL” in the year “2014” and stored in .csv format. The scripts “01_Weather_Data_Reading.py”, which reads the environmental data with correct primary and secondary columns and corrects the values from all years, and “02_Name_Fixing.py”, which fixes the experiment names, are both in the “G2F data preprocessing/Environment” directory. The environmental datasets are categorized into three groups based on the presence of missing values in the raw environmental data files: (1) “complete”, (2) “empty”, and (3) “incomplete”. The separate Python script “Database.py” for each hydroclimatic variable goes through the generated files with a specific name containing the environmental time series for each experiment in each year to check whether all the records during the growing season are available or not. For example, if all records of temperature for a given experiment are available, this dataset belongs to the “complete” group. If all the temperature records are empty, that dataset belongs to the “empty” category. If the temperature dataset is not categorized into the above groups, it belongs to the “incomplete” category. The “complete” datasets are directly transferred to the updated environmental database ready for the CC module. However, the “empty” and “incomplete” datasets must be imputed, filled, and then moved to the improved database. A separate Python script has been developed to categorize each hydroclimatic variable into the three groups above and within the “Database” subdirectory of the database package.
-
-
For gap-filling of the “empty” and “incomplete” time series, we developed an evaluation–improvement pipeline (Sarzaeim et al., 2022a). This pipeline acquires an external hydroclimate (i.e., NSRDB, DayMet, and NWS) through developed application programming interfaces (APIs). The Python APIs are located in the “API” folder in the database package for downloading, storing, and processing the G2F hydroclimate time series in the available locations and years. Afterwards, the script imputes the best-fitted dataset from NSRDB, DayMet, or NWS for any given hydroclimatic variable to the “empty” datasets. Following Aslam et al. (2023a), the “incomplete” datasets use a separate script for predictive analytics of deep neural networks to cover the missing hydroclimate values in the G2F-E time series, which are stored in the “ML” folder and are part of the database package (Aslam et al., 2023b, c). The updated “empty” and “incomplete” datasets are transferred to the updated improved G2F-E database and later used by the CC module. For ease of selecting the desired experiment(s) by users, a Python script has been developed and stored in the “Selection” folder of the database package and offers experiment options for users to select.
3.1.4 Submodule 4: G2F-M
The metadata files contain the digital information relevant to the experiments released annually on the G2F website in .csv format. For preprocessing, we download the raw data files from all available years, save them in the “File Upload/Meta” directory, and then implement the control. Then, control (1) checks whether the first-level data known as primary columns are available, (2) checks whether the second-level data known as secondary columns are available, and (3) checks whether any experiments with unknown locations are available (see Fig. 2). The scripts for steps (1) and (2) are stored in the “File Control/Meta” directory, and the script designated for step (3) is located in the “G2F data preprocessing/Meta” directory, all within the database package. These steps are described below in detail.
-
The primary columns are the first-level data necessary for further processing. These columns are “Experiment”, “Lat”, and “Long”. “Lat” and “Long” denote the latitude and longitude of the weather stations located in the field. The “01_Meta_Files_Primary_Columns.py” script first checks whether these primary columns with the exactly listed headers are available in the metadata files. Note that the input is case-sensitive. Thus, the script returns the associated error where there is a mismatch and suggests how to fix it. In this case, the user needs to fix the typos manually in the raw files. Otherwise, the file is ready for the next control step.
-
The secondary columns are the second-level data necessary for further analyses. These columns are “State”, “Experiment ID”, and “Experiment type”. Note that there are two types of experiments conducted by the G2F collaborators: inbred and hybrid experiments. Here, we need the hybrid experiments for the GxE simulation. The “02_Meta_Files_Secondary_Columns.py” script controls the availability of secondary columns. If they are not available in the raw files, they will be created automatically from the information available in the primary columns.
-
For model output postprocessing and geospatial visualization, the “01_Lat_Lon_Reader.py” script requires the latitude and longitude of the experiments. Additionally, if a given dataset is categorized as empty or incomplete, the G2F experiment location is also required to geolocate and extract the associated values from other databases. The experiments with missing latitude and longitude are removed.
3.2 Consistency control
The CC module is the last preprocessing step before data are ready for model implementation (i.e., GxE modeling). The CC module integrates all controlled and updated files from the QC module, checks their compatibility as inputs for GxE modeling, and synthesizes the multidimensional database for phenotypic simulation and postprocessing. The compatibility check is required by the GxE model and is only possible when genomic data, phenotypic data, environmental data, and metadata are present.
When some genotypic markers, phenotypic observations, or metadata are discarded in the QC submodules, the CC removes those experiments with at least one missing dimension in the controlled files. The designed Python script for the CC module is saved in the “Control” folder in the database package.
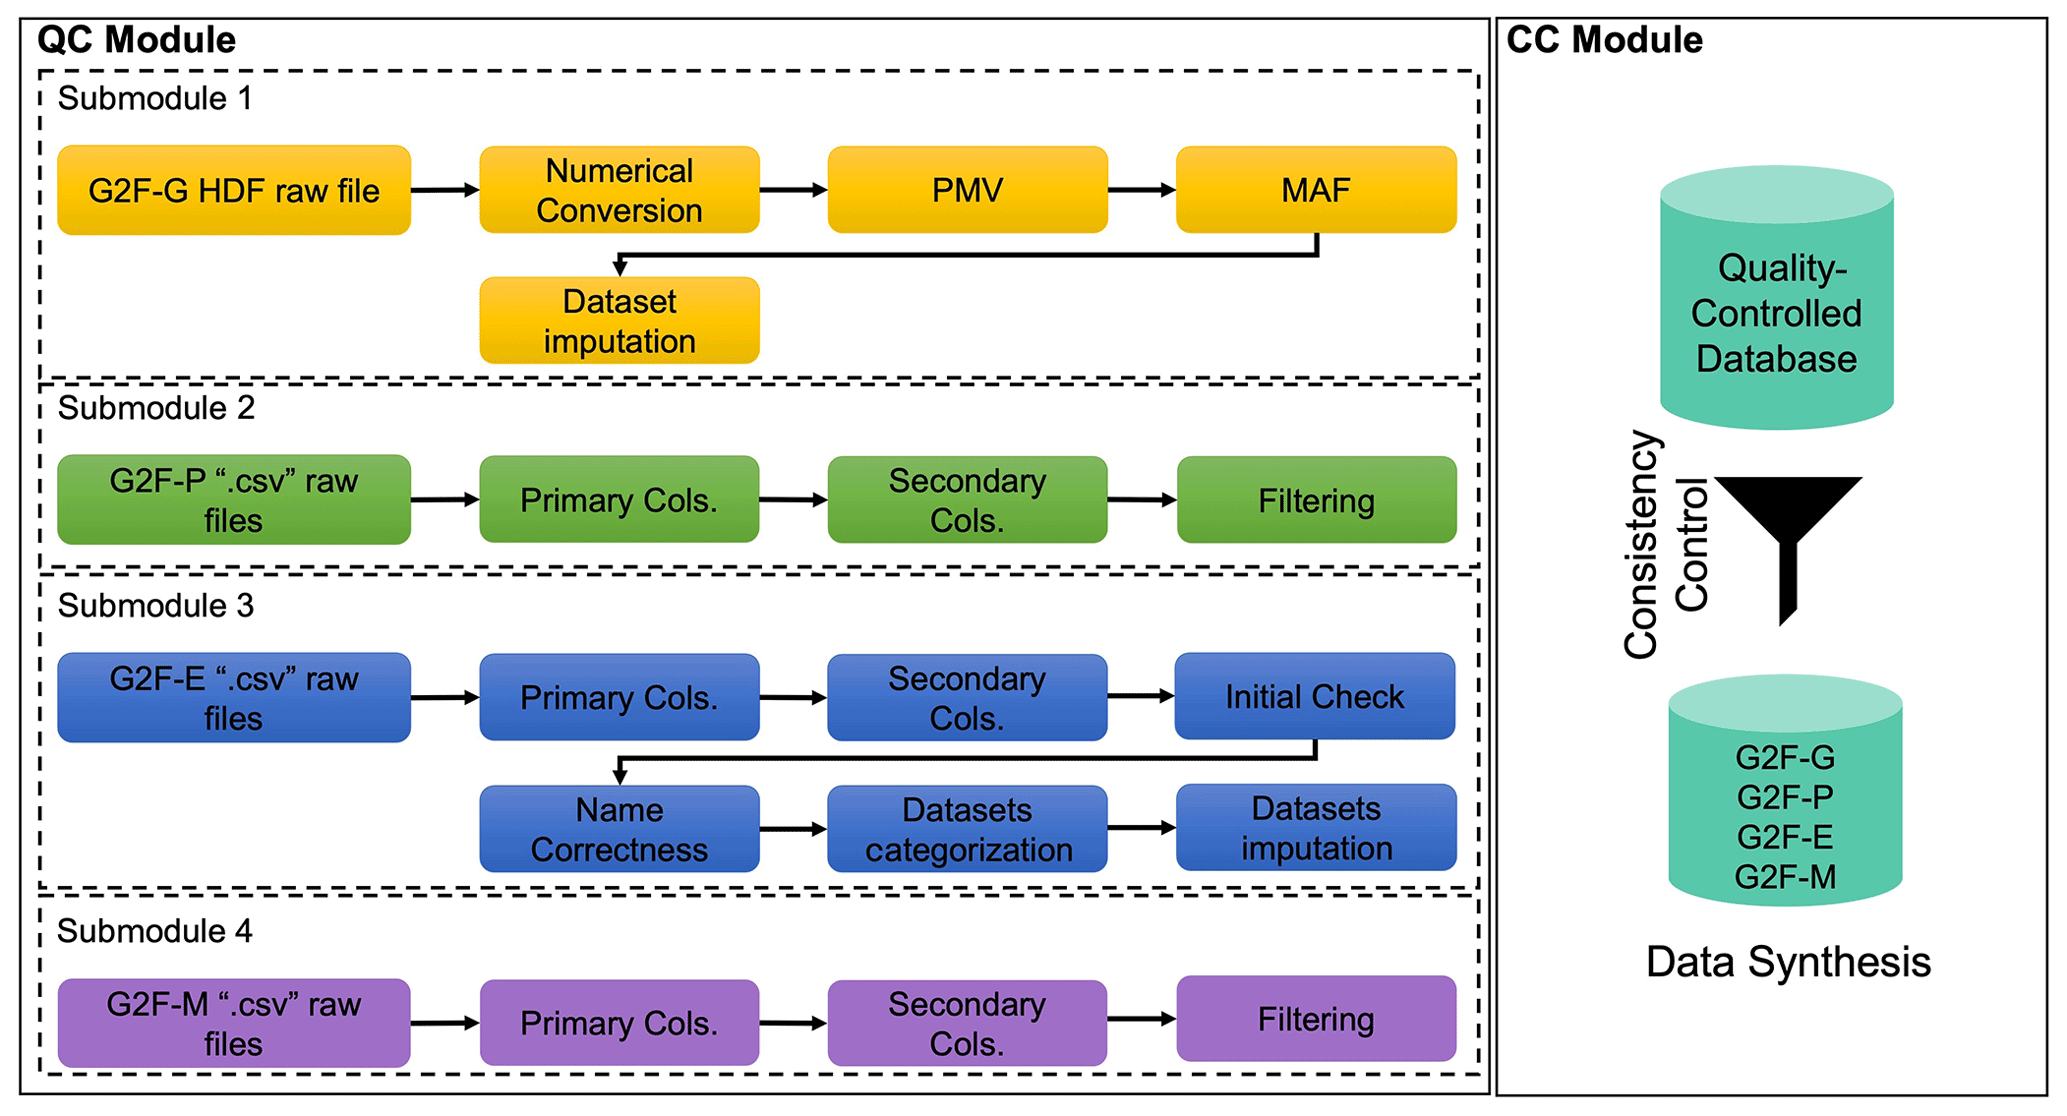
Figure 3The overall algorithmic QC–CC framework for the G2F database. “G2F-G”, “G2F-P”, “G2F-E”, and “G2F-M” denote the G2F genomic data, phenotypic data, environmental data, and metadata, respectively. “PMV” and “MAF” denote the percentage of missing values and minor allele frequency, respectively. “Primary Cols.” and “Secondary Cols.” denote the primary and secondary columns, respectively.
Figure 3 conceptualizes the QC–CC algorithm for each dimension. First, each dataset is controlled by its format, availability, and imputation. Then, the quality-controlled datasets are evaluated for compatibility purposes for the simulation process in the CC module.
3.3 Uncertainty
For the quantification of uncertainty in improved climate data by other data sources (i.e., NSRDB, DayMet, and NWS), we used the differences in the standard deviation (SD) between the climatic time series of the G2F and other data sources used for G2F-E data imputation. The SD represents the dispersion of the probability distribution function (PDF) of errors and measures the magnitude of the standard uncertainty according to Merchant et al. (2017). The following equation represents the error term:
where errG2F-option is the difference between G2F time series and other options, is the G2F-observed value of variable m at day t, and is the value of variable m from other options at day t. The uncertainty is estimated as a spatial aggregate for the area of study. However, the algorithm can be implemented by station if the degrees of freedom are adequate. A separate script, “Uncertainty.py”, was developed to quantify the uncertainty for each hydroclimatic variable located in the “Database” folder of the database package.
In this study, we aim to introduce a quality and consistency data control framework that includes the consolidation of pipelines for retrieval, transformation, improvement, and access to spatiotemporal, large-scale, and multidimensional databases for plant breeding. The provided QC–CC pipeline uses a high-dimensional G2F database that involves genomic data, phenotypic data, environmental data, and metadata, integrating and improving a database for maize yield predictability. The results of the QC module applications are presented in Sect. 4.1 to 4.4. The results of the CC module and data synthesis are presented in Sect. 4.5. Finally, the uncertainty introduced by external environmental databases to improve the G2F-E is presented in Sect. 4.6.
4.1 G2F-G QC
Plant-breeding and genetic improvement programs focus on developing more productive cultivars resistant to uncertain environmental conditions. These uncertain conditions include a wide range of biotic (i.e., diseases, pests, and herbicides) and abiotic (i.e., drought, heat, cold extremes, wet weather, and water limits) stresses (Blum, 2011) that directly affect the crops' productivity and yields. The crop yield (and other commercially essential phenotypes) can be improved in the target environment by selecting the varieties resistant to the environmental stresses (Cattivelli et al., 2008; Sarzaeim et al., 2021). The molecular marker data for tested lines in multiple environments across the large scale of the US and Ontario in Canada provide the opportunity to diagnose and select superior and tolerant maize lines with specific environmental stresses in each environment.
There are extensively published datasets for phenotypic measurements, biophysical parameters, and geospatial environmental observations in croplands. Gómez-Dans et al. (2022) released an integrative dataset in western Africa, including location, leaf area index, and maize yield values. In another study, Weber et al. (2022) published a high-quality, multi-crop, and multiyear database during the crop phenological stages containing canopy height, leaf area index, biomass, and soil water content and temperature in Europe. However, the lack of genetic data may limit the ability to diagnose superior lines. Thus, providing and publishing high-quality crop genomic datasets and ground phenotypic and environmental observations adds value to designing climate-resilient cropping systems for a changing climate. Poland et al. (2012) and Jarquín et al. (2014) underscored that crop DNA data consist of missing values due to the technical inadequacy of sequencing. Also, Alkhalifah et al. (2018) described the main limitations of G2F datasets, including G2F-G, with missing data at several marker sites. We previously observed the missing sequencing values in Table 1. To overcome this limitation, the generated numerical genotypes for each maize line pass through the PMV to remove the genotypes containing missing values of more than 20 % of the whole sequence. Along with the PMV, the MAF filter eliminates the uncommon variants. Lopes et al. (2015) described how rare variants are usually removed because of the limited population size and maintain an acceptable precision level in phenotyping.
After applying the PMV and MAF filters, 253 lines were removed, and 1323 individuals with numerical genotypes were kept for further analysis. This process led to missing values in the genome sequences in the remaining cultivars of less than 20 %, and the minor allele frequency is larger than 3 %. The defined strategy in Sect. 3.1.1 fills the missing values at marker sites of the remaining 1323 maize lines, and the integrated, imputed, and enhanced G2F-G datasets are ready for further analysis.
4.2 G2F-P QC
Overall, phenotypic field measurements of 89 549 individual cultivars have been recorded for maize inbred and hybrid experiments between 2014 and 2021 across G2F sites. Figure 4 shows the spatial distribution of phenotypic measurements sampled for each G2F experiment. The minimum and maximum observations are 38 and 1257, sampled in the “2017COH1” and “2018TXH1” experiments, respectively. The total numbers of observations in 2014 were 5834 and 13 790 in 2021 (15 577 observations were recorded in 2019).
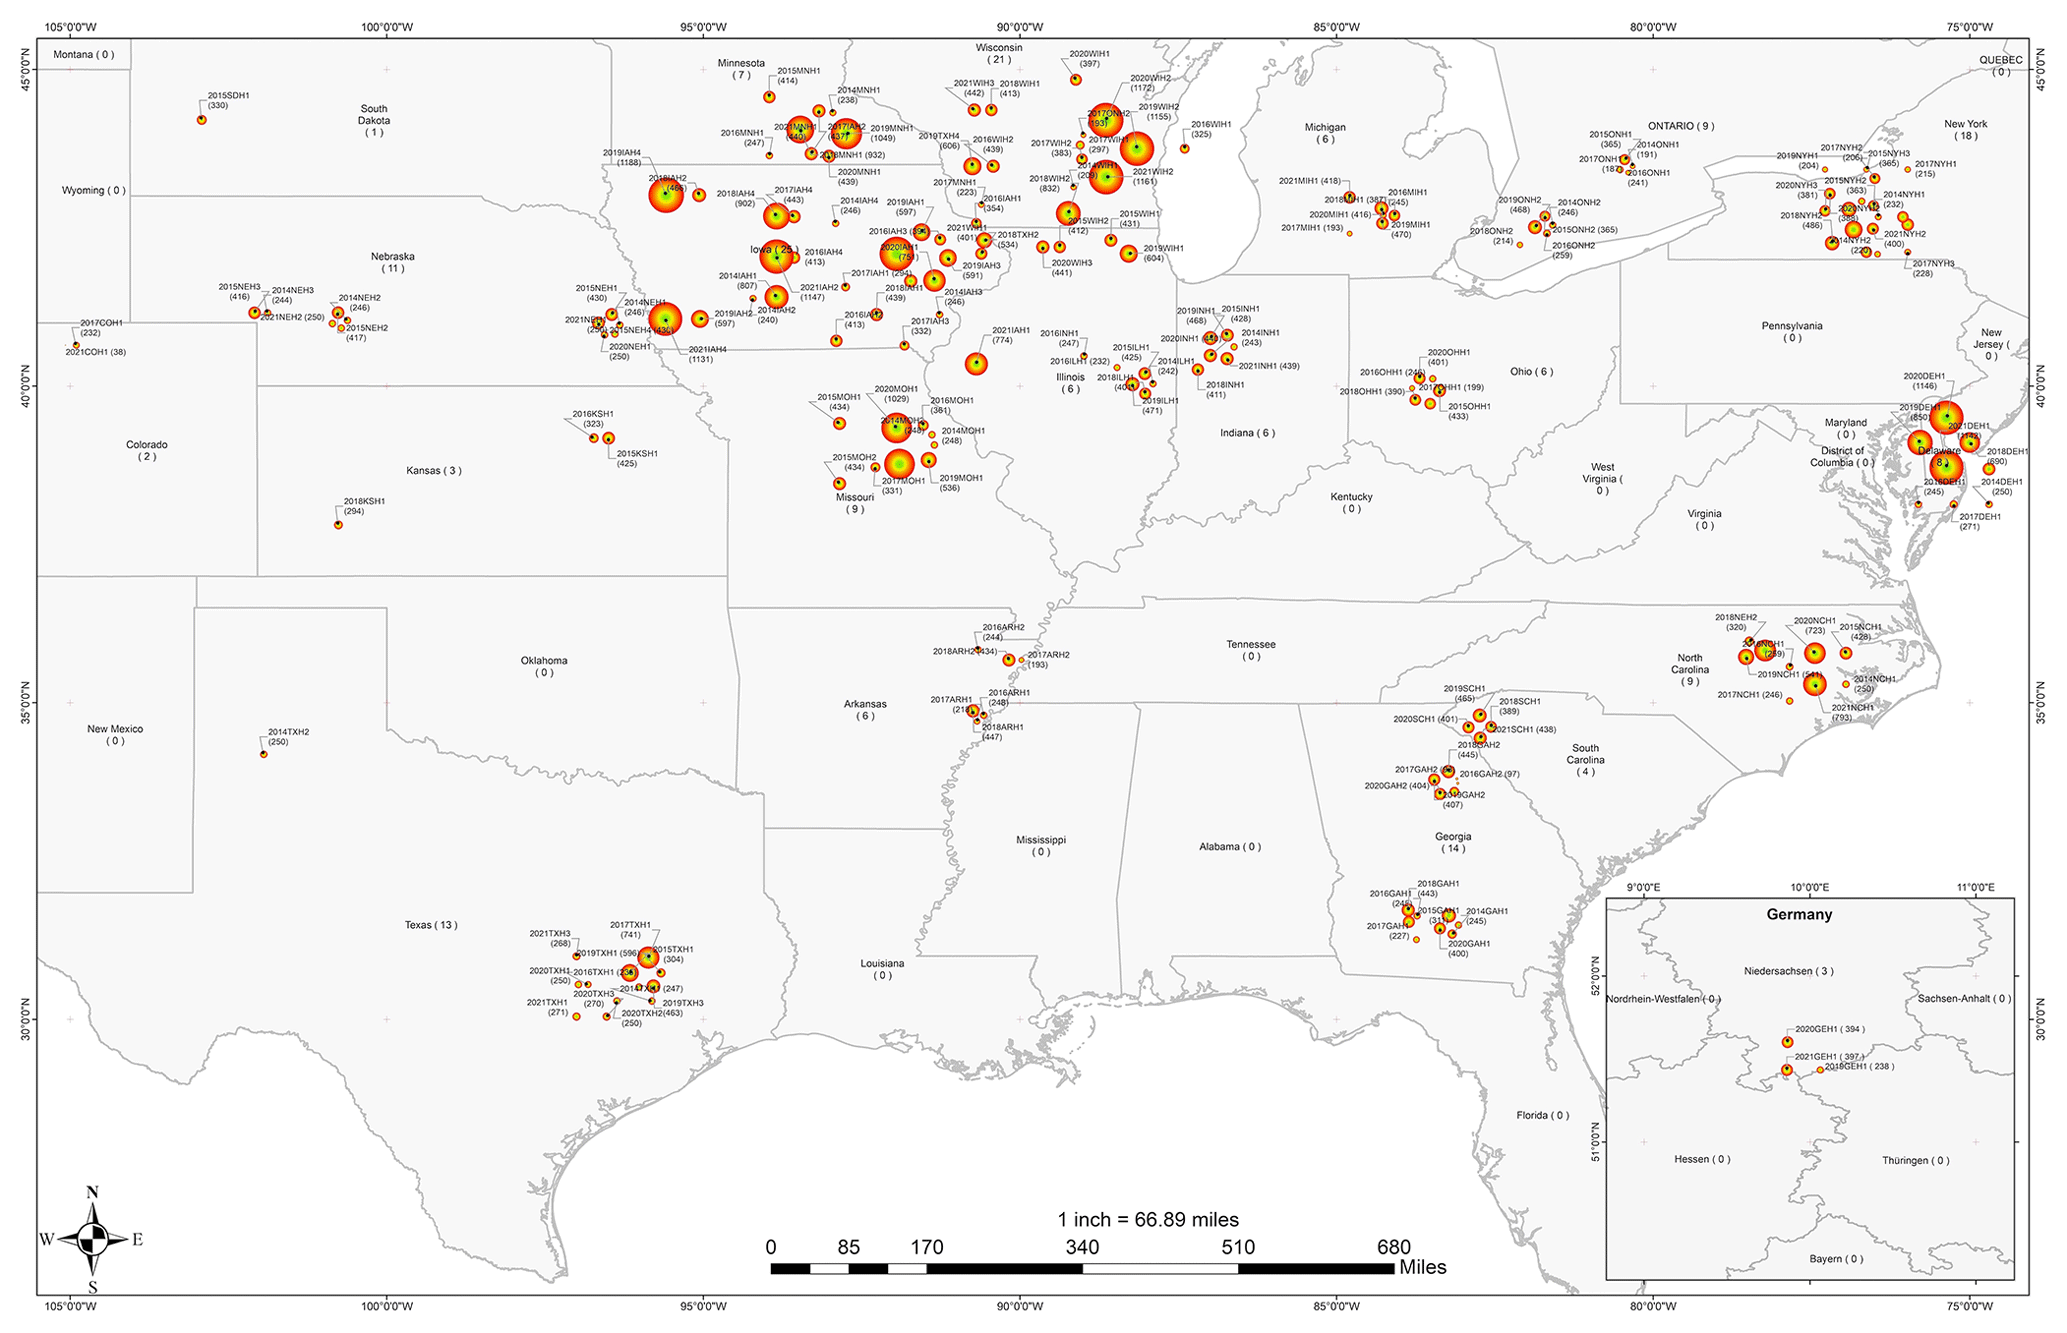
Figure 4The spatial distribution of phenotypic records of G2F experiments in the US regions and the province of Ontario in Canada between 2014 and 2021. The state of Lower Saxony in Germany includes the years 2018, 2020, and 2021 for three locations. The location of each station on the map was modified for visualization purposes, allowing the illustration of stations with multiyear records. The size of the circle represents the number of years sampled, which also appears within the parentheses next to the year at each site. The colors of the circles were included for visualization purposes only.
Table 5Record of a single G2F-P dataset. It shows the phenotypic measurements, including “Plant height (cm)”, “Ear height (cm)”, “Grain moisture (%)”, and “Grain yield (bu A−1)”, for a maize hybrid with pedigrees of “B37” and “MO17” collected in the “2014-DEH1” experiment located in Delaware in 2014. The ID of the record is “2014_DEH1_B37/MO17”, and the ID of the experiment is “2014DEH1”. “H” denotes the hybrid type of the experiment, “P1” and “P2” denote the pedigrees of the maize hybrid, and “DE” denotes the state of Delaware.
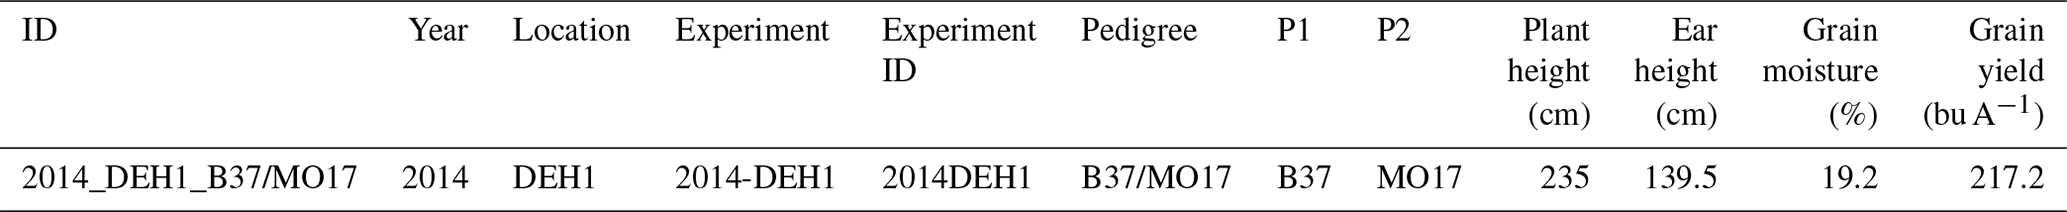
Like in G2F-G, there are several missing phenotypic observations. For example, Table 2 indicates the missing values for all environmental variables in the last five rows or experiments. Also note that the phenotypic measurement is maize grain yield in this study; thus, the missing values for grain yield are removed from the raw phenotype datasets. The same methodology can be applied to other phenotypic variables like grain moisture, test weight, and plot weight found as columns in the stored .csv file (Upload/Phenotype/g2f_2014_hybrid_data_clean.csv). By removing cultivars with grain yield missing values, a total of 89 549 field observations remain in the G2F-P dataset. In the last step, the clean versions of the G2F-P dataset in each year between 2014 and 2021 are consolidated in one single .csv file. One record of the clean G2F-P dataset is represented in Table 5 as an example. This example displays phenotypic observations for the B37/MO17 maize line tested in the state of Delaware in the H1 experiment in 2014.
4.3 G2F-E QC
The designed QC scripts in Python for hydroclimatic files have been implemented, and the available typos and mismatches in the headers have been fixed to have a consistent format among the files stored in different years.
The nonviable samples available in the datasets, such as negative values for solar radiation and rainfall, the out-of-range relative humidity percentage, and the wrong wind direction values, have been detected, eliminated, and left as missing values as described in Sect. 3.1.3.
At this point, the naming policy for the environments is applied. Note that this study focuses on the hybrid experiments for GxE models and the associated simulations, which suggests that inbred experiments are discarded; 211 hybrid experiments remain in the database for the categorization step.
The G2F-E QC and G2F-M QC submodules are implemented in parallel. The reasons for this parallel implementation are the following. (1) Geolocation of weather stations is required to download the data from external environmental data sources. (2) Location of the experiments is required for visualization of the geospatially distributed crop growth predictability. Among the 211 experiments, there are 8 experiments with missing data. Afterwards, for simplicity of the dataset analyses, each G2F annual climate .csv file is split into separate files for each experiment and climate variable. This file structure represents eight files containing each of the hydroclimatic variable time series (e.g., temperature, dew point, relative humidity, solar radiation, rainfall, wind speed, wind direction, and wind gust) for each experiment ( time series files are created and stored).
Table 6The percentage of complete, empty, and incomplete portions of time series for each G2F hydroclimatic variable: temperature (T), dew point (DP), relative humidity (RH), solar radiation (SR), rainfall (R), wind speed (WS), and wind direction (WD).

On the other hand, just 32 experiments were complete of the 97 experiments that comprise the file structure between 2014 and 2017. Table 6 presents a synthesis of experiment completeness between 2014 and 2021 for the G2F-E data. The missing files are mainly caused by gaps in environmental data, limiting the ability of crop models and analytics for phenotype predictions. This situation was emphasized by Huang et al. (2019), who showed that the limitation in phenotypic and environmental data restricts timely diagnostics of crop growth and, consequently, hampers the use of crop growth models for prediction purposes. Di Paola et al. (2016) provided an additional perspective by using the minimal set of input data for crop growth modeling predictions becoming more biased. Sarzaeim et al. (2022a) provided a strategy to reduce the gaps in environmental data using deep neural networks. Such efforts showed how phenotype predictability increases and could be attributed to climate patterns of variability.
In this study, we fill the missing values identified as empty and incomplete in the environmental time series to consolidate a high-dimensional database that could be translated into an improvement in GxE model performance. The improved G2F-E enhances the G2F multidimensional database and provides an opportunity to increase the OMICS observations engaged in the GxE simulations. The time series without missing values are delivered to the final improved database, while files with empty or incomplete time series are processed to fill data gaps with external climate data sources (e.g., NSRDB, DayMet, or NWS). For the filling step, the designed APIs read the “Lat” and “Long” data from controlled G2F metafiles and download and store the climatic datasets for each G2F experiment trial site. The downloaded datasets for each data source are divided into separated files, one per experiment and climate variable, and are stored in .csv format.
The empty datasets have been replaced by one of the other data sources selected based on the calculated minimum root mean square error (RMSE) values between G2F and each of NSRDB, DayMet, and NWS for a given climatic variable in the G2F database. A deep neural network (DNN) technique was implemented to estimate the missing values of the incomplete datasets. The strategies for gap-filling were explained in detail in Sarzaeim et al. (2020, 2022a, b). The gap-filling in the environmental data allowed us to increase the number of complete experiments from 32 to 86. Also, we added other climatic variables like pressure and precipitable water from NSRDB and DayMet, which were not initially provided by the G2F initiative. The G2F-E QC submodule enables one to download other databases and preprocess them for the expansion of G2F-E.
One record of the improved G2F-E data is represented in Table 7 as an example. This example refers to a record for the hybrid experiment called H1 conducted in the state of Delaware in 2014. This record represents the first observation of the climatic time series, including temperature, dew point, relative humidity, solar radiation, rainfall, wind speed, wind direction, and wind gust.
Table 7Record of a single example of the G2F-E dataset. It shows the observed hydroclimate data, including “Temperature (∘C)”, “Dew point (∘C)”, “Relative humidity (%)”, “Solar radiation (W m−2)”, “Rainfall (mm)”, “Wind speed (m s−1)”, “Wind direction (∘)”, and “Wind gust (m s−1)” collected by a weather station with an ID of “9079” for the “2014DEH1” experiment located in Delaware on 9 May 2014 at 15:00:00 local time. The ID of the experiment is “2014DEH1”. “H” denotes the hybrid type of the experiment, and “DE” denotes the state of Delaware.

After implementing the G2F-E QC submodule and improving the recorded hydroclimatic time series for each experiment, the mean temperature (Tmean) and accumulative rainfall (Racc) over the maize-growing season are calculated here and represented in Fig. 5. The minimum and maximum of Tmean values are 11.8 and 25.9 ∘C in the 2014NYH1 and 2016GAH2 experiments, respectively. The minimum and maximum of Racc during the growing season of maize are 11.8 and 1525.9 mm as observed in the 2015NEH3 and 2016KSH1 experiments, respectively.
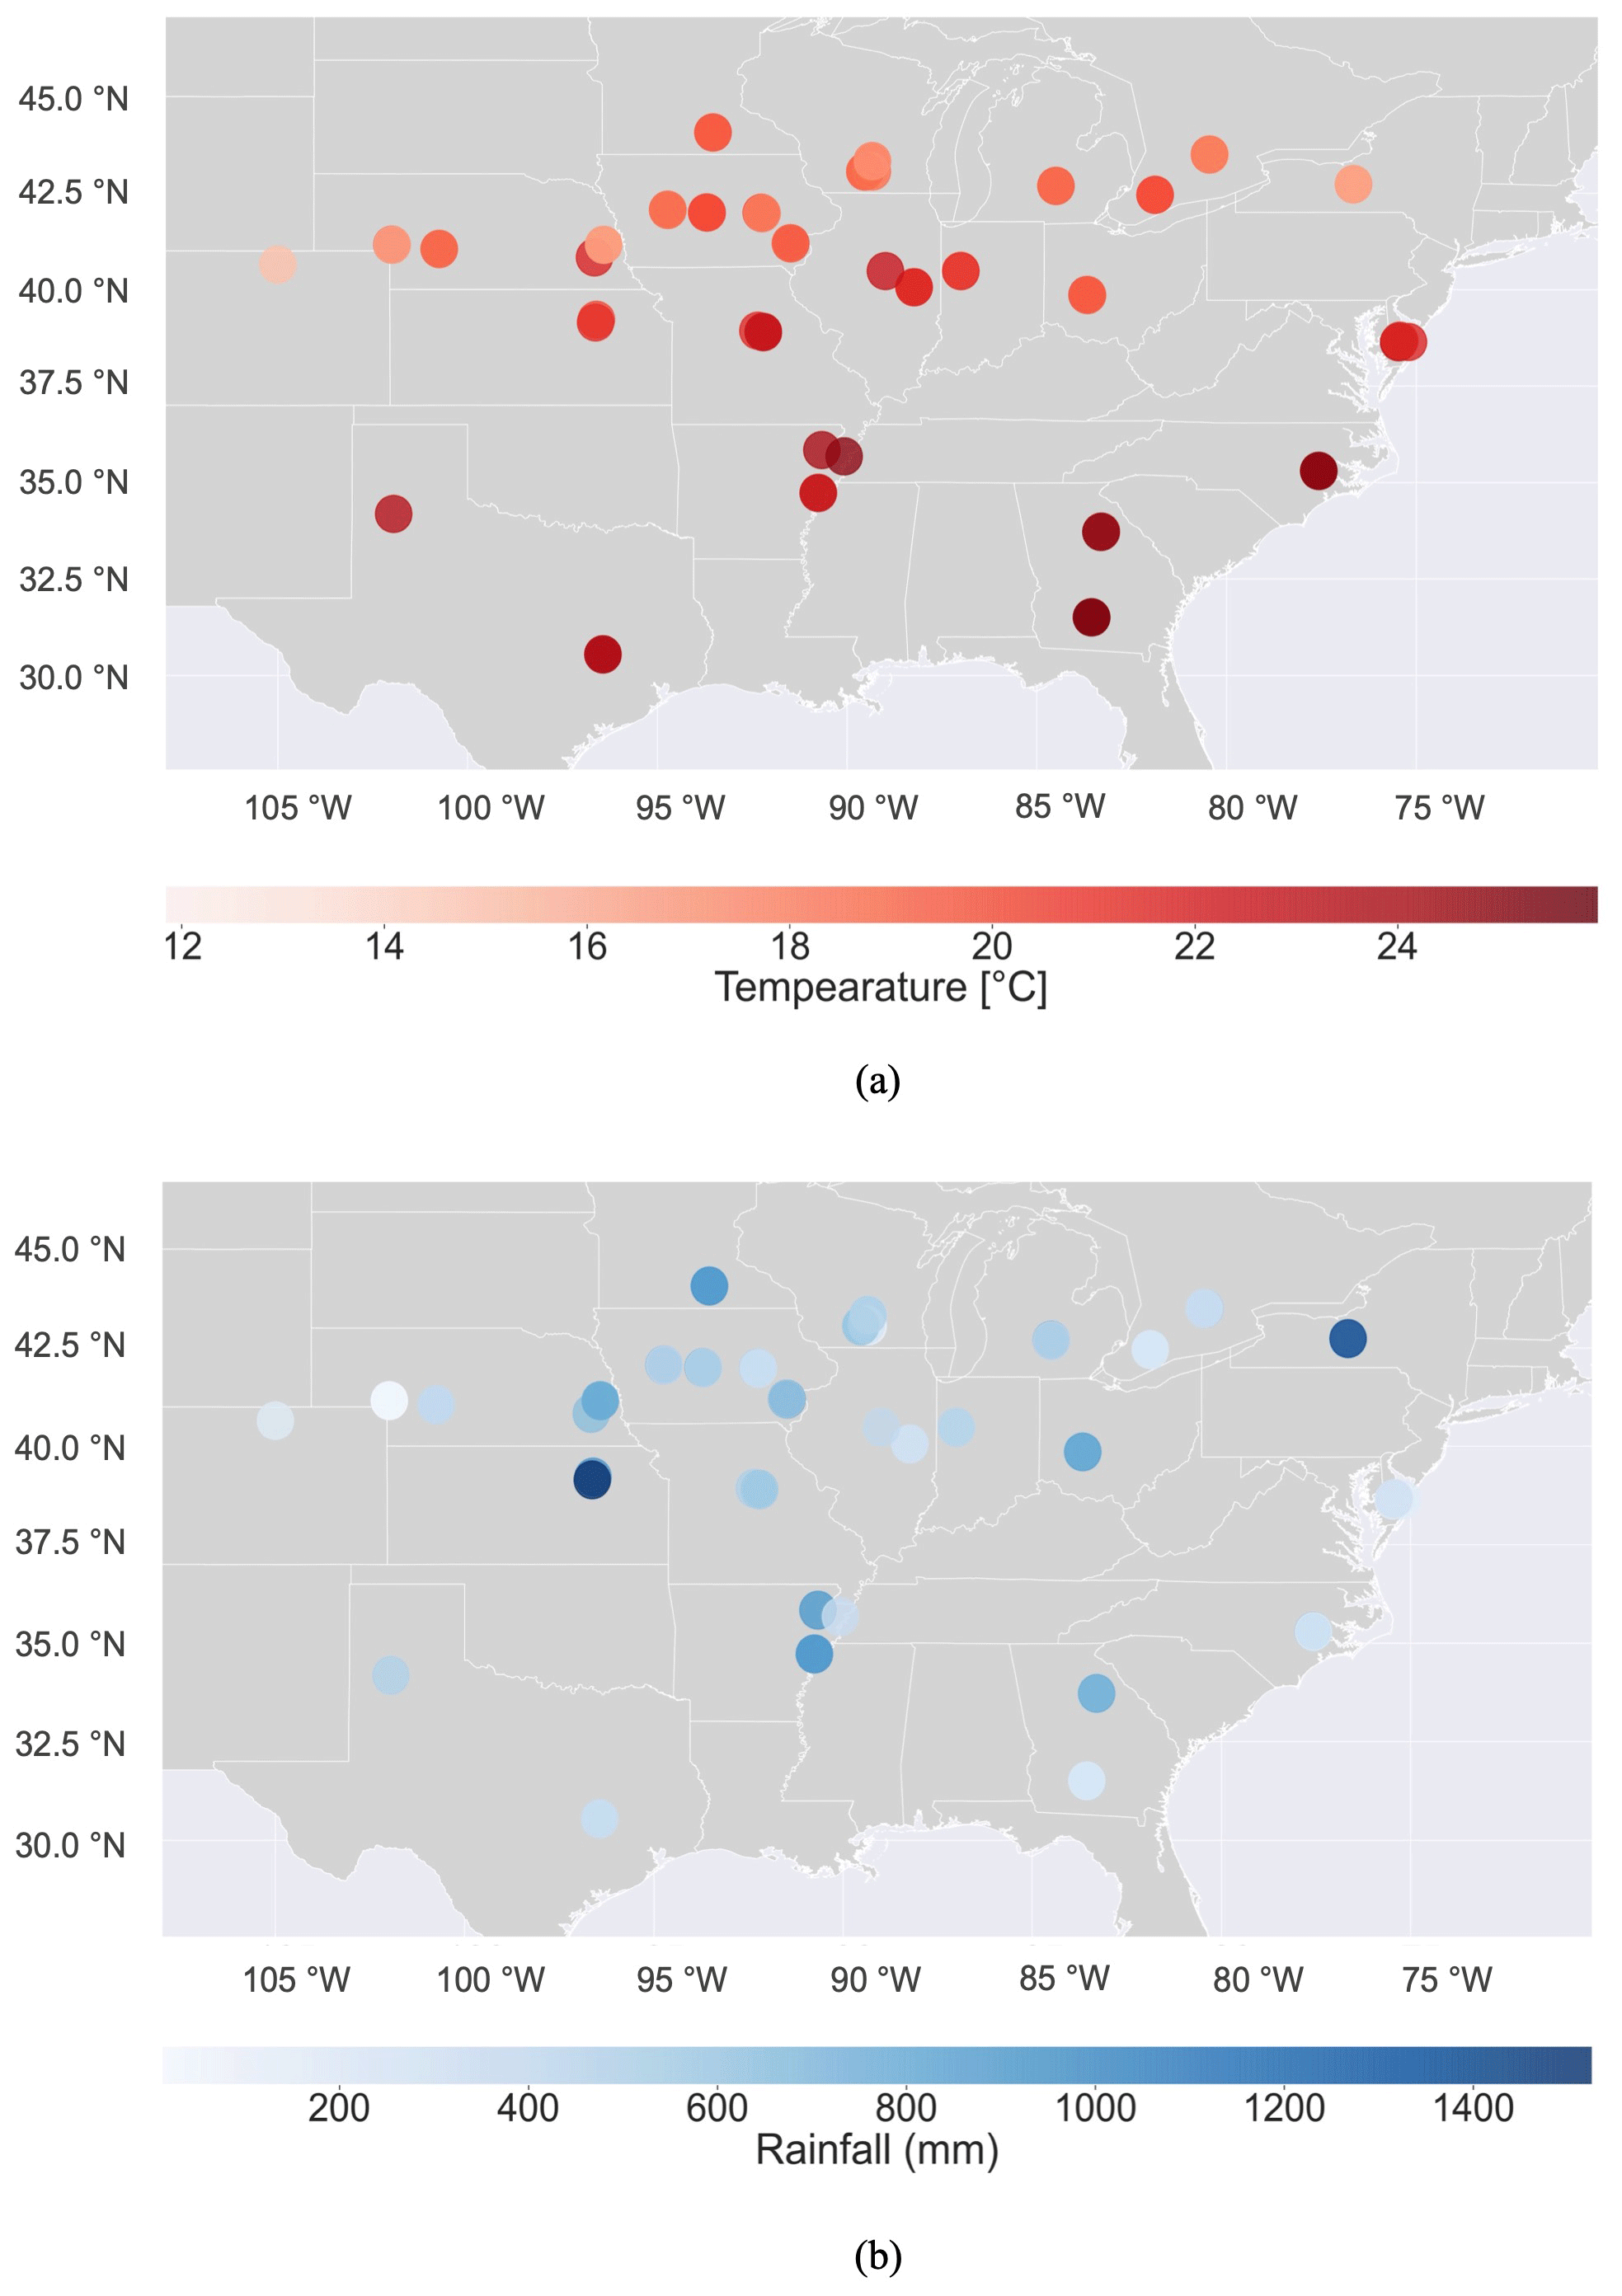
Figure 5The spatial distribution of (a) improved mean temperature (Tmean) and (b) improved accumulated rainfall (Racc) records in the G2F-E database during the maize-growing season in all G2F experimental fields in 2014–2017.
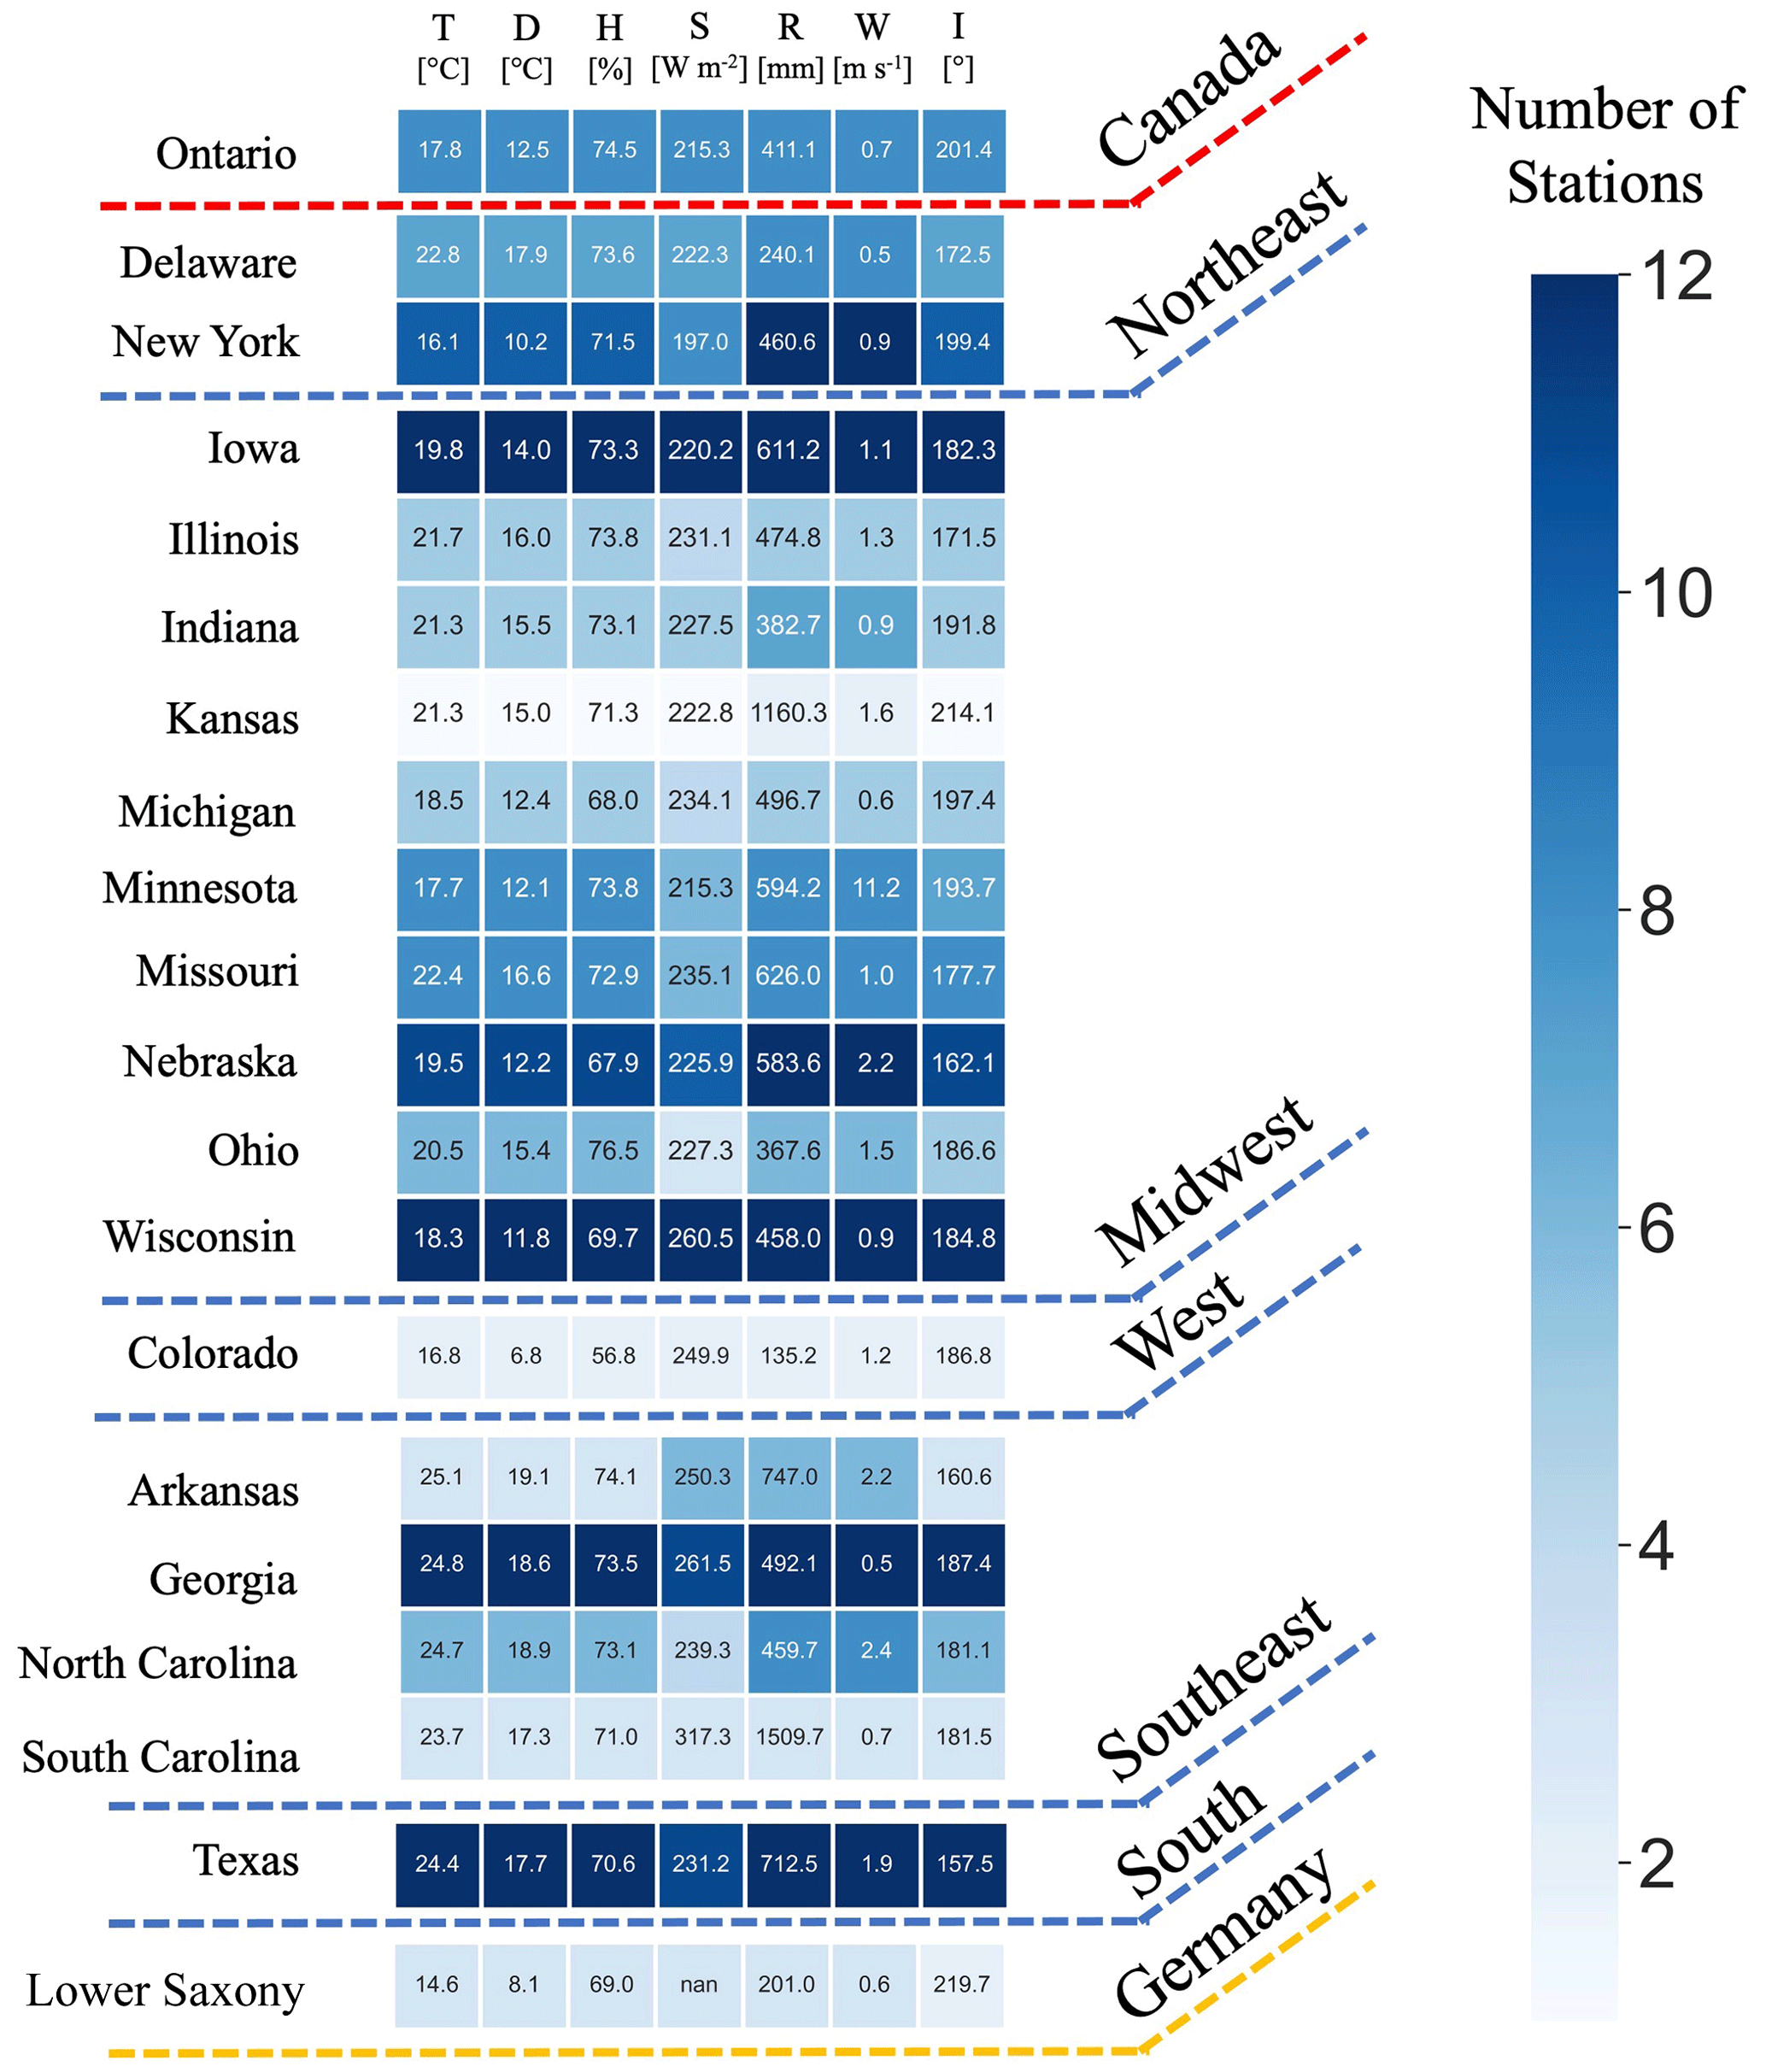
Figure 6The heatmap for the number of G2F experiments in the US regions and the province of Ontario in Canada between 2014 and 2021. The state of Lower Saxony in Germany includes the years 2018, 2020, and 2021 for three locations. The color shows the number of stations in each state. The number in each cell represents the average of hydroclimatic variables in each state, including the mean of temperature (T), mean of dew point (D), mean of relative humidity (H), mean of solar radiation (S), accumulative rainfall (R), mean of wind speed (W), and mean of wind direction (I).
Additionally, the number of G2F trial heatmaps located in the same state over the period of 2014–2021 is illustrated in Fig. 6. The lowest and largest numbers of experiments are 2 in the state of Colorado in the Rocky Mountains region and 12 in Iowa in the Midwest, respectively. The number in each cell displays the average of improved hydroclimatic variables in each state, including the mean of temperature, dew point, relative humidity, solar radiation, accumulative rainfall, wind speed, and wind direction.
4.4 G2F-M QC
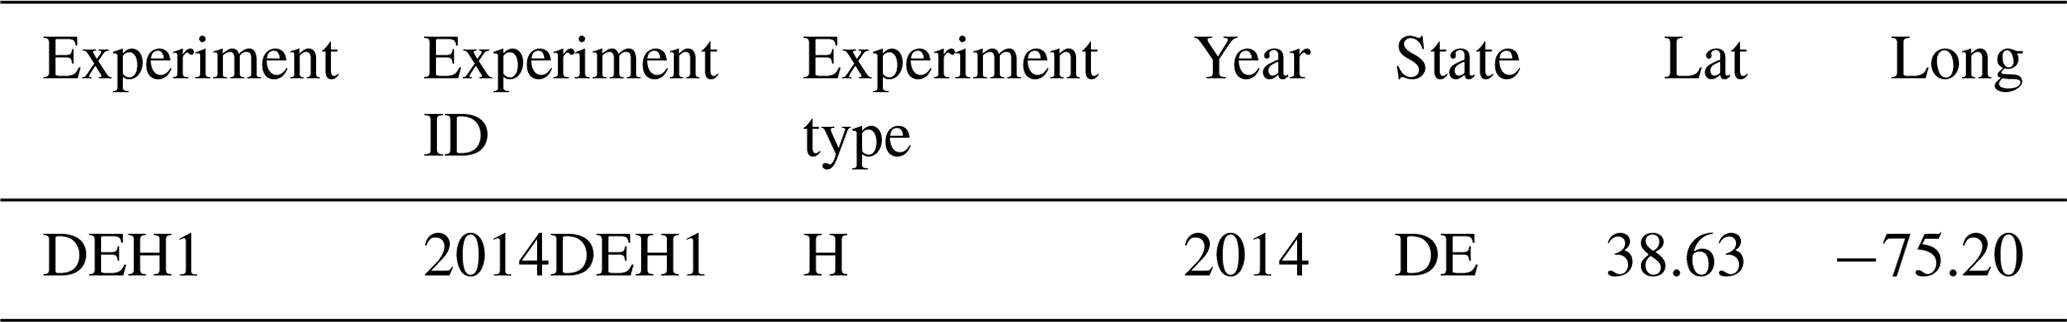
From 2014 to 2017, a total of 112 tested hybrid experiments were registered across the G2F sites. However, the latitude and longitude of 15 experiments were missed and consequently removed from the database. As mentioned in Sect. 4.3, the G2F-M QC submodule has been implemented in parallel with the G2F-E QC submodule to avoid the processing of redundant data for the experiments with unknown locations. One record of the G2F-M data is represented in Table 8 as an example. This example illustrates the coordinates of the weather station located in the experiment of H1 in the state of Delaware in 2014.
Table 8Record of a single G2F-M dataset. It shows the location, including the “Lat” and “Long” of the “2014DEH1” experiment located in Delaware in 2014. The ID of the experiment is “2014DEH1”. “Lat” denotes latitude, “Long” denotes longitude, “H” denotes the hybrid type of the experiment, and “DE” denotes the state of Delaware.
4.5 Database CC
The last stage of input data preprocessing is to check the consistency among the quality-controlled and improved files across the G2F-G, G2F-P, G2F-E, and G2F-M QC submodules. The main purpose of the CC module is to check all quality-controlled files and remove them from the records when their information is not available. In other words, the CC module records the available files with complete sequences of genetic data, phenotypic observations, climatic time series, and location data for eventual implementation of GxE model and visualization analytics or possible use in crop and Earth system models. Also, the CC uses the unique experiment names in the “Experiment ID” column, which is common among G2F-P, G2F-E, and G2F-M, to remove those records missing at least one OMICS or environmental category of G2F data. After checking these three data dimensions' consistency, the CC module uses the P1 and P2 columns, common between the controlled G2F-P and G2F-G, to update the G2F-G file for the available records in phenotypic data. Consequently, all the common records in the high-dimensional G2F data are kept for use in crop growth modeling. We identified that, after implementing the CC on the 2014–2021 G2F, 376 lines, 79 122 yield observations, and 178 experiments remained for phenotype diagnostics or modeling. Figure 7 symbolizes the synthesis of the enhanced high-dimensional G2F database after applying QC and CC modules.
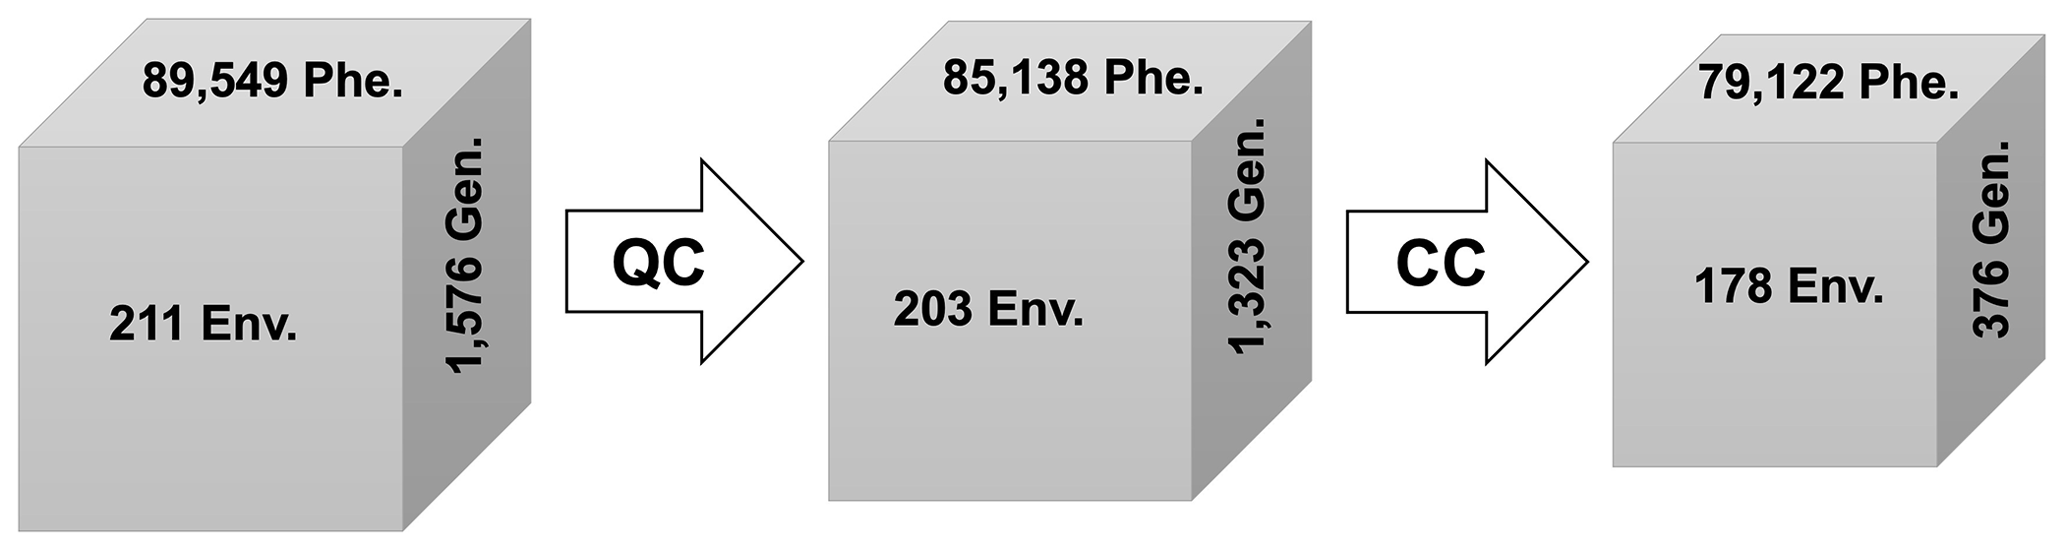
Figure 7The number of observations of G2F-Gen. (genomic data), G2F-Phe. (phenotypic data), and G2F-Env. (environmental data) in the original database, quality-controlled database, and consistency-controlled database. “QC” and “CC” refer to the quality and consistency control algorithms.
The considerable decrease in the number of genotypes indicates that, although the genetic sequences of 1576 maize lines have been generated and published in the G2F database, most of them have not yet been tested in the trials. The phenotypic observations dropped from 89 549 to 79 122 after QC–CC, which could be mitigated by releasing the new samples in a larger number of experiments by the G2F initiative through the years and overcoming this trial deficit (Fig. 7). The use of crop and data-driven modeling together with remote-sensing products to estimate the crop yield and other phenotypes can mitigate these data deficits as well.
Following the FAIR principles, the multidimensional, consolidated, and enhanced G2F databases along with developed Python-based QC–CC scripts are released on the Zenodo platform for public access (findable and accessible). The associated documentation is also available for the database users. The folder and file structures are explained and interoperable, including the dataset preprocessing, the QC and CC submodules, and the implementation process for each G2F data release. Additionally, the database is usable for other crop growth modeling, and the scripts are modifiable for implementation using datasets from sources other rather than G2F (reusable). The CLIM4OMICS database package along with the current study can be taken as a guideline to create and enhance other geospatial databases for Earth system, crop growth, and statistical modeling.
The developed database package in this study is an example of a multidimensional database involving the enhanced OMICS variables along with the improved hydroclimatic drivers of crop growth. The present database contributes to mitigating the lack of genomic and phenotypic data, which limit the use of OMICS data in plant modeling according to Germeier and Unger (2019). Several databases are used in applications like the Agricultural Model Intercomparison and Improvement Project (AgMIP) to simulate agricultural risks under climate change, emphasizing the role played by environmental factors like weather and soil physical properties (AgMIP, 2022).
On the other hand, improving digital products through genomic and phenotypic quality control pipelines for genomic selection can lead to applications in multiple fields, as Persa et al. (2021) stated. The developed QC–CC framework for environmental drivers in our study finds its niche among other efforts as a showcase for climate data for OMICS database enhancement, which could be relevant for improving phenotype predictability, integrating high-throughput phenotyping, and showing emerging phenotyping technologies (Araus et al., 2018; Rico et al., 2020, 2021). The enhanced G2F climate and OMICS database, CLIM4OMICS, and the preprocessing data framework are designed to interconnect the OMICS variables with environmental drivers to improve the models' performance in complex agricultural and climate systems. For example, in an application for version 1.0 of the database, Sarzaeim et al. (2022a) illustrated the benefits of an enhanced G2F database in increasing maize yield predictability by 12.1 % using the coefficient of determination (R2), 2.2 % in terms of RMSE, 11.4 % in terms of mean square error (MSE), and 1.4 % in terms of mean absolute error (MAE). Thus, the current developed database provides an opportunity to integrate interdisciplinary teams formed by agronomists, agricultural engineers, and climate scientists interested in improving food security and resilience applications for climate change and increasing population demands of grains.
4.6 Error uncertainty
In database creation and curation to successfully train and test crop growth models, uncertainty quantification is a useful technique for assessing error sources. Quality and consistency controls enhance and consolidate multidimensional databases to achieve crop model high performance, and uncertainty assessment diagnoses the main sources of error propagation in the models' predictive skill.
The use of external databases (e.g., NSRDB, DayMet, and NWS) to impute and simulate missing environmental data propagates errors in sampling, modeling, and transforming environmental estimations into the G2F time series. These errors in the input data also propagate uncertainties into crop growth model outputs, which require the quantification of input data uncertainty. The standard uncertainty of the climate variables has been quantified using the SD of the PDF of the errors between the observed G2F time series and those of the external databases for a given climatic variable. For G2F improvement, the error SD represents the uncertainty introduced by using each external data source (Steiner et al., 2013). Thus, first, we calculated the errors using Eq. (1), and then we calculated the PDFs of errors. The SD statistics of the error terms are then calculated (see Fig. 8).
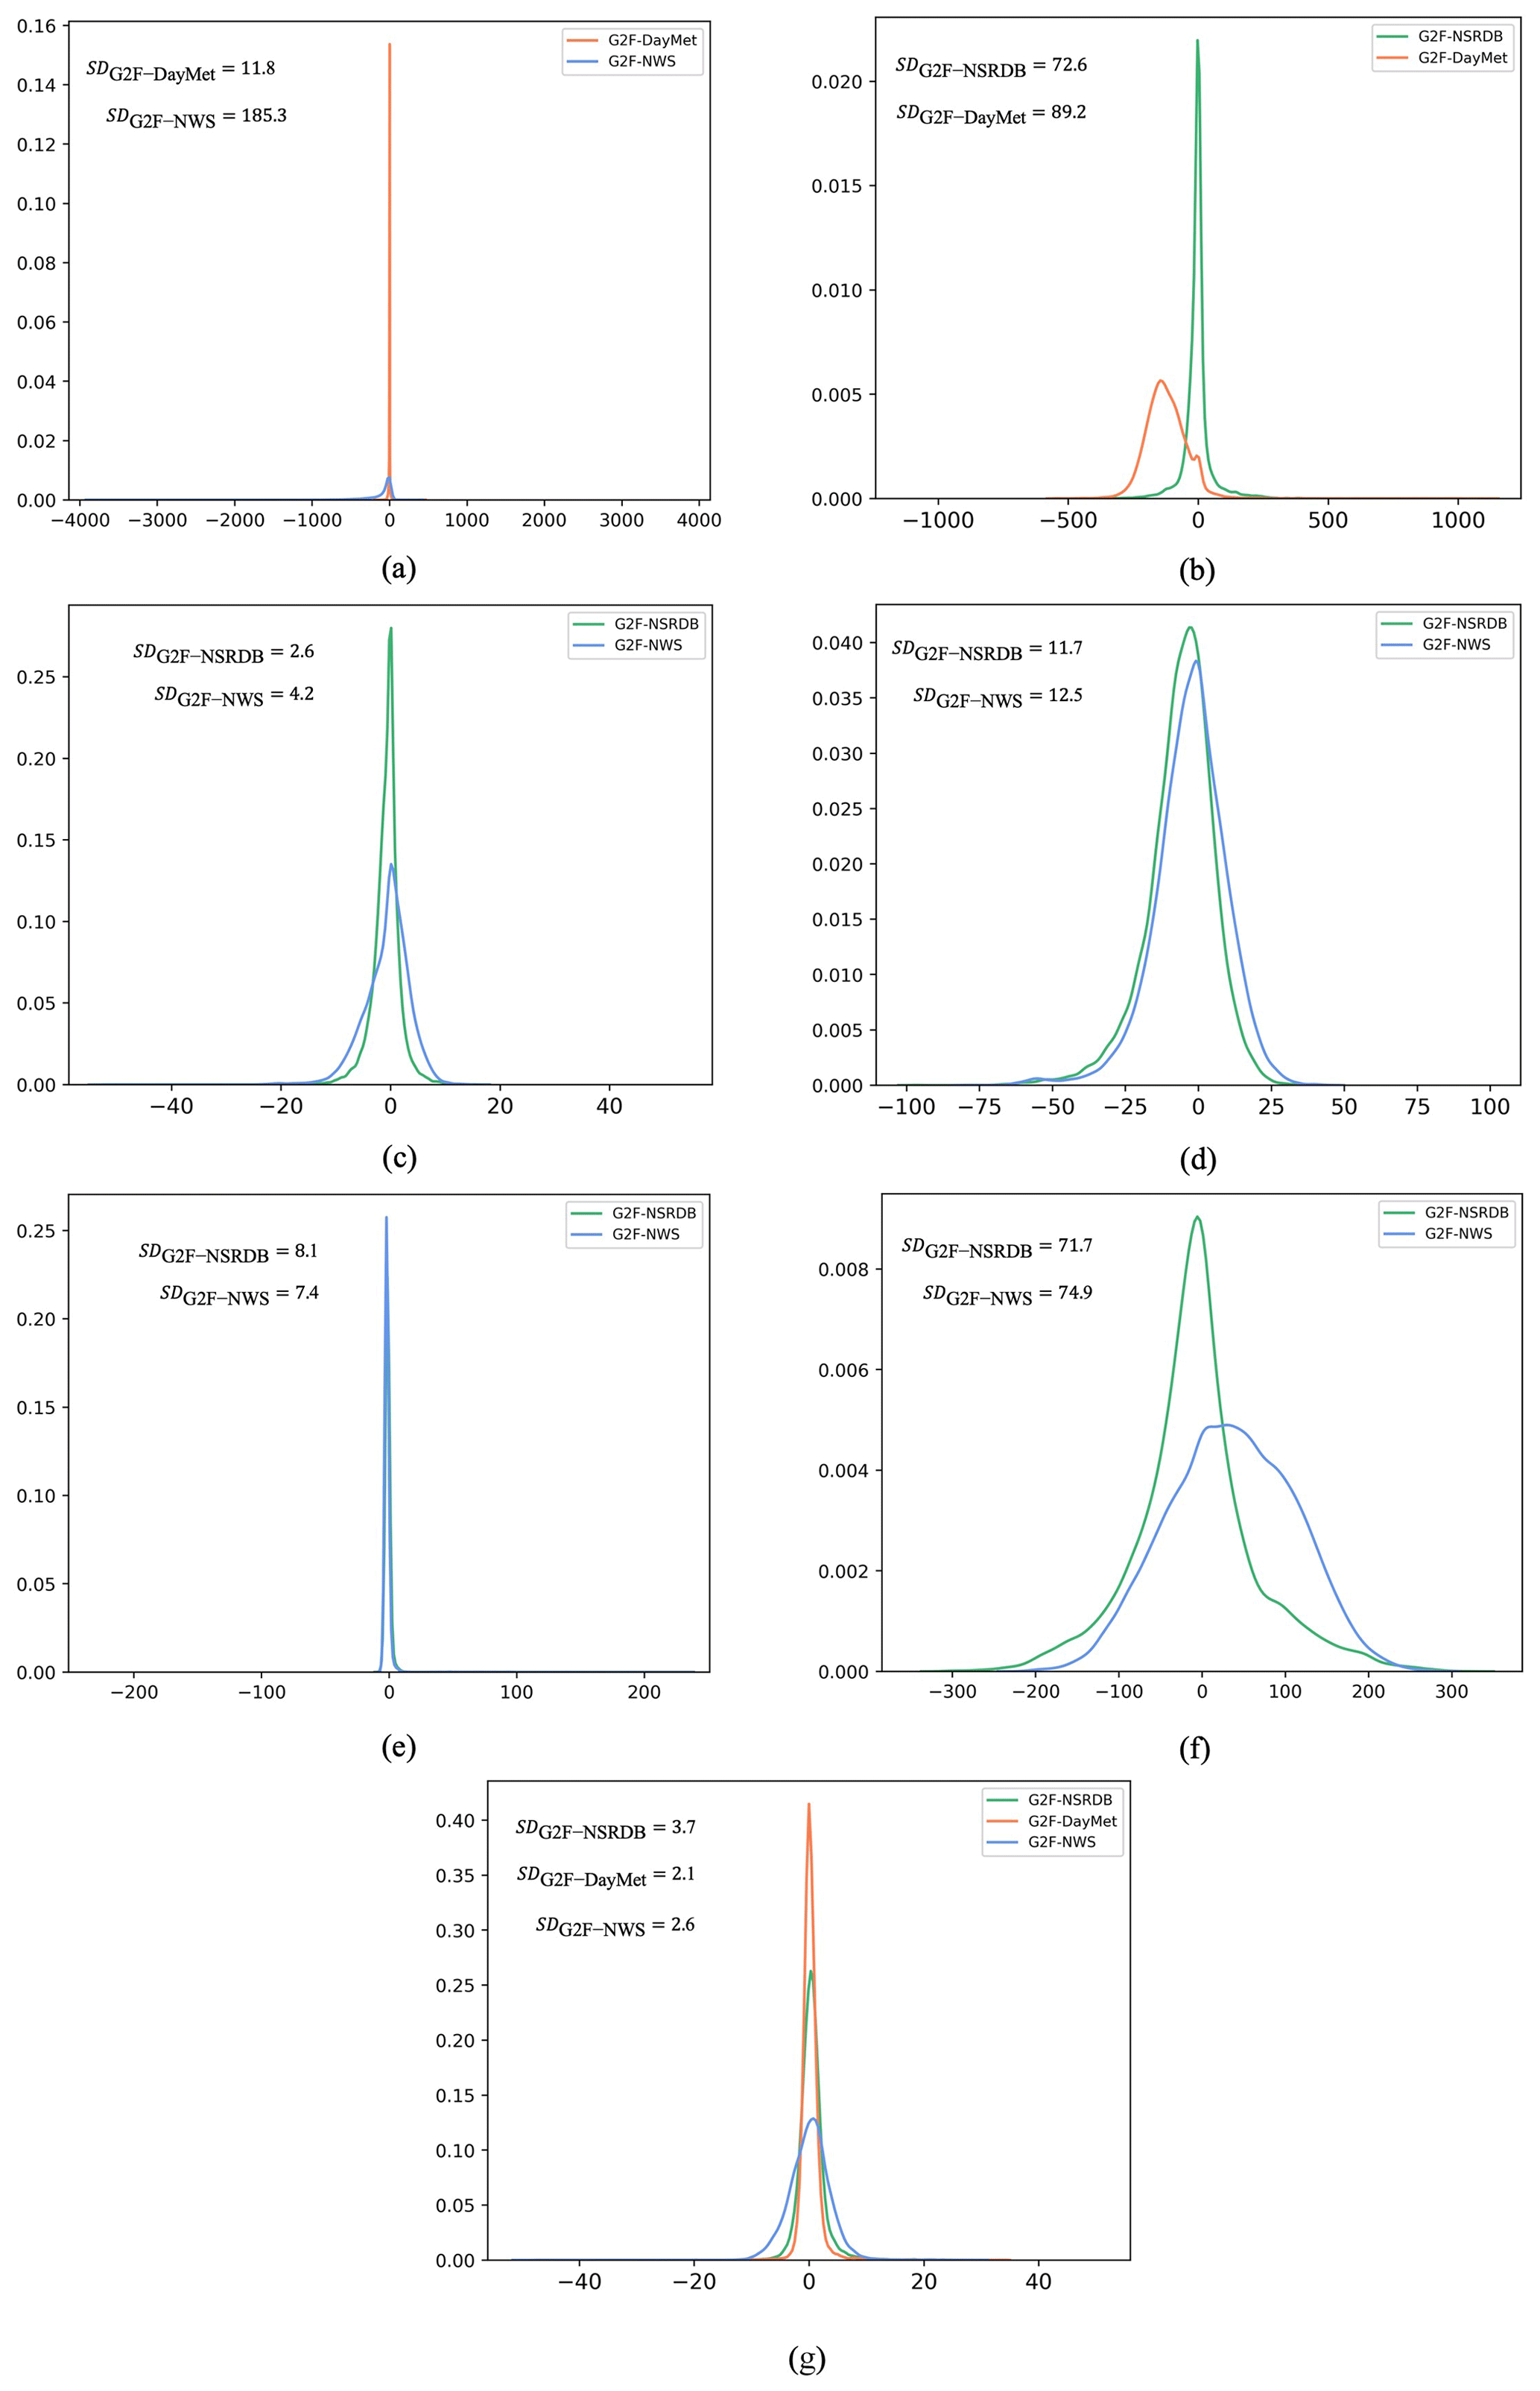
Figure 8The probability distribution function of the error values for (a) rainfall, (b) solar radiation, (c) dew point, (d) relative humidity, (e) wind speed, (f) wind direction, and (g) temperature. Note that each of the external environmental data sources may not contain all the G2F hydroclimatic variables. The error term has been calculated for the common variables between G2F and each of the data sources. SDG2F-NSRDB denotes the standard deviation of the errors between G2F and NSRDB, SDG2F-DayMet denotes the standard deviation of the errors between G2F and DayMet, and SDG2F-NWS denotes the standard deviation of the errors between G2F and NWS for a given climatic variable.
Standard uncertainty is a very informative measurement when the PDF of errors is close to a normal distribution with a mean of zero (Merchant et al., 2017). Here, the error distributions for rainfall (Fig. 8a), dew point (Fig. 8c), relative humidity (Fig. 8d), wind direction (Fig. 8f), and temperature (Fig. 8g) are roughly normal. In the case of solar radiation (Fig. 8b), the normal distribution is reasonably fitted to the errors between G2F and NSRDB. Also, the PDFs of the errors in wind speed are close to a normal distribution.
The SD has been calculated for the errors between G2F and each of the NSRDB, DayMet, and NWS databases. In the case of temperature, the smallest standard uncertainty of errors is obtained from DayMet (SDG2F-DayMet = 2.1). For dew point, the NSRDB introduces the smallest error uncertainty (SDG2F-NSRDB = 2.6). In the case of relative humidity, although the SD statistics are very close for both NSRDB and NWS, it is slightly smaller for NSRDB (SDG2F-NSRDB = 11.7). For solar radiation, the uncertainty of using NSRDB to impute the gaps of G2F is considerably smaller than using DayMet (SDG2F-NSRDB = 72.6). The dispersion of errors for rainfall for DayMet and NWS shows the largest differences among climate variables (with SDs of 11.8 and 185.3, respectively). This discrepancy can be attributed to the geospatial location and aggregation since one of the products uses the closest climatological station and the other represents a gridded product (NWS and DayMet, respectively). There is no consistent pattern of uncertainty for the wind properties. For the wind speed, the SD is slightly smaller from the NWS (SDG2F-NWS = 7.4), while in the case of the wind direction, NSRDB represents the smaller error uncertainty (SDG2F-NSRDB = 71.7). These SD statistics values illustrate the error magnitude introduced by using external databases. In the case of using any data sources other than those provided by the G2F initiative, the uncertainty estimations show the sources of error propagation through the crop growth prediction.
By comparing all the error dispersion statistics for each climate variable, the largest inconsistencies among the digital resources (NSRDV, NWS, and DayMet) were found for temperature and dew point, with error discrepancies of 43 % and 38 %, respectively. Solar radiation, relative humidity, and wind speed followed, with discrepancies of 18.6 %, 10.4 %, and 8.6 %, respectively. The rest of the variables presented discrepancies below 5 %. These results are aligned with several previous studies that show rainfall as a complex phenomenon difficult to measure, model, and predict. This difficulty in rainfall estimates can also be attributed to the spatiotemporal heterogeneity of the collected data (Bruno et al., 2014; Pollock et al., 2018). However, the considerably small differences in the errors among G2F, DayMet, and NSRDB for rainfall (SDG2F-DayMet = 815.6 and SDG2F-DayMet = 814.5, respectively) illustrate the higher robustness of publicly available gridded products and their usefulness in complementing in situ databases (i.e., NWS) for improvement of the G2F-E datasets.
Note that the NWS is the only database that records wind gust. However, we removed the wind gust from the G2F-G database due to several missing values in that database.
The data that support the findings of this study, “CLImate for Maize OMICS: CLIM4OMICS Analytics and Database”, are openly available in Zenodo at https://doi.org/10.5281/zenodo.8002909 (Aslam et al., 2023a).
A quick guideline for Python scripts is provided in the “ReadMe.txt” file, and the required Python packages to be installed are listed in the “Requirements.txt” file in the database package, in a GitHub code repository in Zenodo, and in GitHub at https://doi.org/10.5281/zenodo.8161662 (Aslam et al., 2023b) and https://github.com/HasnatJutt/CLImate-for-Maize-OMICS_CLIM4OMICS-Analytics-and-Database/tree/v2.0 (Aslam et al., 2023c), respectively.
In this study, we proposed an algorithmic QC–CC framework for the data preprocessing pipeline to consolidate a homogeneous, multidimensional, and enhanced database consisting of (1) OMICS observations, (2) hydroclimatic variables, and (3) metadata for statistical, data-driven, and biophysical crop growth model applications to simulate GxE interaction. The G2F initiative database for maize phenotype predictability across the US, the province of Ontario in Canada, and the state of Lower Saxony in Germany between 2014 and 2021 has been used to test the designed QC–CC framework. A QC submodule has been developed for each G2F data dimension, including the G2F-G, G2F-P, G2F-E, and G2F-M submodules. Each submodule generally aims to (1) read the raw files, (2) check and correct structural and format inconsistencies, (3) detect the missing values, and (4) fill them. The CC module is the last step of the input data preprocessing. It is designed to check the compatibility of controlled input data to identify the intersection of the records between all data dimensions ready for GxE model implementation and analytical operation. Multiple external data sources, including NSRDB, DayMet, and NWS, have been used to simulate the G2F-E gaps. The error uncertainty introduced by these data sources is also quantified.
After passing through the QC–CC data preprocessing pipeline, the structural inconsistencies have been corrected and the missing values have been filled in the G2F-G and G2F-E datasets. As a result, 178 G2F trials for GxE simulation are released, consisting of molecular genetic markers of 376 maize lines and 79 122 yield observations. Here, the target phenotypic observation is yield. However, other phenotypes like plant height, ear height, and grain moisture have also been provided in the improved database for users. The improved G2F-E database contains seven hydroclimatic time series during the maize-growing season at the G2F trial sites: temperature, dew point, relative humidity, solar radiation, rainfall, and wind speed and direction. The proposed methodology is applicable to other spatiotemporal variable improvement for the GxE model implementation. The improved multidimensional G2F database, along with developed scripts in a Python environment, is freely available to all users for employment in their research.
The database provided in this study can foster further efforts to improve GxE analytics and phenotypic predictability by enhancing the quality and consistency controls' robustness as listed below.
-
Employ remote-sensing imageries to simulate and fill the crop's phenotypic missing values to involve more samples in the database and analytics of maize growth predictability.
-
Integrate other hydroclimate time series to provide a wide range of environmental drivers of maize growth for the improvement of GxE models' predictive skill.
-
Develop rapid-response and user-friendly software architectures benefiting from pattern recognition techniques to correct typos, erroneous values, and data structure inconsistencies in order to boost database management, analytical tools, and visualization efficiency.
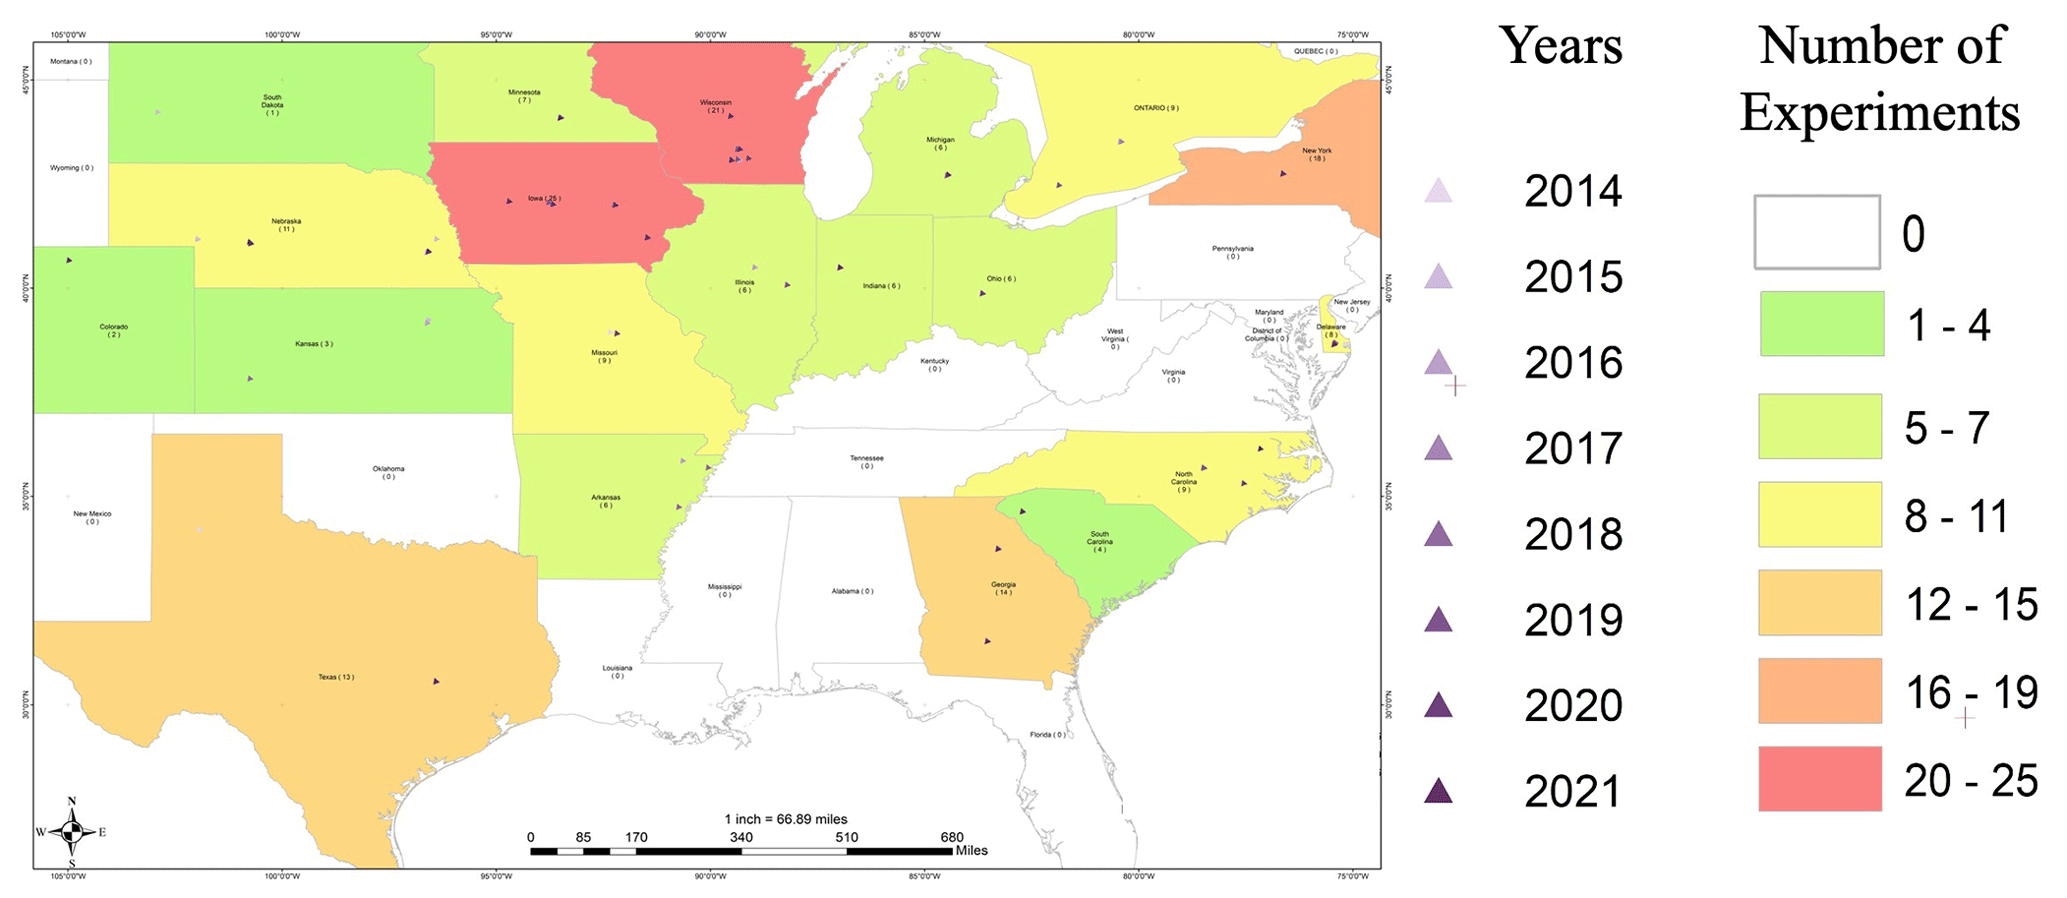
Figure A1Locations, years, and number of sites per state used by the G2F initiative and represented in CLIM4OMICS.
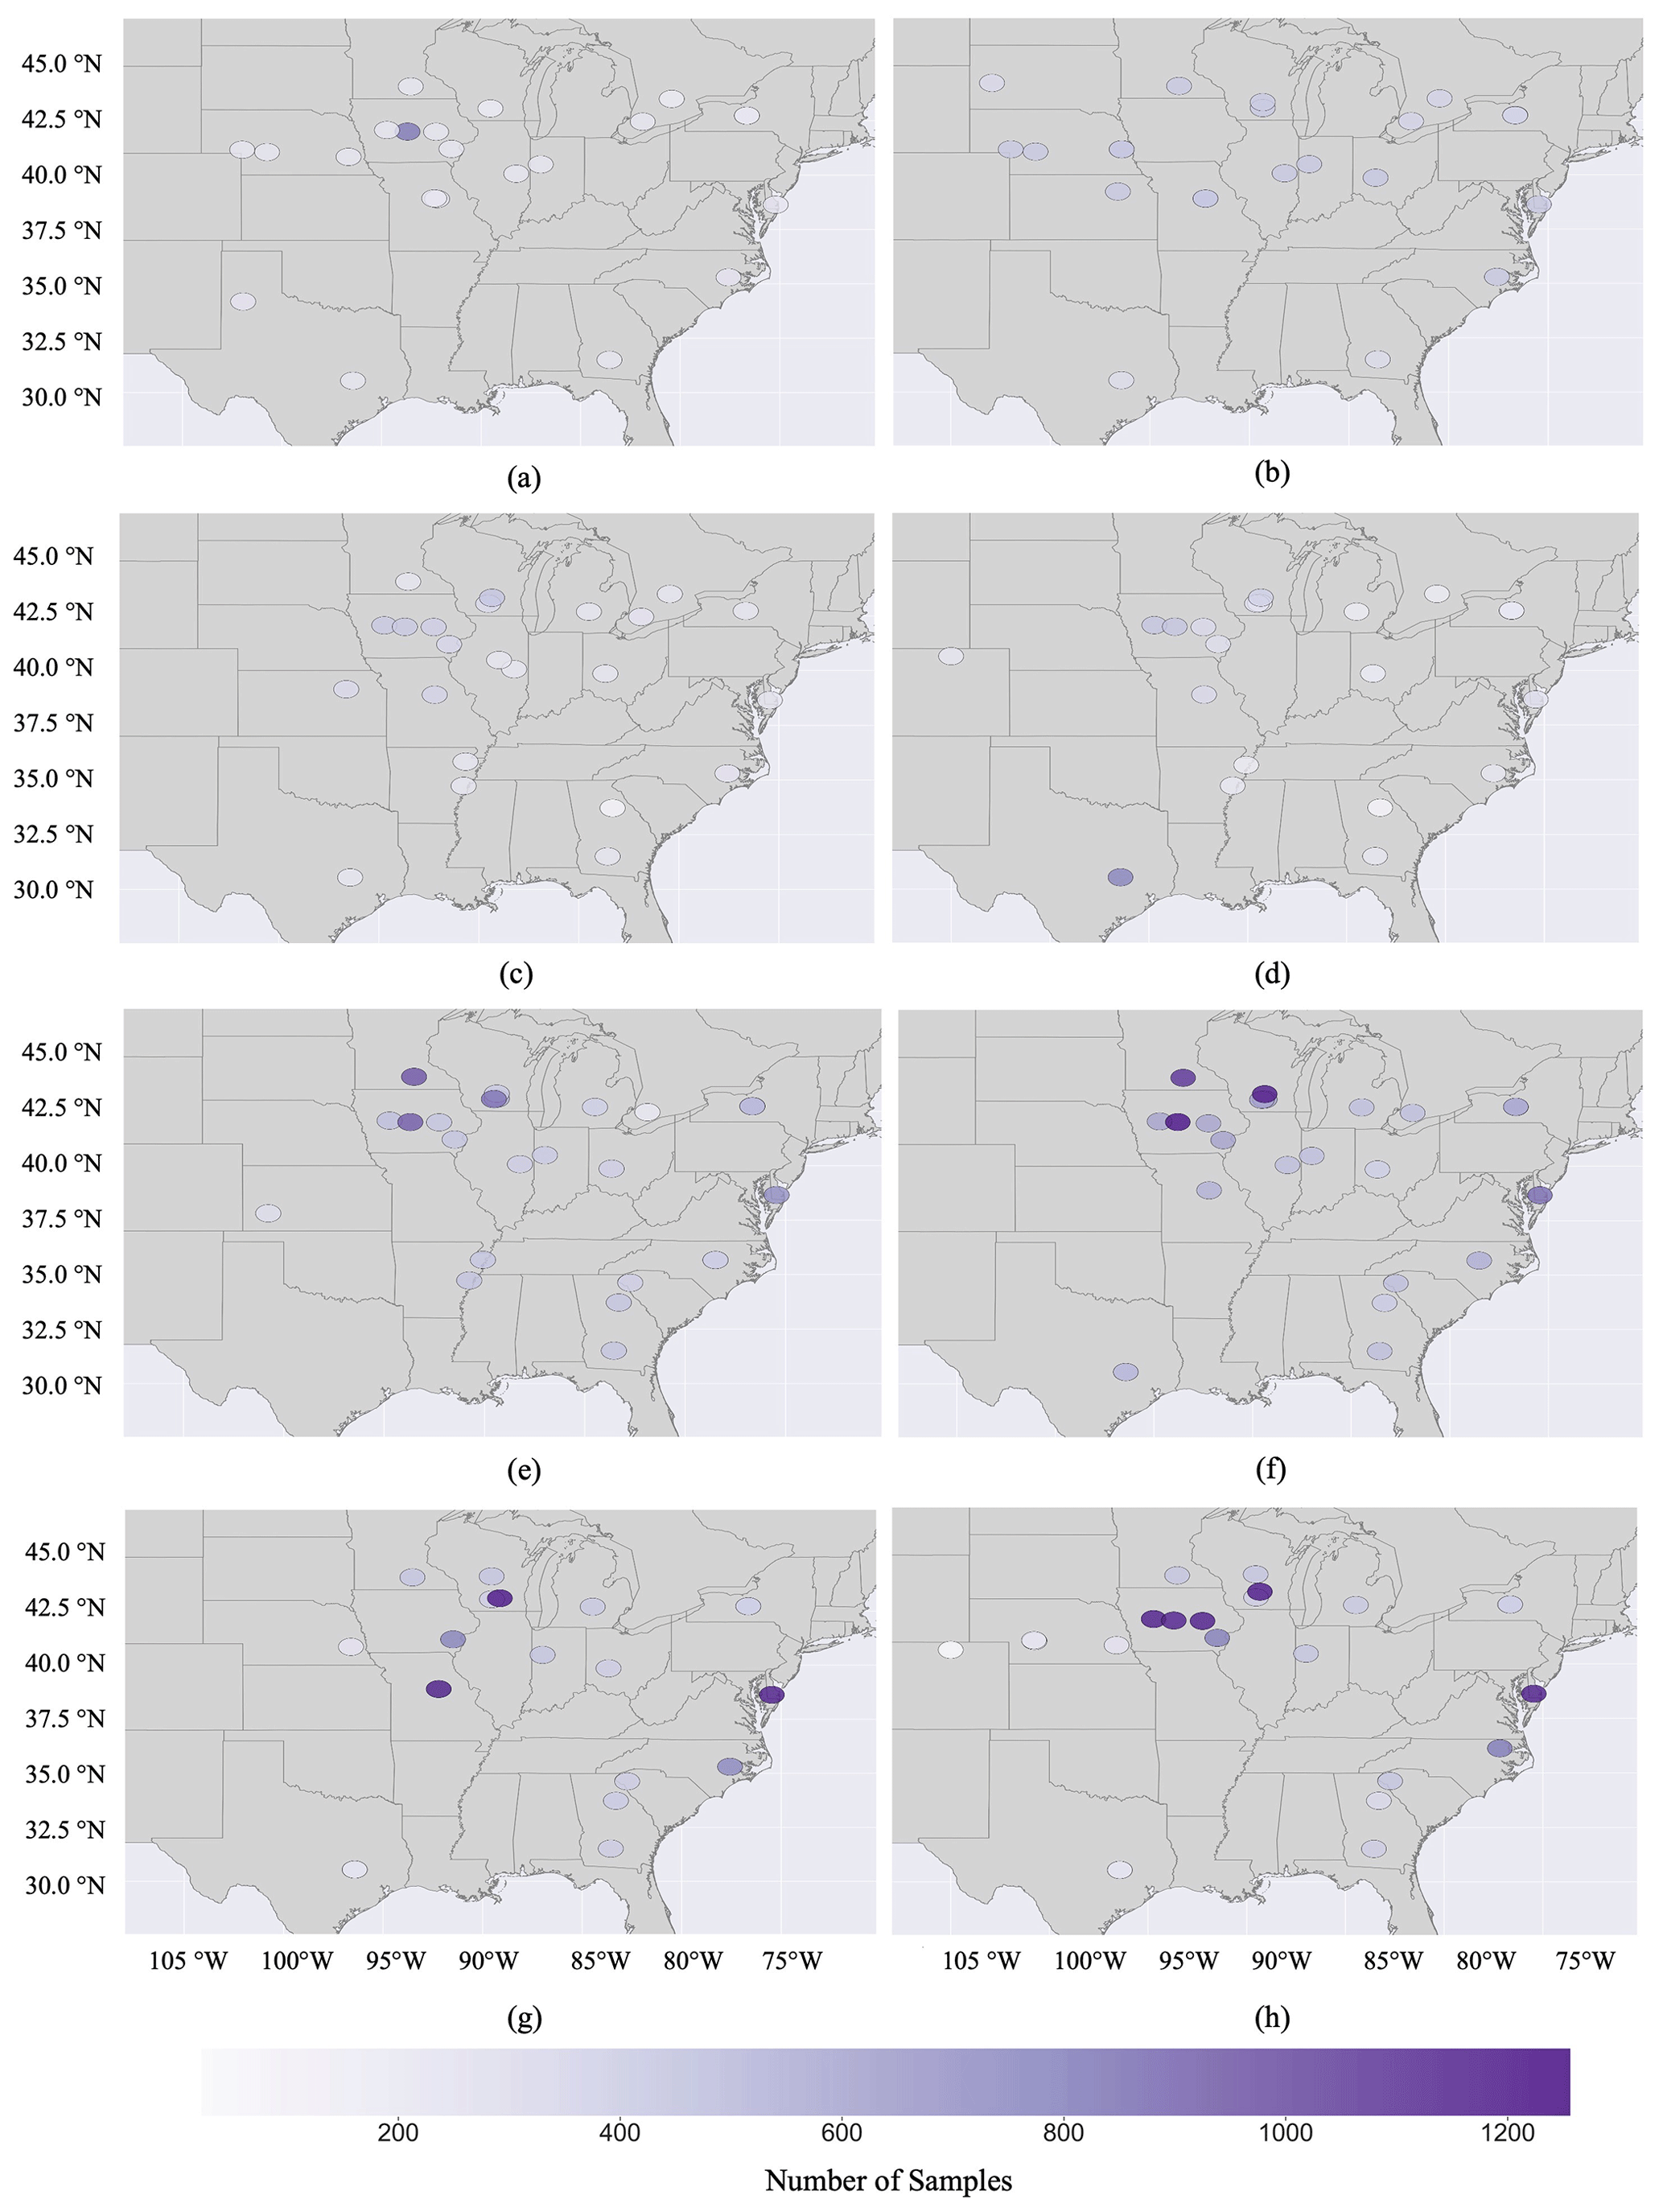
Figure A2The spatial distribution of phenotypic records in the G2F-P database from (a) 2014 to (h) 2021.
PS and FMA designed and conceptualized the study idea and methodology. PS, HA, and FMA designed, processed, and developed the datasets and scripts. PS and FMA prepared the original draft and reviewed it. DJ and NDLG contributed the development of the original G2F OMICS database and reviewed the draft.
The contact author has declared that none of the authors has any competing interests.
Publisher’s note: Copernicus Publications remains neutral with regard to jurisdictional claims in published maps and institutional affiliations.
This research was supported by the intramural research program of the U.S. Department of Agriculture, National Institute of Food and Agriculture, Plant Health and Production and Plant Products: Plant Breeding for Agricultural Production. Also, we thank the Genomes to Fields (G2F) initiative for providing the experimental platform that created the original database. We are grateful to the University of Nebraska-Lincoln (UNL) Holland Computer Center for access to their high-computing facilities to perform the analysis. We are also grateful for the support from the Quantifying Life Sciences Initiative at the University of Nebraska-Lincoln. The authors thank the topical editor Zhen Yu and the reviews of Daniel Kick and two anonymous reviewers for their valuable and constructive comments.
The support provided by the U.S. Department of Agriculture responds to the accession numbers NEB-21-176 and NEB-21-166.
This paper was edited by Zhen Yu and reviewed by Daniel Kick and two anonymous referees.
Agricultural Model Intercomparison and Improvement Project (AgMIP): https://agmip.org/, last access: 31 December 2022.
Alkhalifah, N., Campbell, D. A., Falcon, C. M., Gardiner, J. M., Miller, N. D., Romay, M. C., Walls, R., Walton, R., Yeh, C.-T., Bohn, M., Bubert, J., Buckler, E. S., Ciampitti, I., Flint-Garcia, S., Gore, M. A., Graham, C., Hirsch, C., Holland, J. B., Hooker, D., Kaeppler, S., Knoll, J., Lauter, N., Lee, E. C., Lorenz, A., Lynch, J. P., Moose, S. P., Murray, S. C., Nelson, R., Rocheford, T., Rodriguez, O., Schnable, J. C., Scully, B., Smith, M., Springer, N., Thomison, P., Tuinstra, M., Wisser, R. J., Xu, W., Ertl, D., Schnable, P. S., De Leon, N., Spalding, E. P., Edwards, J., and Lawrence-Dill, C. J.: Maize Genomes to Fields: 2014 and 2015 field season genotype, phenotype, environment, and inbred ear image datasets, BMC Res. Notes, 11, 452, https://doi.org/10.1186/s13104-018-3508-1, 2018.
Amaranto, A., Munoz-Arriola, F., Corzo, G., Solomatine, D. P., and Meyer, G.: Semi-seasonal groundwater forecast using multiple data-driven models in an irrigated cropland, J. Hydroinform., 20, 1227–1246, https://doi.org/10.2166/hydro.2018.002, 2018.
Amaranto, A., Munoz-Arriola, F., Solomatine, D. P., and Corzo, G.: A Spatially Enhanced Data-Driven Multimodel to Improve Semiseasonal Groundwater Forecasts in the High Plains Aquifer, USA, Water Resour. Res., 55, 5941–5961, https://doi.org/10.1029/2018WR024301, 2019.
Amaranto, A., Pianosi, F., Solomatine, D., Corzo, G., and Muñoz-Arriola, F.: Sensitivity analysis of data-driven groundwater forecasts to hydroclimatic controls in irrigated croplands, J. Hydrol., 587, 124957, https://doi.org/10.1016/j.jhydrol.2020.124957, 2020.
Araus, J. L., Kefauver, S. C., Zaman-Allah, M., Olsen, M. S., and Cairns, J. E.: Translating high-throughput phenotyping into genetic gain, Trends Plant Sci., 23, 451–466, 2018.
Aslam, H., Sarzaeim, P., and Munoz-Arriola, F.: CLImate for Maize OMICS: CLIM4OMICS Analytics and Database (2.0), Zenodo [data set], https://doi.org/10.5281/zenodo.8002909, 2023a.
Aslam, H., Sarzaeim, P., and Munoz-Arriola, F.: HasnatJutt/CLImate-for-Maize-OMICS_CLIM4OMICS-Analytics-and-Database: CLImate-for-Maize-OMICS_CLIM4OMICS-Analytics-and-Database Code, Zenodo [code], https://doi.org/10.5281/zenodo.8161662, 2023b.
Aslam, H., Sarzaeim, P., and Munoz-Arriola, F.: HasnatJutt/CLImate-for-Maize-OMICS_CLIM4OMICS-Analytics-and-Database: CLImate-for-Maize-OMICS_CLIM4OMICS-Analytics-and-Database Code, GitHub [code], https://github.com/HasnatJutt/CLImate-for-Maize-OMICS_CLIM4OMICS-Analytics-and-Database/tree/v2.0 (last access: 18 July 2023), 2023c.
Asseng, S., Ewert, F., Rosenzweig, C., Jones, J. W., Hatfield, J. L., Ruane, A. C., Boote, K. J., Thorburn, P. J., Rötter, R. P., Cammarano, D., Brisson, N., Basso, B., Martre, P., Aggarwal, P. K., Angulo, C., Bertuzzi, P., Biernath, C., Challinor, A. J., Doltra, J., Gayler, S., Goldberg, R., Grant, R., Heng, L., Hooker, J., Hunt, L. A., Ingwersen, J., Izaurralde, R. C., Kersebaum, K. C., Müller, C., Naresh Kumar, S., Nendel, C., O'Leary, G., Olesen, J. E., Osborne, T. M., Palosuo, T., Priesack, E., Ripoche, D., Semenov, M. A., Shcherbak, I., Steduto, P., Stöckle, C., Stratonovitch, P., Streck, T., Supit, I., Tao, F., Travasso, M., Waha, K., Wallach, D., White, J. W., Williams, J. R., and Wolf, J.: Uncertainty in simulating wheat yields under climate change, Nat. Clim. Change, 3, 827–832, https://doi.org/10.1038/nclimate1916, 2013.
Baru, C., DeBlanc-Knowles, T., Campbell, L., George, J., Chang, W., and Halbert, M.: Open knowledge network roadmap – powering the next data revolution, OKN Innovation Sprint Organizing Committee, NSF, https://nsf-gov-resources.nsf.gov/2022-09/OKN%20Roadmap%20-%20Report_v03.pdf (last access: 30 August 2023), 2022.
Blum, A.: Drought Resistance and Its Improvement, in: Plant Breeding for Water-Limited Environments, edited by: Blum, A., Springer, New York, NY, 53–152, https://doi.org/10.1007/978-1-4419-7491-4_3, 2011.
Bradbury, P. J., Zhang, Z., Kroon, D. E., Casstevens, T. M., Ramdoss, Y., and Buckler, E. S.: TASSEL: software for association mapping of complex traits in diverse samples, Bioinformatics, 23, 2633–2635, https://doi.org/10.1093/bioinformatics/btm308, 2007.
Brönnimann, S., Annis, J., Dann, W., Ewen, T., Grant, A. N., Griesser, T., Krähenmann, S., Mohr, C., Scherer, M., and Vogler, C.: A guide for digitising manuscript climate data, Clim. Past, 2, 137–144, https://doi.org/10.5194/cp-2-137-2006, 2006.
Bruno, F., Cocchi, D., Greco, F., and Scardovi, E.: Spatial reconstruction of rainfall fields from rain gauge and radar data, Stoch. Environ. Res. Risk Assess., 28, 1235–1245, https://doi.org/10.1007/s00477-013-0812-0, 2014.
Cattivelli, L., Rizza, F., Badeck, F.-W., Mazzucotelli, E., Mastrangelo, A. M., Francia, E., Marè, C., Tondelli, A., and Stanca, A. M.: Drought tolerance improvement in crop plants: An integrated view from breeding to genomics, Field Crops Res., 105, 1–14, https://doi.org/10.1016/j.fcr.2007.07.004, 2008.
Chiu, C.-A., Lin, P.-H., and Lu, K.-C.: GIS-based Tests for Quality Control of Meteorological Data and Spatial Interpolation of Climate Data, Mt. Res. Dev., 29, 339–349, https://doi.org/10.1659/mrd.00030, 2009.
Di Paola, A., Valentini, R., and Santini, M.: An overview of available crop growth and yield models for studies and assessments in agriculture, J. Sci. Food Agric., 96, 709–714, https://doi.org/10.1002/jsfa.7359, 2016.
Feng, S., Hu, Q., and Qian, W.: Quality control of daily meteorological data in China, 1951–2000: a new dataset, Int. J. Climatol., 24, 853–870, https://doi.org/10.1002/joc.1047, 2004.
Firican, G.: The 10 Vs of Big Data, TDWI, https://tdwi.org/articles/2017/02/08/10-vs-of-big-data.aspx (last access: 31 December 2022), 2017.
Furche, T., Gottlob, G., Neumayr, B., and Sallinger, E.: Data Wrangling for Big Data: Towards a Lingua Franca for Data Wrangling, Proceedings of the 10th Alberto Mendelzon International Workshop on Foundations of Data Management, 8–10 May 2016, Panama City, Panama, CEUR Workshop Proceedings 1644, https://ceur-ws.org/Vol-1644/paper20.pdf (last access: 31 August 2023), 2016.
Genomes to Fields: Genomes to Fields Phenotyping Handbook, Genomes to Fields initiative, https://www.genomes2fields.org/docs/Genomes_to_Fields_Phenotype_Handbook.pdf (last access: 30 August 2023), 2013.
Genomes to Fields initiative: Phenotypic, genotypic, and environment data, CyVerse [data set], https://doi.org/10.25739/9wjm-eq41, 2014.
Genomes to Fields initiative: Phenotypic, genotypic, and environment data, CyVerse [data set], https://doi.org/10.25739/erxg-yn49, 2015.
Genomes to Fields initiative: Phenotypic, genotypic, and environment data, CyVerse [data set], https://doi.org/10.25739/yjnh-kt21, 2016.
Genomes to Fields initiative: Phenotypic, genotypic, and environment data, CyVerse [data set], https://doi.org/10.25739/w560-2114, 2017.
Genomes to Fields initiative: Phenotypic, genotypic, and environment data, CyVerse [data set], https://doi.org/10.25739/anqq-sg86, 2018.
Genomes to Fields initiative: Phenotypic, genotypic, and environment data, CyVerse [data set], https://doi.org/10.25739/t651-yy97, 2019.
Genomes to Fields initiative: Phenotypic, genotypic, and environment data, CyVerse [data set], https://doi.org/10.25739/hzzs-a865, 2020.
Genomes to Fields initiative: Phenotypic, genotypic, and environment data, CyVerse [data set], https://doi.org/10.25739/5ae3-sw62, 2021.
Germeier, C. U. and Unger, S.: Modeling Crop Genetic Resources Phenotyping Information Systems, Front. Plant Sci., 10, https://doi.org/10.3389/fpls.2019.00728, 2019.
Gómez-Dans, J. L., Lewis, P. E., Yin, F., Asare, K., Lamptey, P., Aidoo, K. K. Y., MacCarthy, D. S., Ma, H., Wu, Q., Addi, M., Aboagye-Ntow, S., Doe, C. E., Alhassan, R., Kankam-Boadu, I., Huang, J., and Li, X.: Location, biophysical and agronomic parameters for croplands in northern Ghana, Earth Syst. Sci. Data, 14, 5387–5410, https://doi.org/10.5194/essd-14-5387-2022, 2022.
González-Rouco, J. F., Jiménez, J. L., Quesada, V., and Valero, F.: Quality Control and Homogeneity of Precipitation Data in the Southwest of Europe, J. Climate, 14, 964–978, https://doi.org/10.1175/1520-0442(2001)014<0964:QCAHOP>2.0.CO;2, 2001.
Habib, A., Kersting, A. P., Bang, K. I., and Lee, D.-C.: Alternative Methodologies for the Internal Quality Control of Parallel LiDAR Strips, IEEE Trans. Geosci. Remote Sens., 48, 221–236, https://doi.org/10.1109/TGRS.2009.2026424, 2010.
Hartkamp, A. D., White, J. W., and Hoogenboom, G.: Interfacing Geographic Information Systems with Agronomic Modeling: A Review, Agron. J., 91, 761–772, https://doi.org/10.2134/agronj1999.915761x, 1999.
Huang, J., Gómez-Dans, J. L., Huang, H., Ma, H., Wu, Q., Lewis, P. E., Liang, S., Chen, Z., Xue, J.-H., Wu, Y., Zhao, F., Wang, J., and Xie, X.: Assimilation of remote sensing into crop growth models: Current status and perspectives, Agr. Forest Meteorol., 276–277, 107609, https://doi.org/10.1016/j.agrformet.2019.06.008, 2019.
Hubbard, K. G., Goddard, S., Sorensen, W. D., Wells, N., and Osugi, T. T.: Performance of Quality Assurance Procedures for an Applied Climate Information System, J. Atmos. Ocean. Tech., 22, 105–112, https://doi.org/10.1175/JTECH-1657.1, 2005.
Jaimes-Correa, J. C., Muñoz-Arriola, F., and Bartelt-Hunt, S.: Modeling Water Quantity and Quality Nonlinearities for Watershed Adaptability to Hydroclimate Extremes in Agricultural Landscapes, Hydrology, 9, 80, https://doi.org/10.3390/hydrology9050080, 2022.
Janev, V.: Chapter 1 Ecosystem of Big Data, in: Knowledge Graphs and Big Data Processing, edited by: Janev, V., Graux, D., Jabeen, H., and Sallinger, E., Springer International Publishing, Cham, 3–19, https://doi.org/10.1007/978-3-030-53199-7_1, 2020.
Jarquín, D., Kocak, K., Posadas, L., Hyma, K., Jedlicka, J., Graef, G., and Lorenz, A.: Genotyping by sequencing for genomic prediction in a soybean breeding population, BMC Genomics, 15, 740, https://doi.org/10.1186/1471-2164-15-740, 2014.
Jarquín, D., Lemes da Silva, C., Gaynor, R. C., Poland, J., Fritz, A., Howard, R., Battenfield, S., and Crossa, J.: Increasing Genomic-Enabled Prediction Accuracy by Modeling Genotype × Environment Interactions in Kansas Wheat, Plant Genome-US, 10, 1–15, https://doi.org/10.3835/plantgenome2016.12.0130, 2017.
Jarquin, D., de Leon, N., Romay, C., Bohn, M., Buckler, E. S., Ciampitti, I., Edwards, J., Ertl, D., Flint-Garcia, S., Gore, M. A., Graham, C., Hirsch, C. N., Holland, J. B., Hooker, D., Kaeppler, S. M., Knoll, J., Lee, E. C., Lawrence-Dill, C. J., Lynch, J. P., Moose, S. P., Murray, S. C., Nelson, R., Rocheford, T., Schnable, J. C., Schnable, P. S., Smith, M., Springer, N., Thomison, P., Tuinstra, M., Wisser, R. J., Xu, W., Yu, J., and Lorenz, A.: Utility of Climatic Information via Combining Ability Models to Improve Genomic Prediction for Yield Within the Genomes to Fields Maize Project, Front. Genet., 11, 592769, https://doi.org/10.3389/fgene.2020.592769, 2021.
Jiang, R., Wang, T., Shao, J., Guo, S., Zhu, W., Yu, Y., Chen, S., and Hatano, R.: Modeling the biomass of energy crops: Descriptions, strengths and prospective, J. Integr. Agric., 16, 1197–1210, https://doi.org/10.1016/S2095-3119(16)61592-7, 2017.
Lawrence-Dill, C. J., Schnable, P. S., and Springer, N. M.: Idea Factory: the Maize Genomes to Fields Initiative, Crop Sci., 59, 1406–1410, https://doi.org/10.2135/cropsci2019.02.0071, 2019.
Lin, Y.-C. and Habib, A.: Quality control and crop characterization framework for multi-temporal UAV LiDAR data over mechanized agricultural fields, Remote Sens. Environ., 256, 112299, https://doi.org/10.1016/j.rse.2021.112299, 2021.
Liu, H., Wood, A. W., Newman, A. J., and Clark, M. P.: Ensemble Dressing of Meteorological Fields: Using Spatial Regression to Estimate Uncertainty in Deterministic Gridded Meteorological Datasets, J. Hydrometeorol., 23, 1525–1543, https://doi.org/10.1175/JHM-D-21-0176.1, 2022.
Livneh, B., Rosenberg, E. A., Lin, C., Nijssen, B., Mishra, V., Andreadis, K. M., Maurer, E. P., and Lettenmaier, D. P.: A Long-Term Hydrologically Based Dataset of Land Surface Fluxes and States for the Conterminous United States: Update and Extensions, J. Climate, 26, 9384–9392, https://doi.org/10.1175/JCLI-D-12-00508.1, 2013.
Livneh, B., Bohn, T. J., Pierce, D. W., Munoz-Arriola, F., Nijssen, B., Vose, R., Cayan, D. R., and Brekke, L.: A spatially comprehensive, hydrometeorological data set for Mexico, the U.S., and Southern Canada 1950–2013, Sci. Data, 2, 150042, https://doi.org/10.1038/sdata.2015.42, 2015.
Lopes, M. S., El-Basyoni, I., Baenziger, P. S., Singh, S., Royo, C., Ozbek, K., Aktas, H., Ozer, E., Ozdemir, F., Manickavelu, A., Ban, T., and Vikram, P.: Exploiting genetic diversity from landraces in wheat breeding for adaptation to climate change, J. Exp. Bot., 66, 3477–3486, https://doi.org/10.1093/jxb/erv122, 2015.
Matthews, J. L., Mannshardt, E., and Gremaud, P.: Uncertainty Quantification for Climate Observations, B. Am. Meteorol. Soc., 94, ES21–ES25, https://doi.org/10.1175/BAMS-D-12-00042.1, 2013.
Maurer, E. P., Wood, A. W., Adam, J. C., Lettenmaier, D. P., and Nijssen, B.: A Long-Term Hydrologically Based Dataset of Land Surface Fluxes and States for the Conterminous United States, J. Climate, 15, 3237–3251, https://doi.org/10.1175/1520-0442(2002)015<3237:ALTHBD>2.0.CO;2, 2002.
McFarland, B. A., Alkhalifah, N., Bohn, M., Bubert, J., Buckler, E. S., Ciampitti, I., Edwards, J., Ertl, D., Gage, J. L., Falcon, C. M., Flint-Garcia, S., Gore, M. A., Graham, C., Hirsch, C. N., Holland, J. B., Hood, E., Hooker, D., Jarquin, D., Kaeppler, S. M., Knoll, J., Kruger, G., Lauter, N., Lee, E. C., Lima, D. C., Lorenz, A., Lynch, J. P., McKay, J., Miller, N. D., Moose, S. P., Murray, S. C., Nelson, R., Poudyal, C., Rocheford, T., Rodriguez, O., Romay, M. C., Schnable, J. C., Schnable, P. S., Scully, B., Sekhon, R., Silverstein, K., Singh, M., Smith, M., Spalding, E. P., Springer, N., Thelen, K., Thomison, P., Tuinstra, M., Wallace, J., Walls, R., Wills, D., Wisser, R. J., Xu, W., Yeh, C. T., and De Leon, N.: Maize genomes to fields (G2F): 2014–2017 field seasons: Genotype, phenotype, climatic, soil, and inbred ear image datasets, BMC Res. Notes, 13, 71, https://doi.org/10.1186/s13104-020-4922-8, 2020.
Merchant, C. J., Paul, F., Popp, T., Ablain, M., Bontemps, S., Defourny, P., Hollmann, R., Lavergne, T., Laeng, A., de Leeuw, G., Mittaz, J., Poulsen, C., Povey, A. C., Reuter, M., Sathyendranath, S., Sandven, S., Sofieva, V. F., and Wagner, W.: Uncertainty information in climate data records from Earth observation, Earth Syst. Sci. Data, 9, 511–527, https://doi.org/10.5194/essd-9-511-2017, 2017.
Muñoz-Arriola, F., Avissar, R., Zhu, C., and Lettenmaier, D. P.: Sensitivity of the water resources of Rio Yaqui Basin, Mexico, to agriculture extensification under multiscale climate conditions, Water Resour. Res., 45, W00A20, https://doi.org/10.1029/2007WR006783, 2009.
Overpeck, J. T., Meehl, G. A., Bony, S., and Easterling, D. R.: Climate Data Challenges in the 21st Century, Science, 331, 700–702, https://doi.org/10.1126/science.1197869, 2011.
Peng, G., Lacagnina, C., Downs, R. R., Ganske, A., Ramapriyan, H. K., Ivánová, I., Wyborn, L., Jones, D., Bastin, L., Shie, C., and Moroni, D. F.: Global Community Guidelines for Documenting, Sharing, and Reusing Quality Information of Individual Digital Datasets, Data Sci. J., 21, 8, https://doi.org/10.5334/dsj-2022-008, 2022.
Persa, R., Grondona, M., and Jarquin, D.: Development of genomic prediction pipeline for maintaining comparable sample sizes in training and testing sets across prediction schemes accounting for the genotype-by-environment interaction, Agriculture, 11, 932, https://doi.org/10.3390/agriculture11100932, 2021.
Pogson, M.: Modelling Miscanthus yields with low resolution input data, Ecol. Model., 222, 3849–3853, https://doi.org/10.1016/j.ecolmodel.2011.10.008, 2011.
Poland, J., Endelman, J., Dawson, J., Rutkoski, J., Wu, S., Manes, Y., Dreisigacker, S., Crossa, J., Sánchez-Villeda, H., Sorrells, M., and Jannink, J.-L.: Genomic Selection in Wheat Breeding using Genotyping-by-Sequencing, Plant Genome, 5, 103–113, https://doi.org/10.3835/plantgenome2012.06.0006, 2012.
Pollock, M. D., O'Donnell, G., Quinn, P., Dutton, M., Black, A., Wilkinson, M. E., Colli, M., Stagnaro, M., Lanza, L. G., Lewis, E., Kilsby, C. G., and O'Connell, P. E.: Quantifying and Mitigating Wind-Induced Undercatch in Rainfall Measurements, Water Resour. Res., 54, 3863–3875, https://doi.org/10.1029/2017WR022421, 2018.
Quiñones, R., Munoz-Arriola, F., Choudhury, S. D., and Samal, A.: Multi-feature data repository development and analytics for image cosegmentation in high-throughput plant phenotyping, PLOS ONE, 16, e0257001, https://doi.org/10.1371/journal.pone.0257001, 2021.
Rehana, S., Yeleswarapu, P., Basha, G., and Munoz-Arriola, F.: Precipitation and temperature extremes and association with large-scale climate indices: An observational evidence over India, J. Earth Syst. Sci., 131, 170, https://doi.org/10.1007/s12040-022-01911-3, 2022.
Reyer, C. P. O., Silveyra Gonzalez, R., Dolos, K., Hartig, F., Hauf, Y., Noack, M., Lasch-Born, P., Rötzer, T., Pretzsch, H., Meesenburg, H., Fleck, S., Wagner, M., Bolte, A., Sanders, T. G. M., Kolari, P., Mäkelä, A., Vesala, T., Mammarella, I., Pumpanen, J., Collalti, A., Trotta, C., Matteucci, G., D'Andrea, E., Foltýnová, L., Krejza, J., Ibrom, A., Pilegaard, K., Loustau, D., Bonnefond, J.-M., Berbigier, P., Picart, D., Lafont, S., Dietze, M., Cameron, D., Vieno, M., Tian, H., Palacios-Orueta, A., Cicuendez, V., Recuero, L., Wiese, K., Büchner, M., Lange, S., Volkholz, J., Kim, H., Horemans, J. A., Bohn, F., Steinkamp, J., Chikalanov, A., Weedon, G. P., Sheffield, J., Babst, F., Vega del Valle, I., Suckow, F., Martel, S., Mahnken, M., Gutsch, M., and Frieler, K.: The PROFOUND Database for evaluating vegetation models and simulating climate impacts on European forests, Earth Syst. Sci. Data, 12, 1295–1320, https://doi.org/10.5194/essd-12-1295-2020, 2020.
Rico, D. A., Detweiler, C., and Muñoz-Arriola, F.: Power-over-Tether UAS Leveraged for Nearly-Indefinite Meteorological Data Acquisition, in: 2020 ASABE Annual International Virtual Meeting, 12–15 July 2020, Omaha, NE, USA, American Society of Agricultural and Biological Engineers, p. 1, https://doi.org/10.13031/aim.202001345, 2020.
Rico, D. A., Muñoz-Arriola, F., and Detweiler, D.: Trajectory selection for power-over-tether atmospheric sensing UAS, in: 2021 IEEE/RSJ International Conference on Intelligent Robots and Systems (IROS), 27 September–1 October 2021, Prague, Czech Republic, IEEE, 2321–2328, https://doi.org/10.1109/IROS51168.2021.9636364, 2021.
Robertson, A. D., Davies, C. A., Smith, P., Dondini, M., and McNamara, N. P.: Modelling the carbon cycle of Miscanthus plantations: existing models and the potential for their improvement, GCB Bioenergy, 7, 405–421, https://doi.org/10.1111/gcbb.12144, 2014.
Rosenzweig, C., Jones, J. W., Hatfield, J. L., Ruane, A. C., Boote, K. J., Thorburn, P., Antle, J. M., Nelson, G. C., Porter, C., Janssen, S., Asseng, S., Basso, B., Ewert, F., Wallach, D., Baigorria, G., and Winter, J. M.: The Agricultural Model Intercomparison and Improvement Project (AgMIP): Protocols and pilot studies, Agr. Forest Meteorol., 170, 166–182, https://doi.org/10.1016/j.agrformet.2012.09.011, 2013.
Ruane, A. C., Goldberg, R., and Chryssanthacopoulos, J.: Climate forcing datasets for agricultural modeling: Merged products for gap-filling and historical climate series estimation, Agr. Forest Meteorol., 200, 233–248, https://doi.org/10.1016/j.agrformet.2014.09.016, 2015.
Sarzaeim, P., Muñoz-Arriola, F., and Jarquin, D.: Analytics for climate-uncertainty estimation and propagation in maize-phenotype predictions, in: 2020 ASABE Annual International Virtual Meeting, 13–15 July 2020, Omaha, NE, USA, American Society of Agricultural and Biological Engineers, https://doi.org/10.13031/aim.202000884, 2020.
Sarzaeim, P., Ou, W., de Oliveira, L. A., and Munoz-Arriola, F.: Flood-Risk Analytics for Climate-Resilient Agriculture Using Remote Sensing in the Northern High Plains, GEO-Extreme, GSP 329, 234–244, https://doi.org/10.1061/9780784483695.023, 2021.
Sarzaeim, P., Muñoz-Arriola, F., and Jarquín, D.: Climate and genetic data enhancement using deep learning analytics to improve maize yield predictability, J. Exp. Bot., 73, 5336–5354, https://doi.org/10.1093/jxb/erac146, 2022a.
Sarzaeim, P., Munoz-Arriola, F., and Jarquín, D.: Large-scale and Multi-dimensional Climate, Genetics, and Phenotypes Database for Maize Yield Predictability in the U.S. and Canada, Zenodo [data set], https://doi.org/10.5281/zenodo.6299090, 2022b.
Sengupta, M., Xie, Y., Lopez, A., Habte, A., Maclaurin, G., and Shelby, J.: The National Solar Radiation Data Base (NSRDB), Renew. Sustain. Energy Rev., 89, 51–60, https://doi.org/10.1016/j.rser.2018.03.003, 2018.
Sertel, E., Robock, A., and Ormeci, C.: Impacts of land cover data quality on regional climate simulations, Int. J. Climatol., 30, 1942–1953, https://doi.org/10.1002/joc.2036, 2010.
Shekhar, S., Colletti, J., Muñoz-Arriola, F., Ramaswamy, L., Krintz, C., Varshney, L., and Richardson, D.: Intelligent Infrastructure for Smart Agriculture: An Integrated Food, Energy and Water System, arXiv [preprint], https://doi.org/10.48550/arXiv.1705.01993, 4 May 2017.
Steiner, A. K., Hunt, D., Ho, S.-P., Kirchengast, G., Mannucci, A. J., Scherllin-Pirscher, B., Gleisner, H., von Engeln, A., Schmidt, T., Ao, C., Leroy, S. S., Kursinski, E. R., Foelsche, U., Gorbunov, M., Heise, S., Kuo, Y.-H., Lauritsen, K. B., Marquardt, C., Rocken, C., Schreiner, W., Sokolovskiy, S., Syndergaard, S., and Wickert, J.: Quantification of structural uncertainty in climate data records from GPS radio occultation, Atmos. Chem. Phys., 13, 1469–1484, https://doi.org/10.5194/acp-13-1469-2013, 2013.
Surendran Nair, S., Kang, S., Zhang, X., Miguez, F. E., Izaurralde, R. C., Post, W. M., Dietze, M. C., Lynd, L. R., and Wullschleger, S. D.: Bioenergy crop models: descriptions, data requirements, and future challenges, GCB Bioenergy, 4, 620–633, https://doi.org/10.1111/j.1757-1707.2012.01166.x, 2012.
Tang, Q., Vivoni, E. R., Muñoz-Arriola, F., and Lettenmaier, D. P.: Predictability of Evapotranspiration Patterns Using Remotely Sensed Vegetation Dynamics during the North American Monsoon, J. Hydrometeorol., 13, 103–121, https://doi.org/10.1175/JHM-D-11-032.1, 2012.
TASSEL: https://tassel.bitbucket.io/ (last access: 30 August 2023), 2022.
Thornton, M. M., Shrestha, R., Wei, Y., Thornton, P. E., Kao, S.-C., and Wilson, B. E.: Daymet: Daily Surface Weather Data on a 1-km Grid for North America, Version 4 R1, ORNL DAAC, https://doi.org/10.3334/ORNLDAAC/2129, 2022.
van Wart, J., Grassini, P., and Cassman, K. G.: Impact of derived global weather data on simulated crop yields, Glob. Change Biol., 19, 3822, https://doi.org/10.1111/gcb.12302, 2013.
Weber, T. K. D., Ingwersen, J., Högy, P., Poyda, A., Wizemann, H.-D., Demyan, M. S., Bohm, K., Eshonkulov, R., Gayler, S., Kremer, P., Laub, M., Nkwain, Y. F., Troost, C., Witte, I., Reichenau, T., Berger, T., Cadisch, G., Müller, T., Fangmeier, A., Wulfmeyer, V., and Streck, T.: Multi-site, multi-crop measurements in the soil–vegetation–atmosphere continuum: a comprehensive dataset from two climatically contrasting regions in southwestern Germany for the period 2009–2018, Earth Syst. Sci. Data, 14, 1153–1181, https://doi.org/10.5194/essd-14-1153-2022, 2022.
Westhues, C. C., Simianer, H., and Beissinger, T. M.: learnMET: an R package to apply machine learning methods for genomic prediction using multi-environment trial data, G3-Genes Genom. Genet., 12, jkac226, https://doi.org/10.1093/g3journal/jkac226, 2022.
Wilkinson, M. D., Dumontier, M., Aalbersberg, Ij. J., Appleton, G., Axton, M., Baak, A., Blomberg, N., Boiten, J.-W., da Silva Santos, L. B., Bourne, P. E., Bouwman, J., Brookes, A. J., Clark, T., Crosas, M., Dillo, I., Dumon, O., Edmunds, S., Evelo, C. T., Finkers, R., Gonzalez-Beltran, A., Gray, A. J. G., Groth, P., Goble, C., Grethe, J. S., Heringa, J., 't Hoen, P. A. C., Hooft, R., Kuhn, T., Kok, R., Kok, J., Lusher, S. J., Martone, M. E., Mons, A., Packer, A. L., Persson, B., Rocca-Serra, P., Roos, M., van Schaik, R., Sansone, S.-A., Schultes, E., Sengstag, T., Slater, T., Strawn, G., Swertz, M. A., Thompson, M., van der Lei, J., van Mulligen, E., Velterop, J., Waagmeester, A., Wittenburg, P., Wolstencroft, K., Zhao, J., and Mons, B.: The FAIR Guiding Principles for scientific data management and stewardship, Sci. Data, 3, 160018, https://doi.org/10.1038/sdata.2016.18, 2016.
Winn, C. A., Archontoulis, S., and Edwards, J.: Calibration of a crop growth model in APSIM for 15 publicly available corn hybrids in North America, Crop Sci., 63, 511–534, https://doi.org/10.1002/csc2.20857, 2023.
Zeng, Y., Su, Z., Calvet, J.-C., Manninen, T., Swinnen, E., Schulz, J., Roebeling, R., Poli, P., Tan, D., Riihelä, A., Tanis, C.-M., Arslan, A.-N., Obregon, A., Kaiser-Weiss, A., John, V. O., Timmermans, W., Timmermans, J., Kaspar, F., Gregow, H., Barbu, A.-L., Fairbairn, D., Gelati, E., and Meurey, C.: Analysis of current validation practices in Europe for space-based climate data records of essential climate variables, Int. J. Appl. Earth Obs. Geoinform., 42, 150–161, https://doi.org/10.1016/j.jag.2015.06.006, 2015.