the Creative Commons Attribution 4.0 License.
the Creative Commons Attribution 4.0 License.
 | 23 Jan 2023
ChinaCropSM1 km: a fine 1 km daily soil moisture dataset for dryland wheat and maize across China during 1993–2018
Fei Cheng
Zhao Zhang
Huimin Zhuang
Jichong Han
Yuchuan Luo
Juan Cao
Liangliang Zhang
Jing Zhang
Fulu Tao
Soil moisture (SM) is a key variable of the regional hydrological cycle and has important applications for water resource and agricultural drought management. Various global soil moisture products have been mostly retrieved from microwave remote sensing data. However, currently there is rarely spatially explicit and time-continuous soil moisture information with a high resolution at the national scale. In this study, we generated a 1 km soil moisture dataset for dryland wheat and maize in China (ChinaCropSM1 km) over 1993–2018 through a random forest (RF) algorithm based on numerous in situ daily observations of soil moisture. We independently used in situ observations (181 327 samples) from the agricultural meteorological stations (AMSs) across China for training (164 202 samples) and others for testing (17 125 samples). An irrigation module was first developed according to crop type (i.e., wheat, maize), soil depth (0–10, 10–20 cm) and phenology. We produced four daily datasets separately by crop type and soil depth, and their accuracies were all satisfactory (wheat r 0.93, ubRMSE 0.033 m3 m−3; maize r 0.93, ubRMSE 0.035 m3 m−3). The spatiotemporal resolutions and accuracy of ChinaCropSM1 km were significantly better than those of global soil moisture products (e.g., r increased by 116 %, ubRMSE decreased by 64 %), including the global remote-sensing-based surface soil moisture dataset (RSSSM) and the European Space Agency (ESA) Climate Change Initiative (CCI) SM. The approach developed in our study could be applied to other regions and crops in the world, and our improved datasets are very valuable for many studies and field management, such as agricultural drought monitoring and crop yield forecasting. The data are published in Zenodo at https://doi.org/10.5281/zenodo.6834530 (wheat0–10) (Cheng et al., 2022a), https://doi.org/10.5281/zenodo.6822591 (wheat10–20) (Cheng et al., 2022b), https://doi/org/10.5281/zenodo.6822581 (maize0–10) (Cheng et al., 2022c) and https://doi.org/10.5281/zenodo.6820166 (maize10–20) (Cheng et al., 2022d).
- Article
(8419 KB) - Full-text XML
-
Supplement
(1282 KB) - BibTeX
- EndNote


Soil moisture (SM) is closely associated with droughts and floods and consequently agricultural production (Tao et al., 2003). Therefore, SM information at a high resolution is critical to improve crop yield prediction (Prasad et al., 2006; Chakrabarti et al., 2014) and drought impact assessment (Sheffield, 2004). However, such higher resolutions at both temporal (e.g., daily and more than decade) and spatial scales are still unavailable across China, especially for dry croplands.
SM can be obtained in several ways, including in situ observations (Walker et al., 2004; Bogena et al., 2007), remote sensing retrieval (Mohanty et al., 2017; Wei et al., 2019) and process-based model simulations (Vergopolan et al., 2020; Ahmed et al., 2021). Field observations provide the most accurate SM but are expensive and time-consuming, and there are large uncertainties from extrapolating the limited observations into larger regions with high heterogeneity (Collow et al., 2012; Crow et al., 2012). Microwave sensors have been applied to retrieve SM in recent years (Schmugge et al., 2002; Wigneron et al., 2003; Amazirh et al., 2018). The microwave sensors can only monitor near-surface SM (0–10 cm) (Eagleman and Lin, 1976; Jackson et al., 1982). Passive microwave sensors can monitor daily SM but with a coarse resolution (25–40 km), compared with a high spatial resolution (10–30 m) and a coarser repetition interval (15–25 d) for active sensors (Eagleman and Lin, 1976; Jackson et al., 1982; Mallick et al., 2009). Such SM products have large uncertainties due to the limitations of satellite coverage and downscaling methods, although they can easily cover large regions compared with in situ observations (Loew et al., 2013; Su et al., 2016; Peng et al., 2017). Deriving the SM from model simulation is also challenging because of its high requirements in input data and computing ability, as well as large uncertainties from model parameters (Wang and Qu, 2009; Yilmaz et al., 2012; Petropoulos et al., 2015). In addition, many studies have found that irrigation, as an additional water supply source other than precipitation, reduces soil albedo (Chen and Dirmeyer, 2019), increases heat capacity (Wang et al., 2019), alters local SM (Lawston et al., 2017), and affects the water and energy budget (Shen et al., 2013). However, few studies have taken irrigation into account in developing SM data products at the national or global scale (Drewniak et al., 2013; Qiu et al., 2016a). Therefore, it is critical yet challenging to improve SM accuracy at both spatial and temporal resolutions.
As one part of the Climate Change Initiative (CCI), the European Space Agency (ESA) published a long-term surface SM dataset, and the latest version (v06.1) covered the period of 1978–2020 (https://www.esa-soilmoisture-cci.org/, last access: 10 April 2022) (Dorigo et al., 2017; Gruber et al., 2019; Preimesberger et al., 2021). The ESA CCI SM products are consistent with the observed values at some grassland and farmland sites in China (Liu et al., 2011; Albergel et al., 2013; Dorigo et al., 2015, 2017); however, they have a coarse spatial resolution (∼ 27 km) and many coverage gaps (Llamas et al., 2020; Guevara et al., 2021). More recently, based on multiple neural networks, the global remote-sensing-based surface soil moisture (RSSSM) dataset covering 2003–2018 at 0.1∘ resolution was developed by using Soil Moisture Active Passive (SMAP) SM as the primary training target. The RSSSM improved the coefficient of determination (R2) by 0.46 and the root mean squared error (RMSE) by 0.083 m3 m−3, with a 10 d resolution (Chen et al., 2021). In 2020, another new SM dataset in China from 2002 to 2018 was provided from different passive microwave SM products and model-based downscaling techniques (Meng et al., 2021). With an improved correlation coefficient (r) of 0.84 and an unbiased root mean squared error (ubRMSE) of 0.056 m3 m−3, the new dataset has a 0.05∘ spatial resolution and a monthly time resolution. These SM products have contributed largely to related agricultural studies and management; however, they are still too coarse to assess agricultural drought risk and predict crop yield accurately.
Although numerous efforts have been devoted to developing SM products, major concerns should be addressed: (1) agricultural management activities such as irrigation have not been fully considered by previous studies, especially in countries such as China with extensive irrigated areas (Zhu et al., 2013); (2) both the spatial and temporal (e.g., daily) resolutions of SM products need to be improved for regional agricultural management; and (3) the SM accuracy needs to be further improved. In recent years, in situ observations have become available (Li et al., 2005). Some new methods, such as machine learning, are increasingly applied to many fields and have been shown to be robust in incorporating multiple sources of data to develop spatiotemporal datasets (Ahmad et al., 2010; Srivastava et al., 2013; Im et al., 2016).
Therefore, our main objectives in the study were to develop a novel method to generate a daily 1 km SM dataset for dry croplands across China based on numerous field observations, to evaluate their accuracy and compare them with current products, and to explore the spatiotemporal characteristics of soil moisture for dryland wheat and maize. We anticipate that our methods and datasets will be valuable for agricultural drought monitoring and crop yield forecasting.
2.1 Study area
The study area is dominated by dryland crops such as wheat and maize in China, with complex cultivation methods (Wu and Li, 2012) and various irrigation activities (Huang et al., 2015). According to the annual harvesting areas of crops across mainland China from 2000 to 2015 (Luo et al., 2020a, b), maize and wheat are the two main crops in China, accounting for 35.4 % of the total harvested area (FAOSTAT, 2019). The study areas and SM in situ field monitoring sites for the two crops are shown in Fig. 1.
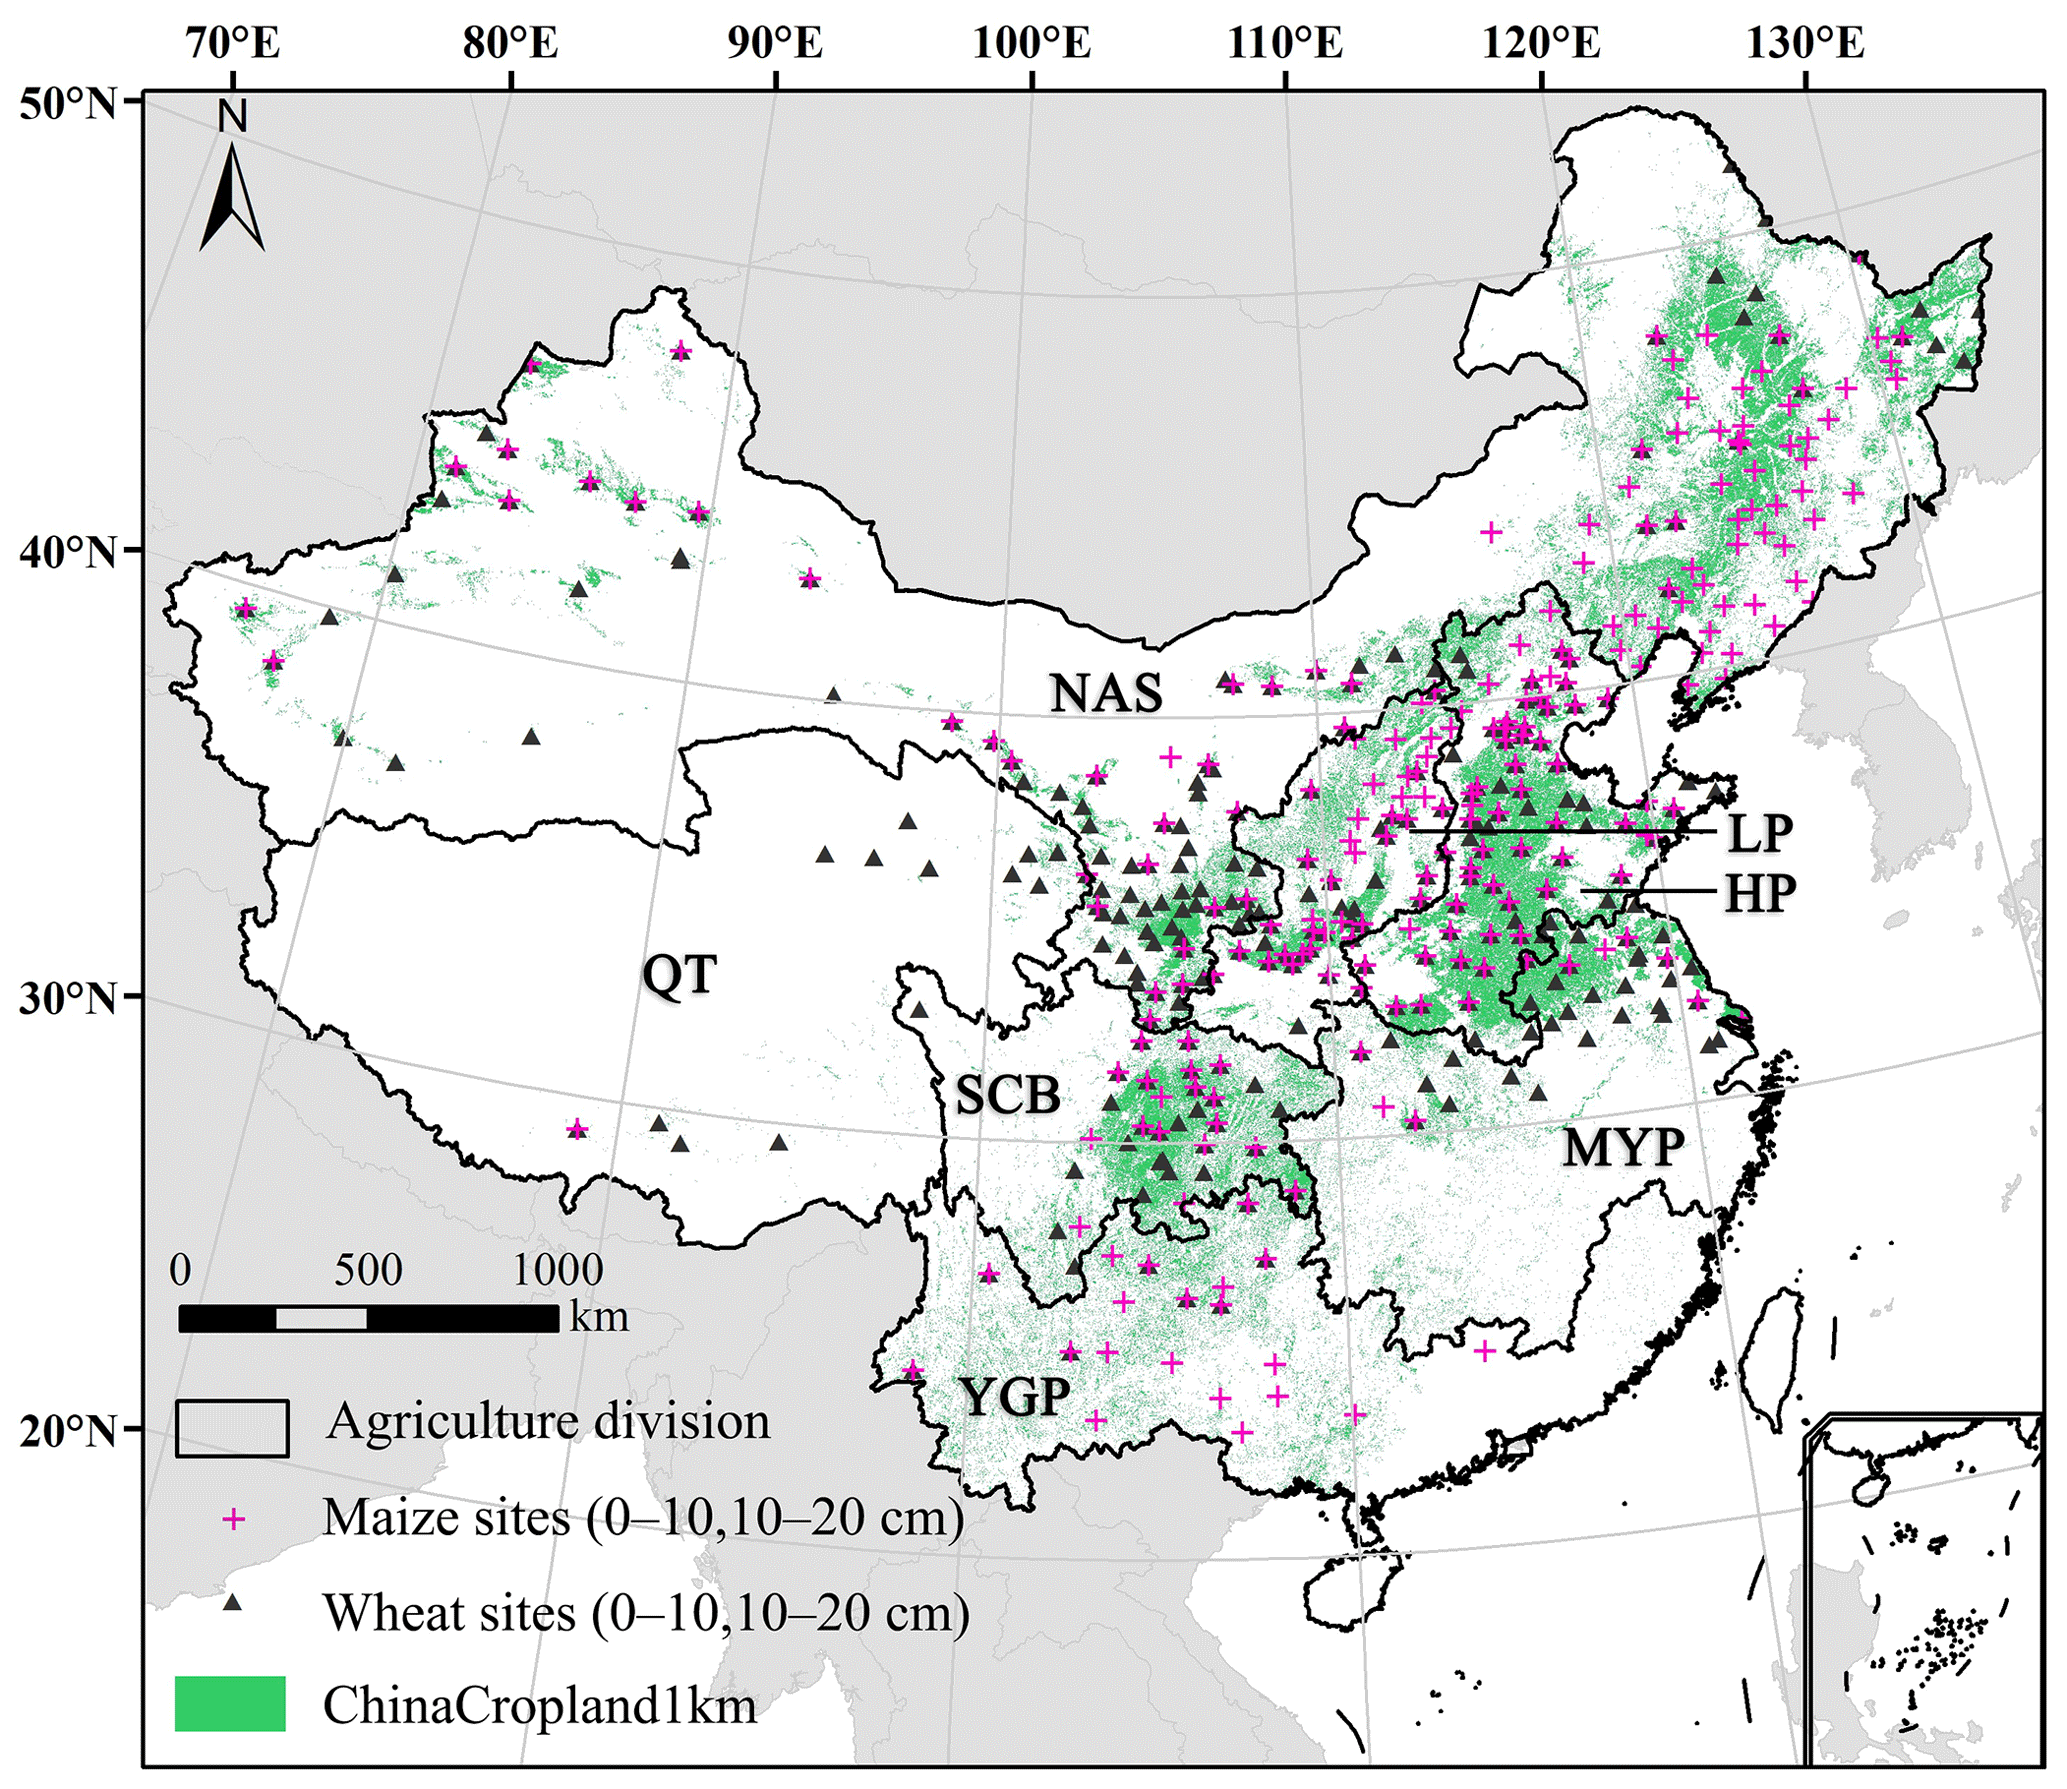
Figure 1Study areas and SM in situ field monitoring sites in China. NAS: northern arid and semiarid region; LP: Loess Plateau; HP: Huang–Huai–Hai Plain; SCB: Sichuan Basin; MYP: middle–lower Yangtze Plain; YGP: Yunnan–Guizhou Plateau and southern China; QT: Qinghai–Tibet region; ChinaCropland1 km: the harvesting areas of crops across mainland China.
2.2 Data
2.2.1 In situ SM observations
The in situ SM observation data (http://data.cma.cn, last access: 18 April 2021) from 1993 to 2018 were obtained from agricultural meteorological stations (AMSs) in China, which recorded the location, crop type, phenology, soil depth and SM. SM was measured at depths of 10 cm and 20 cm at each AMS on the 8th, 18th and 28th of each month. For each sample, crop phenology was observed and recorded by well-trained agricultural technicians in experimental fields (the average field size was 0.15 ha) and then checked and qualified by the Chinese Agricultural Meteorological Monitoring System (CAMMS). The location of AMSs is generally selected in areas with relatively homogeneous soil properties. Also the fact that crops were quite well managed by irrigation according to weather variability and crop growth status makes the crop SM records largely representative of the overall level of pixels (1 km × 1 km) (Zhang et al., 2020; Li et al., 2021). The first layer (0–10 cm) has been widely used to investigate the spatial and temporal characteristics of SM and validate SM retrieved from microwaves across China (Lacava et al., 2012; Zeng et al., 2015; Liu et al., 2018; Fang et al., 2020).
We collected the in situ observations of maize (287 sites) and wheat (240 sites), with a total of 181 327 samples (maize: 36 226 samples for the 0–10 cm soil layer, 36 245 samples for the 10–20 cm soil layer; wheat: 54 396 samples for the 0–10 cm soil layer, 54 460 samples for the 10–20 cm soil layer).
2.2.2 Environmental factors
The environmental factors were classified into site features and gridded features, both of which include meteorological data (MD), day of year (DOY), classified irrigation (CIR), soil properties (SPs), remote sensing data (RSD) and geographical information (GI) (Table 1).
Table 1Environmental factors used in the study, including meteorological data (MD), day of year (DOY), classified irrigation (CIR), soil properties (SP), remote sensing data (RSD) and geographical information (GI).
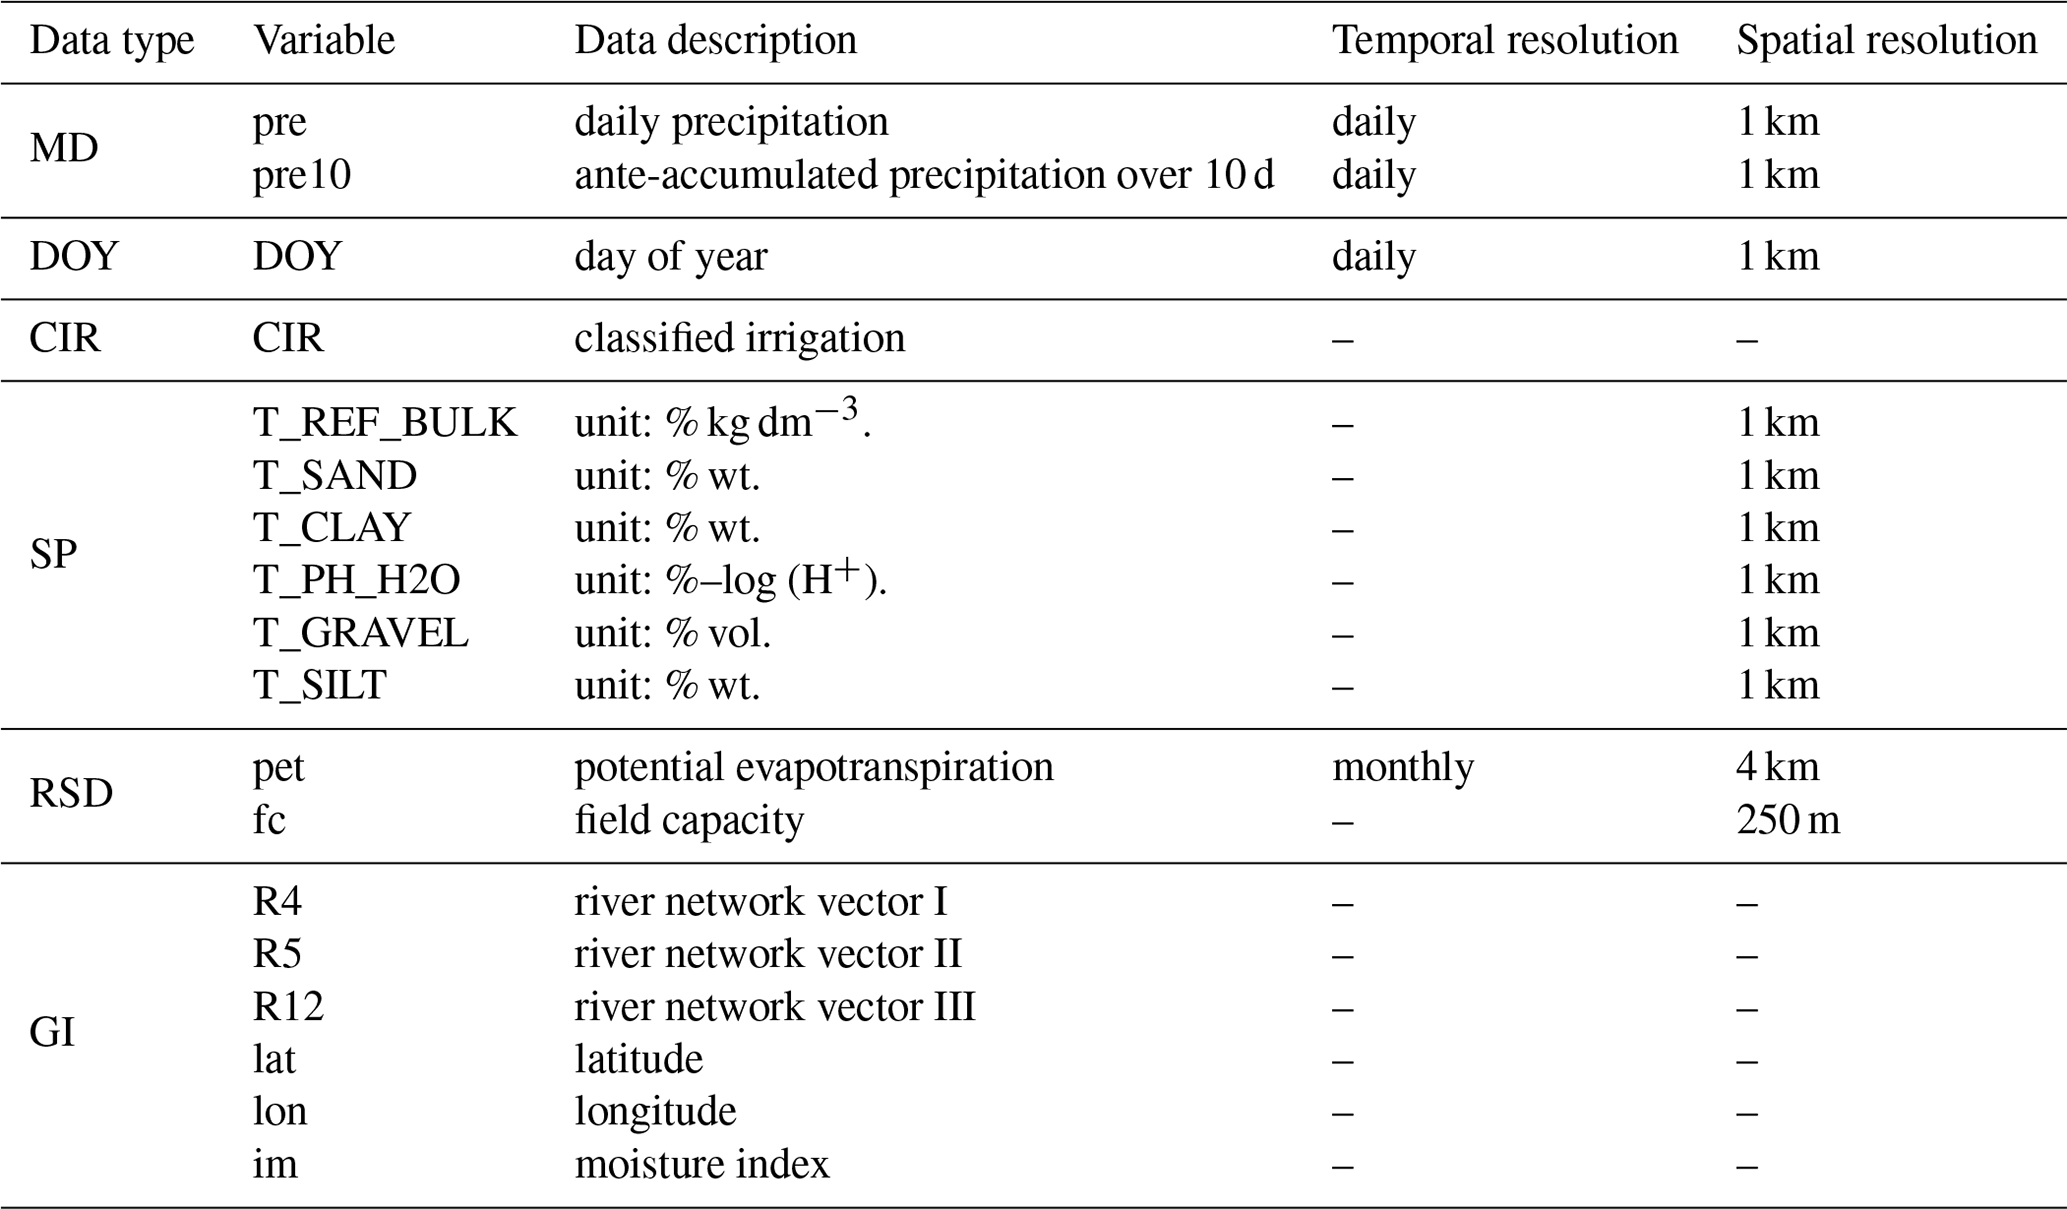
Note: REF_BULK: soil bulk density; PH_H2O: hydrogen ion concentration; GRAVEL: volume percentage of crushed stone; T: topsoil layer. The dashed line represents no default values.
MD includes daily total precipitation (pre) and ante-accumulated precipitation over 10 d (pre10) from meteorological stations across China (CNMSs) (http://data.cma.cn, last access: 10 April 2021) (Fig. S1).
CIR was calculated using Eq. (1).
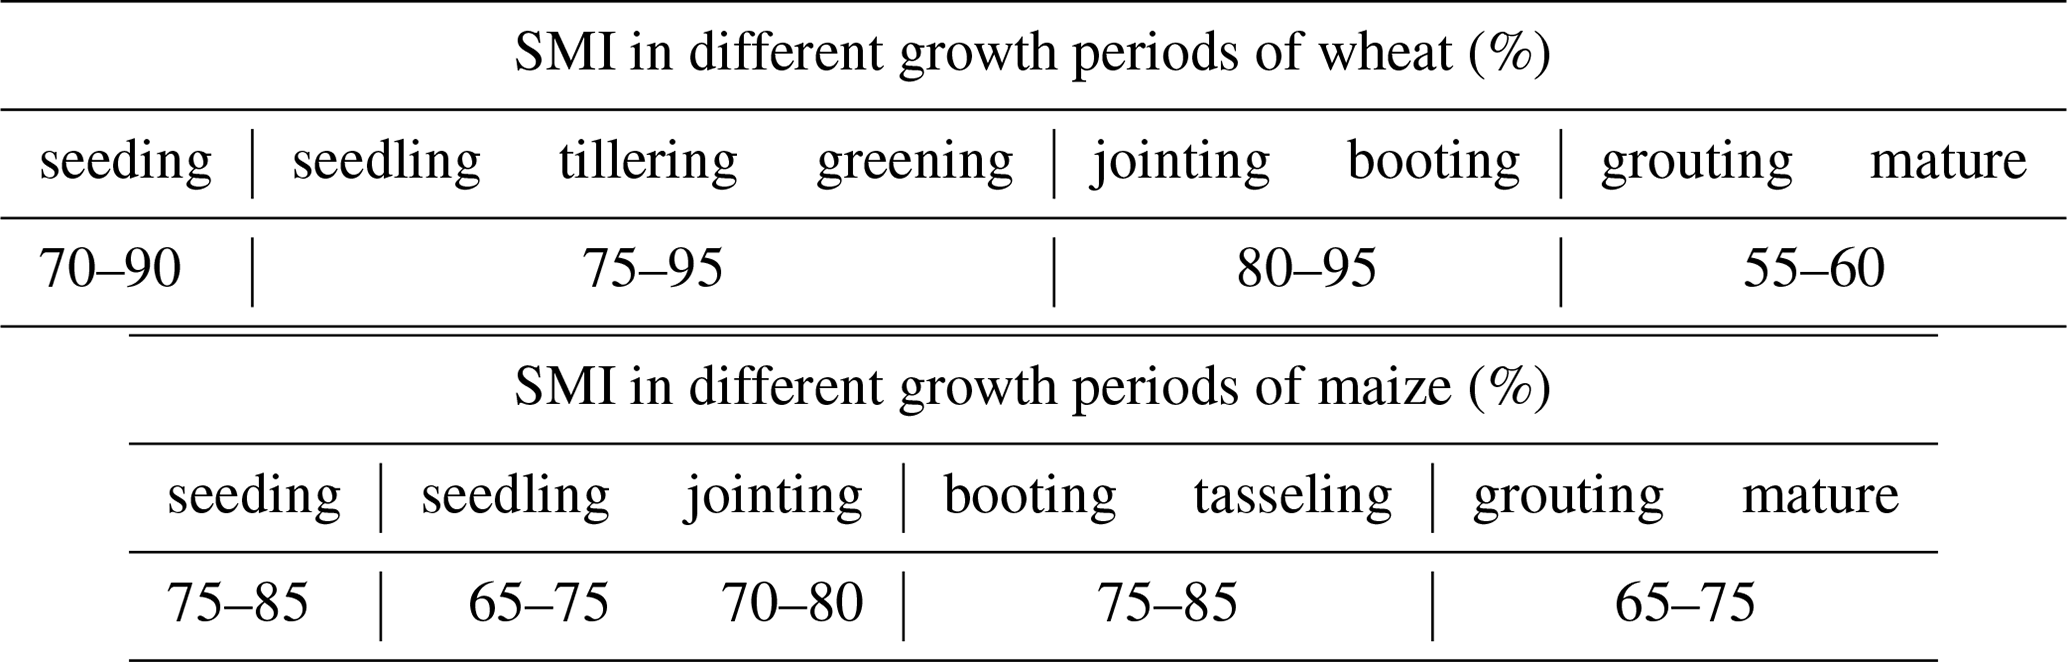
where Ci, Pj, Dk and SMIijk are crop type, phenology, soil depth and the evaluation index of relative soil moisture (SMI) corresponding to the crop type i, phenology j and soil depth k. SMI is a threshold to determine when irrigation is applied (Table 2), which was released by the Ministry of Water Resources of China (CNMWR) (http://www.mwr.gov.cn, last access: 10 July 2022) in July 2012.
Table 2Evaluation index of relative soil moisture (SMI) in different growth periods of crops at 0–10 and 10–20 cm depths.
SP includes sand, silt, gravel, organic carbon, clay contents, soil pH and bulk density, obtained from Harmonized World Soil Database Version 1.2 (http://webarchive.iiasa.ac.at/Research/LUC/External-World-soil-database/HTML/, last access: 18 August 2021). The original 30 arcsec raster spatial resolution data were resampled to a 1 km resolution based on nearest neighbor interpolation, and the site-related SPs were extracted from values to points using ArcGIS 10.5 software (ESRI).
RSD includes reference evapotranspiration (pet) and field capacity (fc): pet was obtained from TerraClimate (https://doi.org/10.7923/G43J3B0R, Abatzoglou et al., 2018), which included monthly climate and climatic water balance from 1958–present with a resolution of ∘ or ∼ 4 km, and fc was obtained from OpenLandMap (https://doi.org/10.5281/zenodo.2629589, Hengl and Gupta, 2019), which included fc under 33 kPa at 0 cm (b0) and 10 cm (b10) depths.
GI includes latitude (lat), longitude (lon), moisture index (im) (Thornthwaite, 1948) and river vector data, provided by the Data Centre for Resources and Environmental Sciences, Chinese Academy of Sciences (http://www.resdc.cn/Default.aspx, last access: 18 April 2021). The distance from each AMS to river networks at all levels (R4, R5, R12) in China was calculated using the Euclidean distance analysis method.
2.2.3 Public SM products for comparison
We used two existing SM products for comparison. (1) The ESA CCI SM data are a merged multisatellite surface SM product, which consists of active, passive or combined products. The SM retrievals were from four microwave radiometers (SMMR: Scanning Multichannel Microwave Radiometer; SSM/I: Special Sensor Microwave/Imager; TMI: Tropical Rainfall Measuring Mission's (TRMM) Microwave Imager; and AMSR-E: Advanced Microwave Scanning Radiometer for the Earth Observing System) and two scatterometers (AMI: Active Microwave Instrument; ASCAT: Advanced Scatterometer) in a 0.25∘ global daily dataset. The assimilated data rely on their respective sensitivity to vegetation density and use a Global Land Data Assimilation System (GLDAS) surface SM product (Rodell et al., 2004) as a climatological reference (Wagner et al., 2012). The active/passive products were the integration of the scatterometer- and radiometer-based SM retrievals, while the ESA CCI SM product is the fusion of both the active and passive products. We used the v05.2 product for comparison because of its advantages compared with active/passive products (Liu et al., 2012; Dorigo et al., 2017). (2) The RSSSM is an improved global long-term remote-sensing-based surface SM dataset covering 2003–2018 at a 0.1∘ resolution (https://doi.org/10.1594/PANGAEA.912597, Chen et al., 2021). Considering their compatibility, we chose 1995 to 2018 for comparison between ChinaCropSM1 km and ESA CCI SM and the 2003–2018 period for that of ChinaCropSM1 km and RSSSM.
2.3 Method
2.3.1 Variable selection and data treatment
For the site-related variables, we used the extract values to points tool to extract the 1 km resolution raster information of the environmental (i.e., SP, RSD and GI) data to AMS point data, to output point data attributes and to save it in CSV format to obtain a dataset of environmental factors through ArcGIS 10.5, and then we deleted those with high multicollinearity () according to the factor stacks (Figs. S3 and S4). Therefore, the 11 independent variables (pre, pre10, DOY, CIR, T_REF_BULK, R4, im, pet, lat, lon and fc) were selected because they characterize well the impacts of meteorology, time, irrigation, soil properties and geography on regional SM. We used the “Euclidean distance” option of the spatial analyst tools in ArcGIS10.5 to obtain the variables related to river networks in China (Danielsson, 1980). We also applied the kriging interpolation method to obtain precipitation-related variables (e.g., pre- and pre-10) from CNMSs. Thereafter, all gridded maps were processed in the WGS84 UTM zone 45N Geographic Coordinate System (EPSG: 332645) and resampled to the same spatial resolution (1 km).
2.3.2 Model development
Ensemble learning was used to aggregate a collection of algorithms to predict the potential impacts, which represents a better method than that using any algorithm alone (Brownlee, 2016). Random forest (RF) is a typical ensemble learning algorithm that can be used to build predictive models for both classification and regression purposes. RF fits an ensemble of models that first train a multitude of decision trees and then obtain predictions by an average or vote through all individual trees (Breiman, 2001). The algorithm introduces extra randomness when growing trees and searches for the best trees among a random subset of features. This technique results in greater tree diversity, generally yielding an overall better model (Hutengs and Vohland, 2016; Lagomarsino et al., 2017). In addition, the bagging method, which constructs multiple training subdatasets by resampling with the replacement of the original dataset, is employed to reduce the variance and overfitting (Díaz-Uriarte and Alvarez de Andrés, 2006; Zhang et al., 2018). Its high accuracy and stability in agricultural fields have been substantiated in several previous studies, especially for predicting grain yield, identifying crop planting areas and mapping soil properties (Hengl et al., 2015; Jeong et al., 2016; Sun et al., 2019).
Hyperparameters in an RF model are very important to optimize its performance. Such parameters are initially defaulted, and we need to investigate their appropriateness or find potentially better values during the development of an RF regression (RFR). The important hyperparameters include the following:
-
n_estimators: the number of trees that the algorithm builds before taking the maximum voting or average overpredictions (a high number of trees increases the performance and makes the predictions more stable but demands more computations);
-
max_features: the maximum number of features that the random forest considers on a per-split level (the condition is based on variance for regression);
-
min_samples_leaf: the minimum number of leaves that are required to split an internal node;
-
max_samples: ratio of samples needed for training each tree.
We applied the 10-fold cross-validation method to tune the four hyperparameters to avoid overfitting the RF models (Fig. S5). Additionally, we used this 10-fold cross-validation to evaluate model performance (Fig. S7).
The detailed irrigation module is shown in Fig. S2. Given that SM is highly sensitive to irrigation application for dryland wheat and maize in China, we first used RF classification (RFC) to build an irrigation module. This module aimed to predict whether irrigation application occurred there and assigns response variable “1” for irrigation and “0” for without irrigation according to the response variables and predictor variables (the same environmental indicators used in producing ChinaCropSM1 km).
The response variable (classified irrigation CIR) was calculated by the irrigation threshold (Table 2) and in situ information, including crop type, phenology and soil depth. Then, we used the forecasted CIR as an additional predictor, integrating with other key predictor variables, to drive RFR for forecasting SM. Considering the regional differences in SM, we randomly sampled in situ SM observations (90 % for training and 10 % for testing) in each agricultural zone to develop the RF model. In total, 98 576 (65 626) and 10 820 (6845) observations were used for training and testing the model for wheat (maize), respectively. All these point samples were used to develop the pointed SM model, and then these pointed models are applied to inversely calculate the gridded SM by inputting 1 km raster environmental variables (Fig. 2).
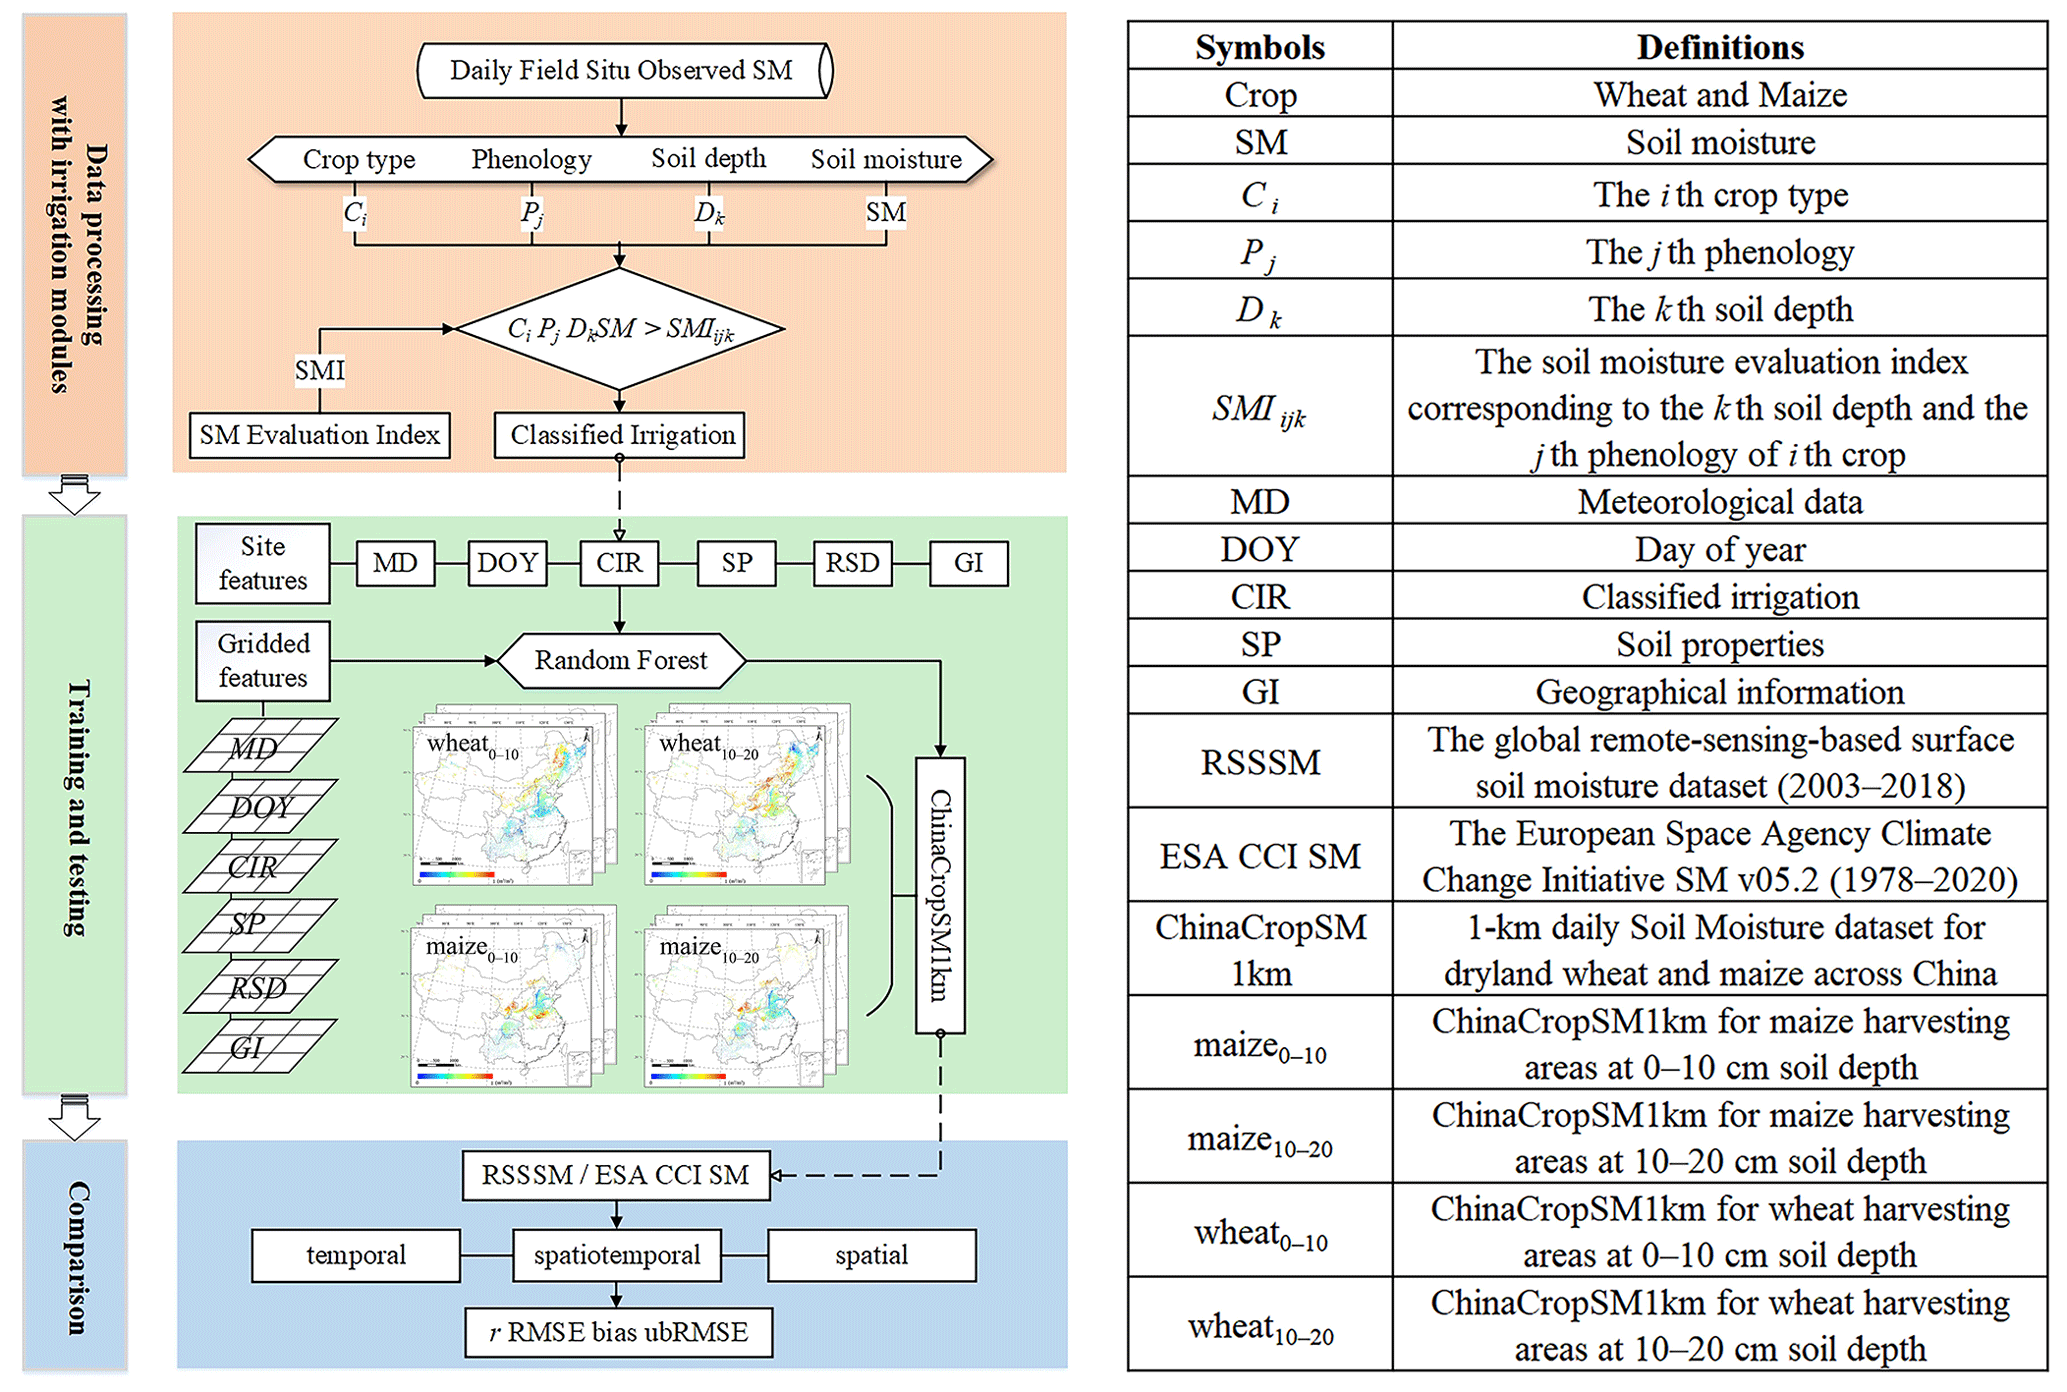
Figure 2Flow chart for producing ChinaCropSM1 km with an irrigation module.
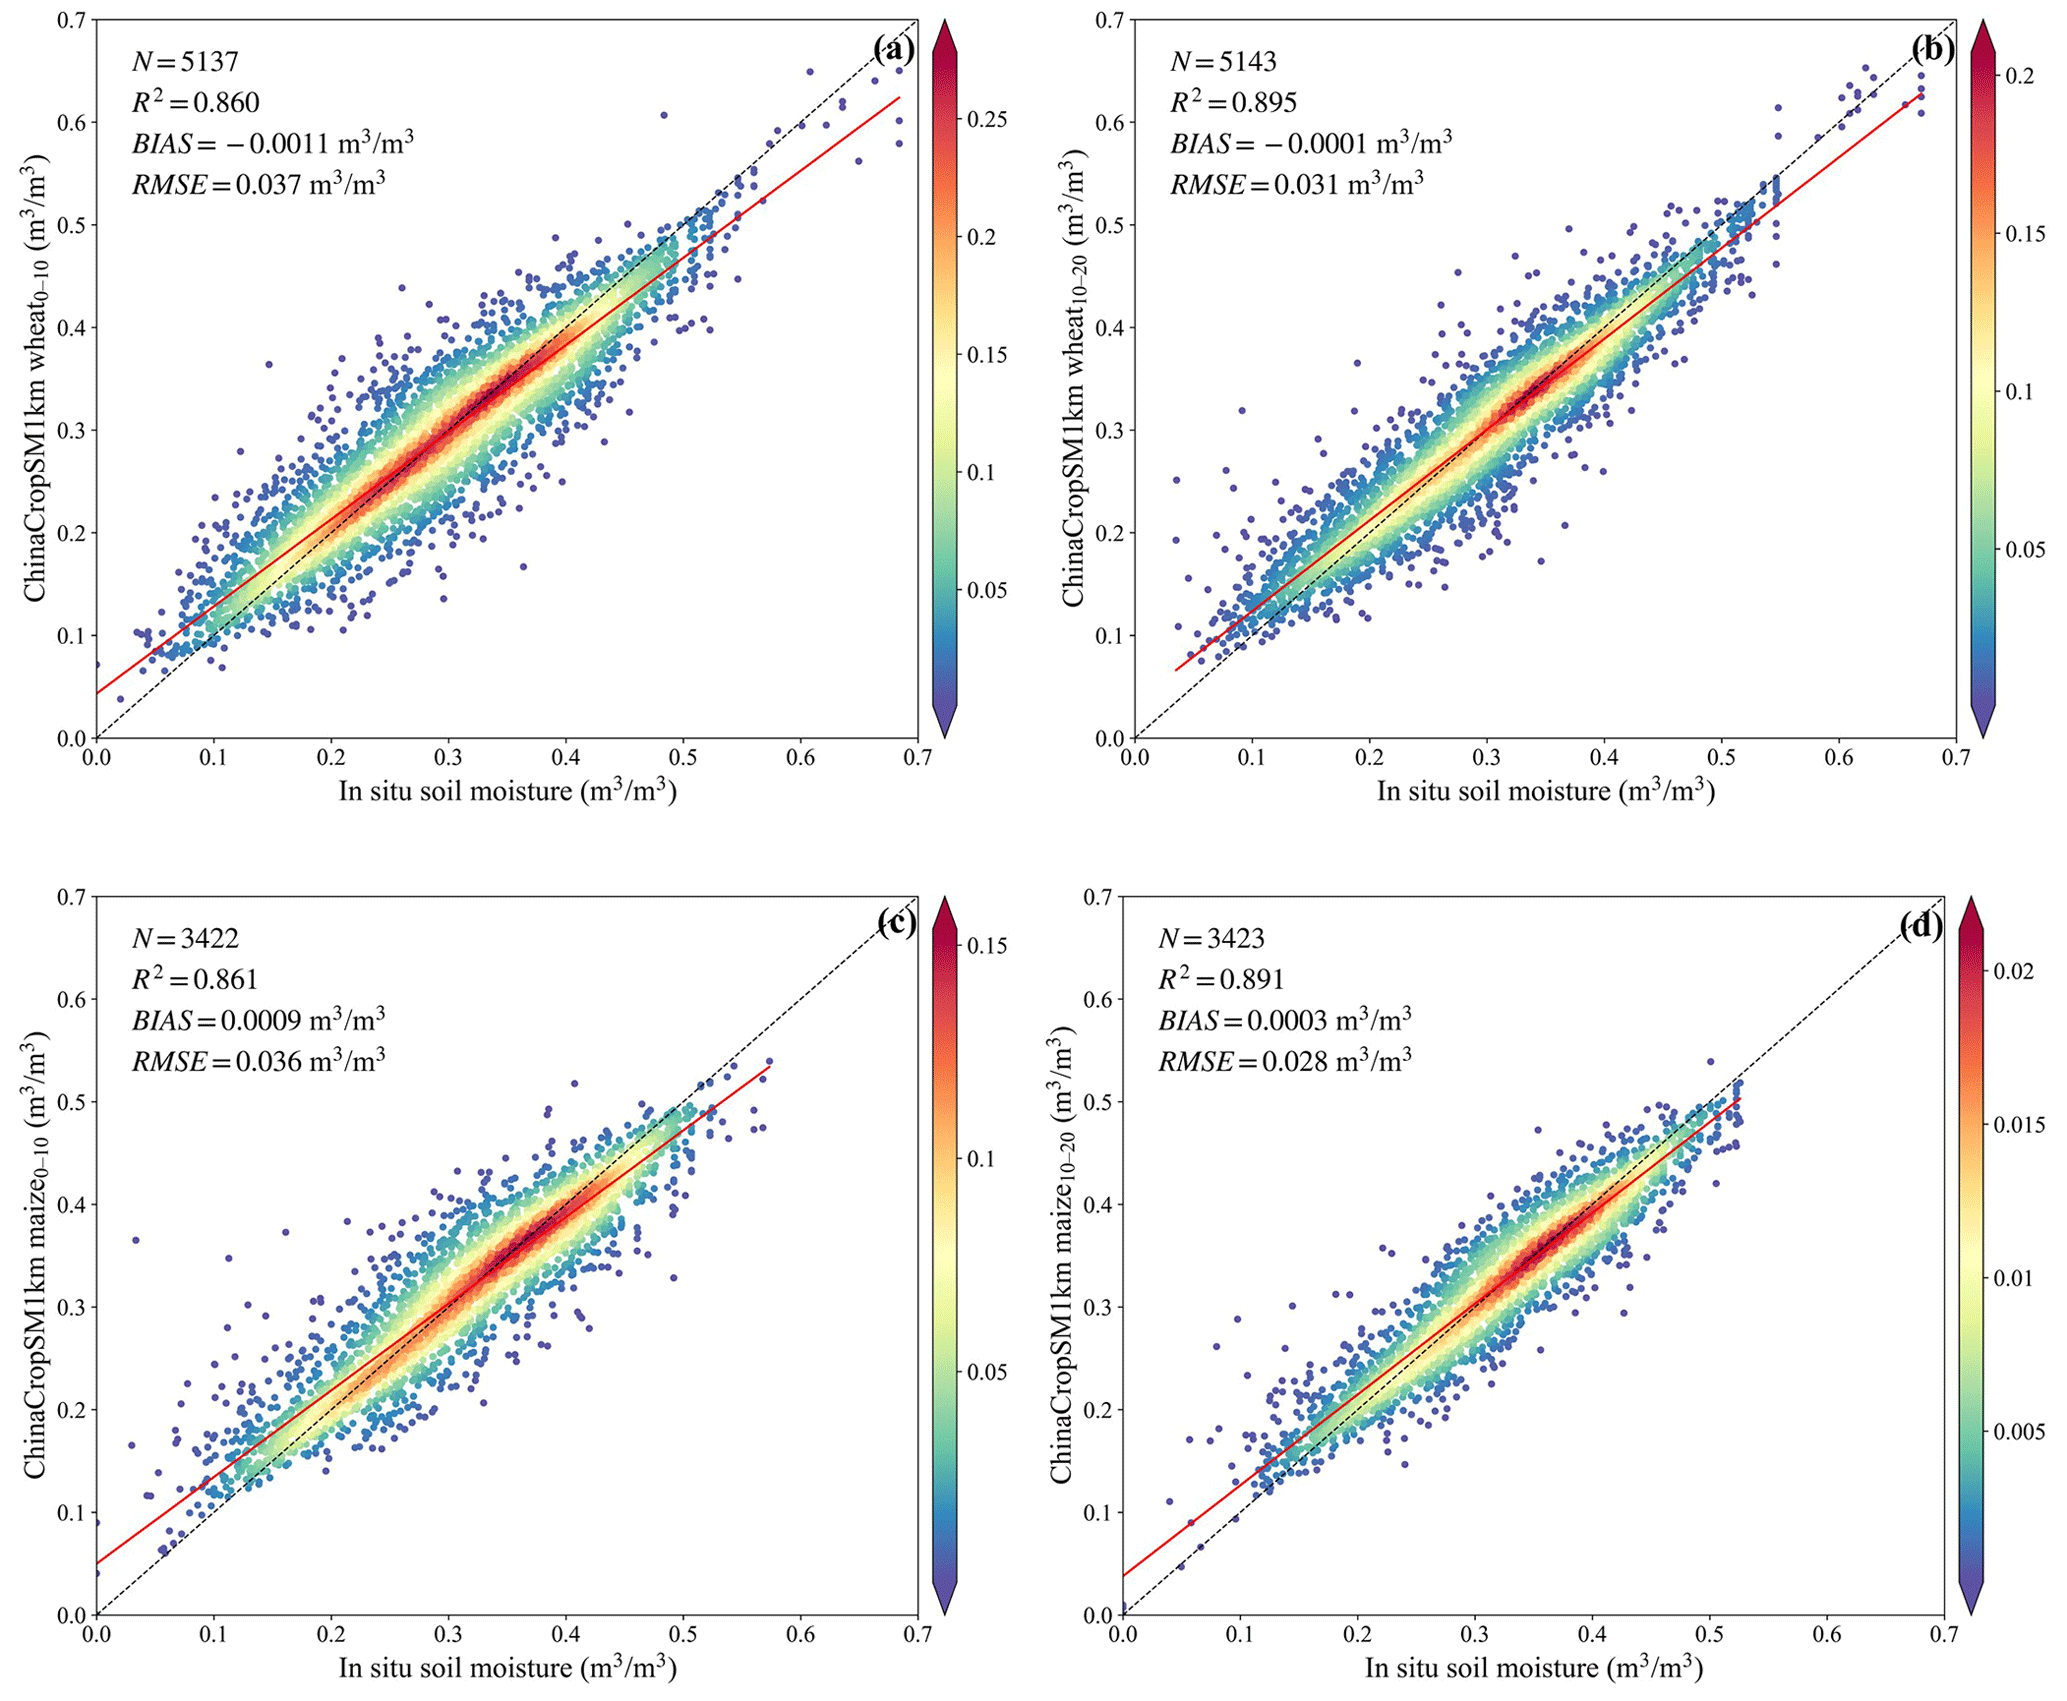
Figure 3Comparison between the predicted soil moisture (ChinaCropSM1 km) and in situ samples by crops and depths (cm). (a) wheat0–10, (b) wheat10–20, (c) maize0–10 and (d) maize10–20. The red lines are the trend lines, the color bar indicates the point density, and the black lines represent the 1:1 lines.
The hyperparameters in the optimal model were determined as 50, 1, 1 and 4 for the respective n_estimators, max_samples, min_samples_leaf and max_features according to the highest accuracy during training (Fig. S5). We implemented these processes in MATLAB 9.8.0 (R2020a). More information can be found in the MATLAB help center (https://www.mathworks.com/help/stats/regressionlearner-app.html, last access: 26 May 2022).
The feature importance was evaluated for the RF model with the greatest regression accuracy by ordering the out-of-bag predictor observations using the MATLAB “oobPermutedPredictorImportance” function (https://www.mathworks.com/help/, last access: 26 May 2022). We also used the method to measure the importance of each predictor variable when predicting ChinaCropSM1 km.
2.3.3 Evaluation metrics for validation and comparison
The in situ observations provide the most accurate SM, and all performance measures were calculated using the testing dataset for evaluation purposes. All SM products were evaluated against the in situ observations (testing dataset) according to five metrics: root mean square error (RMSE; m3 m−3), bias (m3 m−3), unbiased RMSE (ubRMSE; m3 m−3), explained variance (R2) and the correlation coefficient (r), which are defined in Eqs. (2)–(6) as follows:
where the overbar indicates the mean, Pi is the ith prediction SM from products, Oi is the ith in situ observation SM, N is the total number of observations, and σO and σP are the standard deviations of the in situ observed and predicted SM, respectively. In addition, we compared our four subsets of data with RSSSM and ESA CCI SM separately by evaluating their spatial and temporal accuracies related to in situ surface SM observations (Tables S1 and S2).
We evaluated our irrigation factor forecasting model results using the receiver operating characteristic (ROC) curve and the area under the curve (AUC) (Table S4) (Fawcett, 2006). Additionally, we calculated user's accuracy (UA) (Eq. 7), producer's accuracy (PA) (Eq. 8) and overall accuracy (Eq. 9) based on confusion matrices (Table S3) containing the percentages of the four possible outcomes of a model: true positive (TP), true negative (TN), false-positive (FP) and false negative (FN) (Fawcett, 2006).
3.1 Validation of ChinaCropSM1 km products
The scatterplots between the predicted SM and those observations are displayed by soil layers and crops (Fig. 3). We found that the SM predicted by the RF model agreed well with the in situ SM observations, with an ubRMSE of 0.028–0.037, bias of −0.0011–0.0009 and r from 0.925–0.944. Additionally, the mean bias in predicting SM for wheat was negative (Fig. 3a, b), while those for maize were positive (Fig. 3c, d). These findings suggest that maize SM was overestimated, while that for wheat was underestimated. The absolute values of mean bias and RMSE in predicting SM at topsoil depth (0–10 cm) for both crops were relatively larger (e.g., 0–10 cm; RMSE 0.036>0.028) than that for a soil depth of 10–20 cm. This result indicates that the RF model performed better in predicting the SM content in the 10–20 cm layer than in the 0–10 cm layer, which was consistent with previous studies (O and Orth, 2020).
3.2 The improvement of ChinaCropSM1 km products with an irrigation module
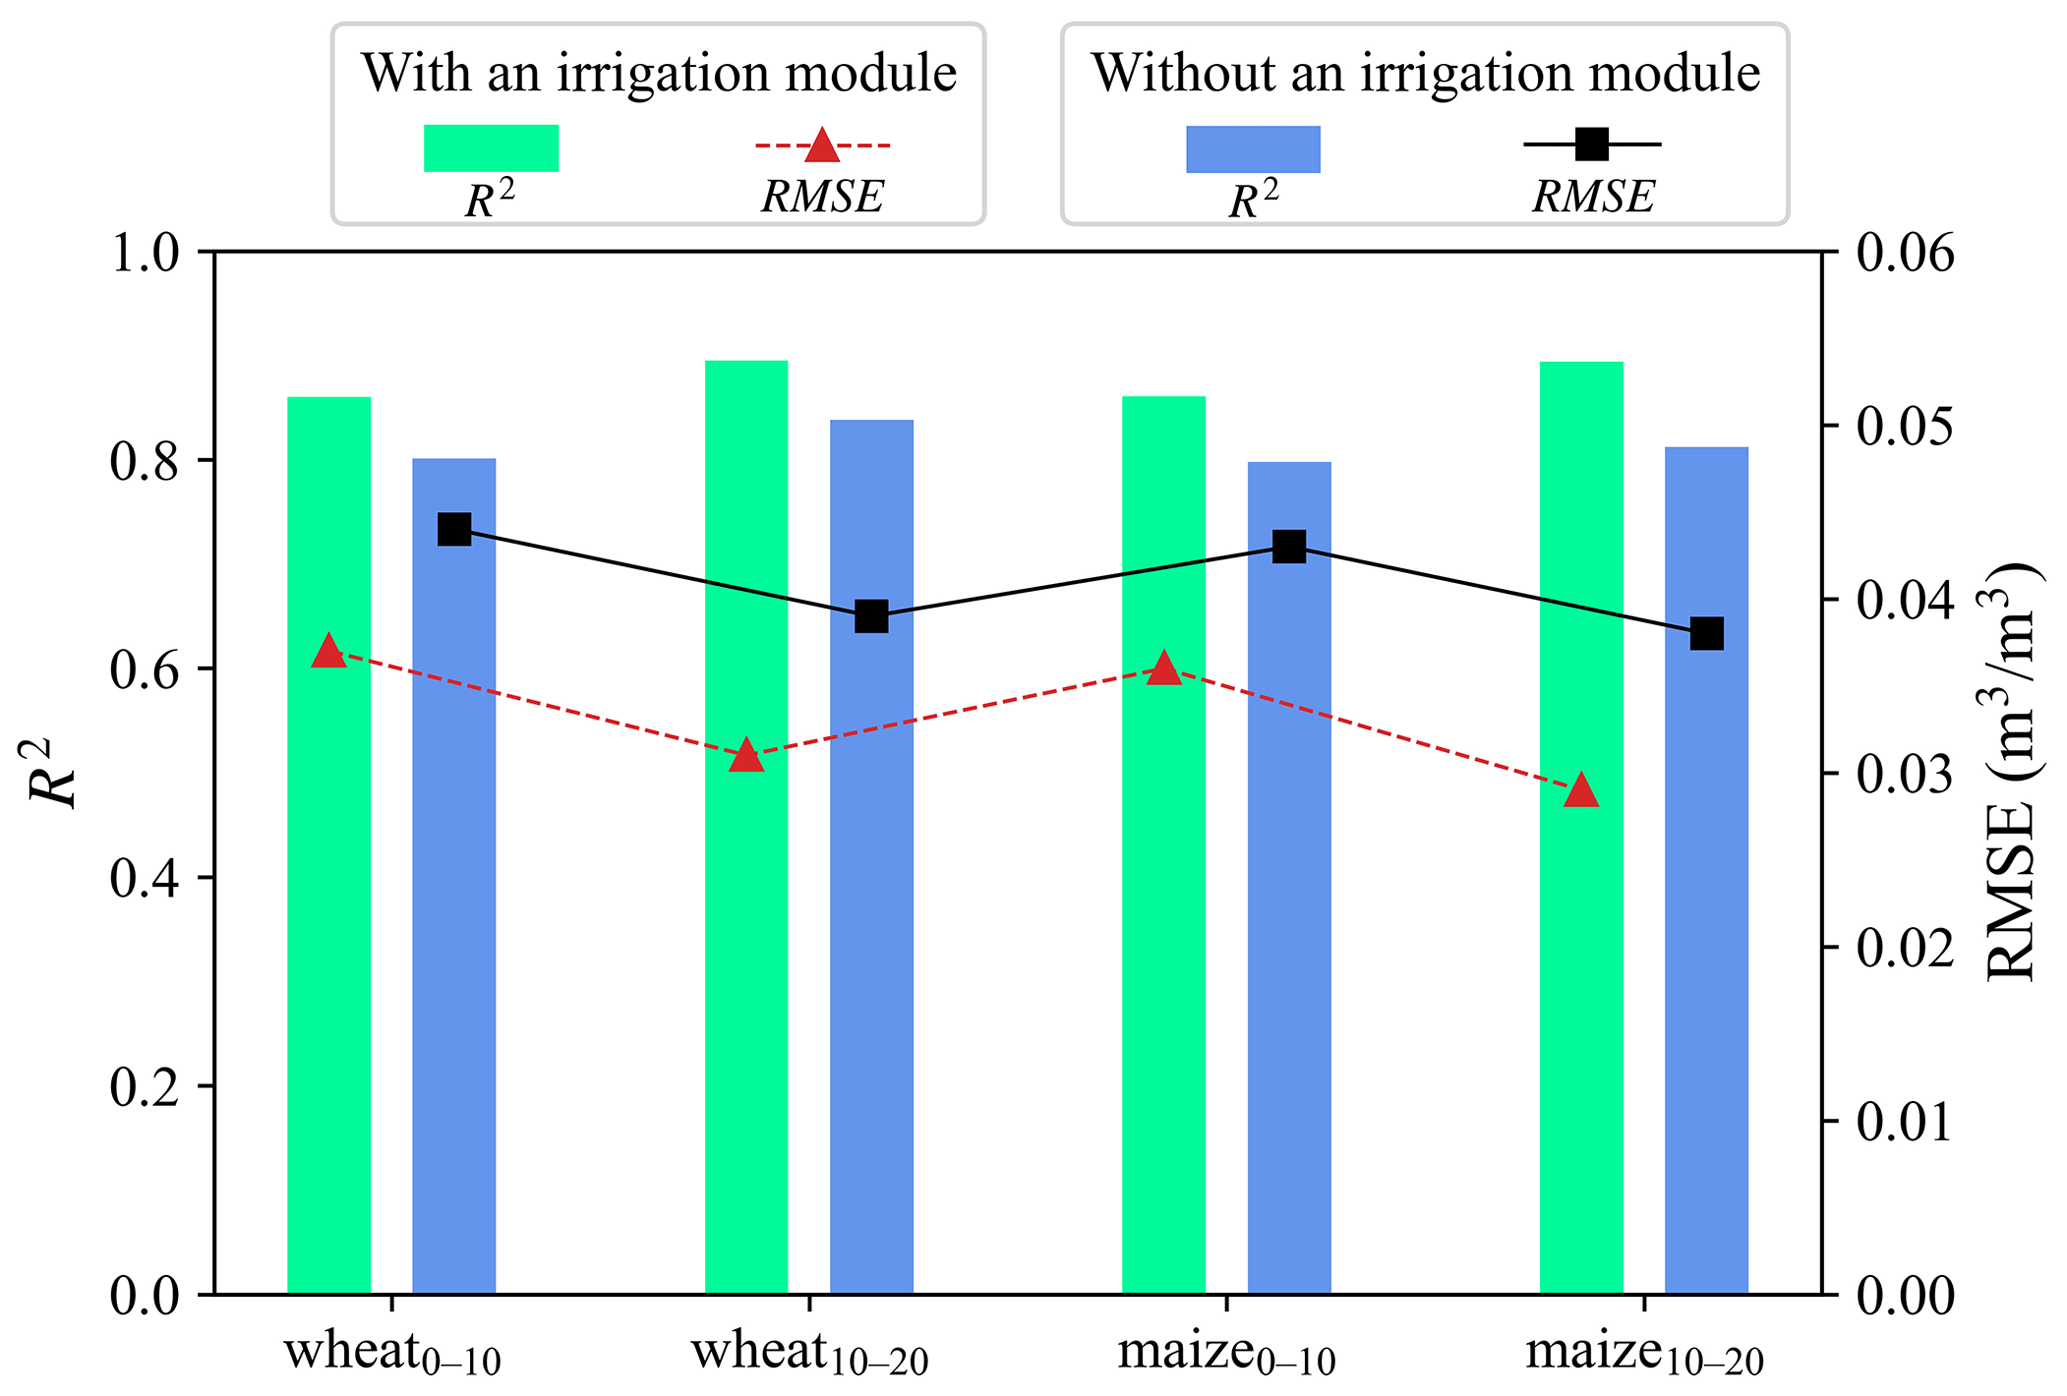
Interestingly, all prediction accuracies of SM were consistently improved for both crops and depths (Fig. 4) compared with those without an irrigation module (Table S5). Specifically, R2 values increased by 6.8 %–9.7 %, and RMSE values decreased by 16 %–23 % (Table S5). Among these, R2 values for maize SM were slightly improved compared with those of wheat, and RMSE for maize decreased more than that of wheat. This finding further suggests that the irrigation water requirements of maize are higher than those of wheat, which is consistent with the fact that summer maize requires large amounts of water to produce high yields. (Karrou et al., 2012).
3.3 The significant scores of different factors for simulating SM
It is critical to select which independent variables are involved in a model, neither too many nor too few, while simultaneously avoiding multicollinearity among them. We have deleted 7 variables due to their high correlations (), leaving the 11 variables selected (Figs. S3 and S4). Surprisingly, the top scorer was irrigation factor (CIR), followed by pre10 (ante-accumulated precipitation over 10 d) and fc (field capacity) (Fig. 5). Current daily precipitation shows significantly different importance on SM planted by wheat and maize, with a similarity for DOY. However, all other factors show less importance in SM simulations. Compared with the significant roles of precipitation-related variables (e.g., pre10, pre) on SM in most rainfall-fed areas, irrigation shows overwhelming impacts on dryland soil moisture across China (Qiu et al., 2016b). Such results highlight that monitoring management activities more accurately, including irrigation times, areas and quantities, will further improve irrigation modules, consequently improving SM simulations (Wu et al., 2020; Zhang et al., 2015, 2022).

3.4 The temporal and spatial patterns between ChinaCropSM1 km and the in situ SM observations
The SM values in ChinaCropSM1 km were significantly correlated with the in situ SM observations, with a mean r of 0.92, 0.94, 0.93 and 0.94 for wheat0–10, wheat10–20, maize0–10 and maize10–20, respectively, during the whole growing period (Fig. 6). The spatial coefficients for wheat at 10–20 cm were generally higher than the surface SM (0.94 vs. 0.92), and the two soil depths of SM in April and September were significantly higher (Fig. 6a, b). We attributed the high spatial correlations of surface SM to irrigation impacts because April and September are planting times for both spring and winter wheat. The better relationships further substantiated that the irrigation module developed in our SM model improves the simulation accuracy for surface SM. Consistently, the spatial coefficients for maize at the 10–20 cm depth were higher than those for the 0–10 cm depth (0.94 vs. 0.93) (Fig. 7c, d). At the sowing (April), heading (July) and milking (August) stages, maize usually demands a large water supply. The spatial coefficient for maize SM at both soil depths from May to August was lower than the mean value potentially due to the lack of irrigation applications (Yin et al., 2016) (Fig. 6).
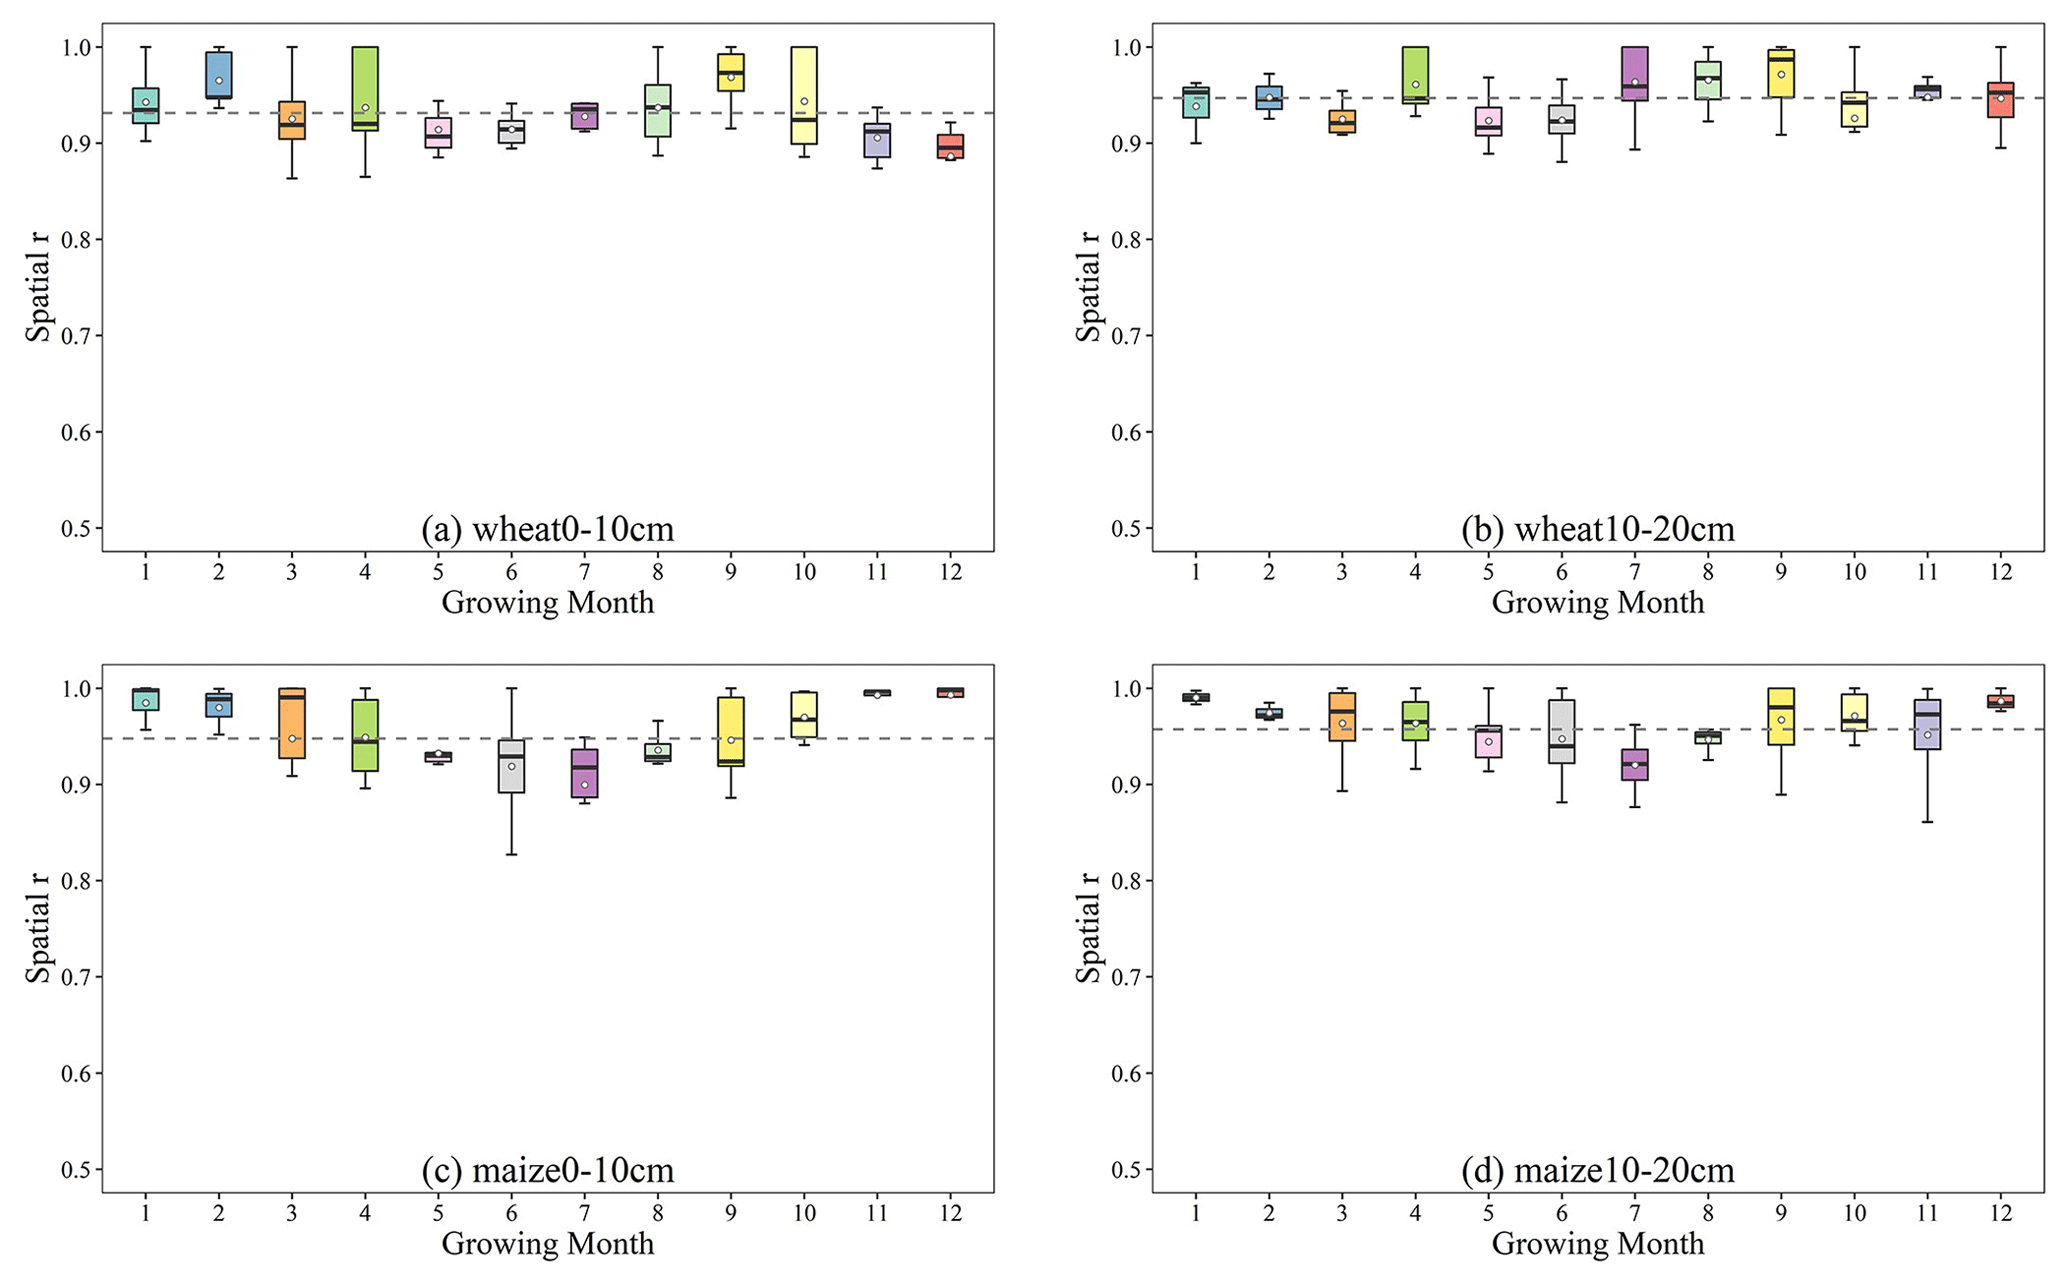
Figure 6Comparison of the spatial accuracy (r) between ChinaCropSM1 km and in situ SM observations in each month by crops and depths. (a) wheat0–10, (b) wheat10–20, (c) maize0–10 and (d) maize10–20. The dashed lines represent the mean values.
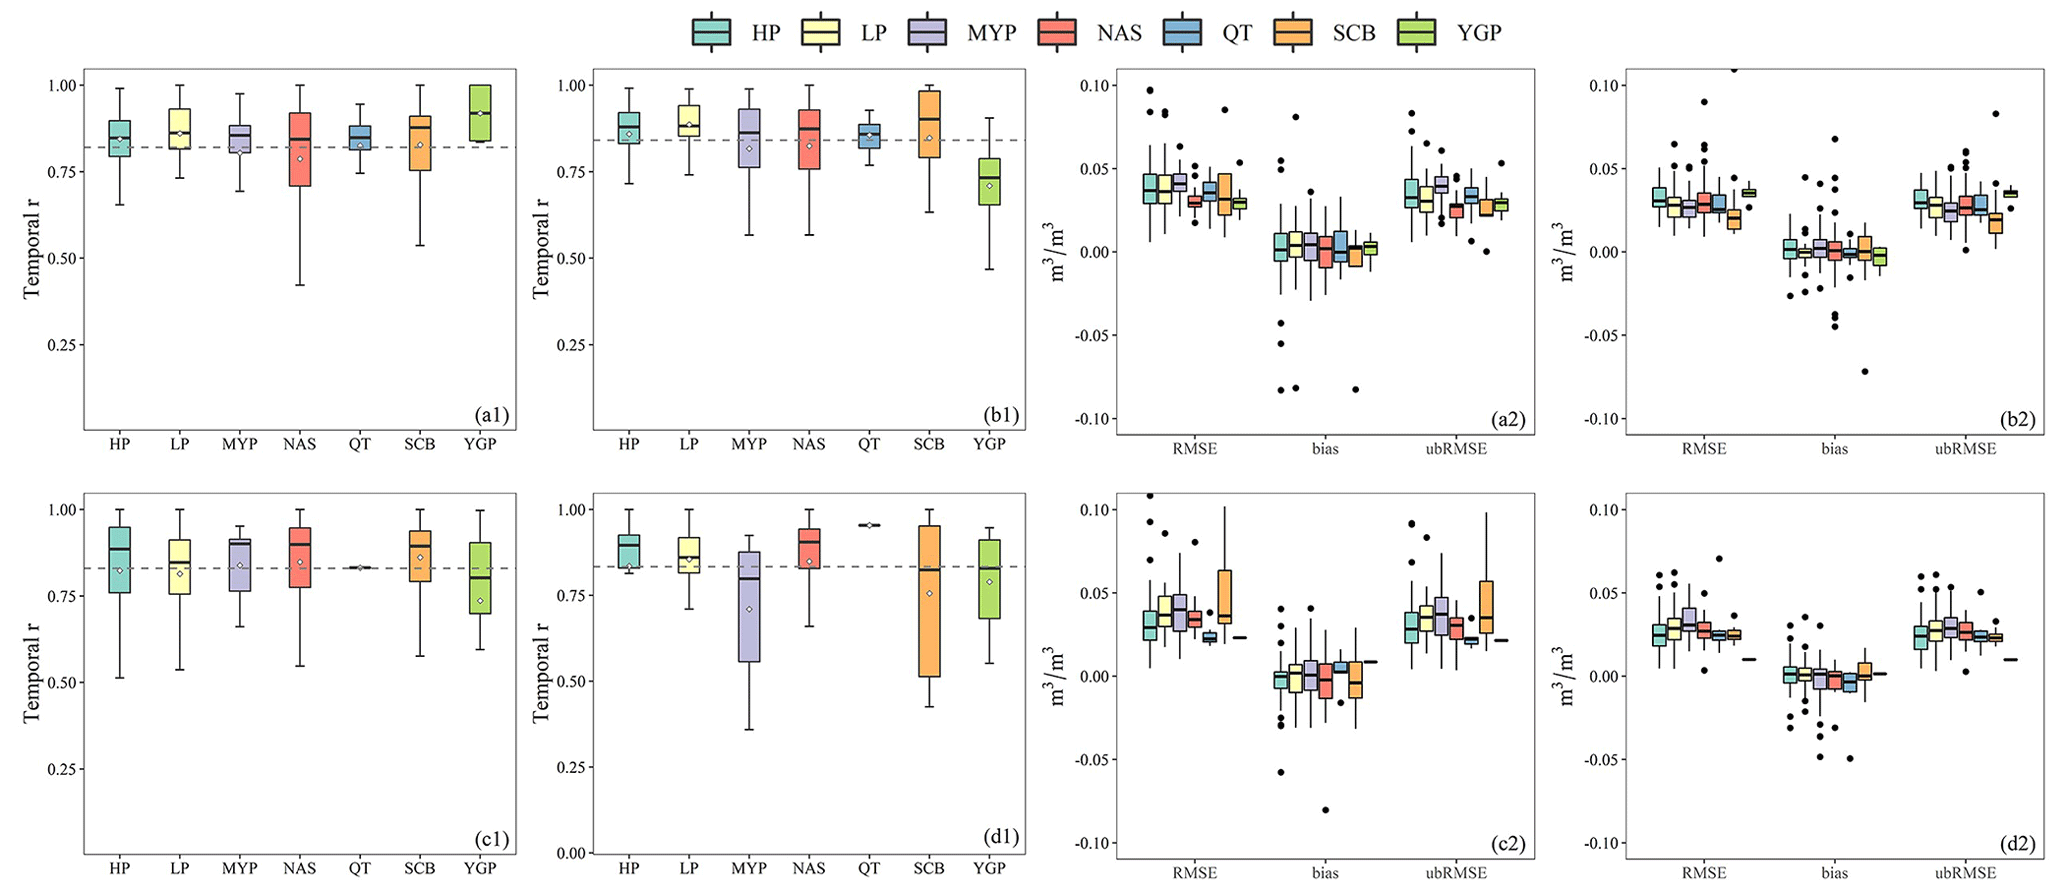
Figure 7Comparison of the temporal accuracy (r, RMSE, bias, ubRMSE) between ChinaCropSM1 km and in situ soil moisture observations by crops and depths. (a1, a2) wheat0–10, (b1, b2) wheat10–20, (c1, c2) maize0–10 and (d1, d2) maize10–20. The dashed lines represent the mean values.
We further analyzed the temporal pattern of SM accuracy in different regions (Fig. 7). The median r values for the Huang–Huai–Hai Plain and the northern arid and semiarid regions were higher than those in other agricultural regions because of the larger training samples. Our findings further substantiated that a larger training sample size will cause a higher temporal accuracy, indicated by a higher r and a lower RMSE (Fig. S6). However, the poor performance in the Yunnan–Guizhou Plateau might be caused by smaller training samples (Fig. S6).
3.5 Comparisons between ChinaCropSM1 km and public global SM products
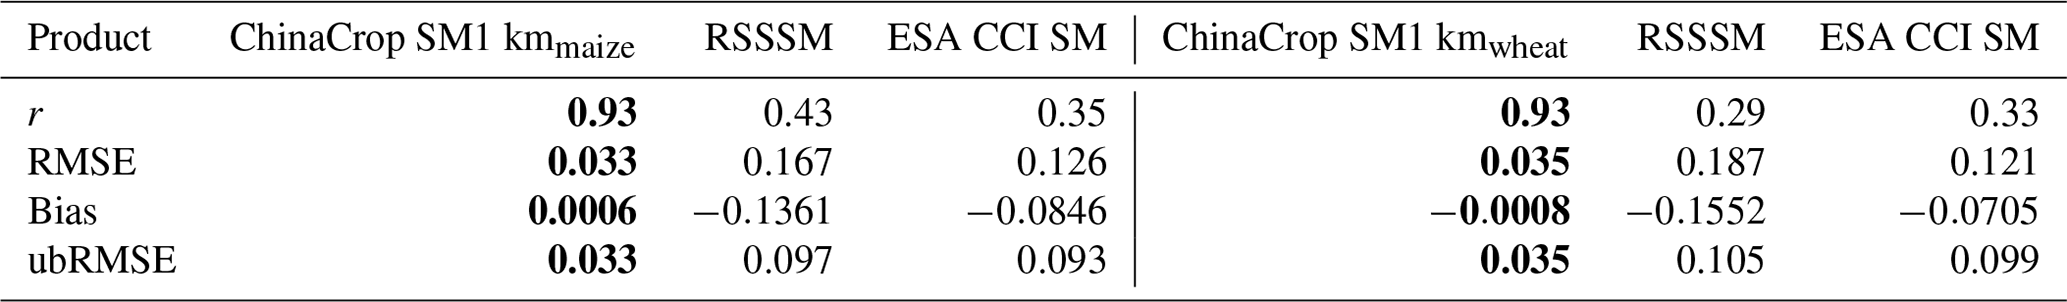
We further compared our ChinaCropSM1 km with the two popular products through evaluating their spatiotemporal accuracy related to in situ surface SM observations. We summarized their evaluation indices by each individual product in Table 3, which consistently indicated in bold our ChinaCropSM1 km means (all r>0.90, RMSE <0.04), while RSSSM and ESA CCI SM were shown by r<0.50 and RMSE >0.1.
Table 3Summary of means of evaluation indices (r, bias, RMSE and ubRMSE) of three products (ChinaCropSM1 km, RSSSM and ESA CCI SM), with better performance highlighted in bold. All products were compared with in situ surface observations (0–10 cm).
To match the different spatial resolutions of the three products, we calculated the averages of all in situ observations in the same pixel (e.g., 1 km, 27 km or 0.1∘) to make their spatiotemporal accuracies comparable. Interestingly, all indices of our products were consistently indicated by the higher accuracy (e.g., r 0.94, bias 0.005, RMSE 0.034, ubRMSE 0.034) (Fig. 9). The RSSSM dataset significantly underestimated SM with an averaged bias of −0.114, accompanied by a higher RMSE of 0.150. ESA CCI SM performed better than RSSSM (e.g., RMSE 0.11 vs. 0.15) derived from Soil Moisture Active Passive (SMAP) (Entekhabi et al., 2010), and we ascribed such improvement partly to some corrections based on in situ observations for ESA CCI SM (Dorigo et al., 2017). Such results highlight that SM products derived solely from remote sensing satellites should be corrected with ground observations. Additionally, neither RSSSM nor ESA CCI SM considered irrigation activities; thus, their spatial correlations with ground observations are incomparable to those of our products (r 0.944 vs. 0.381 and 0.256) (Fig. 8). Our study strongly substantiates that an irrigation module should be taken into account when developing SM simulation models for producing SM products.

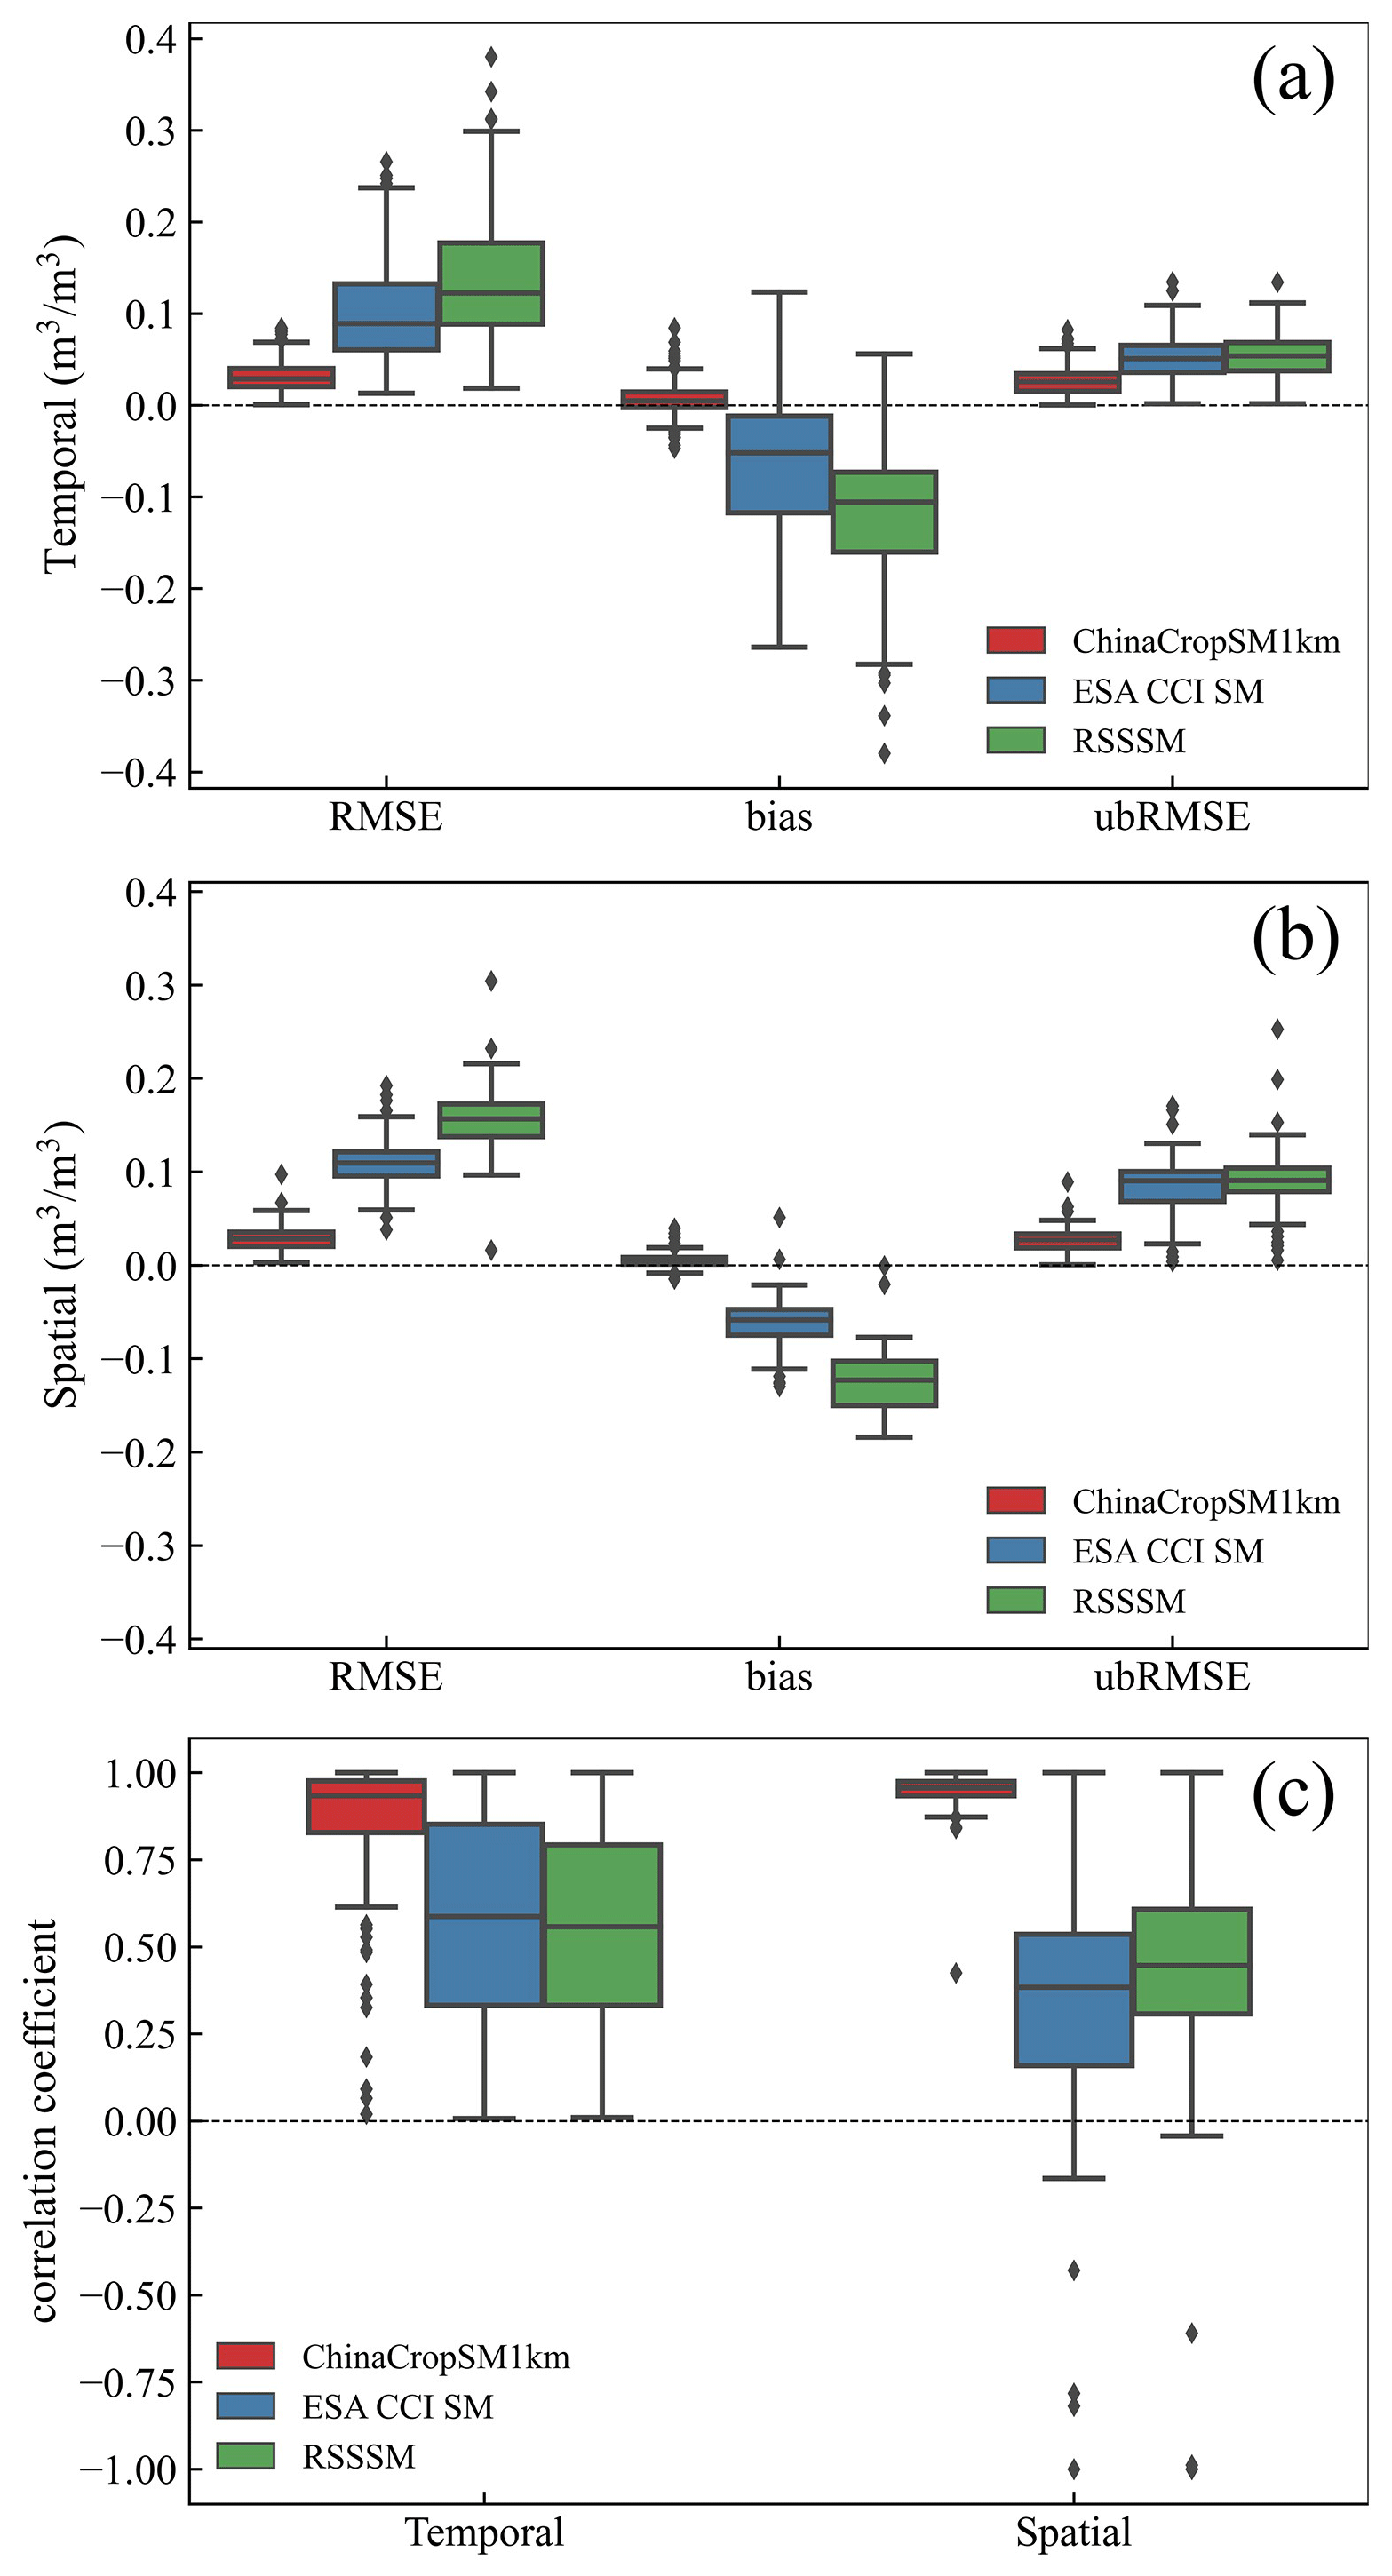
Figure 9Boxplot of the temporal (a, c) and spatial (b, c) accuracies for ChinaCropSM1 km, RSSSM and ESA CCI SM by r, bias, RMSE and ubRMSE. These evaluation indices were calculated by comparing the three products with in situ SM observations; the comparison period for ChinaCropSM1 km and RSSSM is from 2003 to 2018, and for ChinaCropSM1 km and ESA CCI SM it is 1995–2018.
The 1 km gridded daily soil moisture datasets for the main dryland crops (i.e., wheat and maize) in China from 1993 to 2018 (ChinaCropSM1 km) are publicly available at https://doi.org/10.5281/zenodo.6834530 (wheat0–10) (Cheng et al., 2022a), https://doi.org/10.5281/zenodo.6822591 (wheat10–20) (Cheng et al., 2022b), https://doi.org/10.5281/zenodo.6822581 (maize0–10) (Cheng et al., 2022c) and https://doi.org/10.5281/zenodo.6820166 (maize10–20) (Cheng et al., 2022d).
We developed a daily 1 km soil moisture dataset based on numerous field observations (181 327 samples) from 1993–2018, which significantly enriches the current SM datasets available. ChinaCropSM1 km shows higher spatial and temporal resolution and accuracy than the popular global SM products. Additionally, to date, few studies have provided a daily SM product with such a higher resolution, combining different soil depths and an irrigation module. ChinaCropSM1 km is the first SM product with a higher spatial resolution (∼ 1 km) at depths of 0–10 and 10–20 cm in croplands in China by compiling ground observations and using the RF method.
Our ChinaCropSM1 km predicted by the RF model agreed well with in situ SM observations (ubRMSE ranges from 0.028–0.037, bias ranges from −0.0011–0.0009, r ranges from 0.925–0.944, and R2 ranges from 0.860–0.895). An irrigation module was first developed according to crop type (i.e., wheat, maize), soil depth (0–10 cm, 10–20 cm) and phenology. All prediction accuracies of SM were consistently improved (R2 values increased by 6.8∼ 9.7 %, RMSE decreased by 16∼ 23 %) for both crops and depths. Additionally, ChinaCropSM1 km generally has advantages over other popular gridded SM products (RSSSM and ESA CCI SM) through evaluating their spatiotemporal accuracy related to in situ SM as the benchmark. Our ChinaCropSM1 km has relatively higher accuracy (all r>0.90, RMSE <0.04), while RSSSM and ESA CCI SM showed r<0.50 and RMSE >0.1.
The ChinaCropSM1 km dataset is credible and accurate according to the results compared with the public datasets; however, some limitations still exist in our study. First, the limited AMS irrigation records may lead to uncertainty in the irrigation factor predictions. More detailed irrigation information will help to improve irrigation module performance. Second, our method for generating cropland SM is applicable to other regions and crops, but more environmental variables will be increasingly required considering that SM variabilities are complex processes controlled by many factors (Famiglietti et al., 2008; Qin et al., 2013; Guevara and Vargas, 2019), especially for irrigation activities. For example, to more accurately characterize irrigation activities, many field samples are required at both spatial and temporal resolutions. Other auxiliary data on information on crop growth, classification and management (e.g., irrigation frequency, amount and method) will benefit the development of our irrigation module and the accurate derivation of SM datasets. Third, to provide the most extensive SM data as possible, a constant layer integrated with all pixels planting wheat/maize during 2000–2015 (http://dx.doi.org/10.17632/jbs44b2hrk.2, Luo et al., 2020b) was applied to generate our ChinaCropSM1 km. Such merged areas could lead to uncertainties in their spatial distributions because annual wheat/maize planting areas are dynamic over time. To avoid the uncertainties, potential users should mask our products with explicitly annual wheat/maize planting maps to obtain accurate SM data including spatial dynamic information. Fourth, different splitting methods during training and testing affect model performance. Selecting a splitting method to improve the generalization performance is dependent on the data. Generally, the larger the size of the data, the smaller the effect of the splitting methods on the results (Birba, 2020). Additionally, advanced algorithms will be potential alternatives for random forest due to their strong dependence on inputs (Breiman, 2001; Rasmussen, 2004). Improving irrigation modules should focus on details such as irrigation amount and frequency, which will significantly help to verify and improve the accuracy of both irrigation and SM predictions. We anticipate that a more accurate SM dataset will be produced by applying the approach to other crops and areas in the future with all the above improvements.
The supplement related to this article is available online at: https://doi.org/10.5194/essd-15-395-2023-supplement.
FC, HZ, ZZ, JH, JC, YL, LZ, JZ, FT and JX contributed to the design of this research. FC and ZZ collectively prepared the manuscript with contributions from all coauthors. JH, JC, YL, LZ, JZ, JX and FT revised the manuscript. FC and HZ developed the model code.
The contact author has declared that none of the authors has any competing interests.
Publisher’s note: Copernicus Publications remains neutral with regard to jurisdictional claims in published maps and institutional affiliations.
We thank the editor and the three anonymous referees for their valuable comments.
This research has been supported by the National Key Research and Development Program of China (grant no. 2020YFA0608201) and the National Natural Science Foundation of China (grant no. 41977405).
This paper was edited by Hao Shi and reviewed by three anonymous referees.
Abatzoglou, J. T., Dobrowski, S. Z., Parks, S. A., and Hegewisch, K. C.: TerraClimate, a high-resolution global dataset of monthly climate and climatic water balance from 1958–2015, Sci. Data, 5, 170191, https://doi.org/10.1038/sdata.2017.191, 2018.
Ahmad, S., Kalra, A., and Stephen, H.: Estimating soil moisture using remote sensing data: A machine learning approach, Adv. Water Resour., 33, 69–80, https://doi.org/10.1016/j.advwatres.2009.10.008, 2010.
Ahmed, A. A. M., Deo, R. C., Raj, N., Ghahramani, A., Feng, Q., Yin, Z., and Yang, L.: Deep Learning Forecasts of Soil Moisture: Convolutional Neural Network and Gated Recurrent Unit Models Coupled with Satellite-Derived MODIS, Observations and Synoptic-Scale Climate Index Data, Remote Sensing, 13, 554, https://doi.org/10.3390/rs13040554, 2021.
Albergel, C., Dorigo, W., Reichle, R. H., Balsamo, G., de Rosnay, P., Muñoz-Sabater, J., Isaksen, L., de Jeu, R., and Wagner, W.: Skill and Global Trend Analysis of Soil Moisture from Reanalyses and Microwave Remote Sensing, J. Hydrometeorol., 14, 1259–1277, https://doi.org/10.1175/JHM-D-12-0161.1, 2013.
Amazirh, A., Merlin, O., Er-Raki, S., Gao, Q., Rivalland, V., Malbeteau, Y., Khabba, S., and Escorihuela, M. J.: Retrieving surface soil moisture at high spatio-temporal resolution from a synergy between Sentinel-1 radar and Landsat thermal data: A study case over bare soil, Remote Sens. Environ., 211, 321–337, https://doi.org/10.1016/j.rse.2018.04.013, 2018.
Birba, D. E.: A Comparative study of data splitting algorithms for machine learning model selection, Dissertation, KTH Royal Institute of Technology, Stockholm, Sweden, 1–19, 2020.
Bogena, H. R., Huisman, J. A., Oberdörster, C., and Vereecken, H.: Evaluation of a low-cost soil water content sensor for wireless network applications, J. Hydrol., 344, 32–42, https://doi.org/10.1016/j.jhydrol.2007.06.032, 2007.
Breiman, L.: Random forests, Machine Learning, 45, 5–32, 2001.
Brownlee, J.: Machine learning mastery with python, Mach. Learn. Mastery Pty Ltd., 527, 100–120, 2016.
Chakrabarti, S., Bongiovanni, T., Judge, J., Zotarelli, L., and Bayer, C.: Assimilation of SMOS Soil Moisture for Quantifying Drought Impacts on Crop Yield in Agricultural Regions, IEEE J. Sel. Top. Appl. Earth Observations Remote Sensing, 7, 3867–3879, https://doi.org/10.1109/JSTARS.2014.2315999, 2014.
Chen, L. and Dirmeyer, P. A.: Global observed and modelled impacts of irrigation on surface temperature, Int. J. Climatol., 39, 2587–2600, https://doi.org/10.1002/joc.5973, 2019.
Chen, Y., Feng, X., and Fu, B.: An improved global remote-sensing-based surface soil moisture (RSSSM) dataset covering 2003–2018, Earth Syst. Sci. Data, 13, 1–31, https://doi.org/10.5194/essd-13-1-2021, 2021.
Cheng, F., Zhang, Z., Zhuang, H., Han, J., Luo, Y., Cao, J., Zhang, L., Zhang, J., Tao, F., and Xu, J.: ChinaCropSM1km: a fine 1km daily Soil Moisture dataset for dryland wheat and maize across China during 1993–2018 (wheat0–10cm), Zenodo [data set], https://doi.org/10.5281/zenodo.6834530, 2022a.
Cheng, F., Zhang, Z., Zhuang, H., Han, J., Luo, Y., Cao, J., Zhang, L., Zhang, J., Tao, F., and Xu, J.: ChinaCropSM1km: a fine 1km daily Soil Moisture dataset for dryland wheat and maize across China during 1993–2018 (wheat10–20cm), Zenodo [data set], https://doi.org/10.5281/zenodo.6822591, 2022b.
Cheng, F., Zhang, Z., Zhuang, H., Han, J., Luo, Y., Cao, J., Zhang, L., Zhang, J., Tao, F., and Xu, J.: ChinaCropSM1km: a fine 1km daily Soil Moisture dataset for dryland wheat and maize across China during 1993–2018 (maize0–10cm), Zenodo [data set], https://doi.org/10.5281/zenodo.6822581, 2022c.
Cheng, F., Zhang, Z., Zhuang, H., Han, J., Luo, Y., Cao, J., Zhang, L., Zhang, J., Tao, F., and Xu, J.: ChinaCropSM1km: a fine 1km daily Soil Moisture dataset for dryland wheat and maize across China during 1993–2018 (maize10–20cm), Zenodo [data set], https://doi.org/10.5281/zenodo.6820166, 2022d.
Collow, T. W., Robock, A., Basara, J. B., and Illston, B. G.: Evaluation of SMOS retrievals of soil moisture over the central United States with currently available in situ observations, Geophys. Res., 117, D09113, https://doi.org/10.1029/2011JD017095, 2012.
Crow, W. T., Berg, A. A., Cosh, M. H., Loew, A., Mohanty, B. P., Panciera, R., De Rosnay, P., Ryu, D., and Walker, J. P.: Upscaling sparse ground-based soil moisture observations for the validation of coarse-resolution satellite soil moisture products, Rev. Geophys., 50, 1–20, https://doi.org/10.1029/2011RG000372, 2012.
Danielsson, P.-E.: Euclidean distance mapping, Computer Graphics and Image Processing, 14, 227–248, https://doi.org/10.1016/0146-664X(80)90054-4, 1980.
Díaz-Uriarte, R. and Alvarez de Andrés, S.: Gene selection and classification of microarray data using random forest, BMC Bioinformatics, 7, 1–13, https://doi.org/10.1186/1471-2105-7-3, 2006.
Dorigo, W., Wagner, W., Albergel, C., Albrecht, F., Balsamo, G., Brocca, L., Chung, D., Ertl, M., Forkel, M., Gruber, A., Haas, E., Hamer, P. D., Hirschi, M., Ikonen, J., de Jeu, R., Kidd, R., Lahoz, W., Liu, Y. Y., Miralles, D., Mistelbauer, T., Nicolai-Shaw, N., Parinussa, R., Pratola, C., Reimer, C., van der Schalie, R., Seneviratne, S. I., Smolander, T., and Lecomte, P.: ESA CCI Soil Moisture for improved Earth system understanding: State-of-the art and future directions, Remote Sens. Environ., 203, 185–215, https://doi.org/10.1016/j.rse.2017.07.001, 2017.
Dorigo, W. A., Gruber, A., De Jeu, R. A. M., Wagner, W., Stacke, T., Loew, A., Albergel, C., Brocca, L., Chung, D., Parinussa, R. M., and Kidd, R.: Evaluation of the ESA CCI soil moisture product using ground-based observations, Remote Sens. Environ., 162, 380–395, https://doi.org/10.1016/j.rse.2014.07.023, 2015.
Drewniak, B., Song, J., Prell, J., Kotamarthi, V. R., and Jacob, R.: Modeling agriculture in the Community Land Model, Geosci. Model Dev., 6, 495–515, https://doi.org/10.5194/gmd-6-495-2013, 2013.
Eagleman, J. R. and Lin, W. C.: Remote sensing of soil moisture by a 21-cm passive radiometer, J. Geophys. Res., 81, 3660–3666, https://doi.org/10.1029/JC081i021p03660, 1976.
Entekhabi, D., Njoku, E. G., O'Neill, P. E., Kellogg, K. H., Crow, W. T., Edelstein, W. N., Entin, J. K., Goodman, S. D., Jackson, T. J., Johnson, J., Kimball, J., Piepmeier, J. R., Koster, R. D., Martin, N., McDonald, K. C., Moghaddam, M., Moran, S., Reichle, R., Shi, J. C., Spencer, M. W., Thurman, S. W., Tsang, L., and Van Zyl, J.: The Soil Moisture Active Passive (SMAP) Mission, Proc. IEEE, 98, 704–716, https://doi.org/10.1109/JPROC.2010.2043918, 2010.
Famiglietti, J. S., Ryu, D., Berg, A. A., Rodell, M., and Jackson, T. J.: Field observations of soil moisture variability across scales, Water Resour. Res., 44, W01423, https://doi.org/10.1029/2006WR005804, 2008.
Fang, B., Lakshmi, V., Bindlish, R., Jackson, T. J., and Liu, P.-W.: Evaluation and validation of a high spatial resolution satellite soil moisture product over the Continental United States, J. Hydrol., 588, 125043, https://doi.org/10.1016/j.jhydrol.2020.125043, 2020.
Fawcett, T.: An introduction to ROC analysis, Pattern Recogn. Lett., 27, 861–874, https://doi.org/10.1016/j.patrec.2005.10.010, 2006.
Food and Agriculture Organization Corporate Statistical Database (FAOSTAT): FAO online database, Crops and livestock products http://www.fao.org/faostat/en/#data/QCL (last access: 15 October 2021), 2019.
Gruber, A., Scanlon, T., van der Schalie, R., Wagner, W., and Dorigo, W.: Evolution of the ESA CCI Soil Moisture climate data records and their underlying merging methodology, Earth Syst. Sci. Data, 11, 717–739, https://doi.org/10.5194/essd-11-717-2019, 2019.
Guevara, M. and Vargas, R.: Downscaling satellite soil moisture using geomorphometry and machine learning, PLoS ONE, 14, e0219639, https://doi.org/10.1371/journal.pone.0219639, 2019.
Guevara, M., Taufer, M., and Vargas, R.: Gap-free global annual soil moisture: 15 km grids for 1991–2018, Earth Syst. Sci. Data, 13, 1711–1735, https://doi.org/10.5194/essd-13-1711-2021, 2021.
Hengl, T. and Gupta, S.: Soil water content (volumetric %) for 33 kPa and 1500 kPa suctions predicted at 6 standard depths (0, 10, 30, 60, 100 and 200 cm) at 250 m resolution (v0.1), Zenodo [data set], https://doi.org/10.5281/zenodo.2629589, 2019.
Hengl, T., Heuvelink, G. B. M., Kempen, B., Leenaars, J. G. B., Walsh, M. G., Shepherd, K. D., Sila, A., MacMillan, R. A., Mendes de Jesus, J., Tamene, L., and Tondoh, J. E.: Mapping Soil Properties of Africa at 250 m Resolution: Random Forests Significantly Improve Current Predictions, PLoS ONE, 10, e0125814, https://doi.org/10.1371/journal.pone.0125814, 2015.
Huang, S., Krysanova, V., Zhai, J., and Su, B.: Impact of Intensive Irrigation Activities on River Discharge Under Agricultural Scenarios in the Semi-Arid Aksu River Basin, Northwest China, Water Resour. Manage., 29, 945–959, https://doi.org/10.1007/s11269-014-0853-2, 2015.
Hutengs, C. and Vohland, M.: Downscaling land surface temperatures at regional scales with random forest regression, Remote Sens. Environ., 178, 127–141, https://doi.org/10.1016/j.rse.2016.03.006, 2016.
Im, J., Park, S., Rhee, J., Baik, J., and Choi, M.: Downscaling of AMSR-E soil moisture with MODIS products using machine learning approaches, Environ. Earth Sci., 75, 1120, https://doi.org/10.1007/s12665-016-5917-6, 2016.
Jackson, T. J., Schmugge, T. J., and Wang, J. R.: Passive microwave sensing of soil moisture under vegetation canopies, Water Resour. Res., 18, 1137–1142, https://doi.org/10.1029/WR018i004p01137, 1982.
Jeong, J. H., Resop, J. P., Mueller, N. D., Fleisher, D. H., Yun, K., Butler, E. E., Timlin, D. J., Shim, K.-M., Gerber, J. S., Reddy, V. R., and Kim, S.-H.: Random Forests for Global and Regional Crop Yield Predictions, PLoS ONE, 11, e0156571, https://doi.org/10.1371/journal.pone.0156571, 2016.
Karrou, M., Oweis, T., El-Enein, R. A., and Sherif, M.: Yield and water productivity of maize and wheat under deficit and raised bed irrigation practices in Egypt, Afr. J. Agric. Res., 7, 1755–1760, https://academicjournals.org/journal/AJAR/article-abstract/5EA3C6D39463 (last access: 10 October 2022), 2012.
Lacava, T., Matgen, P., Brocca, L., Bittelli, M., Pergola, N., Moramarco, T., and Tramutoli, V.: A First Assessment of the SMOS Soil Moisture Product With In Situ and Modeled Data in Italy and Luxembourg, IEEE Trans. Geosci. Remote, 50, 1612–1622, https://doi.org/10.1109/TGRS.2012.2186819, 2012.
Lagomarsino, D., Tofani, V., Segoni, S., Catani, F., and Casagli, N.: A Tool for Classification and Regression Using Random Forest Methodology: Applications to Landslide Susceptibility Mapping and Soil Thickness Modeling, Environ. Model Assess., 22, 201–214, https://doi.org/10.1007/s10666-016-9538-y, 2017.
Lawston, P. M., Santanello, J. A., and Kumar, S. V.: Irrigation Signals Detected From SMAP Soil Moisture Retrievals: Irrigation Signals Detected From SMAP, Geophys. Res. Lett., 44, 11860–11867, https://doi.org/10.1002/2017GL075733, 2017.
Li, H., Robock, A., Liu, S., Mo, X., and Viterbo, P.: Evaluation of Reanalysis Soil Moisture Simulations Using Updated Chinese Soil Moisture Observations, J. Hydrometeorol., 6, 180–193, https://doi.org/10.1175/JHM416.1, 2005.
Li, Z., Zhang, Z., and Zhang, L.: Improving regional wheat drought risk assessment for insurance application by integrating scenario-driven crop model, machine learning, and satellite data, Agr. Syst., 191, 103141, https://doi.org/10.1016/j.agsy.2021.103141, 2021.
Liu, Y., Yang, Y., and Yue, X.: Evaluation of Satellite-Based Soil Moisture Products over Four Different Continental In-Situ Measurements, Remote Sensing, 10, 1161, https://doi.org/10.3390/rs10071161, 2018.
Liu, Y. Y., Parinussa, R. M., Dorigo, W. A., De Jeu, R. A. M., Wagner, W., van Dijk, A. I. J. M., McCabe, M. F., and Evans, J. P.: Developing an improved soil moisture dataset by blending passive and active microwave satellite-based retrievals, Hydrol. Earth Syst. Sci., 15, 425–436, https://doi.org/10.5194/hess-15-425-2011, 2011.
Liu, Y. Y., Dorigo, W. A., Parinussa, R. M., de Jeu, R. A. M., Wagner, W., McCabe, M. F., Evans, J. P., and van Dijk, A. I. J. M.: Trend-preserving blending of passive and active microwave soil moisture retrievals, Remote Sens. Environ., 123, 280–297, https://doi.org/10.1016/j.rse.2012.03.014, 2012.
Llamas, R. M., Guevara, M., Rorabaugh, D., Taufer, M., and Vargas, R.: Spatial Gap-Filling of ESA CCI Satellite-Derived Soil Moisture Based on Geostatistical Techniques and Multiple Regression, Remote Sensing, 12, 665, https://doi.org/10.3390/rs12040665, 2020.
Loew, A., Stacke, T., Dorigo, W., de Jeu, R., and Hagemann, S.: Potential and limitations of multidecadal satellite soil moisture observations for selected climate model evaluation studies, Hydrol. Earth Syst. Sci., 17, 3523–3542, https://doi.org/10.5194/hess-17-3523-2013, 2013.
Luo, Y., Zhang, Z., Chen, Y., Li, Z., and Tao, F.: ChinaCropPhen1km: a high-resolution crop phenological dataset for three staple crops in China during 2000–2015 based on leaf area index (LAI) products, Earth Syst. Sci. Data, 12, 197–214, https://doi.org/10.5194/essd-12-197-2020, 2020a.
Luo, Y., Zhang, Z., Li, Z., Chen, Y., Zhang, L., Cao, J., and Tao, F.: Identifying the spatiotemporal changes of annual harvesting areas for three staple crops in China by integrating multi-data sources, Environ. Res. Lett., 15, 074003, https://doi.org/10.1088/1748-9326/ab80f0, 2020b.
Mallick, K., Bhattacharya, B. K., and Patel, N. K.: Estimating volumetric surface moisture content for cropped soils using a soil wetness index based on surface temperature and NDVI, Agr. Forest Meteorol., 149, 1327–1342, https://doi.org/10.1016/j.agrformet.2009.03.004, 2009.
Meng, X., Mao, K., Meng, F., Shi, J., Zeng, J., Shen, X., Cui, Y., Jiang, L., and Guo, Z.: A fine-resolution soil moisture dataset for China in 2002–2018, Earth Syst. Sci. Data, 13, 3239–3261, https://doi.org/10.5194/essd-13-3239-2021, 2021.
Mohanty, B. P., Cosh, M. H., Lakshmi, V., and Montzka, C.: Soil Moisture Remote Sensing: State-of-the-Science, Vadose Zone J., 16, vzj2016.10.0105, https://doi.org/10.2136/vzj2016.10.0105, 2017.
O, S. and Orth, R.: Global soil moisture from in-situ measurements using machine learning – SoMo.ml, arXiv [preprint], https://doi.org/10.48550/arxiv.2010.02374, 5 October 2020.
Peng, J., Loew, A., Merlin, O., and Verhoest, N. E. C.: A review of spatial downscaling of satellite remotely sensed soil moisture: Downscale Satellite-Based Soil Moisture, Rev. Geophys., 55, 341–366, https://doi.org/10.1002/2016RG000543, 2017.
Petropoulos, G. P., Ireland, G., and Barrett, B.: Surface soil moisture retrievals from remote sensing: Current status, products & future trends, Phys. Chem. Earth. Parts A/B/C, 83–84, 36–56, https://doi.org/10.1016/j.pce.2015.02.009, 2015.
Prasad, A. K., Chai, L., Singh, R. P., and Kafatos, M.: Crop yield estimation model for Iowa using remote sensing and surface parameters, Int. J. Appl. Earth Obs., 8, 26–33, https://doi.org/10.1016/j.jag.2005.06.002, 2006.
Preimesberger, W., Scanlon, T., Su, C.-H., Gruber, A., and Dorigo, W.: Homogenization of Structural Breaks in the Global ESA CCI Soil Moisture Multisatellite Climate Data Record, IEEE Trans. Geosci. Remote, 59, 2845–2862, https://doi.org/10.1109/TGRS.2020.3012896, 2021.
Qin, J., Yang, K., Lu, N., Chen, Y., Zhao, L., and Han, M.: Spatial upscaling of in-situ soil moisture measurements based on MODIS-derived apparent thermal inertia, Remote Sens. Environ., 138, 1–9, https://doi.org/10.1016/j.rse.2013.07.003, 2013.
Qiu, J., Gao, Q., Wang, S., and Su, Z.: Comparison of temporal trends from multiple soil moisture data sets and precipitation: The implication of irrigation on regional soil moisture trend, Int. J. Appl. Earth Obs., 48, 17–27, https://doi.org/10.1016/j.jag.2015.11.012, 2016a.
Qiu, J., Gao, Q., Wang, S., and Su, Z.: Comparison of temporal trends from multiple soil moisture data sets and precipitation: The implication of irrigation on regional soil moisture trend, Int. J. Appl. Earth Obs., 48, 17–27, https://doi.org/10.1016/j.jag.2015.11.012, 2016b.
Rasmussen, C. E.: Gaussian Processes in Machine Learning, in: Advanced Lectures on Machine Learning, vol. 3176, edited by: Bousquet, O., von Luxburg, U., and Rätsch, G., Springer Berlin Heidelberg, Berlin, Heidelberg, 63–71, https://doi.org/10.1007/978-3-540-28650-9_4, 2004.
Rodell, M., Houser, P. R., Jambor, U., Gottschalck, J., Mitchell, K., Meng, C.-J., Arsenault, K., Cosgrove, B., Radakovich, J., Bosilovich, M., Entin, J. K., Walker, J. P., Lohmann, D., and Toll, D.: The Global Land Data Assimilation System, B. Am. Meteorol. Soc., 85, 381–394, https://doi.org/10.1175/BAMS-85-3-381, 2004.
Schmugge, T. J., Kustas, W. P., Ritchie, J. C., Jackson, T. J., and Rango, A.: Remote sensing in hydrology, Adv. Water Resour., 25, 1367–1385, https://doi.org/10.1016/S0309-1708(02)00065-9, 2002.
Sheffield, J.: A simulated soil moisture based drought analysis for the United States, J. Geophys. Res., 109, D24108, https://doi.org/10.1029/2004JD005182, 2004.
Shen, Y., Zhang, Y., R. Scanlon, B., Lei, H., Yang, D., and Yang, F.: Energy/water budgets and productivity of the typical croplands irrigated with groundwater and surface water in the North China Plain, Agr. Forest Meteorol., 181, 133–142, https://doi.org/10.1016/j.agrformet.2013.07.013, 2013.
Srivastava, P. K., Han, D., Ramirez, M. R., and Islam, T.: Machine Learning Techniques for Downscaling SMOS Satellite Soil Moisture Using MODIS Land Surface Temperature for Hydrological Application, Water Resour. Manage., 27, 3127–3144, https://doi.org/10.1007/s11269-013-0337-9, 2013.
Su, C.-H., Zhang, J., Gruber, A., Parinussa, R., Ryu, D., Crow, W. T., and Wagner, W.: Error decomposition of nine passive and active microwave satellite soil moisture data sets over Australia, Remote Sens. Environ., 182, 128–140, https://doi.org/10.1016/j.rse.2016.05.008, 2016.
Sun, C., Bian, Y., Zhou, T., and Pan, J.: Using of Multi-Source and Multi-Temporal Remote Sensing Data Improves Crop-Type Mapping in the Subtropical Agriculture Region, Sensors, 19, 2401, https://doi.org/10.3390/s19102401, 2019.
Tao, F., Yokozawa, M., Hayashi, Y., and Lin, E.: Changes in agricultural water demands and soil moisture in China over the last half-century and their effects on agricultural production, Agr. Forest Meteorol., 118, 251–261, https://doi.org/10.1016/S0168-1923(03)00107-2, 2003.
Thornthwaite, C. W.: An Approach toward a Rational Classification of Climate, Geogr. Rev., 38, 55–94, https://doi.org/10.2307/210739, 1948.
Vergopolan, N., Chaney, N. W., Beck, H. E., Pan, M., Sheffield, J., Chan, S., and Wood, E. F.: Combining hyper-resolution land surface modeling with SMAP brightness temperatures to obtain 30-m soil moisture estimates, Remote Sens. Environ., 242, 111740, https://doi.org/10.1016/j.rse.2020.111740, 2020.
Wagner, W., Dorigo, W., de Jeu, R., Fernandez, D., Benveniste, J., Haas, E., and Ertl, M.: Fusion of Active and Passive Microwave Observations to Create an Essential Climate Variable Data Record on Soil Moisture, ISPRS Ann. Photogramm. Remote Sens. Spatial Inf. Sci., I-7, 315–321, https://doi.org/10.5194/isprsannals-I-7-315-2012, 2012.
Walker, J. P., Willgoose, G. R., and Kalma, J. D.: In situ measurement of soil moisture: a comparison of techniques, J. Hydrol., 293, 85–99, https://doi.org/10.1016/j.jhydrol.2004.01.008, 2004.
Wang, C., Wang, Z.-H., and Yang, J.: Urban water capacity: Irrigation for heat mitigation, Computers, Environment and Urban Systems, 78, 101397, https://doi.org/10.1016/j.compenvurbsys.2019.101397, 2019.
Wang, L. and Qu, J. J.: Satellite remote sensing applications for surface soil moisture monitoring: A review, Front. Earth Sci. China, 3, 237–247, https://doi.org/10.1007/s11707-009-0023-7, 2009.
Wei, Z., Meng, Y., Zhang, W., Peng, J., and Meng, L.: Downscaling SMAP soil moisture estimation with gradient boosting decision tree regression over the Tibetan Plateau, Remote Sens. Environ., 225, 30–44, https://doi.org/10.1016/j.rse.2019.02.022, 2019.
Wigneron, J.-P., Calvet, J.-C., Pellarin, T., Van de Griend, A. A., Berger, M., and Ferrazzoli, P.: Retrieving near-surface soil moisture from microwave radiometric observations: current status and future plans, Remote Sens. Environ., 85, 489–506, https://doi.org/10.1016/S0034-4257(03)00051-8, 2003.
Wu, B. and Li, Q.: Crop planting and type proportion method for crop acreage estimation of complex agricultural landscapes, Int. J. Appl. Earth Obs., 16, 101–112, https://doi.org/10.1016/j.jag.2011.12.006, 2012.
Wu, B., Ma, Z., and Yan, N.: Agricultural drought mitigating indices derived from the changes in drought characteristics, Remote Sens. Environ., 244, 111813, https://doi.org/10.1016/j.rse.2020.111813, 2020.
Yilmaz, M. T., Crow, W. T., Anderson, M. C., and Hain, C.: An objective methodology for merging satellite‐and model‐based soil moisture products, Water Resour. Res., 48, W11502, https://doi.org/10.1029/2011WR011682, 2012.
Yin, X. G., Jabloun, M., Olesen, J. E., Öztürk, I., Wang, M., and Chen, F.: Effects of climatic factors, drought risk and irrigation requirement on maize yield in the Northeast Farming Region of China, J. Agric. Sci., 154, 1171–1189, https://doi.org/10.1017/S0021859616000150, 2016.
Zeng, J., Li, Z., Chen, Q., Bi, H., Qiu, J., and Zou, P.: Evaluation of remotely sensed and reanalysis soil moisture products over the Tibetan Plateau using in-situ observations, Remote Sens. Environ., 163, 91–110, https://doi.org/10.1016/j.rse.2015.03.008, 2015.
Zhang, D., Qian, L., Mao, B., Huang, C., Huang, B., and Si, Y.: A Data-Driven Design for Fault Detection of Wind Turbines Using Random Forests and XGboost, IEEE Access, 6, 21020–21031, https://doi.org/10.1109/ACCESS.2018.2818678, 2018.
Zhang, Q., Sun, P., Li, J., Singh, V. P., and Liu, J.: Spatiotemporal properties of droughts and related impacts on agriculture in Xinjiang, China: Spatiotemporal properties of droughts and related impacts, Int. J. Climatol., 35, 1254–1266, https://doi.org/10.1002/joc.4052, 2015.
Zhang, Q., Shi, R., Singh, V. P., Xu, C.-Y., Yu, H., Fan, K., and Wu, Z.: Droughts across China: Drought factors, prediction and impacts, Sci. Total Environ., 803, 150018, https://doi.org/10.1016/j.scitotenv.2021.150018, 2022.
Zhang, Z., Li, Z., Chen, Y., Zhang, L., and Tao, F.: Improving regional wheat yields estimations by multi-step-assimilating of a crop model with multi-source data, Agr. Forest Meteorol., 290, 107993, https://doi.org/10.1016/j.agrformet.2020.107993, 2020.
Zhu, X., Li, Y., Li, M., Pan, Y., and Shi, P.: Agricultural irrigation in China, J. Soil Water Conserv., 68, 147A–154A, https://doi.org/10.2489/jswc.68.6.147A, 2013.