the Creative Commons Attribution 4.0 License.
the Creative Commons Attribution 4.0 License.
 | 04 Sep 2023
Quantifying exchangeable base cations in permafrost: a reserve of nutrients about to thaw
Elisabeth Mauclet
Maëlle Villani
Arthur Monhonval
Catherine Hirst
Edward A. G. Schuur
Sophie Opfergelt
Permafrost ecosystems are limited in nutrients for vegetation development and constrain the biological activity to the active layer. Upon Arctic warming, permafrost thaw exposes large amounts of soil organic carbon (SOC) to decomposition and minerals to weathering but also releases organic and mineral soil material that may directly influence the soil exchange properties (cation exchange capacity, CEC, and base saturation, BS). The soil exchange properties are key for nutrient base cation supply (Ca2+, K+, Mg2+, and Na+) for vegetation growth and development. In this study, we investigate the distributions of soil exchange properties within Arctic tundra permafrost soils at Eight Mile Lake (Interior Alaska, USA) because they will dictate the potential reservoir of newly thawed nutrients and thereby influence soil biological activity and vegetation nutrient sources. Our results highlight much lower CEC density in surface horizons (∼9400 cmolc m−3) than in the mineral horizons of the active layer (∼16 000 cmolc m−3) or in permafrost soil horizons (∼12 000 cmolc m−3). Together, with the overall increase in CEC density with depth and the overall increase in BS (percentage of CEC occupied by exchangeable base cations Ca2+, K+, Mg2+, and Na+) with depth (from ∼19 % in organic surface horizons to 62 % in permafrost soil horizons), the total exchangeable base cation density (Ca2+, K+, Mg2+, and Na+ in g m−3) is up to 5 times higher in the permafrost than in the active layer. More specifically, the exchangeable base cation density in the 20 cm upper part of permafrost about to thaw is ∼850 g m−3 for Caexch, 45 g m−3 for Kexch, 200 g m−3 for Mgexch, and 150 g m−3 for Naexch. This estimate is needed for future ecosystem prediction models to provide constraints on the size of the reservoir in exchangeable nutrients (Ca, K, Mg, and Na) about to thaw. All data described in this paper are stored in Dataverse, the online repository of Université catholique de Louvain, and are accessible through the following DOI: https://doi.org/10.14428/DVN/FQVMEP (Mauclet et al., 2022b).
- Article
(3140 KB) - Full-text XML
-
Supplement
(593 KB) - BibTeX
- EndNote


Northern ecosystems are characterized by low temperatures and the presence of ground underlain by permafrost. Within permafrost soils, the surface ground layer which thaws seasonally in summer and refreezes in winter is referred to as the active layer. Active layer thickness is crucial because it governs the soil volume for plant rooting systems, biogeochemical activity, hydrological processes, and the amount of soil organic and mineral constituents exposed to temperatures above freezing (Blume-Werry et al., 2019; Hinzman et al., 2003; Kane et al., 1991). In parallel, the presence of permafrost restricts downward movement of surface water and may create waterlogged soil conditions (Hinzman et al., 2003; Schuur et al., 2015). Together, cold temperatures, water-saturated conditions, and soil acidity reduce the decomposition rates of soil organic matter (SOM), mainly originating from dead plant tissues, and lead to high SOM accumulation in surface horizons (Schuur et al., 2008; Zimov et al., 2006).
Soil organic matter shows specific properties such as low bulk density, source of acidity, and large amounts of negatively charged sites at the organic compound surface (Askin and Özdemir, 2003; Périé and Ouimet, 2008; Ping et al., 2005), and it thereby largely influences multiple soil physical and chemical properties. In particular, SOM and clay minerals both contribute to the soil cation exchange capacity (CEC), which is a soil parameter that evaluates the soil’s ability to retain exchangeable cations and prevent their lixiviation or further drainage (Doran and Safley, 1997; Feller et al., 1991; Oades et al., 1989; Stevenson, 1994). Among exchangeable cations, the most common base cations Ca2+, K+, Mg2+, and Na+ act as a buffer against soil acidification (Bowman et al., 2008; Tian and Niu, 2015; Ulrich, 1983). Some base cations are essential nutrients for plant growth and development (Ca2+, K+, and Mg2+), and the exchangeable soil fraction constitutes a pool of cations readily available for plant uptake (Binkley and Vitousek, 1989; Marschner, 2012). More broadly, plant nutrient availability results from the dynamic interaction of soil processes (such as weathering, atmospheric deposition, leaching, and biological cycling; Jobbágy and Jackson, 2001), and the surface exchange reactions are especially important for the nutrient K but also for the key nutrients Ca and Mg (Havlin, 2005; Krull et al., 2004; Peverill et al., 1999).
Upon warming in the Arctic, permafrost thaw results in active layer thickening, ground subsidence, and changing soil moisture conditions (Hirst et al., 2022; Olefeldt et al., 2016; Osterkamp, 2005; Osterkamp et al., 2009). Moreover, permafrost thaw may influence organic constituents forming the soil exchange complex. In particular, increased SOM microbial degradation (Hobbie and Chapin, 1998; Nadelhoffer et al., 1992; Schuur et al., 2015; Shaver et al., 2006) or lateral transport of organic soil material from soils to streams (Plaza et al., 2019) generates a massive loss of soil organic carbon (SOC). Although the SOC stock and distribution in permafrost-affected soils is well characterized (Hugelius et al., 2014; Tarnocai et al., 2009; Strauss et al. 2017; Schuur et al., 2018), its evolution is uncertain and partly depends on the vulnerability of organic constituents to decompose upon soil warming and permafrost thaw (Schaefer et al., 2011; Schuur et al., 2008). Additionally, permafrost thaw exposes soil material at depth (Beermann et al., 2017; Keuper et al., 2017; Salmon et al., 2016), with potential organic inclusions and clay minerals that may contribute to the soil exchange complex in the active layer, and reservoirs of exchangeable cations with readily available nutrients (Ca2+, K+, Mg2+, and Na+) for plant uptake. Overall, changes in the active layer thickness (ALT) and in the balance between organic and mineral constituents of the active layer are likely to influence the size of the reservoir and the sources of available nutrients for plant uptake, thereby promoting tundra vegetation productivity. However, these changes in nutrient availability upon permafrost thaw remain poorly quantified, and further estimation of the exchangeable nutrient (Ca2+, K+, Mg2+, and Na+) reservoir about to thaw relative to the current stock in the active layer is a needed step for ecosystem models simulating the evolution of vegetation development and microbial activity upon permafrost thaw (Fisher et al., 2014; Koyama et al., 2014; Sulman et al., 2021; van der Kolk et al., 2016).
The main objective of this study is to investigate the influence of permafrost thaw on the properties of the soil exchange complex. We posit that permafrost thaw exposes a deep soil layer with contrasted properties of the soil exchange complex relative to the seasonally thawing active layer, and we aim to quantify this contrast. Across a range of permafrost soil profiles divided into two groups depending on their active layer thickness (ALT <60 cm where ALT cm and ALT >60 cm where ALT cm), we investigate the difference in the constituents controlling the soil capacity to retain exchangeable cations and the distribution of exchangeable cations retained, and we quantify the exchangeable cation density in the seasonally thawed active layer and in the permafrost.
2.1 Study area and sampling
The study is conducted within the Eight Mile Lake (EML) watershed close to Healy, in Interior Alaska, USA (63∘52′42 N, 149∘15′12 W; Schuur et al., 2009). The research site is underlain by degrading permafrost in the discontinuous permafrost zone (Natali et al., 2011; Osterkamp et al., 2009) and covers a natural gradient in permafrost thaw (“Gradient site”). Long-term (1977–2015) mean annual air temperatures range between 10±3.8 ∘C (for the growing season from May to September; Natali et al., 2012) and ∘C (for the non-growing season), and the mean annual precipitation is about 381 mm (Natali et al., 2011; Vogel et al., 2009). Soils at EML are classified as Histic Turbic Cryosols (IUSS Working Group WRB, 2015) and characterized by a thick organic layer up to 55 cm (SOC ≥20 %) in surface horizons. This organic horizon overlays a cryoturbated mineral soil (SOC <20 %) composed of glacial till and loess parent material (Hicks Pries et al., 2012; Osterkamp et al., 2009; Vogel et al., 2009) with dominant amounts of quartz and feldspars (Plaza et al., 2019). The site is located on moist acidic tundra, with a dominance of sedges (such as Eriophorum vaginatum L. and Carex bigelowii Torr. ex Schwein.), evergreen shrubs (e.g., Andromeda polifolia L., Rhododendron tomentosum Harmaja, Vaccinium vitis-idaea L., and Empetrum nigrum L.), deciduous shrubs (e.g., Vaccinium uliginosum L. and Betula nana L.), and forbs (e.g., Rubus chamaemorus L.). Non-vascular plant cover is dominated by mosses (mainly Sphagnum spp., Dicranum spp., and feather mosses including Hylocomium splendens and Pleurozium schreberi) and lichen species (e.g., Nephroma spp., Cladonia spp., and Flavocetraria cucullata; Deane-Coe et al., 2015; Natali et al., 2012; Schuur et al., 2007). Since the start of the thermokarst development, vegetation cover has changed with the evergreen and deciduous shrubs (such as V. uliginosum and Rhododendron tomentosum) and forbs (such as Rubus chamaemorus) being dominant at the expense of the sedges (Jasinski et al., 2018; Mauclet et al., 2022a; Schuur et al., 2007; Villani et al., 2022).
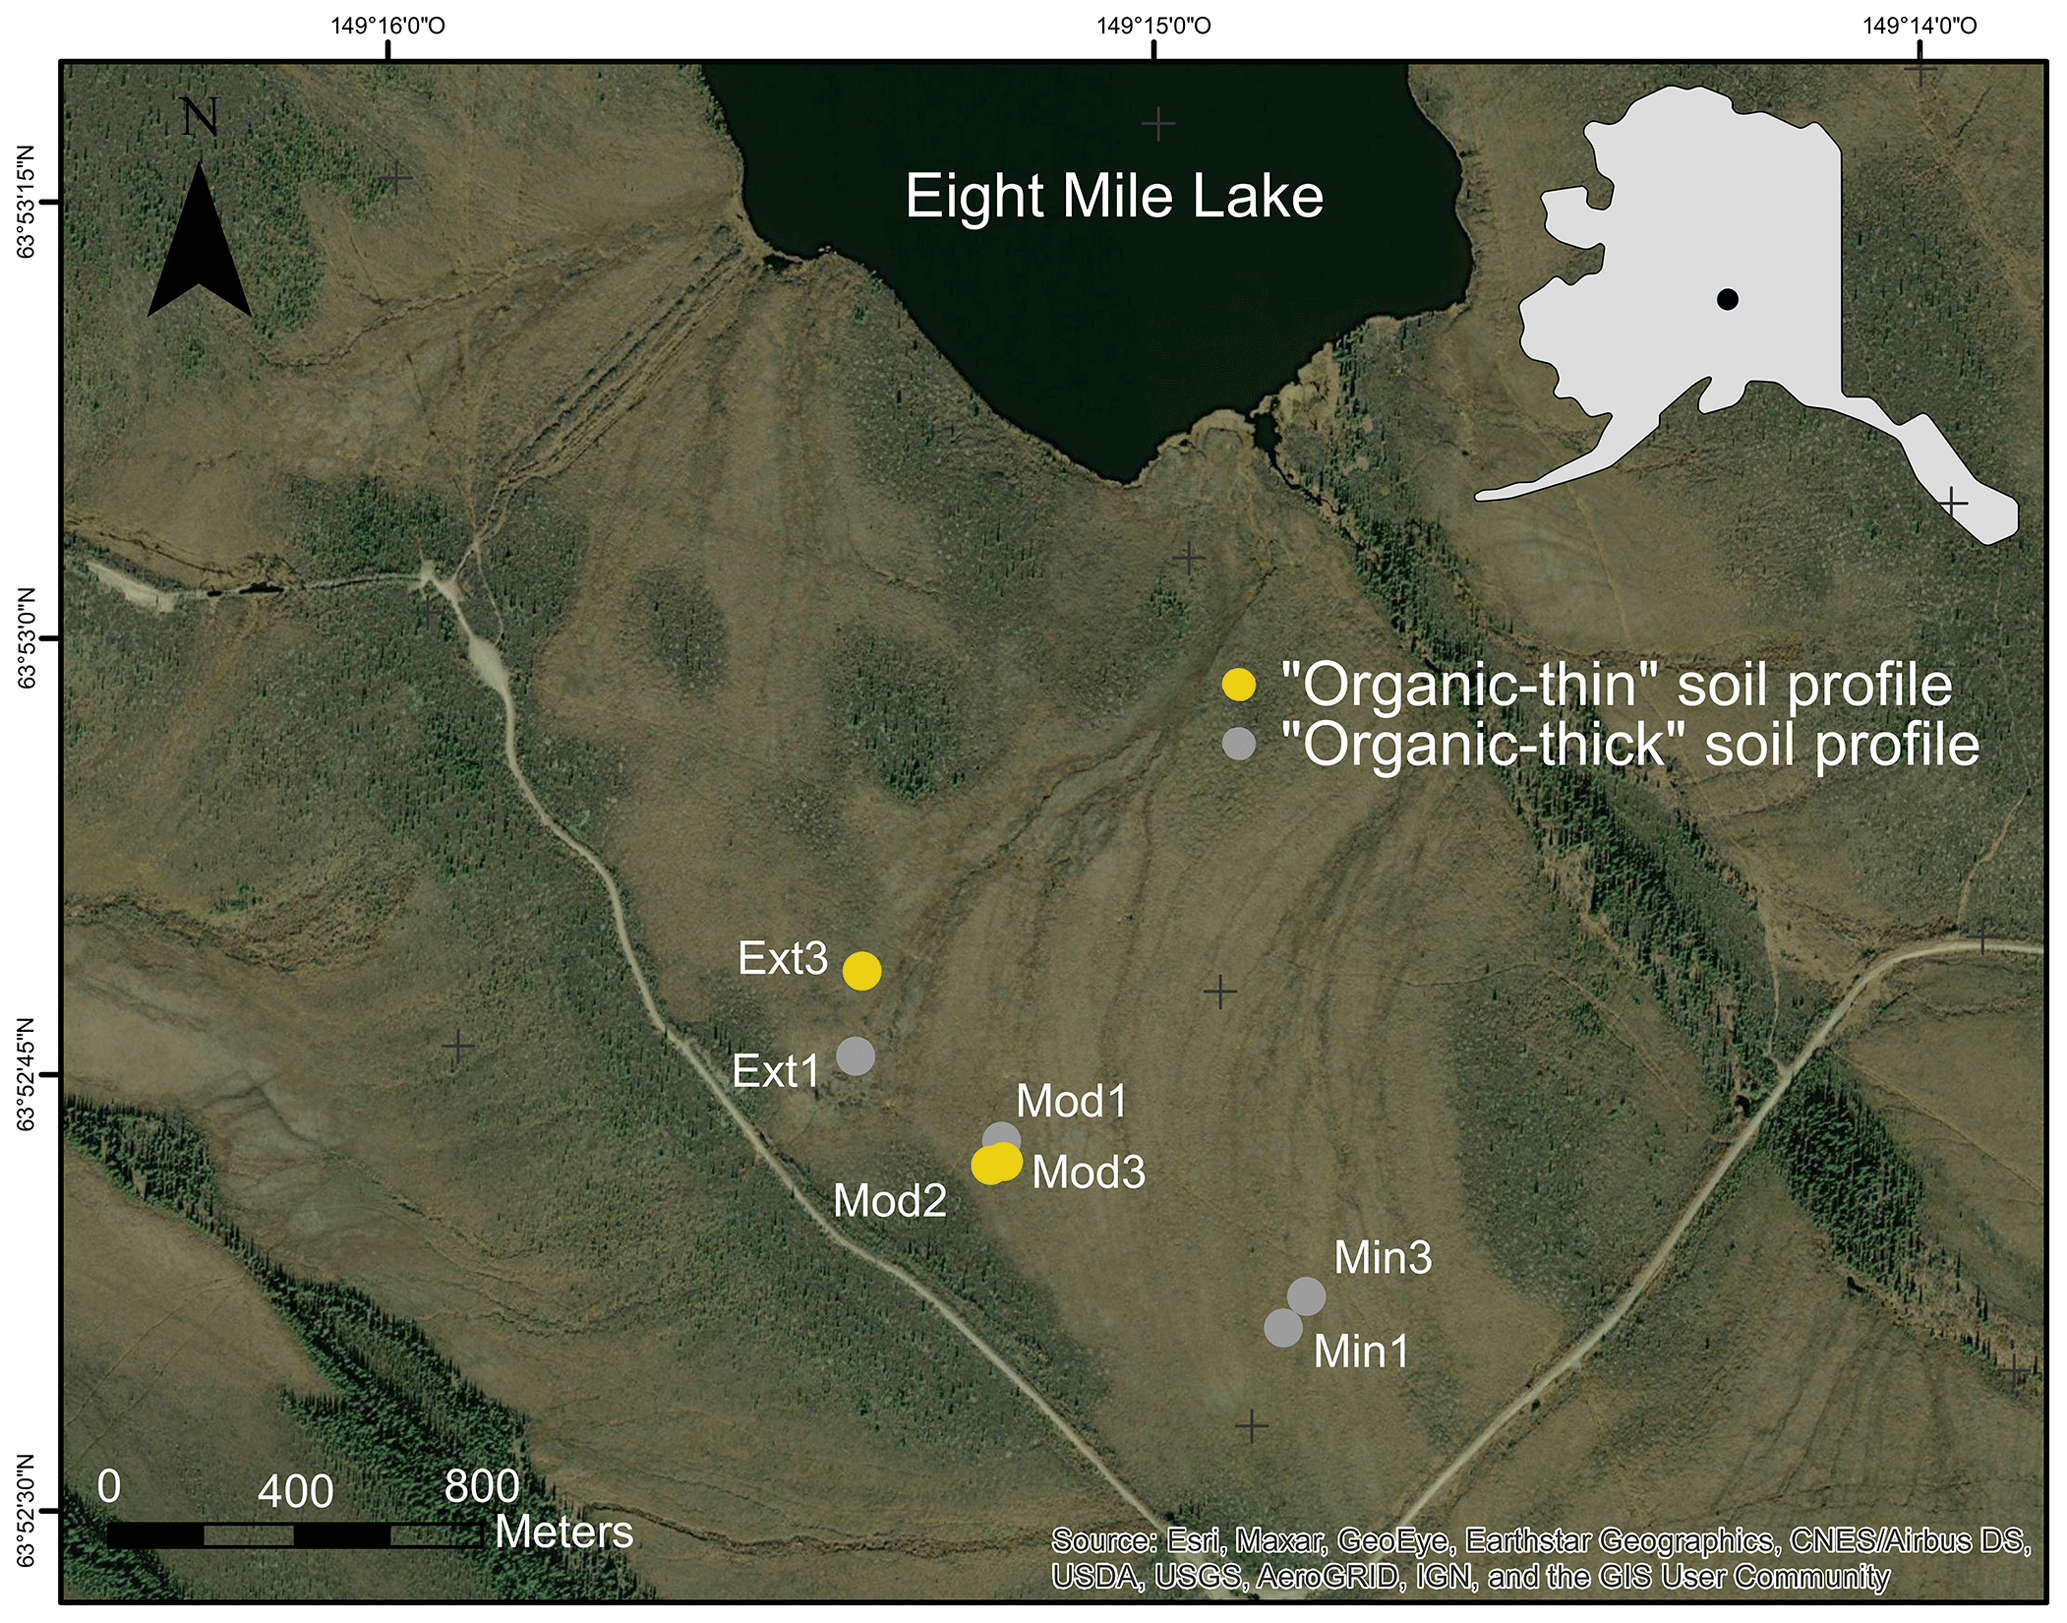
Figure 1Study site at Eight Mile Lake, in central Alaska, USA (inset). The Gradient site is a natural thermokarst gradient originally composed of areas of minimal (Min), moderate (Mod), and extensive (Ext) permafrost thaw. According to the active layer thickness measurement, we separate the seven soil cores into two groups: “organic-thin” soil profile (ALT >60 cm, in yellow) and “organic-thick” soil profile (ALT <60 cm, in grey). Source: Esri, HERE, Garmin, OpenStreetMap contributors, and GIS user community. Map source: GeoNorth Information Systems (Alaska Geospatial Imagery Services| GeoNorth Information Systems (https://www.geonorthis.com, last access: 16 January 2023).
A field campaign took place on the natural and monitored gradient of permafrost thaw at EML (Gradient site, Fig. 1; Osterkamp et al., 2009; Vogel et al., 2009) in the late-season period between mid-August and early September in 2019 to sample permafrost soil profiles with contrasted thaw depth from 48 to 88 cm. Seven soil cores were collected along the permafrost gradient, and their respective active layer thicknesses (e.g., ALT) were measured with a metal probe (Table S1 in the Supplement). This measurement highlights the fact that ALT no longer follows the gradient of permafrost thaw defined in the literature (Schuur et al., 2021). We then divided our seven soil cores according to ALT with the “organic-thin” soil profile (ALT >60 cm, corresponding to an organic layer thickness (OLT) <40 cm) and “organic-thick” soil profile (ALT <60 cm, corresponding to OLT >40 cm). This relationship between ALT and OLT can be explained by the low thermal diffusivity and conductivity of the organic matter (Adams, 1973; Farouki, 1981) that insulates the soil (Decharme et al., 2016; Lawrence and Slater, 2008) and thereby influences the permafrost thaw depth. The mineralogy of the soils from this site is similar, and mineral phases observed are plagioclase, K-feldspar, amphibole, quartz, muscovite, vermiculite, kaolinite, and illite (Mauclet et al., 2023). Soils were sampled to a maximum depth of 120 cm and subdivided into 5 to 10 cm horizons. Active layer samples were collected using a hammer and chisel as deep as possible (up to 45 cm, unless the water table was higher than 45 cm). Below 45 cm depth, active layer and permafrost samples were collected using a steel pipe (diameter 4.5 cm) that was manually hammered into the soil using a sledgehammer (Palmtag et al., 2015). The demarcation between organic and mineral horizons (organic layer thickness OLT) was determined visually and confirmed by percent organic carbon (% OC) analysis (Sect. 2.2) when the percent OC of the soil decreased to less than 20 % (Hicks Pries et al., 2012). For each soil core, we kept separated samples from organic active layers, mineral active layers, and permafrost soil layers. In the lab, soil samples (n=85) were dried at air temperature in a ventilated and temperature-controlled room. Mineral horizons (SOC ≤20 %) were sieved at 2 mm, and organic horizons (SOC >20 %) free of large roots were ground.
2.2 Characterization of the total soil fraction
2.2.1 Soil pH
The soil pH and pHKCl were measured for all soil samples (n=85) with the pH probe (InLab Micro) connected to the pH meter (Mettler Toledo SevenCompact Duo S213). Mineral soil samples were mixed in the 1:5 proportion with H2O or 1 M KCl (Peech, 1965), whereas organic soil samples required adaptation and were mixed in 1:15 proportion with H2O or 1 M KCl in order to have enough liquid solution for the insertion of the pH probe. Although dilution increases the pH of the soil suspension, regardless of the initial pH value of the soil or the distilled water used in preparation of the suspensions (Peech, 1965), we obtained lower pH in organic soil samples (4.0±0.25 for pH and 3.3±0.29 for pHKCl) than in mineral soil samples (5.0±0.66 for pH and 4.2±0.66 for pHKCl). The pH probe was calibrated for pH 4 and 7 before measurement.
2.2.2 Soil organic carbon content measurement and estimation of soil bulk density
The total soil carbon content was measured for all soil samples (n=85) with the C, N, and S elemental analyzer “vario EL cube” (Elementar®, Germany). The C measurements for soil samples (n=85) are reported to the dry soil matrix (105 ∘C). Each sample was measured twice, and the average standard deviation for C content was ∼5 %, with the detection limit of <0.1 %. As the presence of carbonates was not detected by X-ray diffraction, the total soil carbon content is considered equivalent to soil organic carbon (SOC) content. The SOC content analysis was used to confirm the limit between organic (SOC >20 %) and mineral (SOC ≤20 %) soil horizons (OLT; Hicks Pries et al., 2012).
Given that bulk densities were not measured upon sampling, bulk densities were estimated based on measured SOC content. Because of the strong correlation between the soil organic matter content and the soil bulk density (Askin and Özdemir, 2003; Chaudhari et al., 2013; Périé and Ouimet, 2008), we established a linear regression (Fig. 2; Eq. 1; R2=0.73) to relate the SOC content () to soil bulk density (BD, in gsoil cm−3) based on 443 paired measurements on active layer and permafrost samples from a previous study at the EML research site (Interior Alaska, USA; Plaza et al., 2017). This regression reflects the higher bulk density in mineral horizons than in organic horizons (Fig. 2), even if the variability in bulk density is higher in soils with low SOC content (mineral horizons). We applied the resulting empirical equation of correlation between the two parameters (Eq. 1) to our SOC data for soil samples collected at the Gradient site in 2019.
with i being the sample horizon considered and SOC content in .
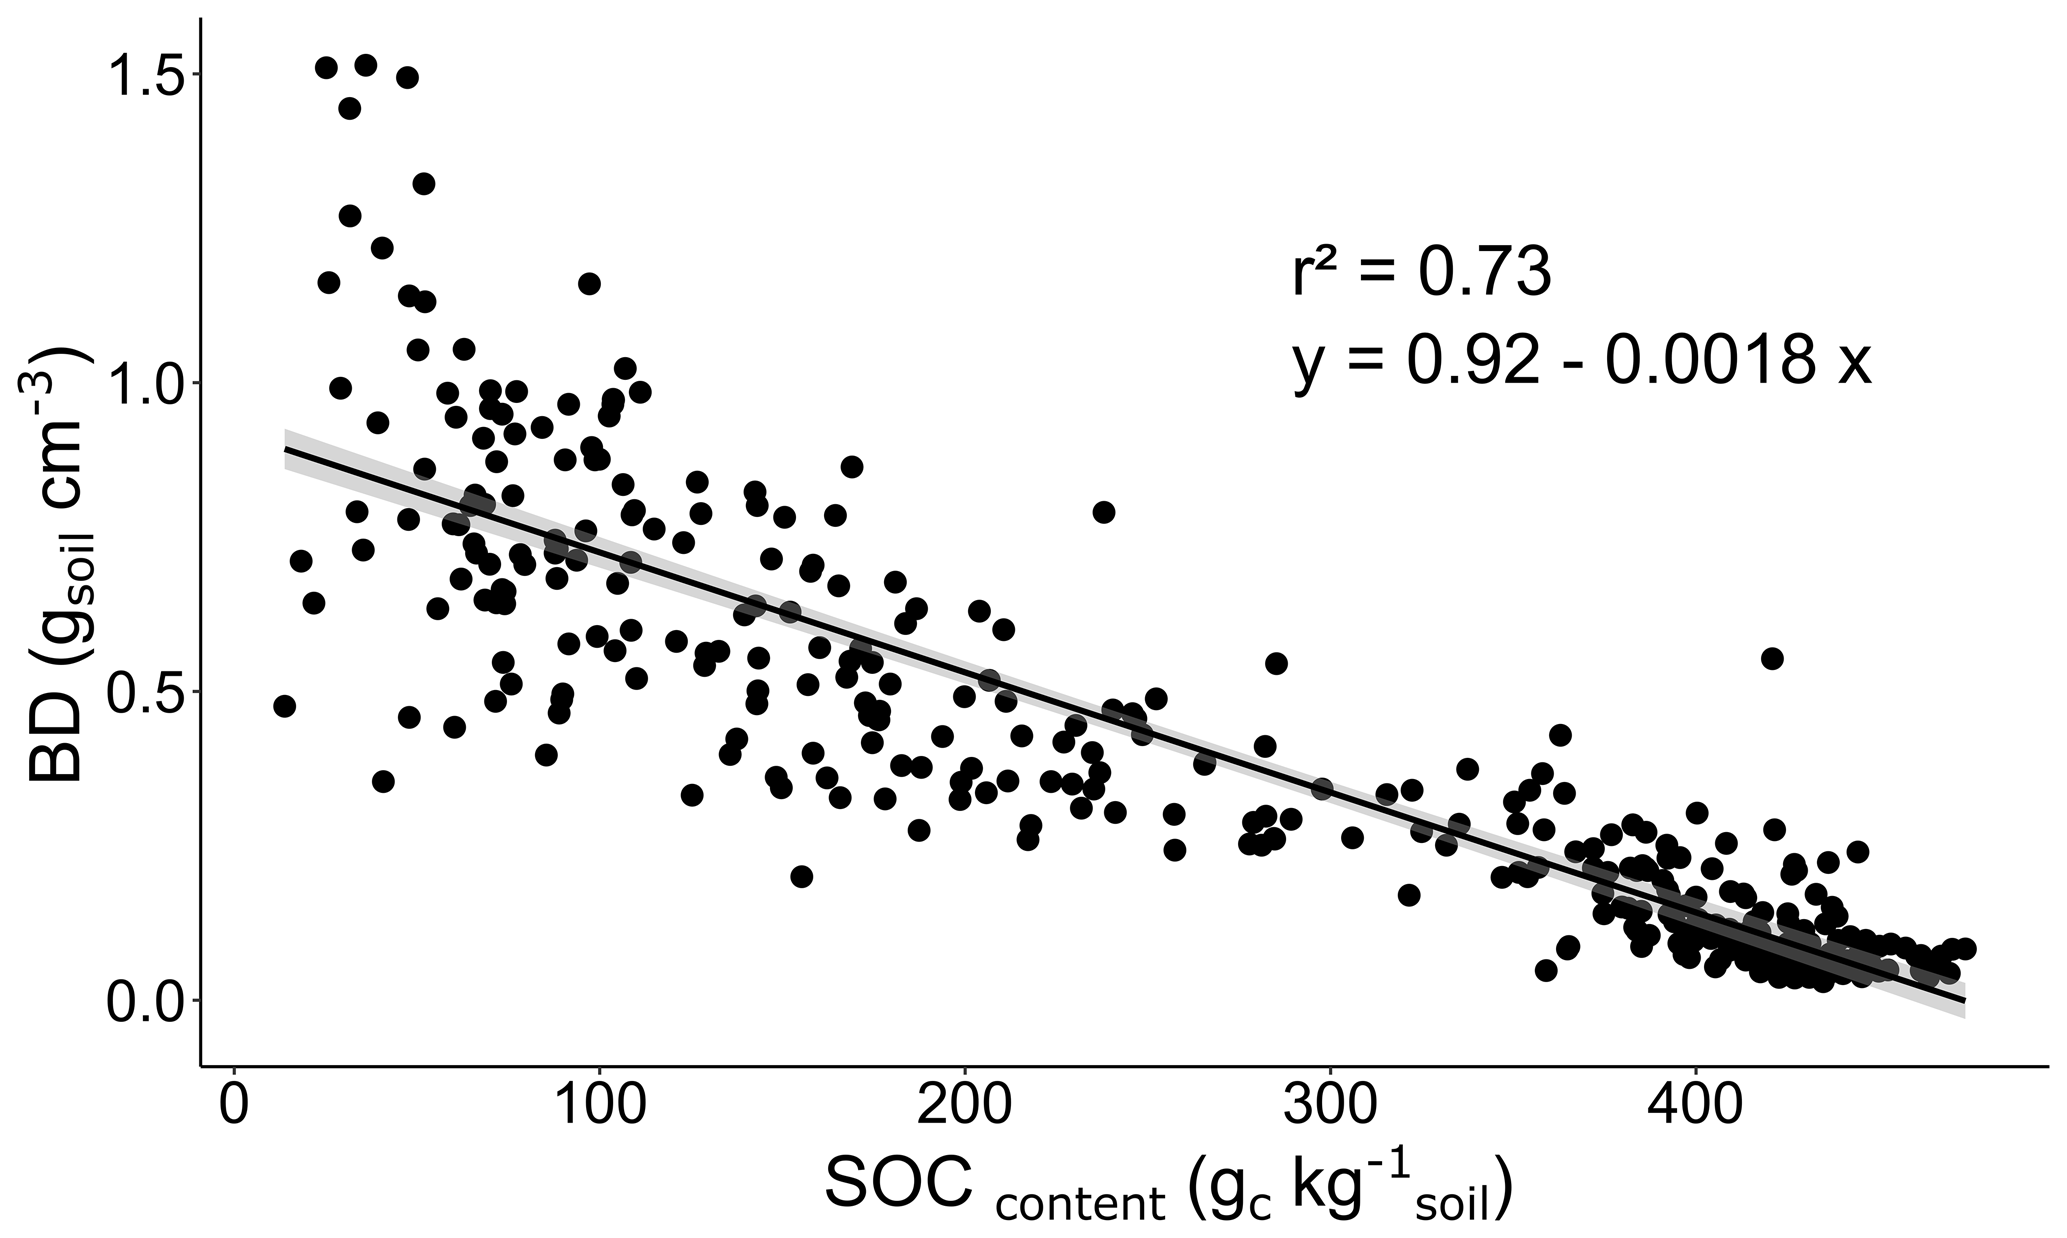
Figure 2Linear correlation between soil organic carbon content (SOC content in ) and bulk density (BD in gsoil cm−3) at Eight Mile Lake, Alaska, USA (n=443, adapted from Plaza et al., 2017).
2.2.3 Soil elemental composition
On two selected soil profiles (n=25) with contrasted permafrost thaw states (one organic-thick soil profile, Min1, where ALT =55 cm and one organic-thin soil profile, Mod3, where ALT =75 cm), the total concentrations of Ca, K, Mg, and Na in bulk soils were determined by inductively coupled plasma optical emission spectroscopy (ICP-OES, iCAP 6500, Thermo Fisher Scientific, Waltham, USA) after alkaline fusion (Chao and Sanzolone, 1992). For the fusion, a portion of the ground sample (80 mg) was mixed with lithium metaborate and lithium tetraborate and heated up to 1000 ∘C for 10 min. Then, the fusion bead is dissolved in HNO3 at 2.2 N at 80 ∘C and stirred until complete dissolution. The loss on ignition is assessed at 1000 ∘C, and the total elemental content is expressed in reference to the dry weight at 105 ∘C. The accuracy for mineral element (Ca, K, Mg, and Na) analyses was assessed using trueness (±2 %, ±5 %, ±2 %, and ±2 %, respectively) on the USGS basalt reference material BHVO-2 (Wilson, 1997) and the analytical precision (±0.5 %) for each element. The limits of detection (LODs) were 0.05, 0.01, 0.001, and 0.02 mg L−1 for Ca, K, Mg, and Na, respectively. The blank levels were below the detection limit for Ca, K, Mg, and Na. The sum of the total concentrations for Ca, K, Mg, and Na was calculated as the total reserve in bases (TRB, expressed in cmolc kg−1; Herbillon, 1986).
2.3 Characterization of the exchangeable soil fraction
2.3.1 Potential soil cationic exchange capacity, concentration in exchangeable base cations, and base saturation
The concentration of exchangeable base cations and the potential CEC of soil were determined for all soil samples (n=85). The exchangeable base cations (Ca2+, K+, Mg2+, Na+) were collected at neutral pH by ammonium acetate extraction (1 M NH4OAc; Metson, 1956), and their concentrations within the extracts were determined by ICP-OES. The potential soil CEC (expressed in reference to the dry weight at 105∘) was determined by desorbing the ammonium from the soil exchange complex and measuring the amount of ammonium recovered by spectrophotometry (Spectroquant® ammonium test kits). The base saturation (BS, percentage of CEC occupied by exchangeable base cations Ca2+, K+, Mg2+, and Na+) was calculated with Eq. (2):
2.3.2 Estimates for CEC density, exchangeable base cation stock, and density
While the usual soil CEC (cmolc kg−1) is relative to soil mass, we evaluated here the CEC density relative to the soil volume (in cmolc m−3) along permafrost soil profiles. For the calculation, we relied on the soil CEC (in cmolc kg−1) and bulk density (BD in g cm−3) with Eq. (3):
with i being the sample horizon considered.
On four soil profiles (n=47) that have samples of each horizon down to 1 m (two organic-thick soil profiles, Min3 and Mod1, and two organic-thin soil profiles, Mod2 and Mod3), we evaluated the exchangeable base cation density (Ca2+, K+, Mg2+, and Na+; in g m−3) using the mineral element concentration of soil [X] (g kg−1) and the bulk density (BD, in g cm−3) with Eq. (4):
with i being the sample horizon considered. This exchangeable base cation density is independent of the depth of each horizon considered and allows us to compare the density of horizons that have different thicknesses.
From this exchangeable base cation density (in g m−3), we also estimated the exchangeable base cation (Ca2+, K+, Mg2+, and Na+) stocks (in g m−2) using the thickness of each horizon (HT, in m) with Eq. (5):
All statistics were performed using R 4.2.1 (RStudio Inc., Boston, Massachusetts, USA; R Core Team, 2018), and plots were created using the ggplot2 package. The significant differences between organic active layer, mineral active layer, and permafrost were evaluated using the non-parametric Kruskal–Wallis test (α=0.05). If significant differences were observed at a p value , a post hoc Dunn's test was carried out.
3.1 Distribution of the organic and mineral constituents from the soil exchange complex within permafrost soil profiles
The soils from EML accumulate organic matter and show contrasts in SOC contents between the organic surface (SOC >20 %) and deep mineral (SOC ≤20 %) soil horizons (Fig. 3). This is consistent with expectations for typical sub-Arctic tundra soils (Christensen et al., 1999; Hugelius et al., 2014; Michaelson et al., 1996). On average, organic soil horizons hold about 43 % OC, whereas mineral soil horizons hold about 4.5 % OC (Table S2). For some soil profiles, an increase in SOC content at the bottom of the active layer (60–80 cm depth, up to 30 % OC) may reflect the presence of old organic matter inclusions within the soil mineral phase. This supports the fact that the transient layer, that may contain thaw unconformities reflecting previous periods of exceptional permafrost thaw, is sensitive to cryoturbation that can mix soil material by repeated freezing and thawing (Fig. 3; Bockheim and Hinkel, 2007; Ping et al., 2008; Shur et al., 2005).
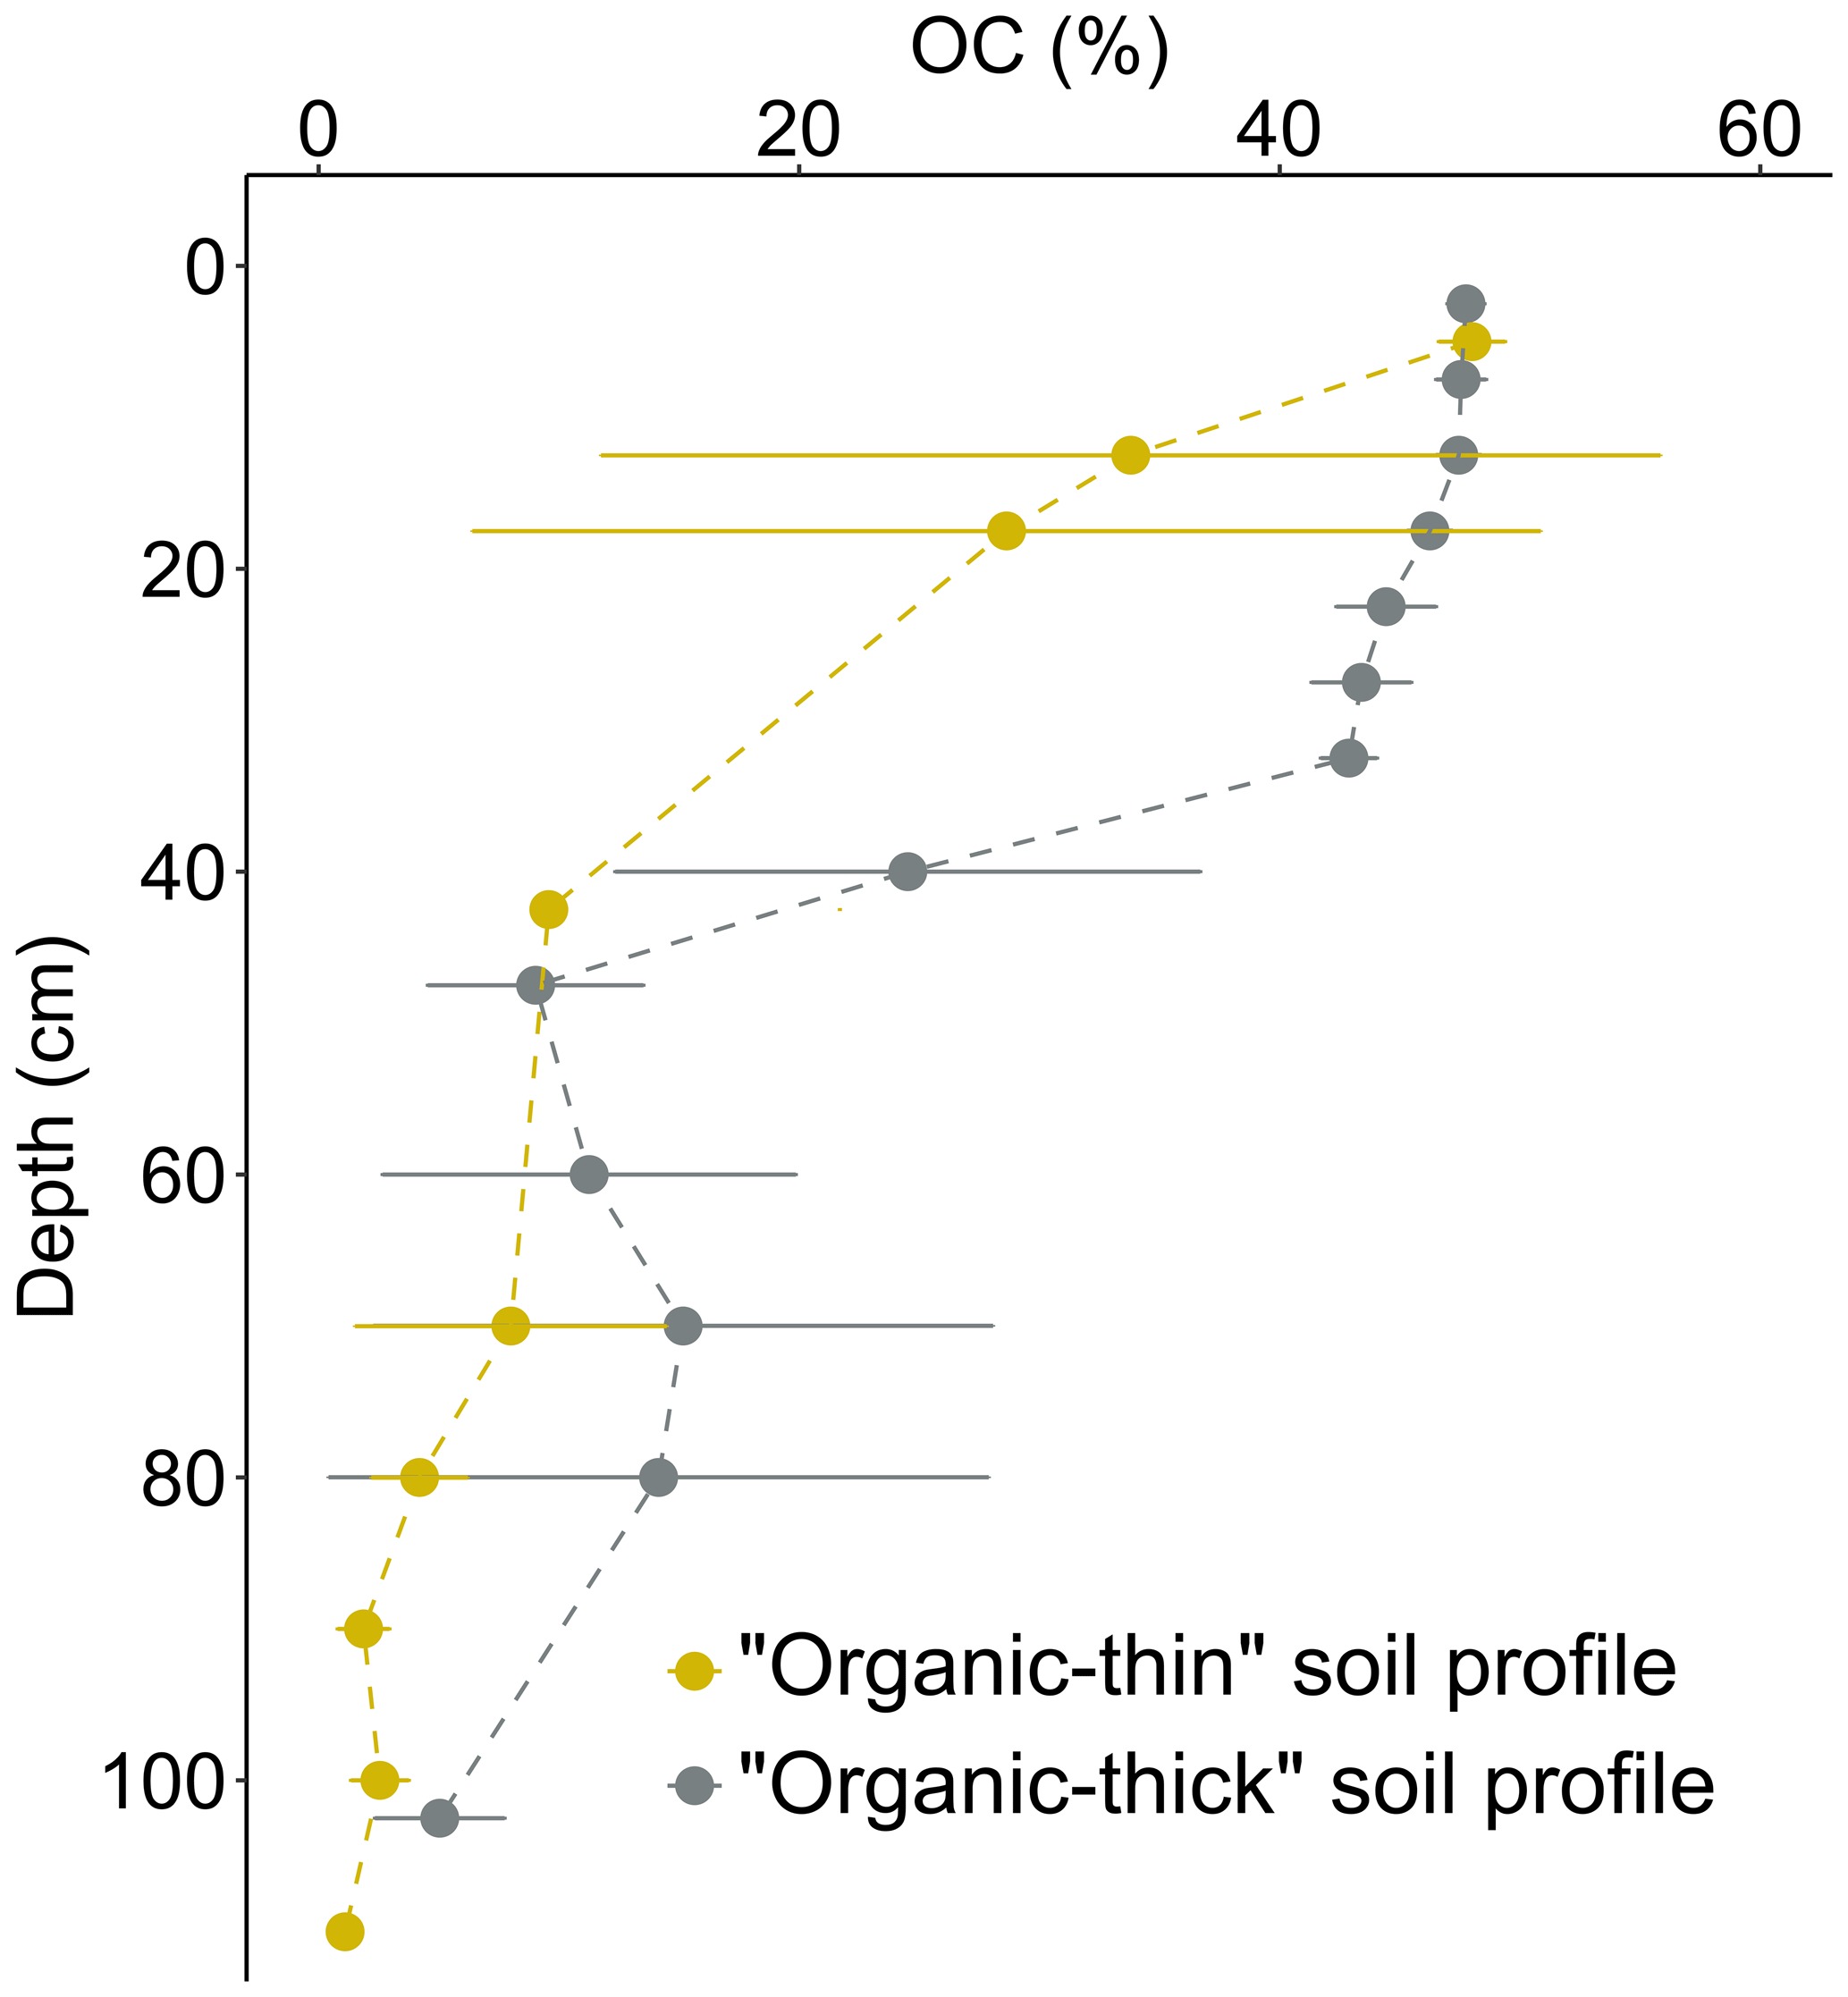
Figure 3Distribution of soil organic carbon content (% OC) into permafrost soil. The organic-thin (in orange) soil profiles present more shallowly distributed high values for OC content, and the organic-thick (in grey) soil profiles present more deeply distributed high values for OC content. The error bars (horizontal lines) represent the standard deviation of the mean values (of 3 to 7 samples).
In parallel to the decrease in OC content with depth, the analysis of the soil composition in mineral elements reveals a significant increase in the Ca, K, Mg, and Na total concentrations between the organic layer and the mineral active layer (3 to 9 times, p value <0.01) or permafrost (3 to 9 times, p value <0.01), whereas concentrations are not significantly different between the mineral active layer and the permafrost layer (p value >0.1, Fig. 4). On average, the organic active layers contain g kg−1 Ca, g kg−1 Mg, g kg−1 K, and g kg−1 Na, and mineral active layer and permafrost layers contain about g kg−1 Ca, g kg−1 Mg, g kg−1 K, and g kg−1 Na (Table S3). Moreover, Ca, Mg, K, and Na concentrations are not significantly different (p value >0.1) between the organic-thick and the organic-thin soil profiles.
This net difference in the total concentrations of Ca, K, Mg, and Na between surface and deep soil horizons reflects the transition between organic and mineral soil horizons (Fig. 4), with higher elemental concentrations in the mineral soil horizons originating from the mineral constituents. In particular, the mineral phases observed at EML include primary minerals (i.e., quartz, mica, K-feldspar, plagioclase, and amphibole) and secondary minerals (i.e., kaolinite, vermiculite, and illite; Mauclet et al., 2023). While some secondary minerals (such as clay minerals Al and Fe oxides) may directly contribute to the soil exchange complex, primary minerals constitute a soil reserve in potentially weatherable minerals that may release base cations into the soil solution. Therefore, the soil composition and distribution in minerals within permafrost will directly influence the soil exchange properties upon active layer thickening.
Overall, our data support the hypothesis of a changing balance between organic and mineral constituents forming the soil exchange complex upon permafrost thaw. A thinner organic layer in more thawed permafrost soils leads to a lower contribution from organic constituents to the soil exchange complex in the active layer relative to less-thawed permafrost soils. In addition, permafrost thaw exposes mineral layers containing proportionally less organic matter and more clay minerals than the above active layer, leading to an increasing contribution from clay minerals to the soil exchange complex at increasing depth and providing new sites for cation exchange.
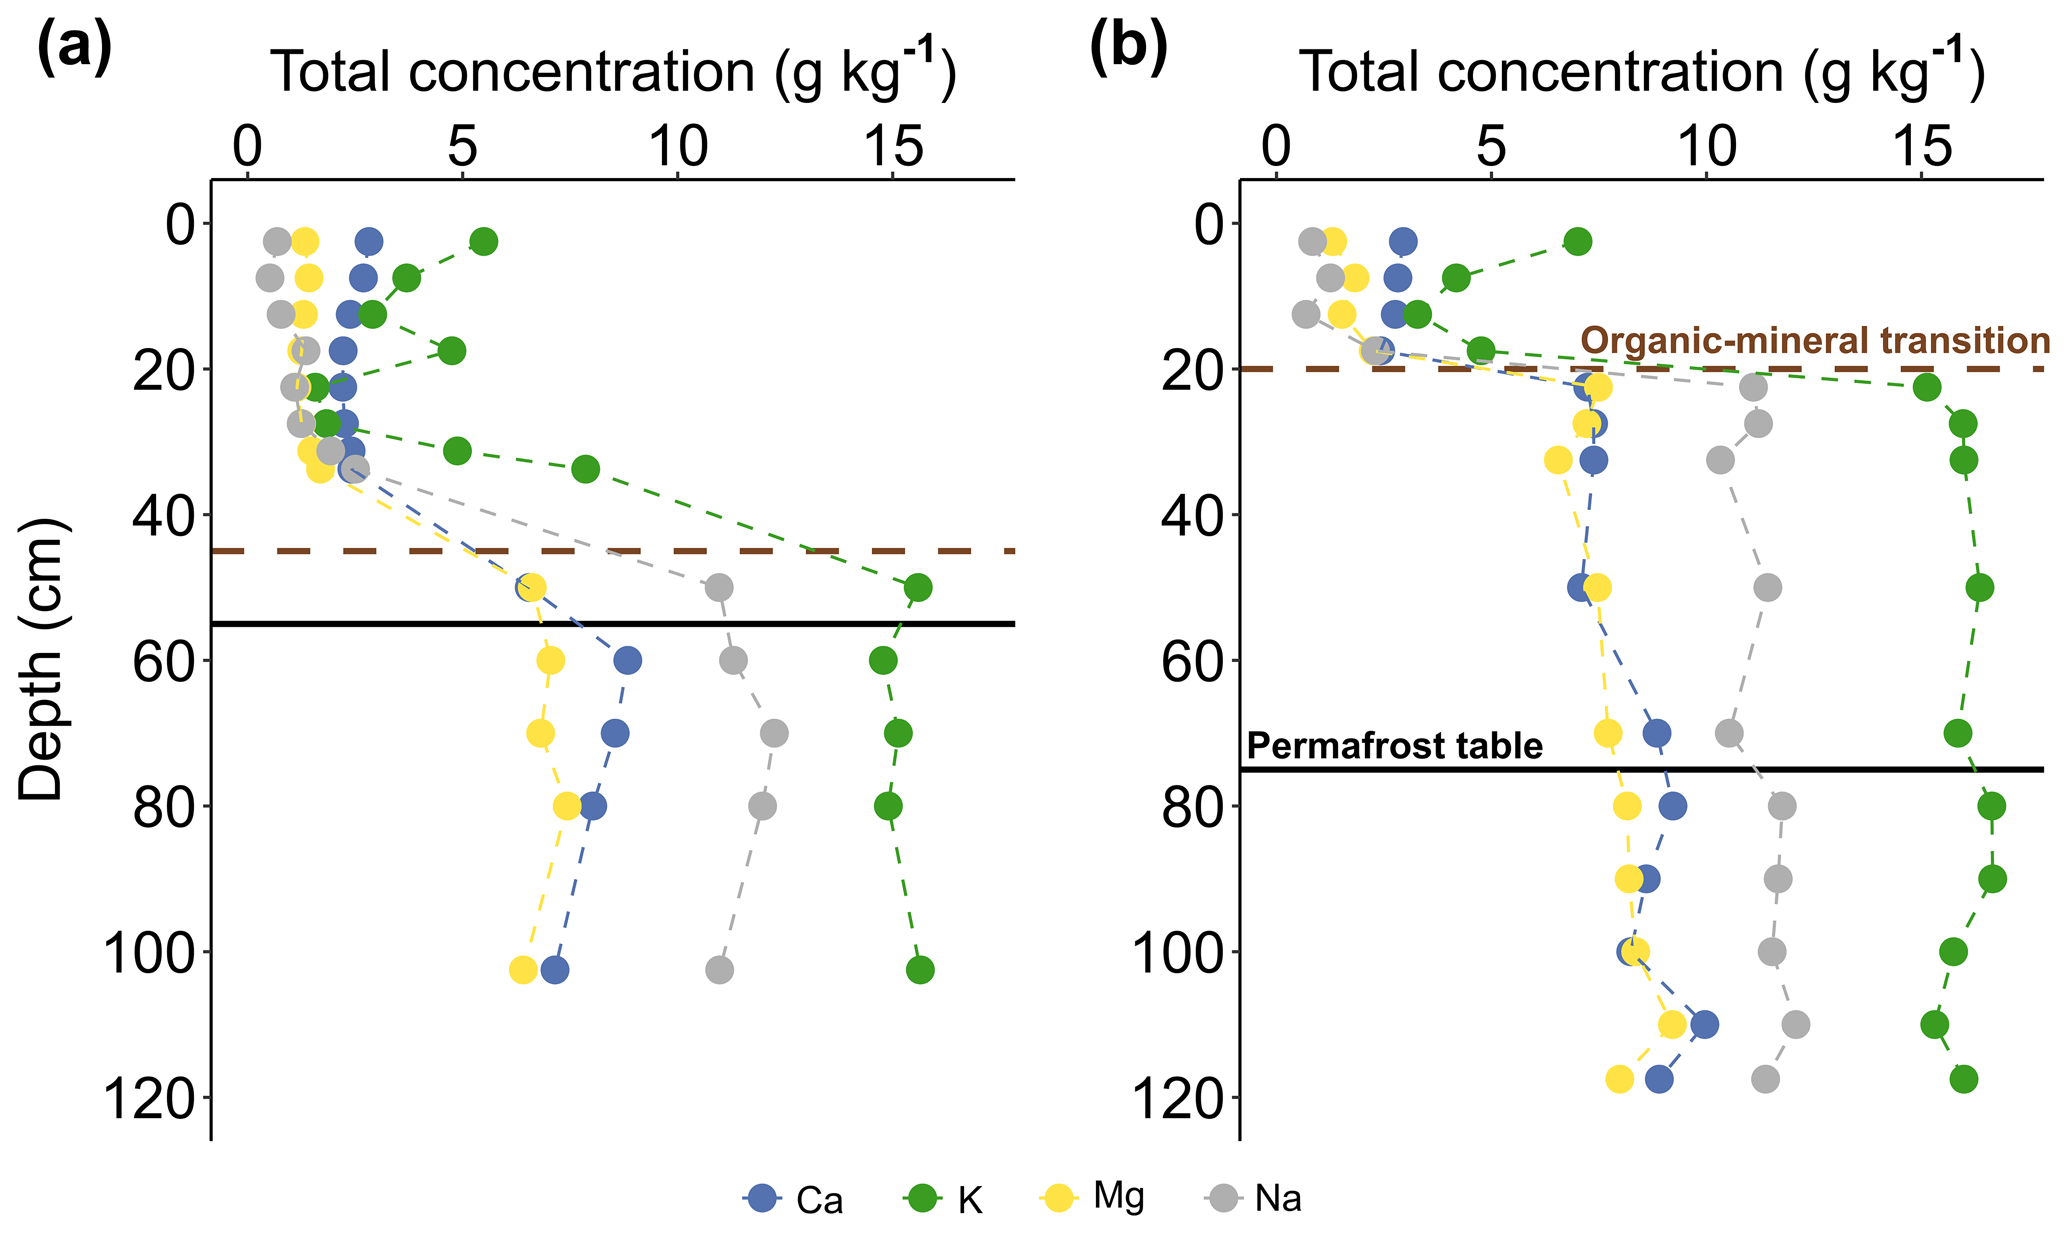
Figure 4Distribution of total concentrations of Ca, K, Mg, and Na (g kg−1) in an organic-thick soil profile (Min1) and an organic-thin soil profile (Mod3). The permafrost table is indicated by the solid black line, and the transition between the organic soil (SOC ≥20 %) and mineral (SOC <20 %) soil is indicated by the dashed brown line.
3.2 Variation of the soil exchange properties along permafrost soil profiles
3.2.1 Change in CEC distribution and CEC density with soil constituents
Given that the distribution of soil CEC follows the SOC content distribution (R2=0.91), high CEC values are more deeply distributed in the organic-thick profile (OLT ≥40 cm) than in the organic-thin (OLT <40 cm) permafrost soil profiles (Fig. 5a). Moreover, CEC in the organic active layer is significantly higher than in the mineral active layer (4 times, p value <0.001) and significantly higher than in permafrost (5 times, p value <0.001), whereas CEC values are not significantly different (p value >0.1) between the mineral active layer and permafrost. Overall, our CEC values measured in organic horizons ( cmolc kg−1) and mineral horizons ( cmolc kg−1; data from Table S2) are in the same range as the values reported in Arctic tundra soils underlain by permafrost (Ping et al., 2005, 1998; CEC of cmolc kg−1 for organic soil layers and of cmolc kg−1 for mineral soil layers). Locally, we observe CEC values at 60–80 cm that are 1.5 times higher in organic-thick profiles than in organic-thin soil profiles (Fig. 5a), and this reflects deep organic inclusions in organic-thick soil profiles (Fig. 3). Below the organic–mineral transition, given that the concentration in organic carbon decreases and the presence of clay minerals is verified (vermiculite, kaolinite, and illite; Mauclet et al., 2023), the contribution from the clay minerals to the CEC increases.
Furthermore, soil CEC is dictated by the presence of variable charges provided by organic matter, some clay minerals, and Fe and Al oxides. While the organic matter is usually associated with a variable charge, clay minerals are assumed to have both constant and variable charges (Kamprath and Smyth, 2005; Weil and Brady, 2016). As the strength of the variable charge depends on ionic strength and pH, chemical soil environment directly influences the soil variable charge and thereby the soil CEC. In our soils, the average pH oscillates between ∼4.0 in surface horizons and ∼5.3 at depth (Table S2). The low pH in the organic-rich soil surface (pH) is expected to reduce the number of negatively charged exchange sites on the variable charge components (i.e., organic matter and clay minerals as kaolinite) and thereby reduce the effective CEC compared to the deep mineral horizons with higher pH (pH) and less variable charge components (Bigorre et al., 2000).
We observe peaks in potential CEC at about 25 cm depth in organic-thick soil profiles (Fig. 5a) that seem to be correlated with the water table depth (27±8.4 cm). An accumulation of Fe oxides at the level of the water table (Fig. S1 in the Supplement) can be explained by the translocation of reduced Fe upon water-saturated conditions and Fe oxide precipitation in favorable oxic conditions at the redox interface (Herndon et al., 2017; Monhonval et al., 2021). The increase in potential CEC can therefore be explained by a methodologically induced potential CEC associated with negative charges created on Fe oxides at the pH buffered at 7 in the method (Metson, 1956) but not present in the soil at a pH of ∼4.
Unlike the distribution of CEC values within soil profile, CEC density shows lower values in the organic active layers ( cmolc m−3) than in the mineral soil horizons ( cmolc m−3 for mineral active layer; cmolc m−3 for permafrost) (Table S2). More specifically, estimates for CEC density increase along the organic active layer and stabilize in the mineral soil horizons (Fig. 5b). When we integrate the CEC density over the permafrost soil profile top meter, organic-thick soil profiles have lower CEC stock (∼12 000 cmolc m−2) than the organic-thin soil profiles (∼14 000 cmolc m−2). This is mainly explained by the difference in organic matter contribution to the total CEC stock: the uppermost 40 cm of the organic-thick soil profiles has lower CEC stock (∼3500 cmolc m−2) than the organic-thin soil profiles (∼5000 cmolc m−2).
The major increase in the estimates for CEC density in mineral horizons relative to organic horizons is driven by the massive change in bulk density. The increase in soil bulk density with depth overcomes the lower CEC values and results in higher estimates for CEC density. Within the top soil meter, the organic active layer in the organic-thin soil profile generates a higher contribution of clay mineral to the CEC density than the organic active layer in the organic-thick soil profile. Overall, our results support the fact that SOM accumulation in surface horizons influences the distribution of CEC density in permafrost soil profiles (Fig. 5b).
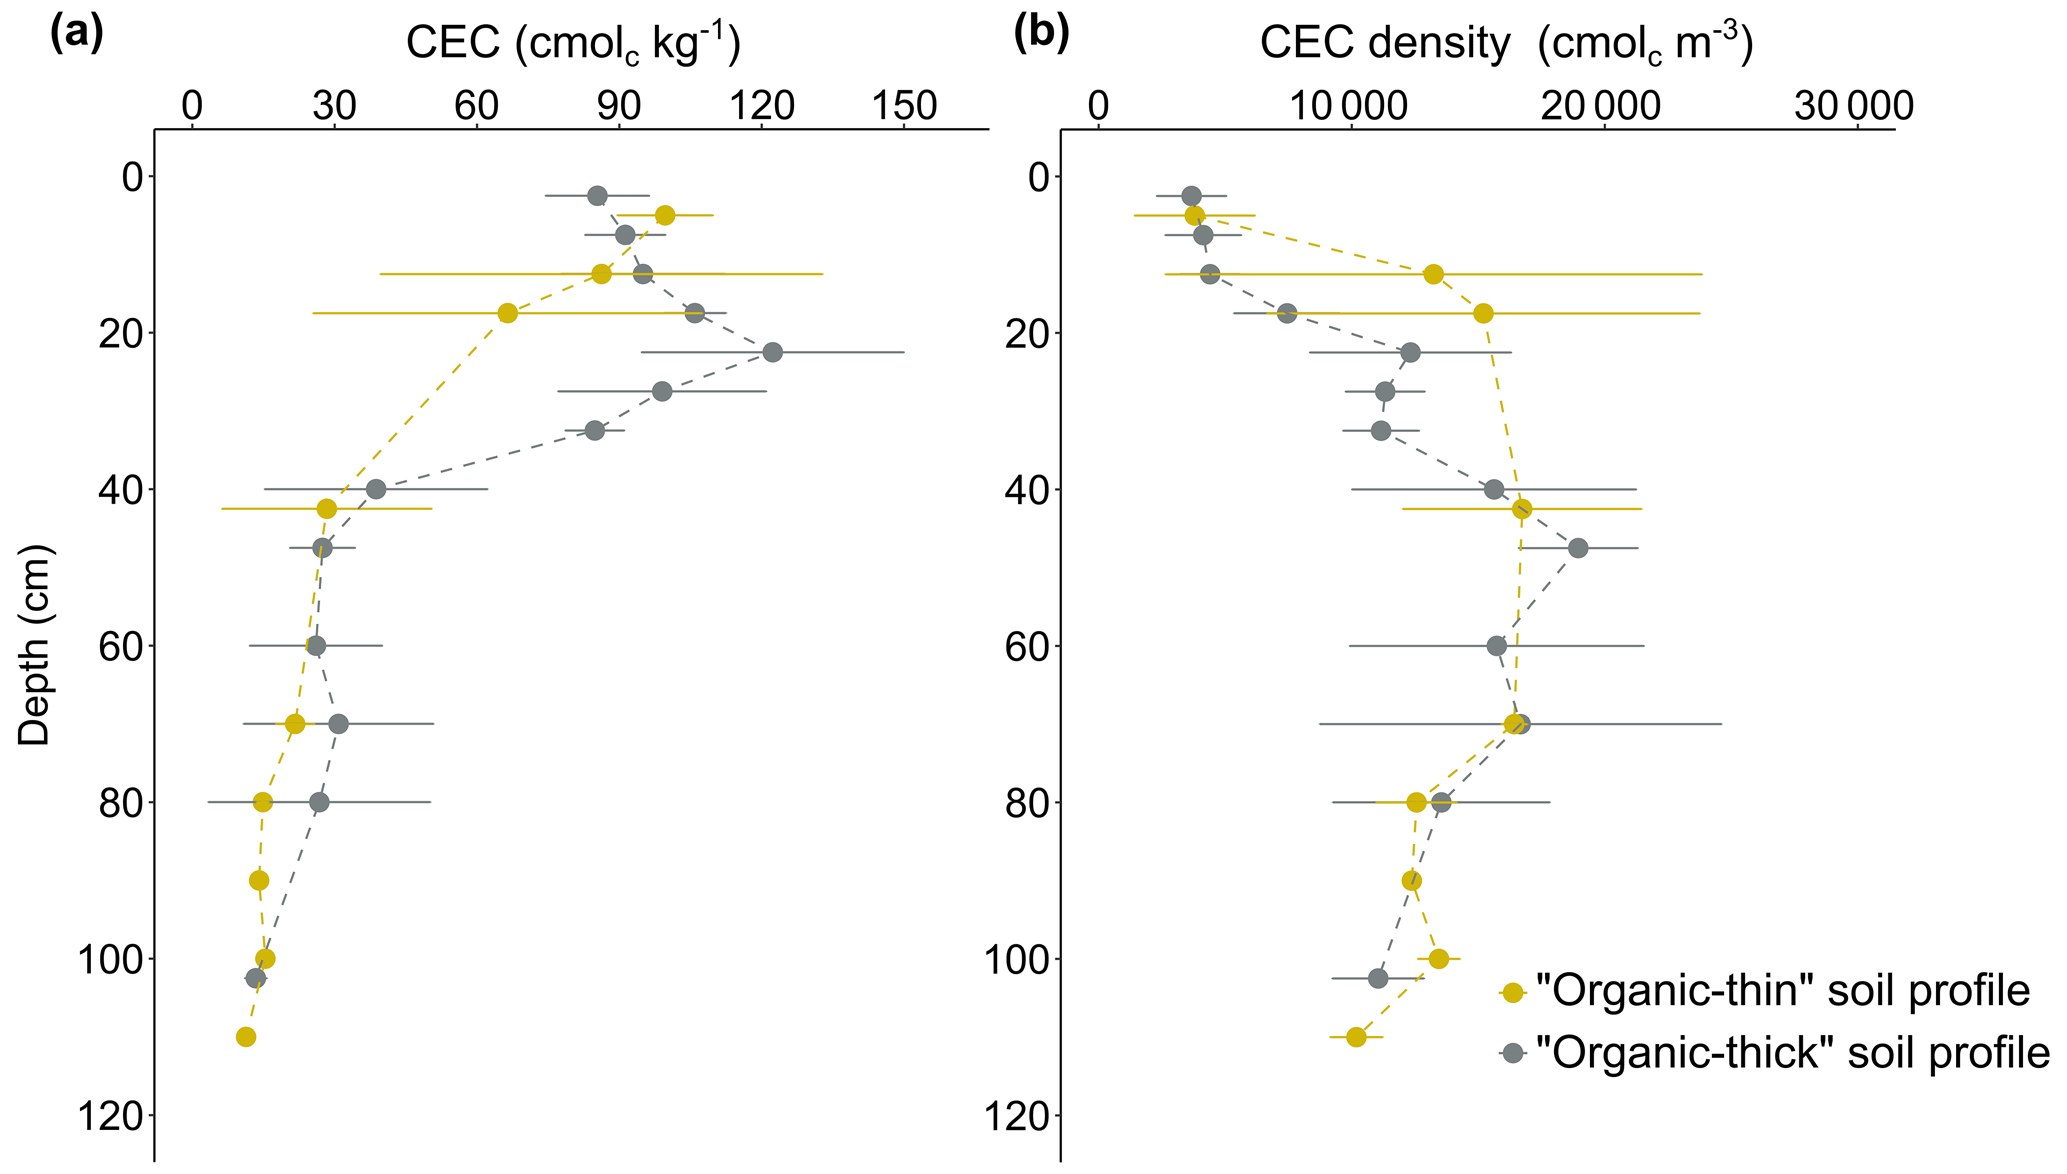
Figure 5(a) Distribution of the soil cation exchange capacity (CEC, in cmolc kg−1) and (b) distribution of the density of soil cation exchange capacity (CEC density, in cmolc m−3) with depth between organic-thin (in orange, n=34) and organic-thick (in grey, n=51) permafrost soil profiles. The error bars (horizontal lines) represent the standard deviation of the mean values (of three to seven samples).
3.2.2 Variation in base saturation (BS), pH, and total reserve in bases (TRB) along soil profiles
Within permafrost soils at EML, we observe a significant decrease in the base saturation (BS, percentage of CEC occupied by exchangeable base cations Ca2+, K+, Mg2+, and Na+) of the soil exchange complex in the organic active layer relative to the mineral active layer (2 times, p value <0.001) or relative to permafrost (3 times, p value <0.001), whereas permafrost is 2 times lower (p value <0.01) than the mineral active layer (Fig. 6a). On average, active layers show base saturation around ∼19 % in the organic soil surface and ∼35 % in the underlying mineral horizons, while permafrost soil horizons show base saturation around ∼62 % (Table S3).
The distribution of BS along permafrost soil profiles shows a positive linear relation with soil pH (R2=0.67, Fig. 6b), well in line with previous studies across various ecosystems (Beery and Wilding, 1971; Binkley et al., 1989; Giesler et al., 1998; Thomas, 2019), including the Arctic (Ping et al., 2005). This reflects the balance between acid cations and base cations in the soil exchange complex. As the BS contributes to the soil buffer capacity (Bowman et al., 2008; Tian and Niu, 2015; Ulrich, 1983), the more acidic conditions in the permafrost soil surface (pH) reveal lower soil buffer capacity and thereby lower BS (black dots in Fig. 7). In contrast, less acidic soil conditions at depth (pH) reflect higher soil buffer capacity and thereby higher BS. The lower values of pHKCl (between 3.29 in surface horizons and 4.47 at depth) than pH (between 4.02 in surface horizons and 5.27 at depth; Table S2) also support the presence of exchangeable acid cations adsorbed onto the soil exchange complex.
The difference in BS between the organic soil surface and the deep permafrost soil likely reflects the increase in the weatherable mineral reserve in the soil with depth, quantified by the total reserve in bases (TRB, sum of total concentration in Ca, K, Mg, and Na; Herbillon, 1986). The TRB is significantly lower (3 times, p value <0.01) in the organic active layer than in the mineral active layer or than in the permafrost (4 times, p value <0.01), whereas TRB is not significantly different (p value >0.1) between the mineral active layer and permafrost. The net increase in TRB with depth (higher values in the mineral active layer and permafrost of ∼180 cmolc kg−1 than in the organic active layer of ∼52 cmolc kg−1, Table S3) follows the organo–mineral transition and reflects higher soil reservoirs of total Ca, K, Mg, and Na in the mineral soil layers compared to the organic active layer. In particular, BS in the mineral soil horizons increases gradually between the mineral active layer, the upper permafrost horizons, and the deep permafrost horizons (Fig. 6a), whereas the TRB remains constant (Fig. 6c). This likely reflects the influence of permafrost thaw on the leaching of exchangeable base cations (Ca2+, K+, Mg2+, and Na+) that are soluble cations. The seasonally thawed mineral active layer is subject to more cation leaching than the upper permafrost (potentially thawed upon exceptional previous warming) and more than the deep permafrost.
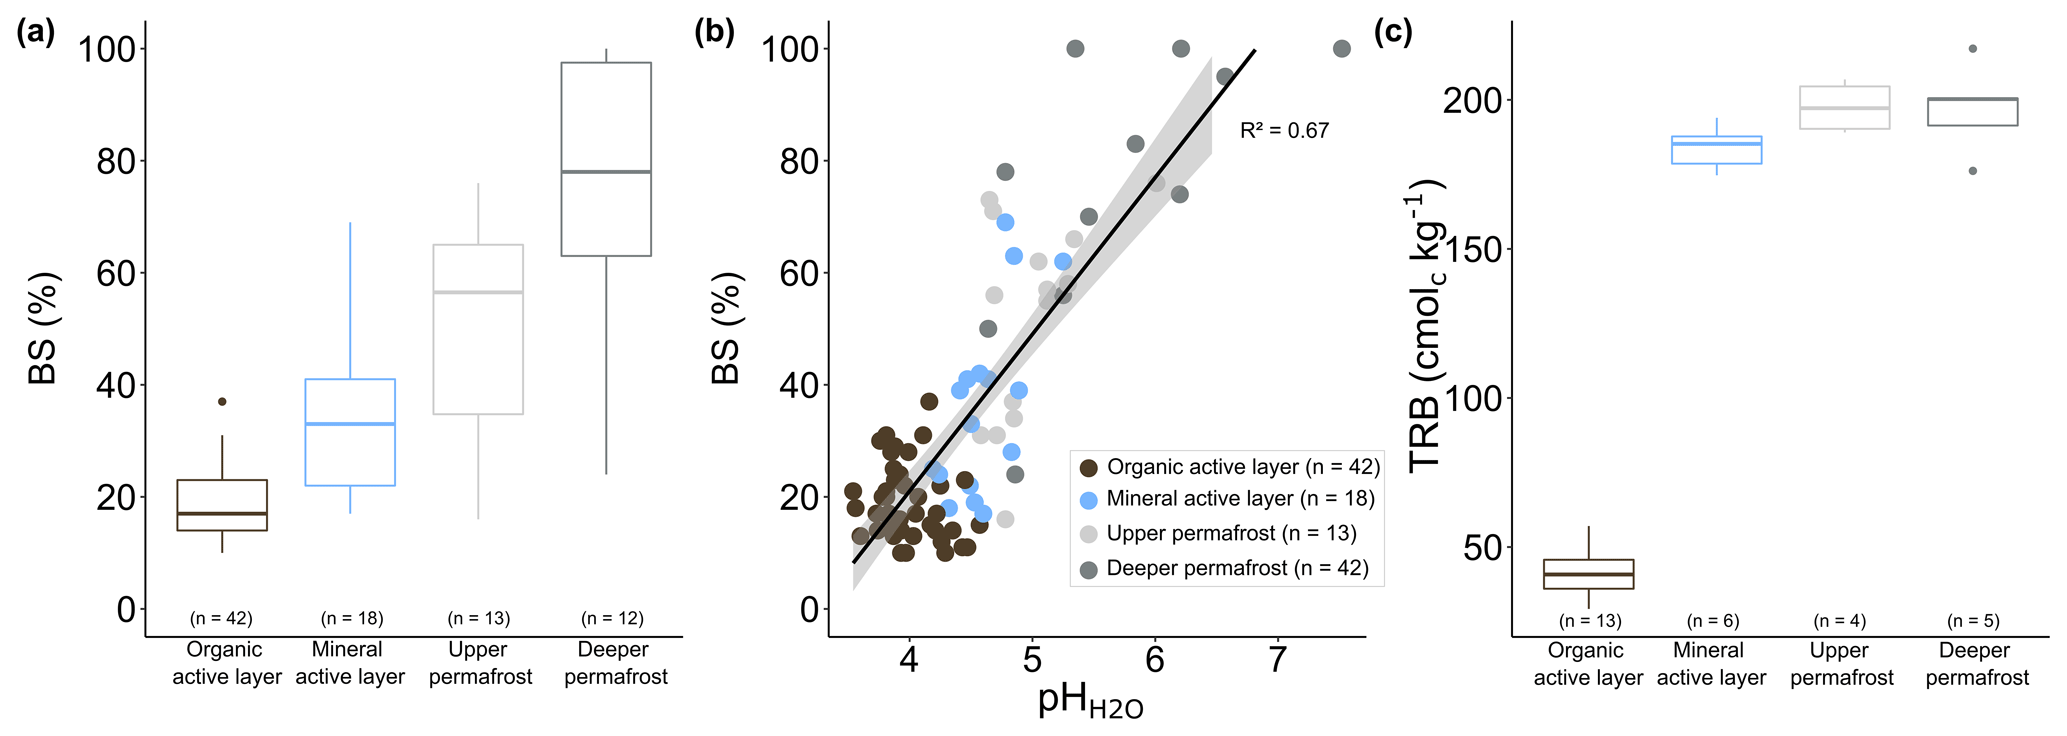
Figure 6(a) Distribution of base saturation (BS, in %) represented as boxplots, (b) linear correlation between BS and soil pH, and (c) distribution of the total reserve in base (TRB in cmolc kg−1; Herbillon, 1986) represented as boxplots in organic (brown) and mineral (blue) active layers, as well as in upper (light grey) and deeper (dark grey) permafrost. The upper permafrost consists of soil samples less than 20 cm below the permafrost table, and the deeper permafrost consists of soil samples at least 20 cm below the permafrost table. In each boxplot, the horizontal line represents the median, the end of the box is the 25 %–75 % quartiles, and whiskers are the 1.5 interquartile ranges from the median. Data points outside of the 1.5 interquartile ranges are represented as dots.
3.2.3 Change in the distribution of exchangeable base cations
The fractions of exchangeable base cations (considered readily available for plant uptake) over the total concentration of these elements in soils are significantly higher in the organic layer than in the mineral active layer (between 3 and 17 times, p value <0.001) or than in the permafrost (between 6 and 35 times, p value <0.001), whereas these fractions are not significantly different between the mineral active layer and permafrost (p value >0.1). On average, from the total Ca, K, Mg, and Na concentrations, we observe that ∼74 %, ∼16 %, ∼47 %, and ∼32 % are exchangeable in organic soil layers and ∼17 %, <1 %, ∼5.5 %, and ∼2.1 % are exchangeable in mineral soil layers, respectively (Table S3). These results are well in line with the proportions of exchangeable base cations reported for an Alaskan tundra site, such as >70 % for Caexch and 18 % of Kexch in organic soil horizons and ∼23 % for Caexch and 1 % for Kexch in mineral soil horizons (Chapin et al., 1979).
We observe the same trend for the stock (in g m−2, numbers in Fig. 7) where exchangeable base cation stock in the organic layer is significantly lower than in the mineral active layer (8 times, p value <0.001) or than in the permafrost (7 times, p value <0.001), whereas stocks are not significantly different (p value >0.1) between the mineral active layer and permafrost. The stocks are higher where layers are thicker: the mineral active layer is enriched in exchangeable cations from 75 to 845 g m−2 (from 5 to 78 cm thick, Fig. 7a to d), and the permafrost layer is depleted in exchangeable cations from 606 to 198 g m−2 (from 40 to 12 cm thick, Fig. 7a to d). These results are mainly explained by the layer thicknesses that are different between soil profiles: the stock is higher where layers are thicker. To be able to investigate the “potential” stocks of exchangeable cations independent to the soil thickness, we converted the concentrations in exchangeable base cations into exchangeable base cation density (in g m−3, Fig. 7). At EML, permafrost soil profiles show an increase in exchangeable base cation density (Ca2+, K+, Mg2+, and Na+, in g m−3) with depth that follows the increase in BS (Fig. 7). On average, each exchangeable base cation density significantly increases from organic active layer to permafrost (5 times, p value <0.001), from 180 to 900 g m−3 for Ca2+, from 51 to 55 g m−3 for K+, from 62 to 250 g m−3 for Mg2+, and from 22 to 140 g m−3 for Na+ (Table S4), considering a higher variability in the estimation for mineral than for organic soils according to the bulk density estimates (Fig. 2). Furthermore, we observe a difference between the organic-thick soil profiles (Fig. 7a–b) and organic-thin soil profiles (Fig. 7c–d): exchangeable base cation density of the organic layer is 1.3 times higher in organic-thick than organic-thin soil profiles, whereas exchangeable base cation density of the mineral layer is 1.5 times lower in organic-thick than organic-thin soil profiles.
Overall, the distribution of exchangeable base cation density follows the soil distribution of CEC density and BS and results in a reserve in exchangeable base cations (Σ CaKMgNa+) that is 5 times higher at depth than in surface horizons. Upon warming, permafrost thaw exposes deeper permafrost soil horizons to above-zero temperatures and thereby increases the potential soil capacity to retain base cations readily available for plant uptake (i.e., soil CEC density). This provides a newly thawed pool of nutrient base cations that can be sensitive to leaching. There is an increase in exchangeable cation density (independent of the thickness layer) in the mineral active layer at the organic-thin (∼1100 g m−3) compared to organic-thick (∼500 g m−3) soil profiles. As Arctic ecosystems only rely on active layer thickness in providing essential nutrients to sustain vegetation growth and development (Iversen et al., 2015; Ping et al., 1998), the contrast in nutrient base cations between the organic and the mineral parts of the active layer is of great importance for changes in tundra vegetation productivity.
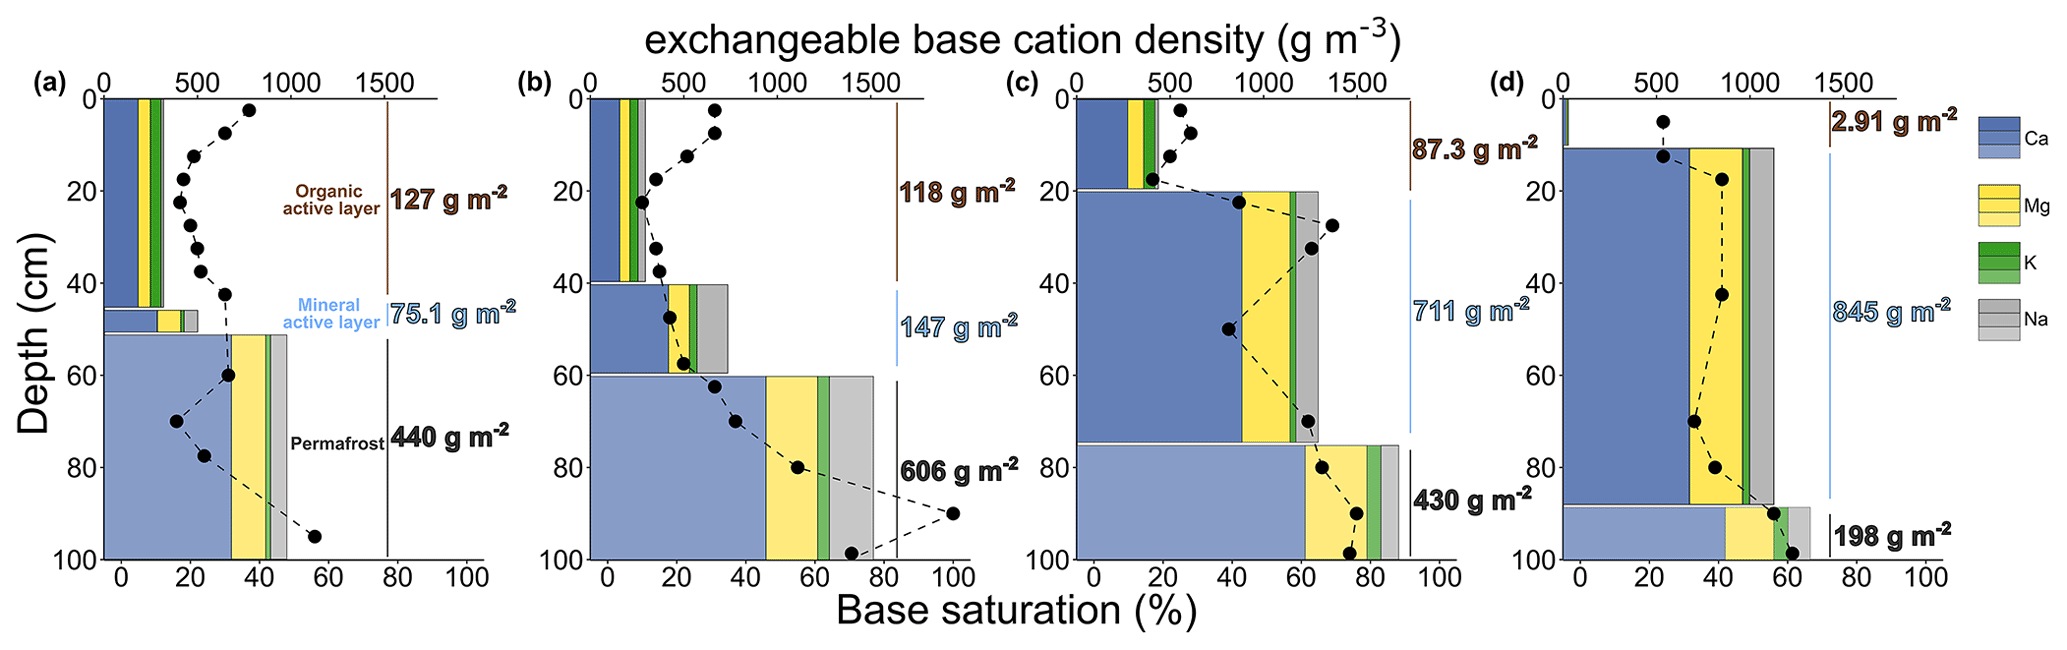
Figure 7Distribution of exchangeable base cation density (Ca2+, Mg2+, K+, and Na+; bar plots; in g m−3) and stock (numbers, in g m−2) and base saturation (black dots) along (a–b) two organic-thick (Mod1 n=13 and Min3 n=14, respectively) and (c–d) two organic-thin soil profiles (Mod3 n=12 and Mod2 n=8, respectively).
3.3 Influence of vegetation nutrient cycling on the exchangeable base cation density within permafrost soil profiles
In this section, we investigate the ecological influence of vegetation nutrient uptake and cycling on the distribution of specific exchangeable base cation density (Fig. 7, in g m−3) within permafrost soil profiles. When looking at the density of the four exchangeable base cations individually, we observe different trends in their vertical distributions into active layer soil horizons. Density in exchangeable Ca, Mg, and Na is low in the organic part of the active layer and significantly increases (p value <0.001) with depth, even if the variability in bulk density is higher in mineral horizons (Fig. 2). On average, these densities are about 4 times lower (for Caexch and Mgexch) and 5 times lower (for Naexch) in organic horizons than in mineral active layer horizons. Conversely, density in Kexch is 1.4 times higher in the organic than in mineral active layer horizons. As the exchangeable base cation densities follow the transition between organic and mineral soil horizons, the low (for Caexch, Mgexch, and Naexch) and high (for Kexch) values of density are more deeply distributed in organic-thick than in organic-thin permafrost soils.
While the distributions in Caexch, Mgexch, and Naexch densities with depth reflect a depletion in nutrient base cations within the organic soil surface relative to the mineral soil horizon, the singular vertical distribution of Kexch across the active layer suggests a nutrient uplift through plant nutrient uptake and cycling, known as the biolifting process (Jobbágy and Jackson, 2001). Our results are consistent with the vertical distribution reported in the literature for available nutrients from shallowest to deepest soil horizons across a wide variety of ecological conditions in the following order: Kexch> Caexch> Mgexch> Naexch (Jobbágy and Jackson, 2001). This supports the key role of plant cycling in the vertical distribution of plant nutrients such as K and thereby in the vegetation production and development within nutrient-limited ecosystems (Flanagan and Cleve, 1983; Hobbie, 1992; Hobbie et al., 2002; Nadelhoffer et al., 1992; Poszwa et al., 2000).
3.4 Projection of exchangeable base cations upon permafrost thaw: a new source of nutrients for vegetation
Upon projected permafrost thaw at EML (Garnello et al., 2021), the upper permafrost (0–20 cm below the permafrost table) will undoubtedly thaw and expose soil (total and exchangeable) constituents by 2100. In the upper permafrost layer (0–20 cm below the permafrost table), we measured exchangeable base cation density up to 850 g m−3 of Caexch, 45 g m−3 of Kexch, 200 g m−3 of Mgexch, and 150 g m−3 of Naexch (Table S4). This represents a stock in exchangeable base cations of up to 340 g m−2 in the 20 cm thick permafrost layer (170 g m−2 from Fig. 7a, 320 g m−2 for Fig. 7b, 340 g m−2 for Fig. 7c, and 200 g m−2 for Fig. 7d). Upon permafrost thaw, these reservoirs of nutrient base cations initially locked will progressively be released and available for plants and microbial activity.
Plants need essential (such as Ca, Mg, K, N, S, and P) and beneficial (such as Na, Si, and Co) nutrients for their growth because they support physiological functions in the vegetation, such as biomolecule formation, process regulation, and metabolic reactions (Marschner, 2012). The potential release of available nutrient stocks at depth is then expected to increase vegetation production and contribute to the ongoing Arctic greening (Keuper et al., 2017; Keyser et al., 2000; Nadelhoffer et al., 1991; Sistla et al., 2013). More specifically, nutrient addition can decrease species richness and diversity and shift the plant community toward dominance by dwarf birch, Betula nana, and a forb, Rubus chamaemorus (Gough et al., 2015). With different nutrient requirements for each species, changes in nutrient distribution (higher at depth) may also influence the tundra plant species and thereby also contribute to the shift in vegetation observed across the Arctic (Chapin et al., 1995; Schuur et al., 2007; Mauclet et al., 2022a; van der Kolk et al., 2016; Villani et al., 2022). For instance, the more deeply rooted graminoids first access the newly thawed soil horizons at depth (Hewitt et al., 2019) and thereby first benefit from these newly thawed pools of nutrients. Nevertheless, plant strategies are complex, and woody shrubs may also benefit from the deep release of nutrients upon further graminoid nutrient cycling and the nutrient transfer from deep soil horizons to surface litterfall deposition (Mauclet et al., 2023). Permafrost thaw also creates localized variability in moisture conditions as thermokarst areas accumulate moisture while higher areas become drier (Jorgenson and Osterkamp, 2005). This has direct effects on plant species composition that follows the altered moisture regime, thereby influencing spatial variability of nutrients. As changes in Arctic tundra vegetation composition and productivity may generate important feedbacks on climate change (Heijmans et al., 2022), our estimations in exchangeable cations within permafrost may be useful for future ecosystem models simulating the evolution of vegetation development and microbial activity upon permafrost thaw (Fisher et al., 2014; Koyama et al., 2014; Sulman et al., 2021; van der Kolk et al., 2016).
All data described in this paper are stored in Dataverse, the online repository of Université catholique de Louvain, and accessible through the following DOI: https://doi.org/10.14428/DVN/FQVMEP (Mauclet et al., 2022b).
We characterized the variability with depth of the soil exchange complex properties across a permafrost thaw gradient (constituents, cation exchange capacity, base saturation), and we quantified the exchangeable cation stocks and densities in the permafrost relative to the seasonally thawed active layer (organic and mineral active layer). The main conclusions are the following:
- i.
The base saturation of the soil exchange complex is the highest in permafrost (∼62 %). In the active layer, the base saturation is lower in the organic part (∼19 %) than in the mineral part (∼35 %).
- ii.
Despite their low OC content and low CEC values, the mineral active layer and the permafrost present a higher CEC density (∼16 000 cmolc m−3 for mineral active layer; ∼12 000 cmolc m−3 for permafrost) than the organic active layer horizons (∼9400 cmolc m−3). This can be explained by the higher bulk density in mineral than in organic soil horizons, even if the bulk density estimation is more variable in mineral than in organic horizons.
- iii.
As a result of the overall increase in base saturation with depth and the overall increase in CEC density with depth, exchangeable base cation density (Ca2+, K+, Mg2+, and Na+ in g m−3) is more than 5 times higher in the permafrost than in the active layer. These findings highlight that the availability of nutrient base cations increases with active layer deepening.
- iv.
The permafrost layer which is predicted to thaw by 2100 (i.e., up to 20 cm below the permafrost table) contains 860 g m−3 of Caexch, 45 g m−3 of Kexch, 200 g m−3 of Mgexch, and 150 g m−3 of Naexch as exchangeable base cation density. These values are needed for ecosystem models to better constrain the size of the reservoir in exchangeable nutrients (Ca2+, K+, Mg2+, and Na+) in the upper permafrost about to thaw.
This study provides a first-order estimate of a reservoir about to thaw and expected to contribute to supply nutrients for vegetation development and microbial activity. The contrast highlighted here in nutrient base cation density between the organic and the mineral parts of the active layer, as well as the permafrost about to thaw, is key for changes in tundra vegetation productivity, given that Arctic ecosystems depend on active layer thickness to provide essential nutrients to sustain vegetation growth and development (Iversen et al., 2015; Ping et al., 1998).
The supplement related to this article is available online at: https://doi.org/10.5194/essd-15-3891-2023-supplement.
EM and MV are first co-authors, cited in alphabetic order. EM and SO conceived the project. EM, AM, and CH collected the samples in Alaska, USA. EM and AM did the elemental analysis and the total organic carbon measurements. MV and EM did the measurements of pH, CEC, and exchangeable bases. EM and MV analyzed the data and calculated the stocks and densities. EM and MV wrote the paper with contributions from all co-authors.
The contact author has declared that none of the authors has any competing interests.
Publisher’s note: Copernicus Publications remains neutral with regard to jurisdictional claims in published maps and institutional affiliations.
We thank Simon Malvaux, Merlin Gérard, Maxime Thomas, Yannick Agnan, Sébastien François, and the WeThaw team at Université catholique de Louvain (UCLouvain) for valuable scientific exchanges and their help in the field and in the lab. We acknowledge the MOCA analytical platform at UCLouvain for the analyses: Anne Iserentant, Claudine Givron, Hélène Dailly, Laurence Monin, and Elodie Devos. We also thank Justin Ledman and the Schuur Lab (Northern Arizona University, Flagstaff, USA) for their scientific support and their help with site selection. We thank the associate editors Chaoqun Lu and Hanqin Tian as well as Matthias Siewert, Chaoqun Lu, and one anonymous reviewer for their constructive comments.
This work was supported by the European Union's Horizon 2020 research and innovation program (grant agreement No. 714617, 2017–2022) and by the Fund for Scientific Research FNRS in Belgium to Sophie Opfergelt (FC69480) and Maëlle Villani (FC49507).
This paper was edited by Chaoqun Lu and reviewed by Matthias Siewert, Chaoqun Lu, and one anonymous referee.
Adams, W. A.: The effect of organic matter on the bulk and true densities of some uncultivated podzolic soils, J. Soil Sci., 24, 10–17, https://doi.org/10.1111/j.1365-2389.1973.tb00737.x, 1973.
Askin, T. and Özdemir, N.: Soil bulk density as related to soil particle size distribution and organic matter content, Poljoprivreda/Agriculture, 9, 52–55, 2003.
Beermann, F., Langer, M., Wetterich, S., Strauss, J., Boike, J., Fiencke, C., Schirrmeister, L., Pfeiffer, E.-M., and Kutzbach, L.: Permafrost Thaw and Liberation of Inorganic Nitrogen in Eastern Siberia: Permafrost thaw and nitrogen release, Permafrost Periglac., 28, 605–618, https://doi.org/10.1002/ppp.1958, 2017.
Beery, M. and Wilding, L. P.: The relationship between soil pH and base-saturation percentage for surface and subsoil horizons of selected Mollisols, Alfisols, and Ultisols in Ohio, Ohio J. Sci., 71, 43–55, 1971.
Bigorre, F., Tessier, D., and Pédro, G.: Contribution des argiles et des matières organiques: la retention de I'eau dans les sols. Signification et rôle fondamental de la capacite d'échange en cations, Comptes Rendus de l'Académie des Sciences-Series IIA-Earth and Planetary Science, 330, 245–250, https://doi.org/10.1016/S1251-8050(00)00136-1, 2000.
Binkley, D. and Vitousek, P.: Soil nutrient availability, in: Plant Physiological Ecology, edited by: Pearcy, R. W., Ehleringer, J. R., Mooney, H. A., and Rundel, P. W., Springer Netherlands, Dordrecht, 75–96, https://doi.org/10.1007/978-94-009-2221-1_5, 1989.
Binkley, D., Valentine, D., Wells, C., and Valentine, U.: An empirical analysis of the factors contributing to 20-year decrease in soil pH in an old-field plantation of loblolly pine, Biogeochemistry, 8, 39–54, https://doi.org/10.1007/BF02180166, 1989.
Blume-Werry, G., Milbau, A., Teuber, L. M., Johansson, M., and Dorrepaal, E.: Dwelling in the deep – strongly increased root growth and rooting depth enhance plant interactions with thawing permafrost soil, New Phytol., 223, 1328–1339, https://doi.org/10.1111/nph.15903, 2019.
Bockheim, J. G. and Hinkel, K. M.: The Importance of “Deep” Organic Carbon in Permafrost-Affected Soils of Arctic Alaska, Soil Sci. Soc. Am. J., 71, 1889–1892, https://doi.org/10.2136/sssaj2007.0070N, 2007.
Bowman, W. D., Cleveland, C. C., Halada, Ĺ., Hreško, J., and Baron, J. S.: Negative impact of nitrogen deposition on soil buffering capacity, Nat. Geosci., 1, 767–770, https://doi.org/10.1038/ngeo339, 2008.
Chao, T. T. and Sanzolone, R. F.: Decomposition techniques, J. Geochem. Explor., 44, 65–106, 1992.
Chapin, F. S., van Cleve, K., and Chapin, M. C.: Soil temperature and nutrient cycling in the tussock growth form of Eriophorum vaginatum, J. Ecol., 67, 169–189, https://doi.org/10.2307/2259343, 1979.
Chapin, F. S., Shaver, G. R., Giblin, A. E., Nadelhoffer, K. J., and Laundre, J. A.: Responses of Arctic tundra to experimental and observed changes in climate, Ecology, 76, 694–711, https://doi.org/10.2307/1939337, 1995.
Chaudhari, P. R., Ahire, D. V., Ahire, V. D., Chkravarty, M., and Maity, S.: Soil Bulk Density as related to soil texture, organic matter content and available total nutrients of coimbatore soil, International Journal of Scientific and Research Publications, 3, 1–8, 2013.
Christensen, T. R., Jonasson, S., Callaghan, T. V., and Havström, M.: On the potential CO2 release from tundra soils in a changing climate, Appl. Soil Ecol., 11, 127–134, https://doi.org/10.1016/S0929-1393(98)00146-2, 1999.
Deane-Coe, K. K., Mauritz, M., Celis, G., Salmon, V., Crummer, K. G., Natali, S. M., and Schuur, E. A. G.: Experimental warming alters productivity and isotopic signatures of tundra mosses, Ecosystems, 18, 1070–1082, https://doi.org/10.1007/s10021-015-9884-7, 2015.
Decharme, B., Brun, E., Boone, A., Delire, C., Le Moigne, P., and Morin, S.: Impacts of snow and organic soils parameterization on northern Eurasian soil temperature profiles simulated by the ISBA land surface model, The Cryosphere, 10, 853–877, https://doi.org/10.5194/tc-10-853-2016, 2016.
Doran, J. W. and Safley, M.: Defining and assessing soil health and sustainable productivity, in: Biological Indicators of Soil Health, CAB International, New-York, 1997.
Farouki, O. T.: The thermal properties of soils in cold regions, Cold Reg. Sci. Technol., 5, 67–75, https://doi.org/10.1016/0165-232X(81)90041-0, 1981.
Feller, C., Albrecht, A., and Tessier, D.: Aggregation and organic matter storage in kaolinitic and smectitic tropical soils, in: Advances in Soil Science: Structure and organic matter storage in agicultural soils, Lewis Publishers: Boca Raton, 309–352, 1991.
Fisher, J. B., Sikka, M., Oechel, W. C., Huntzinger, D. N., Melton, J. R., Koven, C. D., Ahlström, A., Arain, M. A., Baker, I., Chen, J. M., Ciais, P., Davidson, C., Dietze, M., El-Masri, B., Hayes, D., Huntingford, C., Jain, A. K., Levy, P. E., Lomas, M. R., Poulter, B., Price, D., Sahoo, A. K., Schaefer, K., Tian, H., Tomelleri, E., Verbeeck, H., Viovy, N., Wania, R., Zeng, N., and Miller, C. E.: Carbon cycle uncertainty in the Alaskan Arctic, Biogeosciences, 11, 4271–4288, https://doi.org/10.5194/bg-11-4271-2014, 2014.
Flanagan, P. W. and Cleve, K. V.: Nutrient cycling in relation to decomposition and organic-matter quality in taiga ecosystems, Can. J. Forest Res., 13, 795–817, https://doi.org/10.1139/x83-110, 1983.
Garnello, A., Marchenko, S., Nicolsky, D., Romanovsky, V., Ledman, J., Celis, G., Schädel, C., Luo, Y., and Schuur, E. A. G.: Projecting Permafrost Thaw of Sub-Arctic Tundra With a Thermodynamic Model Calibrated to Site Measurements, J. Geophys. Res.-Biogeo., 126, e2020JG006218, https://doi.org/10.1029/2020JG006218, 2021.
Giesler, R., Högberg, M., and Högberg, P.: Soil chemistry and plants in fennoscandian boreal forest as exemplified by a local gradient, Ecology, 79, 119–137, https://doi.org/10.1890/0012-9658(1998)079[0119:SCAPIF]2.0.CO;2, 1998.
Gough, L., Heather, B., and McLaren, J. R.: Effects of increased soil nutrients on seed rain: a role for seed dispersal in the greening of the Arctic?, Arct. Antarct. Alp. Res., 47.1, 27–34, 2015.
Havlin, J. L.: Fertility, in: Encyclopedia of Soils in the Environment, Elsevier, 10–19, https://doi.org/10.1016/B0-12-348530-4/00228-9, 2005.
Heijmans, M. M. P. D., Magnússon, R. Í., Lara, M. J., Frost, G. V., Myers-Smith, I. H., van Huissteden, J., Jorgenson, M. T., Fedorov, A. N., Epstein, H. E., Lawrence, D. M., and Limpens, J.: Tundra vegetation change and impacts on permafrost, Nat. Rev. Earth Environ., 3, 68–84, https://doi.org/10.1038/s43017-021-00233-0, 2022.
Herbillon, A. J.: Chemical estimation of weatherable minerals present in the diagnostic horizon of low activity clay soils, Proceedings of the 8th International Classification Workshop: Classification, Characterization and Utilization of Ultisols, Part 1, Rio de Janeiro, 12–23 May 1986, 39–48, 1986.
Herndon, E., AlBashaireh, A., Singer, D., Roy Chowdhury, T., Gu, B., and Graham, D.: Influence of iron redox cycling on organo-mineral associations in Arctic tundra soil, Geochim. Cosmochim. Ac., 207, 210–231, https://doi.org/10.1016/j.gca.2017.02.034, 2017.
Hewitt, R. E., Taylor, D. L., Genet, H., McGuire, A. D., and Mack, M. C.: Below-ground plant traits influence tundra plant acquisition of newly thawed permafrost nitrogen, J. Ecol., 107, 950–962, https://doi.org/10.1111/1365-2745.13062, 2019.
Hicks Pries, C. E., Schuur, E. A. G., and Crummer, K. G.: Holocene carbon stocks and carbon accumulation rates altered in soils undergoing permafrost thaw, Ecosystems, 15, 162–173, https://doi.org/10.1007/s10021-011-9500-4, 2012.
Hinzman, L. D., Kane, D. L., Yoshikawa, K., Carr, A., Bolton, W. R., and Fraver, M.: Hydrological variations among watersheds with varying degrees of permafrost, in: Proceedings of the Eighth International Conference on Permafrost, Lisse, the Netherlands, Abingdon, UK, Tokyo, Japan, 21–25 July 2003, AA Balkema Publishers, 21–25, 2003.
Hirst, C., Mauclet, E., Monhonval, A., Tihon, E., Ledman, J., Schuur, E. A. G., and Opfergelt, S.: Seasonal Changes in Hydrology and Permafrost Degradation Control Mineral Element-Bound DOC Transport From Permafrost Soils to Streams, Global Biogeochem. Cy., 36, e2021GB007105, https://doi.org/10.1029/2021GB007105, 2022.
Hobbie, S. E.: Effects of plant species on nutrient cycling, Trends Ecol. Evol., 7, 336–339, https://doi.org/10.1016/0169-5347(92)90126-V, 1992.
Hobbie, S. E. and Chapin, F. S.: An experimental test of limits to tree establishment in Arctic tundra, J. Ecol., 86, 449–461, https://doi.org/10.1046/j.1365-2745.1998.00278.x, 1998.
Hobbie, S. E., Nadelhoffer, K. J., and Högberg, P.: A synthesis: The role of nutrients as constraints on carbon balances in boreal and arctic regions, Plant Soil, 242, 163–170, 2002.
Hugelius, G., Strauss, J., Zubrzycki, S., Harden, J. W., Schuur, E. A. G., Ping, C.-L., Schirrmeister, L., Grosse, G., Michaelson, G. J., Koven, C. D., O'Donnell, J. A., Elberling, B., Mishra, U., Camill, P., Yu, Z., Palmtag, J., and Kuhry, P.: Estimated stocks of circumpolar permafrost carbon with quantified uncertainty ranges and identified data gaps, Biogeosciences, 11, 6573–6593, https://doi.org/10.5194/bg-11-6573-2014, 2014.
Iversen, C. M., Sloan, V. L., Sullivan, P. F., Euskirchen, E. S., McGuire, A. D., Norby, R. J., Walker, A. P., Warren, J. M., and Wullschleger, S. D.: The unseen iceberg: plant roots in arctic tundra, New Phytol., 205, 34–58, https://doi.org/10.1111/nph.13003, 2015.
IUSS Working Group WRB: World Reference Base for Soil Resources 2014, update 2015 International soil classification system for naming soils and creating legends for soil maps, World Soil Resources Reports, FAO, Rome, 2015.
Jasinski, B., Schuur, E., and Mack, Mi. C.: Eight Mile Lake Research Watershed, Thaw Gradient: peak growing season aboveground biomass 2017, Bonanza Creek LTER – University of Alaska Fairbanks, BNZ: 705, https://doi.org/10.6073/pasta/40f9ae60d635e5aac0e562ee006d24e2, 2018.
Jobbágy, E. G. and Jackson, R. B.: The distribution of soil nutrients with depth: global patterns and the imprint of plants, Biogeochemistry, 53, 51–77, https://doi.org/10.1023/A:1010760720215, 2001.
Jorgenson, M. T. and Osterkamp, T. E.: Response of boreal ecosystems to varying modes of permafrost degradation, Can. J. Forest Res., 35, 2100–2111, 2005.
Kamprath, E. J. and Smyth, T. J.: LIMING, in: Encyclopedia of Soils in the Environment, Elsevier, 350–358, https://doi.org/10.1016/B0-12-348530-4/00225-3, 2005.
Kane, D. L., Hinzman, L. D., and Zarling, J. P.: Thermal response of the active layer to climatic warming in a permafrost environment, Cold Reg. Sci. Technol., 19, 111–122, https://doi.org/10.1016/0165-232X(91)90002-X, 1991.
Keuper, F., Dorrepaal, E., van Bodegom, P. M., van Logtestijn, R., Venhuizen, G., van Hal, J., and Aerts, R.: Experimentally increased nutrient availability at the permafrost thaw front selectively enhances biomass production of deep-rooting subarctic peatland species, Glob. Change Biol., 23, 4257–4266, https://doi.org/10.1111/gcb.13804, 2017.
Keyser, A. R., Kimball, J. S., Nemani, R. R., and Running, S. W.: Simulating the effects of climate change on the carbon balance of North American high-latitude forests: c balanceof high-latitude forests, Glob. Change Biol., 6, 185–195, https://doi.org/10.1046/j.1365-2486.2000.06020.x, 2000.
Koyama, A., Wallenstein, M. D., Simpson, R. T., and Moore, J. C.: Soil bacterial community composition altered by increased nutrient availability in Arctic tundra soils, Front. Microbiol., 5, 516, https://doi.org/10.3389/fmicb.2014.00516, 2014.
Krull, E. S., Skjemstad, J. O., and Baldock, J. A.: Functions of Soil Organic Matter and the Effect on Soil Properties, Report for GRDC, Project CSO00029, Canberra: GRDC, 2004.
Lawrence, D. M. and Slater, A. G.: Incorporating organic soil into a global climate model, Clim. Dynam., 30, 145–160, https://doi.org/10.1007/s00382-007-0278-1, 2008.
Marschner, H. (Ed.): Marschner's mineral nutrition of higher plants, 3rd ed., Elsevier/Academic Press, London; Waltham, MA, 651 pp., 2012.
Mauclet, E., Agnan, Y., Hirst, C., Monhonval, A., Pereira, B., Vandeuren, A., Villani, M., Ledman, J., Taylor, M., Jasinski, B. L., Schuur, E. A. G., and Opfergelt, S.: Changing sub-Arctic tundra vegetation upon permafrost degradation: impact on foliar mineral element cycling, Biogeosciences, 19, 2333–2351, https://doi.org/10.5194/bg-19-2333-2022, 2022a.
Mauclet, E., Villani, M., Monhonval, A., Hirst, C., Schuur, E. A. G., and Opfergelt, S.: Characterization of permafrost soil exchange properties and quantification of stocks in soil exchangeable base cations, Open Data @ UCLouvain, https://doi.org/10.14428/DVN/FQVMEP, 2022b.
Mauclet, E., Hirst, C., Monhonval, A., Stevenson, E., Gérard, M., Villani, M., Dailly, H., Schuur, E. A. G., and Opfergelt, S.: Tracing changes in base cation sources for Arctic tundra vegetation upon permafrost thaw, Geoderma, 429, 116277, https://doi.org/10.1016/j.geoderma.2022.116277, 2023.
Metson, A. J.: Methods of chemical analysis for soil survey samples, Soil Sci., 83, 245, 1956.
Michaelson, G. J., Ping, C. L., and Kimble, J. M.: Carbon Storage and Distribution in Tundra Soils of Arctic Alaska, USA, Arct. Alp. Res., 28, 414, https://doi.org/10.2307/1551852, 1996.
Monhonval, A., Strauss, J., Mauclet, E., Hirst, C., Bemelmans, N., Grosse, G., Schirrmeister, L., Fuchs, M., and Opfergelt, S.: Iron Redistribution Upon Thermokarst Processes in the Yedoma Domain, Front. Earth Sci., 9, 703339, https://doi.org/10.3389/feart.2021.703339, 2021.
Nadelhoffer, K. J., Giblin, A. E., Shaver, G. R., and Laundre, J. A.: Effects of temperature and substrate quality on element mineralization in six Arctic soils, Ecology, 72, 242–253, https://doi.org/10.2307/1938918, 1991.
Nadelhoffer, K. J., Giblin, A. E., Shaver, G. R., and Linkins, A. E.: Microbial processes and plant nutrient availability in Arctic soils, in: Arctic Ecosystems in a Changing Climate, Elsevier, 281–300, https://doi.org/10.1016/B978-0-12-168250-7.50019-5, 1992.
Natali, S. M., Schuur, E. A. G., Trucco, C., Hicks Pries, C. E., Crummer, K. G., and Baron Lopez, A. F.: Effects of experimental warming of air, soil and permafrost on carbon balance in Alaskan tundra, Glob. Change Biol., 17, 1394–1407, https://doi.org/10.1111/j.1365-2486.2010.02303.x, 2011.
Natali, S. M., Schuur, E. A. G., and Rubin, R. L.: Increased plant productivity in Alaskan tundra as a result of experimental warming of soil and permafrost: Increased plant productivity in Alaskan tundra, J. Ecol., 100, 488–498, https://doi.org/10.1111/j.1365-2745.2011.01925.x, 2012.
Oades, J. M., Gillman, G. P., and Uehara, G.: Interactions of soil organic matter and variable-charge clays., in: Dynamics of soil organic matter in tropical ecosystems, University of Hawaii Press: Honolulu, 69–95, 1989.
Olefeldt, D., Goswami, S., Grosse, G., Hayes, D., Hugelius, G., Kuhry, P., McGuire, A. D., Romanovsky, V. E., Sannel, A. B. K., Schuur, E. A. G., and Turetsky, M. R.: Circumpolar distribution and carbon storage of thermokarst landscapes, Nat. Commun., 7, 13043, https://doi.org/10.1038/ncomms13043, 2016.
Osterkamp, T.: The recent warming of permafrost in Alaska, Global Planet. Change, 49, 187–202, https://doi.org/10.1016/j.gloplacha.2005.09.001, 2005.
Osterkamp, T. E., Jorgenson, M. T., Schuur, E. a. G., Shur, Y. L., Kanevskiy, M. Z., Vogel, J. G., and Tumskoy, V. E.: Physical and ecological changes associated with warming permafrost and thermokarst in Interior Alaska, Permafrost Periglac., 20, 235–256, https://doi.org/10.1002/ppp.656, 2009.
Palmtag, J., Hugelius, G., Lashchinskiy, N., Tamstorf, M. P., Richter, A., Elberling, B., and Kuhry, P.: Storage, Landscape Distribution, and Burial History of Soil Organic Matter in Contrasting Areas of Continuous Permafrost, Arct. Antarct. Alp. Res., 47, 71–88, https://doi.org/10.1657/AAAR0014-027, 2015.
Peech, M.: Hydrogen-Ion Activity, in: Agronomy Monographs, edited by: Norman, A. G., American Society of Agronomy, Soil Science Society of America, Madison, WI, USA, 914–926, https://doi.org/10.2134/agronmonogr9.2.c9, 1965.
Périé, C. and Ouimet, R.: Organic carbon, organic matter and bulk density relationships in boreal forest soils, Can. J. Soil Sci., 88, 315–325, https://doi.org/10.4141/CJSS06008, 2008.
Peverill, K. I., Sparrow, L. A., and Reuter, D. J.: Soil Analysis: An Interpretation Manual, Csiro Publishing, Collingwood, 388 pp., 1999.
Ping, C. L., Bockheim, J. G., Kimble, J. M., Michaelson, G. J., and Walker, D. A.: Characteristics of cryogenic soils along a latitudinal transect in arctic Alaska, J. Geophys. Res., 103, 28917–28928, https://doi.org/10.1029/98JD02024, 1998.
Ping, C. L., Michaelson, G. J., Kimble, J. M., Romanovsky, V. E., Shur, Y. L., Swanson, D. K., and Walker, D. A.: Cryogenesis and soil formation along a bioclimate gradient in Arctic North America, J. Geophys. Res., 113, G03S12, https://doi.org/10.1029/2008JG000744, 2008.
Ping, C.-L., Michaelson, G. J., Kimble, J. M., and Walker, D. A.: Soil acidity and exchange properties of cryogenic soils in Arctic Alaska, Soil Sci. Plant Nutr., 51, 649–653, 2005.
Plaza, C., Schuur, E. A. G., and Pegoraro, E. F.: Eight Mile Lake Research Watershed, Carbon in Permafrost Experimental Heating Research (CiPEHR): physical and chemical properties of soils, 2009–2013, Bonanza Creek LTER – University of Alaska Fairbanks, BNZ: 655, https://doi.org/10.6073/pasta/f502d8fe1a2e1d6c6b035c198af04f3e, 2017.
Plaza, C., Pegoraro, E., Bracho, R., Celis, G., Crummer, K. G., Hutchings, J. A., Hicks Pries, C. E., Mauritz, M., Natali, S. M., Salmon, V. G., Schädel, C., Webb, E. E., and Schuur, E. A. G.: Direct observation of permafrost degradation and rapid soil carbon loss in tundra, Nat. Geosci., 12, 627–631, https://doi.org/10.1038/s41561-019-0387-6, 2019.
Poszwa, A., Dambrine, E., Pollier, B., and Atteia, O.: A comparison between Ca and Sr cycling in forest ecosystems, Plant aSoil,225, 229–310, https://doi.org/10.1023/A:1026570812307, 2000.
R Core Team. R: A language and environment for statistical computing. R Foundation for Statistical Computing, Vienna, Austria, https://www.R-project.org/ (last access: 16 May 2022), 2018.
Salmon, V. G., Soucy, P., Mauritz, M., Celis, G., Natali, S. M., Mack, M. C., and Schuur, E. A. G.: Nitrogen availability increases in a tundra ecosystem during five years of experimental permafrost thaw, Glob. Change Biol., 22, 1927–1941, https://doi.org/10.1111/gcb.13204, 2016.
Schaefer, K., Zhang, T., Bruhwiler, L., and Barrett, A. P.: Amount and timing of permafrost carbon release in response to climate warming: amount and timing of permafrost carbon release, Tellus B, 63, 165–180, https://doi.org/10.1111/j.1600-0889.2011.00527.x, 2011.
Schuur, E. A. G., Crummer, K. G., Vogel, J. G., and Mack, M. C.: Plant species composition and productivity following permafrost thaw and thermokarst in Alaskan tundra, Ecosystems, 10, 280–292, https://doi.org/10.1007/s10021-007-9024-0, 2007.
Schuur, E. A. G., Bockheim, J., Canadell, J. G., Euskirchen, E., Field, C. B., Goryachkin, S. V., Hagemann, S., Kuhry, P., Lafleur, P. M., Lee, H., Mazhitova, G., Nelson, F. E., Rinke, A., Romanovsky, V. E., Shiklomanov, N., Tarnocai, C., Venevsky, S., Vogel, J. G., and Zimov, S. A.: Vulnerability of permafrost carbon to climate change: implications for the global carbon cycle, BioScience, 58, 701–714, https://doi.org/10.1641/B580807, 2008.
Schuur, E. A. G., Vogel, J. G., Crummer, K. G., Lee, H., Sickman, J. O., and Osterkamp, T. E.: The effect of permafrost thaw on old carbon release and net carbon exchange from tundra, Nature, 459, 556–559, https://doi.org/10.1038/nature08031, 2009.
Schuur, E. A. G., McGuire, A. D., Schädel, C., Grosse, G., Harden, J. W., Hayes, D. J., Hugelius, G., Koven, C. D., Kuhry, P., Lawrence, D. M., Natali, S. M., Olefeldt, D., Romanovsky, V. E., Schaefer, K., Turetsky, M. R., Treat, C. C., and Vonk, J. E.: Climate change and the permafrost carbon feedback, Nature, 520, 171–179, https://doi.org/10.1038/nature14338, 2015.
Schuur, E. A. G., Bracho, R., Celis, G., Belshe, E. F., Ebert, C., Ledman, J., Mauritz, M., Pegoraro, E. F., Plaza, C., Rodenhizer, H., Romanovsky, V., Schädel, C., Schirokauer, D., Taylor, M., Vogel, J. G., and Webb, E. E.: Tundra Underlain By Thawing Permafrost Persistently Emits Carbon to the Atmosphere Over 15 Years of Measurements, J. Geophys. Res.-Biogeo., 126, e2020JG006044, https://doi.org/10.1029/2020JG006044, 2021.
Schuur, T., McGuire, A. D., Romanovsky, V. E., Schadel, C., and Mack, M.: Arctic and boreal carbon, The National Academies Press, https://doi.org/10.17226/25045, 2018.
Shaver, G. R., Giblin, A. E., Nadelhoffer, K. J., Thieler, K. K., Downs, M. R., Laundre, J. A., and Rastetter, E. B.: Carbon turnover in Alaskan tundra soils: effects of organic matter quality, temperature, moisture and fertilizer: Carbon turnover in tundra soils, J. Ecol., 94, 740–753, https://doi.org/10.1111/j.1365-2745.2006.01139.x, 2006.
Shur, Y., Hinkel, K. M., and Nelson, F. E.: The transient layer: implications for geocryology and climate-change science, Permafrost Periglac. Process., 16, 5–17, https://doi.org/10.1002/ppp.518, 2005.
Sistla, S. A., Moore, J. C., Simpson, R. T., Gough, L., Shaver, G. R., and Schimel, J. P.: Long-term warming restructures Arctic tundra without changing net soil carbon storage, Nature, 497, 615–618, https://doi.org/10.1038/nature12129, 2013.
Stevenson, F. J.: Humus Chemistry: Genesis, Composition, Reactions, 2nd ed., Wiley and Sons, New York, 1994.
Strauss, J., Schirrmeister, L., Grosse, G., Fortier, D., Hugelius, G., Knoblauch, C., Romanovsky, V., Schädel, C., Schneider von Deimling, T., Schuur, E. A. G., Shmelev, D., Ulrich, M., and Veremeeva, A.: Deep Yedoma permafrost: A synthesis of depositional characteristics and carbon vulnerability, Earth-Sci. Rev., 172, 75–86, https://doi.org/10.1016/j.earscirev.2017.07.007, 2017.
Sulman, B. N., Salmon, V. G., Iversen, C. M., Breen, A. L., Yuan, F., and Thornton, P. E.: Integrating Arctic Plant Functional Types in a Land Surface Model Using Above- and Belowground Field Observations, J. Adv. Model. Earth. Sy., 13, e2020MS002396, https://doi.org/10.1029/2020MS002396, 2021.
Tarnocai, C., Canadell, J. G., Schuur, E. A. G., Kuhry, P., Mazhitova, G., and Zimov, S.: Soil organic carbon pools in the northern circumpolar permafrost region, Global Biogeochem. Cy., 23, GB2023, https://doi.org/10.1029/2008GB003327, 2009.
Thomas, J.: A study of factors controlling pH in Arctic tundra soils, UMEA Universiteit, Sweden, 29 pp., https://urn.kb.se/resolve?urn=urn:nbn:se:polar:diva-8371 (last access: 31 August 2023), 2019.
Tian, D. and Niu, S.: A global analysis of soil acidification caused by nitrogen addition, Environ. Res. Lett., 10, 024019, https://doi.org/10.1088/1748-9326/10/2/024019, 2015.
Ulrich, B.: Soil Acidity and its Relations to Acid Deposition, in: Effects of Accumulation of Air Pollutants in Forest Ecosystems, edited by: Ulrich, B. and Pankrath, J., Springer Netherlands, Dordrecht, 127–146, https://doi.org/10.1007/978-94-009-6983-4_10, 1983.
van der Kolk, H.-J., Heijmans, M. M. P. D., van Huissteden, J., Pullens, J. W. M., and Berendse, F.: Potential Arctic tundra vegetation shifts in response to changing temperature, precipitation and permafrost thaw, Biogeosciences, 13, 6229–6245, https://doi.org/10.5194/bg-13-6229-2016, 2016.
Villani, M., Mauclet, E., Agnan, Y., Druel, A., Jasinski, B., Taylor, M., Schuur, E. A. G., and Opfergelt, S.: Mineral element recycling in topsoil following permafrost degradation and a vegetation shift in sub-Arctic tundra, Geoderma, 421, 115915, https://doi.org/10.1016/j.geoderma.2022.115915, 2022.
Vogel, J., Schuur, E. A. G., Trucco, C., and Lee, H.: Response of CO2 exchange in a tussock tundra ecosystem to permafrost thaw and thermokarst development, J. Geophys. Res., 114, G04018, https://doi.org/10.1029/2008JG000901, 2009.
Weil, R. R. and Brady, N. C.: The nature and properties of soils, Fifteenth edition, Pearson, Columbus, 1086 pp., 2016.
Wilson, S. A.: Data compilation for USGS reference material BHVO-2, Hawaiian Basalt, 1997.
Zimov, S. A., Schuur, E. A. G., and Chapin, F. S.: Permafrost and the Global Carbon Budget, Science, 312, 1612–1613, https://doi.org/10.1126/science.1128908, 2006.