the Creative Commons Attribution 4.0 License.
the Creative Commons Attribution 4.0 License.
 | 02 Aug 2023
Thirty-meter map of young forest age in China
Yuelong Xiao
Qunming Wang
Xiaohua Tong
Peter M. Atkinson
Young forest age mapping at a fine spatial resolution is important for increasing the accuracy of estimating land–atmosphere carbon fluxes and guiding forest management practices. In recent decades, China has actively conducted afforestation and forest protection projects, thereby laying the foundation for the realization of carbon neutrality. However, very few studies have been conducted which map the ages of young forests for the whole of China at a fine spatial resolution. In this research, a continuous change detection and classification (CCDC)-based method suitable for large-scale forest age mapping is proposed and used to estimate young forest ages across China in 2020 at a spatial resolution of 30 m. First, a 10 m spatial-resolution land cover dataset (WorldCover2020) from the European Space Agency (ESA) was used to determine the forest cover areas in 2020. Then, the CCDC algorithm was used to identify stand-replacing disturbances to determine the stand age based on 436 967 Landsat tiles across China from 1990 to 2020. A validation sample set composed of multiple land use and land cover (LULC) products was used to calculate the overall accuracy (OA) of the 2020 young forest age (1–31-year) map of China, and the OA was 90.28 %. The reliability and applicability of the proposed CCDC-based forest age mapping method were validated by comparing the forest age map with Hansen's forest change dataset, Max Planck Institute for Biogeochemistry (MPI-BGC) 1 km global forest age datasets, and field measurements. The CCDC-based method has strong application potential in real-time mapping of the age of young forests at the global scale. The produced forest age map provides a basic dataset for research on the forest carbon cycle and forest ecosystem services as well as important guidance for government departments, such as the National Forestry and Grassland Administration and the National Development and Reform Commission in China. Data presented in this study is available at https://doi.org/10.6084/m9.figshare.21627023.v7 (Xiao, 2022).
- Article
(10598 KB) - Full-text XML
- BibTeX
- EndNote


The industrial revolution and the use of fossil fuels has led to a continuous increase in the concentration of greenhouse gases, particularly carbon dioxide, in the atmosphere, which has caused an increase in global temperatures. Forest growth plays a significant role in reducing atmospheric carbon dioxide levels, and stand age has been recognized as an important parameter in forest carbon cycle models (He et al., 2011; Vilen et al., 2012; Zhang et al., 2014). In existing studies, differences in the carbon sequestration capacity of forest stands with different ages have not been considered, which has led to large uncertainties in estimates of carbon sources and sinks in forest ecosystems (Piao et al., 2022). Loboda and Chen (2017) pointed out that young boreal forests (forest age <30 years) are stable carbon sources, while temperate forests transition from large carbon sources to significant carbon sinks in the first 10 years until they mature. Therefore, studies on the stand age of young restored forests can contribute to more accurate estimates of forest carbon fluxes.
As a major industrial country, China's carbon dioxide emissions have continued to increase in recent decades, and problems such as land degradation, air pollution, and climate change have emerged. To address these problems, China has developed a series of plans to protect and expand its forests (Chen et al., 2019). For example, in recent decades, China has implemented afforestation and forest conservation projects to restore natural forests and improve ecosystem services (Lu et al., 2017). Chen et al. (2019) showed that China ranked first in the world in the production of new green areas from 2000 to 2017 and accounted for 25 % of the global net increase in leaf area, of which forests contributed the most (42 % of China's total greenery). It was found that different land use changes in southern China increased aboveground carbon stocks by 0.11 ± 0.05 PgC yr−1 between 2002 and 2017, with 32 % of the carbon sink contributed by young forests (Tong et al., 2020). Wang et al. (2020) found that the global contribution of China's forest carbon uptake was underestimated. More precisely, land carbon sinks in southwestern China (Yunnan, Guizhou, and Guangxi provinces) were underestimated throughout the year, and land carbon sinks in northeastern China (especially in Heilongjiang and Jilin provinces) were underestimated in the summer months.
Although a large amount of literature has focused on forest cover and carbon sinks in China, few studies have investigated forest age and the spatial distribution of young forests in China. In particular, fine-spatial-resolution data on forest age are missing. Presently, forest age products in China are available mainly at 1 km spatial resolution. For example, forest age maps of forests and plantations at 1 km spatial resolution in China were successively produced by Zhang et al. (2014, 2017) and Yu et al. (2020). However, most forests in China are distributed in mountainous areas with strong spatial heterogeneity. Generally, the existing forest age data are of too coarse a spatial resolution to support stand calculations for these regions.
The traditional method of forest age mapping is based mainly on field investigation, which is time-consuming and labor-intensive (i.e., it requires considerable human resources and material resources) (Racine et al., 2014), especially in steep mountain forests and areas with inconvenient access. This form of forest age surveying makes it very difficult to map large areas. In addition, there exist further problems such as poor timeliness and slow updating, which seriously affect the reliability of the collected forest age data (Pan et al., 2011).
Remote-sensing images represent a systematic tool for estimating large-scale biophysical variables owing to their wide spatial coverage and frequent data updates (Diao et al., 2020). Generally, the basic physical mechanism for estimating forest age using remote-sensing images is that forests of different ages exhibit different physical characteristics, such as spectral reflectance, tree crown texture, light transmittance, and biomass (Champion et al., 2014; Kuusinen et al., 2014; Thom and Keeton, 2019). In particular, regional forest age can be estimated by combining remote-sensing data with field survey (such as forest inventory data). The main principle underlying such approaches is that forest age is correlated with the (i) spectral reflectance and/or vegetation index of optical remote-sensing images and (ii) the backscattering coefficient and interference coherence of radar images (Diao et al., 2020). For example, Besnard et al. (2021) used forest inventories, biomass, and climate data to map the global forest age around 2010, and He et al. (2011) used forest inventory and analysis data to find a threshold for the normalized difference disturbance index to distinguish disturbances from regenerating forests. Combining SPOT 4 satellite sensor data, historical fire data, and forest inventory data, Pan et al. (2011) generated a 1 km spatial-resolution stand age map for the North American continent. Vilen et al. (2012) used remote-sensing-based European forest cover data and forest inventory maps to estimate the age of European forests between 1950 and 2010. The relationship between forest age and forest structure (such as tree height) in measured data has also been used to estimate forest age (Racine et al., 2014).
In addition to optical images, synthetic aperture radar (SAR) images play an important role in forest age mapping because of their advantages of all-weather, all-day monitoring. Pinto et al. (2013) found that the interferometric coherence of the L-band airborne sensor Uninhabited Aerial SAR (UAVSAR) was able to estimate forest age with great accuracy, overcoming the “saturation” problem that occurs in optical image-based forest age mapping. Lidar data have also been used for forest age mapping. For example, Racine et al. (2014) used airborne lidar data and ground data to estimate forest age in Quebec, eastern Canada.
In studies of Chinese forests, age has been widely estimated using the direct relationship between forest age and tree height. For example, Zhang et al. (2014) constructed the relationship between age and height retrieved from field observations to generate a 1 km spatial-resolution map of forest age in China. Zhang et al. (2017) used climate data, forest height data, and provincial statistical data from the national forest inventory to produce a downscaling-based 1 km spatial-resolution map of forest age distribution in China. Yu et al. (2020) used data such as field measurements, national forest inventory data, and remote-sensing-based forest height maps to map the ages and types of planted forests in China at a spatial resolution of 1 km.
Although the strategy of combining remote-sensing data and field survey data has dominated forest age mapping, it still suffers from the following problems. First, the availability of field survey data is difficult to guarantee. The usability problem depends mainly on the positioning accuracy of the sample points, regional differences, and number of samples. The positioning accuracy is affected mainly by measurement errors, while regional differences are reflected mainly in the differences in data availability caused by various regional policies, laws, and regulations. Second, the influence of the saturation phenomenon of spectral reflectance and/or the backscattering coefficient cannot be ignored. This saturation phenomenon means that, at large values of forest variables, such as biomass and age, the spectral reflectance and/or backscattering coefficients of remote-sensing images are no longer sensitive to changes in these variables (Zhao et al., 2016). For example, mature forests have a more stable canopy texture and canopy area than young forests. In addition, the saturation problem varies based on stand species and forest structure (Zhao et al., 2016; Lu et al., 2016), which further increases the difficulty in estimating forest age directly from spectral reflectance or backscattering coefficients. Although studies have shown that lidar data can solve the saturation problem (Lu et al., 2016), the limited spatial coverage and availability of the observed data hinder widespread application. Third, complex stand compositions and forest structures make it difficult for a single classification model to achieve reliable forest age mapping. Specifically, the accuracy varies greatly with spectral reflectance, backscattering coefficient, canopy texture, and other characteristics of mixed forests.
Methods of estimating forest age based on forest disturbance time can overcome the above problems effectively. This type of method uses time-series images (Powell et al., 2010; Zhu and Liu, 2015; Zhao et al., 2016) and/or disturbance historical data (such as burn scar maps) to infer the time of the last stand-replacing disturbance to estimate forest age through time. Common forest disturbance detection algorithms include disturbance and trend detection (Kennedy et al., 2010), the vegetation change tracker (VCT) (Huang et al., 2010), continuous change detection and classification (CCDC) (Zhu and Woodcock, 2014), and breaks for additive season and trend (Verbesselt et al., 2012; DeVries et al., 2015). Chen et al. (2016) developed the stand-replacing fire-mapping method using Landsat images from 2001 to 2012 to infer the forest age of Siberian larch. Kauffman and Prisley (2016) used the VCT algorithm to detect disturbance events based on Landsat time-series images. Diao et al. (2020) used the VCT algorithm, spatial analysis, and random forest regression to map the ages of three typical plantations in southern China (1987–2017). Methods based on forest disturbance monitoring have shown strong potential for forest age estimation, but as yet there exist only a few related studies involving large-scale mapping.
This research uses the Google Earth Engine (GEE) cloud platform with 30 m Landsat images and the CCDC algorithm to estimate forest age across the whole of China in 2020. The CCDC algorithm was selected because it can exploit the full temporal profile of long Landsat time-series data and judge accurately the disturbance time point (Zhu and Woodcock, 2014), thereby achieving reliable forest age mapping (Shen et al., 2018; DeVries et al., 2015). At present, there exist very few studies mapping forest age at a fine spatial resolution and across large areas. Therefore, this study fills such a research gap by mapping forest age at 30 m spatial resolution across the whole of China. In general, the main contributions of this paper are as follows. (1) A large-scale forest age mapping method is proposed based on the CCDC algorithm, which shows potential for mapping global forest ages at a fine spatial resolution of 30 m. (2) A 30 m spatial-resolution forest age map across China in 2020, as a preliminary result of annual forest age mapping, is produced. The dataset is available at https://doi.org/10.6084/m9.figshare.21627023.v7 for public use (Xiao, 2022).
2.1 Landsat images
Landsat Collection 1 (C1) Tier 1 Surface Reflectance (SR) images were selected, including all available Landsat 4–8 images from 1985 to 2020. These images were obtained directly from the GEE platform (https://developers.google.com/earth-engine/datasets/catalog/landsat, last access: 20 July 2023), with a total of 436 967 Landsat tiles across China. Furthermore, these data were atmospherically corrected using the LaSRC algorithm (Vermote et al., 2018). We preprocessed the image within China according to the Landsat SR Quality Assessment (QA) band, including removing shadows, clouds, cloud shadows, and snow-covered areas. In addition, it was necessary to remove outliers in the image; thus, pixels with reflectances of less than zero in each spectral band and pixels with significantly high reflectances were removed. It should be noted that the earliest available images for each region are not the same. For example, the earliest available images in western China were significantly later than those in the eastern coastal regions. Figure 1a and b show the year of the earliest available Landsat 4–8 images covering China before and after masking out non-forest land, respectively. The masks used were based on the 2020 European Space Agency (ESA) land cover product (WorldCover2020). It can be seen from Fig. 1b that the available Landsat 4–8 data after 1990 cover most of the forest land in China.
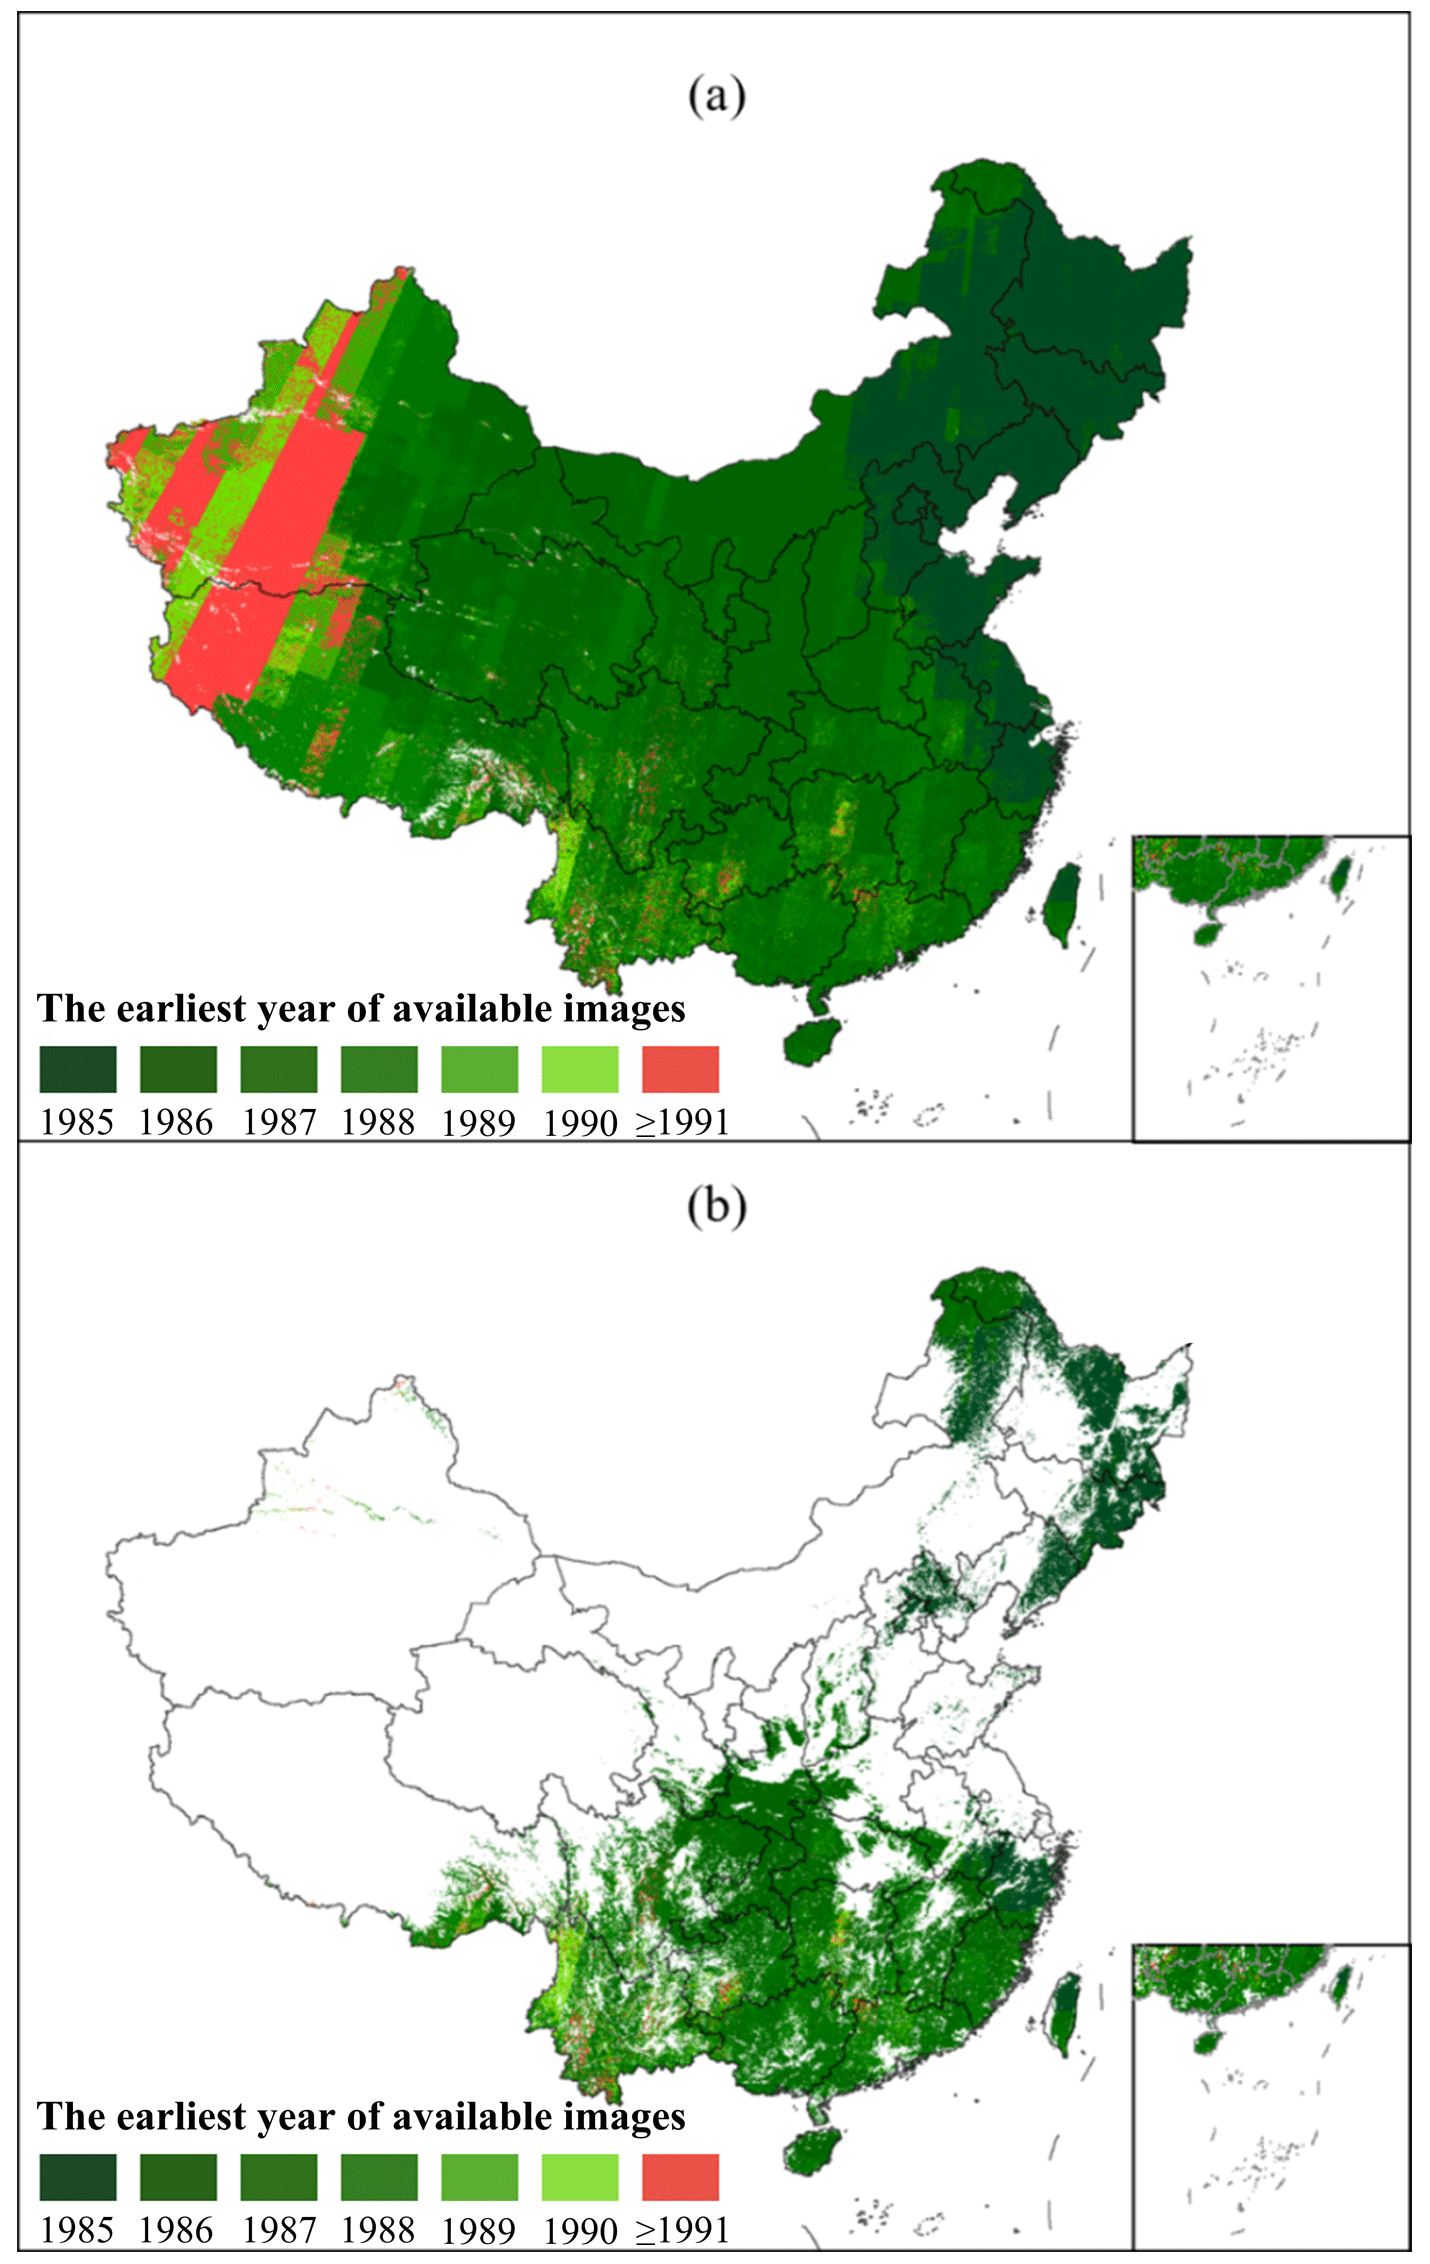
Figure 1The earliest available year of the Landsat images used in this study. (a) Years for the whole of China. (b) Years for the non-forest areas masked out.
2.2 Auxiliary data
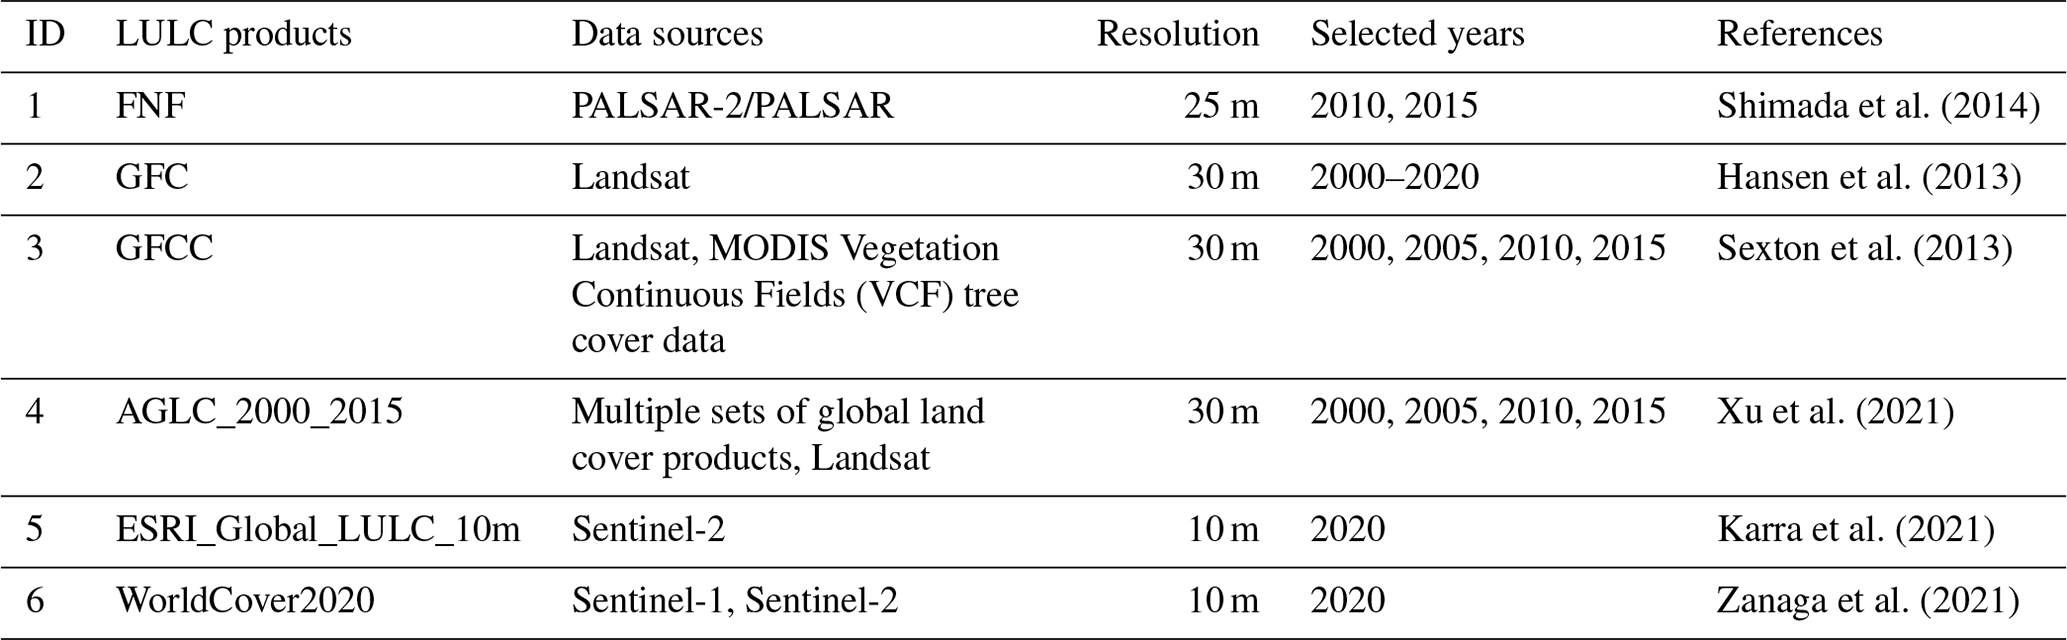
This research used several land cover products to produce reference data to calculate the stand age mapping accuracy, including the Global Forest/Non-Forest Map (FNF), Global Forest Change (GFC), Global Forest Cover Change Dataset (GFCC), Annual Global Land Cover between 2000 and 2015 (AGLC_2000_2015), Global Land Use/Land Cover Dataset (ESRIGlobal-LULC_10m), and WorldCover2020. A detailed description of these products is presented in Table 1.
3.1 CCDC algorithm
The CCDC algorithm is usually used to monitor land cover changes (Zhu and Woodcock, 2014; C. Li et al., 2021). It fits a model to spectral observations of Landsat pixels or vegetation indices (such as the normalized difference vegetation index, NDVI) and can reflect three types of pixel changes: (1) seasonal changes (such as phenology), (2) slow changes (such as vegetation growth or degradation), and (3) rapid changes (such as deforestation, insect disasters, storms, and fires) (Zhu and Woodcock, 2014). CCDC uses robust iteratively reweighted least squares (RIRLS) (Dumouchel and O'Brien, 1992) to fit to the observed values, which can reflect the phenological characteristics and changing trends of ground features. The mathematical expression of the fitted line is as follows:
where x represents Julian day, i represents the ith band of the image, T represents the number of days each year, and N represents the number of years of Landsat data. The coefficient a0,i represents the overall values of the ith band, a1,i and b1,i represent the intra-annual change in the ith band, and a2,i and b2,i represent the inter-annual change in the ith band. Finally, represents the predicted value for the ith band corresponding to the xth Julian day based on RIRLS fitting.
3.2 Forest age mapping based on CCDC
In this research, the CCDC-based method is proposed for large-scale forest age mapping (using Landsat images from the GEE cloud platform and the CCDC algorithm). Arévalo et al. (2020) provided the CCDC application programming interface on the GEE platform so that the algorithm could be employed conveniently.
3.2.1 Dividing the country into small grid cells
The CCDC algorithm performs time-series analysis per pixel, and the large-scale calculations require significant computing power. Although GEE has powerful computing capacity, it is still difficult to analyze the time series at a national scale. For this reason, the country was divided into 62 grid cells of 5∘ × 5∘ (Fig. 2), as this scale not only requires less GEE computing power, but also avoids increasing data management costs.
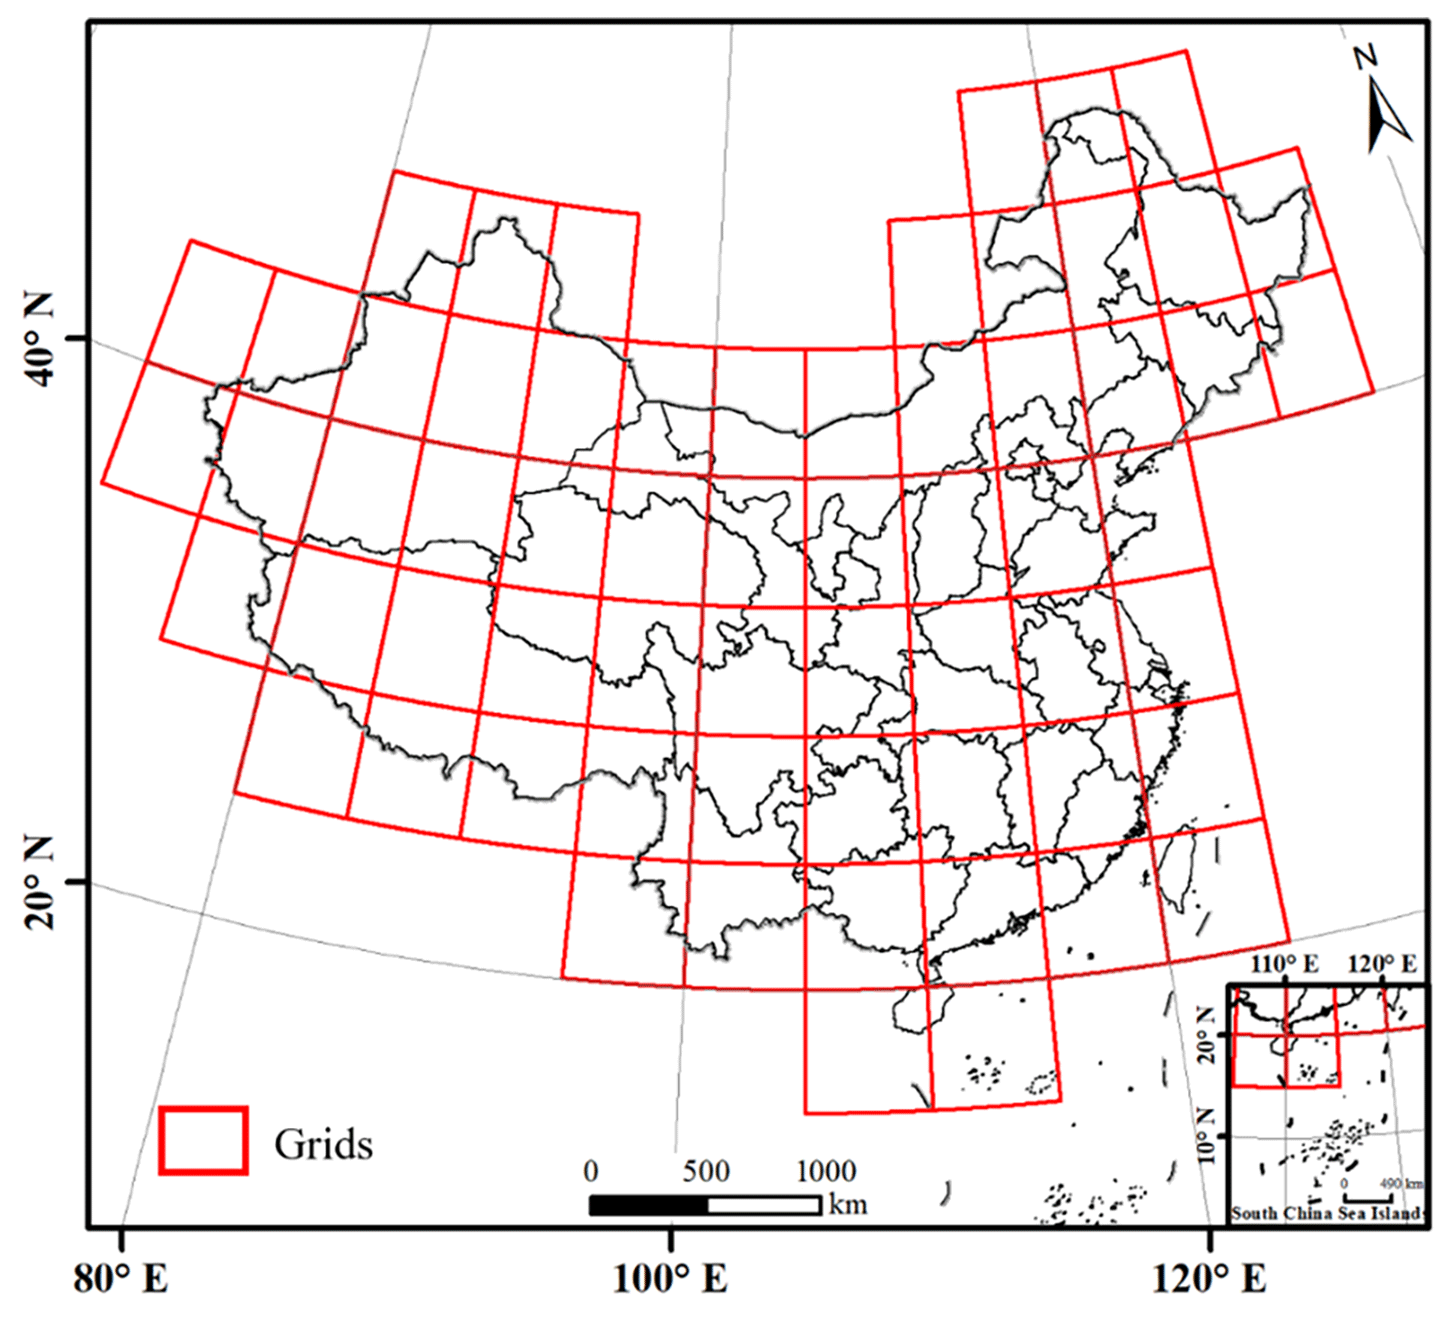
Figure 2The divided grids (62 5∘ × 5∘ grids) for the national land area.
3.2.2 Determining the 2020 forest distribution mask
This research utilizes existing 2020 land use and land cover (LULC) classification products to map forest distribution. Given these data, it was necessary only to identify the woodland area in the year of mapping (i.e., 2020 in this paper) and the time of the last land-replacing change in that area to estimate forest age. For example, if a pixel in the image is forest land in 2020 and the last time the area changed to forest land was in 2015, then the forest land is 5 years old.
Since 2020 is the target year of forest age mapping, we extracted the forest area from WorldCover2020 to generate the forest mask in 2020 (referred to as “Forest mask 2020”). The accuracy of the WorldCover2020 forest classification is sufficient for large-scale forest age mapping (producers' accuracy and users' accuracy are 89.9 % and 80.8 %, respectively). In addition, the spatial resolution of WorldCover2020 is 10 m, which makes it straightforward to match with the 30 m resolution of Landsat data (i.e., 10 m WorldCover2020 data can be degraded to 30 m conveniently).
3.2.3 Determining the breakpoints of the model
CCDC performs time-series analyses for each pixel. The model contains two key parameters, chi-squared probability (chiSquareProbability) and the minimum number of consecutive observations (minObservations) that trigger breakpoint conditions. It should be noted that the chiSquareProbability value ranged from 0 to 1. The larger the parameter value, the fewer the breakpoints detected by the model. The value of minObservations is a positive integer, which affects the sensitivity of the algorithm to breakpoint detection. For example, if the sensitivity is too high, then slow forest degradation (owing to, e.g., insect pests and selective logging) will also be detected as breakpoints. Because there is no land cover type change in this process, a high sensitivity will lead to an underestimation of forest age and vice versa. Therefore, finding the most suitable parameter threshold is the key to reliable forest age mapping.
3.2.4 Calculating the stand age
First, we determined the endpoint of the final fitted curve corresponding to each forest pixel (extracted using the Forest mask 2020). It should be noted that the Forest mask 2020 can represent only the forest extent at a certain time in 2020, and thus this paper assumes that the Forest mask 2020 represents the forest extent on 1 September 2020 (i.e., at the end of summer characterized by green vegetation). Figure 3 shows a schematic diagram illustrating forest age determination based on time-series analysis and the Forest mask 2020. The solid line represents the time-series fitting curve of the surface reflectance of a certain pixel, the red dotted line is the time point on 1 September 2020, and the purple curve intersecting the red dotted line indicates that the forest did not change during this period. Breakpoint B1 indicates that a severe disturbance has occurred at the corresponding time. Point C1 indicates that the location began to gradually recover to forest (afforestation or natural restoration) after a drastic change. Therefore, the forest age at target time point D can be estimated from the distance of C–D.
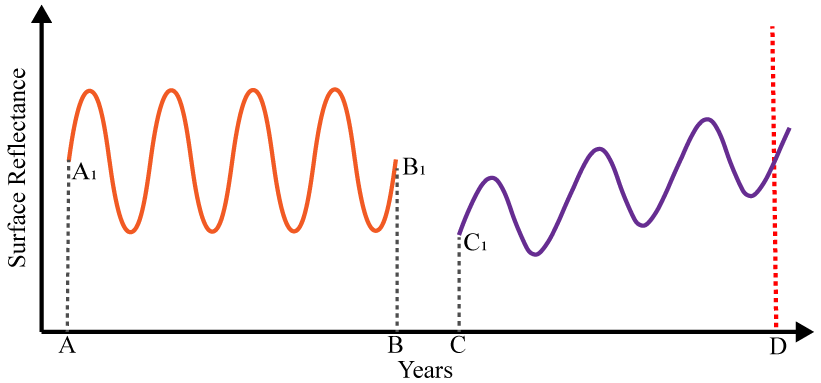
Figure 3Schematic diagram of forest age estimation. A1 and C1 represent the starts of the first fitting curve and second fitting curve, respectively, and B1 represents the breakpoint of first disturbance. A, B, and C represent the time points of A1, B1, and C1, respectively. D indicates 1 September 2020.
Figure 4 shows the time-series curve of a pixel analyzed by CCDC. The first row of images is the true color Landsat image at each time point centered at the pixel (red dot), and the second row is the corresponding fitting curve. The CCDC model detected two breakpoints in this pixel from 2004 to 2021. Specifically, the forest has degraded slowly since 2004, and the image shows that it still belonged to woodland on 22 June 2016. After that, the model detected a breakpoint, indicating that the woodland was disturbed rapidly and the land cover type changed. The image on 9 August 2016 shows that the location was covered by bare land at this time, and after a period of restoration, vegetation began to regrow. The images on 7 August and 28 August 2018 show that it was fully restored to woodland finally.
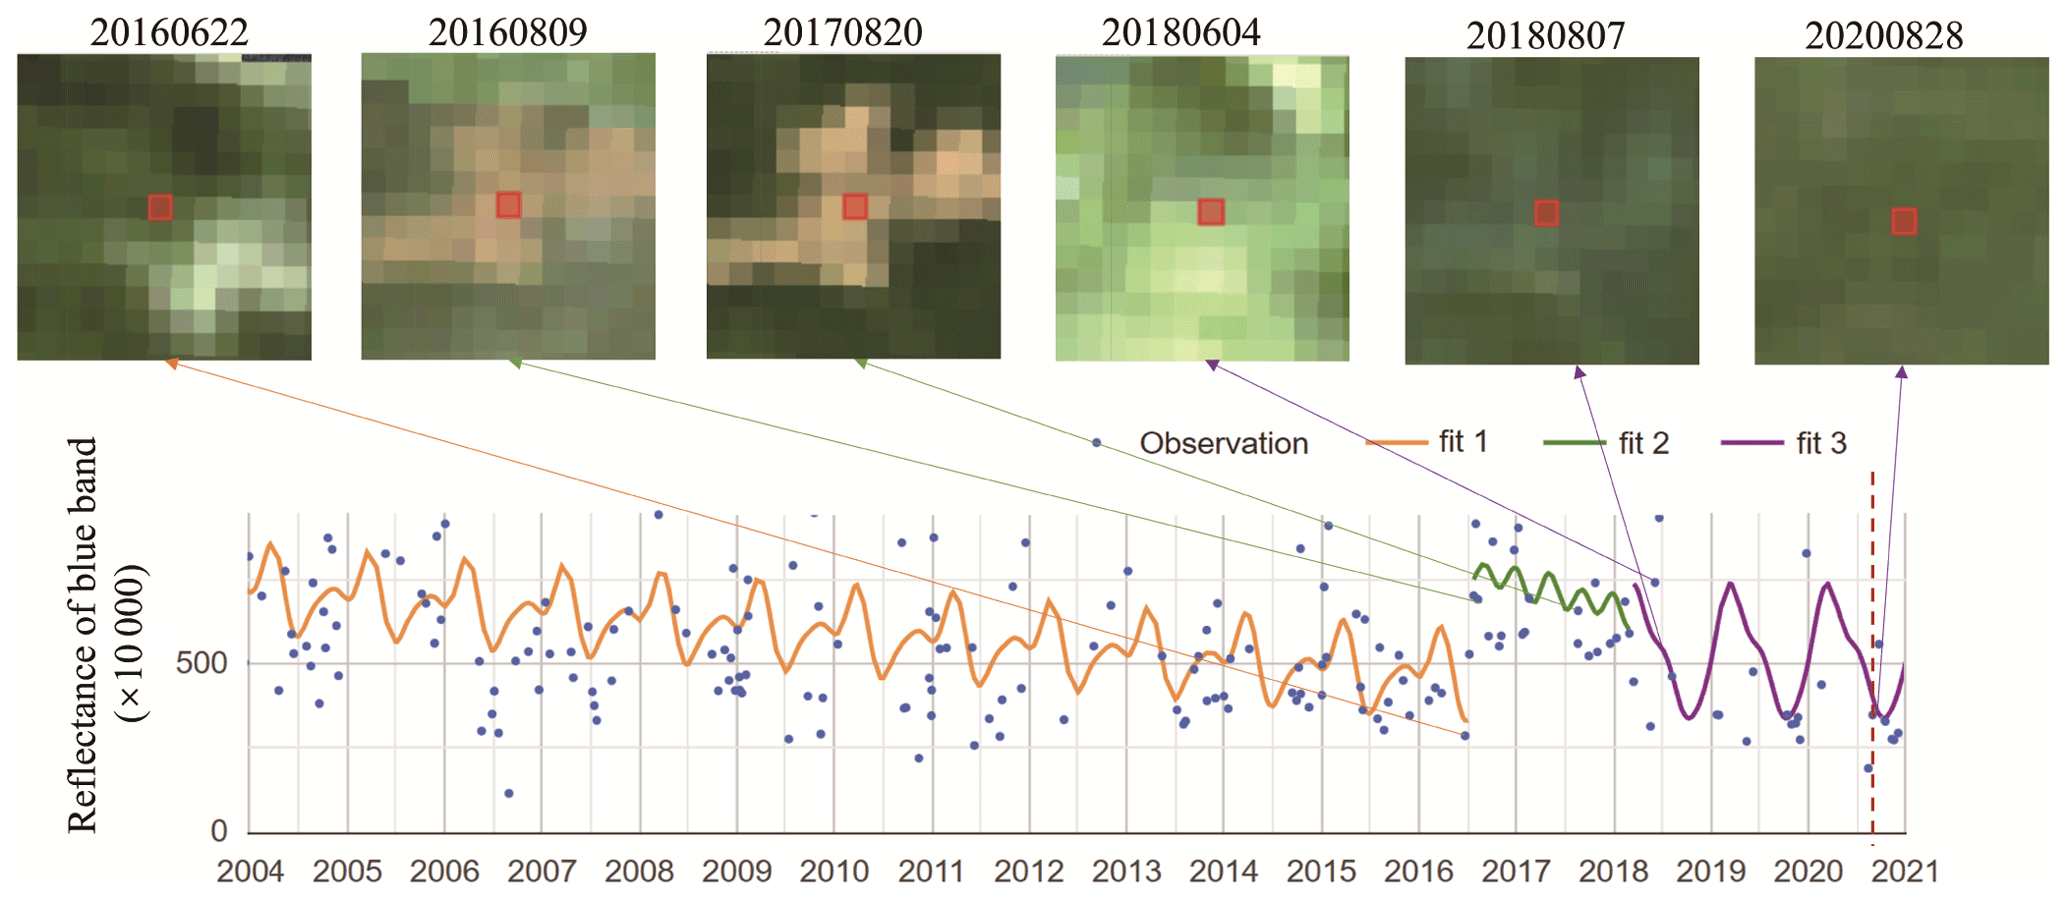
Figure 4Time-series analysis of a pixel by CCDC (only showing the blue band of Landsat images).
3.3 Generation of validation samples using LULC products
Accuracy assessment for large areas generally requires a large number of validation samples. The existing large-scale validation sample sets often contain data in a certain year only, but accuracy evaluation of forest age requires multi-period sample sets. Currently, many LULC products are available, and researchers have invested considerable work in ensuring product accuracy. Therefore, this research used these LULC products comprehensively to generate validation samples. To ensure the reliability of the samples, only land cover products after 2000 were used because there were few existing land cover products before 2000.
The 1–20-year stand age was grouped into four stand age classes: 16–20 years, 11–15 years, 6–10 years, and 1–5 years. These were then converted into binary classification maps with two classes: regrowth and non-regrowth. For the reference data, we used the LULC products to generate regrowth and non-regrowth samples every 5 years after 2000. Regrowth samples from 2000–2005, 2006–2010, 2011–2015, and 2016–2020 were used to create four stand age classes: 16–20 years, 11–15 years, 6–10 years, and 1–5 years, respectively. If they are unified, then the predicted age of the pixel is considered correct; otherwise, it is considered misclassified. Figure 5 is a flowchart showing how the LULC products were used to generate the validation samples. The following section introduces explicitly the accuracy evaluation process.
-
Extracting forest areas of selected years from LULC products. Because the available years for each product are not uniform, several years were selected from the available years, with multiple products at the same time in these years normally available. We identified 5 years: 2000, 2005, 2010, 2015, and 2020. The forest mask (FM) for these 5 years was first extracted from the LULC products. To ensure the reliability of the sample, the intersection of the FM of different LULC products each year (areas that were classified as forest by all LULC products) was determined, and the intersection area was considered the consensus forest (CF), while areas that were classified as forest by only one product were designated as undefined forest (UF).
-
Differencing. Differencing of the FMs of the years before and after each period was performed to assess the consensus regrowth (CR) in the four periods, i.e., 2000–2005, 2005–2010, 2010–2015, and 2015–2020. Since UF cannot determine whether it is forest, the UF of the years before and after each period does not participate in the differencing process. The union of these two areas was defined as undefined regrowth (UR). The area remaining in the image after removing the CR and UR was defined as consensus non-regrowth (CN). Specifically, UR, CR, and CN are expressed as follows:
where CR, UR, CF, UF, and CN represent the spatial sets of CR, UR, CF, UF, and CN, respectively, I represents the spatial set of the entire image area, t1 and t2 represent the 2 years before and after each period, respectively, and ∪ represents the union of the sets.
-
Random sampling and confusion matrix calculation. Stratified random sampling was used to generate validation sample sets. First, we confirmed the area of CR and CN with four periods (i.e., 2000–2005, 2005–2010, 2010–2015, and 2015–2020). Second, about 1000 regrowth samples and 5000 non-regrowth samples were randomly generated from the CR and CN of each period. Considering the possibility of regrowth events occurring in each period within the same pixel, only the regrowth samples in the most recent period were retained for the regrowth samples in the four periods. As a result, 2618 regrowth samples (red dots in Fig. 6) and 21 007 non-regrowth samples (blue dots in Fig. 6) were obtained.
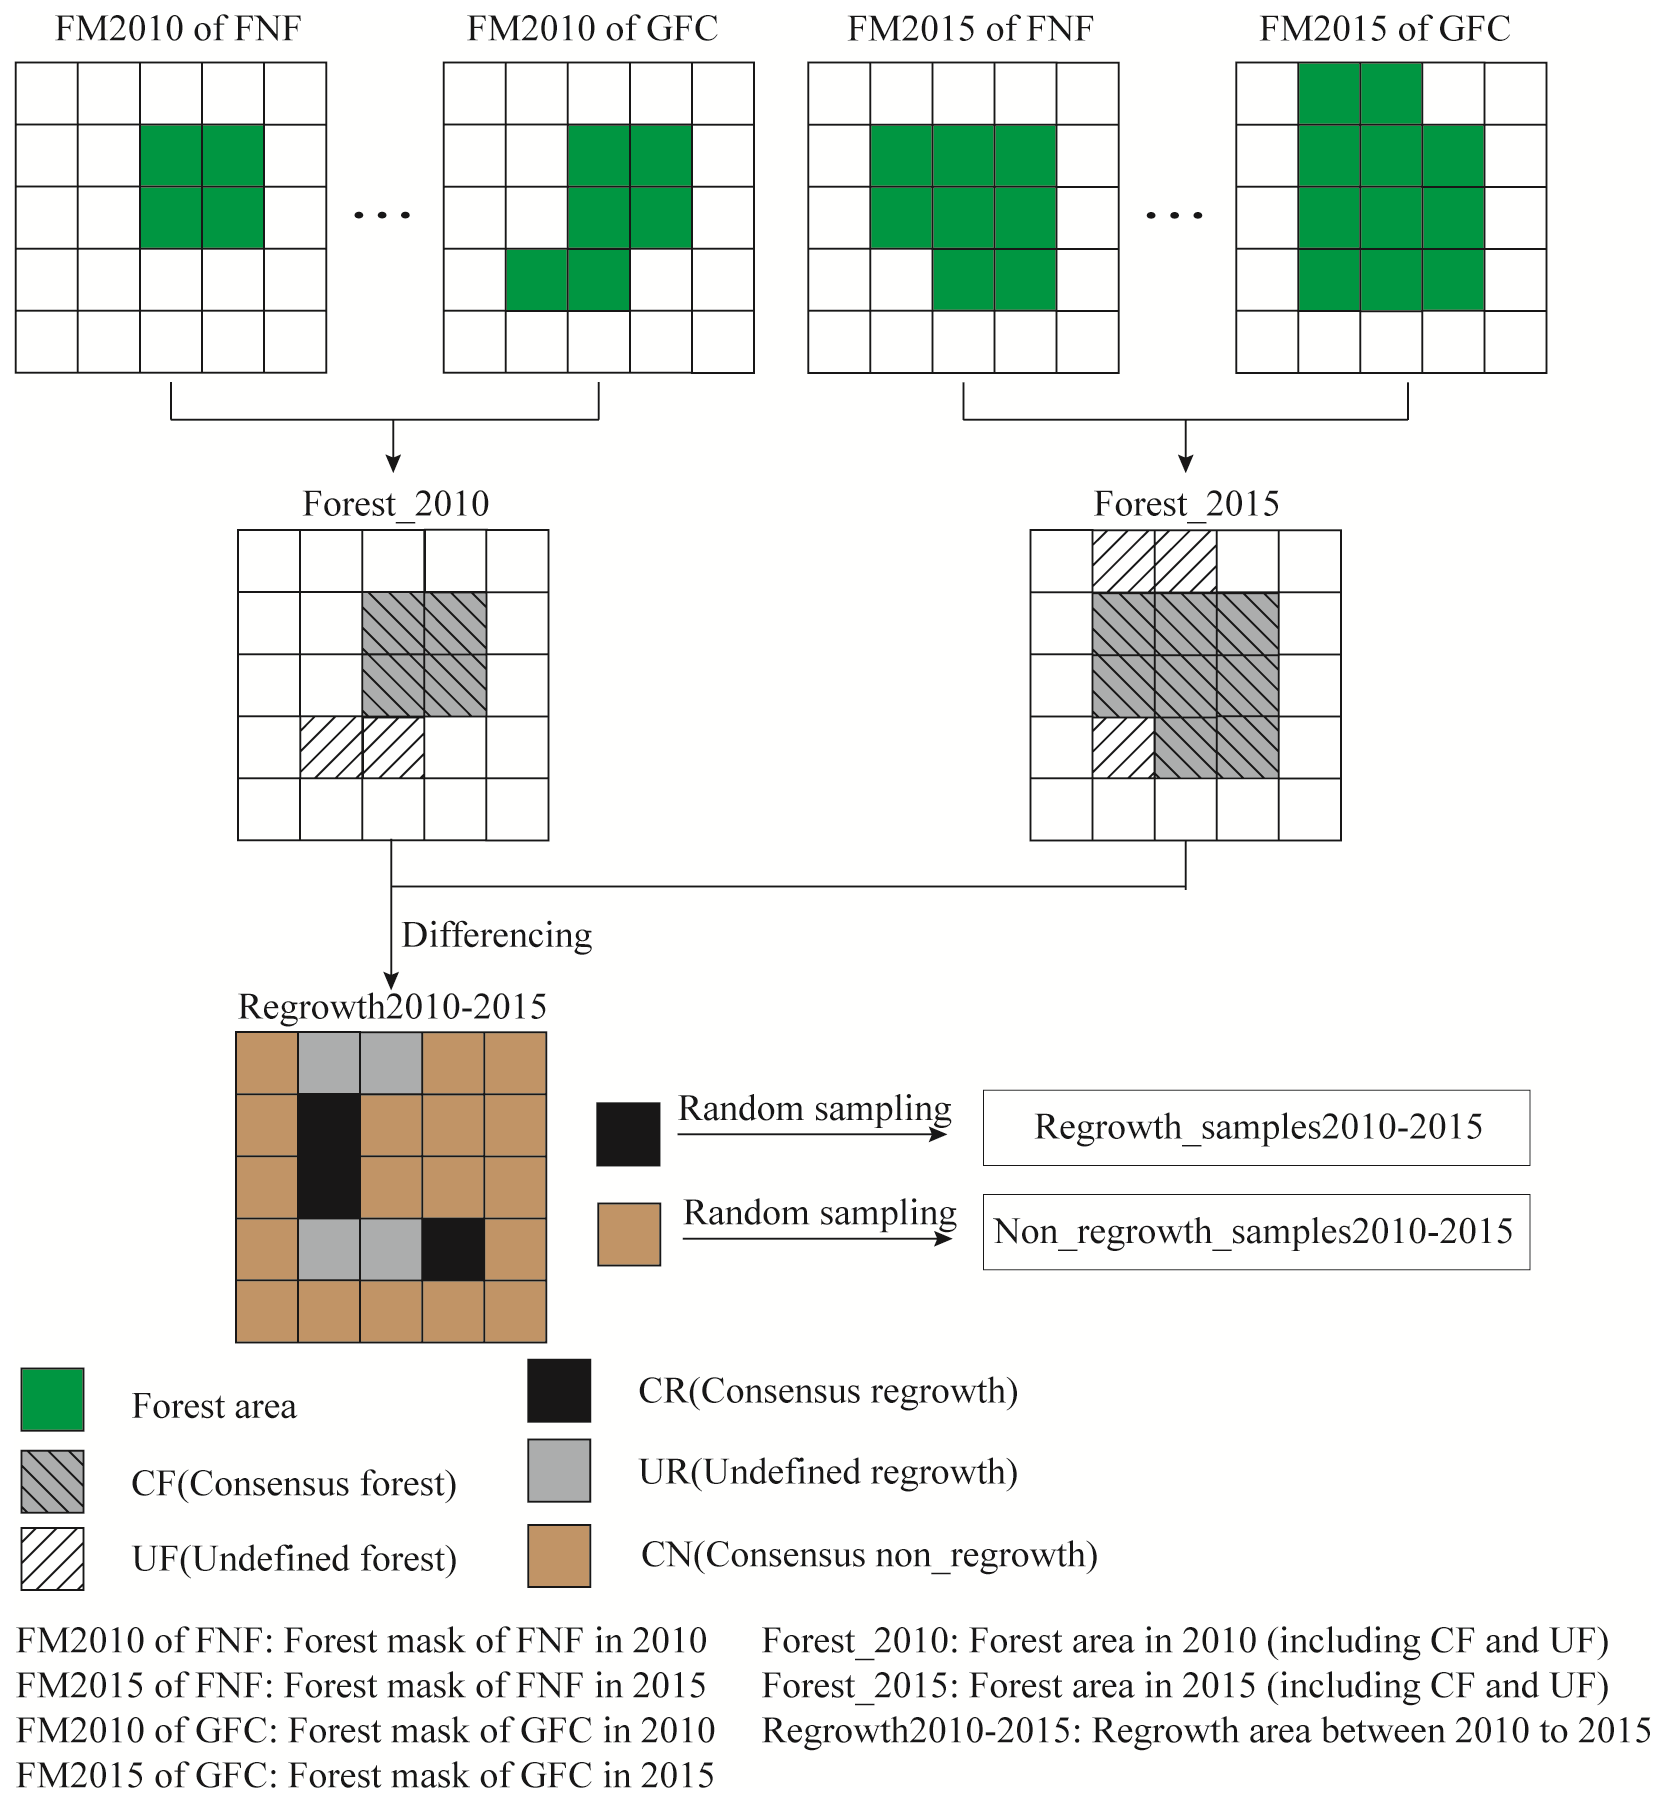
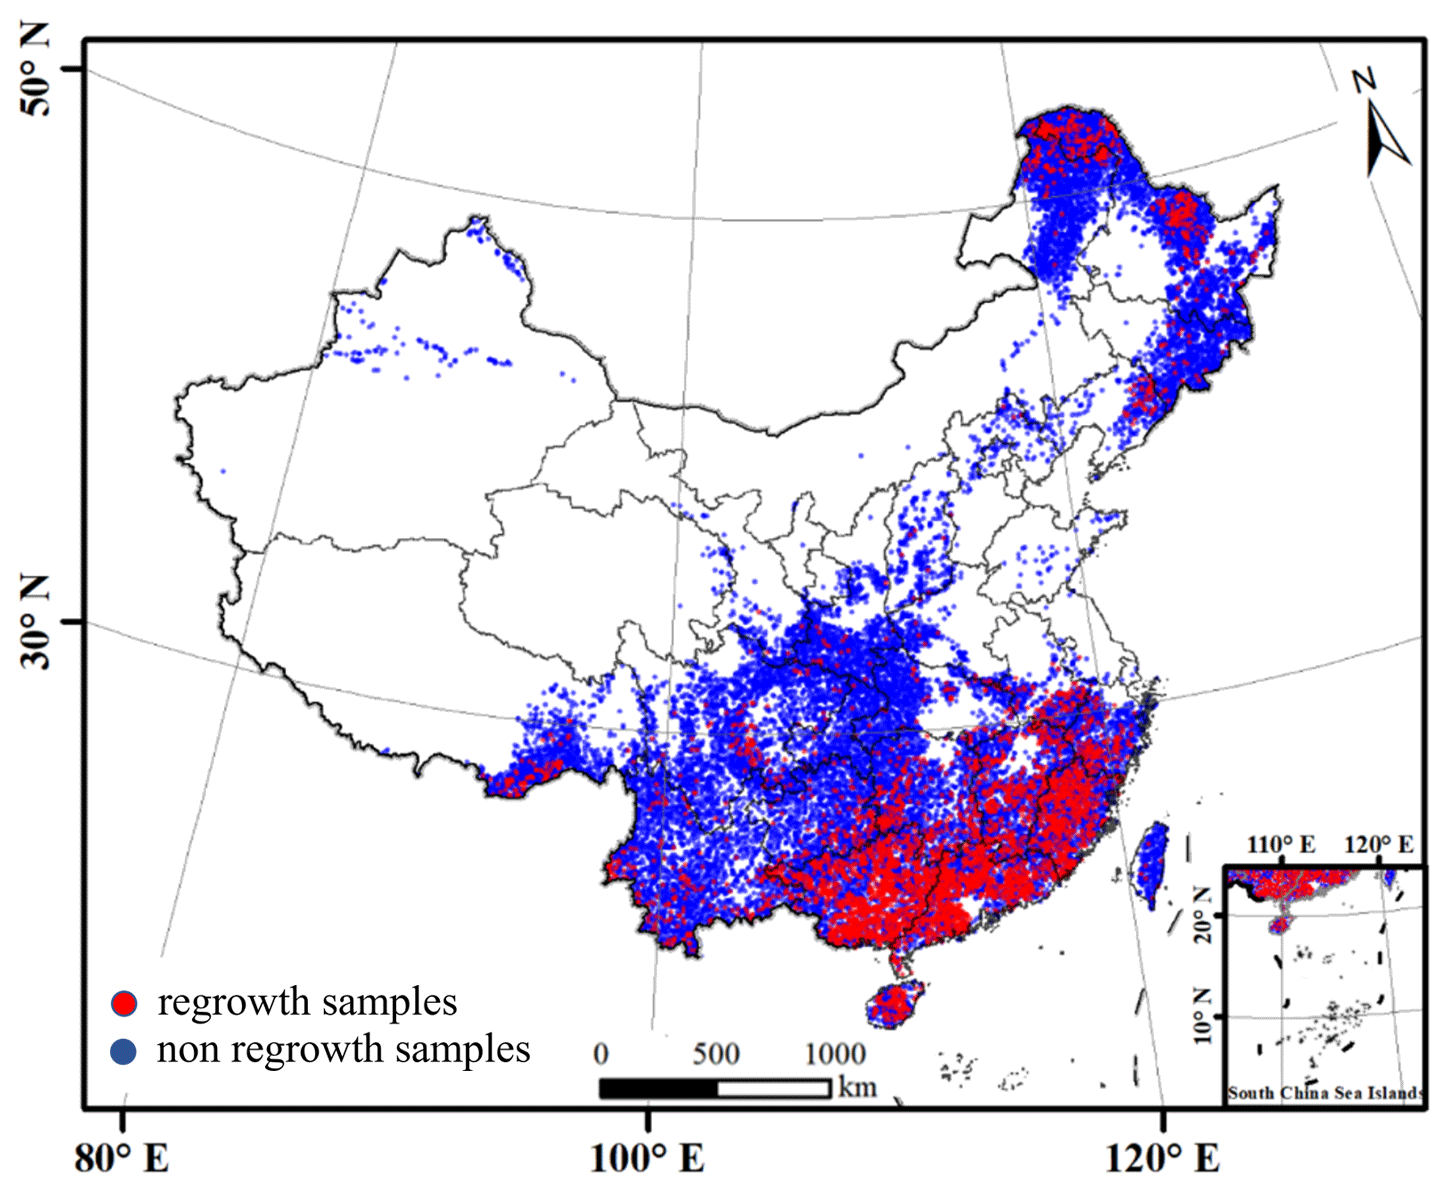
Figure 6Distribution map of validation samples.
4.1 Validation of the produced forest age map
4.1.1 National- and provincial-level performance
The validation samples (reference data) in each period and the forest age predicted by the model (predicted data) were compared to form a confusion matrix. The overall accuracy (OA) of the national young forest age mapping was found to be 90.28 % (Table 2). In addition, this research considered the cartographic performance of the proposed method in various provinces in China (Fig. 7). To ensure consistency in the number of samples used, the number of regrowth and non-regrowth samples for each province was controlled at around 400. In general, the OA of young forest age mapping in all provinces in China was larger than 54 %, and the OAs of Ningxia, Macau, Tianjin, Fujian, Zhejiang, Anhui, and Guangdong were all larger than 80 %. Except for Ningxia, the other six provinces (cities and autonomous regions) are located in eastern and southern China. The provinces with relatively weak classification performances were Gansu, Jiangxi, Shaanxi, and Beijing (in order), and the OAs of these four provinces were lower than 60 %. Except for the above provinces, the OAs of the remaining provinces were between 60 % and 80 %. In general, the classification performances of the southern provinces were more accurate than those of the northern provinces.
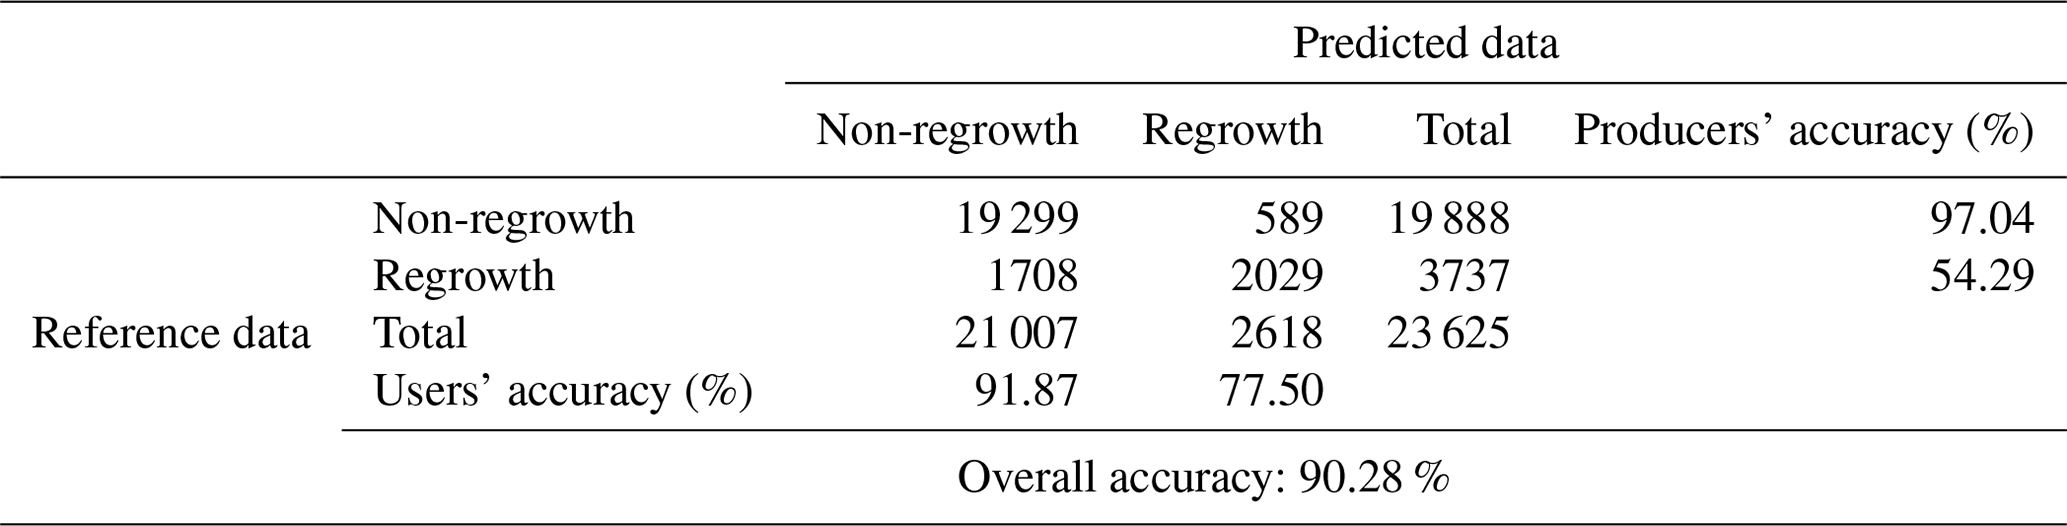
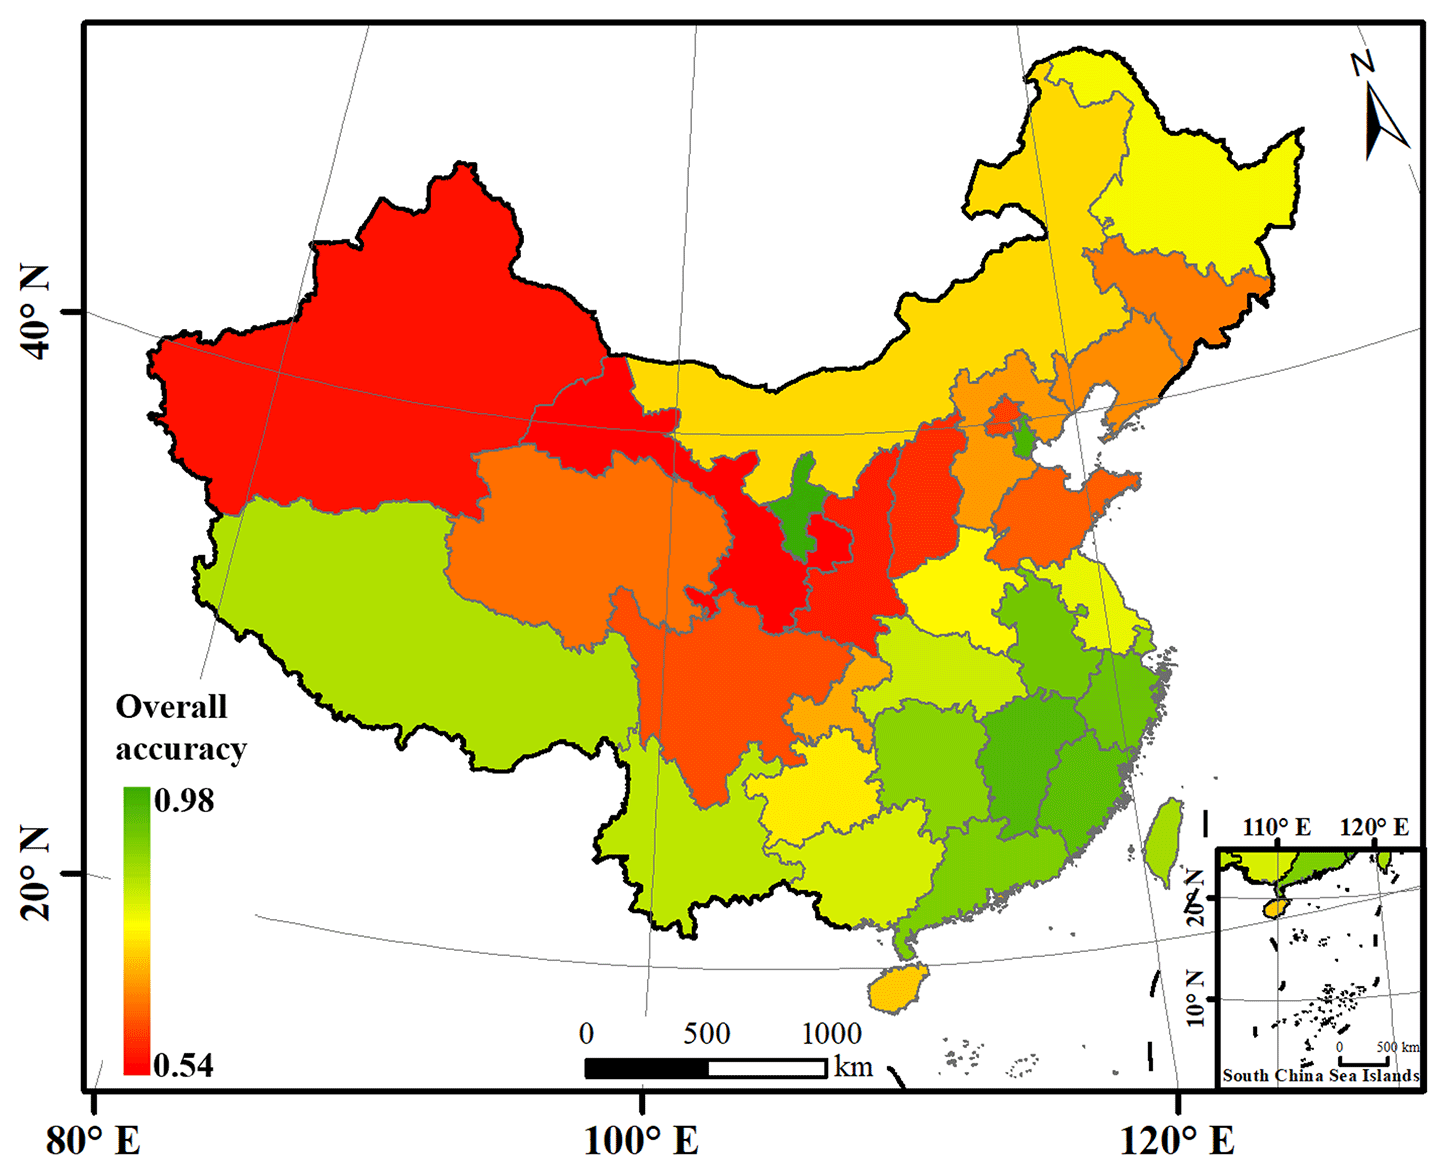
Figure 7Overall accuracy of young forest age mapping across different provinces in China.
4.1.2 Comparison with existing products
We compared visually the forest age map produced by the proposed method with the Max Planck Institute for Biogeochemistry (MPI-BGC) forest age dataset (at 1 km spatial resolution) (Besnard et al., 2021). Figure 8 shows three cases for comparison. In case 1, MPI-BGC presents much less information on the forest age compared to the proposed method. The reason may be that MPI-BGC is produced based on the relationship between forest age and forest biomass, which is influenced greatly by different forest types. However, this research estimates forest age based on the history of forest disturbance and, thus, is not affected by the forest type. Moreover, there are more age classes mixed within the area of each 1 km pixel, and the MPI-BGC forest age dataset cannot present the information explicitly. In case 2, MPI-BGC depicted only the forest age in the northern part of the region. It is difficult for MPI-BGC to map the age of small-scale forests in the southern part because of the coarse spatial resolution (i.e., the small-scale forests were incorrectly identified as non-forests in the 1 km data). In case 3, we selected an area dominated by small-scale forests. It is seen that MPI-BGC cannot depict the age of these forests. The forest age map produced by this research presents clear information at the 30 m spatial resolution, which is helpful for monitoring small-scale deforestation activities and estimating land–atmosphere carbon fluxes.
To further examine the reliability of the forest age map produced by this research, Pearson's product–moment correlation coefficient was calculated between the predicted years of regrowth and years of forest loss extracted from Hansen's product (FLH). FLH was chosen for comparison with the forest age map produced by this research, as forest age products with the same time range and spatial resolution are not available. However, FLH depicts the distribution of annual forest loss at the global scale with a spatial resolution of 30 m from 2000 to 2020. Generally, forest regrowth occurs during the recovery phase after forest loss. Therefore, the soundness of the proposed method can be reflected to some extent by this Pearson product–moment correlation analysis. Specifically, after 2000, 10 000 samples were selected randomly from the regrowth areas in the country. The results showed that there was a large correlation between the years of forest regrowth predicted by this research and the years of FLH, with a Pearson correlation coefficient of 0.62. As shown in Fig. 9, a large number of sample points were distributed on the diagonal line (y=x) or near the right side because the forest at these observation points could be quickly restored to forest after being disturbed. At the same time, the point density in the lower-right part of the diagonal is significantly larger than that in the upper-left part, indicating that the forest age estimation for most of the sample points is reasonable. Observations in the upper-left part of the diagonal line represent areas where forest age may be underestimated or misclassified as forest loss from FLH.
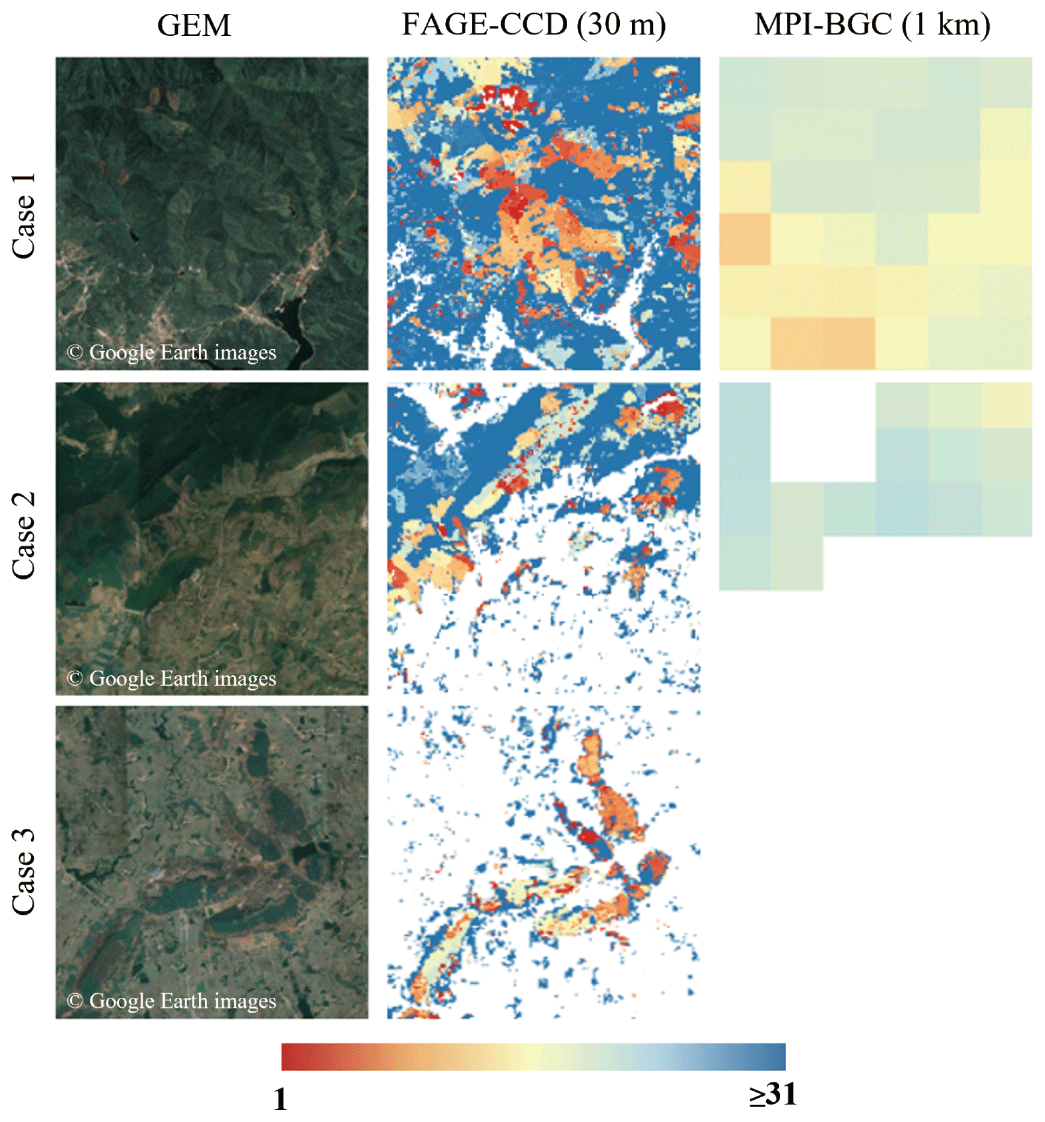
Figure 8Three scenarios for comparison between the 30 m spatial-resolution product (based on CCDC) and the 1 km spatial-resolution product (based on MPI-BGC). White pixels of the forest age maps in the second and third columns indicate non-forest or no data.
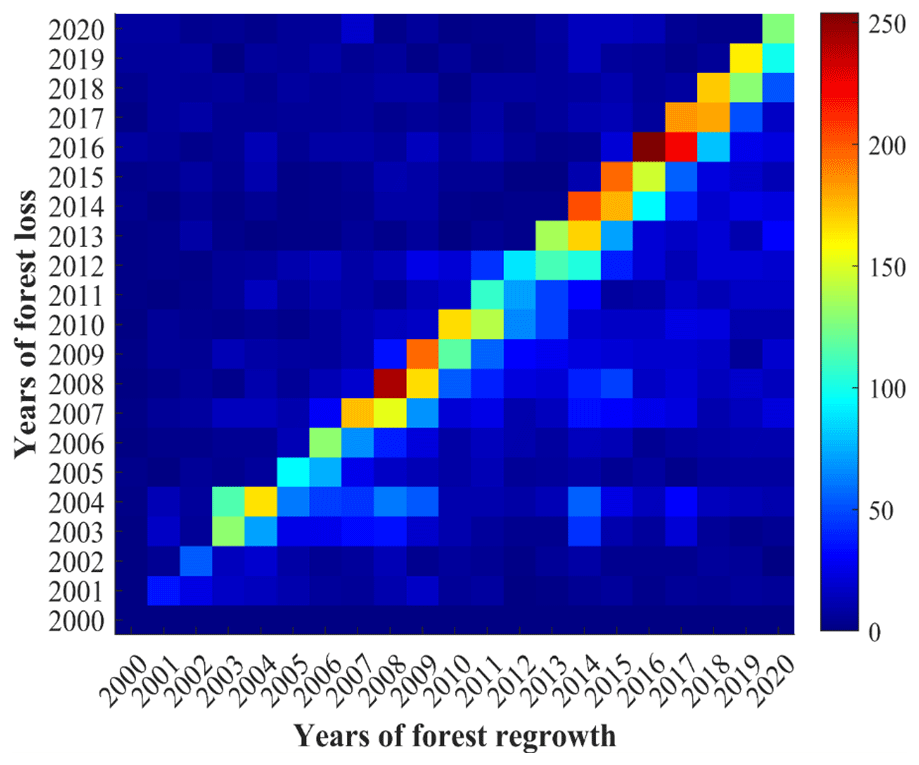
Figure 9Years of predicted regrowth versus years of FLH after 2000. The value of the color bar represents the number of samples that fall within each pixel.
4.1.3 Evaluation based on field measurements
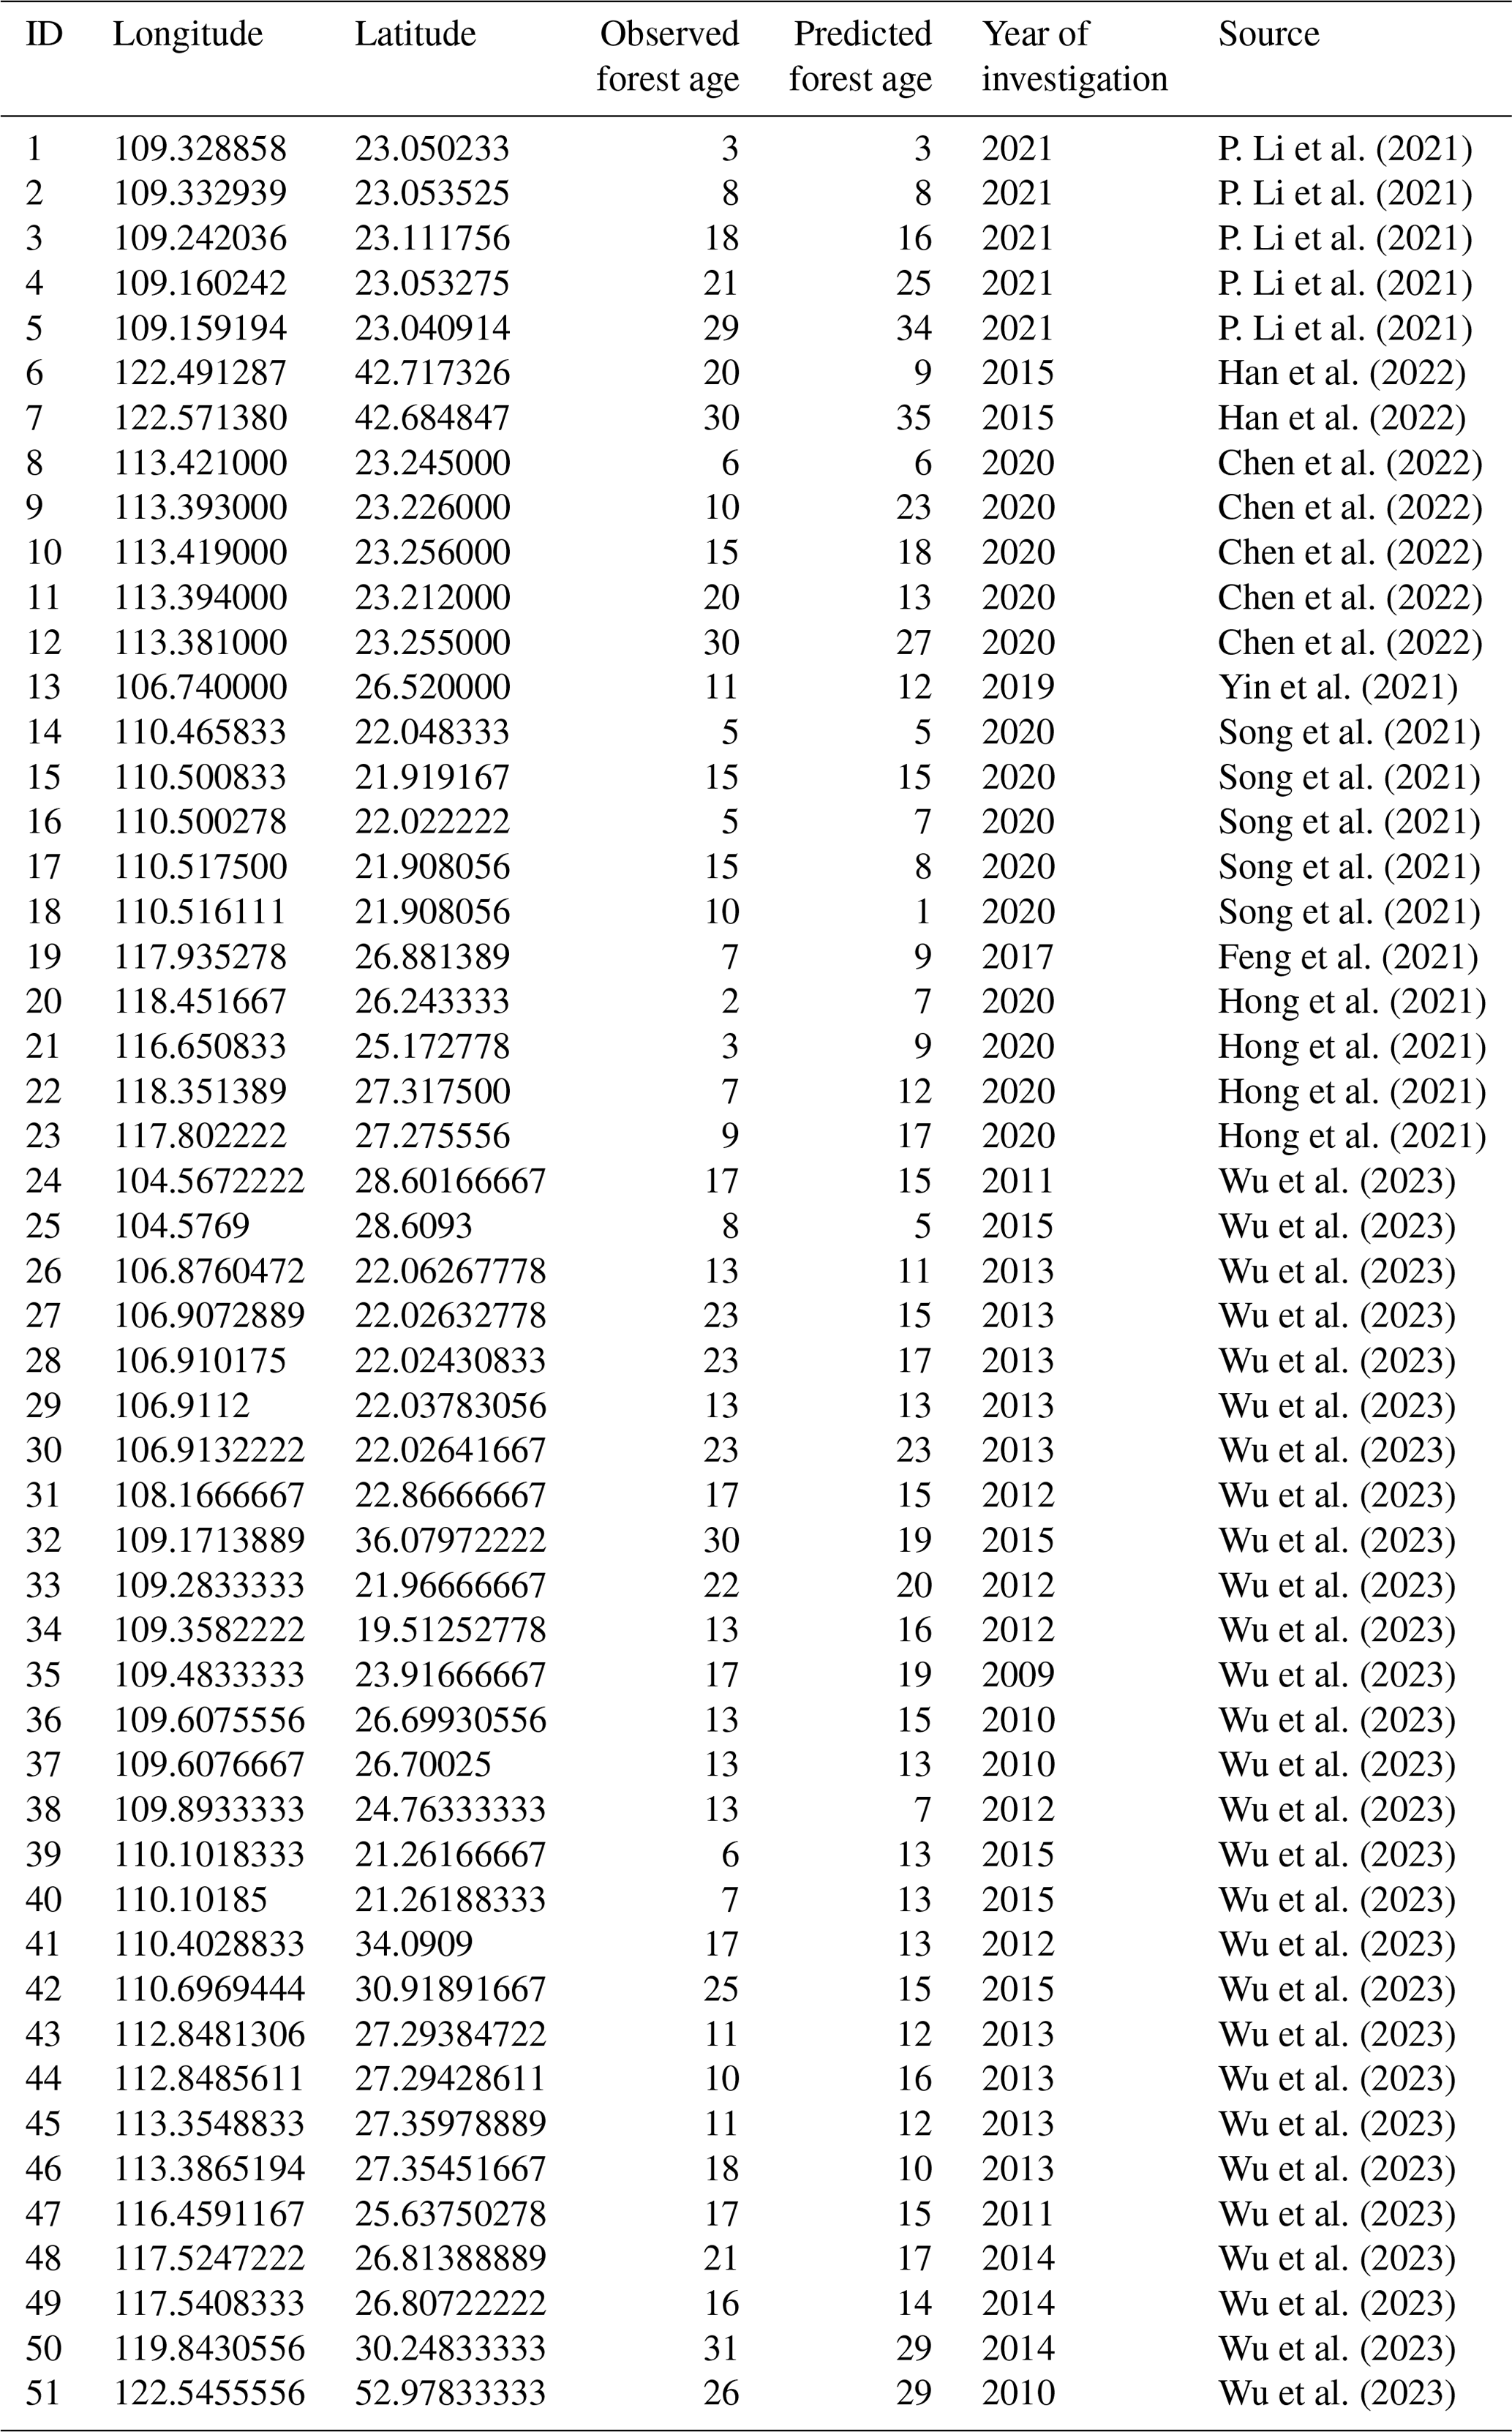
The data of field measurements are composed of two parts. The first part was derived from 150 relevant papers published after 2020 from the China National Knowledge Infrastructure (CNKI). We searched them using the following keywords: “China” and “forest age”. The second part was derived from Wu et al. (2023). It should be pointed out that three preprocessing steps were performed on this dataset. First, we updated the forest age in field measurements based on the investigation year of sampling plots. For example, if the sampling time was 2010 and the corresponding recorded forest age was 7 years, then, in 2020, the forest age should be 2020–2010 + 7 = 17 years. It should be noted that this calculation is based on the assumption that there has been no logging or land use conversion since the survey time of the sampling points. Second, we filtered out the observation points related to longitude or latitude recorded in decimal degree notation with only two or three decimal places retained, because no precise geographical coordinates are available for these sampling plots. Third, observation points with forest ages older than 31 were also filtered out because we only calculated 1–31-year old forests in our product.
Then we used the coordinates of these observation points to find out the predicted forest age in our product. If the predicted age is less than the value of 2020 minus the year of investigation, we will delete this observation, as we cannot determine whether forest succession has occurred at the observation point after the year of investigation. Finally, we obtained 51 field measurements (Table 3) with accurate geographical locations. Figure 10 shows the scatter plot between the field measurements and predicted forest age. Referring to the field measurements, the predicted forest age has a correlation coefficient of 0.77 and a root mean square error (RMSE) of 5.15, suggesting an acceptable correlation with the field measurements.
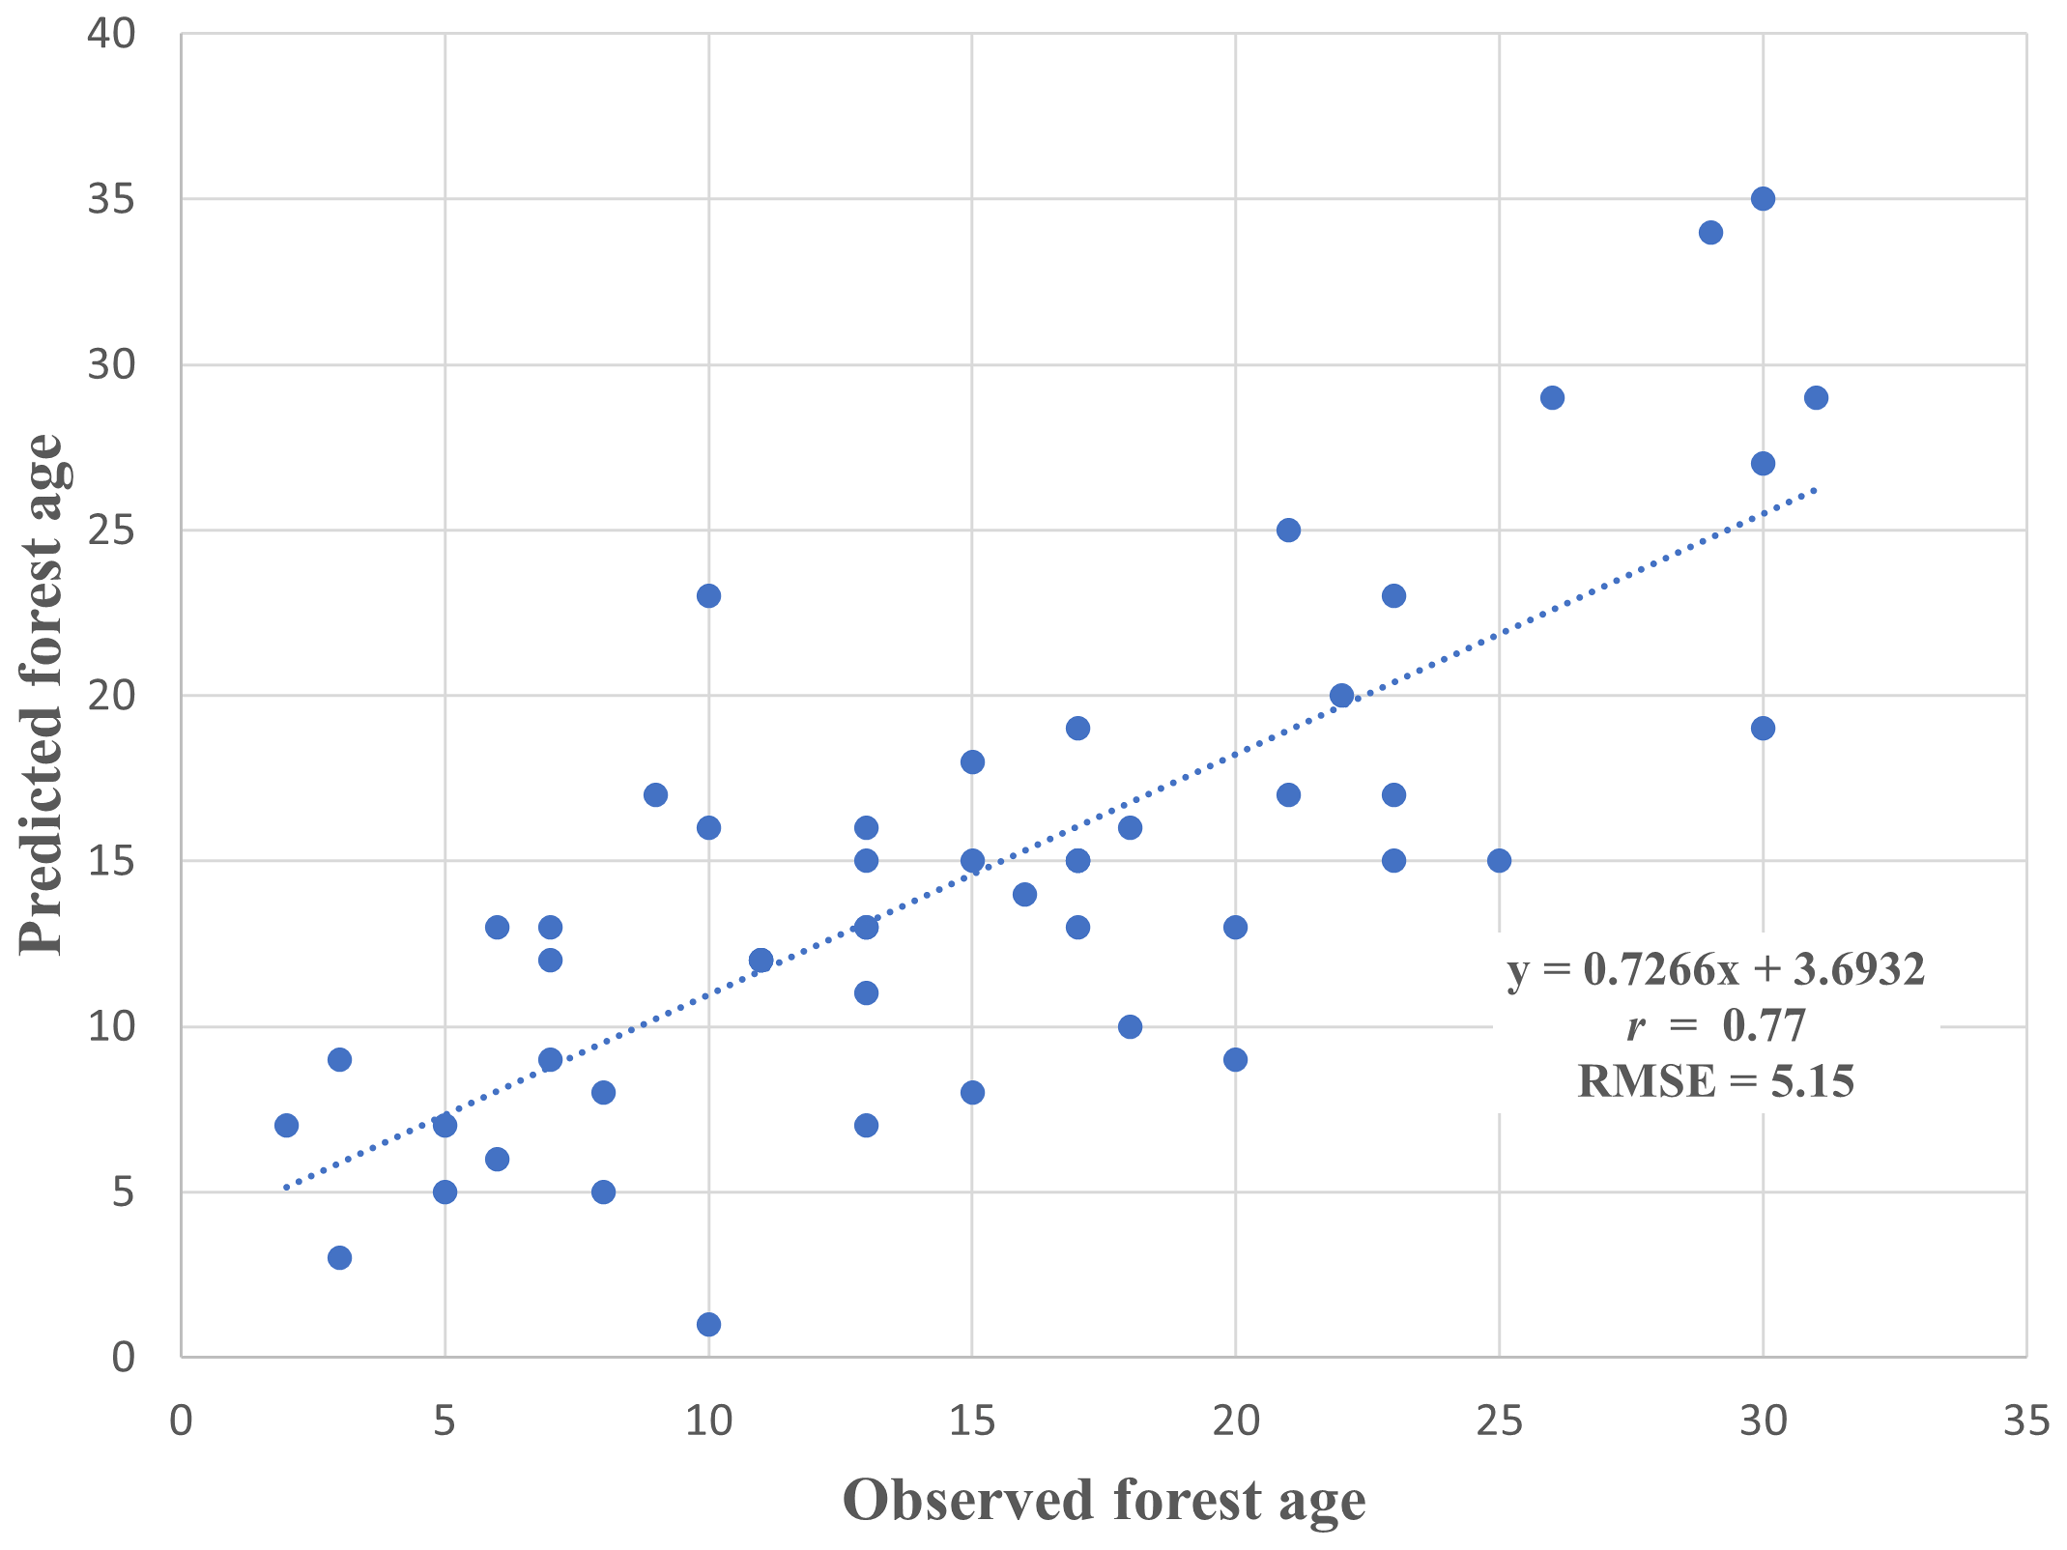
Figure 10Comparison between the forest age derived from field measurements (observed forest age) and predicted forest age.
4.2 Analysis of key parameters in CCDC
The sensitivity of the model to breakpoint detection directly affects the accuracy of stand age mapping, and the two parameters chiSquareProbability and minObservations play important roles in the model. To determine the optimal parameters, we selected eight regions in China (Fig. 11) for testing. These eight regions are all sized 0.5∘ × 0.5∘ and distributed in the east (Area 1 and Area 5), southwest (Area 2), central (Area 3), northeast (Area 4), northwest (Area 6), north (Area 7), and south (Area 8) regions of China. In this research, the value of the chiSquareProbability parameter was increased from 0.50 to 0.99, while minObservations was increased from 2 to 20.
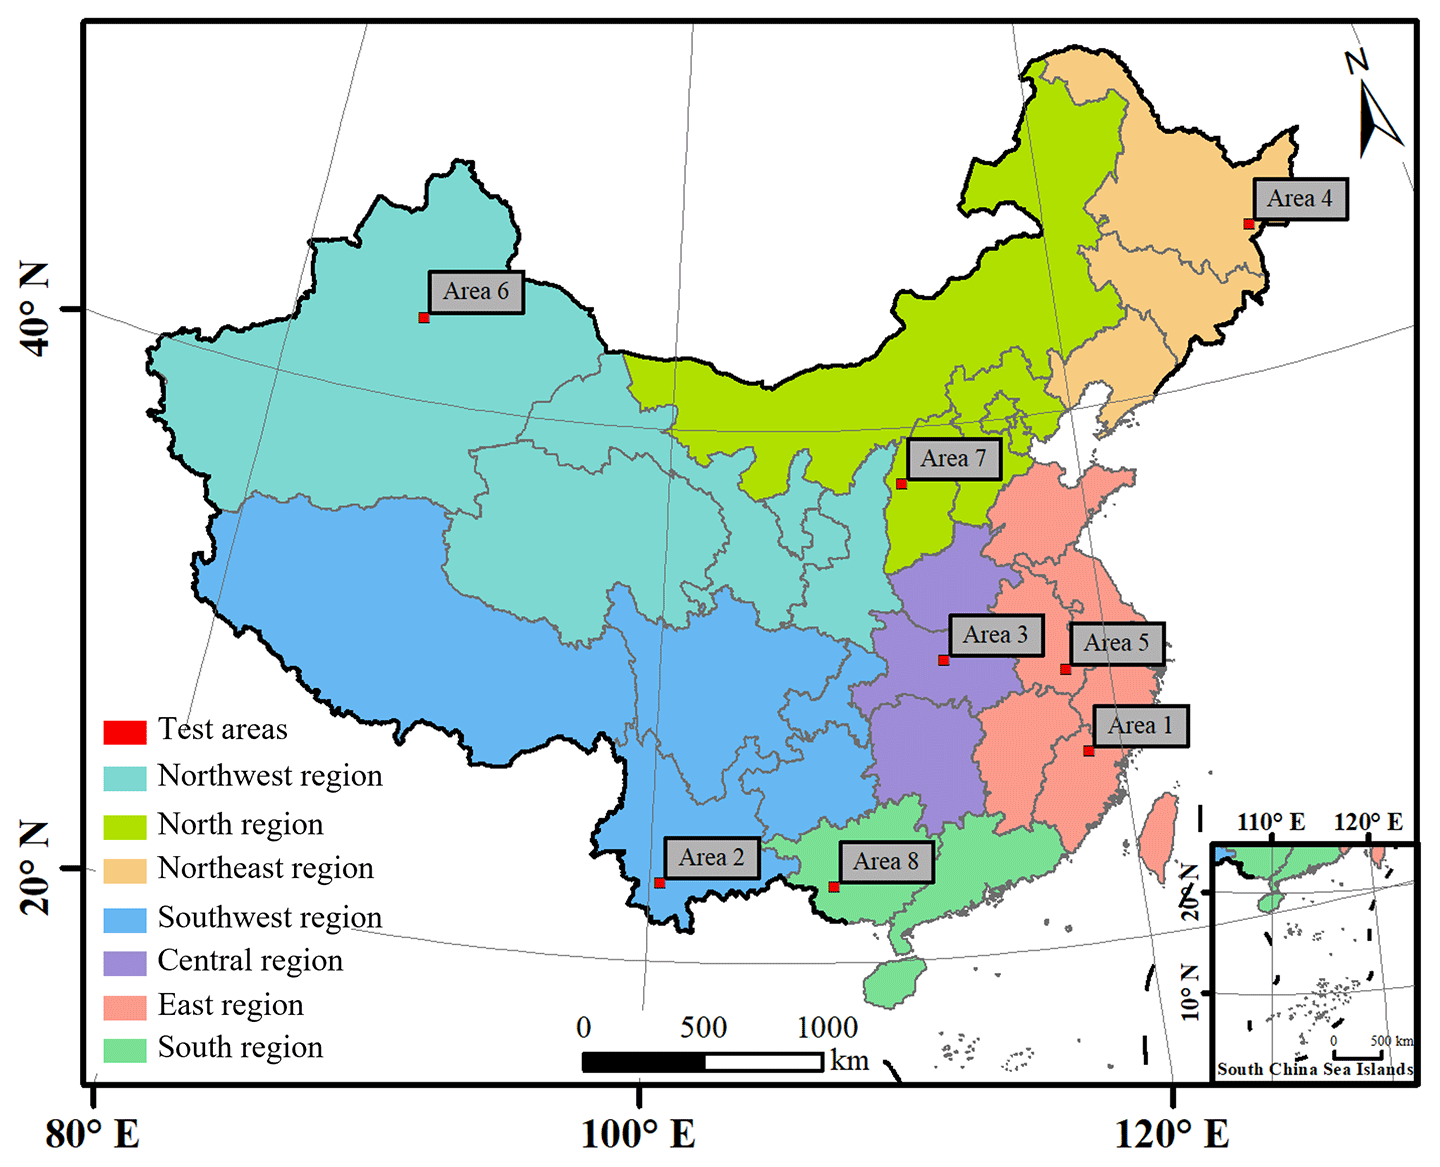
Figure 11Spatial distribution of the eight test areas for analyzing the influence of key parameters.
4.2.1 Analysis of chiSquareProbability
Figure 12a shows that the OA of stand age mapping in the eight areas varies with the choice of different chiSquareProbability values. The largest OAs of the other four areas except Area 3 and Area 8 occur when the chiSquareProbability value is around 0.98, whereas the largest OAs of Area 3 and Area 8 occur when the chiSquareProbability value is 0.82 and 0.80, respectively. The OAs of Area 3 and Area 8 reach the largest value earlier, as the forest land in these two areas is disturbed more frequently. In this case, the CCDC model requires a smaller chiSquareProbability value to detect more breakpoints. In addition, Fig. 12a shows that the OA increase in Area 2 is the fastest, with the smallest OA (70.16 %) observed when the chiSquareProbability value is 0.50 and the largest OA (90.35 %) observed when the chiSquareProbability value is 0.99. The largest and smallest OAs presented a difference of 20.19 %. The reasons for this phenomenon may be that the disturbance year of the forest in Area 2 was relatively late and that the forest experienced less disturbance. When the chiSquareProbability value is too small, more breakpoints will be detected incorrectly, which affects the OA of the forest age mapping.
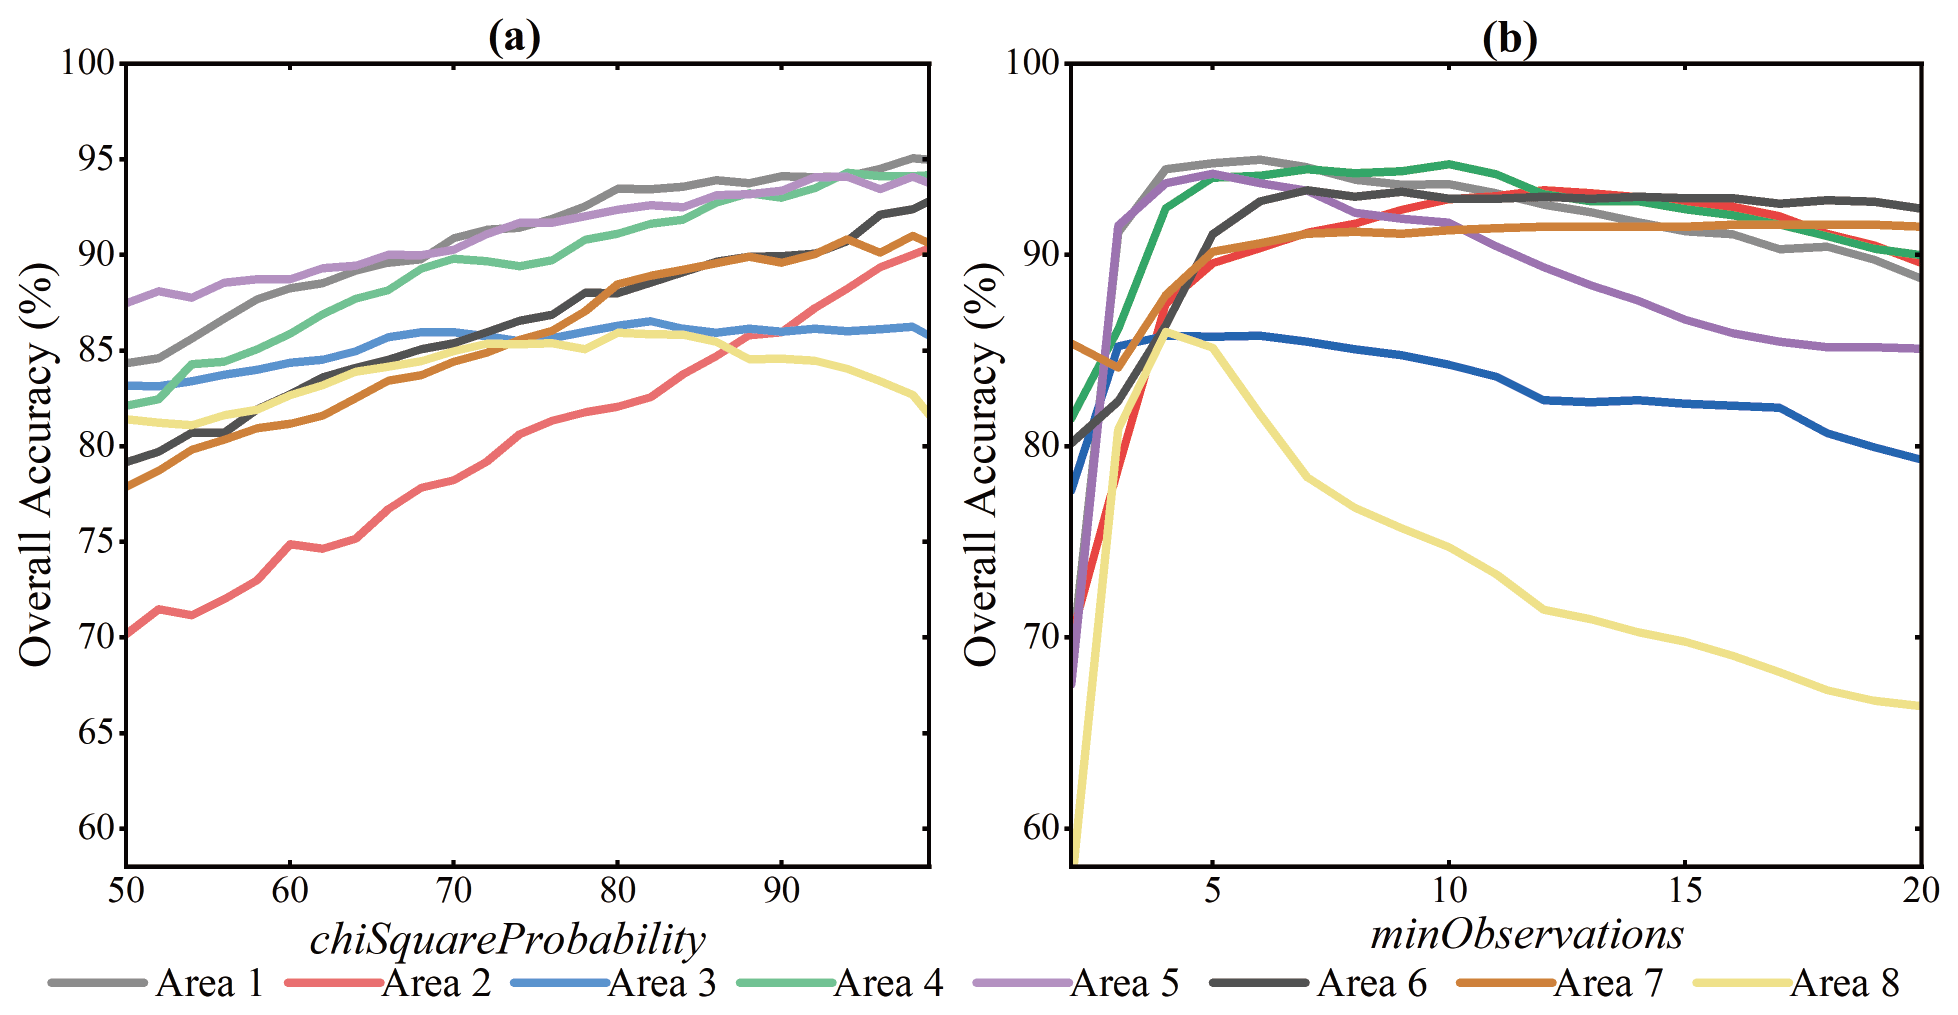
Figure 12OA of forest age under different values of (a) chiSquareProbability and (b) minObservations in eight regions.
Figure 13 shows the model performance when different chiSquareProbability values were used. Specifically, columns 1, 2, and 3 show the stand age maps of the eight regions when the parameter chiSquareProbability values are 0.50, 0.74, and 0.99, respectively. As the value of the parameter chiSquareProbability increases, the area of regrowth detected by the CCDC algorithm decreases. When the value was 0.50, the stand age map for each region contains a large number of misclassified regrowth areas. These misclassified regrowth areas are due mainly to the small values of chiSquareProbability, which make the model extremely sensitive to breakpoint detection.
Generally, there is a close relationship between forest restoration and forest loss. For this reason, FLH was added to the fourth column for convenient visual comparison. The color of FLH indicates the year of forest loss. As the earliest available year for FLH is 2000, the fourth column of Fig. 13 shows only the years of forest loss after 2000. The fifth column of Fig. 13 shows the corresponding fine-spatial-resolution Google Earth maps (GEMs). Clear traces of forest disturbance can be observed in the eight regions from the GEMs. These areas are more consistent with the dark red areas in the third column of the stand age maps.
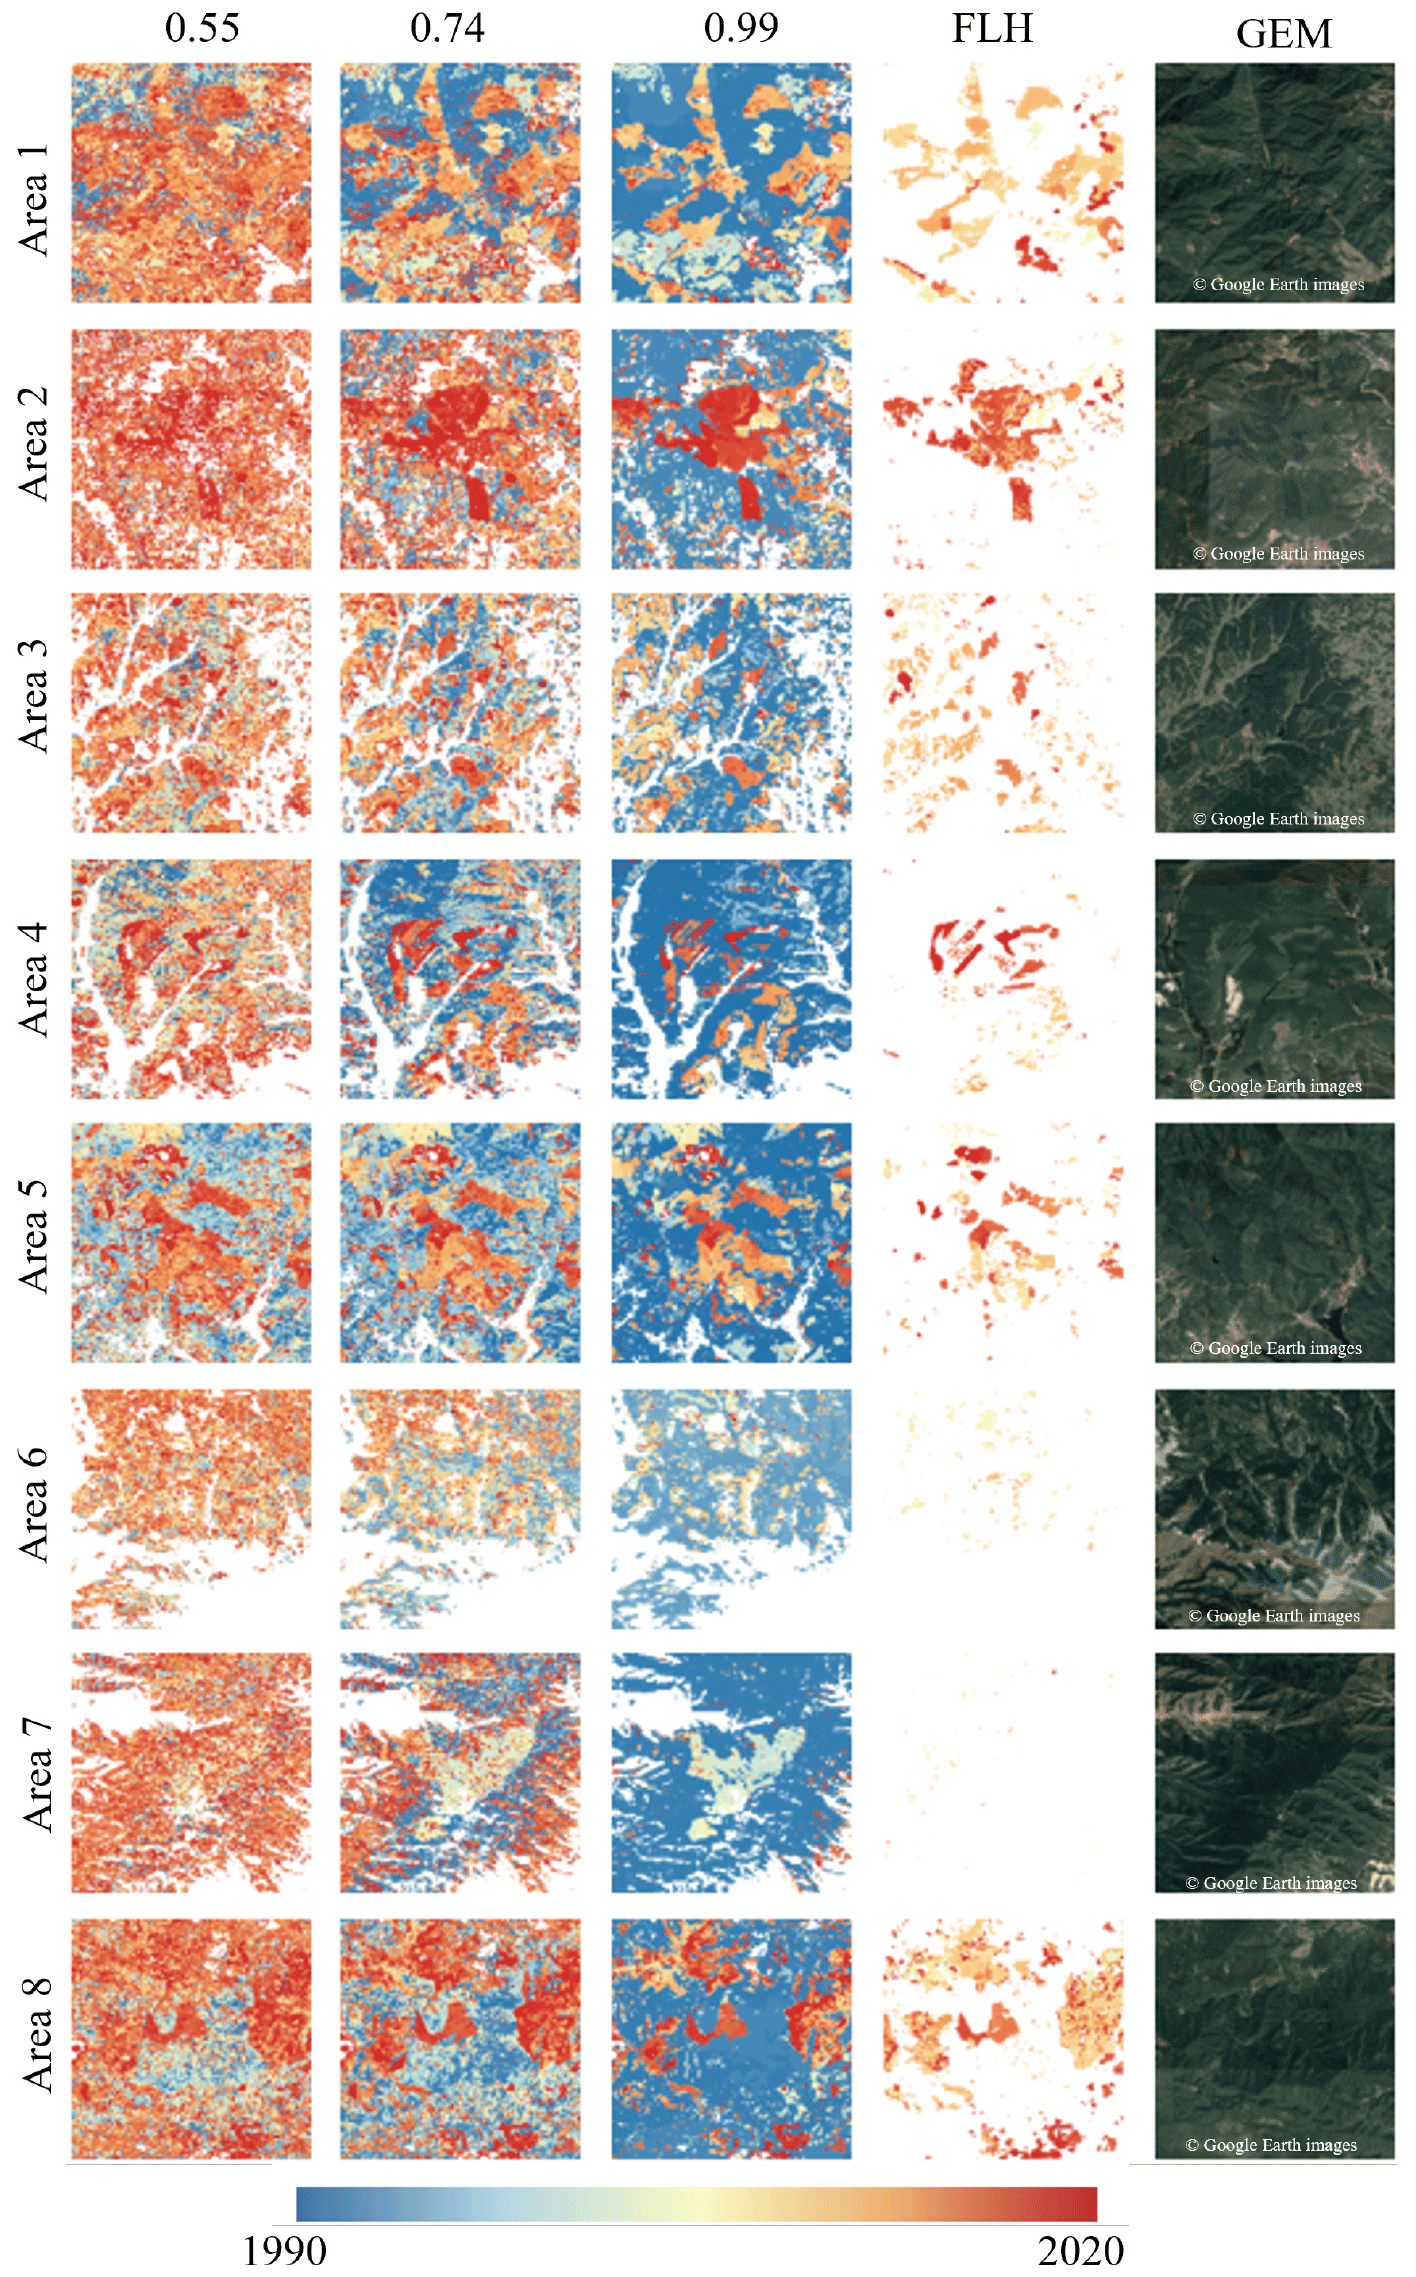
Figure 13Stand age maps of the eight regions (marked in Fig. 11) under different values of chiSquareProbability (0.55, 0.74, and 0.99).
4.2.2 Analysis of minObservations
Figure 12b shows that the OAs of stand age in the eight regions varied with minObservations. The OAs of stand age in the eight areas show a trend of initially increasing and then decreasing. This means that when the minObservations value is smaller, the CCDC model can detect more breakpoints while producing more misclassified regrowth values. When the minObservations value exceeds the optimal threshold, the model presents incorrect detection results. When the parameter is less than six, the OAs of the eight regions increase rapidly. When the parameter is greater than 12, the OAs of each region enter a stage of rapid decay. The largest OAs for both Area 1 (94.98 %) and Area 3 (85.78 %) occur when the values of minObservations are equal to six. The OAs of Area 8, Area 5, and Area 6 reach the maximum value when minObservations is four, five, and seven, respectively, while Area 4, Area 2, and Area 7 reach the maximum OA (94.75 %, 93.37 %, and 91.58 %, respectively) when the values of minObservations are 10, 12, and 16, respectively.
5.1 Spatial distribution of young forests in China
This research produced a young forest stand age map of China in 2020 with a spatial resolution of 30 m (Fig. 14a). To show the spatial distribution of young forest age more clearly, we divided the forest into four stand age classes, i.e., stand age classes I (1–10 years), II (11–20 years), III (21–31 years), and IV (>31 years). In the 1–31-year old forests, stand age class III accounted for the largest proportion (39.32 %), followed by stand age class II (38.34 %). Stand age class I (22.34 %) accounted for the smallest proportion. We referred to the fifth, sixth, seventh, and eighth national forest inventory data and found that the area of net gain planted forest is 102 520, 65 924, 84 311, and 76 416 km2 during 1994–1998, 1999–2003, 2004–2008, and 2009–2013, respectively (Liu et al., 2021). This means that there was less planted forest after 1999, which is consistent with our findings. Another reason may be that the country's early policies (specifically, the Returning Farmland to Forest Program and the Afforestation Program) were implemented effectively, and by 2000 many areas suitable for afforestation had been occupied.
Young forest land in China is distributed mainly in the southern provinces of China, such as Yunnan, Guangxi, Guangdong, and Fujian. As these provinces are located in a subtropical climate zone, abundant rainfall and suitable climatic conditions make them suitable for tree growth. In addition, Fig. 14c shows that there is more young regrowth in the Daxing'anling region of northeastern Inner Mongolia, partly because of the large possibility of forest fires in the virgin forests in this area, and large areas of forest have recovered to young regrowth after fire disturbance (Zhang et al., 2017). In addition, we found that this area is characterized by long snow accumulation periods and large mountain slopes; therefore, many pixels in this area were misclassified as young regrowth. In general, the growth rate of young regrowth in China showed a decreasing trend during the study period (1990–2020), indicating a decrease in the area available for afforestation.
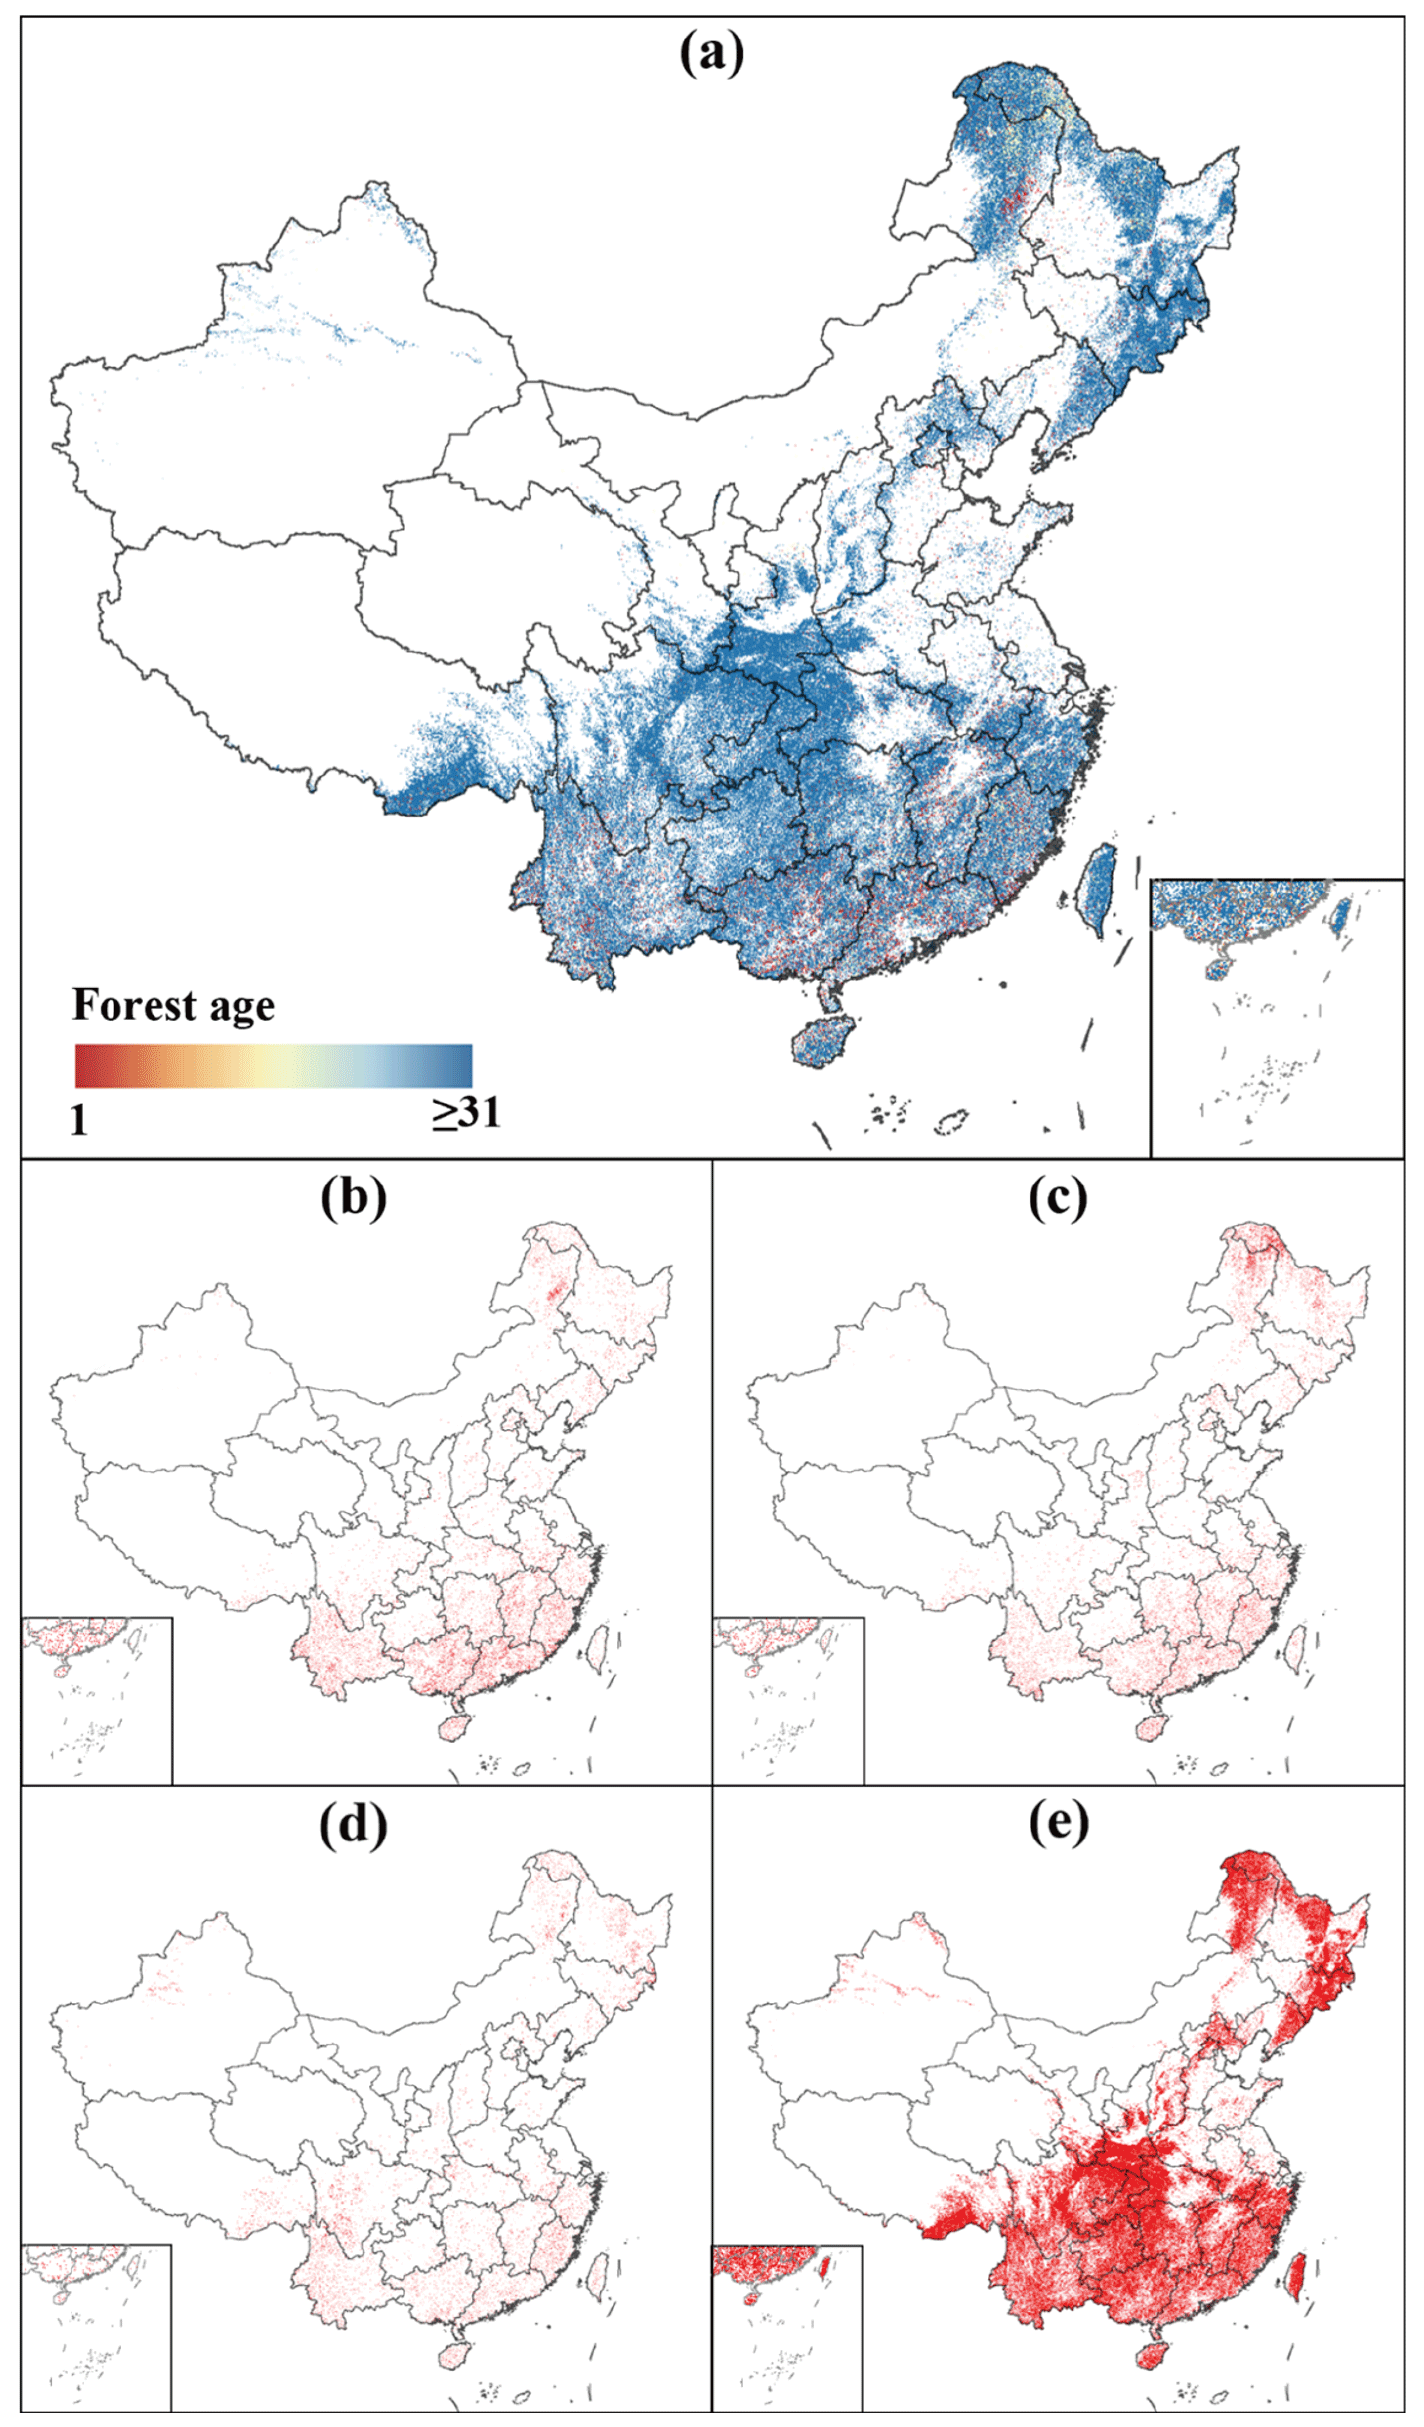
Figure 14Stand age map in China at 30 m spatial resolution. (a) Chinese stand ages and stand age classes, (b) 1–10 years, (c) 11–20 years, (d) 21–31 years, and (e) >31 years.
5.2 Average age of young forests in different provinces
Figure 15 shows the average age distribution of young forests across the provinces of China. Interestingly, the age is larger in the north than in the south and larger in the west than in the east. This phenomenon is driven mainly by natural and anthropogenic factors. Generally, tree growth in western China is restricted by the natural environment. The fragile ecological environment forces people to protect forests in this area, and the proportion of economically productive forests is small. Moreover, the Three-North Shelter Forest Program, which began in 1978, has enabled the effective protection of forest land in the northern region (Wang et al., 2007; Qiu et al., 2017). Therefore, the average forest age in the west is relatively large. On the other hand, a large number of eucalyptus plantations were distributed in southern China, leading to young forest regrowth in the south. Therefore, the average forest age is smaller. In addition, forests have experienced more disturbance due to rapid urban expansion in eastern and southern China (Meng et al., 2020).
The average age of young forests in each province was ranked in ascending order, with Tianjin, Guangxi, Shandong, and Guangdong ranking first (11.3 years), second (11.7 years), third (11.9 years), and fourth (12.2 years), respectively. These provinces are located in southern and eastern China. Furthermore, the average age of young forests in the Ningxia Hui Autonomous Region is relatively young and ranks fifth (12.6 years) as the forest resources of the Ningxia Hui Autonomous Region have further increased in the past 30 years based on the Returning Farmland to Forest Program, the Afforestation Program, and the Three-North Shelter Forest Program (Wang et al., 2007; Qiu et al., 2017). When the average age of young forests in each province was ranked in descending order, the top five provinces (cities and autonomous regions) were Xinjiang (25.7 years), Hong Kong Special Administrative Region (SAR) (20.3 years), Tibet (19.5 years), Qinghai (18.9 years), Sichuan (18.6 years), and Shaanxi (18.3 years). Except for Hong Kong SAR, the other four provinces are all in the western region because the special natural conditions in western China make afforestation or natural restoration of forests difficult. The average age of young forests in Hong Kong SAR is relatively large because of the limited afforestation in the area. Therefore, to further strengthen the role of China's young forest land in the “carbon neutrality” initiative, it is particularly important to carry out afforestation suitability assessments in China (especially in the western and northwestern regions) (Zhang et al., 2022).
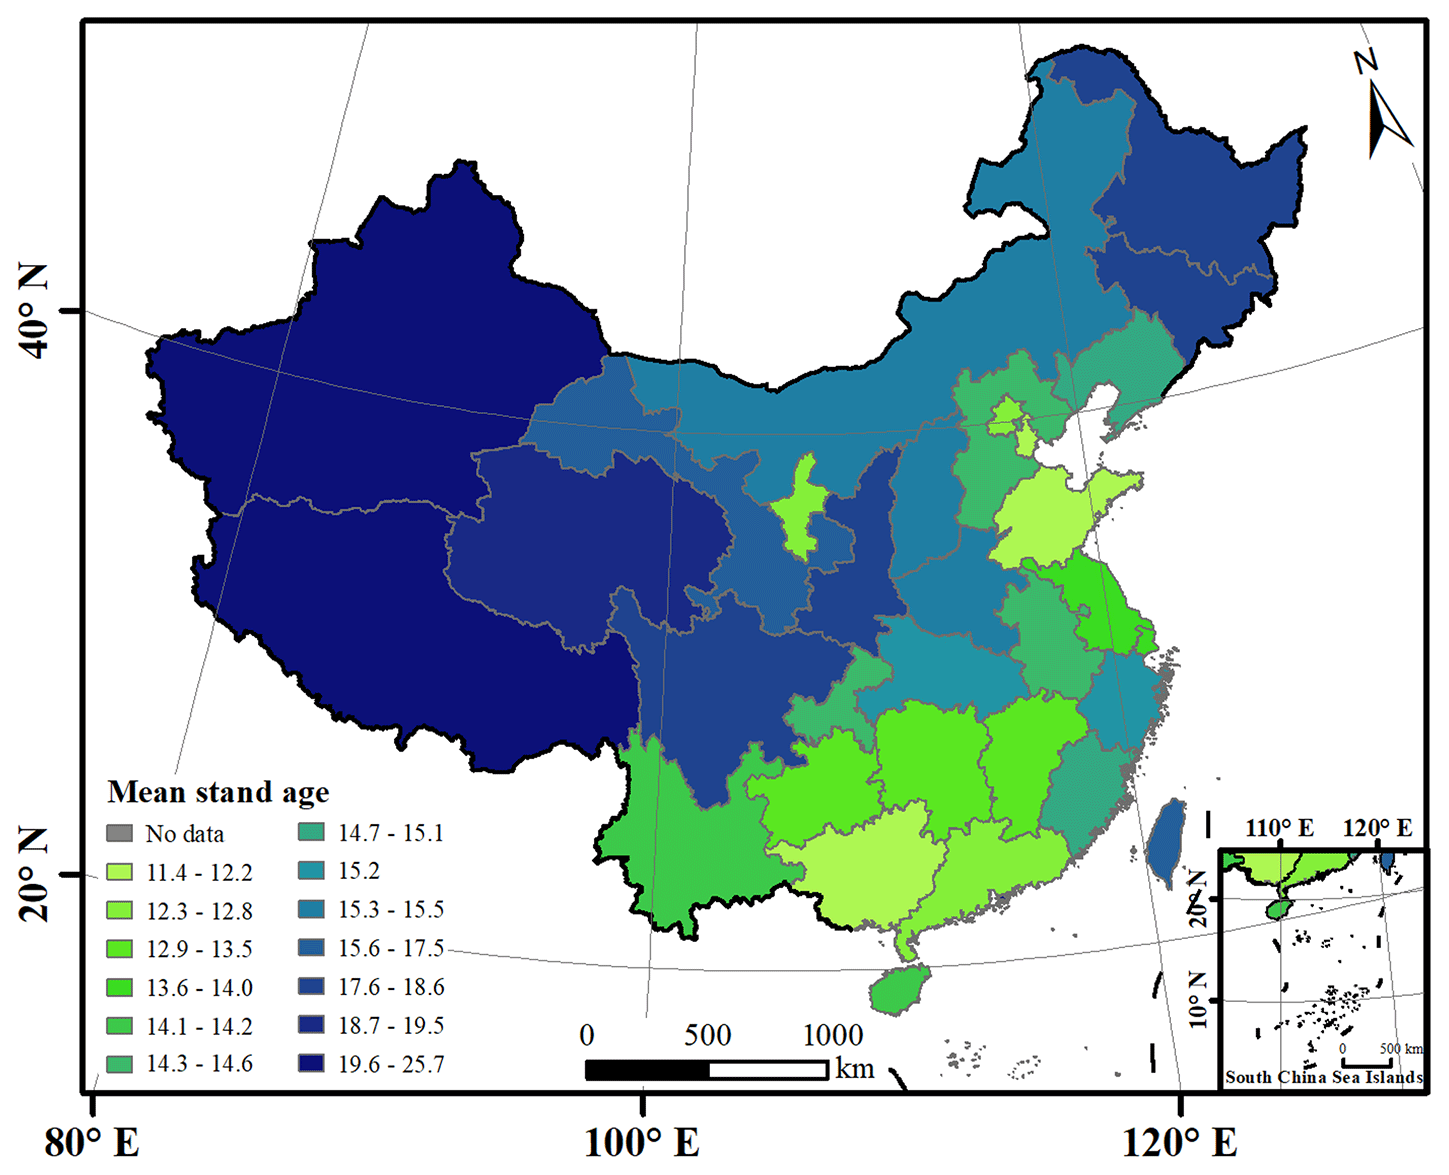
Figure 15The average age of young forests in various provinces in China.
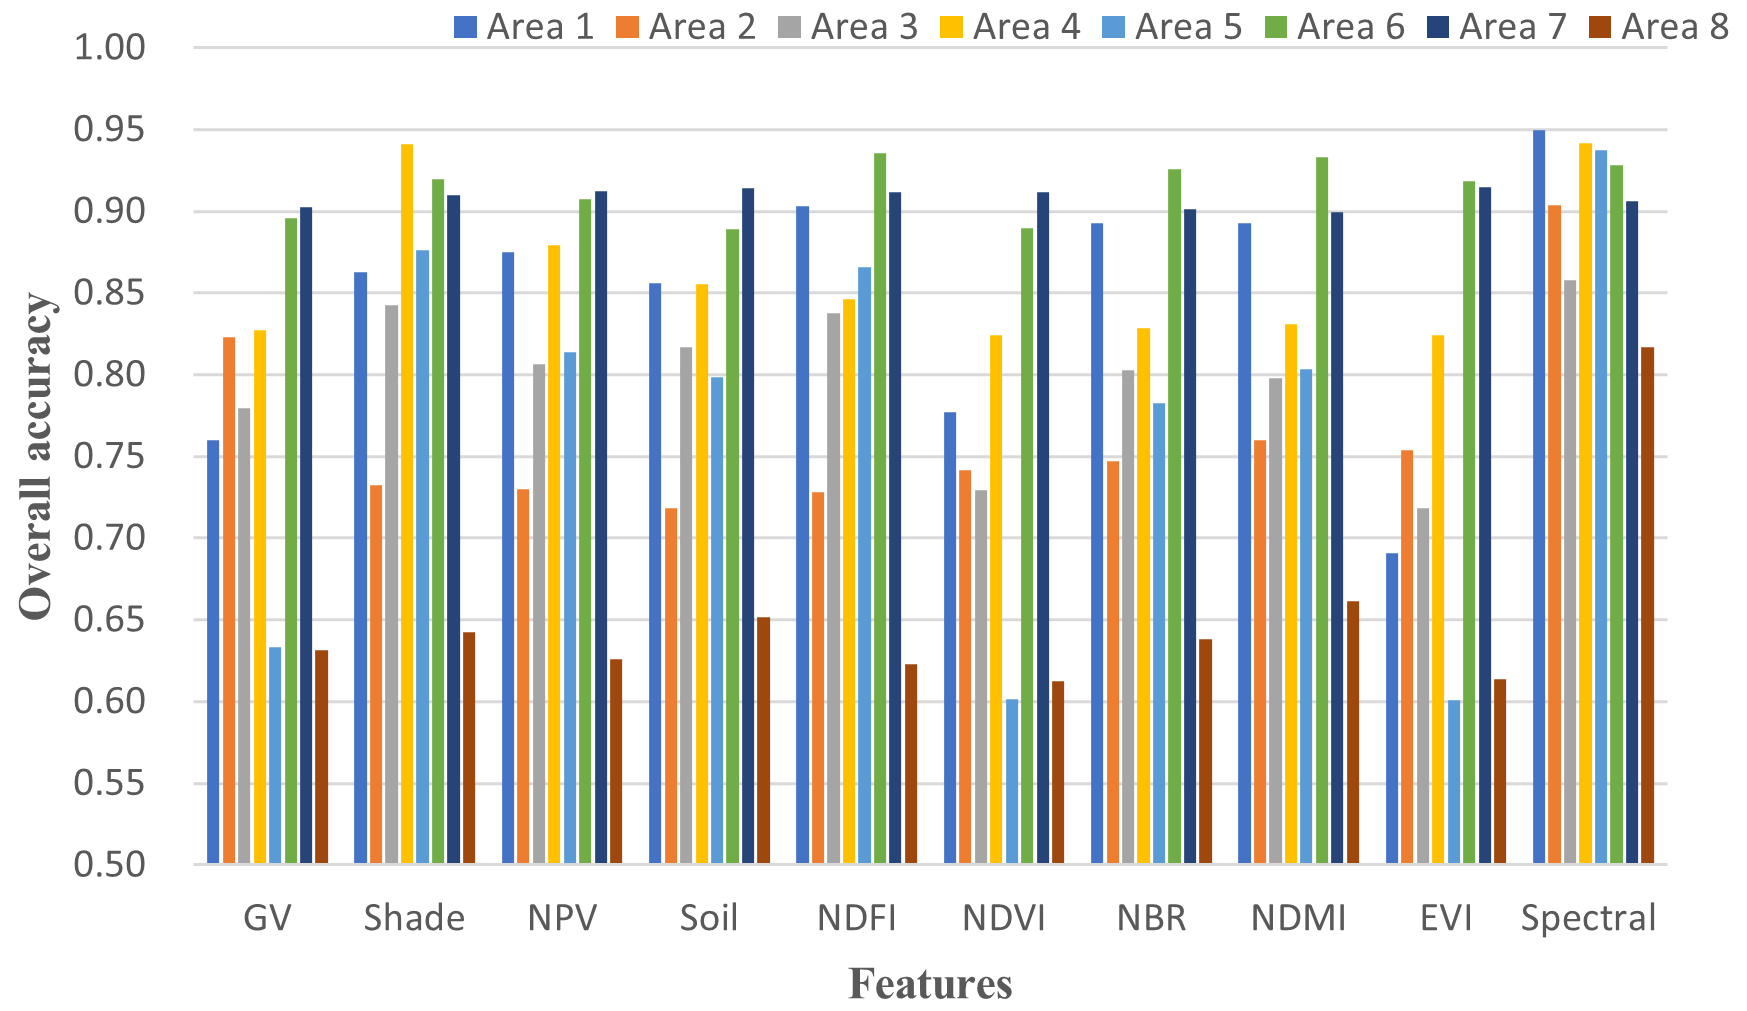
5.3 Effect of input features on the model
Several studies have used the normalized degradation fraction index (NDFI) to increase the accuracy of forest disturbance detection (Souza et al., 2005; Bullock et al., 2020; Chen et al., 2021). The NDFI is calculated from the abundance of several endmembers, including soil, shadow, green vegetation (GV), and nonphotosynthetic vegetation (NPV), through spectral unmixing. To explore the influence of different features on forest age mapping, this research first set the two parameters of chiSquareProbability and minObservations to 0.99 and 6, respectively, and then input the following different features into the CCDC model: spectral bands of Landsat images (spectral), abundance of four endmembers (GV, Shade, NPV, and Soil), and index features (NDFI, NDVI, normalized burning index (NBR), normalized difference moisture index (NDMI), and enhanced vegetation index, EVI). The steps of spectral unmixing were described by Chen et al. (2021).
Figure 16 shows the OAs of the eight regions with the input of different features. Using the original Landsat bands as the input to the model can achieve the greatest mapping accuracy. Except for the spectral feature, whose performance is relatively stable in the eight regions, the performance of the other features in the eight regions is quite different. For example, in Area 1, the mapping performance of the NDFI-based feature is the most satisfactory one (the OA is 90.29 %), and the performance of the GV-based feature is the weakest one (76.00 %); in Area 2, the performance of the GV-based feature is the most satisfactory one (the OA is 82.28 %), and the performance of the soil-based feature is the weakest one (the OA is 71.85 %). Generally, EVI (71.83 %), EVI and/or NDVI (82.43 %), and EVI (60.07 %) were the least predictive features in these three regions.
5.4 Whether to choose vegetation growing season images
To eliminate the influence of winter ice and snow and to improve model fitting, images of the peak vegetation growth season in a year are often selected as observation data, such as Landsat images from the 150th to 300th days of each year (Chen et al., 2021). However, this method of selecting parts of images of the year reduces the available information, especially in warmer regions (where snow and ice are short-lived or largely unaffected by snow and ice). This research compared the mapping accuracy when all the images and some images (the images of the 150th to 300th days of each year) were selected from the annual images as the model input. The OA of young forest stand age mapping using partial data as model input was 88.53 %. When using partial images, the OA of the national young forest age mapping was 1.75 % smaller than that when using all the images (90.28 %).
To further explore the mapping differences between the two input strategies, the difference in the OA for each province was calculated, as shown in Fig. 17. Except for Tianjin, the Ningxia Hui Autonomous Region, Heilongjiang, Jilin, and Qinghai, the OAs of using partial data in the other 27 provinces (cities and autonomous regions) are smaller than those from using all data. Among the 27 provinces (cities and autonomous regions), Tibet, Yunnan, and Guangdong show large differences, with differences in OA ranging from 14.93 % to 19.69 %, followed by Guangxi, Jiangsu, Shanghai, Henan, Fujian, Anhui, Hunan, and Hong Kong SAR (OA differences between 14.93 % and 4.70 %). Except for the abovementioned provinces (cities and autonomous regions), the OAs of the remaining provinces (cities and autonomous regions) are within a 4.70 % difference. The above comparison shows that the use of partial image sets generally reduces the mapping accuracy in most areas.
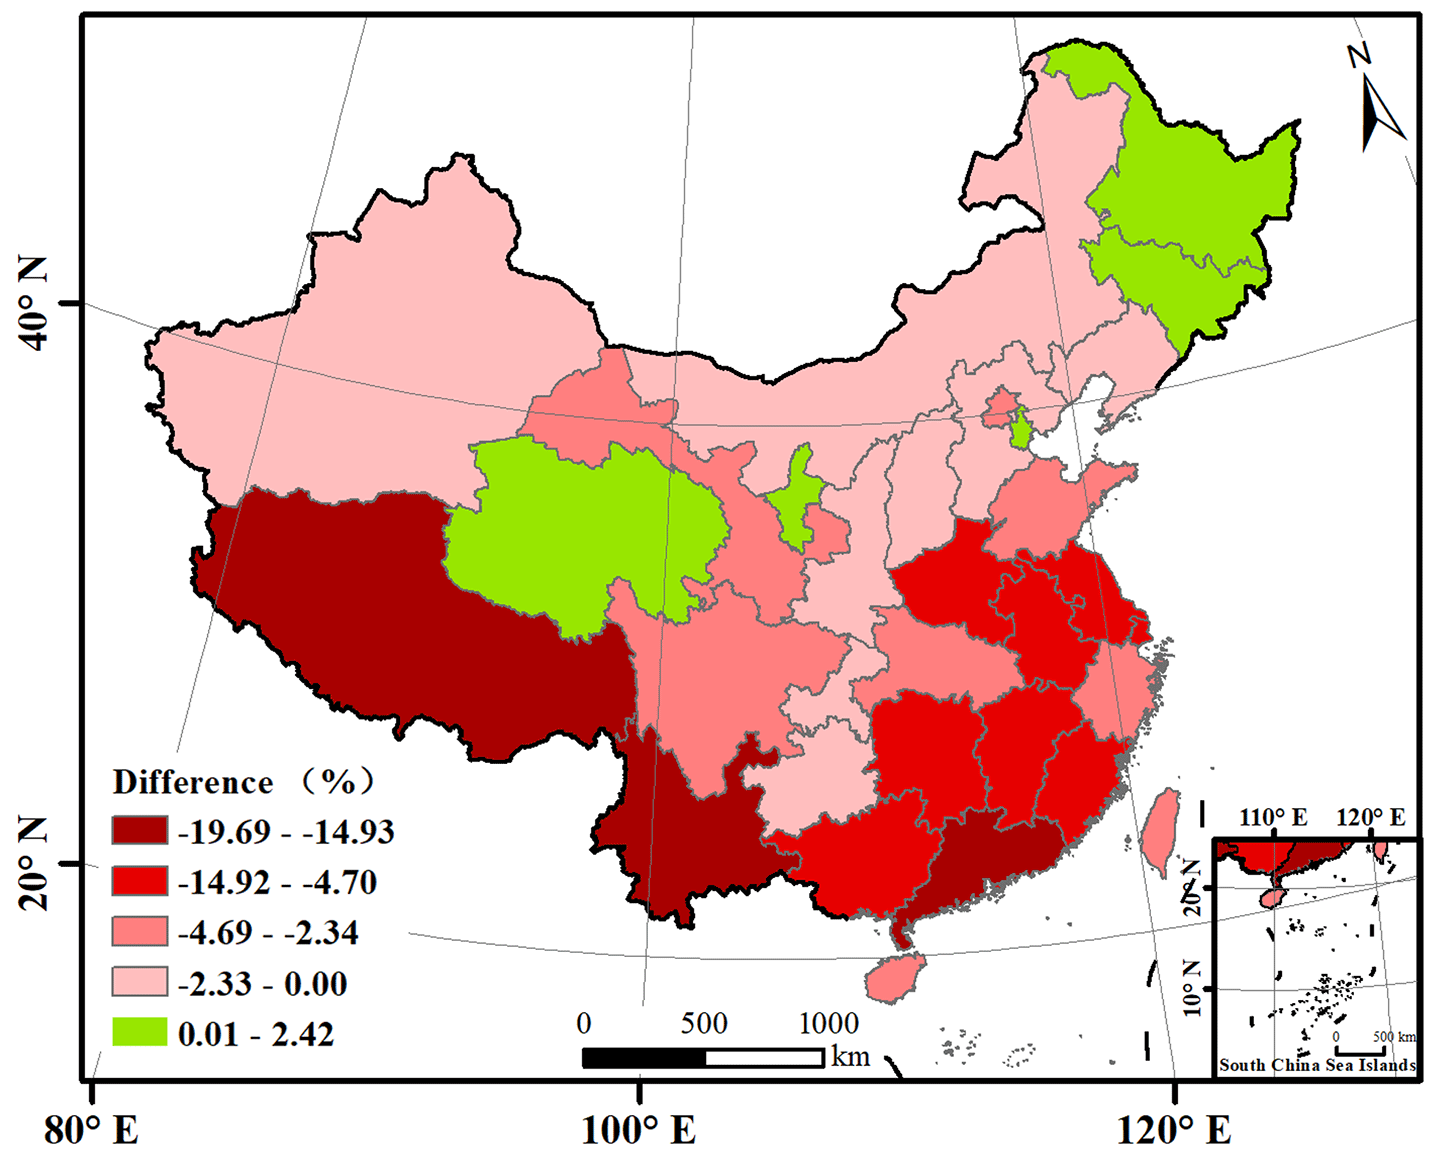
Figure 17Difference in OA (in units of province) between the use of partial and full data.
5.5 Application potential of the proposed method
This research used 436 967 Landsat tiles across China to map forest age at a spatial resolution of 30 m, which validated the feasibility of the proposed method for “big” data processing. In future, the model can be used to generate a global-scale young forest age dataset. This dataset will help build a global-scale forest carbon cycle model and potentially increase the estimation accuracy of carbon sources and sinks (Wang et al., 2020; Piao et al., 2022). In addition, studies have shown that multi-aged stands have a stronger carbon sink recovery ability after disturbance than even-aged stands (Tang et al., 2017); therefore, fine-spatial-resolution stand age datasets can be used to study the carbon sink potential of two types of stands at the global scale after disturbance.
This research not only provides basic scientific data for researchers, but also provides important references for policymakers and forest managers. Previous studies have shown that young forests have certain advantages in carbon sequestration but are weak in ecosystem services (Jonsson et al., 2020). That is, old forests are still irreplaceable in terms of services such as maintaining species diversity (Betts et al., 2022). Therefore, it is also necessary to maintain ecosystem services while increasing the carbon sequestration capacity of forest ecosystems under a climate change environment. The proposed CCDC-based method can estimate young forest age in real time and thus has the potential to be applied for dynamic monitoring of stand age structure, such as timely detection of forest age structure and prevention of rapid forest rejuvenation.
5.6 Uncertainty analysis
This research uses WorldCover2020 to determine the forest distribution; however, the classification process used for its products has certain uncertainties. Specifically, the data represent the state of forest cover in 2020 rather than the cover at a certain time of the year. Therefore, this paper assumed that WorldCover2020 represents the state of forest cover on 1 September 2020, which may lead to uncertainty, mainly for areas where forest disturbances occurred in 2020. The accuracy analysis of different provinces shows that the proposed method exhibits obvious differences in performance between different provinces. The reason may be that the forests in different regions have different climatic conditions and geographical environments (such as topography, slope, or altitude). This uncertainty also exists in the process of current studies that estimate stand age using the relationship between height and age of forest or the relationship between biomass and age of forest (Zhang et al., 2014, 2017). Different disturbance frequencies also have a certain impact on the model. For example, forest succession is faster in southern China (high disturbance frequency) but relatively slow in western and northeastern China (low disturbance frequency). Therefore, the values of chiSquareProbability and minObservations should be controlled adaptively for different forest disturbance frequencies.
This research predicted the annual forest age across China. However, it is difficult to validate the produced forest age at a temporal resolution of 1 year due to the lack of reference data. In this paper, coarse forest age classes (with 5-year intervals) were created to match the validation set by integrating multiple LULC products, which brings uncertainty in assessing the accuracy of the produced maps. In general, if forest age classes with finer temporal resolution are created, the accuracy is likely to be greater. However, a sufficient number of LULC products are needed to ensure the reliability of the reference data. Thus, it is necessary to maintain the balance between the temporal resolution of forest age classes and the number of LULC products. In future, it will be of great interest to evaluate the performance of the produced dataset using age classes with finer temporal resolution if the appropriate validation sets become available.
The produced 30 m map of young forest age across China in this research is openly available at https://doi.org/10.6084/m9.figshare.21627023.v7 (Xiao, 2022). The Landsat data and the auxiliary data are from the public data archive and user team of GEE (https://code.earthengine.google.com/, last access: 20 July 2023).
Mapping the age of young forest stands is of great significance for China's strategic target of carbon neutrality. Conventional stand age mapping methods rely heavily on forest inventory data, but the existing forest inventory data in China are difficult to obtain and are updated slowly. Moreover, the existing stand age products in China derived from remote-sensing images are of a coarse spatial resolution, which cannot meet the needs of stand calculations at the regional scale. In this research, we analyzed Landsat time-series images based on the CCDC model to produce a map of young stand age across the whole of China at 30 m spatial resolution. The advantage of the mapping method is that it does not rely on forest inventory data and enables rapid mapping of young forests on a global scale using the GEE platform. The results showed that the OA of the generated map of young stand age across China was 90.28 %. This dataset is significant for studying the ecosystem services and carbon cycles of young forests in China. The proposed CCDC-based method can be extended in future to global mapping of young forests.
YX designed the research, analyzed the data, wrote the original manuscript, and produced the dataset. QW revised the whole manuscript and provided the funding to support the research. XT and PMA provided direction and comments. All the authors edited and approved the final manuscript.
The contact author has declared that none of the authors has any competing interests.
Publisher’s note: Copernicus Publications remains neutral with regard to jurisdictional claims in published maps and institutional affiliations.
This research was supported by the National Natural Science Foundation of China under grant nos. 42222108, 42171345, 41971297, and 42221002.
This research has been supported by the National Natural Science Foundation of China (grant nos. 42222108, 42171345, 41971297, and 42221002).
This paper was edited by Hao Shi and reviewed by Zhen Yu and one anonymous referee.
Arévalo, P., Bullock, E. L., Woodcock, C. E., and Olofsson, P.: A Suite of Tools for Continuous Land Change Monitoring in Google Earth Engine, Front. Clim., 2, 111051, https://doi.org/10.3389/fclim.2020.576740, 2020.
Besnard, S., Koirala, S., Santoro, M., Weber, U., Nelson, J., Gütter, J., Herault, B., Kassi, J., N'Guessan, A., Neigh, C., Poulter, B., Zhang, T., and Carvalhais, N.: Mapping global forest age from forest inventories, biomass and climate data, Earth Syst. Sci. Data, 13, 4881–4896, https://doi.org/10.5194/essd-13-4881-2021, 2021.
Betts, M. G., Yang, Z., Hadley, A. S., Smith, A. C., Rousseau, J. S., Northrup, J. M., Nocera, J. J., Gorelick, N., and Gerber, B. D.: Forest degradation drives widespread avian habitat and population declines, Nature Ecology & Evolution, 6, 709–719, https://doi.org/10.1038/s41559-022-01737-8, 2022.
Bullock, E. L., Woodcock, C. E., and Olofsson, P.: Monitoring tropical forest degradation using spectral unmixing and Landsat time series analysis, Remote Sens. Environ., 238, 110968, https://doi.org/10.1016/j.rse.2018.11.011, 2020.
Champion, I., Germain, C., Da Costa, J. P., Alborini, A., and Dubois-Fernandez, P.: Retrieval of Forest Stand Age From SAR Image Texture for Varying Distance and Orientation Values of the Gray Level Co-Occurrence Matrix, IEEE Geosci. Remote S., 11, 5–9, https://doi.org/10.1109/LGRS.2013.2244060, 2014.
Chen, C., Park, T., Wang, X., Piao, S., Xu, B., Chaturvedi, R. K., Fuchs, R., Brovkin, V., Ciais, P., Fensholt, R., Tømmervik, H., Bala, G., Zhu, Z., Nemani, R. R., and Myneni, R. B.: China and India lead in greening of the world through land-use management, Nature Sustainability, 2, 122–129, https://doi.org/10.1038/s41893-019-0220-7, 2019.
Chen, D., Loboda, T. V., Krylov, A., and Potapov, P. V.: Mapping stand age dynamics of the Siberian larch forests from recent Landsat observations, Remote Sens. Environ., 187, 320–331, 2016.
Chen, F., Guo, Y., Huang, M., Feng, W., Ye, Q., Liu, J., and Li, X.: Community structure characteristics and management strategies of Castanopsis hystrix plantation with different restoration year, Journal of Anhui Agricultural University, 49, 48–55, https://doi.org/10.13610/j.cnki.1672-352x.20220325.023, 2022.
Chen, S., Woodcock, C. E., Bullock, E. L., Arévalo, P., Torchinava, P., Peng, S., and Olofsson, P.: Monitoring temperate forest degradation on Google Earth Engine using Landsat time series analysis, Remote Sens. Environ., 265, 112648, https://doi.org/10.1016/j.rse.2021.112648, 2021.
DeVries, B., Verbesselt, J., Kooistra, L., and Herold, M.: Robust monitoring of small-scale forest disturbances in a tropical montane forest using Landsat time series, Remote Sens. Environ., 161, 107–121, https://doi.org/10.1016/j.rse.2015.02.012, 2015.
Diao, J., Feng, T., Li, M., Zhu, Z., Liu, J., Biging, G., Zheng, G., Shen, W., Wang, H., Wang, J., and Ji, B.: Use of vegetation change tracker, spatial analysis, and random forest regression to assess the evolution of plantation stand age in Southeast China, Ann. For. Sci., 77, 27, https://doi.org/10.1007/s13595-020-0924-x, 2020.
Dumouchel, W. and O'Brien, F.: Integrating a Robust Option into a Multiple Regression Computing Environment, Computing and Graphics in Statistics, 36, 41–48, 1992.
Feng, W., Li, J., Zhou, C., Jiang, X., and Chen, J.: Soil aggregates and organic carbon status of Liriodendron chinense plantation at different ages, Journal of Central South University of Forestry & Technology, 41, 133–141, https://doi.org/10.14067/j.cnki.1673-923x.2021.02.016, 2021.
Han, H., Zhang, X., Song, G., Ma, Y., and Wang, Y.: Study on soil moisture of Pinus sylvestris var. mongolica plantations at different ages in Zhanggutai, Liaoning Forestry Science & Technology, 315, 7–11, 2022.
Hansen, M. C., Potapov, P. V., Moore, R., Hancher, M., Turubanova, S. A., Tyukavina, A., Thau, D., Stehman, S. V., Goetz, S. J., Loveland, T. R., Kommareddy, A., Egorov, A., Chini, L., Justice, C. O., and Townshend, J. R. G.: High-resolution global maps of 21st-century forest cover change, Science, 342, 850–853, https://doi.org/10.1126/science.1244693, 2013.
He, L., Chen, J. M., Zhang, S., Gomez, G., Pan, Y., McCullough, K., Birdsey, R., and Masek, J. G.: Normalized algorithm for mapping and dating forest disturbances and regrowth for the United States, International Journal of Applied Earth Observation and Geoinformation, 13, 236–245, https://doi.org/10.1016/j.jag.2010.12.003, 2011.
Hong, T., He, C., Huang, B., Chen, C., Li, J., Lin, H., and Wu, C.: Carbon content, carbon storage and distribution pattern of carbon pool of Vernicia montana plantation with different stand ages, Journal of Plant Resources and Environment, 30, 9–16, 2021.
Huang, C., Goward, S. N., Masek, J. G., Thomas, N., Zhu, Z., and Vogelmann, J. E.: An automated approach for reconstructing recent forest disturbance history using dense Landsat time series stacks, Remote Sens. Environ., 114, 183–198, https://doi.org/10.1016/j.rse.2009.08.017, 2010.
Jonsson, M., Bengtsson, J., Moen, J., Gamfeldt, L., and Snall, T.: Stand age and climate influence forest ecosystem service delivery and multifunctionality, Environ. Res. Lett., 15, 0940a8, https://doi.org/10.1088/1748-9326/abaf1c, 2020.
Karra, K., Kontgis, C., Statman-Weil, Z., Mazzariello, J. C., Mathis, M., and Brumby, S. P. (Eds.): Global land use/land cover with Sentinel 2 and deep learning, in: 2021 IEEE International Geoscience and Remote Sensing Symposium IGARSS, Brussels, Belgium, 11–16 July 2021, 4704–4707, https://doi.org/10.1109/IGARSS47720.2021.9553499, 2021.
Kauffman, J. S. and Prisley, S. P.: Automated estimation of forest stand age using vegetation change tracker and machine learning, Mathematical and Computational Forestry & Natural-Resource Sciences, 8, 4–13, 2016.
Kennedy, R. E., Yang, Z., and Cohen, W. B.: Detecting trends in forest disturbance and recovery using yearly Landsat time series: 1. LandTrendr – Temporal segmentation algorithms, Remote Sens. Environ., 114, 2897–2910, https://doi.org/10.1016/j.rse.2010.07.008, 2010.
Kuusinen, N., Tomppo, E., Shuai, Y., and Berninger, F.: Effects of forest age on albedo in boreal forests estimated from MODIS and Landsat albedo retrievals, Remote Sens. Environ., 145, 145–153, https://doi.org/10.1016/j.rse.2014.02.005, 2014.
Li, C., Xian, G., Zhou, Q., and Pengra, B. W.: A novel automatic phenology learning (APL) method of training sample selection using multiple datasets for time-series land cover mapping, Remote Sens. Environ., 266, 112670, https://doi.org/10.1016/j.rse.2021.112670, 2021.
Li, P., Ling, T., Yang, Z., Chen, H., Yan, P., and Lu, S.: Responses of Soil and Leaf Nutrients to Different Stand Ages in Pinus massoniana Plantation, Journal of Northwest Forestry University, 37, 9–16, 2021.
Liu, S., Huang, X., Peng, Z., Lin, W., Zhao, S., Wu, Y., Chen, Y., Xue, X., Wang, C.: Spatio-temporal Analysis of Forestation Area Changes in China (1991–2014), Journal of Global Change Data & Discovery, 5, 37–44, https://doi.org/10.3974/geodp.2021.01.05, 2021.
Loboda, T. V. and Chen, D.: Spatial distribution of young forests and carbon fluxes within recent disturbances in Russia, Glob. Change Biol., 23, 138–153, https://doi.org/10.1111/gcb.13349, 2017.
Lu, D., Chen, Q., Wang, G., Liu, L., Li, G., and Moran, E.: A survey of remote sensing-based aboveground biomass estimation methods in forest ecosystems, Int. J. Digit. Earth, 9, 63–105, https://doi.org/10.1080/17538947.2014.990526, 2016.
Lu, Y., Ranjitkar, S., Harrison, R. D., Xu, J., Ou, X., Ma, X., and He, J.: Selection of Native Tree Species for Subtropical Forest Restoration in Southwest China, PloS one, 12, e0170418, https://doi.org/10.1371/journal.pone.0170418, 2017.
Meng, L., Sun, Y., and Zhao, S.: Comparing the spatial and temporal dynamics of urban expansion in Guangzhou and Shenzhen from 1975 to 2015: A case study of pioneer cities in China's rapid urbanization, Land Use Policy, 97, 104753, https://doi.org/10.1016/j.landusepol.2020.104753, 2020.
Pan, Y., Chen, J. M., Birdsey, R., McCullough, K., He, L., and Deng, F.: Age structure and disturbance legacy of North American forests, Biogeosciences, 8, 715–732, https://doi.org/10.5194/bg-8-715-2011, 2011.
Piao, S., He, Y., Wang, X., and Chen, F.: Estimation of China's terrestrial ecosystem carbon sink: Methods, progress and prospects, Science China Earth Sciences, 65, 641–651, 2022.
Pinto, N., Simard, M., and Dubayah, R.: Using InSAR Coherence to Map Stand Age in a Boreal Forest, Remote Sensing, 5, 42–56, https://doi.org/10.3390/rs5010042, 2013.
Powell, S. L., Cohen, W. B., Healey, S. P., Kennedy, R. E., Moisen, G. G., Pierce, K. B., and Ohmann, J. L.: Quantification of live aboveground forest biomass dynamics with Landsat time-series and field inventory data: A comparison of empirical modeling approaches, Remote Sens. Environ., 114, 1053–1068, https://doi.org/10.1016/j.rse.2009.12.018, 2010.
Qiu, B., Chen, G., Tang, Z., Lu, D., Wang, Z., and Chen, C.: Assessing the Three-North Shelter Forest Program in China by a novel framework for characterizing vegetation changes, ISPRS J. Photogramm., 133, 75–88, https://doi.org/10.1016/j.isprsjprs.2017.10.003, 2017.
Racine, E. B., Coops, N. C., St-Onge, B., and Begin, J.: Estimating Forest Stand Age from LiDAR-Derived Predictors and Nearest Neighbor Imputation, Forest Sci., 60, 128–136, https://doi.org/10.5849/forsci.12-088, 2014.
Sexton, J. O., Song, X.-P., Feng, M., Noojipady, P., Anand, A., Huang, C., Kim, D.-H., Collins, K. M., Channan, S., DiMiceli, C., and Townshend, J. R.: Global, 30-m resolution continuous fields of tree cover: Landsat-based rescaling of MODIS vegetation continuous fields with lidar-based estimates of error, Int. J. Digit. Earth, 6, 427–448, https://doi.org/10.1080/17538947.2013.786146, 2013.
Shen, W. J., Li, M. S., and Huang C Q: Review of remote sensing algorithms for monitoring forest disturbance from time series and multi-source data fusion, Journal of Remote Sensing, 22, 1005–1022, 2018.
Shimada, M., Itoh, T., Motooka, T., Watanabe, M., Shiraishi, T., Thapa, R., and Lucas, R.: New global forest/non-forest maps from ALOS PALSAR data (2007–2010), Remote Sens. Environ., 155, 13–31, https://doi.org/10.1016/j.rse.2014.04.014, 2014.
Song, X., Deng, Z., Dong, H., Guo, Y., Wu, W., and Wang, D.: Study on Plant Diversity of Three Different Age Plantations in Huazhou, Guangdong Province, Forestry and Environmental Science, 37, 108–116, 2021.
Souza, C. M., Roberts, D. A., and Cochrane, M. A.: Combining spectral and spatial information to map canopy damage from selective logging and forest fires, Remote Sens. Environ., 98, 329–343, https://doi.org/10.1016/j.rse.2005.07.013, 2005.
Tang, X., Li, H., Ma, M., Yao, L., Peichl, M., Arain, A., Xu, X., and Goulden, M.: How do disturbances and climate effects on carbon and water fluxes differ between multi-aged and even-aged coniferous forests?, Sci. Total Environ., 599, 1583–1597, https://doi.org/10.1016/j.scitotenv.2017.05.119, 2017.
Thom, D. and Keeton, W. S.: Stand structure drives disparities in carbon storage in northern hardwood-conifer forests, Forest Ecol. Manag., 442, 10–20, https://doi.org/10.1016/j.foreco.2019.03.053, 2019.
Tong, X., Brandt, M., Yue, Y., Ciais, P., Rudbeck Jepsen, M., Penuelas, J., Wigneron, J.-P., Xiao, X., Song, X.-P., Horion, S., Rasmussen, K., Saatchi, S., Fan, L., Wang, K., Zhang, B., Chen, Z., Wang, Y., Li, X., and Fensholt, R.: Forest management in southern China generates short term extensive carbon sequestration, Nat. Commun., 11, 129, https://doi.org/10.1038/s41467-019-13798-8, 2020.
Verbesselt, J., Zeileis, A., and Herold, M.: Near Real-Time Disturbance Detection Using Satellite Image Time Series: Drought Detection in Somalia, Remote Sens. Environ., 123, 98–108, https://doi.org/10.1016/j.rse.2012.02.022, 2012.
Vermote, E., Roger, J. C., Franch, B., and Skakun, S.: LaSRC (Land Surface Reflectance Code): Overview, application and validation using MODIS, VIIRS, LANDSAT and Sentinel 2 data's, 2018 IEEE International Geoscience and Remote Sensing Symposium IGARSS, Valencia, Spain, 22–27 July 2018, 8173–8176, https://doi.org/10.1109/IGARSS.2018.8517622, 2018.
Vilen, T., Gunia, K., Verkerk, P. J., Seidl, R., Schelhaas, M.-J., Lindner, M., and Bellassen, V.: Reconstructed forest age structure in Europe 1950-2010, Forest Ecol. Manag., 286, 203–218, https://doi.org/10.1016/j.foreco.2012.08.048, 2012.
Wang, G., Innes, J. L., Lei, J., Dai, S., and Wu, S. W.: China's forestry reforms, Science, 318, 1556–1557, https://doi.org/10.1126/science.1147247, 2007.
Wang, J., Feng, L., Palmer, P. I., Liu, Y., Fang, S., Bösch, H., O'Dell, C. W., Tang, X., Yang, D., Liu, L., and Xia, C.: Large Chinese land carbon sink estimated from atmospheric carbon dioxide data, Nature, 586, 720–723, https://doi.org/10.1038/s41586-020-2849-9, 2020.
Wu, X., Jiang, X., Liu, H., Allen, C., Li, X., Wang, P., Li, Z., Yang, Y., Zhang, S., Shi, F., Zhu, J., Yu, P., Zhou, M., Zhao, P., Wang, Y., Yue, C., and Chen, D.: CPSDv0: a forest stand structure database for plantation forests in China, Big Earth Data, 7, 212–230, https://doi.org/10.1080/20964471.2021.2012911, 2023.
Xiao, Y.: 30 m Map of Young Forest Age in China, Figshare [data set], https://doi.org/10.6084/m9.figshare.21627023.v7, 2022.
Xu, X., Li, B., Liu, X., Li, X., and Shi, Q.: Mapping annual global land cover changes at a 30 m resolution from 2000 to 2015, National Remote Sensing Bulletin, 25, 1896–1916, https://doi.org/10.11922/sciencedb.976, 2021.
Yin, X., Zhao, L., Fang, Q., and Ding, G.: Differences in Soil Physicochemical Properties in Different-Aged Pinus massoniana Plantations in Southwest China, Forests, 12, 987, https://doi.org/10.3390/f12080987, 2021.
Yu, Z., Zhao, H., Liu, S., Zhou, G., Fang, J., Yu, G., Tang, X., Wang, W., Yan, J., Wang, G., Ma, K., Li, S., Du, S., Han, S., Ma, Y., Zhang, D., Liu, J., Liu, S., Chu, G., Zhang, Q., and Li, Y.: Mapping forest type and age in China's plantations, Sci. Total Environ., 744, 140790, https://doi.org/10.1016/j.scitotenv.2020.140790, 2020.
Zanaga, D., van de Kerchove, R., Keersmaecker, W. de, Souverijns, N., Brockmann, C., Quast, R., Wevers, J., Grosu, A., Paccini, A., Vergnaud, S., Cartus, O., Santoro, M., Fritz, S., Georgieva, I., Lesiv, M., Carter, S., Herold, M., Li, L., Tsendbazar, N.-E., Ramoino, F., and Arino, O.: ESA WorldCover 10 m 2020 v100, Zenodo [data set], https://doi.org/10.5281/zenodo.5571936, 2021.
Zhang, C., Ju, W., Chen, J. M., Li, D., Wang, X., Fan, W., Li, M., and Zan, M.: Mapping forest stand age in China using remotely sensed forest height and observation data, J. Geophys. Res.-Biogeo., 119, 1163–1179, https://doi.org/10.1002/2013JG002515, 2014.
Zhang, L., Sun, P., Huettmann, F., and Liu, S.: Where should China practice forestry in a warming world?, Glob. Change Biol., 28, 2461–2475, https://doi.org/10.1111/gcb.16065, 2022.
Zhang, Y., Yao, Y., Wang, X., Liu, Y., and Piao, S.: Mapping spatial distribution of forest age in China, Earth and Space Science, 4, 108–116, https://doi.org/10.1002/2016EA000177, 2017.
Zhao, P., Lu, D., Wang, G., Wu, C., Huang, Y., and Yu, S.: Examining Spectral Reflectance Saturation in Landsat Imagery and Corresponding Solutions to Improve Forest Aboveground Biomass Estimation, Remote Sensing, 8, 469, https://doi.org/10.3390/rs8060469, 2016.
Zhu, X. and Liu, D.: Improving forest aboveground biomass estimation using seasonal Landsat NDVI time-series, ISPRS J. Photogramm., 102, 222–231, https://doi.org/10.1016/j.isprsjprs.2014.08.014, 2015.
Zhu, Z. and Woodcock, C. E.: Continuous change detection and classification of land cover using all available Landsat data, Remote Sens. Environ., 144, 152–171, https://doi.org/10.1016/j.rse.2014.01.011, 2014.