the Creative Commons Attribution 4.0 License.
the Creative Commons Attribution 4.0 License.
 | 02 Aug 2023
Ice-core data used for the construction of the Greenland Ice-Core Chronology 2005 and 2021 (GICC05 and GICC21)
Sune Olander Rasmussen
Dorthe Dahl-Jensen
Hubertus Fischer
Katrin Fuhrer
Steffen Bo Hansen
Margareta Hansson
Christine S. Hvidberg
Ulf Jonsell
Sepp Kipfstuhl
Urs Ruth
Jakob Schwander
Marie-Louise Siggaard-Andersen
Giulia Sinnl
Jørgen Peder Steffensen
Anders M. Svensson
Bo M. Vinther
We here describe, document, and make available a wide range of data sets used for annual-layer identification in ice cores from DYE-3, GRIP, NGRIP, NEEM, and EGRIP. The data stem from detailed measurements performed both on the main deep cores and shallow cores over more than 40 years using many different setups developed by research groups in several countries and comprise both discrete measurements from cut ice samples and continuous-flow analysis data.
The data series were used for counting annual layers 60 000 years back in time during the construction of the Greenland Ice-Core Chronology 2005 (GICC05) and/or the revised GICC21, which currently only reaches 3800 years back. Now that the underlying data are made available (listed in Table 1) we also release the individual annual-layer positions of the GICC05 timescale which are based on these data sets.
We hope that the release of the data sets will stimulate further studies of the past climate taking advantage of these highly resolved data series covering a large part of the interior of the Greenland ice sheet.
- Article
(614 KB) - Full-text XML
- BibTeX
- EndNote


The full potential of palaeoclimatic data relies on a reliable timescale, i.e. a depth–age relation, and identification and counting of annual layers is the most accurate way to obtain a timescale if high-resolution measurements of parameters showing annual variability are available. In Greenland, the interglacial surface accumulation rate is ∼ 0.1–0.5 m of ice equivalent per year in interior areas where the deep ice cores are drilled, thereby allowing annual layers to be identified in the Holocene period and into the last glacial. Not all parameters have been measured along all the entire ice cores, and the resolving power of measurements depends both on the measurement resolution and the annual-layer thickness, which vary due to past climate changes as well as layer thinning and generally decrease with depth, so annual-layer counting is often only possible within a certain interval for each combination of parameter and ice core. A particular challenge is the so-called brittle zone, where the pressure release and temperature rise experienced by the cores after drilling cause internal cracking of the ice, making uncontaminated continuous measurements of the ice difficult. The brittle zone is found in Greenland at depths around 800–1400 m (sometimes setting in earlier), where the air bubbles are compressed under the increasing pressure caused by the overlying ice and are gradually transformed into clathrate hydrates (Kipfstuhl et al., 2001).
The Greenland Ice-Core Chronology (GICC) is an attempt to derive a consistent, common timescale for the Greenland ice cores by combining data from multiple cores, using, for each time period, all available annually resolved data and then applying the timescale to the other cores by means of matching patterns in volcanic and other non-climatic events. In this way, data from all the ice cores can be interpreted together on a common timescale (i.e. with very small relative dating uncertainty), greatly reducing the risk of artificial offsets due to the misinterpretation of individual records. The first sections of GICC were published in 2006 and cover the time interval from the present day back to 14.8 ka b2k3 (thousands of years before 2000 CE) (Vinther et al., 2006; Rasmussen et al., 2006). Note that 2000 CE is the standard datum of the GICC timescales and that “ka” in this context literally means “1000 years”, distinct from the common standard where “ka” is short for “ka before 1950 CE” (originally used for radiocarbon ages) as discussed by Rasmussen et al. (2006). The dating was continued in the glacial back to 42 ka b2k (Andersen et al., 2006) and onwards to 60 ka b2k (Svensson et al., 2008), at which point the layers had thinned too much compared to the data resolution to allow for further continuous annual-layer counting. The timescale, named GICC05 because the first manuscripts were submitted in 2005, was therefore extended with a flow-model-based timescale to cover the remaining glacial period (Wolff et al., 2010). Since then, data from the newer Greenland ice cores NEEM and EGRIP have appeared, and comparisons to other timescales have shown that GICC05 was not as accurate as initially assumed (Sigl et al., 2015), and in 2021, the revision of GICC05 was started by Sinnl et al. (2022), producing the revised GICC21 timescale covering the most recent 3.8 kyr using data from many parallel ice cores.
Some of the data sets used for GICC05 and GICC21 are publicly available but far from all. With the advent of the revised GICC21 timescale, some of the data sets have been used again, and others will be used as the revision proceeds, and this calls for all data files to be made publicly available. Also, the actual timescale was only released at a 20-year resolution mainly because the Holocene isotope data series and the NGRIP chemistry data sets, on which most of the annual-layer identification was based, were not publicly available at that time. These data sets are now being made available here or in the recent paper by Erhardt et al. (2022a), and it thus seems timely to also make the fully resolved annual-layer positions available.
The data files span several decades of work, come from a range of analysis methods, and are related to different ice cores. Below, we first introduce the drill locations and then go through the different types of measurements.
Data from the DYE-3, GRIP, NGRIP, NEEM, and EGRIP cores are presented here (see Fig. 1 for locations). In some cases, there are several cores from each drill site.
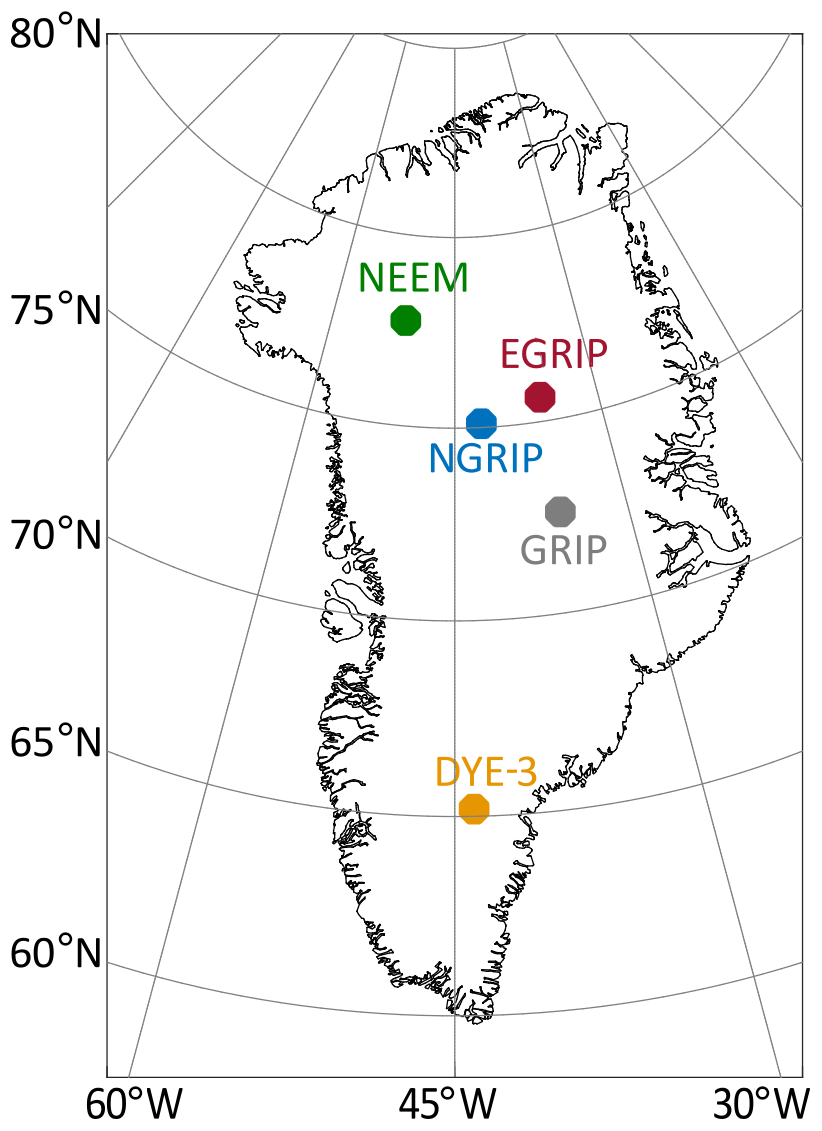
Figure 1Map of Greenland with core locations.
2.1 The DYE-3 cores
The DYE-3 deep ice core was drilled to bedrock, near the US radar station from which the core takes its name, in 1979–1981 during the American–Danish–Swiss Greenland Ice Sheet Program, also known as GISP (Dansgaard et al., 1982). The position of camp is often given as 65∘ N, 44∘ W, but notes from the time of drilling provide the more precise position 65.18∘ N, 43.83∘ W with an altitude of 2480 m above sea level. At the time of drilling, the mean annual surface temperature was determined to be −19 ∘C, while borehole thermometry produces a modern temperature of −20 ∘C (Dahl-Jensen et al., 1998). The ice core retrieved by 1981 was 2035 m long, and at the end of the season, the drill was stuck. The drill was recovered in 1982 with the last 2 m of core. Almost 90 % of the ice originates from the Holocene, and the brittle zone included the section between 800 and 1400 m depth. Present-day accumulation is on the order of 0.5 m ice yr−1 but variable due to upstream surface undulations (Vinther et al., 2006). Despite the relatively thin glacial section, the analysis of oxygen isotopes resolved and confirmed the same repeated abrupt glacial climatic changes previously found in the Camp Century ice core drilled 1400 km away, which we today call the Dansgaard–Oeschger events.
The location of the DYE-3 drill site was determined by the location of the radar station and is not the ideal place to drill an ice core, as flow of ice from upstream areas over a mountainous bedrock and 41.5 km from the ice divide complicates the interpretation. As part of the GISP activities, shallow cores as well as velocity and altitude measurements were made every 2 km along a line upstream from the DYE-3 station (the B line) and along two parallel lines offset by 2 km to the north–north-west (A line) and south–south-east (C line) in order to better understand the flow of ice leading to the DYE-3 site (see Whillans et al., 1984, for details) and to correct for anomalous thinning of the annual layers due to the upstream bedrock (Reeh et al., 1985). The shallow core DYE-3 4B was drilled to 174 m depth 8 km upstream from DYE-3, and the shallow core DYE-3 18C was drilled to 110 m depth 36 km upstream along the C line at the position 65.03∘ N, 44.39∘ W.
2.2 The GRIP core
The core from GRIP (Greenland Ice-Core Project) was drilled during the 1989–1992 field seasons near the highest point of the Greenland ice sheet, Summit (72.57∘ N, 37.62∘ W, 3232 ). The core length is 3028.8 m, and the present-day accumulation is 0.23 m ice yr−1 (Johnsen et al., 1992; Dansgaard et al., 1993; Dahl-Jensen et al., 1993), and the surface temperature was measured to be −32 ∘C (Hvidberg et al., 1997). The core is drilled close to the present-day ice divide, and the ice divide has a low enough slope to allow us to ignore upstream corrections, although we acknowledge that the ice-flow configuration could have been different in the past. Indeed, changing ice-flow configurations during the last glacial cycle are thought to have altered the bottom 200 m of the GRIP core by folding, identified by Grootes et al. (1993) as inconsistencies with the neighbouring GISP2 ice core drilled 28 km away. In the top 101.3 m, measurements were performed on a shallow core (the S3 shallow core) drilled close to the main hole, but the S3 data are fully integrated into main core records, so in practice, the GRIP record is treated as coming from one core.
2.3 The NGRIP cores
Drilling of the North Greenland Ice-Core Project (abbreviated NorthGRIP or NGRIP) ice core (Dahl-Jensen et al., 2002) was successfully completed in 2003 when liquid water was found at the bedrock at a depth of 3085 m at 75.10∘ N, 42.32∘ W. The drill site had an elevation of 2917 m and a mean temperature of −31.5 ∘C during the years where the camp was operational. The melting at the base limits the age of the ice in the core to approx. 123 ka b2k (North Greenland Ice Core Project Members, 2004) and probably for the same reason, folding at the bottom has not been observed. A 45 m long replicate core from the deepest section was drilled in 2004 and goes 6 m deeper, but data from this core are not presented here. The present-day accumulation rate is 0.19 m ice yr−1 and the bottom melting results in a flow pattern different from that of GRIP with a slow flow of approximately 1 m yr−1 along the ice ridge and less thinning of the bottom layers due to the high basal melt rate of several millimetres per year (Buchardt and Dahl-Jensen, 2007). Thus, the annual layers are more than 5 mm thick over the entire length of the NGRIP core, making it ideal for annual-layer identification.
The NGRIP record comes from a combination of two ice cores: the drill got stuck in 1997 and a new core had to be drilled. The two cores are referred to as NGRIP1 and NGRIP2, respectively, and measurements have been performed on the NGRIP1 core down to a depth of 1372 m, while measurements on the NGRIP2 core start at a depth of 1346 m (corresponding to approximately 9.5 ka b2k) with an overlap (below the brittle zone) to ensure correct alignment of the two records. The mean offset of similar features seen in both the NGRIP1 and NGRIP2 cores is 0.43 m, with the same feature appearing at greater depths in the NGRIP1 core than in the NGRIP2 core (Hvidberg et al., 2002), which is opposite to what would be expected given that the NGRIP2 cores was started several years later. The offset was found to be mainly caused by accumulated uncertainties in the logging of the NGRIP1 core across the brittle section.
2.4 The NEEM cores
During the years 2008–2012, the North Greenland Eemian Ice Drilling (commonly known as the NEEM project) produced a 2540 m long ice core from the drill site located at 77.45∘ N, 51.06∘ W (surface elevation 2450 m, mean annual temperature −29 degree C, accumulation rate 0.22 m ice yr−1). See NEEM Community Members (2013) for more details on the drilling and NEEM ice core and Rasmussen et al. (2013a) for a description of the NEEM dating efforts. A 411 m long shallow core named NEEM-2011-S1 was drilled about 100 m away from the NEEM main core drill site (Sigl et al., 2013).
2.5 The EGRIP core
The East Greenland Ice-Core Project (EGRIP or EastGRIP) has at the time of publication retrieved more than 2663 m of ice core at a drill site located within the Northeast Greenland Ice Stream in north-east Greenland. At the start of the drilling operation in 2016, the drilling site was located at 75.6∘ N, 36.0∘ W, and it moves more than 50 m annually towards the north-east together with the Northeast Greenland Ice Stream. The present-day temperature is −30 ∘C, and the average accumulation rate is equivalent to 0.11 m ice yr−1, determined as the average over the period 1607–2011 from a firn core close to the main EGRIP drilling site (Vallelonga et al., 2014) and confirmed later by annual-layer counts on the main core. The upper part of the EGRIP core was first dated by transferring GICC05 to the core by matching mainly volcanic markers (Mojtabavi et al., 2020b; Gerber et al., 2021). Later, the EGRIP records were included in the GICC revision, leading to a revised timescale for the past 3.8 kyr (Sinnl et al., 2022).
We here provide information on the measurement methods used for the presented ice-core records. The information given is correct to the best of our knowledge, but considering that some of the data sets were produced decades ago using equipment that no longer exists by people who are no longer with us, we sometimes have to resort to estimated uncertainties. Uncertainties in individual methods will be discussed below, but we here discuss uncertainties in depth assignment which are particularly important when comparing data obtained on their own, different, and independent depth scales. When an ice core has been drilled, it is logged, a process which involves establishing the master depth scale for the core (Hvidberg et al., 2002). Cores are drilled in segments of up to 4 m, and in the vast majority of cases, the drilled cores match perfectly with the next core, enabling a highly precise depth assignment across core breaks (estimated uncertainty of 1 mm or less). Where drilling problems or core breaks have damaged the core, a larger uncertainty is introduced. This uncertainty will typically be on the order of a few millimetres in the case of irregular breaks, but in a few cases where a piece of ice core has been lost in the drilling process or during extraction from the drill, the uncertainty can be larger. Outside the brittle zone, this is very rare. As this uncertainty applies to the master depth assignment, all measurements performed on the core will be affected in the same way, and for this reason, this is rarely a critical issue when interpreting data from the cores. However, it does introduce localized but large uncertainty in the derived annual-layer thicknesses and could cause problems if the data are compared to data obtained from radar measurements (which rarely have sufficient resolution for this to be a significant problem, though) or data obtained directly in/from the borehole. To summarize, the master depth assignment is accurate, and any uncertainties in the master depth assignment will apply to all measurements in the same way, not influencing the relative depth precision between different records from the same core. After logging, the core is split into sections for further analysis. From this point onward, the depth uncertainties will be different between different measurement systems or sampling methods, e.g. for the following reasons:
-
Some data series are measured directly on the core (e.g. dielectric profiling (DEP), electrical conductivity measurement (ECM), visual stratigraphy). The instruments measure the location of the instrument/sensor along the core, which is often accurate (millimetre-scale uncertainties or less for DEP and visual stratigraphy), while the ECM setup has higher uncertainty because it is necessary to have some flexibility in how to move the electrodes across the surface and because of the non-linearity of the potentiometer measuring the along-core position. From parallel measurements on the same core, we estimate the depth assignment uncertainty to be 0.5 cm at the ends and up to 2 cm in the middle of the core sections when making measurements across breaks where smooth operation of the electrodes is difficult.
-
Some measurements are made on discrete samples cut from the core (the water stable isotopes reported here and some impurity data, e.g. the ion chromatography data presented below). Each data point will represent an average across a depth interval (often 5 cm minus the ∼ 2 mm width of the saw cut), but the depth assignment (relative to the master depth scale) is very accurate, estimated to 1–2 mm, and given by the width of the saw blade and pencil markings.
-
More recently, continuous measurements on melted samples have become common (see Sect. 3.5). While the depth assignment of the end of each core section is accurate, assigning depths in the middle of a section relies on the assumed or measured melt speed. This introduces a possible depth uncertainty from the true (master) depth assignment which is likely similar for all measured species but will produce an artificial offset compared to, e.g., discrete measurements.
These fundamentally different uncertainty contributions will both rely on equipment-specific issues and operator care and experience. Our observations from multi-parameter data sets containing peaks that would be expected to align in ECM, DEP, and impurity data show that relative, and probably artificial, offsets of 2–3 cm are not uncommon, although data sets are most often aligned within ∼ 1 cm. When interpreting data from parallel records from the same core, the observer should be aware of the limitations imposed by these uncertainties (which are on the same scale as the typical annual-layer thickness or smaller). Analysis of sub-annual leads and lags is thus not generally recommended unless special care is taken to improve the relative alignment of the records.
3.1 Electrical conductivity measurements
ECM data (reflecting solid-state direct-current (DC) conductivity) were obtained with the technique described by Hammer (1980) and modern versions hereof. It was soon clear that the main value of ECM data was as a tool for aligning records using patterns of volcanic peaks, where absolute calibration plays a lesser role, and therefore not much work has gone into maintaining absolute calibration measurements for the more recent projects. During the DYE-3 drilling project, the method used a direct voltage of 1250 V, and the method was calibrated using pH measurements on discrete samples (Hammer, 1980). In later projects, the voltage was changed to 2000 V to enhance the signal but not calibrated accurately at these new sites. The data are given as [H+] versus depth (measured from the undisturbed surface for the year where drilling started), but as described, the absolute calibration must be considered tentative, also because the effect of core temperature has not been accounted for systematically. Furthermore, the measurement depends on the density of the ice core due to the experimental technique, so the calibration in the firn is not the same as in the ice.
Data from the DYE-3 cores (main and shallow cores) were originally recorded by an analogue plotter on paper with a high resolution and later digitized by hand with a 1 cm resolution by laboratory assistant Anita Boas. The initial paper plots were of high resolution, and we find it very likely that the depth uncertainty contribution arising from the digitization is negligible compared to the depth uncertainty related to the original depth assignment which – as described above – can be up to a few centimetres in the middle of each measured section. The concentration uncertainty contribution from the digitization is certainly also negligible compared to the uncertainty arising from the tentative calibration and irrelevant when the ECM data are used for matching of patterns of volcanic signals. Regarding calibration, see Hammer (1980), Hammer et al. (1985), and Neftel et al. (1985).
Data from GRIP were recorded in parallel on paper with a high resolution and digitally with a 1 cm resolution. The calibration applied is [H+] = 0.045 I1.73 µequiv kg−1 (where I is the current in microampere), but it must be considered tentative (see Clausen et al., 1995).
ECM data from NGRIP1, NGRIP2, NEEM, and EGRIP are publicly available. Despite the tentative calibration, we provide the data as [H+] values as these were the ones stored when the data sets were originally processed. See Table 1 for data sources.
3.2 Dielectrical properties
Unlike ECM, dielectric profiling (DEP) is an AC (alternating current) method. It was developed by Moore and Paren (1987) and Moore et al. (1989) as a technique to determine the dielectric properties of snow and ice and the total ionic concentration in ice cores at a time when direct measurements of ionic concentrations by ion chromatography (IC, Sect. 3.4) and continuous-flow analysis (CFA, Sect. 3.5) were not yet routinely applied. As a non-destructive method – the complete core is lying between curved electrodes forming a capacitor – DEP is usually the first measurement in an ice-core processing line. Classically, DEP measures conductivity and permittivity in the frequency range up to 1 MHz by standard LCR bridges. The conductivity signal responds to acids and salts, in particular to volcanic and ammonium events. Permittivity is controlled by the porosity and the density can be derived from permittivity measurements in the shallow part of an ice core. Especially for cores which are also analysed for impurities by other methods, DEP (and ECM) data are mainly used for synchronization purposes in order to provide a first timescale for an ice core and to provide dielectric data for modelling synthetic radar profiles (Mojtabavi et al., 2022).
The DEP stratigraphy of the NGRIP, NEEM, and EGRIP cores was determined directly in the field. The DEP device used for all three cores is described by Wilhelms (1996) and Wilhelms et al. (1998), and the measuring procedure is found in detail in Mojtabavi et al. (2020b). The spatial resolution is given by the 1 cm width of the moving capacitor plate, and overlapping measurements were made every 5 mm. The NGRIP cores were measured in a wide and varying range of frequencies between 500 Hz and up to 1 MHz, but only the 250 kHz frequency data are processed and further used, which is also the case for the NEEM and EGRIP data. The DEP instrument was the first in the processing line, and due to lack of space and/or time in the trenches to let the core temperatures equilibrate, the cores' temperatures varied during the day (as well as during the season). The DEP data are not corrected for this temperature variation. The data sets have been documented and made available as listed in Table 1. DEP data are also available for the GRIP core at a 2 cm resolution at https://www.ncei.noaa.gov/access/paleo-search/study/17845 (last access: 16 July 2023) but were not used for the annual-layer counting due to their marginal resolution.
For the GICC05 and GICC21 work, ECM was the main data set used for synchronization, but DEP conductivity data were used for synchronization of cores where there are gaps in the ECM data and occasionally for supporting the annual-layer identification across data gaps in the impurity records (Rasmussen et al., 2006; Sinnl et al., 2022).
3.3 Stable water isotopes, δ18O, and δD
Water stable isotopes from DYE-3 and GRIP were used for annual-layer identification, while the accumulation rates at NGRIP and especially EGRIP are too low for the annual signal to survive diffusion in the top metres of the firn. A high number of stable oxygen isotope measurements δ18O were carried out on the DYE-3 ice core just after drilling (1979–1981) (Dansgaard et al., 1982): 63 000 δ18O samples at a resolution of eight samples per year or higher cover the period back to the year 5815 a b2k and the time interval from 6906 to 7898 a b2k. Because the annual-layer thicknesses decrease with depth, the sample size had to be decreased accordingly. The measurement plan aimed at collecting eight samples per year in order to resolve the annual cycle and used an ice-flow model to provide an a priori estimate of annual-layer thicknesses as a function of depth. For each drilled ice core, the modelled annual layer was determined for the relevant depth, and the sample size was adjusted accordingly. In practice, the sample sizes were cut according to marks placed using an elastic band from the trousers of chief driller and eminent scientist Sigfús Johnsen's trousers as a measuring device: the elastic band had equidistant marks and was stretched in order to produce eight samples of equal size from each ice section corresponding to the calculated layer thickness. Measurements were performed at the Geophysical Isotope Laboratory (now part of the Niels Bohr Institute) in Copenhagen using the CO2 equilibration method. Vinther et al. (2006) added another 12 000 samples of δD analyses from the periods 5816–6905 a b2k and 7899–8313 a b2k at a resolution of eight samples per year in order to complete the DYE-3 stable isotope from the surface and back to the 8.2 ka cold event, around which diffusion gradually smooths the signal to a degree where safe annual-layer identification is no longer possible. The δD measurements were performed at the AMS 14C Dating Centre at the University of Aarhus on a GV Instruments continuous-flow isotope-ratio mass spectrometry (CF-IRMS) (Morrison et al., 2001). With this paper, we make the entire record available at the full, measured resolution. The δ18O measurement uncertainty, estimated from repeated measurements of the same samples and comparisons to standards, is 0.1 ‰, while the δD data uncertainty is 0.5 ‰.
Measurements on the DYE-3 4B and 18C shallow cores were performed using the same setup as described above for DYE-3 in 1983 and 1984, also aiming for an average resolution of eight samples per year. The data were analysed by Clausen and Hammer (1988) and Vinther et al. (2010) but have not been made publicly available before now.
For the GRIP core, δ18O measurements with a resolution of 2.5 cm are available back to 3845 a b2k (Johnsen et al., 1997). This resolution corresponds to 7–10 samples per year (with the fewest samples per year in the earliest part of the record due to flow-related thinning of the annual layers). The δ18O measurements were made in 1989–1990 in Copenhagen immediately after the drilling. The uncertainty in the δ18O values is 0.1 ‰. As diffusion in the firn and snow degrade the annual signal, the data need to be corrected for the effect of diffusion before being used for annual-layer identification (Vinther et al., 2006, 2010). Following the approach of Johnsen and Andersen (1997) and Johnsen et al. (2000), the deconvolution uses an adaptive cut-off frequency permitting a fixed maximum amplification factor of 50 of the spectral components in the original data. While the deconvolution generally restores or strengthens the annual signal, it may also create spurious peaks that can complicate the correct identification of annual layers, in particular near melt layers.
3.4 Impurities measured on discrete samples by ion chromatography (IC)
For the NGRIP1 core, measurements of selected impurities (Li+, Na+, , K+, Mg2+, Ca2+, F−, methane sulfonate (MSA), Cl−, , and ) were made by Ion Chromatography (IC) for the past ∼ 1800 years at a resolution of 5 cm, corresponding to about four samples per year on average. If only one parameter had been measured, this resolution would be marginal, but because different parameters have been measured and these peak at different times of the year, it is possible to identify annual layers using the records in combination. All samples were cut and decontaminated using a microtome knife in a laminar-flow bench at the field site. In 1996, the 9.850–349.250 m depth interval was sampled continuously at a 5 cm resolution. In 1997, selected sections from the Holocene, mainly containing volcanic signals, were sampled at a 5 or 2.5 cm depth resolution. Samples covering the 8.2 ka cold event were cut from the depth interval of 1221–1237.5 m. The frozen samples were thawed in the laboratory and immediately afterwards poured into precleaned sample vials for ion chromatography analyses. Samples from bags 212–403 (depth interval of 116.05–221.65 m) were measured at the Department of Physical Geography, Stockholm University, Sweden. The rest of the samples were measured at the Geophysics Department, Niels Bohr Institute, University of Copenhagen, Denmark. At both laboratories, the measurements where performed on a Dionex 500 IC. Data measured in Stockholm were calibrated to a calibration curve established using eight standards, while data measured in Copenhagen were calibrated to a linear calibration curve established using only a single standard. Ammonium concentrations measured in Copenhagen may be biased due to possible sample uptake of ammonium from the air while in the liquid phase. In Stockholm, Li+ was not measured and F−-concentrations may be biased due to methods that were not optimal for quantification of fast eluted ions. The uncertainty in the concentrations measured in Copenhagen is estimated to 10 %–15 % and comes from a combination of bias from the solutions used for calibration, non-linearity in the measurements, and measurement drift during an analysis series. For extreme sample values, e.g. for large volcanic eruptions, the uncertainty can be larger than 15 %. The concentrations measured in Stockholm are more accurate mainly due to the use of more than one standard for calibration. Further information about the analysis setup can be found in Littot et al. (2002), Siggaard-Andersen et al. (2002), and Jonsell et al. (2007).
The sulfate data were released in connection with the study of Plummer et al. (2012), where the volcanic and background sulfate levels were separated, but the remaining parameters have not yet been made publicly available.
3.5 Impurities measured by continuous-flow analysis (CFA)
Impurity records obtained by continuous-flow analysis (CFA) were pioneered by the University of Bern and are generally very strong tools for annual-layer detection due to the often high resolution and because the annual layers are often detectable in several parallel records, sometimes with different seasonality. The first measurements performed by CFA on long ice-core intervals were those of the GRIP core (Fuhrer et al., 1993), comprising concentration profiles of , Ca2+, and H2O2. The data were registered every 2 mm, but due to internal dispersion of the signal in the analytical setup, the shortest cycles that can be identified in the data are 2–3 cm. This limit is estimated from the response time of the system going from 90 % to 10 % of the amplitude when responding to a step concentration change (Röthlisberger et al., 2000). The achievable resolution depends on the selected melt speed (in the data sets provided here, it is typically 3.5–4 cm min−1). Note that in some publications the resolution is defined by the respective e-folding time of the step signal, which is accordingly shorter (Erhardt et al., 2022a). The data were used for annual-layer identification in the 7.9–10.3 ka b2k interval when creating GICC05 (Rasmussen et al., 2006), but data are also provided over GS-1 (roughly equivalent to the Younger Dryas) and GI-1 (roughly equivalent to the Bølling–Allerød period). Formaldehyde was also measured but does not exhibit a usable annual signal and is not included in the data file. The measurement were performed as described in Fuhrer et al. (1993) and Sigg et al. (1994). Fuhrer et al. (1996) analysed the ammonium data and Fuhrer et al. (1999) analysed the calcium record, but the data set has remained unpublished in its full resolution until now.
The CFA measurement setup at the University of Bern was further developed, extended, and refined and used for obtaining records for several long ice cores. The NGRIP version of the Bern CFA system was operated in the field in 2000 and is described in detail in Röthlisberger et al. (2000). In addition to the and Ca2+ measurements, which were already part of the GRIP setup, measurements of Na+, , and were made, and a conductivity cell as well as an insoluble particle counter were also included. This NGRIP2 data set is only available from around 10.3 ka b2k and further back in time and forms the backbone of GICC05 in large parts of the glacial and is thoroughly described in Erhardt et al. (2022a). The data file was released together with the Erhardt et al. (2022a) paper, but due to larger analytical uncertainties and data quality issues, the records of sulfate, dust particles, formaldehyde, and hydrogen peroxide are not included. The data were nevertheless used by Lin et al. (2022), and the full-resolution sulfate data file back to 60 ka b2k is available as a supplement to their paper.
Insoluble microparticles (mineral dust) was measured as part of the CFA setup, using a laser particle detector contributed by the University of Heidelberg and the Alfred Wegener Institute. The data were published separately by Ruth et al. (2003) and Ruth et al. (2007) as coarse-resolution data sets. A 5 cm resampled version of the data was also made available in connection with the work of Gkinis et al. (2014), and annual values were released over short sections by Steffensen et al. (2008), but for annual-layer identification, the full resolution was used. The full-resolution data file is released with this work. The relative uncertainty in the laser particle measurements has been estimated to 5 %–10 % for the number concentration and 15 %–20 % for the mass concentration (Ruth et al., 2003), the latter including uncertainty in the size calibration.
For the younger, more shallow parts of the NGRIP2 core, an impurity data set was measured at the Desert Research Institute in Reno (CFA extended by an inductively coupled plasma sector field mass spectrometer) covering 159.6–582.4 m depth (approximately from 730 to 3200 a b2k) with a resolution of 1 cm (McConnell et al., 2018), which has been used for GICC21.
For NEEM, the main data set used for the GICC21 work also comes from the Bernese CFA setup: the main NEEM data set is described and published together with the NGRIP2 data by Erhardt et al. (2022a) and covers the entire core but with a relatively large rate of data loss in the brittle section. An additional data set, also measured at the Desert Research Institute combined CFA–ICP-SFMS setup, is the record from the 411 m long shallow core NEEM-2011-S1 (Sigl et al., 2013), which was extended using NEEM main-core ice in the 399–500 m interval by Sigl et al. (2015).
The limit of detection (LOD) of the CFA data (defined as 3 times the standard deviation of the signal baseline (derived from Milli-Q water) is typically 0.1 ppb for all CFA components (Erhardt et al., 2022a; Röthlisberger et al., 2000). However, the reproducibility of calibration standards (1σ of their values) is much higher than the LOD and is also affected by the procedural blank to mix the standards. Thus, while the ice-core meltwater stream is per se not affected by these effects, the translation of signal amplitudes to concentration using the calibration standards introduces this uncertainty. As a conservative estimate of this uncertainty in our concentration records, we use the uncertainty in the calibration standards (derived from a mean calibration curve on individual standards). This reproducibility (which is hence our estimated uncertainty in the concentration values) is 1 ppb for Ca2+ and Na+, 0.5 ppb for , 3 ppb for , and 1–4 ppb for H2O2 (Gfeller et al., 2014). The relative uncertainties are dependent on the mean concentration of the respective species in the ice core, which are also time dependent. For example, for low Ca2+ concentration values during the Holocene, the relative uncertainty can be 10 %–20 %, while for high glacial concentrations they are less than 2 %. For Na+ a similar picture emerges with Holocene relative uncertainties of typically < 5 % and glacial values of < 1 %. For and , where the glacial-to-interglacial changes are small, the relative uncertainties are less than 10 % and 2 %, respectively (Gfeller et al., 2014). For H2O2, the relative uncertainty is typically less than 2 %.
Great care has been given to remove spurious values (for example from potential contamination at core breaks) in the records, but, in particular, outlier values near data gaps need to be interpreted with extra care.
The EGRIP CFA data were measured by the Bernese setup and the data set is available at PANGAEA with the measurements described by Erhardt et al. (2023). In addition to the CFA system already successfully deployed for the NEEM ice core, the setup was extended by an inductively coupled plasma time-of-flight mass spectrometer (icpTOF, TOFWERK, Thun, Switzerland). The system allows the quantification of elemental concentrations over the full mass range of 23–275 amu (atomic mass unit) in millisecond resolution and, thus, allows the detection of individual dust particles (Erhardt et al., 2019). It also includes a single-particle extinction and scattering instrument (SPES, EOS, Milano, Italy) which allows quantification of the diameter and refractive index of the dust particles in the ice. The data of these new instruments are still in the process of evaluation and are not provided here.
3.6 Visual stratigraphy (line-scan data)
A continuous high-resolution record of digital images was obtained from the NGRIP ice core in the depth interval of 1330–3085 m during the 2000 and 2001 field seasons. The images are obtained as dark-field images from an indirect light source and provide detailed visual documentation of the ice core at high depth resolution. The visual stratigraphy grey-scale intensity profile (the line-scan profile) is obtained as an averaged intensity profile from the centre part of the stratigraphy images along the direction of the core. The data set covers the depth interval of 1371.15–2425.00 m at a 1 mm depth resolution. The data set was applied to construct the glacial part of the GICC05 ice-core chronology. The analytical techniques and the intensity profile are described in Svensson et al. (2005), to which we refer for a fuller description of uncertainties, etc.
3.7 GICC05 annual-layer positions
Based on the data described above, annual layers were identified for the construction of the Greenland Ice-Core Chronology 2005 (GICC05). The high-resolution version data file is released for the first time with this paper now that all the underlying data sets are also available. Previously, 10- and 20-year-resolution data files containing the timescale and resampled δ18O data have been released for different time intervals together with relevant dating papers. The data set consists of the location of the annual markers in the GICC05 timescale for each core's depth sections where data were available and sufficiently resolved to allow annual dating. The markers are placed in the winter or spring depending on the availability of data (e.g. using the winter δ18O minimum, winter sodium concentration maximum, spring dust/calcium concentration maximum, or line-scan grey-scale peaks in the deepest parts). Across data gaps, markers are placed by interpolation assuming a constant layer thickness or using other impurity species with different seasonality (e.g. using summer ammonium or nitrate peaks). Therefore, the criteria for where the annual markers are placed vary between sections, and care should be taken when interpreting data on an annual scale.
The dating of the 0–7.9 ka b2k part is based mainly on isotope data and is described by Vinther et al. (2006). Impurity records from GRIP and NGRIP2 form the basis for the multi-parameter annual-layer identification across the 7.9–14.7 ka b2k interval (Rasmussen et al., 2006). In the deeper parts, the line-scan profile plays a larger role together with the best-resolved of the CFA parameters. The dating of the 14.7–41.8 ka b2k part is described in Andersen et al. (2006), while the details on the 41.8–60.0 ka b2k part can be found in Svensson et al. (2008). When counting layers, uncertainty is introduced when an annual layer is backed up by evidence only in some of the data series or when a certain well-resolved feature is suspected to contain more than one annual layer. The cases of ambiguity in the annual-layer identification process have been marked using so-called uncertain layer markings. These uncertain layer markings were included in the timescale as ± year, with the ± year forming the basis for quantifying the so-called maximum counting error. The concept of maximum counting error is further discussed in Rasmussen et al. (2006). If needed, the maximum counting error can in a standard deviation context be regarded as an approximation of the 2σ uncertainty (Andersen et al., 2006).
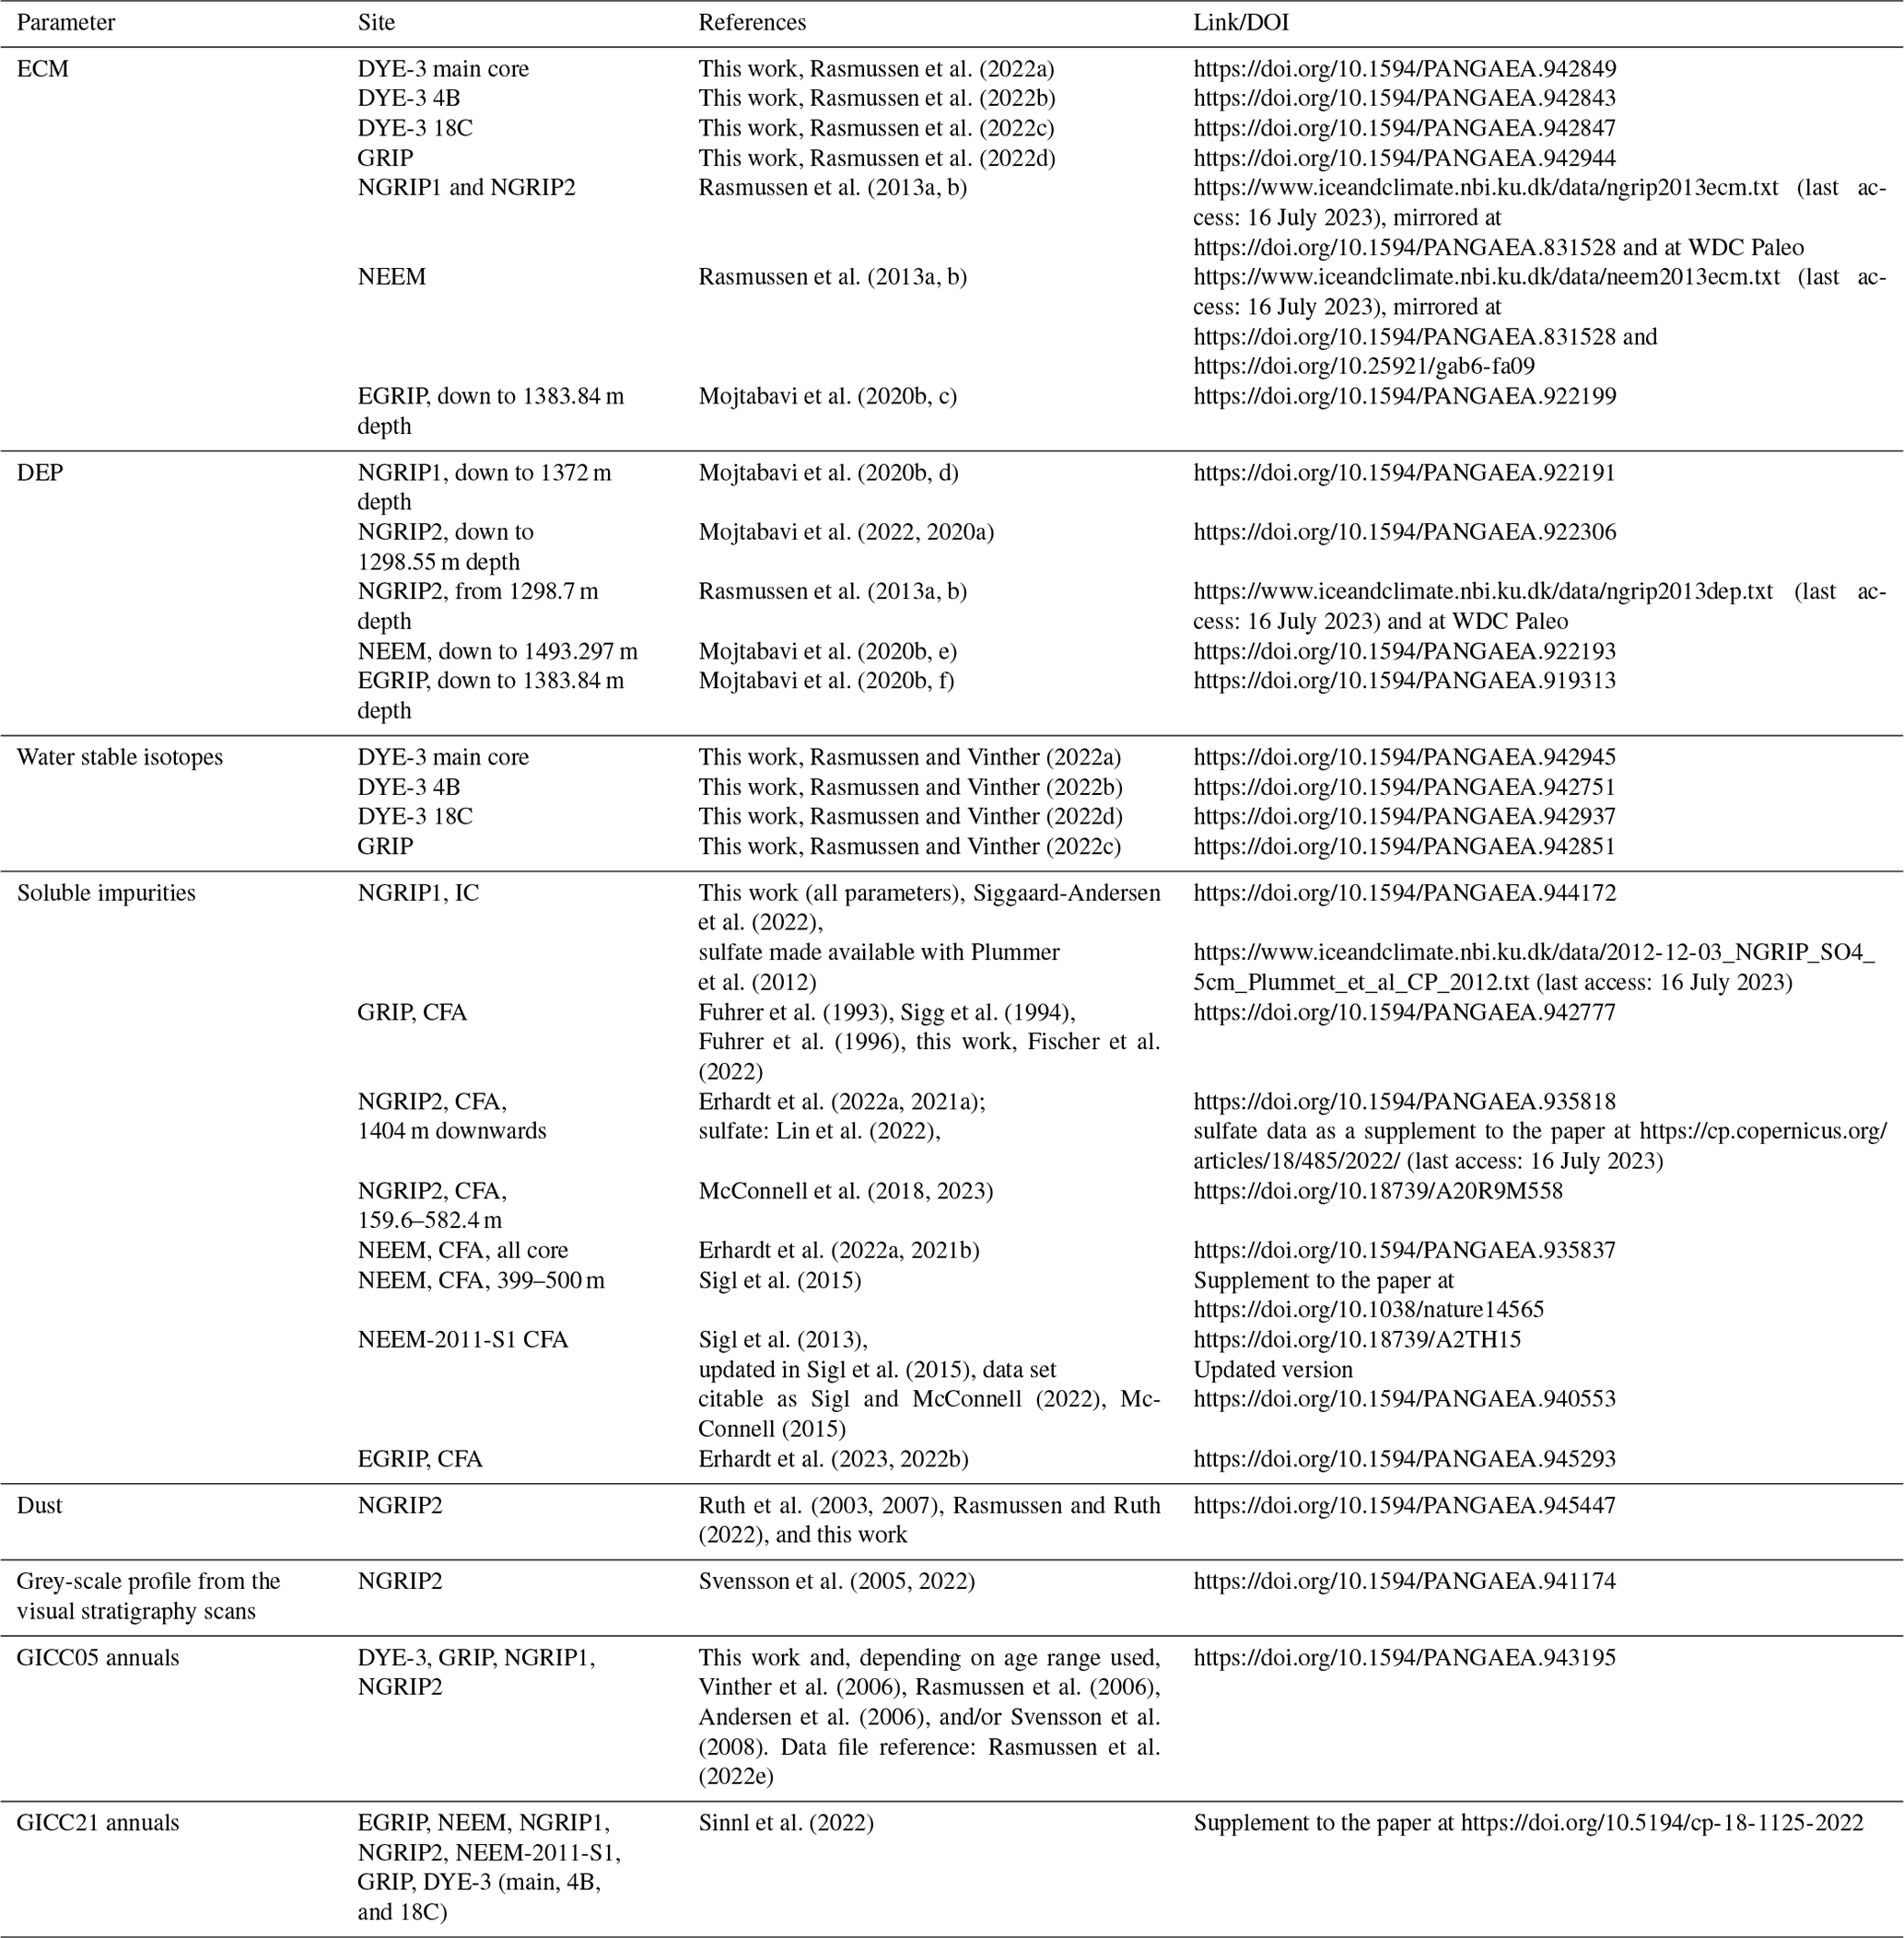
Table 1Data sets used for the construction of the Greenland Ice-Core Chronology 2005 and 2021 (GICC05 and GICC21). For completeness, we include both data sets released with this paper and data made available elsewhere.
In the Holocene, GS-1, and GI-2, the published timescale was derived from annual-layer markings by manually determining which half of the uncertain layer markings to count as years (denoted “type 1”) and which to skip (denoted “type 2”). With the data file, we provide a separate table detailing which uncertain layers were assigned to each of these two categories. The maximum counting error was estimated from the number of uncertain layer markings as a constant relative uncertainty for each period with similar data availability and characteristics: 21–3845 a b2k (0.25 %), 3846–6905 a b2k (0.5 %), 6906–10 276 a b2k (2 %), 10 277–11 703 a b2k (0.67 %), 11 703–12 896 a b2k (3,3 %), 12 896–14 075 a b2k (2.6 %), and 14 075–14 692 a b2k (2.7 %) (see Table 2 in Vinther et al., 2006, and Table 3 in Rasmussen et al., 2006). From GS-2 and below, every second uncertain layer was counted as a year and the maximum counting uncertainty increased by 1 year, giving rise to a variable relative counting error ranging from 4 % in the warm interstadial periods to 7 % in the cold stadials and averaging 5.3 % (Andersen et al., 2006; Svensson et al., 2008).
3.8 A note on accumulation rates
Accumulation rates can in principle be reconstructed from the observed annual-layer thicknesses by taking into account the flow-induced thinning of the layers. However, due to uncertainties in constraining the ice-flow history, this is not straightforward in practice, and other approaches yield different results. We do not embark on accumulation reconstruction here, but for completeness, we provide some comments about published accumulation-rate estimates.
Kindler et al. (2014) provided an accumulation estimate based on firn modelling for NGRIP (see the supplement of that paper), but using diffusion-based estimates, Gkinis et al. (2014) found that the accumulation is ∼ 10 % lower with even larger differences at the Last Glacial Maximum (LGM) and in the Early Holocene. For NEEM, a number of different approaches were compared in Rasmussen et al. (2013a), demonstrating a spread of up to 30 % between accumulation estimates derived from different methods. This illustrates that accumulation reconstructions must be considered rather uncertain and that comparing accumulation reconstructions made in different ways is recommended in order to properly estimate the uncertainty.
The data sets used for this work are listed in Table 1.
With this paper and the associated data sets, the data underpinning the GICC05 and GICC21 timescales have been made available. We hope that this will stimulate further work on high-precision ice-core chronologies, both in relation to the revision of GICC05, which has only just started with the publication of the GICC21 for the first 3.8 kyr (Sinnl et al., 2022), and in other contexts. In view of the complicated data matrix spanning a wide range of parameters, depth intervals, ice cores, and decades of method development, we encourage future users of the data to get in contact with the respective research groups that measured the data to obtain expert advice on the data quality and its limitation for specific applications.
SOR compiled the metadata for the unpublished data sets and carried out the PANGAEA data review process in collaboration with the co-authors (see each data file for names), except for the line-scan data file, which was publicized by AMS. SOR wrote the paper with contributions and feedback from all co-authors.
The contact author has declared that none of the authors has any competing interests.
Publisher's note: Copernicus Publications remains neutral with regard to jurisdictional claims in published maps and institutional affiliations.
We thank all people involved in decades of drilling, ice-core processing and analysis, logistics, and keeping the field camps running and all the people who have worked in the laboratories and with data processing.
We are grateful for reviews by Eric Wolff and an anonymous reviewer and for comments by the editor and Michael Sigl, University of Bern, which all improved the accuracy of the paper.
DYE-3 was supported financially and logistically by the U.S. National Science Foundation (DPP), the Swiss National Science Foundation, the Commission for Scientific Research in Greenland, and the Danish Natural Science Research Council.
GRIP was organized by the European Science Foundation with contributions from the national science foundations in Belgium, Denmark, France, Germany, Iceland, Italy, Switzerland, and the United Kingdom. We thank the XII Directorate of CEC, the Carlsberg Foundation, the Commission for Scientific Research in Greenland, and the University of Iceland Research Foundation for financial support.
NGRIP was directed and organized by the Department of Geophysics at the Niels Bohr Institute for Astronomy, Physics and Geophysics, University of Copenhagen. It was supported by funding agencies in Denmark (SNF), Belgium (FNRS-CFB), France (IPEV and INSU/CNRS), Germany (AWI), Iceland (RannIs), Japan (MEXT), Sweden (SPRS), Switzerland (SNF), and the USA (NSF, Office of Polar Programs).
NEEM was directed and organized by the Centre of Ice and Climate at the Niels Bohr Institute and U.S. NSF, Office of Polar Programs. It was supported by funding agencies and institutions in Belgium (FNRS-CFB and FWO), Canada (NRCan/GSC), China (CAS), Denmark (FIST), France (IPEV, CNRS/INSU, CEA and ANR), Germany (AWI), Iceland (RannIs), Japan (NIPR), South Korea (KOPRI), The Netherlands (NWO/ALW), Sweden (VR), Switzerland (SNF), the United Kingdom (NERC), the USA (US NSF, Office of Polar Programs), and the EU Seventh Framework programmes Past4Future and WaterundertheIce.
EGRIP is directed and organized by the Centre for Ice and Climate at the Niels Bohr Institute, University of Copenhagen. It is supported by funding agencies and institutions in Denmark (A. P. Møller Foundation, University of Copenhagen), the USA (U.S. National Science Foundation, Office of Polar Programs), Germany (Alfred Wegener Institute, Helmholtz Centre for Polar and Marine Research), Japan (National Institute of Polar Research and Arctic Challenge for Sustainability), Norway (University of Bergen and Bergen Research Foundation), Switzerland (Swiss National Science Foundation), France (French Polar Institute Paul-Emile Victor, Institute for Geosciences and Environmental research), and China (Chinese Academy of Sciences and Beijing Normal University).
A lot of the work generating the data presented here was supported by research grants from private and public foundations. We wish in particular to acknowledge support from the Carlsberg Foundation for the work on GICC05 and GICC21, the latter as part of the project ChronoClimate (grant no. CF17-0289).
This research has been supported by the Carlsbergfondet (grant no. CF17-0289).
This paper was edited by Charles Amory and reviewed by Eric Wolff and one anonymous referee.
Andersen, K. K., Svensson, A., Rasmussen, S. O., Steffensen, J. P., Johnsen, S. J., Bigler, M., Röthlisberger, R., Ruth, U., Siggaard-Andersen, M.-L., Dahl-Jensen, D., Vinther, B. M., and Clausen, H. B.: The Greenland Ice Core Chronology 2005, 15–42 ka. Part 1: constructing the time scale, Quaternary Sci. Rev., 25, 3246–3257, https://doi.org/10.1016/j.quascirev.2006.08.002, 2006.
Buchardt, S. L. and Dahl-Jensen, D.: Estimating the basal melt rate at NorthGRIP using a Monte Carlo technique, Ann. Glaciol., 45, 137–142, 2007.
Clausen, H. B. and Hammer, C. U.: The Laki and Tambora eruptions as revealed in Greenland ice cores from 11 locations, Ann. Glaciol., 10, 16–22, 1988.
Clausen, H. B., Hammer, C. U., Christensen, J., Schott Hvidberg, C., Dahl-Jensen, D., Legrand, M., and Steffensen, J. P.: 1250 years of global volcanism as revealed by central Greenland ice cores, in: Ice core studies of global biogeochemical cycles, edited by: Delmas, R. J., NATO ASI Series, Springer-Verlag, Heidelberg, https://doi.org/10.1007/978-3-642-51172-1, 1995.
Dahl-Jensen, D., Johnsen, S. J., Hammer, C. U., Clausen, H. B., and Jouzel, J.: Past accumulation rates derived from observed annual layers in the GRIP ice core from Summit, Central Greenland, in: Ice in the Climate System, edited by: Peltier, R. W., NATO ASI Ser. I, Springer-Verlag, New York, 517–532, https://doi.org/10.1007/978-3-642-85016-5, 1993.
Dahl-Jensen, D., Mosegaard, K., Gundestrup, N., Clow, G. D., Johnsen, S. J., Hansen, A. W., and Balling, N.: Past temperatures directly from the Greenland ice sheet, Science, 282, 268–271, https://doi.org/10.1126/science.282.5387.268, 1998.
Dahl-Jensen, D., Gundestrup, N., Miller, H., Watanabe, O., Johnsen, S. J., Steffensen, J. P., Clausen, H. B., Svensson, A., and Larsen, L. B.: The NorthGRIP deep drilling program, Ann. Glaciol., 35, 1–4, 2002.
Dansgaard, W., Clausen, H. B., Gundestrup, N., Hammer, C. U., Johnsen, S. J., Kristinsdottir, P. M., and Reeh, N.: A new Greenland deep ice core, Science, 218, 1273–1277, 1982.
Dansgaard, W., Johnsen, S. J., Clausen, H. B., Dahl-Jensen, D., Gundestrup, N. S., Hammer, C. U., Hvidberg, C. S., Steffensen, J. P., Sveinbjörnsdottir, A. E., Jouzel, J., and Bond, G.: Evidence for general instability of past climate from a 250-kyr ice-core record, Nature, 364, 218–220, 1993.
Erhardt, T., Jensen, C. M., Borovinskaya, O., and Fischer, H.: Single Particle Characterization and Total Elemental Concentration Measurements in Polar Ice Using Continuous Flow Analysis-Inductively Coupled Plasma Time-of-Flight Mass Spectrometry, Environ. Sci. Technol., 53, 13275–13283, https://doi.org/10.1021/acs.est.9b03886, 2019.
Erhardt, T., Bigler, M., Federer, U., Gfeller, G., Leuenberger, D., Stowasser, O., Röthlisberger, R., Schüpbach, S., Ruth, U., Twarloh, B., Wegner, A., Goto-Azuma, K., Takayuki, K., Kjær, H. A., Vallelonga, P. T., Siggaard-Andersen, M.-L., Hansson, M. E., Benton, A. K., Fleet, L. G., Mulvaney, R., Thomas, E. R., Abram, N. J., Stocker, T. F., and Fischer, H.: High resolution impurity data for the NorthGRIP ice core, PANGAEA [data set], https://doi.org/10.1594/PANGAEA.935818, 2021a.
Erhardt, T., Bigler, M., Federer, U., Gfeller, G., Leuenberger, D., Stowasser, O., Röthlisberger, R., Schüpbach, S., Ruth, U., Twarloh, B., Wegner, A., Goto-Azuma, K., Takayuki, K., Kjær, H. A., Vallelonga, P. T., Siggaard-Andersen, M.-L., Hansson, M. E., Benton, A. K., Fleet, L. G., Mulvaney, R., Thomas, E. R., Abram, N. J., Stocker, T. F., and Fischer, H.: High resolution impurity data for the NEEM ice core, PANGAEA [data set], https://doi.org/10.1594/PANGAEA.935837, 2021b.
Erhardt, T., Bigler, M., Federer, U., Gfeller, G., Leuenberger, D., Stowasser, O., Röthlisberger, R., Schüpbach, S., Ruth, U., Twarloh, B., Wegner, A., Goto-Azuma, K., Kuramoto, T., Kjær, H. A., Vallelonga, P. T., Siggaard-Andersen, M.-L., Hansson, M. E., Benton, A. K., Fleet, L. G., Mulvaney, R., Thomas, E. R., Abram, N., Stocker, T. F., and Fischer, H.: High-resolution aerosol concentration data from the Greenland NorthGRIP and NEEM deep ice cores, Earth Syst. Sci. Data, 14, 1215–1231, https://doi.org/10.5194/essd-14-1215-2022, 2022a.
Erhardt, T., Jensen, C. M., and Fischer, H.: High resolution aerosol records over the past 3.8ka from the EastGRIP ice core, PANGAEA [data set], https://doi.org/10.1594/PANGAEA.945293, 2022b.
Erhardt, T., Jensen, C. M., Adolphi, F., Kjær, H. A., Dallmayr, R., Twarloh, B., Behrens, M., Hirabayashi, M., Fukuda, K., Ogata, J., Burgay, F., Scoto, F., Crotti, I., Spagnesi, A., Maffezzoli, N., Segato, D., Paleari, C., Mekhaldi, F., Muscheler, R., Darfeuil, S., and Fischer, H.: High resolution aerosol data from the top 3.8 ka of the EGRIP ice core, Earth Syst. Sci. Data Discuss. [preprint], https://doi.org/10.5194/essd-2023-176, in review, 2023.
Fischer, H., Rasmussen, S. O., and Fuhrer, K.: High-resolution impurity data from the GRIP ice core, PANGAEA [data set], https://doi.org/10.1594/PANGAEA.942777, 2022.
Fuhrer, K., Neftel, A., Anklin, M., and Maggi, V.: Continuous measurements of hydrogen peroxide, formaldehyde, calcium and ammonium concentrations along the new GRIP ice core from Summit, Central Greenland, Atmos. Environ., A27, 1873–1880, 1993.
Fuhrer, K., Neftel, A., Anklin, M., Staffelbach, T., and Legrand, M.: High-resolution ammonium ice core record covering a complete glacial-interglacial cycle, J. Geophys. Res.-Atmos., 101, 4147–4164, 1996.
Fuhrer, K., Wolff, E. W., and Johnsen, S. J.: Timescales for dust variability in the Greenland Ice Core Project (GRIP) ice core in the last 100,000 years, J. Geophys. Res., 104, 31043–31052, 1999.
Gerber, T. A., Hvidberg, C. S., Rasmussen, S. O., Franke, S., Sinnl, G., Grinsted, A., Jansen, D., and Dahl-Jensen, D.: Upstream flow effects revealed in the EastGRIP ice core using Monte Carlo inversion of a two-dimensional ice-flow model, The Cryosphere, 15, 3655–3679, https://doi.org/10.5194/tc-15-3655-2021, 2021.
Gfeller, G., Fischer, H., Bigler, M., Schüpbach, S., Leuenberger, D., and Mini, O.: Representativeness and seasonality of major ion records derived from NEEM firn cores, The Cryosphere, 8, 1855–1870, https://doi.org/10.5194/tc-8-1855-2014, 2014.
Gkinis, V., Simonsen, S. B., Buchardt, S. L., White, J. W. C., and Vinther, B. M.: Water isotope diffusion rates from the NorthGRIP ice core for the last 16,000 years – Glaciological and paleoclimatic implications, Earth Planet. Sc. Lett., 405, 132–141, https://doi.org/10.1016/j.epsl.2014.08.022, 2014.
Grootes, P. M., Stuiver, M., White, J. W. C., Johnsen, S. J., and Jouzel, J.: Comparison of oxygen isotope records from the GISP2 and GRIP Greenland ice cores, Nature, 366, 552–554, 1993.
Hammer, C. U.: Acidity of polar ice cores in relation to absolute dating, past volcanism, and radio-echoes, J. Glaciol., 25, 359–372, 1980.
Hammer, C. U., Clausen, H. B., Dansgaard, W., Neftel, A., Kristinsdottir, P., and Johnson, E.: Continuous impurity analysis along the Dye-3 deep core, in: Greenland Ice Core: Geophysics, Geochemistry, and the Environment, edited by: Langway Jr., C. C., Oeschger, H., and Dansgaard, W., Geophys. Monogr. Ser., vol. 33, American Geophysical Union (AGU), Washington, D. C., 90–94, 1985.
Hvidberg, C. S., Dahl-Jensen, D., and Waddington, E. D.: Ice flow between the Greenland Ice Project and Greenland Ice Sheet Project 2 boreholes in central Greenland, J. Geophys. Res., 102, 26851–26859, 1997.
Hvidberg, C. S., Steffensen, J. P., Clausen, H. B., Shoji, H., and Kipfstuhl, J.: The NorthGRIP ice-core logging procedure: Description and evaluation, Ann. Glaciol., 35, 5–8, 2002.
Johnsen, S. J. and Andersen, U.: Isotopic diffusion in Greenland firn and ice. Evidence for crystal boundary diffusion, Eos Trans. AGU Fall Meeting, 8–12 December 1997, San Francisco, USA, 78, F7 Poster U21A-24, 1997.
Johnsen, S. J., Clausen, H. B., Dansgaard, W., Fuhrer, K., Gundestrup, N., Hammer, C. U., Iversen, P., Steffensen, J. P., Jouzel, J., and Stauffer, B.: Irregular glacial interstadials recorded in a new Greenland ice core, Nature, 359, 311–313, 1992.
Johnsen, S. J., Clausen, H. B., Dansgaard, W., Gundestrup, N. S., Hammer, C. U., Andersen, U., Andersen, K. K., Hvidberg, C. S., Dahl-Jensen, D., Steffensen, J. P., Shoji, H., Sveinbjörnsdóttir, Á. E., White, J., Jouzel, J., and Fisher, D.: The δ18O record along the Greenland Ice Core Project deep ice core and the problem of possible Eemian climatic instability, J. Geophys. Res., 102, 26397–26410, 1997.
Johnsen, S. J., Clausen, H. B., Cuffey, K. M., Hoffmann, G., Schwander, J., and Creyts, T.: Diffusion of stable isotopes in polar firn and ice: The isotope effect in firn diffusion, in: Physics of Ice Core Records, edited by: Hondoh, T., Hokkaido University Press, Sapporo, ISBN-10 4832902822, ISBN-13 978-4832902824, 121–140, 2000.
Jonsell, U., Hansson, M. E., Siggaard-Andersen, M.-L., and Steffensen, J.-P.: Comparison of northern and central Greenland ice core records of methanesulfonate covering the last glacial period, J. Geophys. Res., 112, D14313, https://doi.org/10.1029/2006JD007451, 2007.
Kindler, P., Guillevic, M., Baumgartner, M., Schwander, J., Landais, A., and Leuenberger, M.: Temperature reconstruction from 10 to 120 kyr b2k from the NGRIP ice core, Clim. Past, 10, 887–902, https://doi.org/10.5194/cp-10-887-2014, 2014.
Kipfstuhl, S., Pauer, F., Kuhs, W. F., and Shoji, H.: Air bubbles and clathrate hydrates in the transition zone of the NGRIP deep ice core, Geophys. Res. Lett., 28, 591–594, 2001.
Lin, J., Svensson, A., Hvidberg, C. S., Lohmann, J., Kristiansen, S., Dahl-Jensen, D., Steffensen, J. P., Rasmussen, S. O., Cook, E., Kjær, H. A., Vinther, B. M., Fischer, H., Stocker, T., Sigl, M., Bigler, M., Severi, M., Traversi, R., and Mulvaney, R.: Magnitude, frequency and climate forcing of global volcanism during the last glacial period as seen in Greenland and Antarctic ice cores (60–9 ka), Clim. Past, 18, 485–506, https://doi.org/10.5194/cp-18-485-2022, 2022.
Littot, G. C., Mulvaney, R., Röthlisberger, R., Udisti, R., Wolff, E. W., Castellano, E., M. de Angelis, Hansson, M., Sommer, S., and Steffensen, J. P.: Comparison of analytical methods used for measuring major ions in the EPICA Dome C (Antarctica) ice core, Ann. Glaciol., 35, 299–305, 2002.
McConnell, J.: Greenland and Antarctic ice core data from Sigl et al., JGR, 2013, Arctic Data Center [data set], https://doi.org/10.18739/A2TH15, 2015.
McConnell, J. R.: High-resolution elemental and chemical measurements in the NGRIP2 core, North Greenland, 2015, Arctic Data Center [data set], https://doi.org/10.18739/A20R9M558, 2023.
McConnell, J. R., Wilson, A. I., Stohl, A., Arienzo, M. M., Chellman, N. J., Eckhardt, S., Thompson, E. M., Pollard, A. M., and Steffensen, J. P.: Lead pollution recorded in Greenland ice indicates European emissions tracked plagues, wars, and imperial expansion during antiquity, P. Natl. Acad. Sci. USA, 115, 5726–5731, https://doi.org/10.1073/pnas.1721818115, 2018.
Mojtabavi, S., Eisen, O., Franke, S., Jansen, D., Steinhage, D., Paden, J. D., Dahl-Jensen, D., Weikusat, I., Eichler, J., and Wilhelms, F.: Specific conductivity measured with the dielectric profiling (DEP) technique on the NGRIP2 ice core (down to 1298.525 m depth), PANGAEA [data set], https://doi.org/10.1594/PANGAEA.922306, 2020a.
Mojtabavi, S., Wilhelms, F., Cook, E., Davies, S. M., Sinnl, G., Skov Jensen, M., Dahl-Jensen, D., Svensson, A., Vinther, B. M., Kipfstuhl, S., Jones, G., Karlsson, N. B., Faria, S. H., Gkinis, V., Kjær, H. A., Erhardt, T., Berben, S. M. P., Nisancioglu, K. H., Koldtoft, I., and Rasmussen, S. O.: A first chronology for the East Greenland Ice-core Project (EGRIP) over the Holocene and last glacial termination, Clim. Past, 16, 2359–2380, https://doi.org/10.5194/cp-16-2359-2020, 2020b.
Mojtabavi, S., Wilhelms, F., Cook, E., Davies, S. M., Sinnl, G., Skov Jensen, M., Dahl-Jensen, D., Svensson, A. M., Vinther, B. M., Kipfstuhl, S., Karlsson, N. B., Faria, S. H., Gkinis, V., Kjær, H. A., Erhardt, T., Berben, S. M. P., Nisancioglu, K. H., Koldtoft, I., and Rasmussen, S. O.: Acidity measured with the Electrical Conductivity Method (ECM) on the EGRIP ice core (down to 1383.84 m depth), converted to hydrogen ion concentration, PANGAEA [data set], https://doi.org/10.1594/PANGAEA.922199, 2020c.
Mojtabavi, S., Wilhelms, F., Cook, E., Davies, S. M., Sinnl, G., Skov Jensen, M., Dahl-Jensen, D., Svensson, A. M., Vinther, B. M., Kipfstuhl, S., Karlsson, N. B., Faria, S. H., Gkinis, V., Kjær, H. A., Erhardt, T., Berben, S. M. P., Nisancioglu, K. H., Koldtoft, I., and Rasmussen, S. O.: Specific conductivity measured with the dielectric profiling (DEP) technique on the NGRIP1 ice core (down to 1371.69 m depth), PANGAEA [data set], https://doi.org/10.1594/PANGAEA.922191, 2020d.
Mojtabavi, S., Wilhelms, F., Cook, E., Davies, S. M., Sinnl, G., Skov Jensen, M., Dahl-Jensen, D., Svensson, A. M., Vinther, B. M., Kipfstuhl, S., Karlsson, N. B., Faria, S. H., Gkinis, V., Kjær, H. A., Erhardt, T., Berben, S. M. P., Nisancioglu, K. H., Koldtoft, I., and Rasmussen, S. O.: Specific conductivity measured with the dielectric profiling (DEP) technique on the NEEM ice core (down to 1493.295 m depth), PANGAEA [data set], https://doi.org/10.1594/PANGAEA.922193, 2020e.
Mojtabavi, S., Wilhelms, F., Cook, E., Davies, S. M., Sinnl, G., Skov Jensen, M., Dahl-Jensen, D., Svensson, A. M., Vinther, B. M., Kipfstuhl, S., Karlsson, N. B., Faria, S. H., Gkinis, V., Kjær, H. A., Erhardt, T., Berben, S. M. P., Nisancioglu, K. H., Koldtoft, I., and Rasmussen, S. O.: Specific conductivity measured with the dielectric profiling (DEP) technique on the EGRIP ice core, 13.77–1383.84 m depth, PANGAEA [data set], https://doi.org/10.1594/PANGAEA.919313, 2020f.
Mojtabavi, S., Eisen, O., Franke, S., Jansen, D., Steinhage, D., Paden, J., Dahl-Jensen, D., Weikusat, I., Eichler, J., and Wilhelms, F.: Origin of englacial stratigraphy at three deep ice core sites of the Greenland Ice Sheet by synthetic radar modelling, J. Glaciol., 1–13, https://doi.org/10.1017/jog.2021.137, 2022.
Moore, J. C. and Paren, J. G.: A new technique for dielectric logging of Antarctic ice cores, J. Phys.-Paris, 48, 155–160, 1987.
Moore, J. C., Mulvaney, R., and Paren, J. G.: Dielectric stratigraphy of ice: A new technique for determining total ionic concentrations in polar ice cores, Geophys. Res. Lett., 16, 1177–1180, 1989.
Morrison, J., Brockwell, T., Merren, T., Fourel, F., and Phillips, A. M.: On-line high-precision stable hydrogen isotopic analyses on nanoliter water samples, Anal. Chem., 73, 3570–3575, https://doi.org/10.1021/ac001447t, 2001.
NEEM community members: Eemian interglacial reconstructed from a Greenland folded ice core, Nature, 493, 489–494, https://doi.org/10.1038/nature11789, 2013.
Neftel, A., Andrée, M., Schwander, J., Stauffer, B., and Hammer, C. U.: Measurements of a kind of DC-conductivity on cores from Dye 3, in: Greenland Ice Core: Geophysics, Geochemistry, and the Environment, edited by: Langway Jr., C. C., Oeschger, H., and Dansgaard, W., Geophys. Monogr. Ser., vol. 33, American Geophysical Union (AGU), Washington D. C., 32–38, 1985.
North Greenland Ice Core Project members: High-resolution record of Northern Hemisphere climate extending into the last interglacial period, Nature, 431, 147–151, 2004.
Plummer, C. T., Curran, M. A. J., van Ommen, T. D., Rasmussen, S. O., Moy, A. D., Vance, T. R., Clausen, H. B., Vinther, B. M., and Mayewski, P. A.: An independently dated 2000-yr volcanic record from Law Dome, East Antarctica, including a new perspective on the dating of the 1450s CE eruption of Kuwae, Vanuatu, Clim. Past, 8, 1929–1940, https://doi.org/10.5194/cp-8-1929-2012, 2012.
Rasmussen, S. O. and Ruth, U.: High-resolution dust concentrations from the NGRIP2 ice core, PANGAEA [data set], https://doi.org/10.1594/PANGAEA.945447, 2022.
Rasmussen, S. O. and Vinther, B. M.: DYE-3 ice core detailed water-isotope data, PANGAEA [data set], https://doi.org/10.1594/PANGAEA.942945, 2022a.
Rasmussen, S. O. and Vinther, B. M.: DYE-3 4B ice core detailed water isotope data, PANGAEA [data set], https://doi.org/10.1594/PANGAEA.942751, 2022b.
Rasmussen, S. O. and Vinther, B. M.: GRIP ice core detailed water isotope (δ18O) data, PANGAEA [data set], https://doi.org/10.1594/PANGAEA.942851, 2022c.
Rasmussen, S. O. and Vinther, B. M.: DYE-3 18C ice core detailed water isotope data, PANGAEA [data set], https://doi.org/10.1594/PANGAEA.942937, 2022d.
Rasmussen, S. O., Andersen, K. K., Svensson, A. M., Steffensen, J. P., Vinther, B. M., Clausen, H. B., Siggaard-Andersen, M.-L., Johnsen, S. J., Larsen, L. B., Dahl-Jensen, D., Bigler, M., Röthlisberger, R., Fischer, H., Goto-Azuma, K., Hansson, M. E., and Ruth, U.: A new Greenland ice core chronology for the last glacial termination, J. Geophys. Res., 111, D06102, https://doi.org/10.1029/2005JD006079, 2006.
Rasmussen, S. O., Abbott, P. M., Blunier, T., Bourne, A. J., Brook, E., Buchardt, S. L., Buizert, C., Chappellaz, J., Clausen, H. B., Cook, E., Dahl-Jensen, D., Davies, S. M., Guillevic, M., Kipfstuhl, S., Laepple, T., Seierstad, I. K., Severinghaus, J. P., Steffensen, J. P., Stowasser, C., Svensson, A., Vallelonga, P., Vinther, B. M., Wilhelms, F., and Winstrup, M.: A first chronology for the North Greenland Eemian Ice Drilling (NEEM) ice core, Clim. Past, 9, 2713–2730, https://doi.org/10.5194/cp-9-2713-2013, 2013a.
Rasmussen, S. O., Abbott, P. M., Blunier, T., Bourne, M., Brook, E. J., Buchardt, S. L., Buizert, C., Chappellaz, J. A., Clausen, H. B., Cook, E., Dahl-Jensen, D., Davies, S. M., Guillevic, M., Kipfstuhl, S., Laepple, T., Seierstad, I. K., Severinghaus, J. P., Steffensen, J. P., Stowasser, C., Svensson, A. M., Vallelonga, P. T., Vinther, B. M., Wilhelms, F., and Winstrup, M.: Specific conductivity and hydrogen ions measured on two ice core (NEEM and NGRIP), PANGAEA [data set], https://doi.org/10.1594/PANGAEA.831528, 2013b.
Rasmussen, S. O., Hansen, S. B., Dahl-Jensen, D., Schwander, J., Steffensen, J. P., and Vinther, B. M.: Electrical conductivity measurements (ECM) from the DYE-3 ice core, Greenland, PANGAEA [data set], https://doi.org/10.1594/PANGAEA.942849, 2022a.
Rasmussen, S. O., Hansen, S. B., Dahl-Jensen, D., Schwander, J., Steffensen, J. P., and Vinther, B. M.: Electrical conductivity measurements (ECM) from the DYE-3 4B ice core, Greenland, PANGAEA [data set], https://doi.org/10.1594/PANGAEA.942843, 2022b.
Rasmussen, S. O., Hansen, S. B., Dahl-Jensen, D., Schwander, J., Steffensen, J. P., and Vinther, B. M.: Electrical conductivity measurements (ECM) from the DYE-3 18C ice core, Greenland, PANGAEA [data set], https://doi.org/10.1594/PANGAEA.942847, 2022c.
Rasmussen, S. O., Hansen, S. B., Hvidberg, C. S., Dahl-Jensen, D., and Steffensen, J. P.: Electrical conductivity measurements (ECM) from the GRIP ice core, central Greenland, PANGAEA [data set], https://doi.org/10.1594/PANGAEA.942944, 2022d.
Rasmussen, S. O., Svensson, A. M., and Vinther, B. M.: Greenland Ice-Core Chronology 2005 (GICC05) annual layer depths for various Greenland ice cores, PANGAEA [data set], https://doi.org/10.1594/PANGAEA.943195, 2022e.
Reeh, N., Johnsen, S. J., and Dahl-Jensen, D.: Dating the Dye 3 Deep Ice Core by Flow Model Calculations, in: Greenland Ice Core: Geophysics, Geochemistry, and the Environment, edited by: Langway Jr., C. C., Oeschger, H., and Dansgaard, W., Geophysical Monograph Series Greenland Ice Core: Geophysics, Geochemistry, and the Environment American Geophysical Union, 2000 Florida Avenue, NW, Washington, DC 20009, 57–65, https://doi.org/10.1029/GM033p0057, ISBN 0-87590-057-7, 1985.
Ruth, U., Wagenbach, D., Steffensen, J. P., and Bigler, M.: Continuous record of microparticle concentration and size distribution in the central Greenland NGRIP ice core during the last glacial period, J. Geophys. Res., 108, 4098, https://doi.org/10.1029/2002JD002376, 2003.
Ruth, U., Bigler, M., Röthlisberger, R., Siggaard-Andersen, M.-L., Kipfstuhl, S., Goto-Azuma, K., Hansson, M. E., Johnsen, S. J., Lu, H., and Steffensen, J. P.: Ice core evidence for a very tight link between North Atlantic and east Asian glacial climate, Geophys. Res. Lett., 34, L03706, https://doi.org/10.1029/2006GL027876, 2007.
Röthlisberger, R., Bigler, M., Hutterli, M., Sommer, S., Stauffer, B., Junghans, H. G., and Wagenbach, D.: Technique for continuous high-resolution analysis of trace substances in firn and ice cores, Environ. Sci. Technol., 34, 338–342, 2000.
Sigg, A., Fuhrer, K., Anklin, M., Staffelbach, T., and Zurmühle, D.: A continuous analysis technique for trace species in ice cores, Environ. Sci. Technol., 28, 204–209, 1994.
Siggaard-Andersen, M.-L., Steffensen, J. P., and Fischer, H.: Lithium in Greenland ice cores measured by ion chromatography, Ann. Glaciol., 35, 243–249, 2002.
Siggaard-Andersen, M.-L., Hansson, M. E., Steffensen, J. P., Jonsell, U., and Rasmussen, S. O.: NorthGRIP ice-core record of major ions measured using ion chromatography covering the last two millennia and additional short Holocene sections, PANGAEA [data set], https://doi.org/10.1594/PANGAEA.944172, 2022.
Sigl, M. and McConnell, J. R.: NEEM-2011-S1 ice-core aerosol record (conductivity, NH4, NO3, BC, acidity, Na, Mg, S, Ca, Mn, Sr, Ce) in NW-Greenland at 2 cm resolution from 86-1997 CE on the annual-layer counted NS1-2011 chronology, PANGAEA [data set], https://doi.org/10.1594/PANGAEA.940553, 2022.
Sigl, M., McConnell, J. R., Layman, L., Maselli, O., McGwire, K., Pasteris, D., Dahl-Jensen, D., Steffensen, J. P., Vinther, B., Edwards, R., Mulvaney, R., and Kipfstuhl, S.: A new bipolar ice core record of volcanism from WAIS Divide and NEEM and implications for climate forcing of the last 2000 years, J. Geophys. Res.-Atmos., 118, 1151–1169, https://doi.org/10.1029/2012JD018603, 2013.
Sigl, M., Winstrup, M., McConnell, J. R., Welten, K. C., Plunkett, G., Ludlow, F., Büntgen, U., Caffee, M., Chellman, N., Dahl-Jensen, D., Fischer, H., Kipfstuhl, S., Kostick, C., Maselli, O. J., Mekhaldi, F., Mulvaney, R., Muscheler, R., Pasteris, D. R., Pilcher, J. R., Salzer, M., Schüpbach, S., Steffensen, J. P., Vinther, B. M., and Woodruff, T. E.: Timing and climate forcing of volcanic eruptions for the past 2,500 years, Nature, 523, 543–549, https://doi.org/10.1038/nature14565, 2015.
Sinnl, G., Winstrup, M., Erhardt, T., Cook, E., Jensen, C. M., Svensson, A., Vinther, B. M., Muscheler, R., and Rasmussen, S. O.: A multi-ice-core, annual-layer-counted Greenland ice-core chronology for the last 3800 years: GICC21, Clim. Past, 18, 1125–1150, https://doi.org/10.5194/cp-18-1125-2022, 2022.
Steffensen, J. P., Andersen, K. K., Bigler, M., Clausen, H. B., Dahl-Jensen, D., Fischer, H., Goto-Azuma, K., Hansson, M., Johnsen, S. J., Jouzel, J., Masson-Delmotte, V., Popp, T., Rasmussen, S. O., Röthlisberger, R., Ruth, U., Stauffer, B., Siggaard-Andersen, M.-L., Sveinbjörnsdóttir, Á. E., Svensson, A., and White, J. W. C.: High-resolution Greenland ice core data show abrupt climate change happens in few years, Science, 321, 680–684, 2008.
Svensson, A., Nielsen, S. W., Kipfstuhl, S., Johnsen, S. J., Steffensen, J. P., Bigler, M., Ruth, U., and Röthlisberger, R.: Visual stratigraphy of the North Greenland Ice Core Project (NorthGRIP) ice core during the last glacial period, J. Geophys. Res., 110, D02108, https://doi.org/10.1029/2004JD005134, 2005.
Svensson, A., Andersen, K. K., Bigler, M., Clausen, H. B., Dahl-Jensen, D., Davies, S. M., Johnsen, S. J., Muscheler, R., Parrenin, F., Rasmussen, S. O., Röthlisberger, R., Seierstad, I., Steffensen, J. P., and Vinther, B. M.: A 60 000 year Greenland stratigraphic ice core chronology, Clim. Past, 4, 47–57, https://doi.org/10.5194/cp-4-47-2008, 2008.
Svensson, A. M., Kipfstuhl, S., and Steffensen, J. P.: Line-scan grey-scale intensity profile from the NGRIP2 ice core, Greenland, PANGAEA [data set], https://doi.org/10.1594/PANGAEA.941174, 2022.
Vallelonga, P., Christianson, K., Alley, R. B., Anandakrishnan, S., Christian, J. E. M., Dahl-Jensen, D., Gkinis, V., Holme, C., Jacobel, R. W., Karlsson, N. B., Keisling, B. A., Kipfstuhl, S., Kjær, H. A., Kristensen, M. E. L., Muto, A., Peters, L. E., Popp, T., Riverman, K. L., Svensson, A. M., Tibuleac, C., Vinther, B. M., Weng, Y., and Winstrup, M.: Initial results from geophysical surveys and shallow coring of the Northeast Greenland Ice Stream (NEGIS), The Cryosphere, 8, 1275–1287, https://doi.org/10.5194/tc-8-1275-2014, 2014.
Vinther, B. M., Clausen, H. B., Johnsen, S. J., Rasmussen, S. O., Andersen, K. K., Buchardt, S. L., Dahl-Jensen, D., Seierstad, I. K., Siggaard-Andersen, M.-L., Steffensen, J. P., Svensson, A. M., Olsen, J., and Heinemeier, J.: A synchronized dating of three Greenland ice cores throughout the Holocene, J. Geophys. Res., 111, D13102, https://doi.org/10.1029/2005JD006921, 2006.
Vinther, B. M., Jones, P. D., Briffa, K. R., Clausen, H. B., Andersen, K. K., Dahl-Jensen, D., and Johnsen, S. J.: Climatic signals in multiple highly resolved stable isotope records from Greenland, Quaternary Sci. Rev., 29, 522–538, https://doi.org/10.1016/j.quascirev.2009.11.002, 2010.
Whillans, I. M., Jezek, K. C., Drew, A. R., and Gundestrup, N.: Ice flow leading to the deep core hole at Dye 3, Greenland, Ann. Glaciol., 5, 190–195, 1984.
Wilhelms, F.: Leitfähigkeits- und Dichtemessung an Eisbohrkernen (Measuring the conductivity and density of ice cores), Berichte zur Polarforschung (Reports on Polar Research), 191, 224p, https://doi.org/10.2312/BzP_0191_1996, 1996.
Wilhelms, F., Kipfstuhl, J., Miller, H., Heinloth, K., and Firestone, J.: Precise dielectric profiling of ice cores: a new device with improved guarding and its theory, J. Glaciol., 44, 171–174, 1998.
Wolff, E. W., Chappellaz, J., Blunier, T., Rasmussen, S. O., and Svensson, A.: Millennial-scale variability during the last glacial: The ice core record, Quaternary Sci. Rev., 29, 2828–2838, https://doi.org/10.1016/j.quascirev.2009.10.013, 2010.